ramah navajo chapter, et al., v. jewell, no. 90-cv-957 … c settlement agreement... · final...
TRANSCRIPT

Ramah Navajo Chapter, et al., v. Jewell, No. 90-cv-957 (D.N.M.)
Final Settlement Agreement Appendix 2 - Distribution Percentages for Each Class Member
This appendix describes the methodology for allocating shares of the Net
Settlement Amount to each Class Member.1 The allocation described herein was developed by Dr. Eugene Ericksen, a Special
Consultant to NERA Economic Consulting and an Emeritus Professor of Sociology and Statistics at Temple University, and Dr. Michael Larsen, an Associate Professor of Statistics at George Washington University. Professor Ericksen was retained by the Department of Justice, and Professor Larsen was retained by Class Counsel.2
1 The Net Settlement Amount is defined in § II.N of the Final Settlement
Agreement (“FSA”) as “the amount available for Distribution to Tribal Contractors after the Reserve Account and attorneys’ fees, costs, and other expenses have been deducted from the ‘Settlement Amount’….” The Settlement Amount is defined in § II.M of the FSA as “$940,000,000.00, plus post judgment interest ….” As explained below, for purposes of this Appendix it is assumed that the Net Settlement Amount will be $854,600,000.
2 Eugene Ericksen and Michael Larsen are professors of statistics who specialize in the design and construction of statistical samples. Each has published scientific papers in the area of sampling, taught graduate level courses in statistical sampling, and designed and constructed many actual samples in applied settings.
Professor Ericksen has been an associate editor of the Journal of the American Statistical Association, and in 1991 he was elected to be a Fellow of the American Statistical Association. He was appointed by then-Secretary of Commerce, Robert Mosbacher, to advise him on whether or not to adjust the results of the 1990 Census for the disproportionate undercount of racial minorities. In April 1997 he published an article, “Problems in Sampling the Native American and Alaska Native Populations” that grew out of his work on a panel of the National Academy of Sciences on that subject.
Professor Larsen served as the Executive Editor of Chance magazine from 2008 to 2010, and he currently serves as an associate editor for three different journals. He served on a National Academies of Sciences Panel on the 2010 Census and Steering Committee for a Workshop on surveying nonprofit organizations about research and development. He is currently a member of the standing committee for reengineering the decennial census. In 2010 he was elected to be a member of the International Statistical Institute. In 2012 he was elected to be a Fellow of the American Statistical Association (ASA) and currently serves on the ASA Fellows committee. He was elected Chair-Elect for the ASA Survey Research Methods Section for 2015 and President-Elect for the Washington Statistical Society for 2015-16. In 2009, he co-authored a published article entitled “Research Synthesis: Research Strategies for Surveys of American Indians.”
Case 1:90-cv-00957-JAP-KBM Document 1306-3 Filed 09/16/15 Page 1 of 22

2
The parties’ goal is to allocate the Net Settlement Amount based on the amount of Contract Support Costs (“CSC”) that was paid to each Class Member during the period 1994 through 2013 (the years covered by the settlement). The allocation plan also addresses years in which Class Members had Indian Self-Determination Act (“ISDA”) contracts3 but received little or no contract support costs according to the BIA database of CSC payments. In recognition of their substantial contributions over the years to the prosecution of the action and the negotiation of this settlement, the allocation also awards each Named Class Representative an incentive payment of a twenty percent (20%) increase in its Distribution Percentage.
The table in § 6 of this Appendix sets forth the Distribution Percentages as
defined in § II.R. of the Final Settlement Agreement. These Distribution Percentages will be used to allocate shares of the Net Settlement Amount to Class Members. That table does not provide dollar amounts that will be paid to each Class Member. This is because the actual Net Settlement Amount will not be known until the Court rules on Class Counsel’s cost reimbursement request and fee application, and until the Court approves or modifies the parties’ proposal that a $4 million Reserve Account be established. For purposes of this Appendix, the parties’ statisticians have assumed that the Court will approve Class Counsel’s fee application (seeking a fee of 8.5% of the Settlement Amount) and request for reimbursement of $1.5 million in costs, and that the Court will also approve the parties’ request to establish a Reserve Account of $4 million to cover future costs of implementing the settlement. These assumptions produce an estimated Net Settlement Amount of $854,600,000.00, and the Class Member share percentages set forth in § 6 of this Appendix are based on these same assumptions. 1. Sources of Information
The parties used two sources of data to develop and implement their allocation plan: (i) the BIA payment database, which contained records of payments made to each Class Member from 1994 through 2012; and (ii) for 2013, BIA’s 2013 Shortfall Report (“SFR”). The parties also used these two data sources to determine the years in which each Class Member had an ISDA contract, and the amounts of CSC paid to each Class Member each year.
BIA records show that 645 separate tribal entities had ISDA contracts at some time during the period 1994 through 2013. The statisticians identified a population of 9,409 “CSC years,” i.e., the total number of years in which Class Members received CSC payments.
The data showed that not every Class Member had an ISDA contract in every year between 1994 and 2013. Additionally, the parties determined that the average amount of the CSC underpayment was different each year. For this reason, the parties’ statisticians determined that it would be efficient to take a sample of all of the Class Members by each
3 “Contracts” as used in this Appendix also includes ISDA self-governance
funding agreements.
Case 1:90-cv-00957-JAP-KBM Document 1306-3 Filed 09/16/15 Page 2 of 22

3
fiscal year, and then determined that they could use data derived from the sample to allocate the Net Settlement Amount across each of the 20 years at issue. 2. The Basis for Allocating the Net Settlement Amount
The parties’ statisticians used statistical sampling as the basis for determining how much of the Net Settlement Amount to allocate to each fiscal year. The statisticians randomly selected Class Members for each year from 1994 through 2012, and the parties’ accountants examined each contractor’s contract documents from the sampled year to determine the sampled contractor’s CSC underpayment for that year.
The parties relied on three important factors in developing their sampling plan and
distribution plan. First, BIA has databases that show the amount of CSC paid to all Class Members in all years at issue, so the parties agreed to select samples from the BIA database. Second, amounts appropriated for CSC and the percent of CSC paid varied by year, so the statisticians stratified the sample selection by year to account for these differences. Third, the size of payments to Class Members each year ranged from hundreds of dollars to millions of dollars, so the statisticians used probability proportional to size sampling to account for these differences in size.4 This information produced a sampling frame from which the parties’ statisticians selected a sample.
The statisticians used the smallest sample sizes that would still produce reliable
estimates. The statisticians selected a sample of 108 selections over the 1994–2012 time period. Each party then retained expert certified public accounting firms experienced in government contracting matters to conduct an independent forensic evaluation to determine the amount of CSC that should have been paid to each sampled Class Member in that sampled year.5
The accountants then compared the amount of CSC that should have been paid to
the amount of CSC that was actually paid to produce a “CSC ratio” for each sampled Class Member in that year. Because the government’s accountants and Class Counsel’s accountants worked independently and reached different conclusions about the size of the underpayments, the ratios they developed for each sampled Class Member differed, although typically not by large amounts. The parties’ statisticians then calculated the
4 The statisticians used both stratification and probability proportional to size sampling (PPS), described in standard textbooks on survey sampling. Stratified sampling divides the population into groups called strata and then samples independently within strata. PPS sampling weights each entity in the population by size, thus increasing the probability that larger entities will be selected. In this case, the statisticians used the years in the BIA database to define strata and assigned a weight to each Class Member within each year based on the size of the CSC payment reported in the payment database. CSC payment information for the 2013 year was not available when the parties’ statisticians selected the sample.
5 The Class retained REDW, LLC, of Albuquerque, New Mexico. Defendants retained Cotton & Co. LLP, of Alexandria, Virginia.
Case 1:90-cv-00957-JAP-KBM Document 1306-3 Filed 09/16/15 Page 3 of 22

4
Distribution Percentages set out in § 6 of this appendix using the methods described below.
3. Allocating the Net Settlement Amount for Each Fiscal Year
The parties’ statisticians averaged the accountants’ CSC ratios for each sampled
Class Member in the sampled year and then, for each sampled year, averaged the CSC ratios of all Class Members sampled in that year to produce a CSC ratio for each year from 1994 through 2012. The parties’ statisticians then conducted a series of analyses and determined that, because the sample sizes for any given year were small, it was best to “smooth” the CSC ratios as follows:
• For the years 1996–2010, the statisticians calculated a 5-year average for each year, which included the year itself, each of the two preceding years, and each of the two succeeding years. For example, for the year 2000 they calculated the average of the yearly ratios for 1998, 1999, 2000, 2001 and 2002.
• For the years 1995 and 2011, the statisticians calculated a 3-year average, which included the year itself, the one preceding year, and the one succeeding year.
• For the year 1994, the statisticians calculated a 3-year average with 50 percent of the weight assigned to the 1994 ratio and 25 percent assigned to each of the 1995 and 1996 ratios.
• For the year 2012, the statisticians calculated a 3-year average with 50 percent of the weight assigned to the 2012 ratio and 25 percent assigned to each of the 2010 and 2011 ratios.
• Because the parties were unable to select a sample for 2013, the statisticians applied the weighted average for 2012 to the 2013 data.
The parties’ statisticians then calculated an initial amount of the settlement to be allocated to each year.
4. Allocating the Share of the Net Settlement Amount to Each Class Member
The parties used a three-step process to allocate a share of the Net Settlement Amount to each Class Member.
Step 1: Allocation of Net Settlement Amount to Class Members
The first step applied the smoothed CSC ratio for each year from 1994 through 2013 to the amounts paid to each Class Member that had an ISDA contract in a given year. To illustrate, suppose that a hypothetical Class Member received CSC payments for only three years: 2004, 2005, and 2006. Suppose that this hypothetical Class Member was paid $100,000 for CSC in 2004, $200,000 in 2005, and $250,000 in 2006. The parties’ statisticians determined that the smoothed CSC ratios for the three years are 1.55,
Case 1:90-cv-00957-JAP-KBM Document 1306-3 Filed 09/16/15 Page 4 of 22

5
1.52 and 1.36. The initial estimate of the CSC that should have been paid to this hypothetical entity would therefore be ($100,000 X 1.55) for 2004 + ($200,000 X 1.52) for 2005 + ($250,000 X 1.36) for 2006, or $799,000 for all three years. Subtracting the $550,000 for CSC already paid, the potential distribution to this hypothetical Class Member would be $249,000. The parties’ statisticians made similar calculations for all 645 Class Members.
Step 2: Incentive Payments to Class Representatives
The second step accounted for the incentive payments that may be awarded to the Named Class Representatives: the Ramah Navajo Chapter, the Oglala Sioux Tribe, and the Pueblo of Zuni. The parties agreed that as compensation for their services, these Class Representatives’ shares of the Net Settlement Amount would be multiplied by a factor of 1.20. The parties’ statisticians adjusted the initial distribution amounts of all Class Members to reflect these incentive payments to the Named Class Representatives.
Step 3: Minimum Payment to Each Class Member for Each Year It Had an ISDA Contract
The third step provides a minimum payment of approximately $8,000 for each year where a Class Member had an ISDA contract. The parties noted that, according to the BIA payment database, there were many years when a Class Member had an ISDA contract for which it should have received CSC payments, but in fact received disproportionately small or even no CSC payments. The parties were concerned that certain small tribes and tribal contractors (especially in rural Alaska, but also elsewhere) may have been disproportionately underpaid for CSC, and would have resulted in lower or zero allocations of the NSA in Step 1, above. To address this phenomenon, the parties agreed to establish a minimum distribution amount of approximately $8,000 for each year that a Class Member had an ISDA contract. For example, an entity with 20 years of ISDA contracts would receive a minimum total payment of approximately $160,000, and an entity with 5 years of ISDA contracts would receive a minimum total payment of approximately $40,000.
The parties’ accountants and statisticians identified approximately 454 Class Members that, absent application of the $8,000 threshold amount, would otherwise receive a distribution amount of less than $8,000 for at least one of the years in which the Class Member had an ISDA contract. Overall, there are a total of 2,730 CSC years in which a Class Member had an ISDA contract but would have received a distribution amount of less than $8,000, but for this Step 3 adjustment. Increasing these minimum distributions up to $8,000 for each year a Class Member had an ISDA contract will allocate an additional amount of approximately $13,108,461 out of the estimated $854,600,000 Net Settlement Amount to these 454 Class Members (or roughly 1.5% [one and one-half percent] of the Net Settlement Amount).
To account for this $13,108,461 reallocation, the parties’ statisticians adjusted the Class Members’ distribution amounts for each year that a Class Member was unaffected by the $8,000 minimum distribution. They did this by multiplying the initial distribution
Case 1:90-cv-00957-JAP-KBM Document 1306-3 Filed 09/16/15 Page 5 of 22
6
amount by 0.985. The parties’ statisticians then adjusted the initial distribution percentage for each Class Member accordingly to produce the final distribution percentage. In the hypothetical in paragraph 4.a, above, this adjustment would reduce that hypothetical Class Member’s share from $249,000 to $245,265. After completing these additional steps, the statisticians then calculated a final distribution percentage for this hypothetical Class member of 0.02870 percent. The final distribution percentage for each Class Member is shown in the tables in Section 6, subject to the potential adjustments set out in Section VIII.D.1 of the FSA.
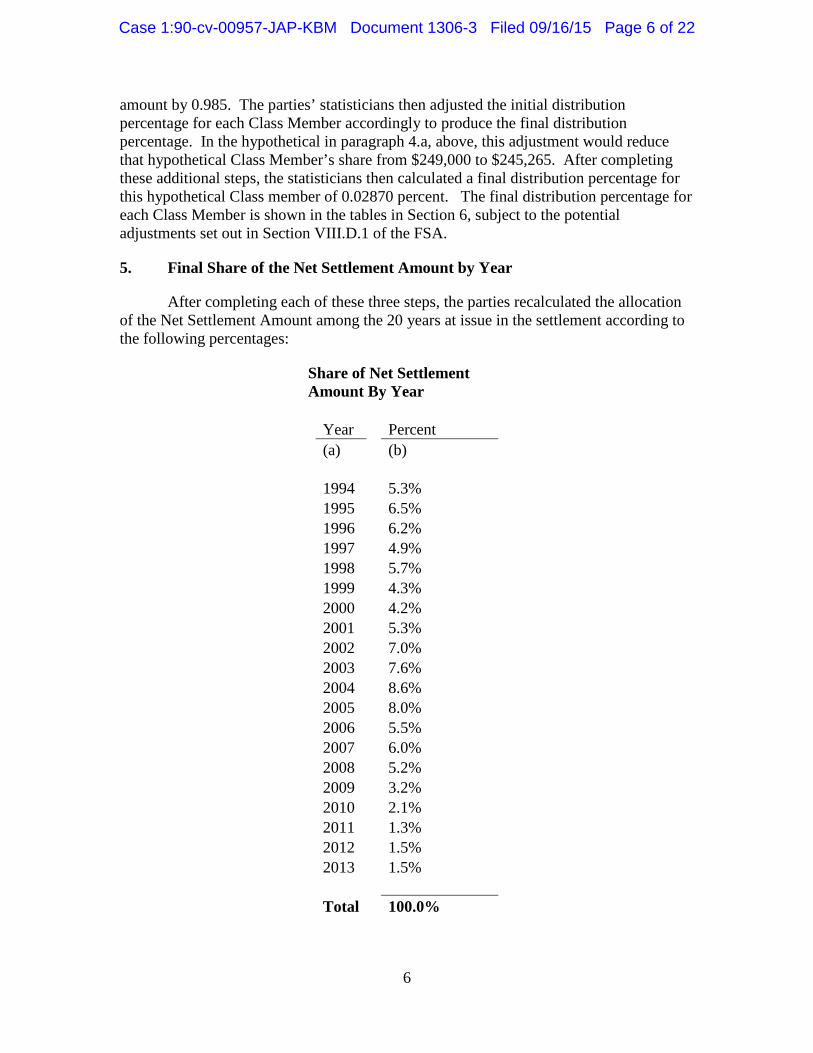
5. Final Share of the Net Settlement Amount by Year
After completing each of these three steps, the parties recalculated the allocation of the Net Settlement Amount among the 20 years at issue in the settlement according to the following percentages:
Share of Net Settlement Amount By Year Year Percent (a) (b) 1994 5.3% 1995 6.5% 1996 6.2% 1997 4.9% 1998 5.7% 1999 4.3% 2000 4.2% 2001 5.3% 2002 7.0% 2003 7.6% 2004 8.6% 2005 8.0% 2006 5.5% 2007 6.0% 2008 5.2% 2009 3.2% 2010 2.1% 2011 1.3% 2012 1.5% 2013 1.5% Total 100.0%
Case 1:90-cv-00957-JAP-KBM Document 1306-3 Filed 09/16/15 Page 6 of 22

7
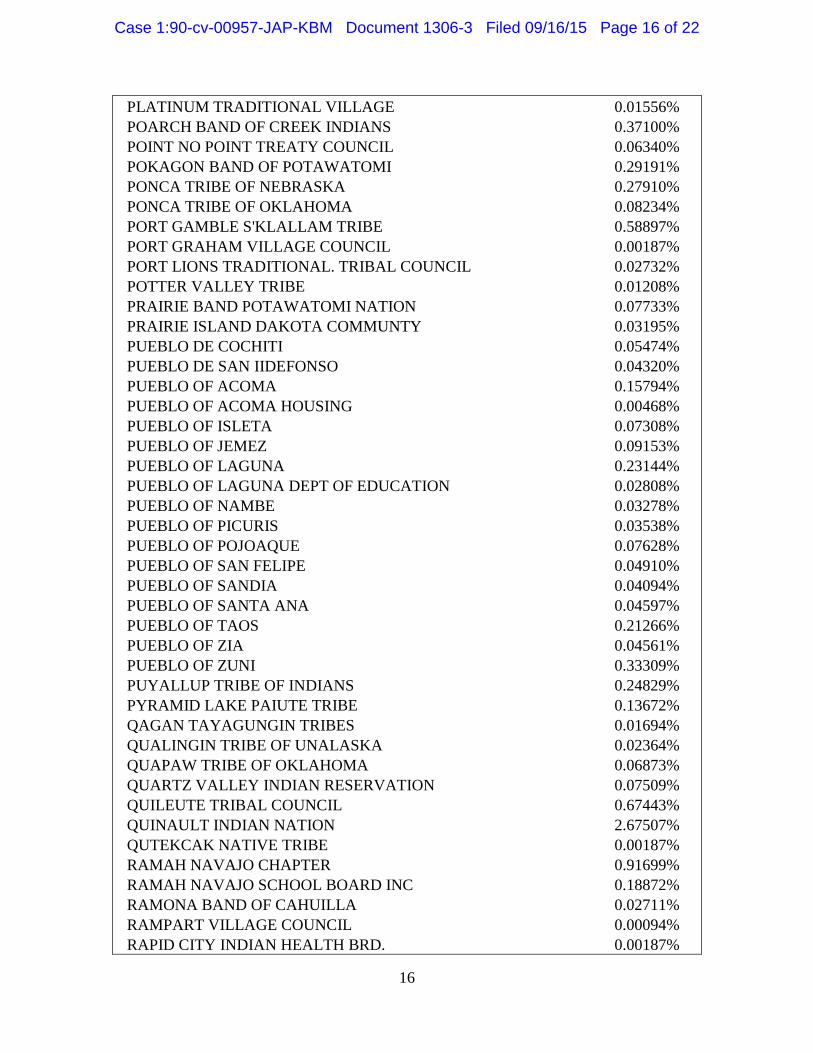
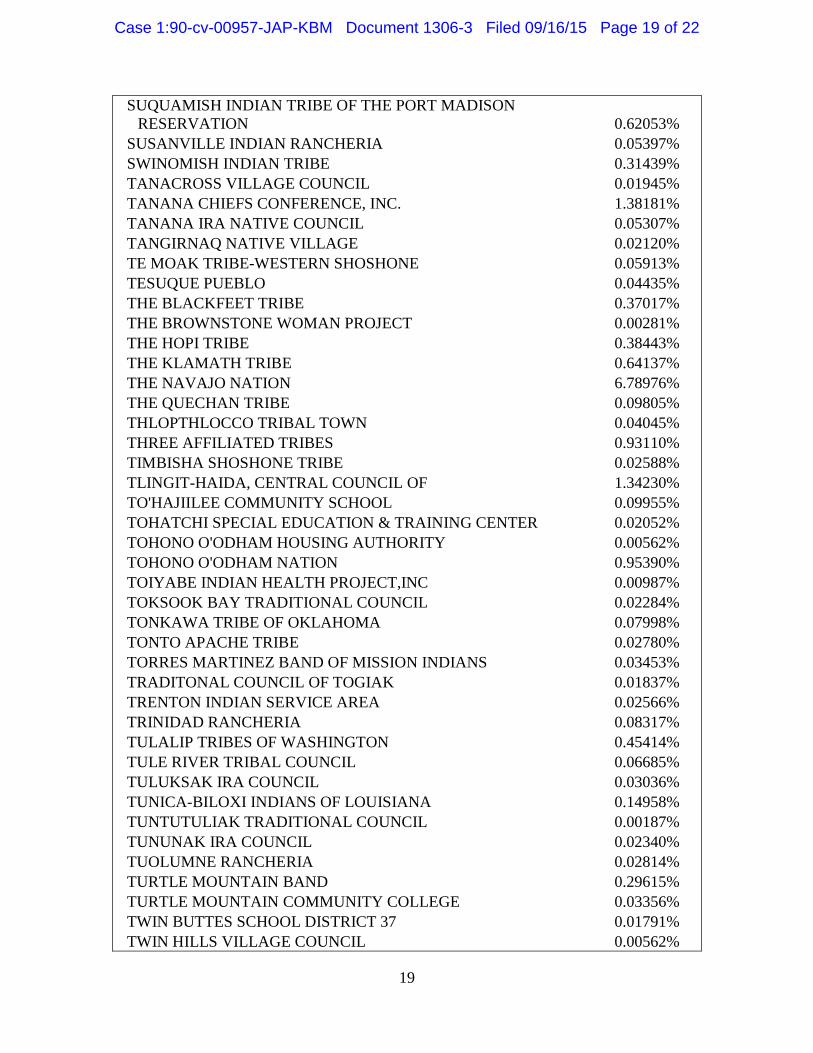
6. Final Distribution Percentages
The Final Distribution Percentages are presented in two tables. The first table provides the Class Member Distribution Percentages for Class Members that have previously been given an opportunity to request exclusion from the Class. The second table provides the Class Member Distribution Percentage for Class Members that have not previously been given an opportunity to request exclusion from the Class.
Table 1. Class Members That Have Previously Been Given an Opportunity to Request Exclusion from the Class
Class Member Class Member Name Distribution Percentage 1854 AUTHORITY 0.15481% ABSENTEE SHAWNEE 0.23660% AGDAAGUX TRIBAL COUNCIL 0.03601% AGUA CALIENTE BAND OF CAHUILLA 0.00736% AK-CHIN INDIAN COMMUNITY 0.05627% AKIACHAK NATIVE COMMUNITY 0.02975% AKIAK NATIVE COMMUNITY 0.07302% ALABAMA COUSHATTA INDIAN RESERVATION 0.22962% ALABAMA-QUASSARTE TRIBAL TOWNSHIP 0.08639% ALAKANUK TRADITIONAL COUNCIL 0.00187% ALAMO NAVAJO SCHOOL BOARD 0.01872% ALEUTIAN PRIBILOF ISLANDS ASSOCIATION 0.47975% ALGAACIQ TRIBAL GOVERNMENT 0.00187% ALL INDIAN PUEBLO COUNCIL INC 0.00947% AMERICAN INDIAN SERVICES INC 0.00281% ANNETTE ISLAND SCHOOL DISTRICT 0.00374% APACHE TRIBE OF OKLAHOMA 0.02048% ARCTIC SLOPE NATIVE ASSOCIATION 0.12320% ARCTIC VILLAGE COUNCIL 0.00187% AROOSTOOK BAND OF MICMACS 0.11456% ASA'CARSARMIUT TRIBAL COUNCIL 0.04021% ASSOC OF VILLAGE COUNCIL PRESIDENTS 1.03218% ATHABASCAN TRIBAL GOVERNMENTS, COUNCIL OF 0.01311% ATMAUTHLUAK TRADITIONAL COUNCL 0.03548% AUGUSTINE BAND-MISSION INDIANS 0.01927% BAD RIVER BAND OF LAKE 0.06903% BARROW, NATIVE VILLAGE OF 0.22572% BATTLE MOUNTAIN BAND COUNCIL 0.09396% BAY MILLS INDIAN COMMUNITY 0.24618% BEAR RIVER BAND OF ROHNERVILLE 0.05627% BEAVER VILLAGE COUNCIL 0.02577%
Case 1:90-cv-00957-JAP-KBM Document 1306-3 Filed 09/16/15 Page 7 of 22
8
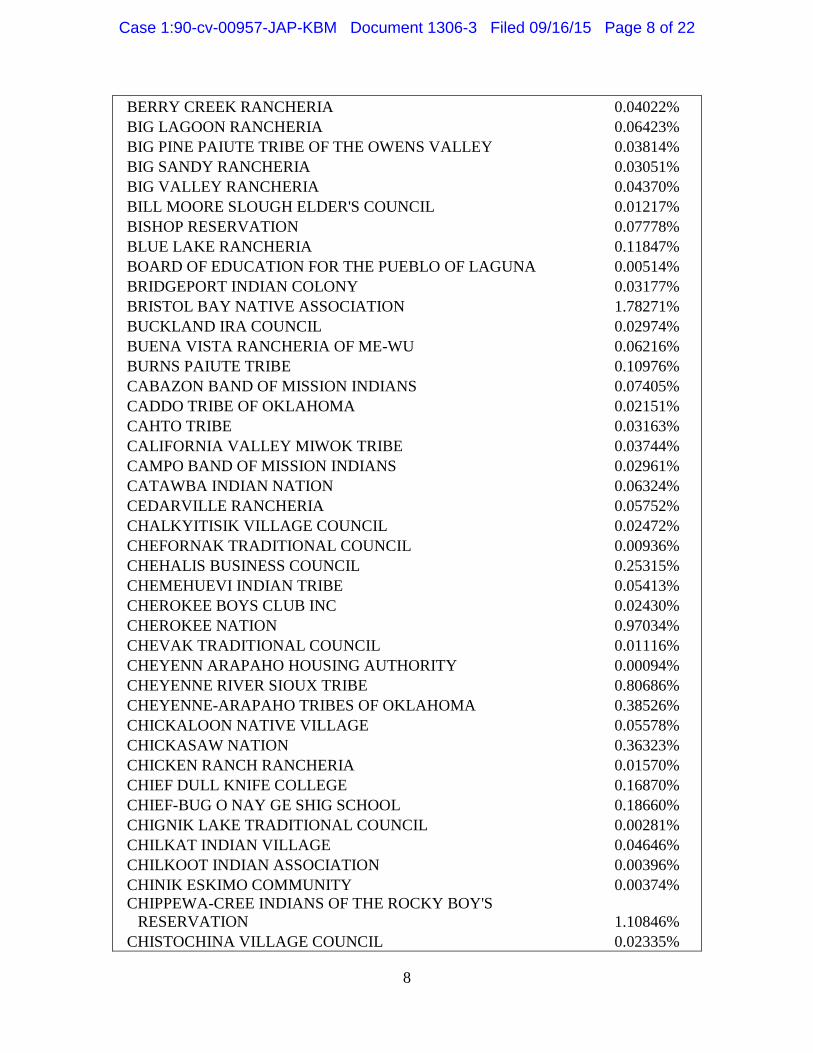
BERRY CREEK RANCHERIA 0.04022% BIG LAGOON RANCHERIA 0.06423% BIG PINE PAIUTE TRIBE OF THE OWENS VALLEY 0.03814% BIG SANDY RANCHERIA 0.03051% BIG VALLEY RANCHERIA 0.04370% BILL MOORE SLOUGH ELDER'S COUNCIL 0.01217% BISHOP RESERVATION 0.07778% BLUE LAKE RANCHERIA 0.11847% BOARD OF EDUCATION FOR THE PUEBLO OF LAGUNA 0.00514% BRIDGEPORT INDIAN COLONY 0.03177% BRISTOL BAY NATIVE ASSOCIATION 1.78271% BUCKLAND IRA COUNCIL 0.02974% BUENA VISTA RANCHERIA OF ME-WU 0.06216% BURNS PAIUTE TRIBE 0.10976% CABAZON BAND OF MISSION INDIANS 0.07405% CADDO TRIBE OF OKLAHOMA 0.02151% CAHTO TRIBE 0.03163% CALIFORNIA VALLEY MIWOK TRIBE 0.03744% CAMPO BAND OF MISSION INDIANS 0.02961% CATAWBA INDIAN NATION 0.06324% CEDARVILLE RANCHERIA 0.05752% CHALKYITISIK VILLAGE COUNCIL 0.02472% CHEFORNAK TRADITIONAL COUNCIL 0.00936% CHEHALIS BUSINESS COUNCIL 0.25315% CHEMEHUEVI INDIAN TRIBE 0.05413% CHEROKEE BOYS CLUB INC 0.02430% CHEROKEE NATION 0.97034% CHEVAK TRADITIONAL COUNCIL 0.01116% CHEYENN ARAPAHO HOUSING AUTHORITY 0.00094% CHEYENNE RIVER SIOUX TRIBE 0.80686% CHEYENNE-ARAPAHO TRIBES OF OKLAHOMA 0.38526% CHICKALOON NATIVE VILLAGE 0.05578% CHICKASAW NATION 0.36323% CHICKEN RANCH RANCHERIA 0.01570% CHIEF DULL KNIFE COLLEGE 0.16870% CHIEF-BUG O NAY GE SHIG SCHOOL 0.18660% CHIGNIK LAKE TRADITIONAL COUNCIL 0.00281% CHILKAT INDIAN VILLAGE 0.04646% CHILKOOT INDIAN ASSOCIATION 0.00396% CHINIK ESKIMO COMMUNITY 0.00374% CHIPPEWA-CREE INDIANS OF THE ROCKY BOY'S
RESERVATION 1.10846% CHISTOCHINA VILLAGE COUNCIL 0.02335%
Case 1:90-cv-00957-JAP-KBM Document 1306-3 Filed 09/16/15 Page 8 of 22

9
CHITIMACHA TRIBE OF LOUISIANA 0.19820% CHITINA VILLAGE COUNCIL 0.04453% CHOCTAW NATION 0.41987% CHUATHBALUK TRADITIONAL COUNCIL 0.01672% CHUGACH REGIONAL RESOURCES COMMISSION 0.05408% CHUGACHMIUT 0.32218% CHULOONAWICK NATIVE VILLAGE 0.01492% CHUSKA SCHOOL BOARD OF EDUCATION INC 0.00439% CIRCLE OF LIFE SURVIVAL SCHOOL 0.02460% CIRCLE VILLAGE COUNCIL 0.00958% CITIZEN BAND OF POTAWATOMI 0.20821% CLOVERDALE RANCHERIA TRIBE 0.05067% COAST INDIAN COMMUNITY OF RESIGHINI RANCHERIA 0.05621% COCOPAH INDIAN TRIBE 0.09479% COEUR D'ALENE TRIBE OF IDAHO 0.49613% COLORADO RIVER INDIAN TRIBES 0.29017% COLUMBIA RIVER INTERTR FISH CO 0.85949% COLVILLE BUSINESS COUNCIL 1.56037% COMANCHE NATION 0.06826% CONF TRBS OF COOS LOWER UMPQUA 0.17602% CONF TRBS UMATILLA INDIAN RESERVATION 0.69354% CONF TRBS&BDS OF YAKIMA INDIAN NATION 0.84487% CONF TRIBES OF THE GRANDE ROND 0.61892% CONF TRIBES OF WARM SPRINGS 0.88400% CONFEDERATED SALISH AND KOOTENAI TRIBES OF THE FLATHEAD NATION 0.96845% CONFEDERATED TRIBE GOSHUTE RESERVATION 0.08155% COOK INLET TRIBAL COUNCIL 0.16706% COPPER RIVER NATIVE ASSOCIATION 0.13003% COQUILLE INDIAN TRIBE 0.41888% CORTINA RANCHERIA 0.04813% COUSHATTA TRIBE OF LOUISIANA 0.10195% COW CREEK AND OF UMPQUA TRIBE 0.10711% COYOTE VALLEY BAND OF POMO INDIANS 0.02858% CROW CREEK SIOUX TRIBE 0.11675% CROW TRIBE OF MONTANA 0.33974% CURYUNG TRIBAL COUNCIL 0.00187% DELAWARE NATION 0.03369% DELAWARE TRIBE OF INDIANS 0.00875% DEVIL'S LAKE SIOUX TRIBE 0.00374% DINE BI OLTA SCHOOL BOARD ASSOCIATION 0.17975% DOT LAKE VILLAGE COUNCIL 0.01994%
Case 1:90-cv-00957-JAP-KBM Document 1306-3 Filed 09/16/15 Page 9 of 22

10
DOUGLAS INDIAN ASSOCIATION 0.03837% DRY CREEK RANCHERIA BAND OF POMO INDIANS 0.03287% DUCK VALLEY, SHOSHONE-PAIUTE OF 0.29372% DUCKWATER SHOSHONE TRIBE 0.19845% EAGLE TRADITIONAL COUNCIL 0.00499% EASTERN BAND OF CHEROKEE INDIANS 0.13817% EASTERN SHAWNEE TRIBE OF OKLAHOMA 0.10012% EEK TRADITIONAL COUNCIL 0.01323% EGEGIK VILLAGE COUNCIL 0.00094% EIGHT NORTHERN INDIAN PUEBLOS 0.01900% ELEM INDIAN COLONY 0.04345% ELK VALLEY RANCHERIA 0.06770% ELKO BAND COUNCIL 0.08267% ELY SHOSHONE TRIBE 0.13924% EMMONAK TRIBAL COUNCIL 0.04256% ENTERPRISE RANCHERIA 0.04424% EWIIAAPAAYP BAND OF KUMEYAAY INDIANS 0.07062% EYAK, NATIVE VILLAGE OF 0.02423% FAIRBANKS NATIVE ASSOCIATION 0.07195% FALLON PAIUTE SHOSHONE TRIBE 0.12657% FALSE PASS TRIBAL COUNCIL 0.00706% FLANDREAU SANTEE SIOUX TRIBE 0.10255% FOND DU LAC OJIBWAY SCHOOL 0.02430% FOREST COUNTY POTAWATOMI COMMUNITY 0.02651% FORT BELKNAP COMMUNITY COUNCIL 0.71667% FORT MCDERMITT PAIUTE SHOSHONE 0.04428% FORT MCDOWELL MOHAVE APACHE 0.08260% FORT MOJAVE INDIAN TRIBE 0.17253% FORT PECK TRIBAL EXECUTIVE BOARD 0.42030% FORT SILL APACHE TRIBE 0.05478% FT BERTHOLD COMMUNITY COLLEGE 0.02828% FT BIDWELL INDIAN COMMUNITY COLLEGE 0.06296% FT. INDEPENDENCE RESERVATION 0.03341% GALENA VILLAGE 0.04423% GAMBELL, NATIVE VILLAGE OF 0.12677% GEORGETOWN TRIBAL COUNCIL 0.01486% GILA RIVER INDIAN COMMUNITY 0.90546% GOODNEWS BAY NATIVE VILLAGE 0.01314% GRAND TRAVERSE BAND 0.40128% GRAYLING IRA COUNCIL 0.00281% GREAT LAKES INDIAN FISH 0.40774% GREAT LAKES INTER-TRIBAL COUNCIL 0.01340% GREENVILLE RANCHERIA 0.02482%
Case 1:90-cv-00957-JAP-KBM Document 1306-3 Filed 09/16/15 Page 10 of 22

11
GUIDIVILLE RANCHERIA 0.12847% GULKANA VILLAGE COUNCIL 0.02300% HABEMATOLEL POMO OF UPPER LAKE 0.03569% HANNAHVILLE INDIAN COMMUNITY 0.20852% HANNAHVILLE INDIAN SCHOOL 0.52304% HAVASUPAI TRIBE 0.04805% HO-CHUNK NATION 0.02845% HOH INDIAN TRIBE 0.19181% HOONAH INDIAN ASSOCIATION 0.08932% HOOPA VALLEY TRIBAL COUNCIL 1.00054% HOOPER BAY TRADITIONAL COUNCIL 0.00666% HOPI INDIAN CREDIT ASSOCIATION 0.01601% HOPLAND RESERVATION 0.03284% HOULTON BAND OF MALISEET INDIANS 0.15981% HUALAPAI TRIBE 0.50074% HURON POTWATOMI INC. 0.02836% HYDABURG COOPERATION ASSOCIATON 0.04224% IGIUGIG VILLAGE COUNCIL 0.02863% IHANKTONWAN COMMUNITY COLLEGE 0.00634% ILIAMNA VILLAGE COUNCIL 0.03703% INDIAN CENTER, INC. 0.00187% INDIAN HEALTH COUNCIL INC 0.05032% INTER TRIBAL COUNCIL AVT 0.00562% INTER TRIBAL COUNCIL OF MI INC 0.00468% INTER-TRIBAL COUCIL OF CA INC 0.00094% INUPIAT COMMUNITY OF THE ARCTIC SLOPE 0.07490% IOWA TRIBE OF OKLAHOMA 0.07191% IQURMIUT TRADITIONAL COUNCIL 0.01695% JAMESTOWN S'KLALLAM TRIBE 0.51076% JENA BAND OF CHOCTAW INDIANS 0.04486% JICARILLA APACHE TRIBE 0.14038% KAIBAB PAIUTE TRIBE 0.05637% KAKE, ORGANIZED VILLAGE OF 0.14416% KALISPEL BUSINESS COMMITTEE 0.08081% KARLUK IRA COUNCIL 0.02470% KARUK TRIBE 0.26520% KASHIA BAND OF POMO INDIANS OF STEWARTS POINT RANCHERIA 0.04874% KAW NATION 0.12717% KAWERAK, INC. 1.81756% KENAITZE INDIAN TRIBE 0.06581% KETCHIKAN INDIAN CORPORATION 0.73550% KEWEENAW BAY INDIAN COMMUNITY 0.20792%
Case 1:90-cv-00957-JAP-KBM Document 1306-3 Filed 09/16/15 Page 11 of 22

12
KIALEGEE TRIBAL TOWN 0.04649% KIANA TRADITIONAL COUNCIL 0.03441% KICKAPOO OF OKLAHOMA 0.10920% KICKAPOO TRADITONAL TRIBE OF TEXAS 0.06810% KICKAPOO TRIBE IN KANSAS 0.11255% KIOWA TRIBAL HOUSING PROGRAMS 0.00281% KIOWA TRIBE OF OKLAHOMA 0.06585% KIPNUK TRADITIONAL COUNCIL 0.02118% KNIK TRIBAL COUNCIL 0.04543% KOBUK TRADITIONAL COUNCIL 0.02098% KODIAK AREA NATIVE ASSOCIATION 0.05955% KOLIGANEK VILLAGE COUNCIL 0.00407% KONGIGANAK TRADITIONAL COUNCIL 0.00468% KOOTENAI TRIBE OF IDAHO 0.13183% KOTLIK TRADITIONAL COUNCIL 0.00187% KOTZEBUE, NATIVE VILLAGE OF 0.27061% KUIGPAGMIUT, INC. 0.06255% KUSHKOKWIM NATIVE ASSOCIATION 0.10258% KWIGILLINGOK IRA COUNCIL 0.02824% KWINHAGAK, NATIVE VILLAGE OF 0.06049% LA JOLLA BAND OF MISSION INDIANS 0.02734% LAC COURTE OREILLES BAND OF LAKE SUPERIOR
CHIPPEWA INDIANS OF WISCONSIN 0.34217% LAC DU FLAMBEAU CHIPPEWA 0.16648% LAC VIEUX DESERT BAND OF LAKE 0.07181% LARSEN BAY TRIBAL COUNCIL 0.02883% LAS VEGAS INDIAN CENTER 0.00191% LAS VEGAS PAIUTE TRIBE 0.02901% LIME VILLAGE TRAD. COUNCIL 0.01363% LITTLE HOOP COMMUNITY COLLEGE 0.00621% LITTLE RIVER BAND-OTTAWA INIANDNS 0.17344% LITTLE TRAVERSE BAY BAND-INIANDNS 0.31266% LOCAL INDIAN EDUCATION INC 0.04380% LONE PINE PAIUTE-SHOSHONE RESERVATION 0.03108% LOVELOCK PAIUTE TRIBE 0.07174% LOWER BRULE SIOUX TRIBE 0.13674% LOWER ELWHA S'KLALLAM TRIBE 0.29604% LOWER SIOUX INDIAN COMMUNITY 0.02567% LUMMI TRIBE OF THE LUMMI RESERVATION 1.47285% LYTTON RANCHERIA 0.04832% MAINE INDIAN EDUCATION 0.14435% MAKAH INDIAN TRIBE OF THE MAKAH INDIAN
RESERVATION 0.90405%
Case 1:90-cv-00957-JAP-KBM Document 1306-3 Filed 09/16/15 Page 12 of 22
13
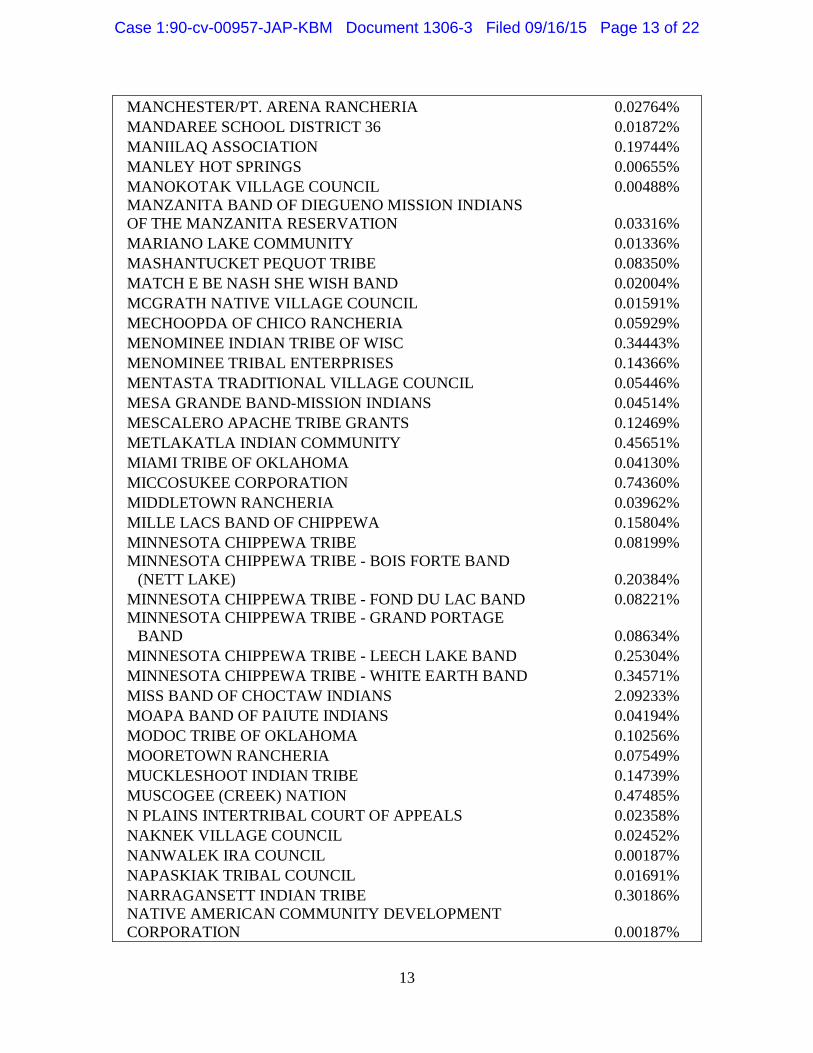
MANCHESTER/PT. ARENA RANCHERIA 0.02764% MANDAREE SCHOOL DISTRICT 36 0.01872% MANIILAQ ASSOCIATION 0.19744% MANLEY HOT SPRINGS 0.00655% MANOKOTAK VILLAGE COUNCIL 0.00488% MANZANITA BAND OF DIEGUENO MISSION INDIANS OF THE MANZANITA RESERVATION 0.03316% MARIANO LAKE COMMUNITY 0.01336% MASHANTUCKET PEQUOT TRIBE 0.08350% MATCH E BE NASH SHE WISH BAND 0.02004% MCGRATH NATIVE VILLAGE COUNCIL 0.01591% MECHOOPDA OF CHICO RANCHERIA 0.05929% MENOMINEE INDIAN TRIBE OF WISC 0.34443% MENOMINEE TRIBAL ENTERPRISES 0.14366% MENTASTA TRADITIONAL VILLAGE COUNCIL 0.05446% MESA GRANDE BAND-MISSION INDIANS 0.04514% MESCALERO APACHE TRIBE GRANTS 0.12469% METLAKATLA INDIAN COMMUNITY 0.45651% MIAMI TRIBE OF OKLAHOMA 0.04130% MICCOSUKEE CORPORATION 0.74360% MIDDLETOWN RANCHERIA 0.03962% MILLE LACS BAND OF CHIPPEWA 0.15804% MINNESOTA CHIPPEWA TRIBE 0.08199% MINNESOTA CHIPPEWA TRIBE - BOIS FORTE BAND
(NETT LAKE) 0.20384% MINNESOTA CHIPPEWA TRIBE - FOND DU LAC BAND 0.08221% MINNESOTA CHIPPEWA TRIBE - GRAND PORTAGE
BAND 0.08634% MINNESOTA CHIPPEWA TRIBE - LEECH LAKE BAND 0.25304% MINNESOTA CHIPPEWA TRIBE - WHITE EARTH BAND 0.34571% MISS BAND OF CHOCTAW INDIANS 2.09233% MOAPA BAND OF PAIUTE INDIANS 0.04194% MODOC TRIBE OF OKLAHOMA 0.10256% MOORETOWN RANCHERIA 0.07549% MUCKLESHOOT INDIAN TRIBE 0.14739% MUSCOGEE (CREEK) NATION 0.47485% N PLAINS INTERTRIBAL COURT OF APPEALS 0.02358% NAKNEK VILLAGE COUNCIL 0.02452% NANWALEK IRA COUNCIL 0.00187% NAPASKIAK TRIBAL COUNCIL 0.01691% NARRAGANSETT INDIAN TRIBE 0.30186% NATIVE AMERICAN COMMUNITY DEVELOPMENT CORPORATION 0.00187%
Case 1:90-cv-00957-JAP-KBM Document 1306-3 Filed 09/16/15 Page 13 of 22

14
NATIVE COUNCIL OF PORT HEIDEN 0.02237% NATIVE VILLAGE OF AKHIOK 0.00468% NATIVE VILLAGE OF AMBLER 0.01822% NATIVE VILLAGE OF CHENEGA 0.00187% NATIVE VILLAGE OF DEERING 0.01941% NATIVE VILLAGE OF EKLUTNA 0.02667% NATIVE VILLAGE OF ELIM 0.00655% NATIVE VILLAGE OF FORT YUKON 0.00597% NATIVE VILLAGE OF KASIGLUK 0.02271% NATIVE VILLAGE OF KIVALINA 0.01895% NATIVE VILLAGE OF KLUTI-KAAH 0.01217% NATIVE VILLAGE OF MARSHALL 0.02882% NATIVE VILLAGE OF MEKORYUK 0.04410% NATIVE VILLAGE OF NAPAKIAK 0.00187% NATIVE VILLAGE OF NOATAK 0.02601% NATIVE VILLAGE OF PAIMIUT 0.01648% NATIVE VILLAGE OF PITKA'S 0.01562% NATIVE VILLAGE OF POINT HOPE 0.09043% NATIVE VILLAGE OF SAVOONGA 0.00374% NATIVE VILLAGE OF SHELDON 0.00094% NATIVE VILLAGE OF TYONEK 0.03233% NATIVE VILLAGE OF UNALAKLEET 0.00749% NATIVE VILLAGE OF VENETIE 0.02320% NATIVE VILLAGE OF WALES 0.00421% NAVAJO AGRICULTURAL PRODUCTS INDUSTRY 0.23813% NAY AH SHING SCHOOL 0.06302% NB INDIAN INTER TRIBAL DEVELOPMENT CORPORATION 0.00187% NEW KOLIGANEK VILLAGE COUNCIL 0.00094% NEW STUYAHOK TRADITIONAL 0.01764% NEWHALEN TRIBAL COUNCIL 0.02412% NEWTOK TRADITIONAL COUNCIL 0.02404% NEZ PERCE TRIBE 0.55381% NIGHTMUTE TRADITIONAL COUNCIL 0.01959% NINILCHIK TRADITIONAL COUNCIL 0.05194% NISQUALLY INDIAN TRIBE 0.56972% NOME ESKIMO COMMUNITY 0.14242% NONDALTON TRIBAL COUNCIL 0.04539% NOOKSACK INDIAN TRIBE 0.27198% NOORVIK IRA COUNCIL 0.02871% NORTH FORK RANCHERIA 0.07585% NORTHERN ARAPAHO TRIBE 0.25759% NORTHERN CHEYENNE OF THE NORTHERN CHEYENNE 0.30464%
Case 1:90-cv-00957-JAP-KBM Document 1306-3 Filed 09/16/15 Page 14 of 22
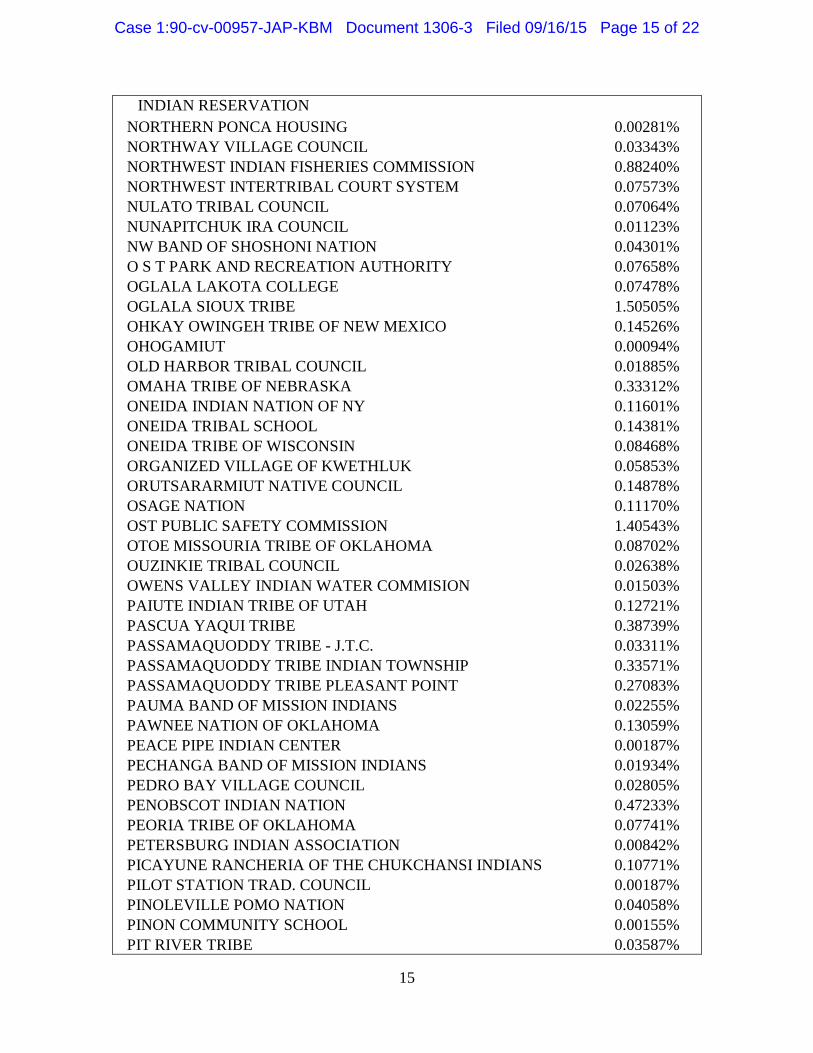
15
INDIAN RESERVATION NORTHERN PONCA HOUSING 0.00281% NORTHWAY VILLAGE COUNCIL 0.03343% NORTHWEST INDIAN FISHERIES COMMISSION 0.88240% NORTHWEST INTERTRIBAL COURT SYSTEM 0.07573% NULATO TRIBAL COUNCIL 0.07064% NUNAPITCHUK IRA COUNCIL 0.01123% NW BAND OF SHOSHONI NATION 0.04301% O S T PARK AND RECREATION AUTHORITY 0.07658% OGLALA LAKOTA COLLEGE 0.07478% OGLALA SIOUX TRIBE 1.50505% OHKAY OWINGEH TRIBE OF NEW MEXICO 0.14526% OHOGAMIUT 0.00094% OLD HARBOR TRIBAL COUNCIL 0.01885% OMAHA TRIBE OF NEBRASKA 0.33312% ONEIDA INDIAN NATION OF NY 0.11601% ONEIDA TRIBAL SCHOOL 0.14381% ONEIDA TRIBE OF WISCONSIN 0.08468% ORGANIZED VILLAGE OF KWETHLUK 0.05853% ORUTSARARMIUT NATIVE COUNCIL 0.14878% OSAGE NATION 0.11170% OST PUBLIC SAFETY COMMISSION 1.40543% OTOE MISSOURIA TRIBE OF OKLAHOMA 0.08702% OUZINKIE TRIBAL COUNCIL 0.02638% OWENS VALLEY INDIAN WATER COMMISION 0.01503% PAIUTE INDIAN TRIBE OF UTAH 0.12721% PASCUA YAQUI TRIBE 0.38739% PASSAMAQUODDY TRIBE - J.T.C. 0.03311% PASSAMAQUODDY TRIBE INDIAN TOWNSHIP 0.33571% PASSAMAQUODDY TRIBE PLEASANT POINT 0.27083% PAUMA BAND OF MISSION INDIANS 0.02255% PAWNEE NATION OF OKLAHOMA 0.13059% PEACE PIPE INDIAN CENTER 0.00187% PECHANGA BAND OF MISSION INDIANS 0.01934% PEDRO BAY VILLAGE COUNCIL 0.02805% PENOBSCOT INDIAN NATION 0.47233% PEORIA TRIBE OF OKLAHOMA 0.07741% PETERSBURG INDIAN ASSOCIATION 0.00842% PICAYUNE RANCHERIA OF THE CHUKCHANSI INDIANS 0.10771% PILOT STATION TRAD. COUNCIL 0.00187% PINOLEVILLE POMO NATION 0.04058% PINON COMMUNITY SCHOOL 0.00155% PIT RIVER TRIBE 0.03587%
Case 1:90-cv-00957-JAP-KBM Document 1306-3 Filed 09/16/15 Page 15 of 22
16
PLATINUM TRADITIONAL VILLAGE 0.01556% POARCH BAND OF CREEK INDIANS 0.37100% POINT NO POINT TREATY COUNCIL 0.06340% POKAGON BAND OF POTAWATOMI 0.29191% PONCA TRIBE OF NEBRASKA 0.27910% PONCA TRIBE OF OKLAHOMA 0.08234% PORT GAMBLE S'KLALLAM TRIBE 0.58897% PORT GRAHAM VILLAGE COUNCIL 0.00187% PORT LIONS TRADITIONAL. TRIBAL COUNCIL 0.02732% POTTER VALLEY TRIBE 0.01208% PRAIRIE BAND POTAWATOMI NATION 0.07733% PRAIRIE ISLAND DAKOTA COMMUNTY 0.03195% PUEBLO DE COCHITI 0.05474% PUEBLO DE SAN IIDEFONSO 0.04320% PUEBLO OF ACOMA 0.15794% PUEBLO OF ACOMA HOUSING 0.00468% PUEBLO OF ISLETA 0.07308% PUEBLO OF JEMEZ 0.09153% PUEBLO OF LAGUNA 0.23144% PUEBLO OF LAGUNA DEPT OF EDUCATION 0.02808% PUEBLO OF NAMBE 0.03278% PUEBLO OF PICURIS 0.03538% PUEBLO OF POJOAQUE 0.07628% PUEBLO OF SAN FELIPE 0.04910% PUEBLO OF SANDIA 0.04094% PUEBLO OF SANTA ANA 0.04597% PUEBLO OF TAOS 0.21266% PUEBLO OF ZIA 0.04561% PUEBLO OF ZUNI 0.33309% PUYALLUP TRIBE OF INDIANS 0.24829% PYRAMID LAKE PAIUTE TRIBE 0.13672% QAGAN TAYAGUNGIN TRIBES 0.01694% QUALINGIN TRIBE OF UNALASKA 0.02364% QUAPAW TRIBE OF OKLAHOMA 0.06873% QUARTZ VALLEY INDIAN RESERVATION 0.07509% QUILEUTE TRIBAL COUNCIL 0.67443% QUINAULT INDIAN NATION 2.67507% QUTEKCAK NATIVE TRIBE 0.00187% RAMAH NAVAJO CHAPTER 0.91699% RAMAH NAVAJO SCHOOL BOARD INC 0.18872% RAMONA BAND OF CAHUILLA 0.02711% RAMPART VILLAGE COUNCIL 0.00094% RAPID CITY INDIAN HEALTH BRD. 0.00187%
Case 1:90-cv-00957-JAP-KBM Document 1306-3 Filed 09/16/15 Page 16 of 22

17
RED CLIFF BAND OF LAKE SUPERIOR 0.25899% RED DEVIL TRADITIONAL COUNCIL 0.00094% RED HORSE LODGE INC 0.00481% RED LAKE BAND OF CHIPPEWA INDIANS 0.56719% REDDING RANCHERIA 0.11979% REDWOOD VALLEY LITTLE RIVER 0.04236% RENO SPARKS TRIBAL COUNCIL 0.06405% RESERVATION TRANSPRTN AUTHORTY 0.00692% RINCON BAND OF MISSION INDIANS 0.02719% RIVERSIDE-SAN BERNARDINO 0.02829% ROBINSON RANCHERIA 0.04027% ROCK POINT SCHOOL INC 0.00187% ROSEBUD SIOUX TRIBE 0.62636% ROUND VALLEY RESERVATION 0.11867% RUBY TRIBAL COUNCIL 0.01952% SAC AND FOX NATION 0.38582% SAC AND FOX SETTLEMENT SCHOOL 0.09058% SAC AND FOX TRIBE OF THE MISSISSIPPI IN IOWA 0.06625% SAGINAW CHIPPEWA INDIAN TRIBE 0.14279% SALISH/KOOTENAI COLLEGE 0.02809% SALT RIVER PIMA MARICOPA 0.38735% SAMISH INDIAN NATION 0.08569% SAN CARLOS APACHE TRIBE 1.66270% SAN JUAN SOUTHERN PAIUTE TRIBE 0.06132% SAN PASQUAL BAND OF MISSION INDIANS 0.02763% SANTA CLARA PUEBLO 0.15704% SANTA FE INDIAN SCHOOL 0.00094% SANTA YNEZ BAND OF MISSION INDIANS 0.03395% SANTA YNEZ TRIBAL HEALTH CLINIC 0.00374% SANTEE SIOUX NATION 0.12536% SANTO DOMINGO TRIBE 0.06140% SAUK SUIATTLE INDIAN TRIBE 0.10893% SAULT STE MARIE TRIBE 0.50239% SCAMMON BAY TRAD. COUNCIL 0.00187% SCOTTS VALLEY RANCHERIA 0.02690% SELAWIK NATIVE VILLAGE 0.05227% SELDOVIA VILLAGE TRIBE 0.05103% SEMINOLE NATION OF OKLAHOMA 0.08802% SEMINOLE TRIBE OF FLORIDA 0.47019% SENECA CAYUGA TRIBE OF OKLAHOMA 0.05295% SENECA NATION OF INDIANS 0.11006% SHAKOPEE MDEWAKANTON SIOUX 0.01798% SHAKTOOLIK, NATIVE VILLAGE OF 0.00562%
Case 1:90-cv-00957-JAP-KBM Document 1306-3 Filed 09/16/15 Page 17 of 22

18
SHERWOOD VALLEY RANCHERIA 0.05411% SHINGLE SPRINGS RANCHERIA 0.04293% SHIPROCK ASSOCIATED SCHOOLS, INC. 0.00103% SHISHMAREF, NATIVE VILLAGE OF 0.00749% SHOALWATER BAY TRIBAL COUNCIL 0.17876% SHOSHONE & ARAPAHOE TRIBES 0.08358% SHOSHONE BANNOCK TRIBES INC 0.62532% SHOSHONE TRIBE OF THE WIND RIVER RESERVATION, WYOMING 0.08593% SILETZ, CONFEDERATED TRIBES OF 0.41517% SINTE GLESKA UNIVERSITY 0.13679% SIOUX CITY IND EDUC COMMITTEE 0.01404% SISSETON WAHPETON HOUSING AUTHORITY 0.01591% SISSETON-WAHPETON COMM.COLLEGE 0.02107% SISSETON-WAHPETON OYATE 0.26163% SITKA TRIBE 0.32745% SITTING BULL COLLEGE 0.04234% SKAGIT SYSTEM COOPERATIVE 0.10119% SKOKOMISH INDIAN TRIBE 0.33795% SKULL VALLEY BAND OF GOSHUTES 0.01123% SKY PEOPLE HIGHER EDUCATION 0.19123% SMITH RIVER RANCHERIA 0.06642% SNOQUALMIE INDIAN TRIBE 0.04367% SO PUGET INTER TRIBAL PLANNING 0.00281% SOBOBA BAND OF MISSION INDIANS 0.02209% SOKAOGON CHIPPEWA COMMUNITY 0.05820% SOUTH FORK BAND COUNCIL 0.01498% SOUTHERN INDIAN HEALTH COUNCIL 0.06430% SOUTHERN UTE INDIAN TRIBE 0.19098% SPIRIT LAKE SIOUX TRIBE 0.13748% SPOKANE TRIBE OF THE SPOKANE RESERVATION 0.20912% SQUAXIN ISLAND TRIBAL COUNCIL 0.49505% ST CROIX TRIBAL COUNCIL 0.05328% ST MICHAEL,NATIVE VILLAGE OF 0.01030% ST MICHAELS ASSOCIATION FOR SPECIAL EDUCATION 0.13744% ST REGIS MOHAWK TRIBE 0.12692% ST. PAUL IRA COUNCIL 0.01123% STANDING ROCK SIOUX TRIBE 0.49836% STEVENS VILLAGE COUNCIL 0.02352% STILLAGUAMISH BOARD OF DIRECTORS 0.20653% STOCKBRIDGE MUNSEE COMMUNITY 0.04565% SUMMIT LAKE PAIUTE TRIBE 0.11473% SUN’AQ TRIBE OF KODIAK 0.07733%
Case 1:90-cv-00957-JAP-KBM Document 1306-3 Filed 09/16/15 Page 18 of 22
19
SUQUAMISH INDIAN TRIBE OF THE PORT MADISON RESERVATION 0.62053%
SUSANVILLE INDIAN RANCHERIA 0.05397% SWINOMISH INDIAN TRIBE 0.31439% TANACROSS VILLAGE COUNCIL 0.01945% TANANA CHIEFS CONFERENCE, INC. 1.38181% TANANA IRA NATIVE COUNCIL 0.05307% TANGIRNAQ NATIVE VILLAGE 0.02120% TE MOAK TRIBE-WESTERN SHOSHONE 0.05913% TESUQUE PUEBLO 0.04435% THE BLACKFEET TRIBE 0.37017% THE BROWNSTONE WOMAN PROJECT 0.00281% THE HOPI TRIBE 0.38443% THE KLAMATH TRIBE 0.64137% THE NAVAJO NATION 6.78976% THE QUECHAN TRIBE 0.09805% THLOPTHLOCCO TRIBAL TOWN 0.04045% THREE AFFILIATED TRIBES 0.93110% TIMBISHA SHOSHONE TRIBE 0.02588% TLINGIT-HAIDA, CENTRAL COUNCIL OF 1.34230% TO'HAJIILEE COMMUNITY SCHOOL 0.09955% TOHATCHI SPECIAL EDUCATION & TRAINING CENTER 0.02052% TOHONO O'ODHAM HOUSING AUTHORITY 0.00562% TOHONO O'ODHAM NATION 0.95390% TOIYABE INDIAN HEALTH PROJECT,INC 0.00987% TOKSOOK BAY TRADITIONAL COUNCIL 0.02284% TONKAWA TRIBE OF OKLAHOMA 0.07998% TONTO APACHE TRIBE 0.02780% TORRES MARTINEZ BAND OF MISSION INDIANS 0.03453% TRADITONAL COUNCIL OF TOGIAK 0.01837% TRENTON INDIAN SERVICE AREA 0.02566% TRINIDAD RANCHERIA 0.08317% TULALIP TRIBES OF WASHINGTON 0.45414% TULE RIVER TRIBAL COUNCIL 0.06685% TULUKSAK IRA COUNCIL 0.03036% TUNICA-BILOXI INDIANS OF LOUISIANA 0.14958% TUNTUTULIAK TRADITIONAL COUNCIL 0.00187% TUNUNAK IRA COUNCIL 0.02340% TUOLUMNE RANCHERIA 0.02814% TURTLE MOUNTAIN BAND 0.29615% TURTLE MOUNTAIN COMMUNITY COLLEGE 0.03356% TWIN BUTTES SCHOOL DISTRICT 37 0.01791% TWIN HILLS VILLAGE COUNCIL 0.00562%
Case 1:90-cv-00957-JAP-KBM Document 1306-3 Filed 09/16/15 Page 19 of 22

20
UINTAH/OURAY UTE INDIAN TRIBE 0.11470% UMKUMIUTE TRADITIONAL COUNCIL 0.01454% UNITED CROW BAND INC 0.01382% UNITED SIOUX TRIBES DEVELOPMENT CORPORATION 0.03829% UNITED TRIBES TECHNICAL COLLEGE 0.49486% UNITED VILLAGES INC 0.02861% UPPER KALSKAG TRAD. COUNCIL 0.00187% UPPER SIOUX COMMNITY 0.02401% UPPER SKAGIT INDIAN TRIBE 0.16772% UTE MOUNTAIN UTE TRIBE 0.26337% VALDEZ NATIVE TRIBE 0.02583% VILLAGE OF AFOGNAK 0.03050% VILLAGE OF ANIAK 0.01123% VILLAGE OF LOWER KALSKAG 0.00468% VILLAGE OF SALAMATOFF 0.00118% WAHPETON INDIAN SCH BRD INC 0.18193% WAINWRIGHT TRADITIONAL COUNCIL 0.00610% WALKER RIVER PAIUTE TRIBE 0.09699% WAMPANOAG TRIBE OF GAY HEAD 0.34909% WASHOE TRIBE 0.05558% WELLS BAND COUNCIL 0.03902% WHITE MOUNTAIN APACHE TRIBE 0.67374% WHITE MOUNTAIN NATIVE VILLAGE 0.00562% WICHITA AND AFFILIATED TRIBES 0.03317% WILTON RANCHERIA 0.00281% WINGATE BOARD OF EDUCATION INC 0.13610% WINNEBAGO TRIBE OF NEBRASKA 0.13901% WIYOT TRIBE 0.05670% WYANDOTTE TRIBE OF OKLAHOMA 0.08412% YAKUTAT TLINGIT TRIBE 0.09001% YANKTON SIOUX TRIBE 0.17574% YAVAPAI APACHE TRIBE 0.20086% YAVAPAI PRESCOTT TRIBE 0.07920% YERINGTON PAIUTE TRIBE 0.04718% YOMBA SHOSHONE TRIBE 0.08757% YSLETA DEL SUR PUEBLO 0.14701% YUPIIT OF ANDREAFSKI 0.02320% YUROK TRIBE 0.74984% TOTAL 98.95741%
Case 1:90-cv-00957-JAP-KBM Document 1306-3 Filed 09/16/15 Page 20 of 22

21
Table 2. Class Members That Have Not Previously Been Given an Opportunity to Request Exclusion
Class Member Class Member Name Distribution Percentage ALTURAS INDIAN RANCHERIA 0.00412% ANGOON COMMUNITY ASSOCIATION 0.00187% ANVIK VILLAGE 0.01798% BARONA BAND OF MISSION INDIANS 0.00749% BENTON PAIUTE RESERVATION 0.00936% BONSALL UNION SCHOOL DISTRICT 0.00562% CAHUILLA BAND OF INDIANS 0.01404% CAYUGA NATION 0.01311% CHEESH-NA TRIBE 0.01790% CHIGNIK LAGOON VILLAGE COUNCIL 0.00094% COLD SPRINGS RANCHERIA 0.02061% COLUSA RANCHERIA 0.00655% COWLITZ INDIAN TRIBE 0.03108% CROOKED CREEK TRAD. COUNCIL 0.01109% EKWOK VILLAGE COUNCIL 0.00094% FED. INDIANS OF GRATON RANCHERIA 0.01186% FORT BERTHOLD HOUSING AUTHORITY 0.00207% GRINDSTONE INDIAN RANCHERIA OF WINTUN-WAILAKI INDIANS 0.00749% IIPAY NATION OF SANTA YSABEL 0.01734% INAJA BAND OF MISSION INDIANS 0.00804% INDIAN CHILD & FAMILY PRESERVATION 0.00374% INDIAN CHILD & FAMILY SERVICES 0.01217% INTER TRIBAL COUNCIL OF NEVADA 0.01277% INTERTRIBAL BISON COUNCIL 0.00187% IONE BAND OF MIWOK INDIANS 0.01113% IOWA TRIBE OF KANSAS AND NEBRASKA 0.01591% JAMUL INDIAN VILLAGE 0.01518% KALTAG TRIBAL COUNCIL 0.00885% KING SALMON TRIBE 0.01217% KOYUKUK NATIVE VILLAGE 0.00468% LA POSTA BAND OF MISSION INDIANS 0.02171% LAKOTA OYATE WAKANYEJA OWICAKI 0.00468% LOS COYOTES BAND OF MISSION INDIANS 0.00749% LOWER LAKE RANCHERIA 0.00374% MASHPEE WAMPANOAG TRIBE 0.02633% MNI SOSE INTERTRIBAL WATER RIGHTS COALITION 0.00616%
Case 1:90-cv-00957-JAP-KBM Document 1306-3 Filed 09/16/15 Page 21 of 22

22
MORONGO BAND OF MISSION INDIANS 0.00956% NATIVE AMERICAN FAMILY SERVICES 0.01779% NATIVE VILLAGE OF CANTWELL 0.00468% NATIVE VILLAGE OF GAKONA 0.01665% NATIVE VILLAGE OF KAKTOVIK 0.01459% NATIVE VILLAGE OF KALSKAG 0.00281% NATIVE VILLAGE OF NUIQSUT 0.01157% NATIVE VILLAGE OF TAZLINA 0.00842% NAVAJO TECHNICAL COLLEGE 0.29699% NORTHERN PUEBLOS TRIBUTARY WATER RIGHTS 0.00842% ORGANIZED VILLAGE OF KASAAN 0.00187% OTTAWA TRIBE OF OKLAHOMA 0.03155% PALA BAND OF MISSION INDIANS 0.01217% PONCA ECONOMIC DEVELOPMENT CORPORATION 0.00868% SAC AND FOX TRIBE OF MISSOURI 0.01901% SAN DIEGO UNIFIED SCHOOL DISTRICT 0.00187% SAN FELIPE PUEBLO HOUSING AUTHORITY 0.00281% SAN MANUEL BAND-MISSION INDIAN 0.00468% SANTA ROSA BAND OF MISSION INDIANS 0.00859% SHAWNEE TRIBE 0.00752% SHINNECOCK INDIAN NATION FUND, INC. 0.00519% SICANGU CHILD AND FAMILY SERVICES 0.00468% SKAGWAY VILLAGE 0.00281% SLEETMUTE TRADITIONAL COUNCIL 0.01120% SOUTH NAKNEK VILLAGE COUNCIL 0.01528% SOUTHERN CA INDIAN CENTER INC 0.00685% SOUTHERN CALIF TRIBAL CHAIRMEN 0.00374% SYCUAN BAND OF MISSION INDIANS 0.00803% TE-MOAK SHOSHONE LAW ENFORCEMENT SERVICES 0.01049% THE MOHEGAN TRIBE 0.00849% TODD COUNTY SCHOOL DIST 66-1 0.00281% TOHONO O'ODHAM COMMUNITY COLLEGE 0.01567% TWENTY-NINE PALMS BAND OF MISSION INDIANS 0.00726% UGASHIK TRADITIONAL COUNCIL 0.00655% UNITED KEETOOWAH BAND OF CHEROKEE
INDIANS IN OKLAHOMA 0.02670% UPPER COLUMBIA UNITED TRIBES 0.02918% VIEJAS BAND OF MISSION INDIANS 0.00655% WINNER SCHOOL DISTRICT 59-2 0.00281% TOTAL 1.04259%
Case 1:90-cv-00957-JAP-KBM Document 1306-3 Filed 09/16/15 Page 22 of 22