raman and surface-enhanced raman spectra of...
TRANSCRIPT
JOURNAL OF RAMAN SPECTROSCOPYJ. Raman Spectrosc. 2007; 38: 802–818Published online 2 March 2007 in Wiley InterScience(www.interscience.wiley.com) DOI: 10.1002/jrs.1695
Raman and surface-enhanced Raman spectra of flavoneand several hydroxy derivatives
Tatyana Teslova,1† Charlie Corredor,1† Richard Livingstone,1 Tudor Spataru,1
Ronald L. Birke,1 John R. Lombardi,1∗ M. V. Canamares2 and Marco Leona2
1 Department of Chemistry and Center for Study of Structures and Interfaces (CASI), The City College of New York, New York, N.Y. 100312 The Metropolitan Museum of Art, 1000 Fifth Avenue, New York, N.Y. 10028
Received 19 September 2006; Accepted 5 December 2006
The Raman and surface-enhanced Raman spectra (SERS) of flavone and three of its hydroxy derivatives,3-hydroxyflavone (3-HF) and 5-hydroxyflavone (5-HF) and quercetin (3,5,7,3′,4′ pentahydroxyflavone) havebeen obtained. The normal Raman (NR) spectra were taken in the powder form. The SERS spectra wereobtained both on Ag colloids and Ag electrode substrates. Assignments of the spectrally observed normalmodes were aided by density functional theory (DFT) calculations using the B3LYP functional and the6-31+G∗ basis, a split valence polarized basis set with diffuse functions. Excellent fits were obtained forthe observed spectra with little or no scaling. The most intense lines of the NR spectra are those in theC O stretching region (near 1600 cm−1). These lines are often weakened by proximity to the surface,while other lines at lower wavenumbers, due to in-plane ring stretches, tend to be strongly enhanced. TheSERS spectrum of flavone is weak both on the colloid and on the electrode, indicating weak attachmentto the surface. In contrast, the SERS spectra of the hydroxy derivatives of flavone are intense, indicatingthe assistance of OH groups in attachment to the surface. The spectra of the various species are compared,and a case study of application to detection of a textile dye (Persian berries), which contains quercetin, ispresented. Copyright 2007 John Wiley & Sons, Ltd.
KEYWORDS: surface-enhanced Raman spectroscopy; Ag colloids; electrochemical SERS; flavonoids; DFT
INTRODUCTION
Almost all flavone derivatives have been identified frombotanical sources.1 They are commonly found in vascularplants as phenyl-benzopyrones with different basic struc-tures. Many of the flavonoids found in plants exist as sugarderivatives (glycosides).2 Owing to their active role in pho-tosensitization, energy transport and cellular metabolism,many of flavone derivatives are ingredients for biochem-ical and pharmacological products used as human dietsupplements.3 – 8
Flavones and flavonols found in plants are yellowcompounds and are the main components of a numberof natural dyes used in textile dyeing since antiquity. Fustic,young fustic, quercitron, Persian berries, weld, dyer’s broomand sawwort, which are important yellow dyes, all containflavonoids such as quercetin, luteolin, fisetin, rhamnetin,
ŁCorrespondence to: John R. Lombardi, Department of Chemistryand Center for Study of Structures and Interfaces (CASI), The CityCollege of New York, New York, N.Y. 10031, USA.E-mail: [email protected]†The first two authors carried out much of the work involved in thisresearch and should be considered equally as principal authors.
genistein and morin.9 Extracted from plants, they are easilyhydrolyzed from the glycosides to their parent flavonoid andcan be applied to textiles as mordant dyes.
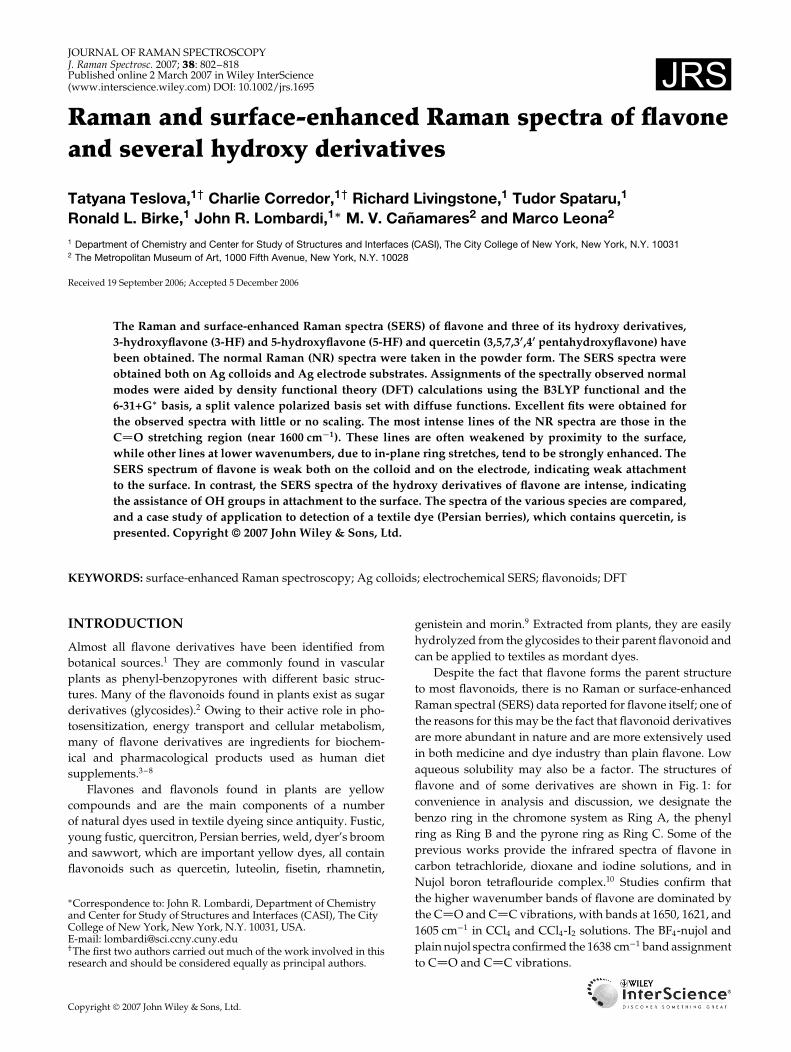
Despite the fact that flavone forms the parent structureto most flavonoids, there is no Raman or surface-enhancedRaman spectral (SERS) data reported for flavone itself; one ofthe reasons for this may be the fact that flavonoid derivativesare more abundant in nature and are more extensively usedin both medicine and dye industry than plain flavone. Lowaqueous solubility may also be a factor. The structures offlavone and of some derivatives are shown in Fig. 1: forconvenience in analysis and discussion, we designate thebenzo ring in the chromone system as Ring A, the phenylring as Ring B and the pyrone ring as Ring C. Some of theprevious works provide the infrared spectra of flavone incarbon tetrachloride, dioxane and iodine solutions, and inNujol boron tetraflouride complex.10 Studies confirm thatthe higher wavenumber bands of flavone are dominated bythe C O and C C vibrations, with bands at 1650, 1621, and1605 cm�1 in CCl4 and CCl4-I2 solutions. The BF4-nujol andplain nujol spectra confirmed the 1638 cm�1 band assignmentto C O and C C vibrations.
Copyright 2007 John Wiley & Sons, Ltd.
Raman and SERS spectra of flavone and several hydroxy derivatives 803
O
O
1
2
35
6
7
8
2'
3'4'
5'
6'O
O
OH
O
OOH
O
OOH
OH
HO
OHOH
Figure 1. Flavone (upper left), 3-hydroxyflavone (upper right),5-hydroxyflavone (lower left), and quercitin (3,5,7,30,40
pentahydroxyflavone (lower right). For convenience, wedesignate the benzo ring in the chromone system as Ring A,the phenyl ring as Ring B and the pyrone ring as Ring C.
As a member of flavonoid family, 3-hydroxyflavone (3-HF, flavonol) has been extensively studied for chemical andstructural properties by UV, NMR, IR and PMR11,12 and usedin extensive studies of excited-state intramolecular protontransfer and photoisomerization by means of electronic spec-troscopy and time-resolved fluorescence measurements.13 – 15
Infrared spectroscopy has been widely applied to study thevibrational modes of 3-HF.16 – 20 Unlike in flavone where thecarbonyl absorption is at 1649 cm�1, in 3-HF its wavenum-ber is lowered to 1610 cm�1 which overlaps with the C Cband. The IR spectra in the C–H and O–H stretching regionwere reported differently in various works,10,15,16 in whichresearchers concluded that there is no strong hydrogen bond-ing in 3-HF, as opposed to the 5-hydroxyflavone (5-HF)molecule. The hydroxyl stretching absorption was found at3350 cm�1.
Many studies have been reported on 5-HF, including IR,UV, NMR and proton-transfer fluorescence spectra.10,15,21 – 23
The published IR spectra show that although in 5-HF thehydroxyl stretching band is broadened and displaced tolower wavenumbers (3000–2500 cm�1) to an extent that ithas almost disappeared, none of the compounds examinedshows a marked lowering of the carbonyl wavenumber.Two possible canonical forms of 5-HF were reported,which explained the electronic behavior of the moleculeand confirmed that the hydroxyl group forms a stronghydrogen bond between the phenolic hydrogen atom andthe negatively charged carbonyl oxygen atom. CarbonylIR absorptions of 5-HF on KBr disk, Nujol mull, CCl4
and dioxane solution were reported at 1653, 1651, 1652and 1654 cm�1, respectively. Solid-state IR spectroscopy
revealed 5-HF vibrational modes with wavenumbers at 1617,1590, 1550, 1473, 1457 and 1417 cm�1, which are possiblyassociated with in-plane skeletal vibrations.15 Commonbands in the 1400–1000 cm�1 region have also been studied.Examination of the double bond region revealed C C andC O wavenumbers at 1620 and 1612 cm�1, respectively.10
One of the most biologically active and common dietarypolyhydroxy-substituted derivative of flavonol, quercetin(3,5,7,30,40 pentahydroxyflavone Fig. 1), has been studiedmore extensively than any other flavonoid owing to itscomplex chemical structure and unique properties. Quercetinand its glycoside quercitrin are the main components of thenatural dyestuff quercitron, extracted from the bark of thequercitron, or black oak (Quercus velutina Lam.); quercetinis also found in Persian berries, a dye derived from theberries of shrubs of the Rhamnus genus.10 Raman, IR andpulse radiolysis techniques were successfully used to studythe chelation properties of quercetin with Cu(II) ions.24 Thedouble bond region showed the C O band at 1649 cm�1 andthe C C band at 1607 cm�1. X-ray diffraction investigationsreported the bond lengths, bond angles and torsionalangles of quercetin, which suggested that the conformationalchanges with the physical state of the molecule are limitedto an inter-ring link.25 FT-Raman spectra of quercetin in thesolid state and in solution have shown structural changes inthe molecule depending on its physical state. Calculated andexperimental wavenumbers24 were compared after scalingthe calculated values by a factor of 0.85 in the region between600 and 1800 cm�1. UV spectra also supported the calculatedwavenumbers of quercetin.
Besides the wide studies on quercetin, there is almostno Raman or SERS work reported on flavone and 3-and 5-HF. A reference to unpublished work by Petroskiet al.26 reported 3-HF Raman bands at 1650 and 1625 cm�1.The reason for the lack of Raman work may be thefact that these molecules are poorly soluble in water andshow strong fluorescence upon excitation, which tendsto obscure the normally weak Raman spectra. Recentstudies suggest valuable application of SERS to microscopicsamples in the detection of molecules at extremely lowconcentration, which is particularly valuable in continuingresearch on biosensors,27 forensics28 and art preservation.29
In collaborative studies with the Metropolitan Museumof Art, we turned our interest to Raman spectroscopy ofseveral natural dye constituents, with an eye toward possibleapplications in the analysis of works of art. We feel it is likelythat Raman spectroscopy will be an efficient technique inthe measurement of vibrational modes of flavone, 3-HF,5-HF and quercetin at milli-, micro- and even nanomolarsolutions. Furthermore, a detailed vibrational study andcomparative analysis of these molecules could be useful toreveal the effects of hydroxy group substituents on structuraland chemical changes of flavones. In this article we reportFourier-transform Raman (FTR) spectra of all four moleculesin the solid state as well as their SERS spectra in solution on
Copyright 2007 John Wiley & Sons, Ltd. J. Raman Spectrosc. 2007; 38: 802–818DOI: 10.1002/jrs
804 T. Teslova et al.
an Ag colloid and, where possible, on an Ag electrode. Allspectral assignments were aided by density functional theory(DFT) calculations. We provide a comparative analysis of thespectra of all molecules of this study in relation to eachother. This article will be the base for our future studiesof other flavonoids, with the eventual aim of building areference database of spectral assignments for most of theimportant derivatives. This database should be of great valuein the development of pharmacological and art conservationstudies.
In the next section we present details of our experimentalprocedure, as well as DFT calculations. Following that, wepresent the analysis of the spectra of flavone, 3-HF, 5-HFand quercetin. The normal mode spectral assignments wereaided by DFT calculations, and we compare the results ofboth the normal Raman (NR) spectrum and SERS spectra.We will then provide a comparative analysis of several of thenormal modes of each molecule, showing the effect of varioushydroxy substituents on the basic flavone wavenumbers. Inthe final section, we present a proof-of-concept experiment todemonstrate the feasibility of employing SERS in the analysisof a textile dyed with the natural dyestuff Persian berries,which consists mainly of quercetin.
EXPERIMENTAL
The experimental setup for NR and electrochemical SERSstudies has been described in previous papers.30 A SpectraPhysics Model 2020 BeamLock argon ion laser line at 488 nmwas used as the Raman excitation source. The spectra wererecorded with a Spex Model 1401 double monochromatorwith a resolution of 2 cm�1. Photon-counting detection wasused. The laser power was approximately 30 mW in the SERSexperiment but only 5 mW in the NR experiment. Chemicalswere purchased from the Aldrich Chemical Company Inc.,and used as received.
The NR spectra of the solids were obtained in the region100–4000 cm�1 directly from the pure powder samples.When possible, the 488 nm laser and Raman spectroscopysetup described above were used. In cases where thefluorescence of the dyes prevented the acquisition ofa Raman spectrum, FT-Raman spectroscopy was carriedout using a Bruker Ram II FT-Raman-Vertex 70 FT-IRmicrospectrometer. The 1064 nm line of a Nd : YAG laserwas used as the excitation line. The resolution was set to4 cm�1 in the backscattering mode. A liquid-nitrogen-cooledGe detector was used to collect 100 scans for obtaining agood Raman spectrum. The laser output was kept at 150 mWfor the SERS spectra and 50 mW for the solid samples.
Additionally, some SERS work on Ag colloids was carriedout using a Bruker Senterra Raman microscope using 785 nmexcitation with power at the sample ranging from 10 to100 mW, a 1200 rulings/mm holographic grating and a CCDdetector.
The SERS spectra in an electrochemical cell were obtainedat different applied potentials with an activated Ag electrode,which had various molecules adsorbed on it. In the SERSexperiments, the sample cell consisted of a 99.999% puresilver working electrode, a Pt counter electrode and asaturated calomel electrode (SCE) as the reference. Allpotentials reported in this paper are quoted versus the SCE.For activating a Ag electrode, the polished Ag electrodewas roughened by an oxidation–reduction cycle (ORC)pretreatment, which was accomplished in the solution ofthe flavone molecules (2 ð 10�5 M) in 0.1 M K2SO4 aqueoussolution by applying a potential pulse from �0.4 to 0.5 Vfor 2 s. These solutions were made with doubly deionized,quartz distilled water. The molecule was adsorbed on the Agelectrode surface during the ORC. Non-adsorbed moleculeswere then washed from the electrode by distilled water. Afterthe ex situ ORC pretreatment, the activated Ag electrode wasplaced in 0.1 M K2SO4 aqueous solution for carrying out SERSexperiments at various potentials. The same spectra werealso obtained with in situ ORC and direct recording of theSERS spectra in the flavone solutions. The ORC pretreatmentand potential control during the SERS experiments werecarried out by using an EG&G PARC Model 175 universalprogrammer and an EG&G PARC Model 173 potentiostat.
The Ag colloid was prepared following the method ofLee and Meisel31 by reduction of silver nitrate (Aldrich209139 silver nitrate 99.9%) with sodium citrate (AldrichW302600 sodium citrate dihydrate). The colloid thus pre-pared shows an absorption maximum at 406 nm and FWHMof 106 nm, as measured with a Cary 50 UV–vis spectropho-tometer (after a 1 : 4 dilution with ultrapure water to keepthe maximum absorbance within the instrumental range). Tofurther concentrate the colloid for use, a volume of 10 ml ofthe original colloid was centrifuged at 5000 rpm for 2 min.The supernatant was discarded and the settled portion wasresuspended in 1 ml of ultrapure water. All glassware wascleaned with Pierce PC54 cleaning solution and rinsed withultrapure water and finally in acetone and methanol. Thismethod proved to be as effective as the use of aggressivecleaning agents such as aqua regia or piranha solution, andwas preferred for health and safety reasons. Only ultrapurewater was used for the preparation of the various solutions.SERS measurement were made simply by adding 1 µl of thedye solution to a 2 µl drop of the colloid deposited on agold coated microscope slide, followed by addition of 2 µlof a 0.2 M KNO3 solution. Raman measurements were madedirectly from the drop using a 10 or 20ð microscope objectiveand focusing on the microscope slide surface. SERS spectracould be obtained 2 or 3 min after addition of the KNO3 andremained constant in quality until the evaporation of theliquid.
DFT calculations were performed with Gaussian 0332
at the B3LYP level of theory and employing the 6-31CGŁ
basis set. The geometry optimization resulted in a planargeometry, and no imaginary wavenumbers were observed
Copyright 2007 John Wiley & Sons, Ltd. J. Raman Spectrosc. 2007; 38: 802–818DOI: 10.1002/jrs
Raman and SERS spectra of flavone and several hydroxy derivatives 805
in the calculated spectrum. This basis set was chosen to beconsistent with earlier work, in which the fit obtained wasexcellent (see below). We also tried using the basis 6-311GŁ,which gave an equally good wavenumber fit but with lesserability to reproduce intensities, which shows the effect of thediffuse functions in the calculation. This was especially true,for example, with the 1544 cm�1 line of quercitin, which isintense in the spectrum and using the former calculation, butis quite weak in the latter calculation. A further explorationusing the hybrid functional PBE0 and 6-31CGŁ basis setwas carried out for quercitin. This gave essentially thesame results as the B3LYP/6-31CGŁ calculation, but requiredconsiderably more computer time and memory. In general,the vibrational normal mode assignments were based on thebest-fit comparison of the calculated Raman spectrum withthe observed NR spectrum. Where needed, a slight scalingof the calculated spectrum was utilized (usually 0.96–0.99).In instances where there was spectral congestion, such asin the carbonyl stretch region (near 1600 cm�1), the relativeintensities of the calculated spectra were matched to thoseof the observed spectra, so that the most intense calculatedlines were assigned to the most intense observed lines.
RESULTS
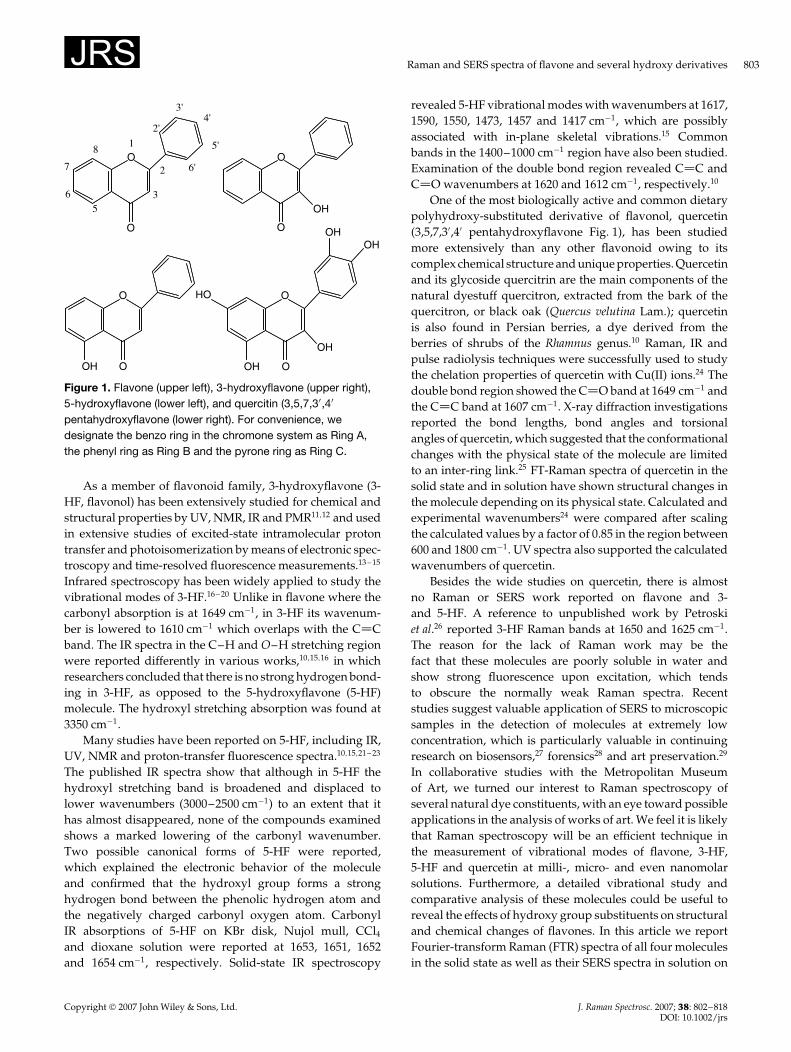
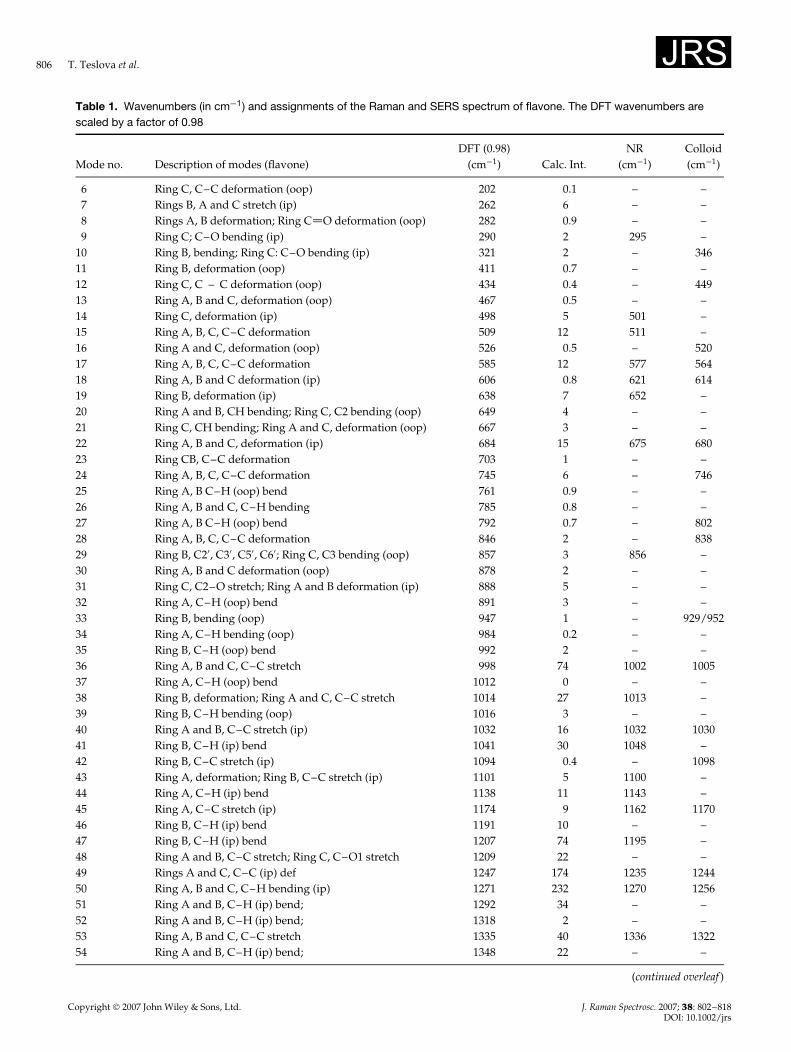
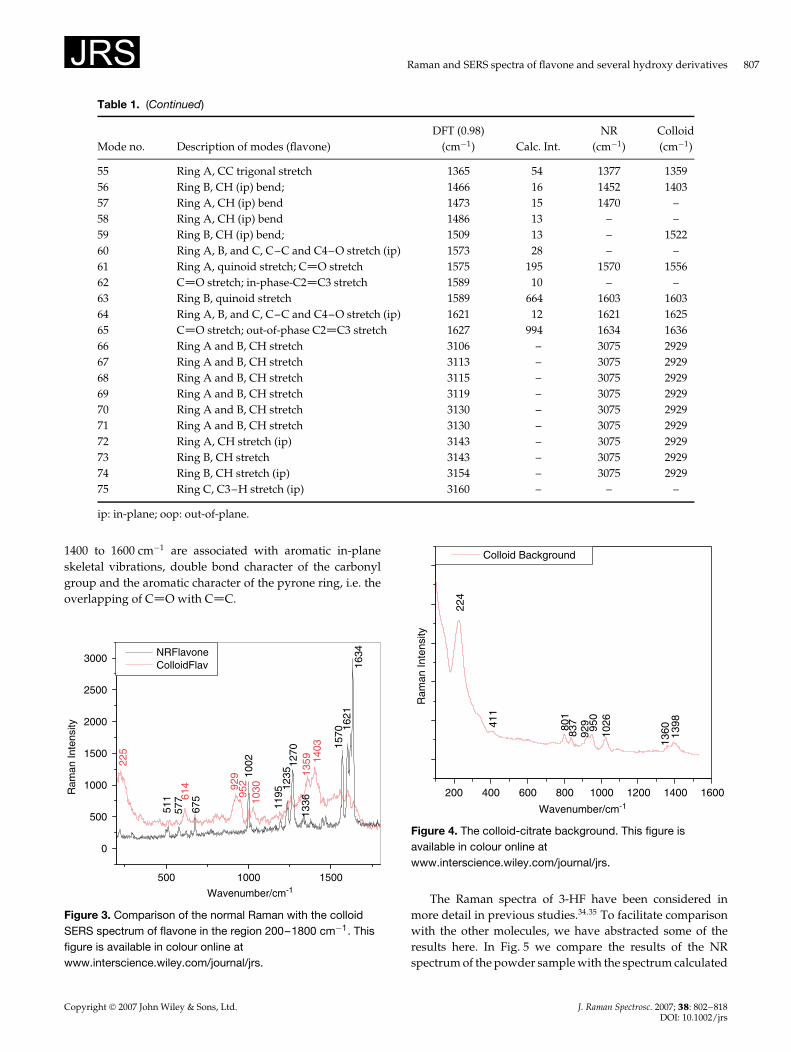
FlavoneThe NR spectrum of solid flavone along with the calculatedDFT spectrum is shown in Fig. 2 (200–1800 cm�1). Thewavenumber scale of the DFT spectrum was scaled by afactor of 0.98 in order to obtain the best fit of the calculatedspectrum with the experimental one. The observed andcalculated wavenumbers are listed in Table 1. In the lowwavenumber region, we observe an excellent match of thespectrum with the calculated modes. The most intense peaksare well fitted (such as the modes �15, �17 and �22). Only a fewof the calculated wavenumbers do not match the observedones in the low wavenumber region, such as at 745 and888 cm�1. This may be explained by the fact that the signal-to-noise ratio in this region is low and therefore the assignmentsare uncertain. In the higher wavenumber region, almost allthe intense lines correspond to the calculated features. Themost intense peak in the spectrum at 1634 cm�1 correspondsto the �65 mode calculated at 1627 cm�1. Nearby is also anintense line at 1603 ��63� cm�1. Both these are assigned to acombination of C O and C2 C3 stretching vibrations. Theintense lines at 1621 ��64� and 1570 ��60� cm�1 are due toin-plane ring stretching combined with a C4 –O stretch.
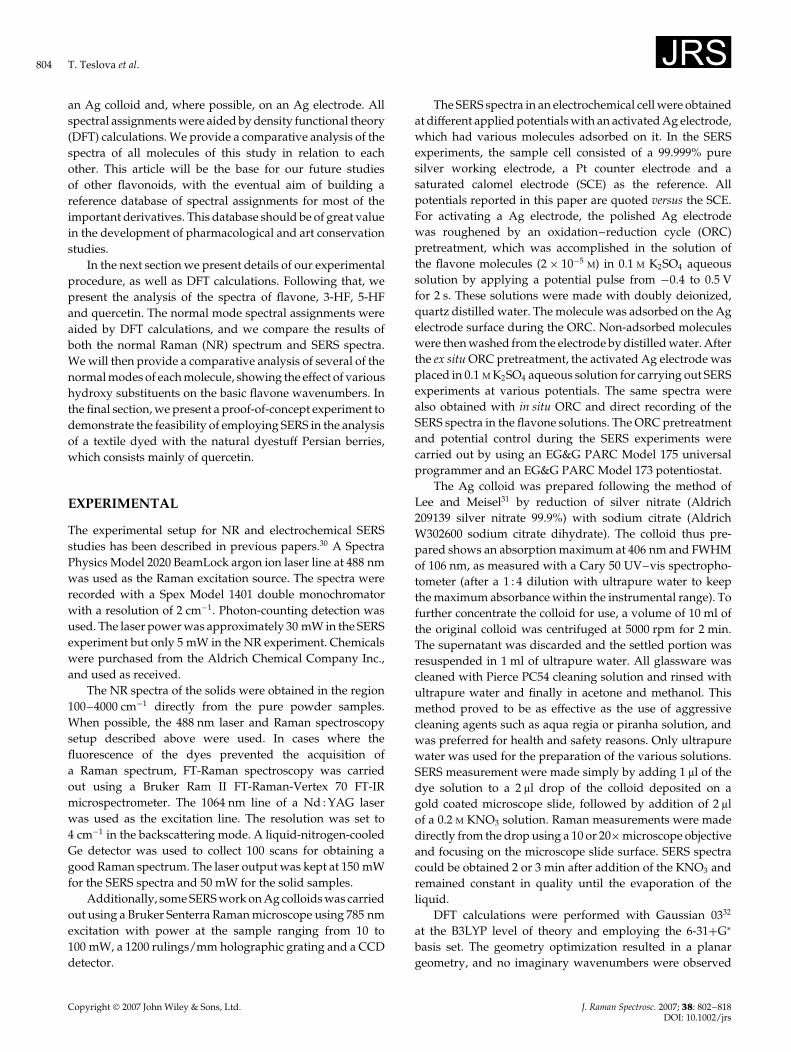
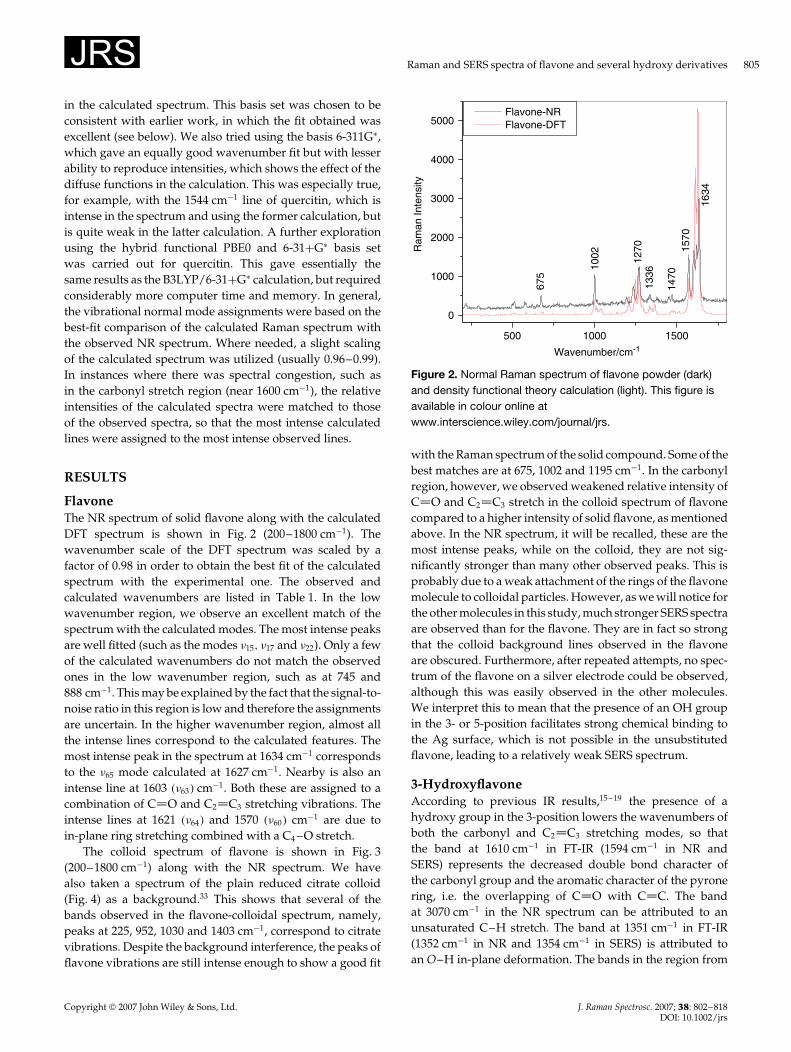
The colloid spectrum of flavone is shown in Fig. 3(200–1800 cm�1) along with the NR spectrum. We havealso taken a spectrum of the plain reduced citrate colloid(Fig. 4) as a background.33 This shows that several of thebands observed in the flavone-colloidal spectrum, namely,peaks at 225, 952, 1030 and 1403 cm�1, correspond to citratevibrations. Despite the background interference, the peaks offlavone vibrations are still intense enough to show a good fit
500 1000 1500
0
1000
2000
3000
4000
5000
1470
1336
675
1002 12
70 1570
1634
Ram
an In
tens
ity
Wavenumber/cm-1
Flavone-NRFlavone-DFT
Figure 2. Normal Raman spectrum of flavone powder (dark)and density functional theory calculation (light). This figure isavailable in colour online atwww.interscience.wiley.com/journal/jrs.
with the Raman spectrum of the solid compound. Some of thebest matches are at 675, 1002 and 1195 cm�1. In the carbonylregion, however, we observed weakened relative intensity ofC O and C2 C3 stretch in the colloid spectrum of flavonecompared to a higher intensity of solid flavone, as mentionedabove. In the NR spectrum, it will be recalled, these are themost intense peaks, while on the colloid, they are not sig-nificantly stronger than many other observed peaks. This isprobably due to a weak attachment of the rings of the flavonemolecule to colloidal particles. However, as we will notice forthe other molecules in this study, much stronger SERS spectraare observed than for the flavone. They are in fact so strongthat the colloid background lines observed in the flavoneare obscured. Furthermore, after repeated attempts, no spec-trum of the flavone on a silver electrode could be observed,although this was easily observed in the other molecules.We interpret this to mean that the presence of an OH groupin the 3- or 5-position facilitates strong chemical binding tothe Ag surface, which is not possible in the unsubstitutedflavone, leading to a relatively weak SERS spectrum.
3-HydroxyflavoneAccording to previous IR results,15 – 19 the presence of ahydroxy group in the 3-position lowers the wavenumbers ofboth the carbonyl and C2 C3 stretching modes, so thatthe band at 1610 cm�1 in FT-IR (1594 cm�1 in NR andSERS) represents the decreased double bond character ofthe carbonyl group and the aromatic character of the pyronering, i.e. the overlapping of C O with C C. The bandat 3070 cm�1 in the NR spectrum can be attributed to anunsaturated C–H stretch. The band at 1351 cm�1 in FT-IR(1352 cm�1 in NR and 1354 cm�1 in SERS) is attributed toan O–H in-plane deformation. The bands in the region from
Copyright 2007 John Wiley & Sons, Ltd. J. Raman Spectrosc. 2007; 38: 802–818DOI: 10.1002/jrs
806 T. Teslova et al.
Table 1. Wavenumbers (in cm�1) and assignments of the Raman and SERS spectrum of flavone. The DFT wavenumbers arescaled by a factor of 0.98
Mode no. Description of modes (flavone)DFT (0.98)
(cm�1) Calc. Int.NR
(cm�1)Colloid(cm�1)
6 Ring C, C–C deformation (oop) 202 0.1 – –7 Rings B, A and C stretch (ip) 262 6 – –8 Rings A, B deformation; Ring C O deformation (oop) 282 0.9 – –9 Ring C; C–O bending (ip) 290 2 295 –
10 Ring B, bending; Ring C: C–O bending (ip) 321 2 – 34611 Ring B, deformation (oop) 411 0.7 – –12 Ring C, C – C deformation (oop) 434 0.4 – 44913 Ring A, B and C, deformation (oop) 467 0.5 – –14 Ring C, deformation (ip) 498 5 501 –15 Ring A, B, C, C–C deformation 509 12 511 –16 Ring A and C, deformation (oop) 526 0.5 – 52017 Ring A, B, C, C–C deformation 585 12 577 56418 Ring A, B and C deformation (ip) 606 0.8 621 61419 Ring B, deformation (ip) 638 7 652 –20 Ring A and B, CH bending; Ring C, C2 bending (oop) 649 4 – –21 Ring C, CH bending; Ring A and C, deformation (oop) 667 3 – –22 Ring A, B and C, deformation (ip) 684 15 675 68023 Ring CB, C–C deformation 703 1 – –24 Ring A, B, C, C–C deformation 745 6 – 74625 Ring A, B C–H (oop) bend 761 0.9 – –26 Ring A, B and C, C–H bending 785 0.8 – –27 Ring A, B C–H (oop) bend 792 0.7 – 80228 Ring A, B, C, C–C deformation 846 2 – 83829 Ring B, C20, C30, C50, C60; Ring C, C3 bending (oop) 857 3 856 –30 Ring A, B and C deformation (oop) 878 2 – –31 Ring C, C2–O stretch; Ring A and B deformation (ip) 888 5 – –32 Ring A, C–H (oop) bend 891 3 – –33 Ring B, bending (oop) 947 1 – 929/95234 Ring A, C–H bending (oop) 984 0.2 – –35 Ring B, C–H (oop) bend 992 2 – –36 Ring A, B and C, C–C stretch 998 74 1002 100537 Ring A, C–H (oop) bend 1012 0 – –38 Ring B, deformation; Ring A and C, C–C stretch 1014 27 1013 –39 Ring B, C–H bending (oop) 1016 3 – –40 Ring A and B, C–C stretch (ip) 1032 16 1032 103041 Ring B, C–H (ip) bend 1041 30 1048 –42 Ring B, C–C stretch (ip) 1094 0.4 – 109843 Ring A, deformation; Ring B, C–C stretch (ip) 1101 5 1100 –44 Ring A, C–H (ip) bend 1138 11 1143 –45 Ring A, C–C stretch (ip) 1174 9 1162 117046 Ring B, C–H (ip) bend 1191 10 – –47 Ring B, C–H (ip) bend 1207 74 1195 –48 Ring A and B, C–C stretch; Ring C, C–O1 stretch 1209 22 – –49 Rings A and C, C–C (ip) def 1247 174 1235 124450 Ring A, B and C, C–H bending (ip) 1271 232 1270 125651 Ring A and B, C–H (ip) bend; 1292 34 – –52 Ring A and B, C–H (ip) bend; 1318 2 – –53 Ring A, B and C, C–C stretch 1335 40 1336 132254 Ring A and B, C–H (ip) bend; 1348 22 – –
(continued overleaf )
Copyright 2007 John Wiley & Sons, Ltd. J. Raman Spectrosc. 2007; 38: 802–818DOI: 10.1002/jrs
Raman and SERS spectra of flavone and several hydroxy derivatives 807
Table 1. (Continued)
Mode no. Description of modes (flavone)DFT (0.98)
(cm�1) Calc. Int.NR
(cm�1)Colloid(cm�1)
55 Ring A, CC trigonal stretch 1365 54 1377 135956 Ring B, CH (ip) bend; 1466 16 1452 140357 Ring A, CH (ip) bend 1473 15 1470 –58 Ring A, CH (ip) bend 1486 13 – –59 Ring B, CH (ip) bend; 1509 13 – 152260 Ring A, B, and C, C–C and C4–O stretch (ip) 1573 28 – –61 Ring A, quinoid stretch; C O stretch 1575 195 1570 155662 C O stretch; in-phase-C2 C3 stretch 1589 10 – –63 Ring B, quinoid stretch 1589 664 1603 160364 Ring A, B, and C, C–C and C4–O stretch (ip) 1621 12 1621 162565 C O stretch; out-of-phase C2 C3 stretch 1627 994 1634 163666 Ring A and B, CH stretch 3106 – 3075 292967 Ring A and B, CH stretch 3113 – 3075 292968 Ring A and B, CH stretch 3115 – 3075 292969 Ring A and B, CH stretch 3119 – 3075 292970 Ring A and B, CH stretch 3130 – 3075 292971 Ring A and B, CH stretch 3130 – 3075 292972 Ring A, CH stretch (ip) 3143 – 3075 292973 Ring B, CH stretch 3143 – 3075 292974 Ring B, CH stretch (ip) 3154 – 3075 292975 Ring C, C3–H stretch (ip) 3160 – – –
ip: in-plane; oop: out-of-plane.
1400 to 1600 cm�1 are associated with aromatic in-planeskeletal vibrations, double bond character of the carbonylgroup and the aromatic character of the pyrone ring, i.e. theoverlapping of C O with C C.
500 1000 1500
0
500
1000
1500
2000
2500
3000
952
225
1403
1359
1030
614 92
9
511
577
675
1002
1195
1235
1270
1336
1570
1621
1634
Ram
an In
tens
ity
Wavenumber/cm-1
NRFlavoneColloidFlav
Figure 3. Comparison of the normal Raman with the colloidSERS spectrum of flavone in the region 200–1800 cm�1. Thisfigure is available in colour online atwww.interscience.wiley.com/journal/jrs.
200 400 600 800 1000 1200 1400 1600
136092
9
1398
102695
0
83780
1
411
224
Ram
an In
tens
ity
Wavenumber/cm-1
Colloid Background
Figure 4. The colloid-citrate background. This figure isavailable in colour online atwww.interscience.wiley.com/journal/jrs.
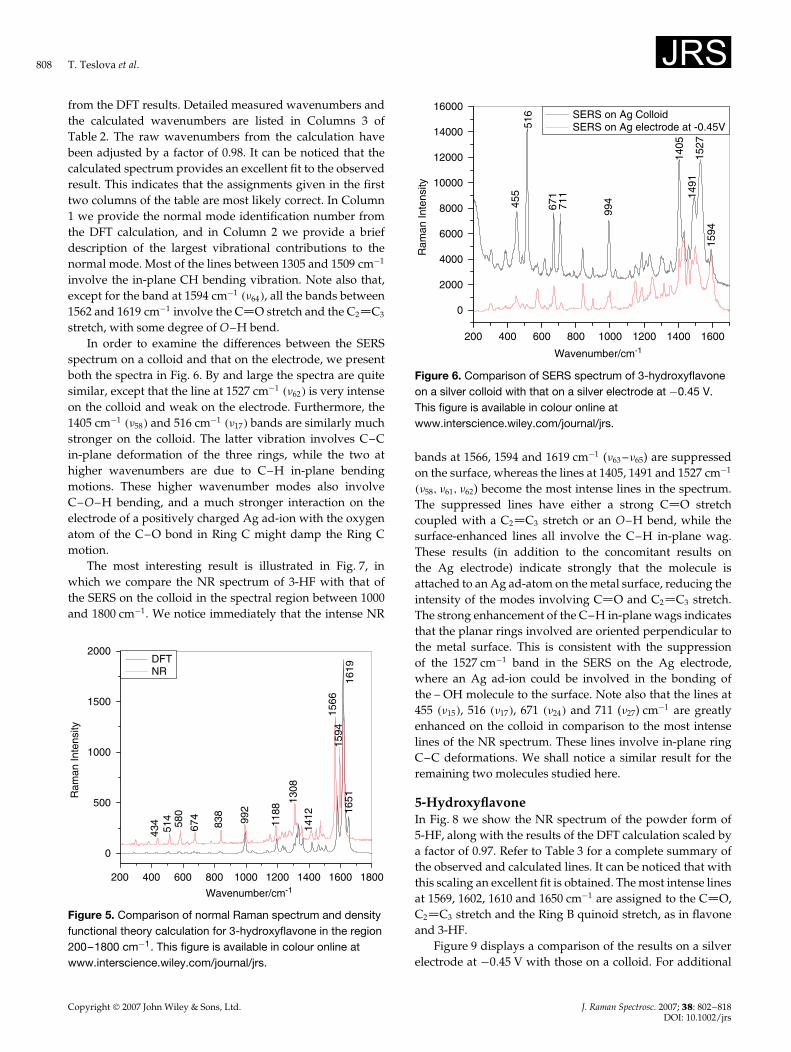
The Raman spectra of 3-HF have been considered inmore detail in previous studies.34,35 To facilitate comparisonwith the other molecules, we have abstracted some of theresults here. In Fig. 5 we compare the results of the NRspectrum of the powder sample with the spectrum calculated
Copyright 2007 John Wiley & Sons, Ltd. J. Raman Spectrosc. 2007; 38: 802–818DOI: 10.1002/jrs
808 T. Teslova et al.
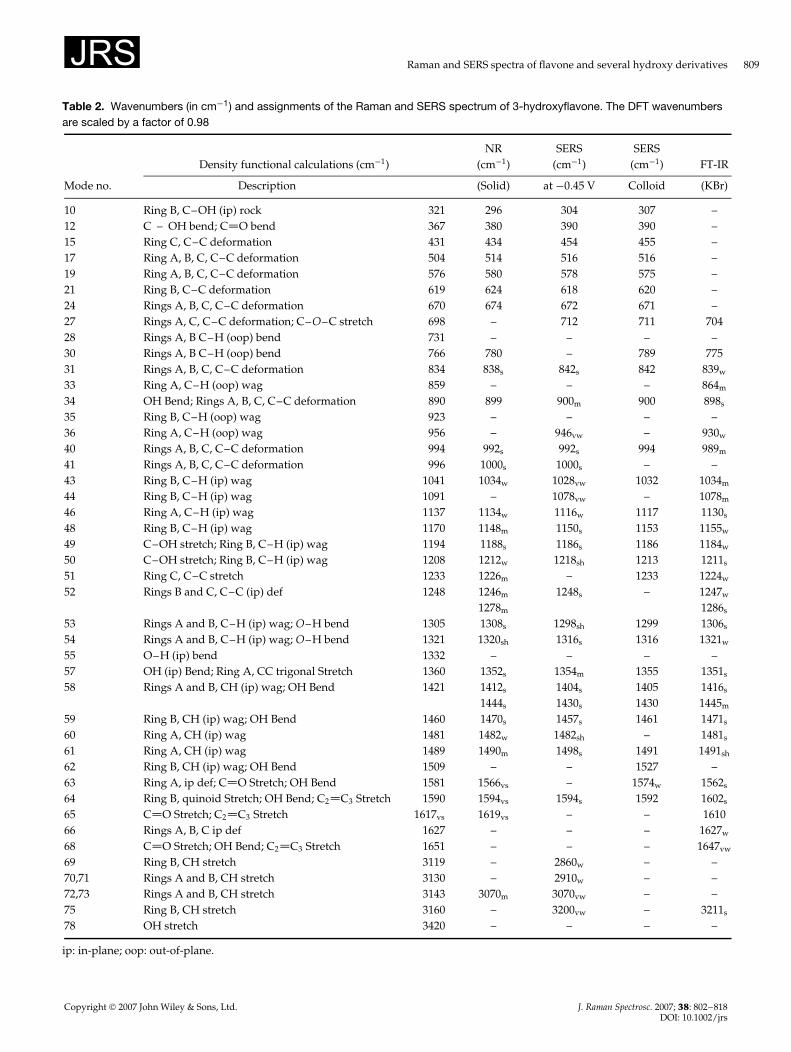
from the DFT results. Detailed measured wavenumbers andthe calculated wavenumbers are listed in Columns 3 ofTable 2. The raw wavenumbers from the calculation havebeen adjusted by a factor of 0.98. It can be noticed that thecalculated spectrum provides an excellent fit to the observedresult. This indicates that the assignments given in the firsttwo columns of the table are most likely correct. In Column1 we provide the normal mode identification number fromthe DFT calculation, and in Column 2 we provide a briefdescription of the largest vibrational contributions to thenormal mode. Most of the lines between 1305 and 1509 cm�1
involve the in-plane CH bending vibration. Note also that,except for the band at 1594 cm�1 ��64�, all the bands between1562 and 1619 cm�1 involve the C O stretch and the C2 C3
stretch, with some degree of O–H bend.In order to examine the differences between the SERS
spectrum on a colloid and that on the electrode, we presentboth the spectra in Fig. 6. By and large the spectra are quitesimilar, except that the line at 1527 cm�1 ��62� is very intenseon the colloid and weak on the electrode. Furthermore, the1405 cm�1 ��58� and 516 cm�1 ��17� bands are similarly muchstronger on the colloid. The latter vibration involves C–Cin-plane deformation of the three rings, while the two athigher wavenumbers are due to C–H in-plane bendingmotions. These higher wavenumber modes also involveC–O–H bending, and a much stronger interaction on theelectrode of a positively charged Ag ad-ion with the oxygenatom of the C–O bond in Ring C might damp the Ring Cmotion.
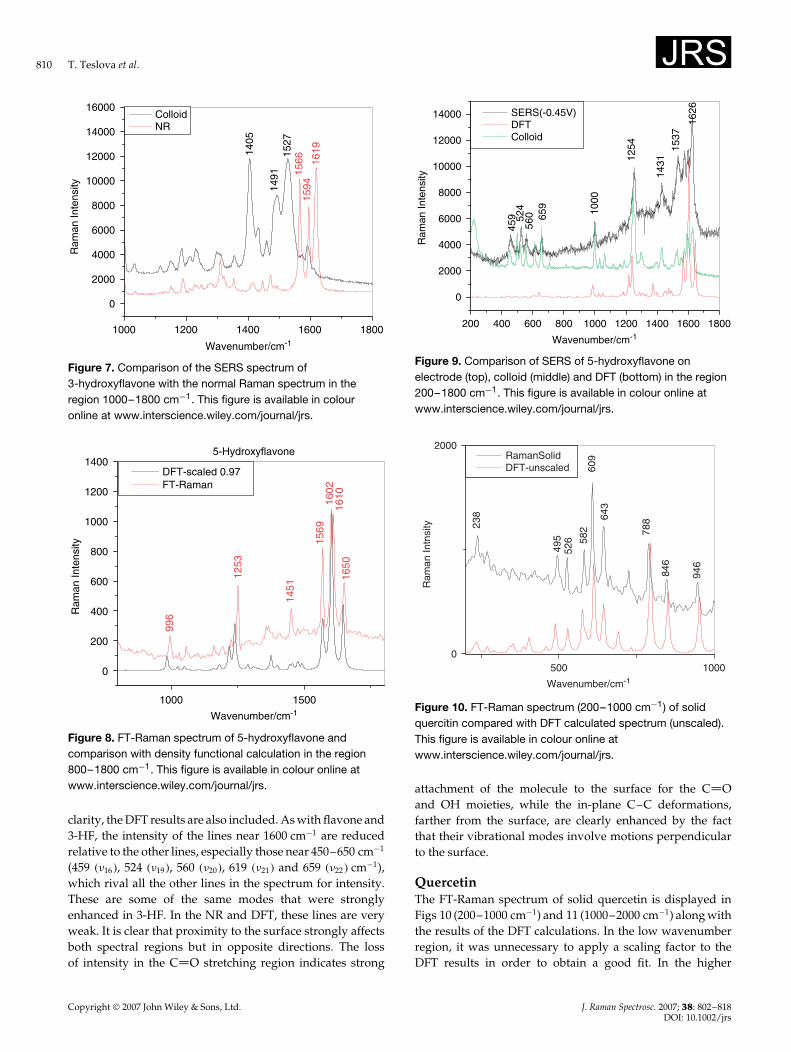
The most interesting result is illustrated in Fig. 7, inwhich we compare the NR spectrum of 3-HF with that ofthe SERS on the colloid in the spectral region between 1000and 1800 cm�1. We notice immediately that the intense NR
200 400 600 800 1000 1200 1400 1600 1800
0
500
1000
1500
2000
Ram
an In
tens
ity
Wavenumber/cm-1
DFTNR
1651
1619
1594
1566
1308
1188
992
838
674
580
514
434
1412
Figure 5. Comparison of normal Raman spectrum and densityfunctional theory calculation for 3-hydroxyflavone in the region200–1800 cm�1. This figure is available in colour online atwww.interscience.wiley.com/journal/jrs.
200 400 600 800 1000 1200 1400 1600
0
2000
4000
6000
8000
10000
12000
14000
16000
Ram
an In
tens
ity
Wavenumber/cm-1
SERS on Ag ColloidSERS on Ag electrode at -0.45V
1594
1527
1491
1405
516
99471
167
1
455
Figure 6. Comparison of SERS spectrum of 3-hydroxyflavoneon a silver colloid with that on a silver electrode at �0.45 V.This figure is available in colour online atwww.interscience.wiley.com/journal/jrs.
bands at 1566, 1594 and 1619 cm�1 (�63 –�65) are suppressedon the surface, whereas the lines at 1405, 1491 and 1527 cm�1
��58, �61, �62) become the most intense lines in the spectrum.The suppressed lines have either a strong C O stretchcoupled with a C2 C3 stretch or an O–H bend, while thesurface-enhanced lines all involve the C–H in-plane wag.These results (in addition to the concomitant results onthe Ag electrode) indicate strongly that the molecule isattached to an Ag ad-atom on the metal surface, reducing theintensity of the modes involving C O and C2 C3 stretch.The strong enhancement of the C–H in-plane wags indicatesthat the planar rings involved are oriented perpendicular tothe metal surface. This is consistent with the suppressionof the 1527 cm�1 band in the SERS on the Ag electrode,where an Ag ad-ion could be involved in the bonding ofthe – OH molecule to the surface. Note also that the lines at455 ��15�, 516 ��17�, 671 ��24� and 711 (�27) cm�1 are greatlyenhanced on the colloid in comparison to the most intenselines of the NR spectrum. These lines involve in-plane ringC–C deformations. We shall notice a similar result for theremaining two molecules studied here.
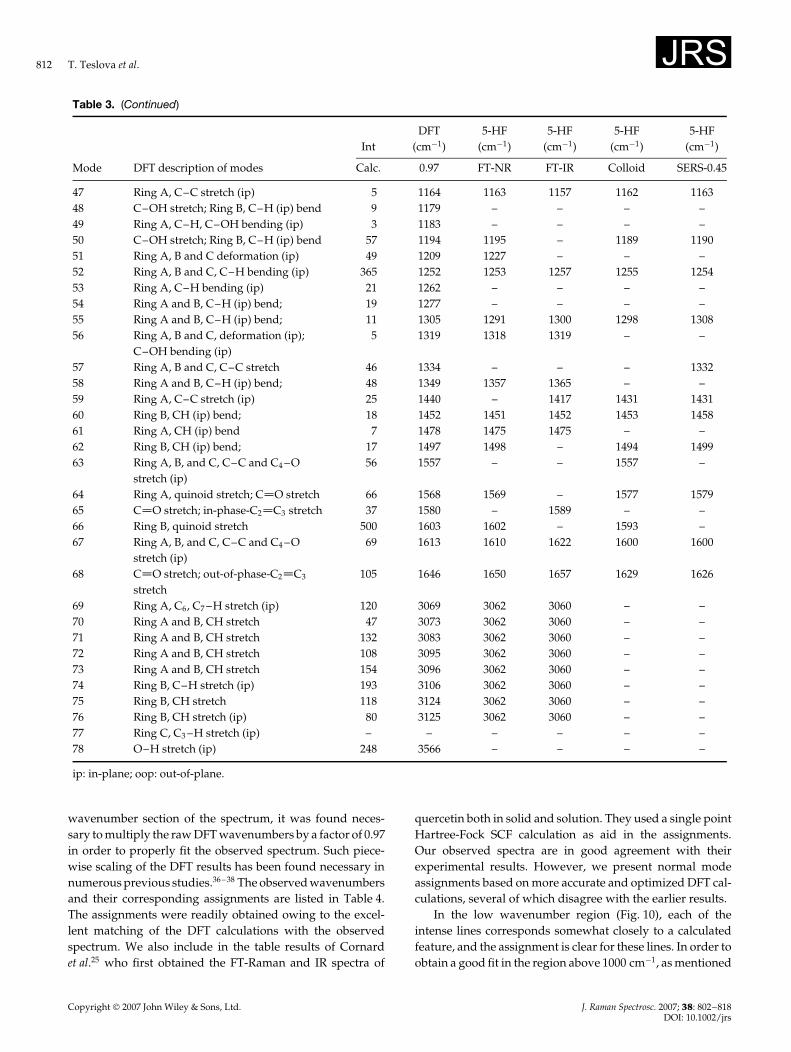
5-HydroxyflavoneIn Fig. 8 we show the NR spectrum of the powder form of5-HF, along with the results of the DFT calculation scaled bya factor of 0.97. Refer to Table 3 for a complete summary ofthe observed and calculated lines. It can be noticed that withthis scaling an excellent fit is obtained. The most intense linesat 1569, 1602, 1610 and 1650 cm�1 are assigned to the C O,C2 C3 stretch and the Ring B quinoid stretch, as in flavoneand 3-HF.
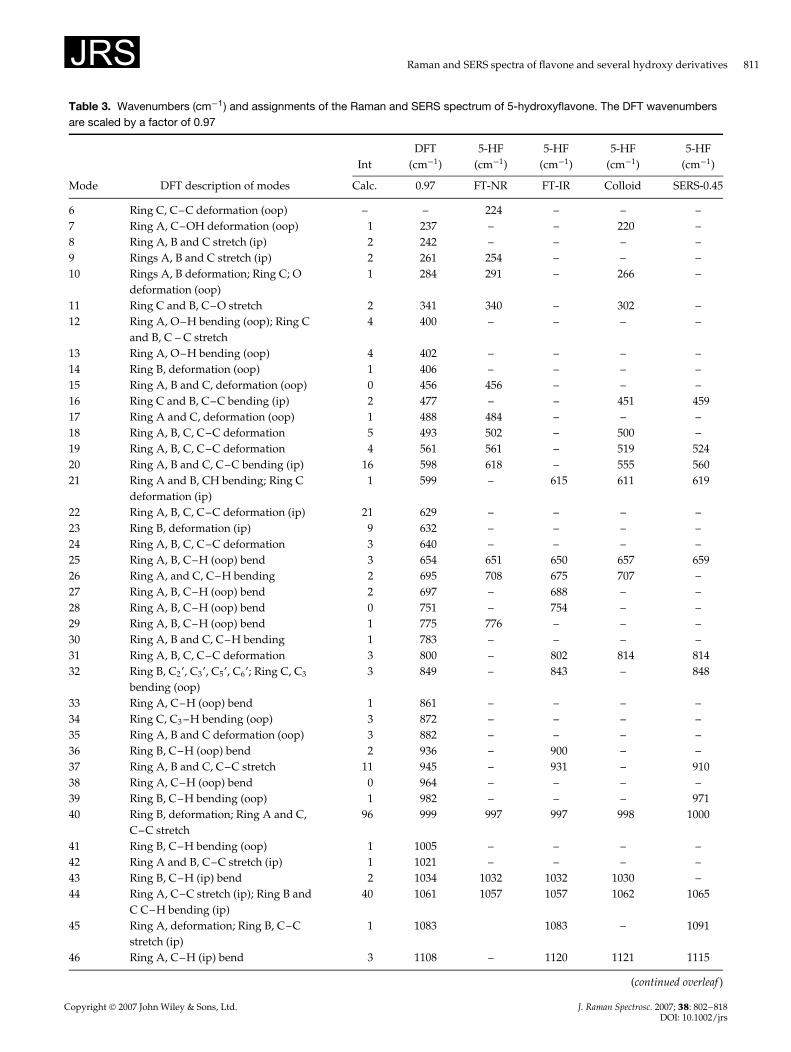
Figure 9 displays a comparison of the results on a silverelectrode at �0.45 V with those on a colloid. For additional
Copyright 2007 John Wiley & Sons, Ltd. J. Raman Spectrosc. 2007; 38: 802–818DOI: 10.1002/jrs
Raman and SERS spectra of flavone and several hydroxy derivatives 809
Table 2. Wavenumbers (in cm�1) and assignments of the Raman and SERS spectrum of 3-hydroxyflavone. The DFT wavenumbersare scaled by a factor of 0.98
Density functional calculations (cm�1)NR
(cm�1)SERS
(cm�1)SERS
(cm�1) FT-IR
Mode no. Description (Solid) at �0.45 V Colloid (KBr)
10 Ring B, C–OH (ip) rock 321 296 304 307 –12 C – OH bend; C O bend 367 380 390 390 –15 Ring C, C–C deformation 431 434 454 455 –17 Ring A, B, C, C–C deformation 504 514 516 516 –19 Ring A, B, C, C–C deformation 576 580 578 575 –21 Ring B, C–C deformation 619 624 618 620 –24 Rings A, B, C, C–C deformation 670 674 672 671 –27 Rings A, C, C–C deformation; C–O–C stretch 698 – 712 711 70428 Rings A, B C–H (oop) bend 731 – – – –30 Rings A, B C–H (oop) bend 766 780 – 789 77531 Rings A, B, C, C–C deformation 834 838s 842s 842 839w
33 Ring A, C–H (oop) wag 859 – – – 864m
34 OH Bend; Rings A, B, C, C–C deformation 890 899 900m 900 898s
35 Ring B, C–H (oop) wag 923 – – – –36 Ring A, C–H (oop) wag 956 – 946vw – 930w
40 Rings A, B, C, C–C deformation 994 992s 992s 994 989m
41 Rings A, B, C, C–C deformation 996 1000s 1000s – –43 Ring B, C–H (ip) wag 1041 1034w 1028vw 1032 1034m
44 Ring B, C–H (ip) wag 1091 – 1078vw – 1078m
46 Ring A, C–H (ip) wag 1137 1134w 1116w 1117 1130s
48 Ring B, C–H (ip) wag 1170 1148m 1150s 1153 1155w
49 C–OH stretch; Ring B, C–H (ip) wag 1194 1188s 1186s 1186 1184w
50 C–OH stretch; Ring B, C–H (ip) wag 1208 1212w 1218sh 1213 1211s
51 Ring C, C–C stretch 1233 1226m – 1233 1224w
52 Rings B and C, C–C (ip) def 1248 1246m 1248s – 1247w
1278m 1286s
53 Rings A and B, C–H (ip) wag; O–H bend 1305 1308s 1298sh 1299 1306s
54 Rings A and B, C–H (ip) wag; O–H bend 1321 1320sh 1316s 1316 1321w
55 O–H (ip) bend 1332 – – – –57 OH (ip) Bend; Ring A, CC trigonal Stretch 1360 1352s 1354m 1355 1351s
58 Rings A and B, CH (ip) wag; OH Bend 1421 1412s 1404s 1405 1416s
1444s 1430s 1430 1445m
59 Ring B, CH (ip) wag; OH Bend 1460 1470s 1457s 1461 1471s
60 Ring A, CH (ip) wag 1481 1482w 1482sh – 1481s
61 Ring A, CH (ip) wag 1489 1490m 1498s 1491 1491sh
62 Ring B, CH (ip) wag; OH Bend 1509 – – 1527 –63 Ring A, ip def; C O Stretch; OH Bend 1581 1566vs – 1574w 1562s
64 Ring B, quinoid Stretch; OH Bend; C2 C3 Stretch 1590 1594vs 1594s 1592 1602s
65 C O Stretch; C2 C3 Stretch 1617vs 1619vs – – 161066 Rings A, B, C ip def 1627 – – – 1627w
68 C O Stretch; OH Bend; C2 C3 Stretch 1651 – – – 1647vw
69 Ring B, CH stretch 3119 – 2860w – –70,71 Rings A and B, CH stretch 3130 – 2910w – –72,73 Rings A and B, CH stretch 3143 3070m 3070vw – –75 Ring B, CH stretch 3160 – 3200vw – 3211s
78 OH stretch 3420 – – – –
ip: in-plane; oop: out-of-plane.
Copyright 2007 John Wiley & Sons, Ltd. J. Raman Spectrosc. 2007; 38: 802–818DOI: 10.1002/jrs
810 T. Teslova et al.
1000 1200 1400 1600 1800
0
2000
4000
6000
8000
10000
12000
14000
16000
Ram
an In
tens
ity
Wavenumber/cm-1
ColloidNR
1619
1594
1566
1405
1491
1527
Figure 7. Comparison of the SERS spectrum of3-hydroxyflavone with the normal Raman spectrum in theregion 1000–1800 cm�1. This figure is available in colouronline at www.interscience.wiley.com/journal/jrs.
1000 1500
0
200
400
600
800
1000
1200
1400
996
1253
1451
161016
0215
69
1650
5-Hydroxyflavone
Ram
an In
tens
ity
Wavenumber/cm-1
DFT-scaled 0.97FT-Raman
Figure 8. FT-Raman spectrum of 5-hydroxyflavone andcomparison with density functional calculation in the region800–1800 cm�1. This figure is available in colour online atwww.interscience.wiley.com/journal/jrs.
clarity, the DFT results are also included. As with flavone and3-HF, the intensity of the lines near 1600 cm�1 are reducedrelative to the other lines, especially those near 450–650 cm�1
(459 ��16�, 524 ��19�, 560 ��20�, 619 ��21� and 659 ��22� cm�1),which rival all the other lines in the spectrum for intensity.These are some of the same modes that were stronglyenhanced in 3-HF. In the NR and DFT, these lines are veryweak. It is clear that proximity to the surface strongly affectsboth spectral regions but in opposite directions. The lossof intensity in the C O stretching region indicates strong
200 400 600 800 1000 1200 1400 1600 1800
0
2000
4000
6000
8000
10000
12000
14000
459 52
456
0 659
1000
1254
1431
1537
1626
Ram
an In
tens
ity
Wavenumber/cm-1
SERS(-0.45V)DFTColloid
Figure 9. Comparison of SERS of 5-hydroxyflavone onelectrode (top), colloid (middle) and DFT (bottom) in the region200–1800 cm�1. This figure is available in colour online atwww.interscience.wiley.com/journal/jrs.
500 10000
2000
238
495
526 58
260
964
3
788
846
946
Ram
an In
tnsi
ty
Wavenumber/cm-1
RamanSolidDFT-unscaled
Figure 10. FT-Raman spectrum (200–1000 cm�1) of solidquercitin compared with DFT calculated spectrum (unscaled).This figure is available in colour online atwww.interscience.wiley.com/journal/jrs.
attachment of the molecule to the surface for the C Oand OH moieties, while the in-plane C–C deformations,farther from the surface, are clearly enhanced by the factthat their vibrational modes involve motions perpendicularto the surface.
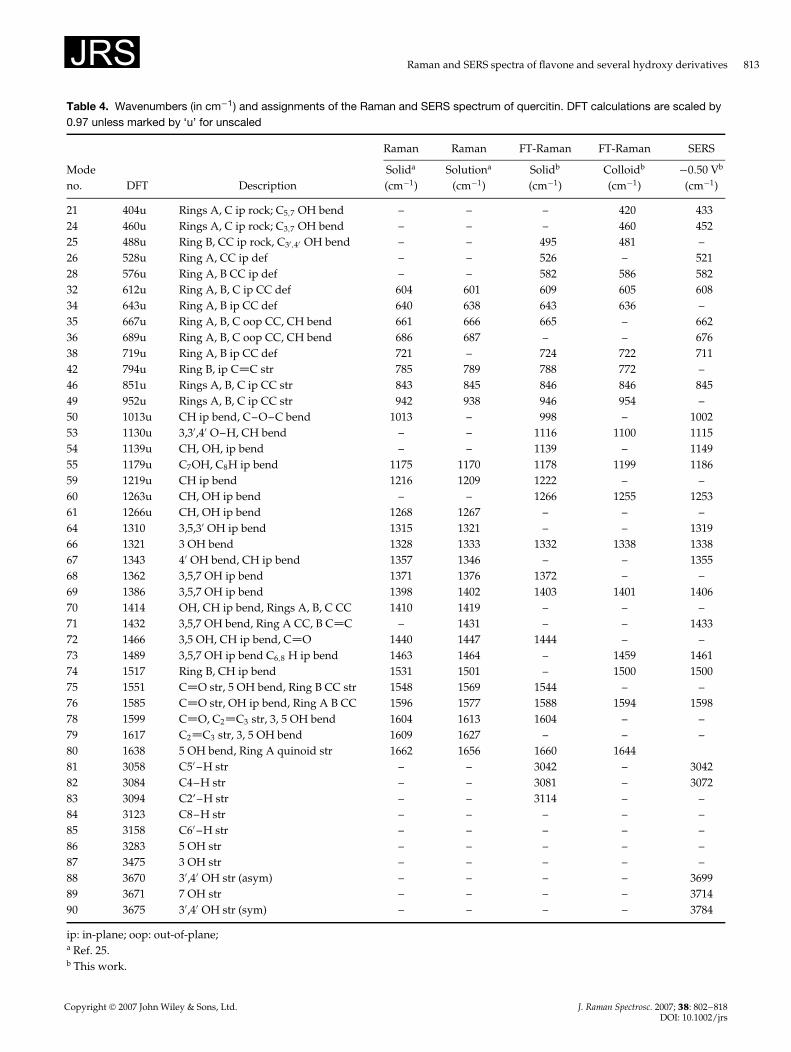
QuercetinThe FT-Raman spectrum of solid quercetin is displayed inFigs 10 (200–1000 cm�1) and 11 (1000–2000 cm�1) along withthe results of the DFT calculations. In the low wavenumberregion, it was unnecessary to apply a scaling factor to theDFT results in order to obtain a good fit. In the higher
Copyright 2007 John Wiley & Sons, Ltd. J. Raman Spectrosc. 2007; 38: 802–818DOI: 10.1002/jrs
Raman and SERS spectra of flavone and several hydroxy derivatives 811
Table 3. Wavenumbers (cm�1) and assignments of the Raman and SERS spectrum of 5-hydroxyflavone. The DFT wavenumbersare scaled by a factor of 0.97
IntDFT
(cm�1)5-HF
(cm�1)5-HF
(cm�1)5-HF
(cm�1)5-HF
(cm�1)
Mode DFT description of modes Calc. 0.97 FT-NR FT-IR Colloid SERS-0.45
6 Ring C, C–C deformation (oop) – – 224 – – –7 Ring A, C–OH deformation (oop) 1 237 – – 220 –8 Ring A, B and C stretch (ip) 2 242 – – – –9 Rings A, B and C stretch (ip) 2 261 254 – – –10 Rings A, B deformation; Ring C; O
deformation (oop)1 284 291 – 266 –
11 Ring C and B, C–O stretch 2 341 340 – 302 –12 Ring A, O–H bending (oop); Ring C
and B, C – C stretch4 400 – – – –
13 Ring A, O–H bending (oop) 4 402 – – – –14 Ring B, deformation (oop) 1 406 – – – –15 Ring A, B and C, deformation (oop) 0 456 456 – – –16 Ring C and B, C–C bending (ip) 2 477 – – 451 45917 Ring A and C, deformation (oop) 1 488 484 – – –18 Ring A, B, C, C–C deformation 5 493 502 – 500 –19 Ring A, B, C, C–C deformation 4 561 561 – 519 52420 Ring A, B and C, C–C bending (ip) 16 598 618 – 555 56021 Ring A and B, CH bending; Ring C
deformation (ip)1 599 – 615 611 619
22 Ring A, B, C, C–C deformation (ip) 21 629 – – – –23 Ring B, deformation (ip) 9 632 – – – –24 Ring A, B, C, C–C deformation 3 640 – – – –25 Ring A, B, C–H (oop) bend 3 654 651 650 657 65926 Ring A, and C, C–H bending 2 695 708 675 707 –27 Ring A, B, C–H (oop) bend 2 697 – 688 – –28 Ring A, B, C–H (oop) bend 0 751 – 754 – –29 Ring A, B, C–H (oop) bend 1 775 776 – – –30 Ring A, B and C, C–H bending 1 783 – – – –31 Ring A, B, C, C–C deformation 3 800 – 802 814 81432 Ring B, C2’, C3’, C5’, C6’; Ring C, C3
bending (oop)3 849 – 843 – 848
33 Ring A, C–H (oop) bend 1 861 – – – –34 Ring C, C3 –H bending (oop) 3 872 – – – –35 Ring A, B and C deformation (oop) 3 882 – – – –36 Ring B, C–H (oop) bend 2 936 – 900 – –37 Ring A, B and C, C–C stretch 11 945 – 931 – 91038 Ring A, C–H (oop) bend 0 964 – – – –39 Ring B, C–H bending (oop) 1 982 – – – 97140 Ring B, deformation; Ring A and C,
C–C stretch96 999 997 997 998 1000
41 Ring B, C–H bending (oop) 1 1005 – – – –42 Ring A and B, C–C stretch (ip) 1 1021 – – – –43 Ring B, C–H (ip) bend 2 1034 1032 1032 1030 –44 Ring A, C–C stretch (ip); Ring B and
C C–H bending (ip)40 1061 1057 1057 1062 1065
45 Ring A, deformation; Ring B, C–Cstretch (ip)
1 1083 1083 – 1091
46 Ring A, C–H (ip) bend 3 1108 – 1120 1121 1115
(continued overleaf )
Copyright 2007 John Wiley & Sons, Ltd. J. Raman Spectrosc. 2007; 38: 802–818DOI: 10.1002/jrs
812 T. Teslova et al.
Table 3. (Continued)
IntDFT
(cm�1)5-HF
(cm�1)5-HF
(cm�1)5-HF
(cm�1)5-HF
(cm�1)
Mode DFT description of modes Calc. 0.97 FT-NR FT-IR Colloid SERS-0.45
47 Ring A, C–C stretch (ip) 5 1164 1163 1157 1162 116348 C–OH stretch; Ring B, C–H (ip) bend 9 1179 – – – –49 Ring A, C–H, C–OH bending (ip) 3 1183 – – – –50 C–OH stretch; Ring B, C–H (ip) bend 57 1194 1195 – 1189 119051 Ring A, B and C deformation (ip) 49 1209 1227 – – –52 Ring A, B and C, C–H bending (ip) 365 1252 1253 1257 1255 125453 Ring A, C–H bending (ip) 21 1262 – – – –54 Ring A and B, C–H (ip) bend; 19 1277 – – – –55 Ring A and B, C–H (ip) bend; 11 1305 1291 1300 1298 130856 Ring A, B and C, deformation (ip);
C–OH bending (ip)5 1319 1318 1319 – –
57 Ring A, B and C, C–C stretch 46 1334 – – – 133258 Ring A and B, C–H (ip) bend; 48 1349 1357 1365 – –59 Ring A, C–C stretch (ip) 25 1440 – 1417 1431 143160 Ring B, CH (ip) bend; 18 1452 1451 1452 1453 145861 Ring A, CH (ip) bend 7 1478 1475 1475 – –62 Ring B, CH (ip) bend; 17 1497 1498 – 1494 149963 Ring A, B, and C, C–C and C4 –O
stretch (ip)56 1557 – – 1557 –
64 Ring A, quinoid stretch; C O stretch 66 1568 1569 – 1577 157965 C O stretch; in-phase-C2 C3 stretch 37 1580 – 1589 – –66 Ring B, quinoid stretch 500 1603 1602 – 1593 –67 Ring A, B, and C, C–C and C4 –O
stretch (ip)69 1613 1610 1622 1600 1600
68 C O stretch; out-of-phase-C2 C3
stretch105 1646 1650 1657 1629 1626
69 Ring A, C6, C7 –H stretch (ip) 120 3069 3062 3060 – –70 Ring A and B, CH stretch 47 3073 3062 3060 – –71 Ring A and B, CH stretch 132 3083 3062 3060 – –72 Ring A and B, CH stretch 108 3095 3062 3060 – –73 Ring A and B, CH stretch 154 3096 3062 3060 – –74 Ring B, C–H stretch (ip) 193 3106 3062 3060 – –75 Ring B, CH stretch 118 3124 3062 3060 – –76 Ring B, CH stretch (ip) 80 3125 3062 3060 – –77 Ring C, C3 –H stretch (ip) – – – – – –78 O–H stretch (ip) 248 3566 – – – –
ip: in-plane; oop: out-of-plane.
wavenumber section of the spectrum, it was found neces-sary to multiply the raw DFT wavenumbers by a factor of 0.97in order to properly fit the observed spectrum. Such piece-wise scaling of the DFT results has been found necessary innumerous previous studies.36 – 38 The observed wavenumbersand their corresponding assignments are listed in Table 4.The assignments were readily obtained owing to the excel-lent matching of the DFT calculations with the observedspectrum. We also include in the table results of Cornardet al.25 who first obtained the FT-Raman and IR spectra of
quercetin both in solid and solution. They used a single pointHartree-Fock SCF calculation as aid in the assignments.Our observed spectra are in good agreement with theirexperimental results. However, we present normal modeassignments based on more accurate and optimized DFT cal-culations, several of which disagree with the earlier results.
In the low wavenumber region (Fig. 10), each of theintense lines corresponds somewhat closely to a calculatedfeature, and the assignment is clear for these lines. In order toobtain a good fit in the region above 1000 cm�1, as mentioned
Copyright 2007 John Wiley & Sons, Ltd. J. Raman Spectrosc. 2007; 38: 802–818DOI: 10.1002/jrs
Raman and SERS spectra of flavone and several hydroxy derivatives 813
Table 4. Wavenumbers (in cm�1) and assignments of the Raman and SERS spectrum of quercitin. DFT calculations are scaled by0.97 unless marked by ‘u’ for unscaled
Raman Raman FT-Raman FT-Raman SERS
Modeno. DFT Description
Solida
(cm�1)Solutiona
(cm�1)Solidb
(cm�1)Colloidb
(cm�1)�0.50 Vb
(cm�1)
21 404u Rings A, C ip rock; C5,7 OH bend – – – 420 43324 460u Rings A, C ip rock; C3,7 OH bend – – – 460 45225 488u Ring B, CC ip rock, C30,40 OH bend – – 495 481 –26 528u Ring A, CC ip def – – 526 – 52128 576u Ring A, B CC ip def – – 582 586 58232 612u Ring A, B, C ip CC def 604 601 609 605 60834 643u Ring A, B ip CC def 640 638 643 636 –35 667u Ring A, B, C oop CC, CH bend 661 666 665 – 66236 689u Ring A, B, C oop CC, CH bend 686 687 – – 67638 719u Ring A, B ip CC def 721 – 724 722 71142 794u Ring B, ip C C str 785 789 788 772 –46 851u Rings A, B, C ip CC str 843 845 846 846 84549 952u Rings A, B, C ip CC str 942 938 946 954 –50 1013u CH ip bend, C–O–C bend 1013 – 998 – 100253 1130u 3,30,40 O–H, CH bend – – 1116 1100 111554 1139u CH, OH, ip bend – – 1139 – 114955 1179u C7OH, C8H ip bend 1175 1170 1178 1199 118659 1219u CH ip bend 1216 1209 1222 – –60 1263u CH, OH ip bend – – 1266 1255 125361 1266u CH, OH ip bend 1268 1267 – – –64 1310 3,5,30 OH ip bend 1315 1321 – – 131966 1321 3 OH bend 1328 1333 1332 1338 133867 1343 40 OH bend, CH ip bend 1357 1346 – – 135568 1362 3,5,7 OH ip bend 1371 1376 1372 – –69 1386 3,5,7 OH ip bend 1398 1402 1403 1401 140670 1414 OH, CH ip bend, Rings A, B, C CC 1410 1419 – – –71 1432 3,5,7 OH bend, Ring A CC, B C C – 1431 – – 143372 1466 3,5 OH, CH ip bend, C O 1440 1447 1444 – –73 1489 3,5,7 OH ip bend C6,8 H ip bend 1463 1464 – 1459 146174 1517 Ring B, CH ip bend 1531 1501 – 1500 150075 1551 C O str, 5 OH bend, Ring B CC str 1548 1569 1544 – –76 1585 C O str, OH ip bend, Ring A B CC 1596 1577 1588 1594 159878 1599 C O, C2 C3 str, 3, 5 OH bend 1604 1613 1604 – –79 1617 C2 C3 str, 3, 5 OH bend 1609 1627 – – –80 1638 5 OH bend, Ring A quinoid str 1662 1656 1660 164481 3058 C50 –H str – – 3042 – 304282 3084 C4–H str – – 3081 – 307283 3094 C2’–H str – – 3114 – –84 3123 C8–H str – – – – –85 3158 C60 –H str – – – – –86 3283 5 OH str – – – – –87 3475 3 OH str – – – – –88 3670 30,40 OH str (asym) – – – – 369989 3671 7 OH str – – – – 371490 3675 30,40 OH str (sym) – – – – 3784
ip: in-plane; oop: out-of-plane;a Ref. 25.b This work.
Copyright 2007 John Wiley & Sons, Ltd. J. Raman Spectrosc. 2007; 38: 802–818DOI: 10.1002/jrs
814 T. Teslova et al.
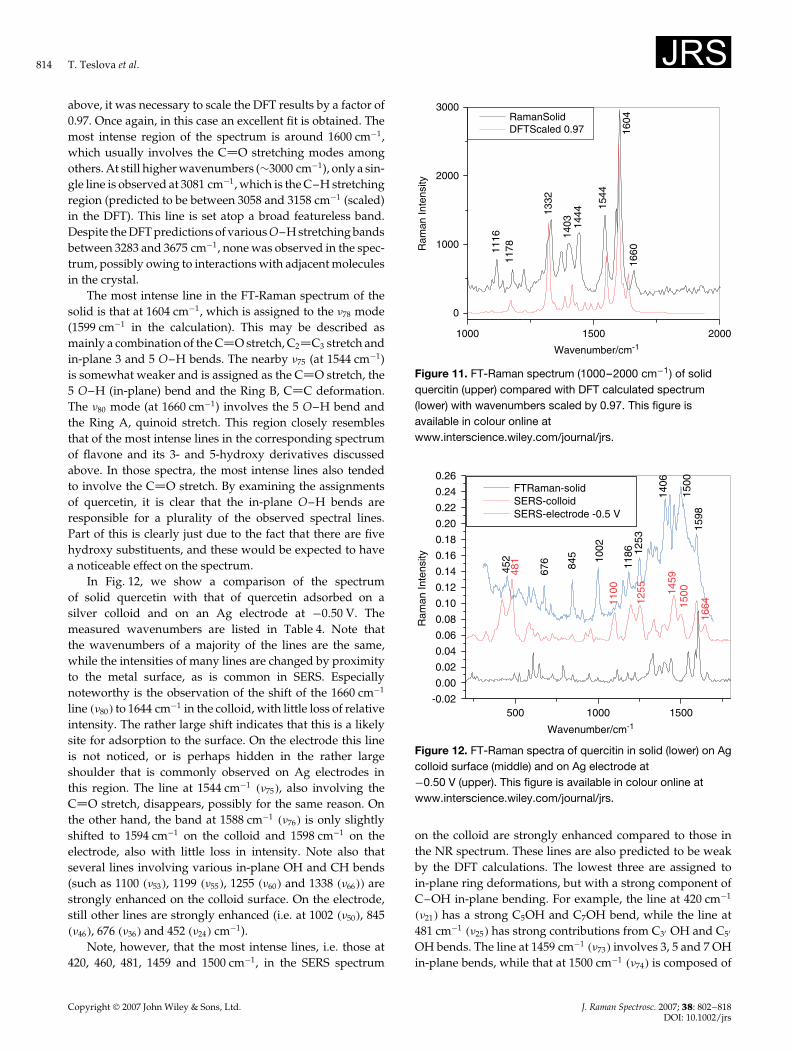
above, it was necessary to scale the DFT results by a factor of0.97. Once again, in this case an excellent fit is obtained. Themost intense region of the spectrum is around 1600 cm�1,which usually involves the C O stretching modes amongothers. At still higher wavenumbers (¾3000 cm�1), only a sin-gle line is observed at 3081 cm�1, which is the C–H stretchingregion (predicted to be between 3058 and 3158 cm�1 (scaled)in the DFT). This line is set atop a broad featureless band.Despite the DFT predictions of various O–H stretching bandsbetween 3283 and 3675 cm�1, none was observed in the spec-trum, possibly owing to interactions with adjacent moleculesin the crystal.
The most intense line in the FT-Raman spectrum of thesolid is that at 1604 cm�1, which is assigned to the �78 mode(1599 cm�1 in the calculation). This may be described asmainly a combination of the C O stretch, C2 C3 stretch andin-plane 3 and 5 O–H bends. The nearby �75 (at 1544 cm�1)is somewhat weaker and is assigned as the C O stretch, the5 O–H (in-plane) bend and the Ring B, C C deformation.The �80 mode (at 1660 cm�1) involves the 5 O–H bend andthe Ring A, quinoid stretch. This region closely resemblesthat of the most intense lines in the corresponding spectrumof flavone and its 3- and 5-hydroxy derivatives discussedabove. In those spectra, the most intense lines also tendedto involve the C O stretch. By examining the assignmentsof quercetin, it is clear that the in-plane O–H bends areresponsible for a plurality of the observed spectral lines.Part of this is clearly just due to the fact that there are fivehydroxy substituents, and these would be expected to havea noticeable effect on the spectrum.
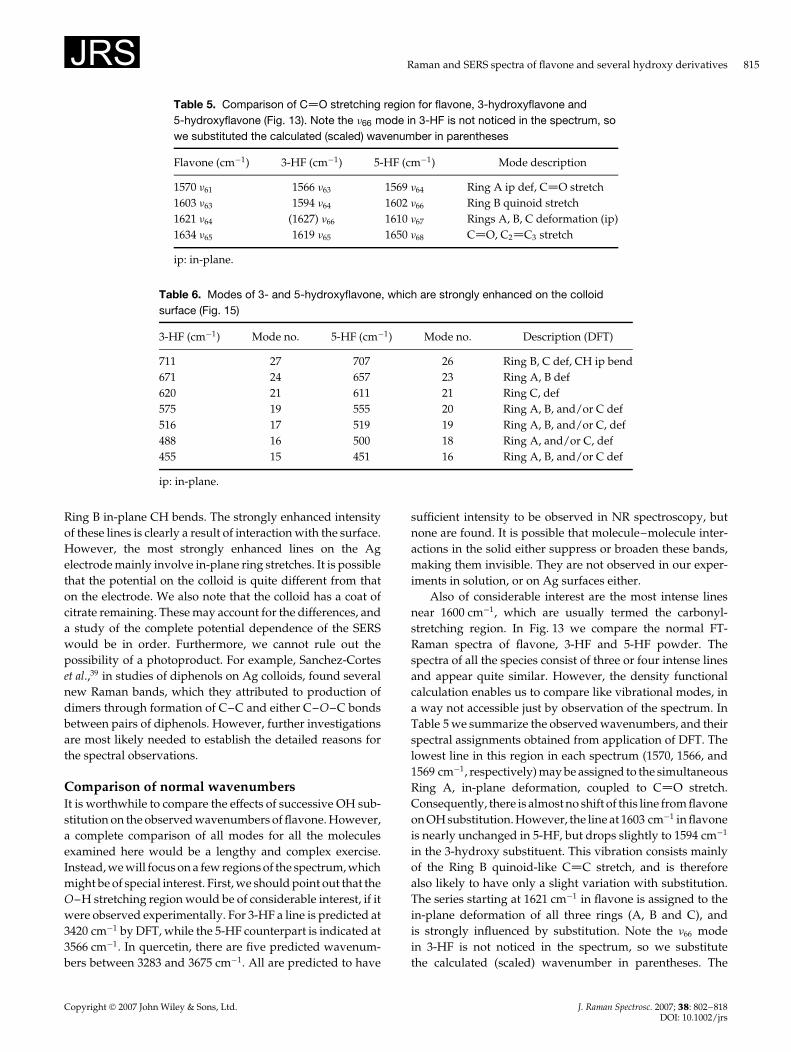
In Fig. 12, we show a comparison of the spectrumof solid quercetin with that of quercetin adsorbed on asilver colloid and on an Ag electrode at �0.50 V. Themeasured wavenumbers are listed in Table 4. Note thatthe wavenumbers of a majority of the lines are the same,while the intensities of many lines are changed by proximityto the metal surface, as is common in SERS. Especiallynoteworthy is the observation of the shift of the 1660 cm�1
line ��80� to 1644 cm�1 in the colloid, with little loss of relativeintensity. The rather large shift indicates that this is a likelysite for adsorption to the surface. On the electrode this lineis not noticed, or is perhaps hidden in the rather largeshoulder that is commonly observed on Ag electrodes inthis region. The line at 1544 cm�1 ��75�, also involving theC O stretch, disappears, possibly for the same reason. Onthe other hand, the band at 1588 cm�1 ��76� is only slightlyshifted to 1594 cm�1 on the colloid and 1598 cm�1 on theelectrode, also with little loss in intensity. Note also thatseveral lines involving various in-plane OH and CH bends(such as 1100 ��53�, 1199 ��55�, 1255 ��60� and 1338 ��66�� arestrongly enhanced on the colloid surface. On the electrode,still other lines are strongly enhanced (i.e. at 1002 ��50�, 845��46�, 676 ��36� and 452 ��24� cm�1).
Note, however, that the most intense lines, i.e. those at420, 460, 481, 1459 and 1500 cm�1, in the SERS spectrum
1000 1500 2000
0
1000
2000
3000
1660
1604
1544
1444
1403
1332
117811
16
Ram
an In
tens
ity
Wavenumber/cm-1
RamanSolidDFTScaled 0.97
Figure 11. FT-Raman spectrum (1000–2000 cm�1) of solidquercitin (upper) compared with DFT calculated spectrum(lower) with wavenumbers scaled by 0.97. This figure isavailable in colour online atwww.interscience.wiley.com/journal/jrs.
500 1000 1500-0.02
0.00
0.02
0.04
0.06
0.08
0.10
0.12
0.14
0.16
0.18
0.20
0.22
0.24
0.26
481
1100
1255 14
5915
00
1664
1186
452
1406
1253
676 84
5
1500
1598
1002
Ram
an In
tens
ity
Wavenumber/cm-1
FTRaman-solidSERS-colloidSERS-electrode -0.5 V
Figure 12. FT-Raman spectra of quercitin in solid (lower) on Agcolloid surface (middle) and on Ag electrode at�0.50 V (upper). This figure is available in colour online atwww.interscience.wiley.com/journal/jrs.
on the colloid are strongly enhanced compared to those inthe NR spectrum. These lines are also predicted to be weakby the DFT calculations. The lowest three are assigned toin-plane ring deformations, but with a strong component ofC–OH in-plane bending. For example, the line at 420 cm�1
��21� has a strong C5OH and C7OH bend, while the line at481 cm�1 ��25� has strong contributions from C30 OH and C50
OH bends. The line at 1459 cm�1 ��73� involves 3, 5 and 7 OHin-plane bends, while that at 1500 cm�1 ��74� is composed of
Copyright 2007 John Wiley & Sons, Ltd. J. Raman Spectrosc. 2007; 38: 802–818DOI: 10.1002/jrs
Raman and SERS spectra of flavone and several hydroxy derivatives 815
Table 5. Comparison of C O stretching region for flavone, 3-hydroxyflavone and5-hydroxyflavone (Fig. 13). Note the �66 mode in 3-HF is not noticed in the spectrum, sowe substituted the calculated (scaled) wavenumber in parentheses
Flavone (cm�1) 3-HF (cm�1) 5-HF (cm�1) Mode description
1570 �61 1566 �63 1569 �64 Ring A ip def, C O stretch1603 �63 1594 �64 1602 �66 Ring B quinoid stretch1621 �64 (1627) �66 1610 �67 Rings A, B, C deformation (ip)1634 �65 1619 �65 1650 �68 C O, C2 C3 stretch
ip: in-plane.
Table 6. Modes of 3- and 5-hydroxyflavone, which are strongly enhanced on the colloidsurface (Fig. 15)
3-HF (cm�1) Mode no. 5-HF (cm�1) Mode no. Description (DFT)
711 27 707 26 Ring B, C def, CH ip bend671 24 657 23 Ring A, B def620 21 611 21 Ring C, def575 19 555 20 Ring A, B, and/or C def516 17 519 19 Ring A, B, and/or C, def488 16 500 18 Ring A, and/or C, def455 15 451 16 Ring A, B, and/or C def
ip: in-plane.
Ring B in-plane CH bends. The strongly enhanced intensityof these lines is clearly a result of interaction with the surface.However, the most strongly enhanced lines on the Agelectrode mainly involve in-plane ring stretches. It is possiblethat the potential on the colloid is quite different from thaton the electrode. We also note that the colloid has a coat ofcitrate remaining. These may account for the differences, anda study of the complete potential dependence of the SERSwould be in order. Furthermore, we cannot rule out thepossibility of a photoproduct. For example, Sanchez-Corteset al.,39 in studies of diphenols on Ag colloids, found severalnew Raman bands, which they attributed to production ofdimers through formation of C–C and either C–O–C bondsbetween pairs of diphenols. However, further investigationsare most likely needed to establish the detailed reasons forthe spectral observations.
Comparison of normal wavenumbersIt is worthwhile to compare the effects of successive OH sub-stitution on the observed wavenumbers of flavone. However,a complete comparison of all modes for all the moleculesexamined here would be a lengthy and complex exercise.Instead, we will focus on a few regions of the spectrum, whichmight be of special interest. First, we should point out that theO–H stretching region would be of considerable interest, if itwere observed experimentally. For 3-HF a line is predicted at3420 cm�1 by DFT, while the 5-HF counterpart is indicated at3566 cm�1. In quercetin, there are five predicted wavenum-bers between 3283 and 3675 cm�1. All are predicted to have
sufficient intensity to be observed in NR spectroscopy, butnone are found. It is possible that molecule–molecule inter-actions in the solid either suppress or broaden these bands,making them invisible. They are not observed in our exper-iments in solution, or on Ag surfaces either.
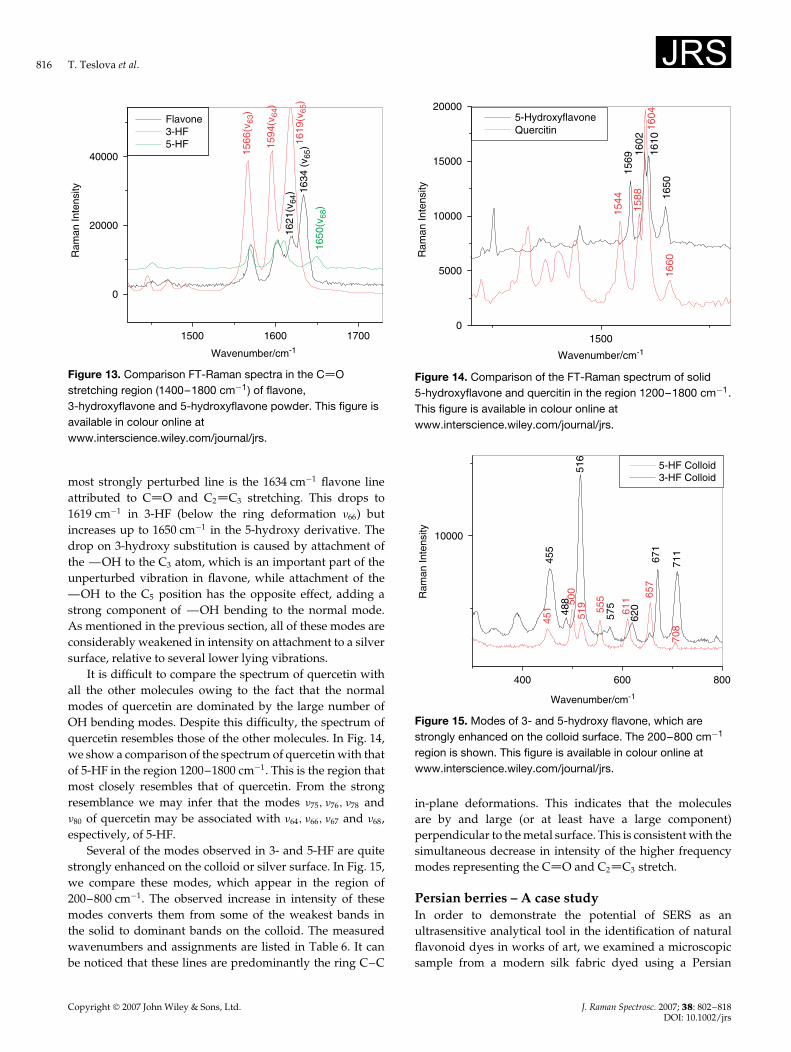
Also of considerable interest are the most intense linesnear 1600 cm�1, which are usually termed the carbonyl-stretching region. In Fig. 13 we compare the normal FT-Raman spectra of flavone, 3-HF and 5-HF powder. Thespectra of all the species consist of three or four intense linesand appear quite similar. However, the density functionalcalculation enables us to compare like vibrational modes, ina way not accessible just by observation of the spectrum. InTable 5 we summarize the observed wavenumbers, and theirspectral assignments obtained from application of DFT. Thelowest line in this region in each spectrum (1570, 1566, and1569 cm�1, respectively) may be assigned to the simultaneousRing A, in-plane deformation, coupled to C O stretch.Consequently, there is almost no shift of this line from flavoneon OH substitution. However, the line at 1603 cm�1 in flavoneis nearly unchanged in 5-HF, but drops slightly to 1594 cm�1
in the 3-hydroxy substituent. This vibration consists mainlyof the Ring B quinoid-like C C stretch, and is thereforealso likely to have only a slight variation with substitution.The series starting at 1621 cm�1 in flavone is assigned to thein-plane deformation of all three rings (A, B and C), andis strongly influenced by substitution. Note the �66 modein 3-HF is not noticed in the spectrum, so we substitutethe calculated (scaled) wavenumber in parentheses. The
Copyright 2007 John Wiley & Sons, Ltd. J. Raman Spectrosc. 2007; 38: 802–818DOI: 10.1002/jrs
816 T. Teslova et al.
1500 1600 1700
0
20000
40000
1621
(v64
)
1650
(v68
)
1634
(v 6
5)16
19(v
65)
1594
(v64
)
1566
(v63
)
Ram
an In
tens
ity
Wavenumber/cm-1
Flavone3-HF5-HF
Figure 13. Comparison FT-Raman spectra in the C Ostretching region (1400–1800 cm�1) of flavone,3-hydroxyflavone and 5-hydroxyflavone powder. This figure isavailable in colour online atwww.interscience.wiley.com/journal/jrs.
most strongly perturbed line is the 1634 cm�1 flavone lineattributed to C O and C2 C3 stretching. This drops to1619 cm�1 in 3-HF (below the ring deformation �66) butincreases up to 1650 cm�1 in the 5-hydroxy derivative. Thedrop on 3-hydroxy substitution is caused by attachment ofthe —OH to the C3 atom, which is an important part of theunperturbed vibration in flavone, while attachment of the—OH to the C5 position has the opposite effect, adding astrong component of —OH bending to the normal mode.As mentioned in the previous section, all of these modes areconsiderably weakened in intensity on attachment to a silversurface, relative to several lower lying vibrations.
It is difficult to compare the spectrum of quercetin withall the other molecules owing to the fact that the normalmodes of quercetin are dominated by the large number ofOH bending modes. Despite this difficulty, the spectrum ofquercetin resembles those of the other molecules. In Fig. 14,we show a comparison of the spectrum of quercetin with thatof 5-HF in the region 1200–1800 cm�1. This is the region thatmost closely resembles that of quercetin. From the strongresemblance we may infer that the modes �75, �76, �78 and�80 of quercetin may be associated with �64, �66, �67 and �68,espectively, of 5-HF.
Several of the modes observed in 3- and 5-HF are quitestrongly enhanced on the colloid or silver surface. In Fig. 15,we compare these modes, which appear in the region of200–800 cm�1. The observed increase in intensity of thesemodes converts them from some of the weakest bands inthe solid to dominant bands on the colloid. The measuredwavenumbers and assignments are listed in Table 6. It canbe noticed that these lines are predominantly the ring C–C
15000
5000
10000
15000
20000
1602
1588
1544
1604
1660
1610
1569
1650
Ram
an In
tens
ity
Wavenumber/cm-1
5-HydroxyflavoneQuercitin
Figure 14. Comparison of the FT-Raman spectrum of solid5-hydroxyflavone and quercitin in the region 1200–1800 cm�1.This figure is available in colour online atwww.interscience.wiley.com/journal/jrs.
400 600 800
10000
711
708
488
575
620
455
516
671
451
500
519 55
5
611 65
7
Ram
an In
tens
ity
Wavenumber/cm-1
5-HF Colloid3-HF Colloid
Figure 15. Modes of 3- and 5-hydroxy flavone, which arestrongly enhanced on the colloid surface. The 200–800 cm�1
region is shown. This figure is available in colour online atwww.interscience.wiley.com/journal/jrs.
in-plane deformations. This indicates that the moleculesare by and large (or at least have a large component)perpendicular to the metal surface. This is consistent with thesimultaneous decrease in intensity of the higher frequencymodes representing the C O and C2 C3 stretch.
Persian berries – A case studyIn order to demonstrate the potential of SERS as anultrasensitive analytical tool in the identification of naturalflavonoid dyes in works of art, we examined a microscopicsample from a modern silk fabric dyed using a Persian
Copyright 2007 John Wiley & Sons, Ltd. J. Raman Spectrosc. 2007; 38: 802–818DOI: 10.1002/jrs
Raman and SERS spectra of flavone and several hydroxy derivatives 817
berries extract in the Department of Textile Conservationat The Metropolitan Museum of Art. Persian berries is thename for a yellow dye obtained since antiquity from the driedunripe berries of plants in the buckthorn family (Rhamnus).9
Our previous work on a variety of natural dyes40,41 hasshown that microscopic textile samples can be analyzed bySERS following a vapor phase treatment with hydrofluoricacid (HF) to hydrolyze the mordant dye complex. In thiscase, a 2 mm fragment of a silk thread from a modern textiledyed with Persian berries following traditional practice wastreated for 15 min in a microchamber saturated with HFvapor. Following HF treatment, the sample was treated witha 2 µl drop of Ag colloid (diluted 20ð) and 2 µl of a 0.2 M
KNO3 solution and the SERS spectrum measured directlyfrom the microscopic colloidal aggregates deposited on thefiber.
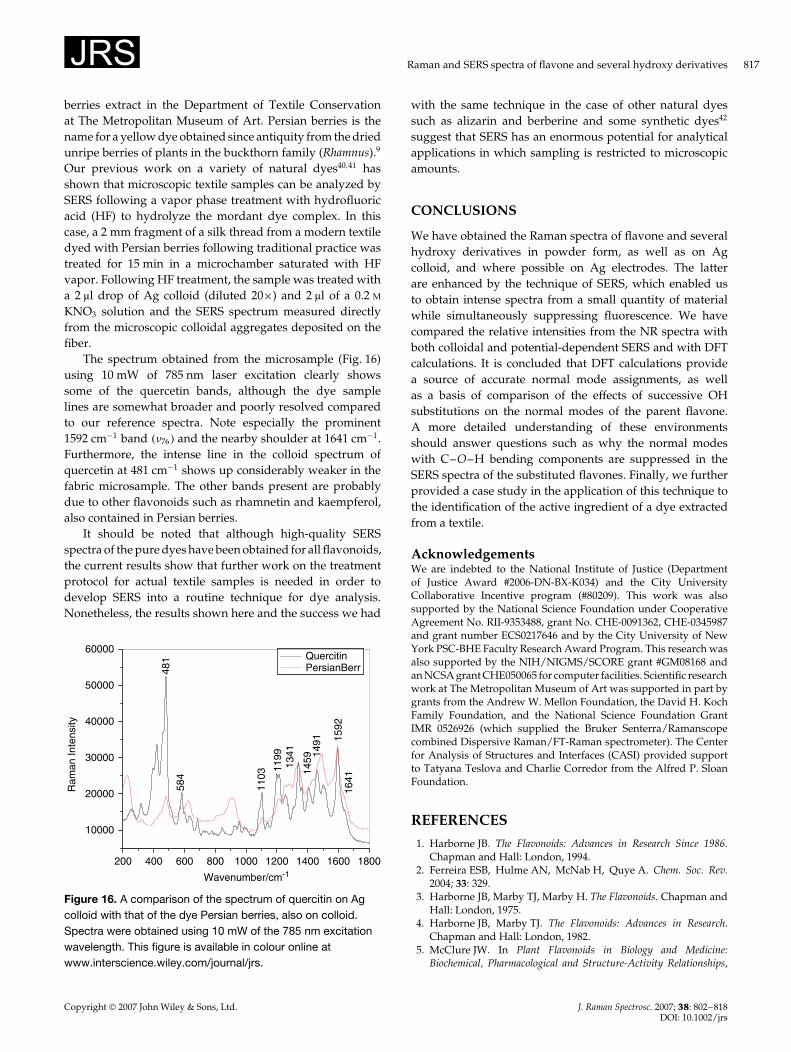
The spectrum obtained from the microsample (Fig. 16)using 10 mW of 785 nm laser excitation clearly showssome of the quercetin bands, although the dye samplelines are somewhat broader and poorly resolved comparedto our reference spectra. Note especially the prominent1592 cm�1 band ��76� and the nearby shoulder at 1641 cm�1.Furthermore, the intense line in the colloid spectrum ofquercetin at 481 cm�1 shows up considerably weaker in thefabric microsample. The other bands present are probablydue to other flavonoids such as rhamnetin and kaempferol,also contained in Persian berries.
It should be noted that although high-quality SERSspectra of the pure dyes have been obtained for all flavonoids,the current results show that further work on the treatmentprotocol for actual textile samples is needed in order todevelop SERS into a routine technique for dye analysis.Nonetheless, the results shown here and the success we had
200 400 600 800 1000 1200 1400 1600 1800
10000
20000
30000
40000
50000
60000
Ram
an In
tens
ity
Wavenumber/cm-1
QuercitinPersianBerr
1592
1341
1103
1199
1459 14
91
481
584
1641
Figure 16. A comparison of the spectrum of quercitin on Agcolloid with that of the dye Persian berries, also on colloid.Spectra were obtained using 10 mW of the 785 nm excitationwavelength. This figure is available in colour online atwww.interscience.wiley.com/journal/jrs.
with the same technique in the case of other natural dyessuch as alizarin and berberine and some synthetic dyes42
suggest that SERS has an enormous potential for analyticalapplications in which sampling is restricted to microscopicamounts.
CONCLUSIONS
We have obtained the Raman spectra of flavone and severalhydroxy derivatives in powder form, as well as on Agcolloid, and where possible on Ag electrodes. The latterare enhanced by the technique of SERS, which enabled usto obtain intense spectra from a small quantity of materialwhile simultaneously suppressing fluorescence. We havecompared the relative intensities from the NR spectra withboth colloidal and potential-dependent SERS and with DFTcalculations. It is concluded that DFT calculations providea source of accurate normal mode assignments, as wellas a basis of comparison of the effects of successive OHsubstitutions on the normal modes of the parent flavone.A more detailed understanding of these environmentsshould answer questions such as why the normal modeswith C–O–H bending components are suppressed in theSERS spectra of the substituted flavones. Finally, we furtherprovided a case study in the application of this technique tothe identification of the active ingredient of a dye extractedfrom a textile.
AcknowledgementsWe are indebted to the National Institute of Justice (Departmentof Justice Award #2006-DN-BX-K034) and the City UniversityCollaborative Incentive program (#80209). This work was alsosupported by the National Science Foundation under CooperativeAgreement No. RII-9353488, grant No. CHE-0091362, CHE-0345987and grant number ECS0217646 and by the City University of NewYork PSC-BHE Faculty Research Award Program. This research wasalso supported by the NIH/NIGMS/SCORE grant #GM08168 andan NCSA grant CHE050065 for computer facilities. Scientific researchwork at The Metropolitan Museum of Art was supported in part bygrants from the Andrew W. Mellon Foundation, the David H. KochFamily Foundation, and the National Science Foundation GrantIMR 0526926 (which supplied the Bruker Senterra/Ramanscopecombined Dispersive Raman/FT-Raman spectrometer). The Centerfor Analysis of Structures and Interfaces (CASI) provided supportto Tatyana Teslova and Charlie Corredor from the Alfred P. SloanFoundation.
REFERENCES
1. Harborne JB. The Flavonoids: Advances in Research Since 1986.Chapman and Hall: London, 1994.
2. Ferreira ESB, Hulme AN, McNab H, Quye A. Chem. Soc. Rev.2004; 33: 329.
3. Harborne JB, Marby TJ, Marby H. The Flavonoids. Chapman andHall: London, 1975.
4. Harborne JB, Marby TJ. The Flavonoids: Advances in Research.Chapman and Hall: London, 1982.
5. McClure JW. In Plant Flavonoids in Biology and Medicine:Biochemical, Pharmacological and Structure-Activity Relationships,
Copyright 2007 John Wiley & Sons, Ltd. J. Raman Spectrosc. 2007; 38: 802–818DOI: 10.1002/jrs
818 T. Teslova et al.
Cody V, Middleton E, Harborne JB (eds). Alan R. Liss: NewYork, 1986; 77.
6. Geissman TA. The Chemistry of Flavonoid Compounds. TheMacmillan Company: New York, 1962.
7. Smith DA, Banks SW. In Plant Flavonoids in Biology and Medicine:Biochemical, Pharmacological and Structure-Activity Relationships,Cody V, Middleton E, Harborne JB (eds). Alan R. Liss: NewYork, 1986; 113.
8. Gabor M. The Pharmacology of Benzopyrone Derivatives and RelatedCompounds. Akademiai Kiado: Budapest, 1986.
9. Hofenk de Graaff JH. The Colorful Past. Origins, Chemistry andIdentification of Natural Dyestuffs. Abegg-Stiftung and ArchetypePublications: Riggisberg, London, 2004.
10. Jose CI, Phadke PS, Rao AVR. Spectrochem. Acta 1974; 30A: 1199.11. Dean FM. Naturally Occurring Oxygen Ring Compounds.
Butterworth: London, 1963; 280.12. Marby TJ, Markham FK, Thomas MB. The Systematic
Identification of Flavonoids. Springer: Berlin, 1970.13. Sengupta PK, Kasha M. Chem. Phys. Lett. 1979; 68: 382.14. Brewer WE, Studet SL, Standiford M, Chou PT. J. Phys. Chem.
1989; 93: 6088.15. Dzugan TP, Schmidt J, Aartsma TJ. Chem. Phys. Lett. 1986; 127(4):
336.16. Looker JH, Hanneman WW. J. Org. Chem. 1962; 27: 381.17. Shaw L, Simpson TH. J. Chem. Soc. 1955; 655.18. Hergert HL, Kurth EF. J. Am. Chem. Soc. 1953; 75: 1622.19. Looker JH, Hanneman WW, Kagal SA, Dappen JI, Edman JR.
J. Hetero-Cycl. Chem. 1966; 3: 55.20. Looker JH, Kagal SA, Dappen JI, Edman JR. J. Hetero-Cycl. Chem.
1966; 3: 61.21. del Valle JC. J. Chem. Phys. 2006; 124: 104506.22. Briggs LH, Colebrook LD. Spectrochim. Acta 1962; 18: 939.23. Amaral DF, Arruda MSP, Arruda AC, Muller AH, Pantoja LLJ,
da S, Lima TM. J. Braz. Chem. Soc. 2001; 12(4): 538.24. Torreggiani A, Trinchero A, Tamba M, Taddei P. J. Raman
Spectrosc. 2005; 36: 380.25. Cornard JP, Merlin JC, Boudet AC, Vrielynck L. Biospectroscopy
1997; 3(3): 183.26. Petroski JM, Valente CDS, Kelson EP, Collins S. J. Phys. Chem., A
2002; 106: 11714.27. Livingstone RLG, Quagliano LG, Perez-Paz N, Munoz M,
Tamargo MC, Jean-Mary F, Lombardi JR. SERS as sensingmethod for bio-molecules on MBE-grown quantum dots. InProceedings of SPIE.; Nanosensing: Materials and DevicesII, SaifIslam M, Dutta AK (eds). SPIE-The International Society forOptical Engineering, Bellingham, WA, USA, 2005; 6008.
28. Daeid NN (ed.) Review Papers, 14th International Forensic Sci-ence Symposium, Interpol- Lyon, 19–22 October 2004 [Online].
Available: www.interpol.int/Public/Forensic/IFSS/meeting14/ReviewPapers.pdf.
29. Chen K, Leona M, Vo-Dinh KC, Yan F, Wabuyele MB, Vo-Dinh T. J. Raman Spectrosc. 2006; 37: 520.
30. Birke RL, Lu T, Lombardi JR. Techniques for Characterization ofElectrodes and Electrochemical Processes, Varma R, Selam JR (eds).John Wiley and Sons, Inc: New York, 1991; Chapt. 5.
31. Lee PC, Meisel D. J. Phys. Chem. 1982; 86: 3391.32. Frisch MJ, Trucks GW, Schlegel HB, Scuseria GE, Robb MA,
Cheeseman JR, Montgomery JA Jr, Vreven T, Kudin KN,Burant JC, Millam JM, Iyengar SS, Tomasi J, Barone V,Mennucci B, Cossi M, Scalmani G, Rega N, Petersson GA,Nakatsuji H, Hada M, Ehara M, Toyota K, Fukuda R,Hasegawa J, Ishida M, Nakajima T, Honda Y, Kitao O,Nakai H, Klene M, Li X, Knox JE, Hratchian HP, Cross JB,Bakken V, Adamo C, Jaramillo J, Gomperts R, Stratmann RE,Yazyev O, Austin AJ, Cammi R, Pomelli C, Ochterski JW,Ayala PY, Morokuma K, Voth GA, Salvador P, Dannenberg JJ,Zakrzewski VG, Dapprich S, Daniels AD, Strain MC, Farkas O,Malick DK, Rabuck AD, Raghavachari K, Foresman JB, Ortiz JV,Cui Q, Baboul AG, Clifford S, Cioslowski J, Stefanov BB,Liu G, Liashenko A, Piskorz P, Komaromi I, Martin RL,Fox DJ, Keith T, Al-Laham MA, Peng CY, Nanayakkara A,Challacombe M, Gill PMW, Johnson B, Chen W, Wong MW,Gonzalez C, Pople JA. Gaussian 03, Revision C.02. Gaussian, Inc:Wallingford, CT, 2004.
33. Silman O, Bumm LA, Callaghan R, Blatchford CG, Kerker M. J.Phys. Chem. 1983; 87: 1014.
34. Wang M, Teslova T, Xu F, Lombardi JR, Birke RL, Leona M. J.Phys. Chem. 2007; DOI: 10.1021/jp062100i.
35. Wang M, Spataru T, Lombardi JR, Birke RL. J. Phys. Chem. 2007;DOI: 10.1021/jp0650937.
36. Rauhut G, Pulay P. J. Phys. Chem. 1995; 99: 3093.37. Pulay P, Fogarasi G, Pongor G, Boggs JE, Vargha A. J. Am. Chem.
Soc. 1983; 105: 7037.38. Neugebauer J, Hess BA. J. Chem. Phys. 2003; 118: 7215.39. Sanchez-Cortes S, Francioso O, Garcia-Ramos JV, Ciavatta C,
Gessa C. Colloids Surf. A: Physicochem. Eng. Aspects 2001; 176:177.
40. Leona M, Stenger J, Ferloni E. J. Raman Spectrosc. 2006; 37: 981.41. Leona M. Surface enhanced Raman scattering in art and
archaeology, Proc. of SPIE Vol. 5993, 5993L-1. SPIE-TheInternational Society for Optical Engineering, Bellingham, WA,USA, 2005.
42. Leona M. Identification of Natural Dyes in Works of art by SERSTechniques: Recent Progress and Remaining Problems. ICORS:Yokohama, 2006;; 20, August 2006.
Copyright 2007 John Wiley & Sons, Ltd. J. Raman Spectrosc. 2007; 38: 802–818DOI: 10.1002/jrs