raman spectroscopy of diamondoids · 2006-05-12 · spectrochimica acta part a 64 (2006) 681–692...
TRANSCRIPT

Spectrochimica Acta Part A 64 (2006) 681–692
Raman spectroscopy of diamondoids
Jacob Filik a, Jeremy N. Harvey a, Neil L. Allan a, Paul W. May a,∗,Jeremy E.P. Dahl b, Shenggao Liu b, Robert M.K. Carlson b
a School of Chemistry, University of Bristol, Bristol BS8 1TS, UKb MolecularDiamond Technologies, ChevronTexaco Technology Ventures, Post Office Box 1627, Richmond, CA 94802, USA
Received 11 July 2005; received in revised form 30 July 2005; accepted 30 July 2005
Abstract
A selection of diamondoid hydrocarbons, from adamantane to [121321] heptamantane, have been analysed by multi-wavelength laser Ramanspectroscopy. Spectra were assigned using vibrational frequencies and Raman intensities were calculated by employing the B3LYP functional andthe split valence basis set of Schafer, Horn and Ahlrichs with polarisation functions on carbon atoms. The variation of the spectra and associatedvibrational modes with the structure and symmetry of the molecules are discussed. Each diamondoid was found to produce a unique Ramanspectrum, allowing for easy differentiation between molecules. Using the peak assignments derived from the calculations we find that the lowfrequency region of the spectra, corresponding to CCC-bending/CC-stretching modes, is particularly characteristic of the geometric shape of thed©
K
1
[ubrmsirspt
ttpt
(
1d
iamondoid molecules.2005 Elsevier B.V. All rights reserved.
eywords: Raman; Spectroscopy; Diamondoids; Polymantanes; Diamond hydrocarbons; Density functional theory
. Introduction
Since the discovery of adamantane from petroleum in 19331], there has been great interest in the properties of this oncenique cage-structured molecule. Some years later it was joinedy diamantane [2] to form the two smallest examples of a se-ies of molecules known as “diamond hydrocarbons” or dia-ondoids. Synthetically, chemists managed to reproduce these
tructures in the laboratory [3] and go two steps further, produc-ng both triamantane [4] and a tetramantane that bore structuralesemblance to butane in its anti conformation [5]. For largerystems, the huge number of potential intermediates, reactionathways, and complex reaction schemes has prevented the syn-hetic production of higher polymantanes [6].
In 2003, MolecularDiamond Technologies used vacuum dis-illation and a combination of chromatographic techniqueso isolate a range of diamondoid molecules [7], again frometroleum. For the first time, diamondoids, from tetramantaneso an undecamantane, were available.
∗ Corresponding author. Tel.: +44 1173317555.E-mail addresses: [email protected] (J. Filik), [email protected]
P.W. May).
Use of the systematic von Baeyer nomenclature forpolymantanes is somewhat counter-productive, with eventhe simple triamantane being correctly referred to asheptacyclo[7.7.13,15.01,12.02,7.04,13.06,11]octadecane. Luckily,with an impressive display of foresight, the problem of namingthese newly discovered molecules was tackled in 1978 by Bal-aban and von Schleyer [8]. To avoid the adoption of a plethoraof trivial names to categorize isomeric polymantanes, they usedgraph theory to formulate a manageable numerical prefix, basedon the relative positions of the centres of the fused adaman-tane units. This prefix is followed by the Greek numeral forthe number of adamantane units and the suffix “mantane”, e.g.[1(2,3)4] pentamantane. Without delving too deeply into theconventions of this classification, there are a few simple ob-servations relevant to this paper. The smallest diameter “rod”of diamondoid has a prefix that consists solely of alternatingones and twos. For example [1212] pentamantane (Fig. 1(g)) isa “rod-shaped” diamondoid containing five adamantane units.Flat diamondoid molecules that just extend in two dimensionsonly have ones, twos and threes in their prefix, e.g. [12312] hexa-mantane (Fig. 1(n)) is a “disc-shaped” diamondoid containingsix adamantanes. Following from this, when a prefix containsones, twos, threes and fours, the diamondoid network is extendedin all three dimensions, e.g. [1(2,3)4] pentamantane (Fig. 1(h))
URL: http://www.chm.bris.ac.uk/pt/diamond.. is a tetrahedron made of five adamantane units. Only pentaman-
386-1425/$ – see front matter © 2005 Elsevier B.V. All rights reserved.oi:10.1016/j.saa.2005.07.070

682 J. Filik et al. / Spectrochimica Acta Part A 64 (2006) 681–692
Fig. 1. Diamondoids studied in this experiment, (a) adamantane C10H16 Td, (b) diamantane C14H20 D3d, (c) triamantane C18H24 C2v, (d) [121] tetramantane C22H28
C2h, (e) [1(2)3] tetramantane C22H28 C3v, (f) [123] tetramantane C22H28 C2, (g) [1212] pentamantane C26H32 C2v, (h) [1(2,3)4] pentamantane C26H32 Td, (i)3-methyl-[1(2,3)4] pentamantane C27H34 C3v, (j) [12(3)4] pentamantane C26H32 Cs, (k) [1213] pentamantane C26H32 C1, (l) [1234] pentamantane C26H32 C2, (m)[12(1)3] pentamantane C26H32 C1, (n) [12312] hexamantane C26H30 D3d, (o) [121321] heptamantane C30H34 Cs.
tanes or larger can extend in three dimensions, tetramantanesare always flat and their prefix will only contain ones, twos orthrees.
Laser Raman spectroscopy is a popular characterisation tech-nique used to probe the structure of materials. The Raman spec-tra of adamantane and several of its derivatives have been studiedon many occasions and in great detail [9,10]. These experimentswere conducted on the solid phase and to a good approximationit was possible to divide modes into intramolecular and inter-molecular.
The intramolecular studies concentrate on the high wavenum-ber region (above 300 cm−1) of the spectrum and in general usetheoretical calculations performed on a single molecule to assistwith the mode assignment [11]. Very recently, Jensen [9] pub-lished a highly detailed assignment of the normal modes of vibra-tion of both adamantane and deuterated adamantane, producingnormal mode based empirical correction factors at the Hartree–Fock, DFT (B3LYP) and MP2 levels. In other work [10] attemptshave been made to correlate the Raman spectra of adamantaneand diamantane with that of nanocrystalline diamond. However,it is now widely accepted that any peaks found in the Ramanspectrum of a chemical vapour deposition nanocrystalline dia-mond film, excluding the diamond 1332 cm−1 Brillouin zonecentre mode, are due to non-diamond phases of carbon [12].Adamantane derivatives also studied by this combination ofRaman spectroscopy and computational methods include 2-att
is [12312] hexamantane [16] (often referred to as cyclohexa-mantane), but the spectral assignment was based on semiem-pirical (AM1) calculations on adamantane, and is therefore notcompletely reliable. Despite there being very little experimen-tal Raman data for other diamondoids, interest in the theoreticalcalculations of the molecular vibrational frequencies and Ramanintensities is growing [17,18].
Conversely, intermolecular studies focus on the lowwavenumber region (sub 300 cm−1) and are concerned with themotion of molecular units in the crystal relative to each other.Such studies are usually performed over a range of tempera-tures to observe solid-solid phase transitions [19,20]. The mostrelevant example of this is the plastic transition in adamantane.At low temperature, crystalline adamantane has the space groupD4
2d with two molecules per primitive unit cell. Raising the tem-perature to above 209 K produces a phase transition to the plasticstate. During this transition the sharp but weak low frequencylattice modes observed in the Raman spectrum become a broadwing [19], tentatively assigned to disorder-induced scattering inthe Raman disallowed first-order spectrum of the high tempera-ture structure.
We now present the first general study of the Raman spectraof a large family of diamondoids. In this investigation, the ef-fects of variations in structure and symmetry on the intramolec-ular vibrations of a selection of diamondoid molecules, fromadamantane to [121321] heptamantane (Fig. 1), are analysed byRfo
damantanone [11], 1,1′-biadamantane [13], perfluoroadaman-ane [14], and the antiparkinson drug amantadine [15]. To datehe largest diamondoid to be analysed by Raman spectroscopy
aman spectroscopy. Assignments are made using vibrationalrequencies and Raman intensities calculated at the B3LYP levelf theory. Spectra are compared and contrasted with respect to
J. Filik et al. / Spectrochimica Acta Part A 64 (2006) 681–692 683
the molecular geometries of the diamondoids with special atten-tion being paid to any modes that may be structurally diagnostic.
Fig. 1 depicts the relationships between all the diamondoidsincluded in this study. The first three structures, adamantane(a), diamantane (b), and triamantane (c), are the only isomerspossible constructed of one, two or three adamantane units. Afurther unit can be added in eight distinct ways, producing [121]tetramantane (d), [1(2)3] tetramantane (e), and both enantiomersof the chiral [123] tetramantane (f).
All the other diamondoids in this study are built by the addi-tion of further adamantane units on the base of these four struc-tures with the exception of (i) which results from methyl additionto (h). The pentamantanes can be split into two groups; thosewhose structure can only be related to a single tetramantane, andthose whose structure is based on a combination of two or allthree tetramantanes. The first group contains [1212] pentaman-tane (g), [1(2,3)4] pentamantane (h), and chiral [1234] penta-mantane (l), whose structures are uniquely based on [121] tetra-mantane, [1(2)3] tetramantane and [123] tetramantane, respec-tively. There is predicted to be a further pentamantane, [1231]pentamantane, uniquely related to [123] tetramantane, which isthe base pentamantane for [12312] hexamantane (n), but this hasnot yet been isolated, and may not even be stable due to stericinteractions between two specific neighbouring hydrogens. Thesecond group contains chiral [1213] pentamantane (k) (relatedto [121] and [123] tetramantanes), [12(3)4] pentamantane (j)(pttgdtahah
2
Ad2witAsr
btg
(d
and lower luminescence. All chiral diamondoids were presentas racemic mixtures.
Calculations were performed using Gaussian 03 [21], usingthe standard B3LYP functional and the split valence basis setof Schaefer et al. [22] with polarisation functions on carbon.Raman intensities were calculated by numerical differentiationof dipole derivatives with respect to the electric field.
3. Results
The experimental and calculated Raman spectra for all di-amondoids analysed in this study are displayed in Figs. 2, 3,6, 8–10. All modes in the calculated spectra are displayed asLorentzians, each with a full-width half-maximum of 5 cm−1.All spectra have been split into two groups, the higher frequencyCH stretch region (2800–3100 cm−1) and the lower frequencyregion. The CH stretch modes are approximately three timesmore intense than the other modes, and have been normalised tothe strongest peak. The lower frequency region of the spectra arenormalised to the strongest mode in the region 1100–1300 cm−1
not withstanding the occasional signal of high intensity at around500 cm−1.
Looking at the width of the bands corresponding to CHstretches compared to those associated with the lower frequencymodes we find the CH stretching bands are considerably broader.This has been observed previously in adamantane [19] and wasfpkf
sarcnTli
3
bAm(tsecwm3bt(
related to [123] and [1(2)3] tetramantanes) and chiral [12(1)3]entamantane (m) (related to [121], [1(2)3] and [123] tetraman-anes). This inherent ordering permits the grouping of this selec-ion of diamondoids by their root tetramantane(s), producing fiveroups, adamantane to triamantane, then three groups uniquelyerived from and including all tetramantanes, and finally pen-amantanes that can be made by addition to either of two orll three tetramantanes. [12312] Hexamantane (n) and [121321]eptamantane (o) are analysed in their own section due to thebsence of [1231] pentamantane that would help relate [12312]examantane to [123] tetramantane.
. Experimental and computational details
Raman spectra were measured using Renishaw inVia (488 nmr+, 2400 l/mm grating) and 2000 (514 nm Ar+ laser, 785 nmiode laser, 1200 l/mm grating and 325 nm He–Cd laser,400 l/mm grating) spectrometers. No wavenumber dispersionas observed with the change in excitation wavelength. Changes
n relative peak intensity were noticed, but are most likely at-ributable to the system response function of each spectrometer.ll the spectra presented here were produced using the 488 nm
ystem, chosen because of its superior resolution and flat systemesponse function.
Spectra were studied in the range 200–3200 cm−1 and coulde split into two distinct regions, the “CH stretch region” be-ween 3100 and 2800 cm−1 and the “CH bend, CC stretch re-ion” between 1600 and 200 cm−1.
Diamondoid samples varied in size from small single crystalssub 1 mm) to fine powders. Generally, the single crystals pro-uced a superior spectrum, with a higher signal-to-noise ratio
ound to reduce considerably on cooling to below the plastichase transition at 209 K. The cause of this broadening is un-nown but is speculated to be caused by coupling of the highrequency modes to the crystal disorder.
The use of this level of theory and a split valence basiset to calculate vibrational frequencies and Raman activities ofdamantane and its derivatives has been found to successfullyeproduce experimental spectra [9,11]. Differences between thealculated and experimental spectra were found to be most pro-ounced in CH2/CH bending vibrations, also noticed in our data.he causes of these deficiencies are uncertain but they are mostly
ikely due to use of a relatively small basis set or the effect ofntermolecular interactions in the condensed phase.
.1. Adamantane, diamantane, and triamantane
We start with the simplest example. Adamantane has 72 vi-rational modes, 11T2 + 7T1 + 6E + 1A2 + 5A1. The T1 and2 vibrations are not Raman active, leaving 22 possible Ra-an signals. Comparing the experimental and calculated spectra
Fig. 2) we find that only half these modes are intense enougho be observable experimentally. The CH stretch region con-ists of six broad vibrations, three of which are so close in en-rgy they are unresolvable (experimental frequency 2848 cm−1,alculated frequency 3005 cm−1, E + A1 + T2). The vibrationith the highest Raman intensity is the fully symmetric A1ode (experimental frequency 2916 cm−1, calculated frequency
039 cm−1 and intensity 654 A4/amu). The lower wavenum-er region contains five strong Raman bands, the most in-ense of which being the doubly-degenerate CH2 twist modeexperimental wavenumber 1220 cm−1, calculated wavenum-

684 J. Filik et al. / Spectrochimica Acta Part A 64 (2006) 681–692
Fig. 2. Experimental and calculated spectra for (from bottom) adamantane (a), diamantane (b) and triamantane (c).
ber 1238 cm−1 and intensity 2 × 46 A4/amu). The other visiblemodes are the fully symmetric A1 CC stretch (breathing) mode(experimental wavenumber 757 cm−1, calculated wavenumber759 cm−1 and intensity 27 A4/amu), a T2 CC stretch/CCCbend mode (experimental wavenumber 971 cm−1, calculatedwavenumber 985 cm−1 and intensity 3 × 12 A4/amu), a T2 CH2rock/CH wag mode (experimental wavenumber 1097 cm−1, cal-culated wavenumber 1126 cm−1 and intensity 3 × 4 A4/amu)and finally an E CH2 scissor mode (experimental wavenumber1435 cm−1, calculated wavenumber 1469 cm−1 intensity and2 × 29 A4/amu).
Diamantane has 96 vibrational modes, 11A1g + 6A1u +5A2g + 10A2u + 16Eg + 16Eu. Only the A1g and Eg species areRaman active, leaving 27 Raman active vibrational modes. Ex-amining the experimental and calculated spectra (Fig. 2) we find22 visible Raman signals. Comparing the adamantane and dia-mantane spectra we find similar broad high wavenumber CHstretch modes and the sharper lower wavenumber modes. Ob-serving the CH stretch region we find that both have six Ramansignals, produced by similar nuclear displacements, but in dia-mantane only two modes are close enough to be unresolvable,and hence giving the extra peak in the spectrum. Looking at thelower wavenumber range, there seems to be a reasonable corre-lation between the peak positions in the spectra of adamantaneand diamantane, but there are more peaks present in the diaman-t −1
atw
ing of CH2 twisting motions strongly mixed with CH waggingmodes. Both adamantane and diamantane have six CH2 groups,and group theory shows that in both there should be only oneEg/E CH2 twist. This suggests that the appearance of more in thespectrum must be due to mixing with extra CH wag/CC stretchEg modes produced by the larger structure of diamantane. Themajority of the peaks in the diamantane spectrum can be tracedback to similar peaks in the adamantane spectrum, which havebeen complicated by mixing induced by extra modes of the samesymmetry at similar energies.
The addition of another adamantane unit produces triaman-tane which has 120 vibrational modes, 35A1 + 25A2 + 29B1 +31B2. Again, the addition of another unit has reduced the sym-metry of the molecule. From adamantane to diamantane thishad little effect, as in both only some limited symmetries wereRaman active. In triamantane, the symmetry has decreased toC2v, so all modes are now Raman active, producing 120 pos-sible signals in the Raman spectrum (Fig. 2). This increase inmolecule size and decrease in symmetry means we now have20 intense CH stretch vibrations in the same 100 cm−1 region,which produces a very poorly resolved experimental signal.
For the lower frequency region, the agreement betweenthe experimental and calculated data appears to decrease. Foradamantane and diamantane, the only major inconsistencies inthe calculated intensities were the underestimation of the breath-ing modes (757 cm−1 in adamantane, 708 cm−1 in diamantane)aro
ane spectrum. For example, the single peak at 1220 cm in thedamantane spectrum is replaced by two signals in the diaman-ane spectrum. Looking at the nuclear displacements associatedith these vibrations, we find that all three are Eg modes consist-
nd the overestimation of the CH2 scissor modes (1435 cm−1)elative to the ∼1220 cm−1 CH2 twist modes. As the complexityf the Raman spectra increases the deficiencies in the calculated
J. Filik et al. / Spectrochimica Acta Part A 64 (2006) 681–692 685
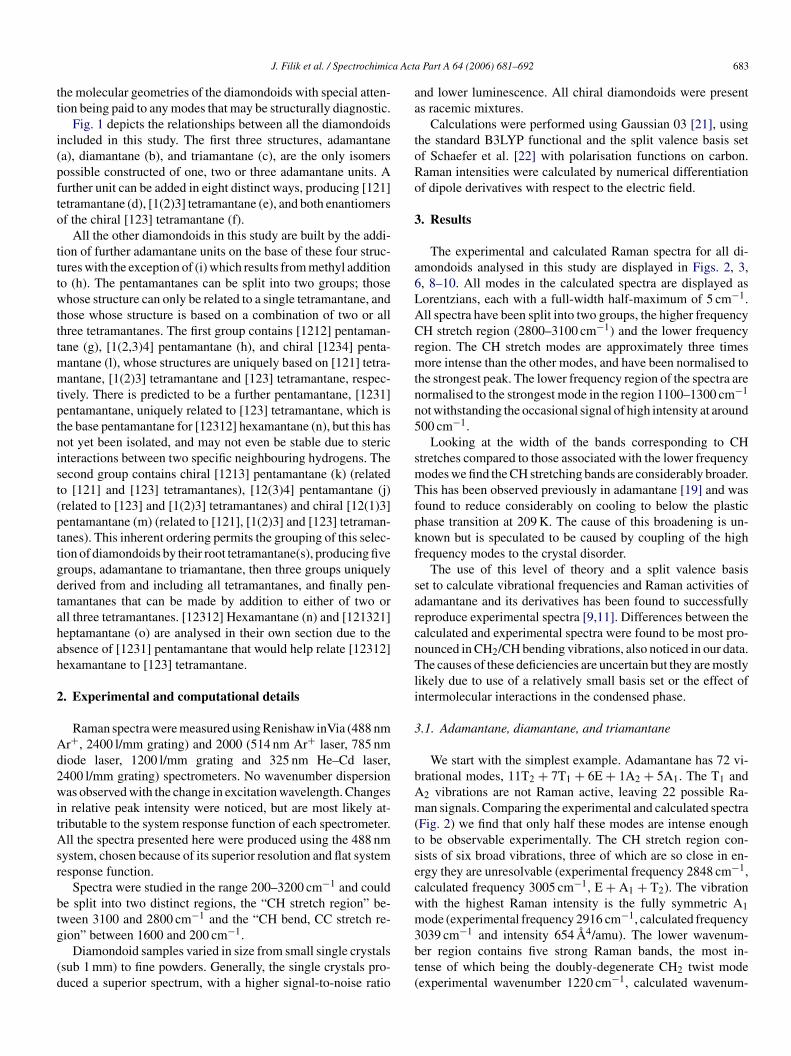
Fig. 3. Experimental and calculated spectra for (from bottom) [1(2)3] tetramantane (e), [1(2,3)4] pentamantane (h) and 3-methyl-[1(2,3)4] pentamantane (i). Spectrahave been normalised to the most intense signal at ∼1200 cm−1, higher intensity peaks are shown as dashed lines.
intensities become more prominent. The calculated spectrumfor triamantane still has the same discrepancies as the adaman-tane and diamantane calculations but there is also disagreementin the intensity of vibrations in the region around ∼1300 and∼1100 cm−1. This type of disagreement is not wholly unex-pected for calculations performed on molecules of this size dueto the limitations in the size of basis set [11]. The most promi-nent signals in the low wavenumber region are two close peaksat 1197 and 1222 cm−1 similar to those observed in the diaman-tane spectrum, both of which are assigned to CH wag motions,and the 681 cm−1 cage deformation (CCC bend, CC stretch)which, again, also has an analogous peak in diamantane. Aswell as these modes there is a large abundance of weaker modesthroughout the 400–1500 cm−1 region produced by the largerstructure of triamantane and the absence of symmetry forbiddenvibrations.
As mentioned above, the attachment of an additional adaman-tane unit to triamantane can occur in four distinct ways, produc-ing two distinct molecules and a pair of enantiomers. In the nextsection, we shall study addition to the central unit in triamantaneproducing [1(2)3] tetramantane (e), and further addition to thisto produce several pentamantane derivatives.
3.2. [1(2)3] Tetramantane, [1(2,3)4] pentamantane and3-methyl-[1(2,3)4] pentamantane
tr
from C2v to C3v, meaning that of the 144 vibrational modes(29A1 + 19A2 + 48E), we would expect a maximum of 77peaks in the Raman spectrum (Fig. 3), considerably less than fortriamantane due to the presence of doubly degenerate E modesand the A2 modes being Raman inactive in C3v molecules. De-spite the fewer expected signals there are still 15 intense CHstretch vibrations, again making this region of the spectrumpoorly resolved. The lower wavenumber region does not havenotably fewer peaks than triamantane, since although triaman-tane has 120 Raman active vibration modes not all of them willinduce a significant change in polarisability in the molecule, nec-essary for an experimentally observable Raman signal. Againthere are two intense E CH2 twist modes (1177 and 1211 cm−1)similar to those observed in the diamantane spectrum. But, as inthe triamantane spectrum, the relative intensities of the neigh-bouring peaks are different in the calculated spectrum comparedto the experimental spectrum. The most noticeable difference be-tween the low wavenumber region of [1(2)3] tetramantane andthe other diamondoid molecules studied so far is the increase inintense signals in the CCC bend/CC stretch deformation region.From adamantane to triamantane there has been only one strongsignal, decreasing in wavenumber (from 757 to 681 cm−1) asthe molecular size increases. The same peak is still present in[1(2)3] tetramantane, but for the first time there are peaks withgreater intensity at a lower wavenumber. The 659 cm−1 vibra-tion involves stretching of the molecule parallel to the C axis,wpp
The addition of an adamantane unit to the middle unit inriamantane produces [1(2)3] tetramantane (C22H28), triviallyeferred to as “iso-tetramantane”. This increases the symmetry
3hereas the more intense 505 cm−1 vibration is stretching per-endicular to this axis (Fig. 4). The experimental intensity of thiserpendicular stretch is over twice as large as any other mode

686 J. Filik et al. / Spectrochimica Acta Part A 64 (2006) 681–692
Fig. 4. Nuclear displacements of the 505 and 659 cm−1 modes of [1(2)3] tetra-mantane.
in the 200–1500 wavenumber region but in the calculated spec-trum it is only half as intense as the strongest CH2 twist mode.This appears to be another region where only limited accuracycan be achieved because of the large size of the systems. Peakassignment is still possible but the accuracy of the calculated vi-brational frequencies is considerably better than the intensities.
As mentioned above, [1(2)3] tetramantane is formed byadding an extra unit to one of two equivalent sites on the centralpart of triamantane. Addition of a further unit to the other of thesesites then leads to the smallest Td symmetry polymantane afteradamantane, [1(2,3)4] pentamantane (C26H32). [1(2,3)4] Pen-tamantane has 168 vibrational modes, 24T2 + 18T1 + 14E +4A2 + 10A1, but because of the double or triple degeneracy ofsome of the vibrations, and the T1 and A2 modes being Ra-man inactive, there is a maximum of 48 signals in the Ramanspectrum (Fig. 3). The high symmetry of this particular poly-mantane suggests that it may be rewarding to compare its Ra-man spectrum to those of adamantane and [1(2)3] tetraman-tane. The CH stretch region of the Raman spectrum of [1(2,3)4]pentamantane contains eight vibrations which produces threebroad peaks, bearing closer resemblance to the same region fromadamantane than from [1(2)3] tetramantane. The CCC bend/CCstretch range, on the other hand, correlates better with that from[1(2)3] tetramantane. The only intense low wavenumber vibra-tion in the adamantane spectrum occurs at 757 cm−1, far fromthe 518 cm−1 mode in [1(2,3)4] pentamantane, whereas [1(2)3]taocit
smd
Fig. 5. The five diamondoid structural groups. The molecules on the right areidentical to those on the left but rotated 90◦ around the x-axis, which is shownas a dotted line.
[12] respectively, if they were not unique isomers. [1(2)3] Tetra-mantane is two-dimensional and has an isotropic structure i.e.symmetrical, disc-shaped (Fig. 5(b)). [1(2,3)4] Pentamantaneis a three-dimensional isotropic diamondoid, its structure beinga tetrahedral arrangement of five adamantane units. The peakoccurring at ∼680 cm−1 in all spectra except adamantane and[1(2,3)4] pentamantane is assigned as a breathing mode acrossa section which is one adamantane unit wide (Fig. 4 showsthis for [1(2)3] tetramantane). [1(2,3)4] Pentamantane does nothave a peak at ∼680 cm−1 because it is not two-dimensional,there is no part of its structure that is only one-adamantane-unitacross. Adamantane is a special case because all of its dimen-sions are one-adamantane-unit wide, and its equivalent peak isat 757 cm−1, the lowest wavenumber strong Raman signal. Thehypothesis that a strong peak at ∼680 cm−1 can be used to iden-tify a two-dimensional diamondoid (i.e. one whose structure isone-adamantane-unit wide) will be tested further as this studyprogresses.
Still looking at the low wavenumber region, both [1(2)3]tetramantane and [1(2,3)4] pentamantane display reasonably in-tense peaks below 450 cm−1 which only start to appear whenthe polymantane structure is large, due to vibrations featuringquaternary carbon CCC bending. Yet again, the most intense vi-bration in the low wavenumber region (excluding the breathingmode) is an E CH2 twist mode.
etramantane (as mentioned above) has both a peak at 659 andt 505 cm−1. Up to [1(2,3)4] pentamantane, the Raman spectraf all diamondoids (with the exception of adamantane, a specialase) have displayed a peak at or close to ∼680 cm−1. So whats it about the structure of [1(2,3)4] pentamantane that removeshe Raman active vibrational mode at this wavenumber?
Looking at the structures of the diamondoid molecules in thistudy, we can put them all into one of five groups (Fig. 5). Dia-antane and triamantane are both one-dimensional rod-shaped
iamondoids (Fig. 5(a)) and would have the prefixes of [1] and

J. Filik et al. / Spectrochimica Acta Part A 64 (2006) 681–692 687
For [1(2,3)4] pentamantane there are also discrepancies be-tween the observed and calculated spectra in the ∼400 and∼1300 cm−1 areas as observed for [1(2)3] tetramantane. Itwould be useful to see the effect of a larger basis set on the cal-culated spectrum but is not feasible on a molecule this size usingB3LYP, but it is possible using Hartree–Fock. Recalculating thevibrational frequencies and Raman intensities of [1(2,3)4] pen-tamantane with Hartree–Fock theory and the same basis set, wefind that the frequencies are considerably worse, but there is lit-tle change in the intensities. This suggests that correlation haslittle effect on calculated Raman intensities. If again we recal-culate using Hartree–Fock with the larger 6-311+G(2d,p) basisset, we find that this does have a positive effect on the calculatedintensities compared to the experimental data. The most obviousdeviation in the smaller basis set calculation is the gross under-estimation of the intensity of the 518 cm−1 breathing mode. Inthe experimental spectrum this mode is over twice as intense asany other in the non-CH stretch region, whereas in the smallerbasis set calculation it is half as intense as the strongest mode.With the larger basis set, the calculated intensity of the breathingmode increases to be the strongest peak in the non-CH stretch re-gion, a clear improvement over the smaller basis set calculation.In general, the overall “shape” of the larger basis set spectrumis significantly closer to the experimental than the smaller basisset, but there is still some disagreement. It would be useful to tryeven larger basis sets but it is not currently feasible for moleculesa
Bfsgmdbop
aRgdmtitCgTosbotfho
ilar. The main differences are caused by the slight differencesin frequency of the A1 and E modes produced by the breakingof the T2 modes by symmetry. There is also a small peak at∼2950 cm−1 in the methyl-pentamantane spectrum due to theCH stretching mode of the CH3 group. Studying the calculatedfrequencies and intensities in this region shows that there areRaman active modes of E symmetry that have gone over frominactive T1 modes, but their intensities are low compared to theother CH stretch modes (∼30 times weaker than the most intenseCH stretch). The lower frequency regions of the two spectra areremarkably similar, but again, there are a few cases of peak split-ting. A prime example of this is the change from a single strongT2 vibration at 1061 cm−1 in the [1(2,3)4] pentamantane spec-trum to three E modes in the methylated pentamantane spectrum,which cannot easily be assigned as corresponding to T1, T2 orE modes of the Td parent structure due to strong mode mixing.
3.3. [121] Tetramantane and [1212] pentamantane
The base tetramantane considered in this section is[121] tetramantane (C22H28, C2h), trivially called “anti-tetramantane”. [121] Tetramantane has 144 vibrational modes,40Ag + 33Au + 32Bg + 39Bu, producing a maximum of 72 Ra-man fundamentals (Fig. 6) due to the inactivity of the Bu and Aumodes. The majority of the polymantanes remaining are large(≥50 atoms) with low symmetry (≤C2v). Thus we ignore theCclcaodtwawamwa
tsntvssmatti(as
s large as [1(2,3)4] pentamantane.Recent work by Richardson et al. [18] used the Perdew–
urke–Ernzerhof generalized-gradient approximation (PBE)or the exchange and correlation functions and a very large basiset to study the Raman spectrum of [12312] hexamantane. Theeneral shape of their calculated spectrum (intense breathingode, weak CH2 scissors) is considerably better than the one
isplayed here. Test calculations using the same PBE functionalut the smaller SV basis set yield similar intensities to thosebtained with B3LYP, suggesting that the accurate intensitiesroduced by Richardson et al. are due to the basis set.
As well as [1(2,3)4] pentamantane we have also examinedn alkylated version, 3-methyl-[1(2,3)4] pentamantane C27H34.eplacing the hydrogen atom at one of the apexes with a methylroup reduces the symmetry of the molecule to C3v with the ad-ition of only three atoms, increasing the number of vibrationalodes by 9 to a total of 177, 36A1 + 23A2 + 59E. Because of
he reduction in symmetry the number of possible Raman signalsncreases from 48 to 95 (A2 not active in C3v), which is far morehan might be expected from just the addition of three atoms.omparing the spectra (Fig. 3) of these two molecules shouldive an insight to the effect of symmetry on a Raman spectrum.he reduction of symmetry is such that a T2 symmetry vibrationf a Td molecule will give rise to two vibrations, of A1 and Eymmetry, in C3v, while a T1 vibration will give rise to two vi-rations of A2 and E symmetry. This shows how a near doublingf the number of Raman active vibrations results from the addi-ion of three atoms. But do these new E symmetry modes createdrom T1 modes induce a significant change in polarisability andence produce new peaks in the spectrum? The overall shapesf the CH stretch regions of the two spectra are reasonably sim-
H stretch and CH2 twist/CH wag modes due to the growingomplication in extracting information from the increasinglyarge number of peaks in these regions. Instead, we shall con-entrate upon the very low wavenumber modes (sub 800 cm−1)s these are still easily resolvable and should be characteristicf the unique structural features of each diamondoid. All theiamondoids examined so far should be identifiable by usinghis lower wavenumber region as a fingerprint for the molecule,ith the possible exception of [1(2,3)4] pentamantane and its
lkylated derivative, which can be differentiated by the highestavenumber mode in the CH stretch region. The polymantanes
damantane through to triamantane exhibit only one very intenseode below 800 cm−1, so can be distinguished by the specificavenumber of each mode. All others should be identifiable byfew relative peak intensities and positions.
Returning to [121] tetramantane, as with the other one- orwo-dimensional diamondoids studied so far, there is a verytrong peak at 680 cm−1, but another interesting trend is alsooticeable. Comparing the area around this peak in diamantane,riamantane, and [121] tetramantane, we find there is always aery weak accompanying peak ∼50 cm−1 lower which is ab-ent in the spectrum of [1(2)3] tetramantane. If we look at theeries of molecules, diamantane, triamantane and [121] tetra-antane, (b)—(d) in Fig. 1, it is clear that on each occasion an
damantane unit is added to the end of the structure, producinghe effect of “growing” the molecule in one direction. This leadso the conclusion that the appearance of this pair of peaks is anndication that the particular diamondoid is rod-shaped (groupa) in Fig. 5) i.e. its prefix would contain only alternating onesnd twos. The nuclear displacements from the DFT calculationshow that again the ∼680 cm−1 vibration is the same breathing

688 J. Filik et al. / Spectrochimica Acta Part A 64 (2006) 681–692
Fig. 6. Experimental and calculated spectra for (from bottom) [121] tetramantane (d) and [1212] pentamantane (g). Spectra have been normalised to the most intensesignal at ∼1200 cm−1, higher intensity peaks are shown as dashed lines.
mode across a single adamantane unit, and its accompanyingpeak is also due to a CCC bend/CC stretch deformation at a dif-ferent angle (Fig. 7), so both can only occur when the moleculeis in this [1212. . . ] group.
The only rod-shaped pentamantane is obtained by the ad-dition of another unit onto the end of [121] tetramantane, andis called [1212] pentamantane (C26H32). This polymantane has168 vibrational modes, 48A1 + 36A2 + 40A1 + 44B2, all 168being Raman active due to the C2v point group (Fig. 6). Lookingat the lower wavenumber regions of the two previous molecules,triamantane and [121] tetramantane, it is apparent that apart fromsome extra structure around the 426 cm−1 peak in [121] tetra-mantane, the only obvious difference is the relative intensity ofthe peaks at ∼680 and ∼500 cm−1, with the former being far
Fig. 7. Nuclear displacements of the 680 cm−1 mode and its companion modein [121] tetramantane.
more intense in triamantane. The spectrum of [1212] pentaman-tane also satisfies the rule mentioned above, as it has a peak at∼680 cm−1 with a weaker companion ∼50 cm−1 lower, whichis characteristic of a rod-like structure.
There is also the ∼426 cm−1 line caused by other deforma-tions common to this linear structure. An interesting observa-tion is a down-shifting in wavenumber of the 352 cm−1 peakpresent in [121] tetramantane to 325 cm−1 in [1212] pentaman-tane. The calculations show that this mode involves stretchingof the molecule in the “growth” direction, hence a reduction infrequency is expected as the molecule becomes longer. What issurprising is the absence or weakness of this mode in triaman-tane compared to [121] tetramantane and [1212] pentamantane.The frequency of this particular mode may be a good indicationof length of these rod-shaped diamondoids.
3.4. [123] Tetramantane and [1234] pentamantane
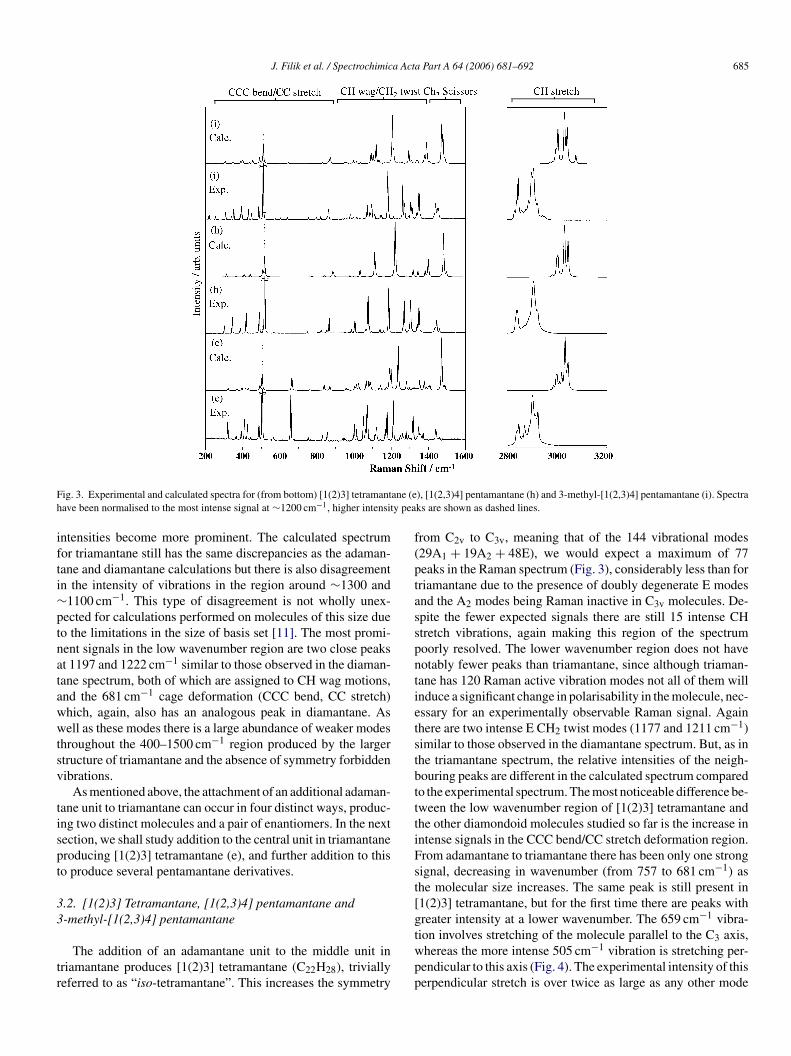
Addition of an adamantane unit to one of the four sites ontriamantane not considered so far produces one enantiomer ofthe smallest chiral diamondoid, [123] tetramantane (C22H28,C2), trivially called “skew-tetramantane”. All 144 vibrationalmodes (73A + 71B) in [123] tetramantane are Raman activewhich explains why its spectrum (Fig. 8) is considerably morestructured than those from the other tetramantanes. Even the5 −1
mtppstFt[b
00–800 cm region of the spectrum, which for the previousolecules is either free of signals (as in [1(2,3)4] pentaman-
ane) or contains the two-dimensional or rod-shaped fingerprinteak (∼680 cm−1), is starting to display more signals. As ex-ected, there is a single peak at 655 cm−1, produced by theame breathing mode across a single adamantane unit ([123]etramantane lies in the two-dimensional anisotropic group inig. 5). There is also the 516 cm−1 peak that appears in the other
wo tetramantanes which, in all cases, is related to the mode in1(2)3] tetramantane (an expansion perpendicular to what woulde the three-fold rotational axis in diamond). But now there are
J. Filik et al. / Spectrochimica Acta Part A 64 (2006) 681–692 689
Fig. 8. Experimental and calculated spectra for (from bottom) racemic [123] tetramantane (f) and racemic [1234] pentamantane (l). Spectra have been normalisedto the most intense signal at ∼1200 cm−1, higher intensity peaks are shown as dashed lines.
other modes in this region, of a similar intensity to the 655 and516 cm−1 modes. These modes are at 725 and 548 cm−1 and,again, are CCC bend/CC stretch deformations and are a fea-ture of the more complex, less symmetrical structure of [123]tetramantane.
The chiral diamondoid [1234] pentamantane (C26H32, C2)can only be formed by the addition of another adamantaneunit to [123] tetramantane, and as the name suggests, ex-tends the molecule in all three dimensions. This large, “screw-shaped”, low symmetry molecule produces 168 vibrationalmodes (84A + 84B, all Raman active) again leading to a com-plicated spectrum (Fig. 8). As with [123] tetramantane thereare several peaks in the 500–800 cm−1 region and, notably, thestrong signal at 529 cm−1. But unlike [123] tetramantane, wherethe intensity of these peaks was similar to the 516 cm−1 peak,in this case they are only approximately half as intense. Thesepeaks are throughout the “structural fingerprint” region, whichpreviously contained few peaks and was very descriptive of thestructure of the molecule in question. The prefix to this moleculeshows it extends in all three dimensions (like [1(2,3)4] penta-mantane) but where this occurred previously there were no peaksin this region. This suggests that the fingerprint hypothesis re-quires some refinement, as follows.
For a three-dimensional isotropic structure, like thetetrahedron-shaped [1(2,3)4] pentamantane, the fingerprint re-gion should be completely void of signals. The one-dimensionalrn∼tsmeasp
cal two-dimensional structures, producing signals in the 500–800 cm−1 region of the spectrum that would not be seen for asolid three-dimensional structure. Using the relative intensitiesof the mode(s) at ∼680 cm−1 compared to that of neighbouringmodes (i.e. the ∼500 cm−1 mode that appears in most spectra)it might be possible to tell the anisotropic three-dimensionalmolecules, that have only local two-dimensional structure, fromthe two-dimensional diamondoids, but the accuracy would belimited. This suggests that the fingerprint region of the spectrumis indeed diagnostic of isotropic three-dimensional, isotropictwo-dimensional disc-shaped or one-dimensional rod-like struc-tures. However, more care is needed for the more complicateddiamondoid molecules.
3.5. [12(3)4] Pentamantane, [12(1)3] pentamantane and[1213] pentamantane
This section contains three diamondoids whose structuresare as complicated, if not more complicated than the chiralpentamantane seen in the previous section. [12(3)4] Pentaman-tane (C26H32, Cs, 168 vibrational modes, 90A′ + 78A′′, all Ra-man active) can be produced by addition to either [1(2)3] or[123] tetramantane. [12(1)3] Pentamantane (C26H32, C1, 168vibrational modes, 168 A, all Raman active), is produced bythe addition of an adamantane unit to any of the three tetra-mmoAptpar
c
od-shaped ([1212. . . ] case) still stands, but there should beo strong signals in the region 500–800 cm−1 apart from the680 cm−1 mode. An isotropic two-dimensional structure, like
he disc-shaped [1(2)3] tetramantane, should only have thetrong ∼680 cm−1 line. Complications arise when globally theolecule extends in three dimensions but there are local ar-
as of two-dimensional structure. This is the three-dimensionalnisotropic case (Fig. 5(e)), as in [1234] pentamantane. Theame CCC bend/CC stretch motion that produces the singleeak in the two-dimensional structures also occurs in these lo-
antanes. [1213] Pentamantane (C26H32, C1, 168 vibrationalodes, 168 A, all Raman active), is produced by the addition
f an adamantane unit to either [121] or [123] tetramantane.ll these molecules have several peaks in the structural finger-rint region, and clearly do not fall into the rod-shaped, isotropicwo-dimensional or isotropic three-dimensional categories. Therefixes specific to each molecule describe whether they arenisotropic two- or three-dimensional, but can this also be de-ived from the Raman spectrum?
Including [1234] pentamantane in this analysis allows theomparison of four spectra, two anisotropic two-dimensional

690 J. Filik et al. / Spectrochimica Acta Part A 64 (2006) 681–692
Fig. 9. Experimental and calculated spectra for (from bottom) racemic [1213] pentamantane (k) and racemic [12(1)3] pentamantane (m) and [12(3)4] pentamantane(j). Spectra have been normalised to the most intense signal at ∼1200 cm−1, higher intensity peaks are shown as dashed lines.
molecules (Fig. 5(c), e.g. [1213] and [12(1)3]) and twoanisotropic three-dimensional molecules (Fig. 5(e), e.g. [1234]and [12(3)4]). The Raman spectra for all these molecules haveseveral signals in the structural fingerprint region (Figs. 8 and9), most due to single adamantane unit breathing vibrations inlocal regions of the molecules. Comparing the spectra of the two-dimensional molecules to the three-dimensional molecules thereis a clear difference, but in relative Raman intensities rather thanvibrational frequencies. In the spectra of the three-dimensional
structures, the intensity of the 500 cm−1 mode (breathing par-allel to the (1 1 1) face in diamond) is larger than any signalin the 200–1600 cm−1 region, whereas in the two-dimensionalmolecules spectra the intensities are similar. This suggests thatjust using this region of the spectrum it is possible to derive in-formation, even when the diamondoid structure is complex, butthis analysis is definitely becoming more difficult now that themolecules are very large and have the lowest symmetries, i.e.C1 and Cs.
tom) [
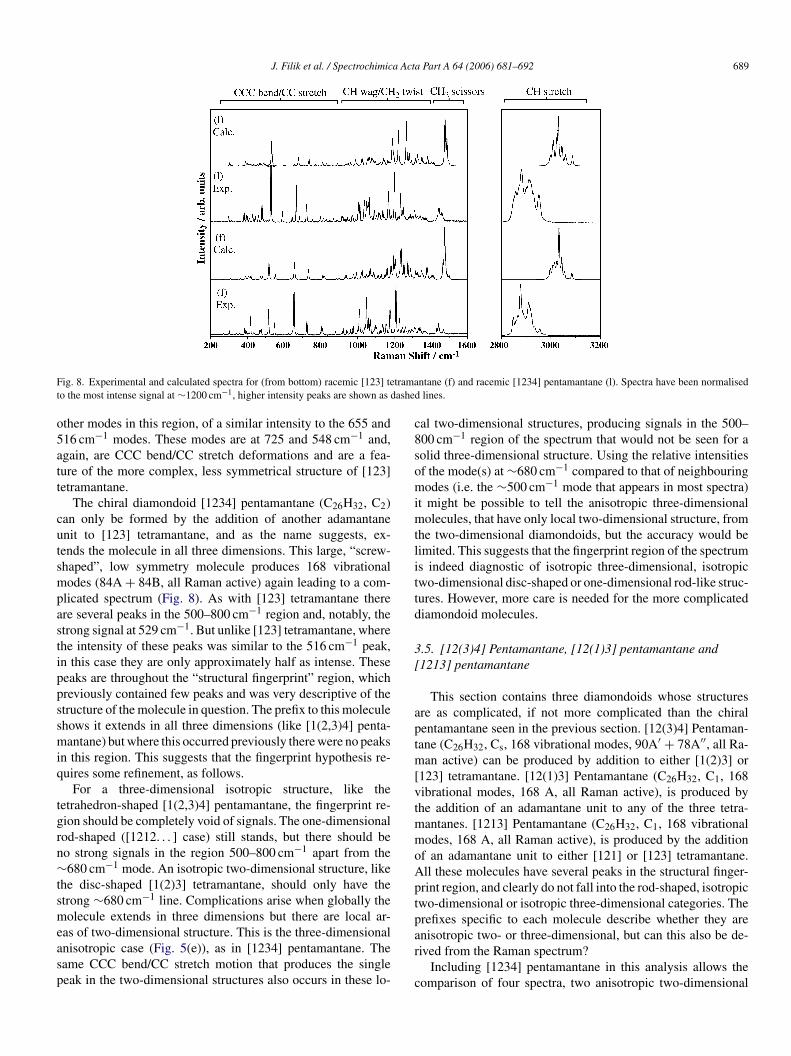
Fig. 10. Experimental and calculated spectra for (from bot 12312] hexamantane (n), and [121321] heptamantane (o).
J. Filik et al. / Spectrochimica Acta Part A 64 (2006) 681–692 691
3.6. [12312] Hexamantane and [121321] heptamantane
[12312] hexamantane (trivially called cyclohexamantane)and [121321] heptamantane could have been included in the[123] tetramantane section, being derivatives of only that par-ticular tetramantane. But, as mentioned above, the pentaman-tane that lies between them ([1231] pentamantane) has not been
Fig. 11. Structural fingerprint region of, (a) one-dimensional rod-shaped [1212]pentamantane, (b) two-dimensional isotropic disc-shaped [12312] hexamantane,(c) two-dimensional anisotropic [1213] pentamantane, (d) three-dimensionalisotropic [1(2,3)4] pentamantane, (e) three-dimensional anisotropic [1234] pen-tamantane.
isolated, possibly because of instability caused by the steric in-teraction between two of its hydrogen atoms. Because of this,and due to the relatively high symmetry of [12312] hexaman-tane, their Raman spectra shall be compared to the spectra ofother diamondoids in a more general manner.
Out of the 162 vibrational modes (17A1g + 11A1u +10A2g + 19A2u + 27Eg + 27Eu), of [12312] hexamantane(C26H30, D3d), only the 44Eg and A1g symmetry modes are Ra-man active. The highest intensity mode in the lower frequencyregion is again a mixed CH wag/CH2 twist mode of E symmetryat 1200 cm−1, which is similar to those observed in the highersymmetry molecules mentioned above. The fingerprint regionagain has a peak at 651 and 498 cm−1 due to the same CCCbend/CC stretch deformations parallel to and perpendicular tothe three-fold rotational axis as observed before in [1(2)3] tetra-mantane. [12312] Hexamantane has a two-dimensional isotropicdisc-shaped polymantane structure, and that is clearly reflectedin its Raman spectrum.
Adding another adamantane unit to [12312] hexamantaneproduces the largest diamondoid in this study, [121321] hepta-mantane (C30H34, Cs). This molecule has 186 vibrational modes(100A′ + 86A′′) all of them Raman active (Fig. 10). The Ramanspectra of [12312] hexamantane and [121321] heptamantane arereasonably similar. There are many more peaks in the [121321]heptamantane spectrum but it does have an extra 142 Ramanactive vibrational modes so this is not surprising. It might beeatpthit
4
mitcfeepa
sTawachrs
xpected that as the diamondoid molecules become larger theddition of extra adamantane units would have less effect uponhe Raman spectrum, until the only signal is the 1332 cm−1
honon of the diamond crystal, but that is much greater thanhe size of molecules dealt with here. [121321] Heptamantaneas low symmetry, but it has the same strong vibrational modesn the fingerprint region as [12312] hexamantane and is alsowo-dimensional.
. Conclusions
In this paper, we report for the first time the experimental Ra-an spectra for a broad selection of diamondoid molecules rang-
ng from adamantane to [121321] heptamantane. These spec-ra have been nearly completely assigned, by comparison withomputed vibrational frequencies and Raman intensities derivedrom density functional theory computations. Calculated andxperimental frequencies are generally in good agreement withach other, although some discrepancies arise between com-uted and observed intensities, mainly due to the relatively smalltomic basis sets used.
Each diamondoid in this study produced a unique Ramanpectrum, allowing for easy differentiation between molecules.he general features of the spectra allowed us to divide the di-mondoids into five groups based on their molecular structure,ith characteristic spectral properties for each group. Using onlysmall fingerprint region of the spectrum (550–700 cm−1) we
an identify to which group a specific diamondoid belongs, andence gain information about its structure. The one-dimensionalod-shaped diamondoids (Fig. 11(a)) are identifiable by a singletrong peak (∼680 cm−1) and weak companion peak (∼50 cm−1

692 J. Filik et al. / Spectrochimica Acta Part A 64 (2006) 681–692
lower) in this fingerprint region. The length of the rod can be es-timated from the lowest wavenumber peak. Isotropic (symmet-rical) two-dimensional diamondoids (Fig. 11(b)) should onlyhave the single strong ∼680 cm−1 peak in the fingerprint regionand should not have any weak signals between this peak andthe strong ∼500 cm−1 signal. Anisotropic (low symmetry) two-dimensional diamondoids (Fig. 11(c)) may have several peaks inthe fingerprint region but the ∼680 cm−1 peak should be weakeror as intense as the ∼500 cm−1 signal. If the ∼500 cm−1 peakis considerably more intense than the ∼680 cm−1 peak the dia-mondoid is three-dimensional anisotropic (Fig. 11(e)). The finalgroup, three-dimensional isotropic, should have no peaks in thefingerprint region (Fig. 11(d)).
Acknowledgements
The authors would like to thank M. Kuball, A. Sarua andJ. Pomeroy from the Bristol of University Physics Departmentfor use of their Renishaw inVia system, F. Claeyssens for usefuldiscussion and the EPSRC for funding.
References
[1] S. Landa, V. Machacek, Collect. Czech. Chem. Commun. 5 (1933) 1.[2] S. HaIa, S. Landa, V. Hanus, Angew. Chem. Internat. Edit. 5 (1966) 1045.[3] P.R. von Schleyer, G.A. Olah (Eds.), Cage Hydrocarbons, Wiley, New York,
1990, p. 138.
[8] A.T. Balaban, P.R. von Schleyer, Tetrahedron 34 (1978) 3599.[9] J.O. Jensen, Spectrochim. Acta A 60 (2004) 1895.
[10] P.W. May, S.H. Ashworth, C.D.O. Pickard, M.N.R. Ashfold, T. Peak,J.W. Steeds, Phys. Chem. Commun. (1998). Royal Society of ChemistryOn-line Journal. http://www.rsc.org/is/journals/current/physchemcomm/contentslists/1998/pc998001.htm.
[11] L. Bistricic, L. Pejovb, G. Baranovic, J. Mol. Struct.-Theochem. 594 (2002)79.
[12] A.C. Ferrari, J. Robertson, Phys. Rev. B 63 (2001) 121405(R).[13] L. Bistricic, G. Baranovic, K. Mlinaric-Majerski, J. Mol. Struct. 508 (1999)
207.[14] A. Kovacs, A. Szabo, J. Mol. Struct. 519 (2000) 13.[15] L. Rivas, S. Sanchez-Cortes, J. Stanicova b, J.V. Garcia-Ramos, P.
Miskovsky, Vib. Spectrosc. 20 (1999) 179.[16] J.E.P. Dahl, J.M. Moldowan, T.M. Peakman, J.C. Clardy, E. Lobkovsky,
M.M. Olmstead, P.W. May, T.J. Davis, J.W. Steeds, K.E. Peters, A. Pepper,A. Ekuan, R.M.K. Carlson, Angew. Chem. Int. Ed. 42 (2003) 2040.
[17] Y.F. Chang, Y.L. Zhao, M. Zhao, P.J. Liu, R.S. Wang, Acta Chim. Sinica62 (2004) 1867.
[18] S.L. Richardson, T. Baruah, M.J. Mehl, M.R. Pederson, Chem. Phys. Lett.403 (2005) 83.
[19] T.E. Jenkins, J. Lewis, Spectrochim. Acta 36A (1979) 259.[20] T.E. Jenkins, A.R. Bates, J. Phys. C 12 (1979) 1003.[21] M.J. Frisch, G.W. Trucks, H.B. Schlegel, G.E. Scuseria, M.A. Robb, J.R.
Cheeseman, J.A. Montgomery Jr., T. Vreven, K.N. Kudin, J.C. Burant, J.M.Millam, S.S. Iyengar, J. Tomasi, V. Barone, B. Mennucci, M. Cossi, G. Scal-mani, N. Rega, G.A. Petersson, H. Nakatsuji, M. Hada, M. Ehara, K. Toy-ota, R. Fukuda, J. Hasegawa, M. Ishida, T. Nakajima, Y. Honda, O. Kitao, H.Nakai, M. Klene, X. Li, J.E. Knox, H.P. Hratchian, J.B. Cross, C. Adamo,J. Jaramillo, R. Gomperts, R.E. Stratmann, O. Yazyev, A.J. Austin, R.Cammi, C. Pomelli, J.W. Ochterski, P.Y. Ayala, K. Morokuma, G.A. Voth,
[4] V.Z. Williams Jr., P.R. von Schleyer, G.J. Gleicher, L.B. Rodewald, J. Am.Chem. Soc. 88 (1966) 3862.
[5] W. Burns, T.R.B. Mitchell, M.A. McKervey, J.J. Rooney, G. Ferguson, P.Roberts, J. Chem. Soc., Chem. Commun. 21 (1976) 893.
[6] E. Ozawa, A. Furusaki, N. Hashiba, T. Matsumoto, V. Sing, Y. Tahara, E.Wiskott, M. Farcasiu, T. Iizuka, N. Tanaka, T. Kan, P.R. von Schleyer, J.Org. Chem. 45 (1980) 2985.
[7] J.E. Dahl, S.G. Liu, R.M.K. Carlson, Science 299 (2003) 96.
P. Salvador, J.J. Dannenberg, V.G. Zakrzewski, S. Dapprich, A.D. Daniels,M.C. Strain, O. Farkas, D.K. Malick, A.D. Rabuck, K. Raghavachari, J.B.Foresman, J.V. Ortiz, Q. Cui, A.G. Baboul, S. Clifford, J. Cioslowski, B.B.Stefanov, G. Liu, A. Liashenko, P. Piskorz, I. Komaromi, R.L. Martin, D.J.Fox, T. Keith, M.A. Al-Laham, C.Y. Peng, A. Nanayakkara, M. Challa-combe, P.M.W. Gill, B. Johnson, W. Chen, M.W. Wong, C. Gonzalez, J.A.Pople, Gaussian 03, Revision B.04, Gaussian, Inc., Pittsburgh, PA, 2003.
[22] A. Schaefer, H. Horn, R. Ahlrichs, J. Chem. Phys. 97 (1992) 2571.