ramping up brucejack scotiabank mining...
TRANSCRIPT

1
VALUE THROUGH GOLD
RAMPING UP BRUCEJACK
December 5-6, 2017Scotiabank Mining Conference
2
CAUTIONARY STATEMENT
Forward-Looking InformationThis Presentation contains “forward-looking information” and “forward looking statements” within the meaning of applicable Canadian and United States securities legislation. Forward-looking information may include, but is not limited to, the anticipated production and developments in our operations in future periods, information with respect to our planned exploration and development activities, the adequacy of our financial resources, the estimation of mineral reserves and resources including the 2016 Valley of the Kings Mineral Resource estimate, realization of mineral reserve and resource estimates and timing of development of our Brucejack Project, costs and timing of future exploration, results of future exploration and drilling, production and processing estimates, capital and operating cost estimates, timelines and similar statements relating to the economic viability of the Brucejack Mine, timing and receipt of approvals, consents and permits under applicable legislation, our executive compensation approach and practice, the composition of our board of directors and committees and adequacy of financial resources. Wherever possible, words such as “plans”, “expects”, “projects”, “assumes”, “budget”, “strategy”, “scheduled”, “estimates”, “forecasts”, “anticipates”, “believes”, “intends”, “targets” and similar expressions or statements that certain actions, events or results “may”, “could”, “would”, “might” or “will” be taken, occur or be achieved, or the negative forms of any of these terms and similar expressions, have been used to identify forward-looking statements and information. Statements concerning mineral reserve and resource estimates may also be deemed to constitute forward-looking information to the extent that they involve estimates of the mineralization that will be encountered if the property is developed. Any statements that express or involve discussions with respect to predictions, expectations, beliefs, plans, projections, objectives, assumptions or future events or performance are not statements of historical fact and may be forward-looking information. Forward-looking information is subject to a variety of known and unknown risks, uncertainties and other factors that could cause actual events or results to differ from those expressed or implied by the forward-looking information, including, without limitation, those risks identified in our Annual Information Form dated March 30, 2017 filed on SEDAR at www.sedar.com and in the United States on Form 40-F through EDGAR at the SEC’s website at www.sec.gov. Forward-looking information is based on the expectations and opinions of our management on the date the statements are made. The assumptions used in the preparation of such statements, although considered reasonable at the time of preparation, may prove to be imprecise. We do not assume any obligation to update forward-looking information, whether as a result of new information, future events or otherwise, other than as required by applicable law. For the reasons set forth above, prospective investors should not place undue reliance on forward-looking information. National Instrument 43-101Technical and scientific information contained herein relating to the Projects is derived from National Instrument 43-101 (“NI 43-101”) compliant technical reports (“Reports”), “Measured, Indicated, and Inferred Mineral Resource Update” dated July 21, 2016, “Feasibility Study and Technical Report on the Brucejack Project, Stewart, BC” dated June 19, 2014, “Mineral Reserve Update” dated December 15, 2016, “capital cost update” dated February 3, 2017, and . We have filed the Reports and Update under our profile at www.sedar.com. Technical and scientific information not contained within the Reports for the Projects have been prepared under the supervision of Mr. Ivor W.O. Jones, M.S.c., FAusIMM, Cpgeo, Mr. Kenneth C. McNaughton, P.Eng., Ian Chang, P.Eng., Mr. Russell Pennel, B.A.S.c., P.Eng., and Mr. Lyle Morgenthaler, B.A.S.c., P.Eng. each of whom is an independent “qualified person” under NI 43-101.This presentation uses the terms “measured resources”, “indicated resources” (together “M&I”) and “inferred resources”. Although these terms are recognized and required by Canadian regulations (under NI 43-101), the United States Securities and Exchange Commission does not recognize them. Mineral resources which are not mineral reserves do not have demonstrated economic viability. The estimate of mineral resources may be materially affected by environmental, permitting, legal, title, taxation, socio-political, marketing, or other relevant issues. There is no guarantee that all or any part of the mineral resource will be converted into mineral reserves.In addition, “inferred resources” have a great amount of uncertainty as to their existence, and economic and legal feasibility. It cannot be assumed that all or any part of an inferred mineral resource will ever be upgraded to a higher category. Under Canadian rules, estimates of inferred mineral resources may not form the basis of feasibility or pre feasibility studies, or economic studies, except for a Preliminary Assessment as defined under NI 43-101. Investors are cautioned not to assume that part or all of an inferred resource exists, or is economically or legally mineable. CurrencyUnless otherwise indicated, all dollar values herein are in Canadian $.

3
High-grade underground gold mine in British Columbia, Canada
Ramping up production
Local and regional exploration potential

4
BRUCEJACK LOCATION
5
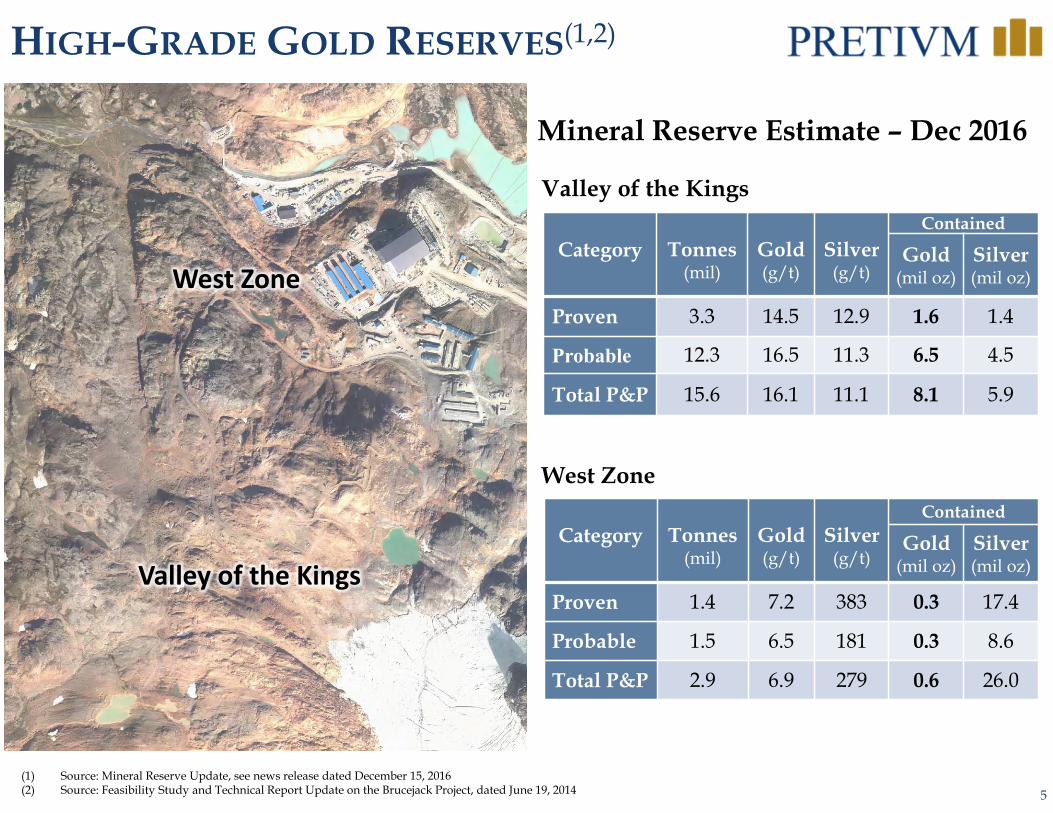
HIGH-GRADE GOLD RESERVES(1,2)
Category Tonnes(mil)
Gold(g/t)
Silver(g/t)
Contained
Gold(mil oz)
Silver(mil oz)
Proven 1.4 7.2 383 0.3 17.4
Probable 1.5 6.5 181 0.3 8.6
Total P&P 2.9 6.9 279 0.6 26.0
Valley of the Kings
West Zone
(1) Source: Mineral Reserve Update, see news release dated December 15, 2016(2) Source: Feasibility Study and Technical Report Update on the Brucejack Project, dated June 19, 2014
Category Tonnes(mil)
Gold(g/t)
Silver(g/t)
Contained
Gold(mil oz)
Silver(mil oz)
Proven 3.3 14.5 12.9 1.6 1.4
Probable 12.3 16.5 11.3 6.5 4.5
Total P&P 15.6 16.1 11.1 8.1 5.9
Mineral Reserve Estimate – Dec 2016
West Zone
Valley of the Kings
6
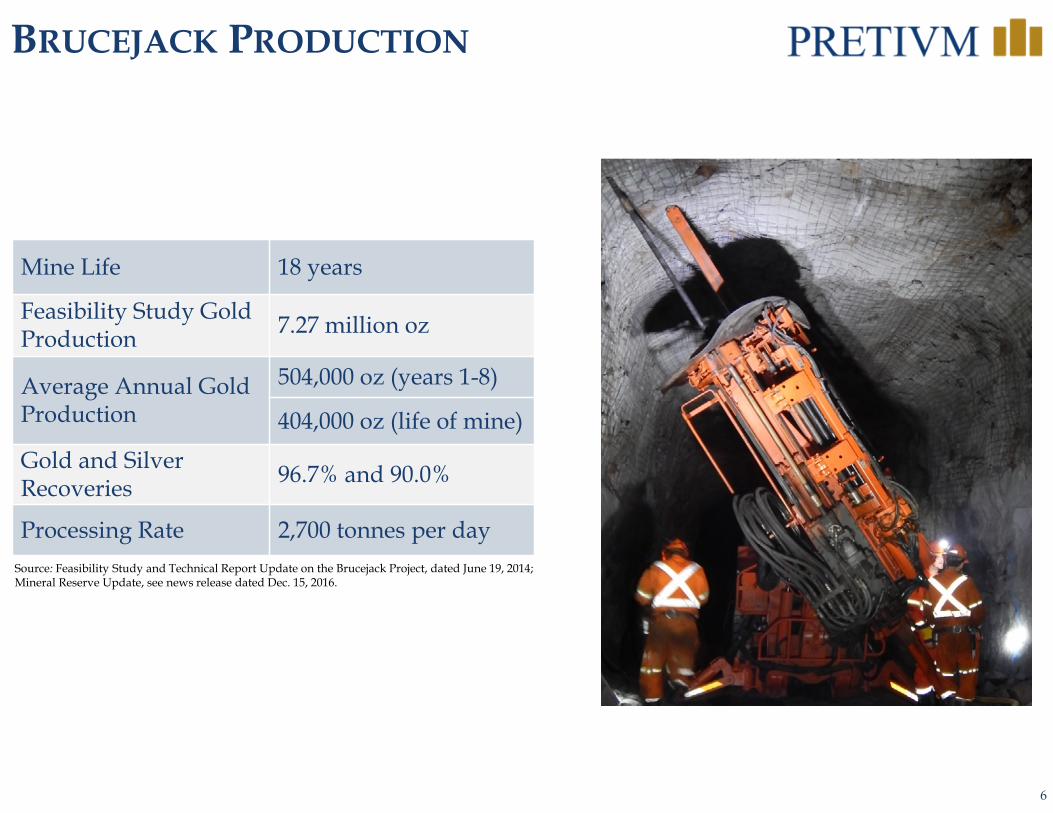
BRUCEJACK PRODUCTION
Source: Feasibility Study and Technical Report Update on the Brucejack Project, dated June 19, 2014; Mineral Reserve Update, see news release dated Dec. 15, 2016.
Mine Life 18 years
Feasibility Study Gold Production 7.27 million oz
Average Annual Gold Production
504,000 oz (years 1-8)
404,000 oz (life of mine)Gold and Silver Recoveries 96.7% and 90.0%
Processing Rate 2,700 tonnes per day
7
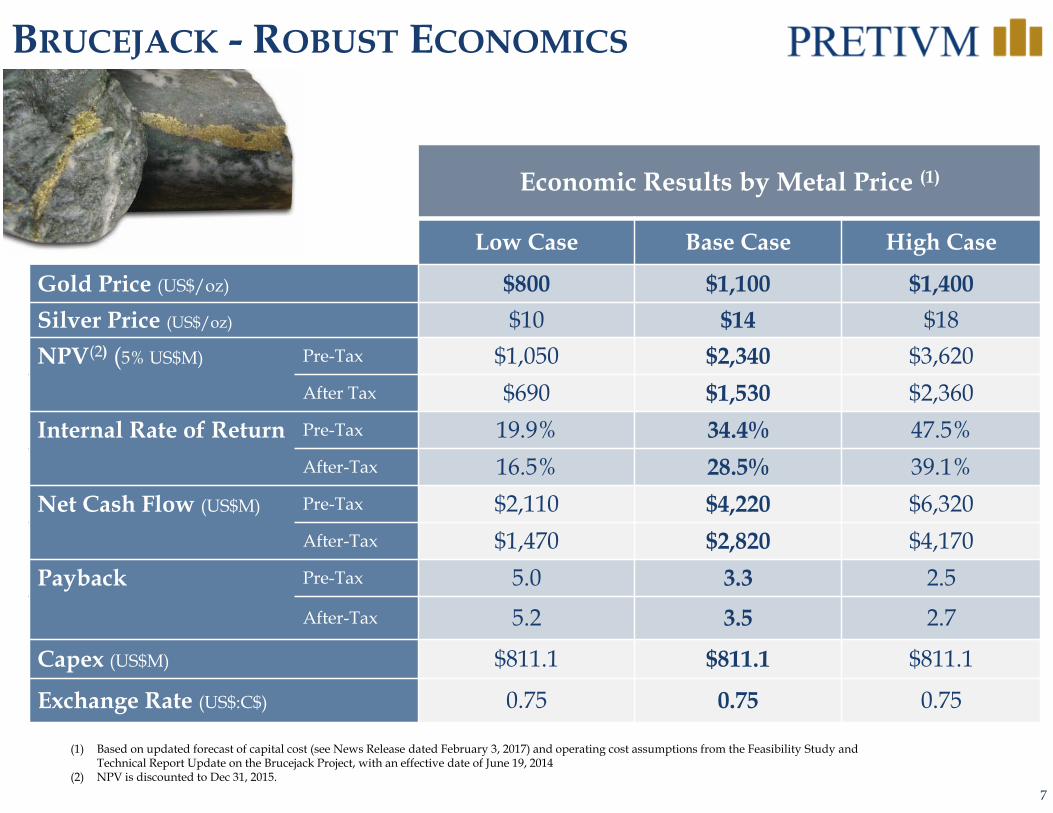
BRUCEJACK - ROBUST ECONOMICS
(1) Based on updated forecast of capital cost (see News Release dated February 3, 2017) and operating cost assumptions from the Feasibility Study and Technical Report Update on the Brucejack Project, with an effective date of June 19, 2014
(2) NPV is discounted to Dec 31, 2015.
Economic Results by Metal Price (1)
Low Case Base Case High Case
Gold Price (US$/oz) $800 $1,100 $1,400Silver Price (US$/oz) $10 $14 $18NPV(2) (5% US$M) Pre-Tax $1,050 $2,340 $3,620
After Tax $690 $1,530 $2,360Internal Rate of Return Pre-Tax 19.9% 34.4% 47.5%
After-Tax 16.5% 28.5% 39.1%Net Cash Flow (US$M) Pre-Tax $2,110 $4,220 $6,320
After-Tax $1,470 $2,820 $4,170Payback Pre-Tax 5.0 3.3 2.5
After-Tax 5.2 3.5 2.7
Capex (US$M) $811.1 $811.1 $811.1
Exchange Rate (US$:C$) 0.75 0.75 0.75

8
MILL COMMISSIONING & RAMP-UP
2017 Focus:
MAY: Wet commissioning complete
JUNE: Increase in production rate. First gold pour.
JULY: Achieved commercial processing rate. Produced 25,392 oz of gold in June/July from low-grade stockpiles, development muck and the addition of stope ore.
AUGUST: Continued mill optimization. Continued addition of stope ore.
SEPTEMBER: Produced 82,203 oz of gold in the first quarter of production. Throughput averaged 2,840 tpd with a head grade of 10.5 g/t. Mill optimization complete
4th QUARTER 2017 > Ramp-up production. Initiate grade control system.

9
FIRST FULL QUARTER PRODUCTION
Source: See News Release dated Nov 10, 2017
3rd Quarter 2017
Gold Produced 82,203 ozMill Feed Grade 10.52 g/tGold Recovery Rate 96.49 %Ore Milled 261,262 tAverage Milled Per Day 2,840 t/dGold Sold 55,413 oz
Third Quarter 2017 Operating Results

10
FIRST FULL QUARTER PRODUCTION
Source: See News Release dated Nov 10, 2017. Currency US$
3rd Quarter 2017
Revenue $70.9 MEarnings from Mine Operations $26.0 MWorking Capital $7.2 MAdjusted Earnings $8.3 M
Per Share Adjusted Earnings $0.05/shareTotal Cash Costs $656/oz soldAll-in Sustaining Cost $788/oz sold
Third Quarter 2017 Financial Summary

11
LOCAL EMPLOYMENT
Brucejack Mine Workforce
As of Sept 2017
78% British Columbia
50% NW British Columbia
30% First Nations
12
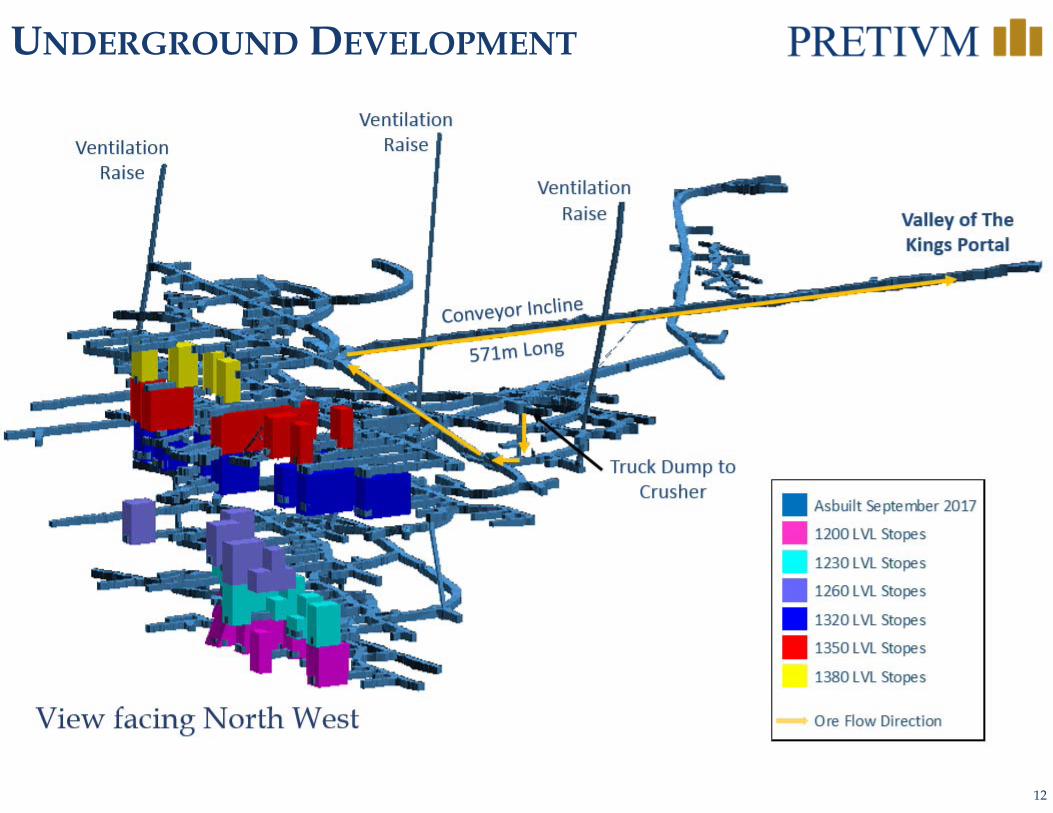
UNDERGROUND DEVELOPMENT
Asbuilt September 2017
1200 LVL Stopes
1230 LVL Stopes
1260 LVL Stopes
1320 LVL Stopes
1350 LVL Stopes
1380 LVL Stopes
Ore Flow DirectionView facing North West
Valley of The Kings Portal
Ventilation Raise
Ventilation Raise
VentilationRaise
Truck Dump to Crusher
13
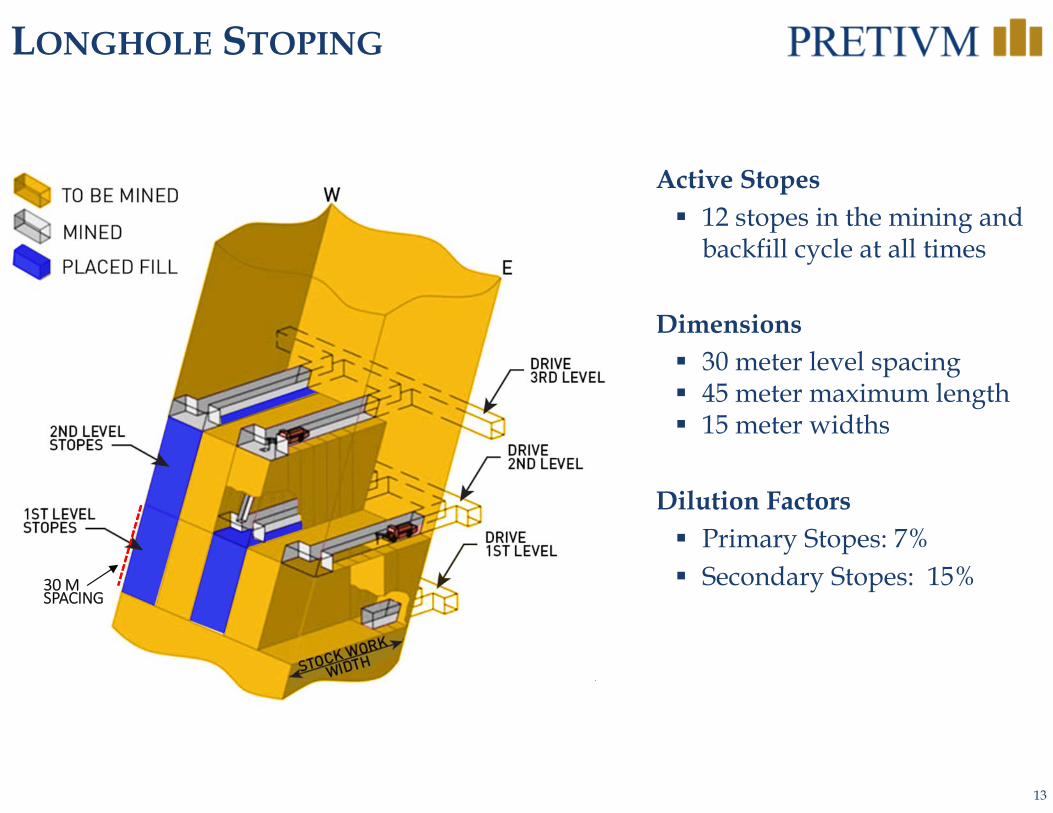
LONGHOLE STOPING
Active Stopes 12 stopes in the mining and
backfill cycle at all times
Dimensions 30 meter level spacing 45 meter maximum length 15 meter widths
Dilution Factors Primary Stopes: 7% Secondary Stopes: 15%30 M
SPACING

14
PRODUCTION GRADE CONTROL

15
MILL BUILDING
VOK Portal
Mill
Camp
Waste RockDisposal
Contact WaterPond
West ZonePortal

16
PROCESSING FLOW SHEET
55% FROM CONCENTRATE
45% FROM GRAVITY
(1) Source: Feasibility Study and Technical Report Update on the Brucejack Project, dated June 19, 2014.
96.7% GOLD RECOVERY (LOM)
17
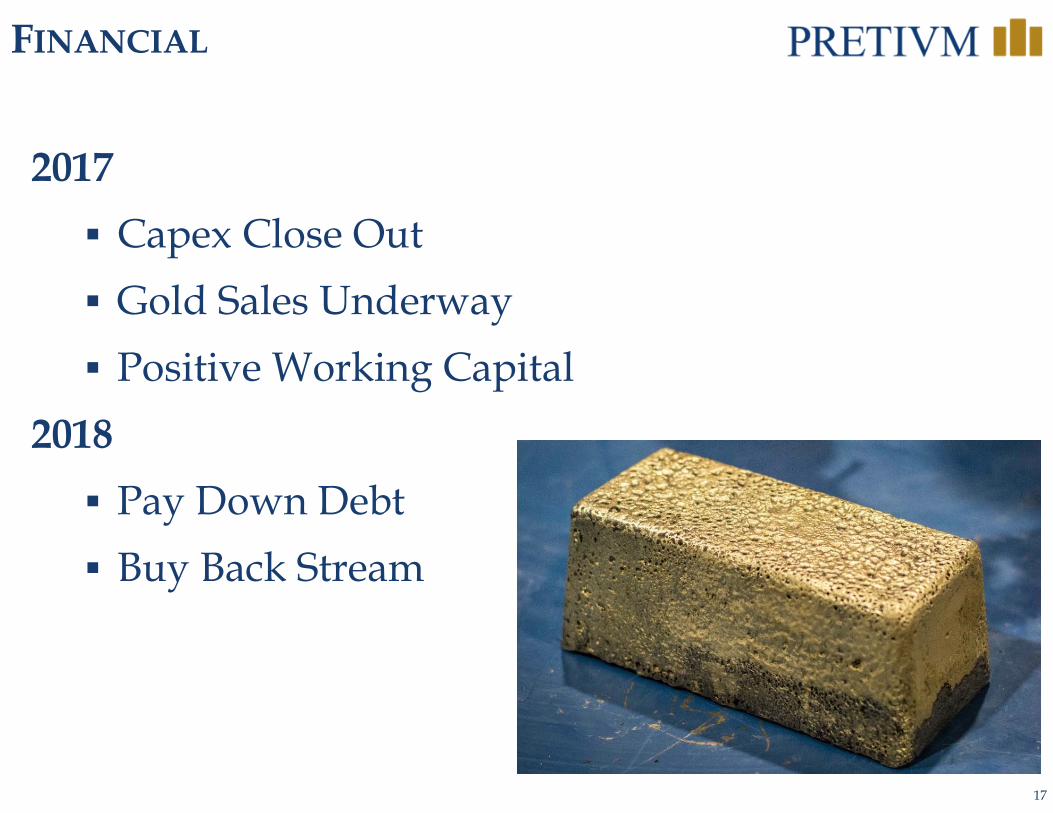
FINANCIAL
2017 Capex Close Out Gold Sales Underway Positive Working Capital
2018 Pay Down Debt Buy Back Stream
18
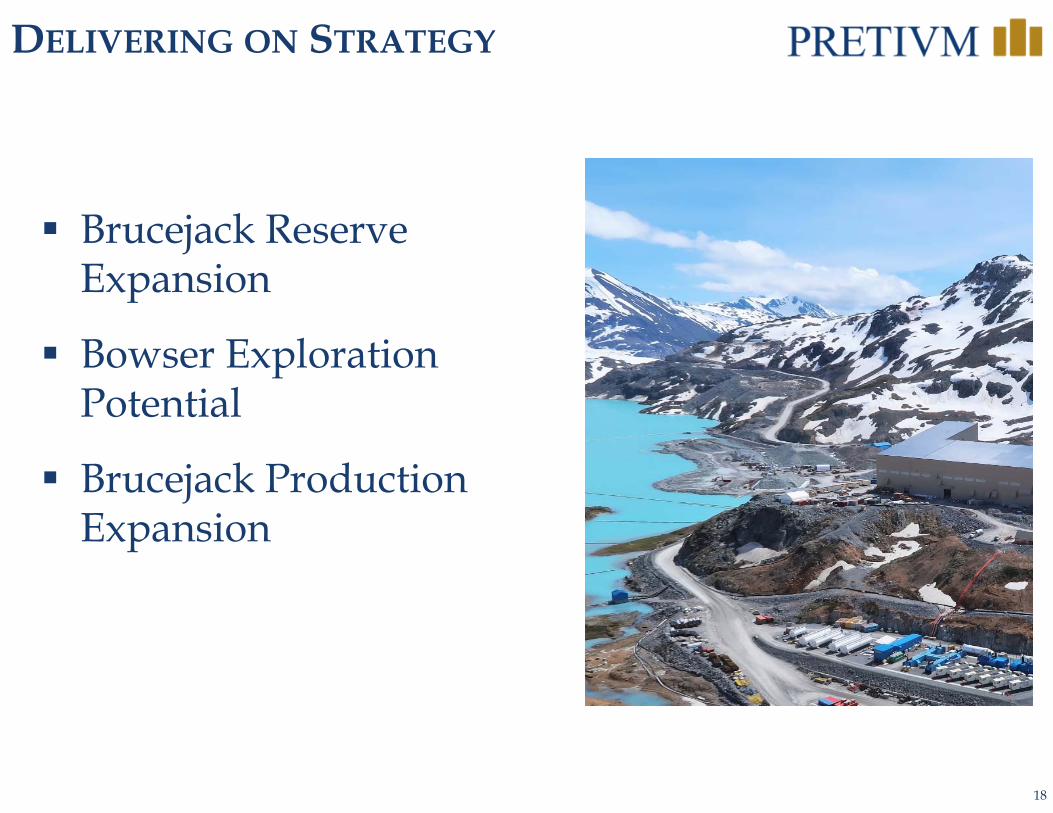
DELIVERING ON STRATEGY
Brucejack Reserve Expansion
Bowser Exploration Potential
Brucejack Production Expansion

19
RESERVE EXPANSION
N
250 m
1Outline of Measured, Indicated, and Inferred Mineral Resource as at 21 July 2016.2Outline of Proven and Probable Mineral Reserve, based on 19 June 2014 Updated Feasibility Study.
SU-658
SU-661
SU-654
SU-668
2.05m @ 2,100 g/t Au(Includes 0.5m @ 8,600 g/t Au)
1.18m @ 10.75 g/t Au
9.0m @ 21.87 g/t Au(Includes 0.5m @ 203 g/t Au)
1.5m @ 16.9 g/t Au
0.5m @ 137 g/t Au
Mineral Resource1
Mineral Reserve2
Exploration PotentialDrill Intercepts

20
5km
BOWSER REGIONAL EXPLORATIONSURFACE SAMPLING
20172016201520142011/13 Pre 2011
NN
Boulder Zone
Koopa Zone
American Creek Zone
5 km

21
PRODUCTION EXPANSION
22
Construction Commissioning Commercial Production Completion Date Processing Stope Ore Targeting Steady State
Production - End of Q4
RAMPING UP PRODUCTION

23
SHAREHOLDING & ANALYST COVERAGE
(1) As of December 1, 2017; ownership calculated on an undiluted basis.(2) As of December 1, 2017. Source: IPREO & SEDI.
Top Shareholders(2)` (% S/O)
Black Rock Asset Management 13.7Van Eck Associates 10.9SSR Mining 5.0Zijin Mining 5.0Liberty Mutual Group 4.1M&G Investment Management 3.0BMO Asset Management 3.0Sun Valley Gold 2.6Orion Mine Finance 2.5Anchor Bolt Capital 2.4Pretivm Management 1.9
Equity Structure(1)(shares in millions)
Issued & Outstanding 182.1Fully Diluted 188.0
Market Cap (Dec 1, 2017) US$1.956 B
Analyst CoverageBMO Andrew KaipCanaccord Genuity Eric ZaunscherbCIBC Jeff KilleenCiti Alexander HackingCormark Securities Richard GrayCredit Suisse Robert ReynoldsGlobal Mining Research David CotterellH.C. Wainwright Heiko F. IhleNumis Jonathan GuyRBC Dan RollinsRoth Capital Partners Joseph ReagorScotiabank Ovais Habib

24
Brucejack Mine
PVG : TSX/NYSEpretivm.com
Pretium Resources Inc.Suite 2300 – 1055 Dunsmuir St.Four Bentall CentrePO Box 49334Vancouver, BC, Canada V7X 1L4
Phone: 604-558-1784Fax: 604-558-4784Toll-free: 1-877-558-1784