randomization in practice dr. eric p. bettinger stanford university and nber may 10, 2010
TRANSCRIPT
Randomization in PracticeDr. Eric P. Bettinger
Stanford University and NBER
May 10, 2010
Presentation Goals
1. Why Do We Care About Impact Evaluation?
2. What Constitutes “Impact Evaluation”?3. How can the Design of Educational
Interventions Facilitate Evaluation?4. What Data are Required for Successful
Evaluation?5. Other Considerations in Impact
Evaluation

Policy Example: Financial Aid for School
Student Aid Programs are Diverse Merit-based Grant Aid, Need-based
Grant Aid, Loans, Tax Credits, Work-Based Credits
Effects Differ Across Aid Programs Proper Mix of Programs Depends on
Goals of Policy Timely Data on Efficacy is Essential to
Success“Policy has to be made one way or
another. I prefer to do it with data.” - Former Head of Ohio’s Higher Educational System

Experimentation and The Learning Organization: A Virtuous Cycle
Evaluate
Innovate
Experiment
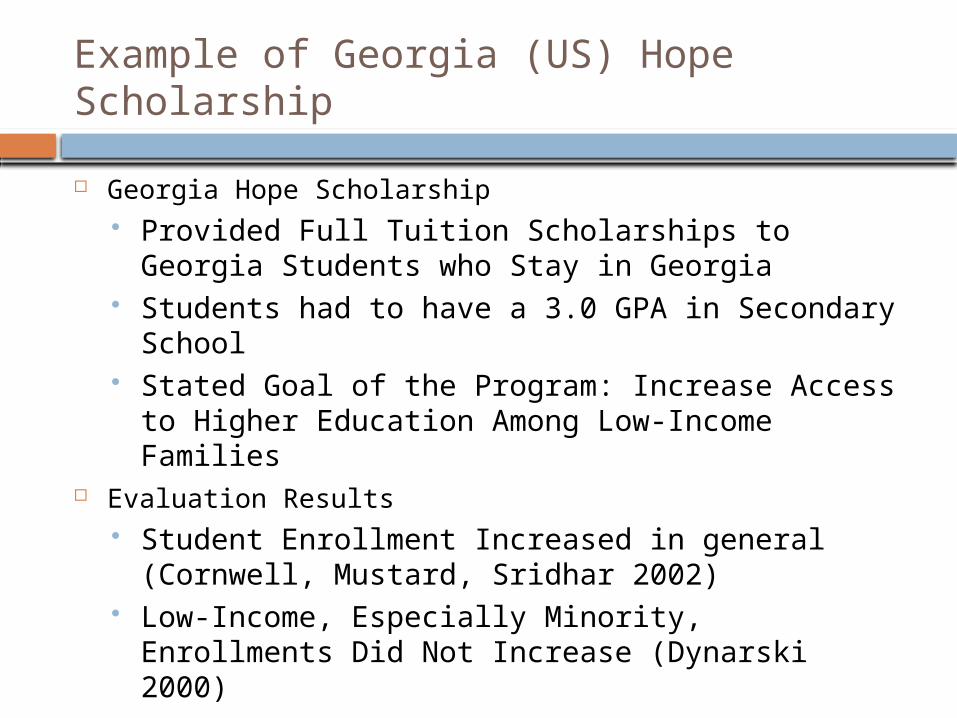
Example of Georgia (US) Hope Scholarship
Georgia Hope Scholarship Provided Full Tuition Scholarships to Georgia
Students who Stay in Georgia Students had to have a 3.0 GPA in Secondary
School Stated Goal of the Program: Increase Access to
Higher Education Among Low-Income Families Evaluation Results
Student Enrollment Increased in general (Cornwell, Mustard, Sridhar 2002)
Low-Income, Especially Minority, Enrollments Did Not Increase (Dynarski 2000)

Example of Georgia (US) Hope Scholarship (cont.)
Gap Between Goal and Impact Goal: Increase Access for Low-Income Impact: Increase Access for Middle- and Upper-
Income Families but not Lower-Income Why the Failure?
Hope Rewarded Academic Performance HOPE Required Complex Forms Higher Income Families Have
Better Secondary School Performance Greater Access to College Information
How did Evaluation Impact Policy? Academic Performance Requirement was
Reduced Application Process Simplified

Value of Impact Evaluation
Assess Overall Effectiveness Without Evaluation, There is Only “Conjecture and
Criticism” (Phipps 1998) Alignment and Modifications of Policies
Georgia Hope Example Unexpected Benefits and Consequences Identifying Specific Programmatic Elements
Policy Preservation Social Security Student Benefit Program (US)
Improved Student College Attendance and Completion (Dynarski 2000)
Cancelled in 1982 Example of Colombia PACES Program
Voucher Program was Highly Effective Cancelled Before Evaluation Conducted

How Do We Conduct Impact Evaluation?
1. Comparison Strategy (“Identification Strategy”) Research is About Comparing What
Happened to What Might Have Happened
2. Data Detailed Data on Program
Implementation and Use Data on Student Outcomes

Comparison Strategy
Core of Evaluation is Comparison Program effect is difference between
observed outcome and outcome that would have happened without the program
Counterfactual outcome is never observed We cannot observe the same student with and
without aid Comparison group represents the
counterfactual Not all comparison groups are created
equal

Forming a Comparison Group Randomization is “Gold Standard”
Policymaker randomly chooses among applicants to a program
Students chosen in the lottery receive aid Students not chosen in lottery do not
receive aid On average, lottery winners and losers
appear similar at the time of the lottery Over time, any differences in lottery
winners and losers show the effects of the program

Other Frequently Used Comparison Strategies
Matched Comparison Comparison group is similar students
without aid Natural Experiments
Threshold analysis (i.e. Regression-Discontinuity)
“Natural” randomization

Example of Randomization
Angrist, Lang & Oreopoulos (2006) Large Canadian university Multiple Services
Program providing support services to new college students (e.g. Tutoring)
Financial incentive for grade point average in college
700 students applied Program managers used random lottery to
assign students to level of treatment

Pre-Lottery Similarities in High School Grades
0.0
2.0
4.0
6.0
8
65 70 75 80 85 90 95High School Grade Average Used for University Admission
Control SFP/SFSP

Post-Lottery Differences in Grade Point Average (Women)
0.0
1.0
2.0
3.0
4
30 35 40 45 50 55 60 65 70 75 80 85 90 95First Term Grade Average
Control SFP/SFSP

Support for Randomization
United States No Child Left Behind Law (2001) Ties school funding to “scientifically-based research
which “is evaluated using experimental or quasiexperimental designs in which individuals, entities, programs, or activities are assigned to different conditions and with appropriate controls to evaluate the effects of the condition of interest, with a preference for random-assignment experiments “
World Bank (2003): “Randomized designs are generally the most robust
of the evaluation methodologies"

Another Example of Randomization: Colombia’s PACES Program Colombia Educational Voucher Program
Provided subsidies for students to attend private secondary schools
Targeted low-income families About 125,000 students benefited Demand for vouchers exceeded supply Used lotteries to award vouchers Ran from 1992-1998

Colombia PACES
Preliminary Evidence Based on Matching Schools Matched private voucher schools to public
schools with similar characteristics Compared school-level outcomes Inexpensive evaluation using school-level
data KEY CONCLUSION: No difference between
voucher private schools and public schools in test scores.
Conclusion is Difficult to Defend
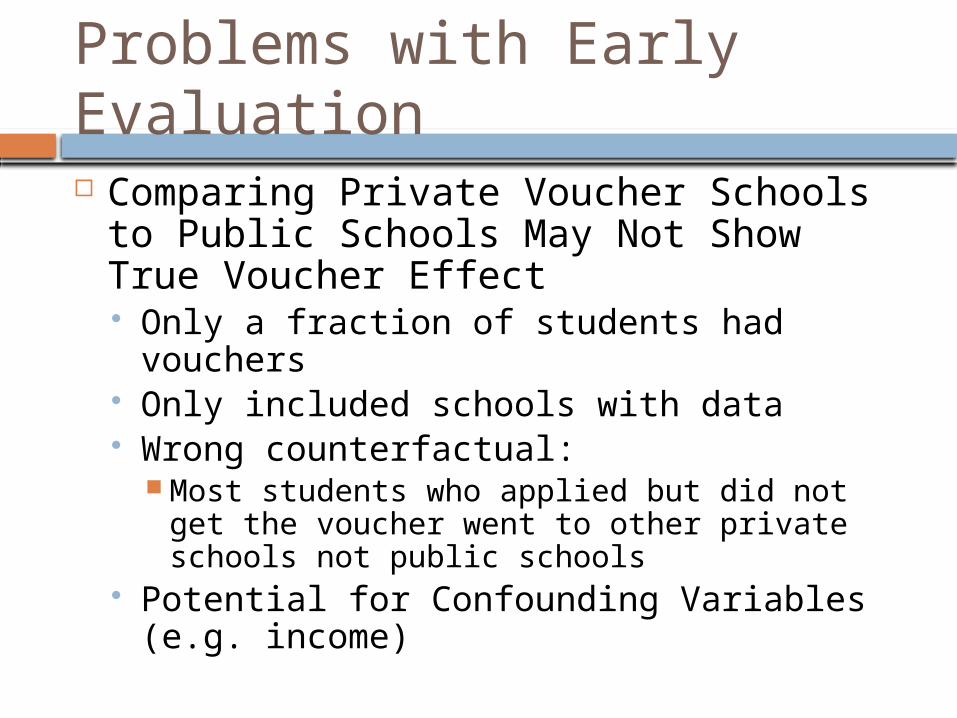
Problems with Early Evaluation Comparing Private Voucher Schools to
Public Schools May Not Show True Voucher Effect Only a fraction of students had vouchers Only included schools with data Wrong counterfactual:
Most students who applied but did not get the voucher went to other private schools not public schools
Potential for Confounding Variables (e.g. income)
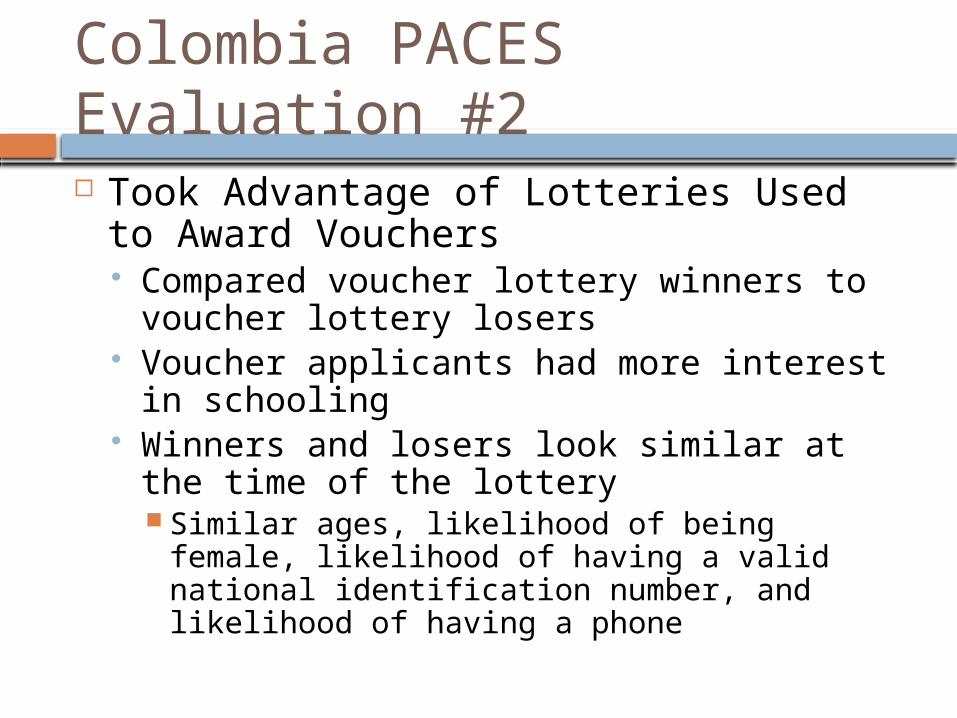
Colombia PACES Evaluation #2 Took Advantage of Lotteries Used to
Award Vouchers Compared voucher lottery winners to
voucher lottery losers Voucher applicants had more interest in
schooling Winners and losers look similar at the time
of the lottery Similar ages, likelihood of being female,
likelihood of having a valid national identification number, and likelihood of having a phone

Colombia PACES – Evaluation Results
Evidence After Three Years Shows that Voucher Winners Have: Higher test scores More years of schooling completed Less grade repetition Lower rate of working in the labor market Lower rate of marriage or cohabitation
After Six Years: 20 percent increase in college attendance Higher test scores on college entrance exams
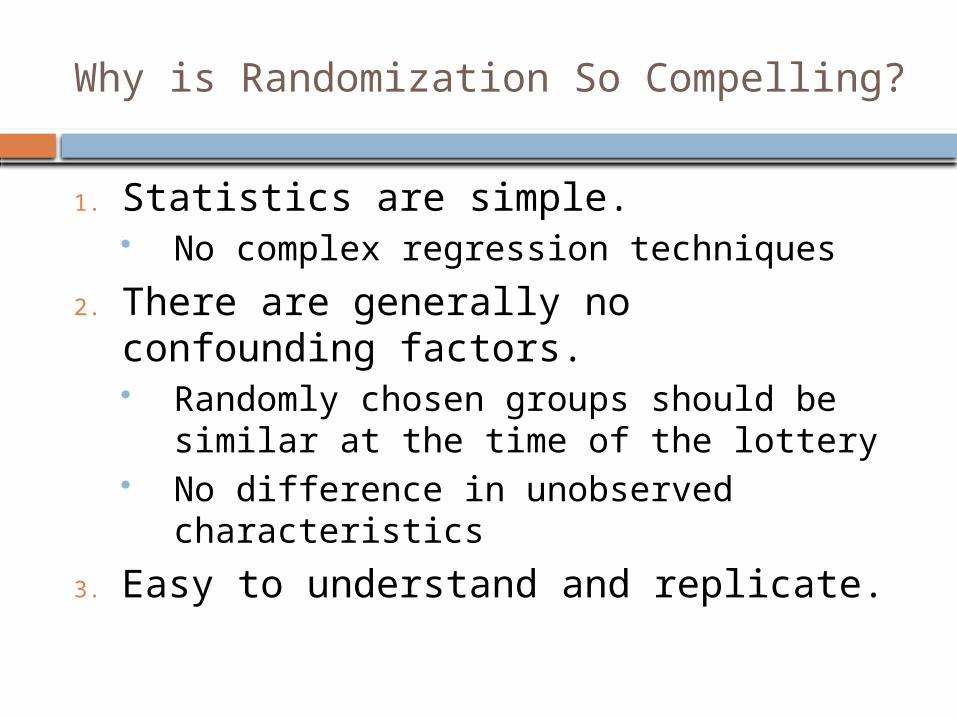
Why is Randomization So Compelling?
1. Statistics are simple. No complex regression techniques
2. There are generally no confounding factors. Randomly chosen groups should be
similar at the time of the lottery No difference in unobserved
characteristics
3. Easy to understand and replicate.
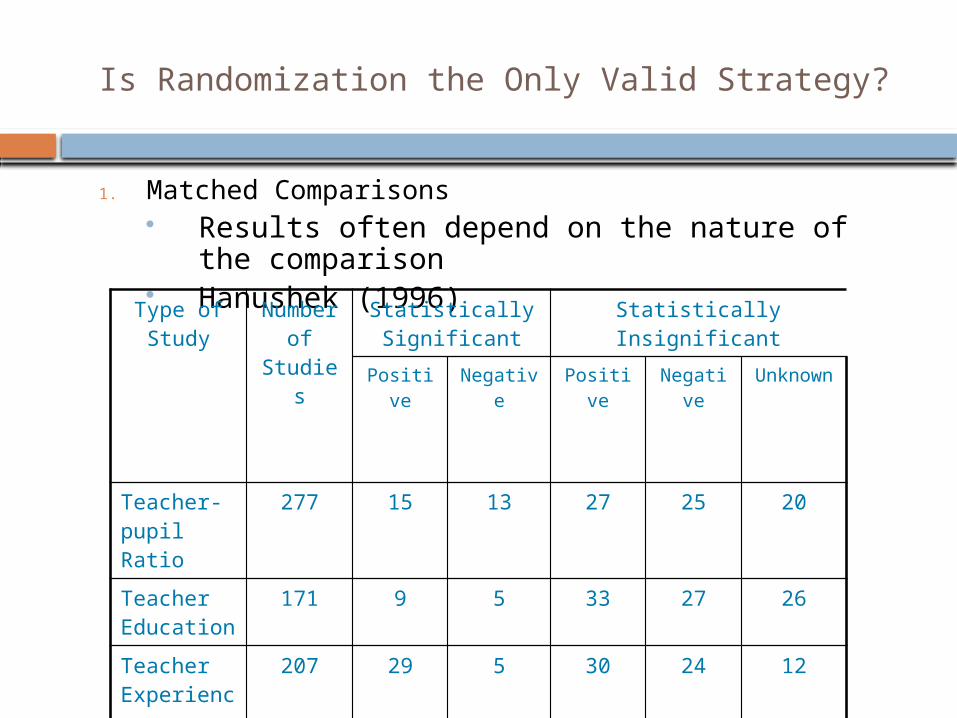
Is Randomization the Only Valid Strategy?
1. Matched Comparisons Results often depend on the nature of the
comparison Hanushek (1996)Type of Study
Number of
Studies
Statistically Significant
Statistically Insignificant
Positive Negative Positive Negative Unknown
Teacher-pupil Ratio
277 15 13 27 25 20
Teacher Education
171 9 5 33 27 26
Teacher Experience
207 29 5 30 24 12
Expenditure per Pupil
163 27 7 34 19 13

Matching Strategies: Example Classic Debate on Class Size in
Secondary School• Hanushek (1986, 1989, 1996, 1997,
1998) Uses matching. Finds no consistent effect of class size on
student achievement.• Krueger (2003)
Uses randomization in Tennessee Finds large positive effects of class size

Why the Difference?
Krueger: “not all estimates are created equal” Krueger quoting Galileo:
‘I say that the testimony of many has little more value than that of few, since the number of people who reason well in complicated matters is much smaller than that of those who reason badly. If reasoning were like hauling I should agree that several reasoners would be worth more than one, just as several horses can haul more sacks of grain than one can. But reasoning is like racing and not like hauling, and a single Barbary steed can outrun a hundred dray horses.’
“Tennessee’s Project STAR is the single Barbary steed in the class size literature”

Other Strategies
2. Threshold Analysis Aid is often awarded if students meet a certain
criteria Income under a certain threshold Test scores above a specific level
Students near the threshold are very similar Random reasons why some are just over the mark
Compare students just above and below the threshold
Threshold Analysis is Part of a Larger Class of “Natural Experiments” Where Researchers Identify Situations or Policies that Seem to Generate Randomization

Threshold Analysis Example: California College Grant
California College Grant Awards Kane (2003) Guaranteed admission based on high
school grade point average Awarded Full Tuition Income eligibility requirement. Discontinuity around 3.15
Students above received full benefit Students below received none

Were people similar around the discontinuity?

Did the Discontinuity Lead to Changes in Outcomes?

Another Example of Threshold Analysis
Social Security Benefit Program (Dynarski 2000) Provided tuition for college for students
whose parent had died Liberal tuition policy Abruptly cancelled in 1982 Discontinuity was in year of graduation
Pre-1982: Aid to families with deceased parent Post-1982: No Aid to families with deceased
parent

Social Security Benefit Program Aid by Year

Percentage of Students Attending College
Father Not Deceased
Father Deceased
Finished Secondary School 1979-1981
.54 .63
Finished Secondary School 1982-83
.49 .32
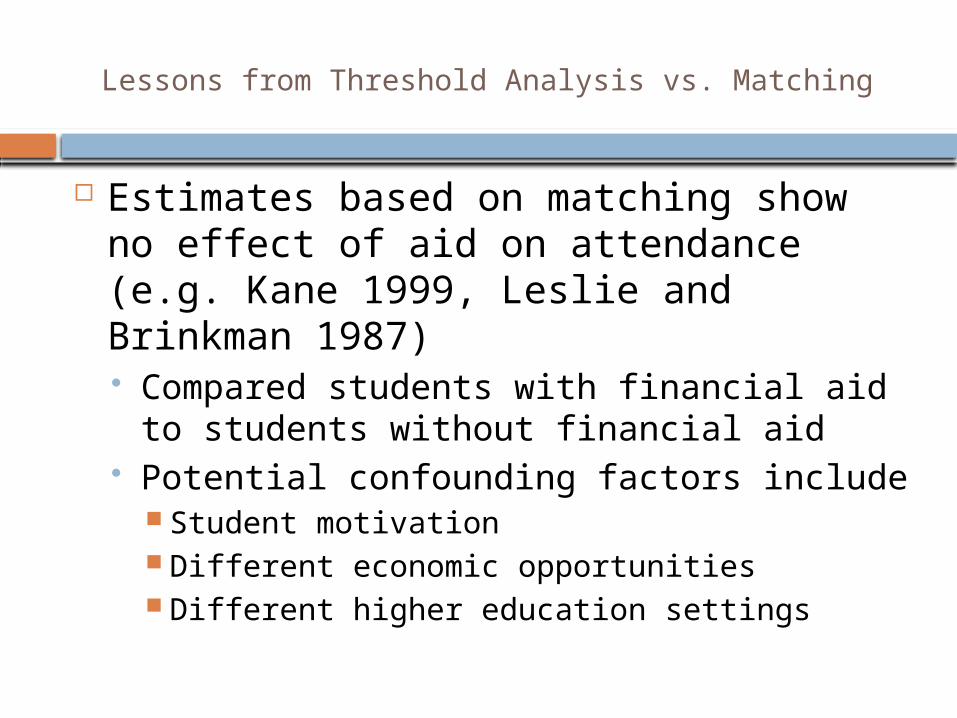
Lessons from Threshold Analysis vs. Matching
Estimates based on matching show no effect of aid on attendance (e.g. Kane 1999, Leslie and Brinkman 1987) Compared students with financial aid to
students without financial aid Potential confounding factors include
Student motivation Different economic opportunities Different higher education settings

Need-Based Aid in a New Light More “Scientifically Based” Research:
Dynarski (2000): Aid has dramatic influence
Kane (2003): Aid increased attendance rate Bettinger (2004): Need-based aid
decreased college drop-out rate

“Bottom Line”
Research Depends on the Quality of Comparisons Not all comparisons are equal Some comparisons provide information
BUT, may hide confounding factors Randomization is the “Gold Standard” in
Evaluation Easy to understand Not susceptible to confounding factors

Data Requirements
Implementation Details Who Participates How Much Aid Do They Receive When Did They Receive It Duration of Benefits Baseline Information on Participants
Costs to Losing this Information Colombia PACES example

Data Requirements (cont.)
Outcome Data Outcomes that realistically matter
College Attendance College Completion Major Choice Earnings
Method of Collecting It Survey Administrative Records

Data Requirements (cont.)
“If you build it, they will come” – Field of Dreams (1989) Creating data on outcomes attracts
researchers Often the question leads to data collection Often the data lead to the question
Quantity of research leads to increased demand for research quality Creates additional research capacity Increases political will for rigorous evaluation

Considerations in Policy Evaluation Timing of Evaluation
Gap Between Start and Production of Evidence Cost of Evaluation
Cost of Program, Evaluation, Data Collection Ethical Considerations
Provision of the Service Right of Privacy
Political Feasibility of Evaluation Lant Pritchett: “No advocate would want to engage
in research that potentially undermines support for his/her program. Endless, but less than compelling, controversy is preferred to knowing for sure.”

So How Does One Take on Rigorous Evaluation?
1. Plan Ahead Impossible to use randomization after the fact Creating and developing data collection
instruments takes time2. Consult People Who Know Research
Colombia Department of National Planning example
3. Take a Risk Evaluation is risky. It may be that the program
does not work, but knowing a policy’s strengths can lead to even better policies.

Experimentation and The Learning Organization: A Virtuous Cycle
Evaluate
Innovate
Experiment

Conclusion
Impact Evaluation is Essential to Understanding the Strengths and Weaknesses of Public Policy Not all evaluations are created
equal Comparisons based on random
assignment are “the most robust” methodology
Evaluation Requires Good Data Systems Implementation and Outcome Data Plan for gathering data