range estimation for the nissan leaf and … · range estimation for the nissan leaf and tesla...
TRANSCRIPT

Proceedings of the
ITRN2011 31st August – 1st September, University College Cork
Hayes, De Oliveira, Vaughan, Egan: EV Range
RANGE ESTIMATION FOR THE NISSAN LEAF AND TESLA ROADSTER USING SIMPLIFIED POWER TRAIN MODELS
R. Pedro R. de Oliveira University College Cork Sean Vaughan University College Cork John G. Hayes Senior Lecturer
University College Cork Abstract In this paper, simplified EV power train models are used to estimate range for the Nissan Leaf and the Tesla Roadster. The models are compared with published manufacturer specifications for range under various route and driving conditions, and for various drive cycles. The models are validated against test results for the Nissan Leaf and Tesla Roadster vehicles, where the test route topography is modelled using Google Earth and a GPS-based smart-phone application. Excellent correlations are demonstrated between the experimental results and manufacturer data and the vehicle models. Impacts of battery degradation with time and vehicle HVAC loads are considered in the study.
I. INTRODUCTION
In recent years, there has been significant societal interest in the development, production
and sale of electric vehicles. Announcements occur regularly on proposed new product
introductions into the automotive marketplace. Electric vehicles can range from the hybrid-
electric vehicle (HEV) technologies currently on the market such as the Toyota Prius and
Honda Insight to the new production battery electric vehicles (BEV) such as the Nissan Leaf,
the Mitsubishi iMiEV and the Tesla Roadster, to the extended-range electric vehicle (EREV)
Chevy Volt [11]. Key factors in customer acceptance of the new technologies will be the cost
and range of the battery electric vehicles.
Significant information has been published on BEV performance by manufacturers, the
Environmental Protection Agency (EPA), and by the public on the internet. On-going vehicle
testing is providing additional information. The information provided often is not consistent
and some customization is required in order to predict vehicle range under the various
driving conditions. For example, driving range results are presented for the Nissan Leaf on
the company website and are presented in Table I [1]. The nominal range for the EPA LA4
drive cycle is quoted by Nissan and is given at 100 miles. The EPA sticker cites a range of
73 miles based on a standardized five-cycle test [3].
Given the inherent range limitations of BEVs and associated driver anxiety, it is necessary
to estimate vehicle range for varied sets of battery, road and driving conditions. The purpose
of this paper is to present the range estimations using the simplified power train models
developed in [13]. The models are compared to published range information and on-going
road tests.

Hayes, De Oliveira, Vaughan, Egan: EV Range 31st August – 1st September, University College Cork
Proceedings of the
ITRN2011
TABLE I
RANGE ESTIMATES FOR NISSAN LEAF [1]
Driving
condition
Average Speed Temperature Range
Climate
Control
mph km/h °F °C mi km
EPA LA4 20 31 68-86 20-30 100 160 Off
Ideal driving
conditions
38 61 68 20 138 221 Off
Highway, summer 55 88 95 35 70 112 AC
Stop-and-go, winter 15 24 14 -11 62 99 Heat
EPA five-cycle test Varying Varying 73 117 Varying
Vehicle auxiliary loads for heating, ventilation, and air conditioning (HVAC) can restrict
vehicle range significantly. Based on the stop-and-go winter conditions above in Table I, it is
estimated that the maximum heating load is approximately 6 kW for the Nissan Leaf.
Similarly, it appears that that the maximum AC load is 6 kW for the highway summer driving
condition. Thus, driving in extreme temperature conditions can result in significant range
reduction and significant HVAC is required for the passenger cabin and for the batteries.
LiIon batteries require significant thermal management in order to meet the automotive
lifetime specifications and various management approaches are implemented [5, 6].
In [13] an understanding of the vehicle power train and vehicle performance under various
conditions is used to develop a vehicle model. The vehicle range characteristics for various
drive conditions and topographies can then be easily derived. Given the significant
information available in the public domain for the Nissan Leaf and Tesla Roadster, these two
vehicles are initially investigated. Range estimations are available for the Roadster in [10],
while [9] refers to the use of a 4 kW heater for the Roadster.
The simplified electric vehicle models are briefly discussed in Section II. Section III
discusses the drive cycles and simulation results. Section IV presents Nissan Leaf test
results. The Tesla Roadster is discussed in Section V.
II. ELECTRIC VEHICLE MODELS
A significant body of literature and a wide variety of software tools are available for vehicle
modeling [7, 8]. For this study, the power train models are implemented using EXCEL and
are easily implemented using other mathematical software. See [13] for greater detail on the
power train models.

Proceedings of the
ITRN2011 31st August – 1st September, University College Cork
Hayes, De Oliveira, Vaughan, Egan: EV Range
DRIVE CYCLES AND SIMULATION OUTPUTS
There are many types of standardized drive cycles used around the world. The US EPA
uses a combined five-cycle test [3] based on dynamometer testing. There are four basic
cycles: FTP, HFET, US06 and SC03. The fuel economy is based on testing under various
temperature conditions. The FTP cycle is a longer variation of the LA4 drive cycle quoted by
Nissan in their literature. The FTP drive cycle is as shown in Fig. 1.
0
10
20
30
40
50
60
0 500 1000 1500 2000
Time (s)
Sp
eed
(m
ph
)
Speedmph
Fig. 1. EPA FTP drive cycle
The five-cycle tests are based on the internal combustion engine and many of the
variations on the testing do not appear directly applicable to EVs. The authors of this paper
are calculating the EPA range based on slight modifications of the procedures described in
Section III of [3]. The formulae from [3] are used to generate a range or fuel consumption
and are as outlined below. The formulae include an adjustment factor of 9.5 % to allow for
non-dynamometer effects. An additional assumption of an adjustment of 20 % for battery
degradation is also made by the authors. A feature of the Nissan Leaf is that the long-life
mode can be enabled in order to set the maximum state of charge at 80 % and so extend
battery life [12].
The model is used to generate the mileage available using the specified battery energy.
The energies required for traction and braking are easily calculated. Using regenerative
braking, a certain proportion of the braking energy is regenerated. As mentioned, the
calculation of the five-cycle fuel economy is dependent on various temperatures, starting,
soak, and running conditions. The authors in this study neglect the effects of starting and the
calculation of the rating is purely based on the running fuel economy. These assumptions
are reasonable for an EV.
The mileage and fuel economy ratings for the city, highway, and combined five-cycle tests
are simplified in this study from those presented in [3] and are as follows:
=0.905×1
City FERunning FC
(1)
where the factor 0.905 represents the adjustment factor due to real road conditions, FC is the fuel consumption in kWh/mile, and FE is the fuel economy in mile/kWh or range in miles for a given battery pack size. The city Running FC is given by
0.89 0.11 0.18=0.82× + +
1 1+0.133×1.083 -
Running FCFTP US06 FTP
SC03 FTP
(2)
where FTP, US06, HFET, and SC03 represent the fuel consumption in kWh/mile for the
related drive cycle.
Similarly, the Highway mileage range and fuel economy ratings are developed as follows:
=0.905×1
Highway FERunning FC
(3)

Hayes, De Oliveira, Vaughan, Egan: EV Range 31st August – 1st September, University College Cork
Proceedings of the
ITRN2011
The Highway Running FC is given by
0.79 0.21=1.007× +
1 1+0.133×0.377 -
Running FCUS06 HFET
SC03 FTP
(4)
The 5-cycle fuel economy and range is then simply the addition of the City and Highway
driving ranges.
=0.43 0.575 cycleFE City FE Highway FE (5)
The following table calculates the consumption and mileage based on regenerating 30 %
of the braking energy. The SC03 drive cycle is calculated using continuous full HVAC power.
TABLE II
CONSUMPTION AND RANGE FOR THE NISSAN LEAF
Cycle kWh/mile Range Range, 80%
LA4 0.24 101 81
FTP 0.24 100 80
HFET 0.22 110 88
US06 0.32 74 59
SC03 0.53 45 36
City 0.24 99 79
Highway 0.27 88 70
5-cycle 0.26 93 74
VUT 0.25 97
The results presented in Table II show an excellent correlation with the published data. For
30 % regeneration of braking energy, the model predicts a range of 101 miles correlating
well to the Nissan prediction of 100 miles. A range of 74 miles is the model prediction for the
EPA 5-cycle range. Allowing for a battery degradation to 80%, this correlates well to the EPA
sticker range of 73 miles. The SC03 test under full HVAC indicates that a range less than 40
miles is likely with a degraded or long-life-mode battery and full HVAC at extreme
temperatures.
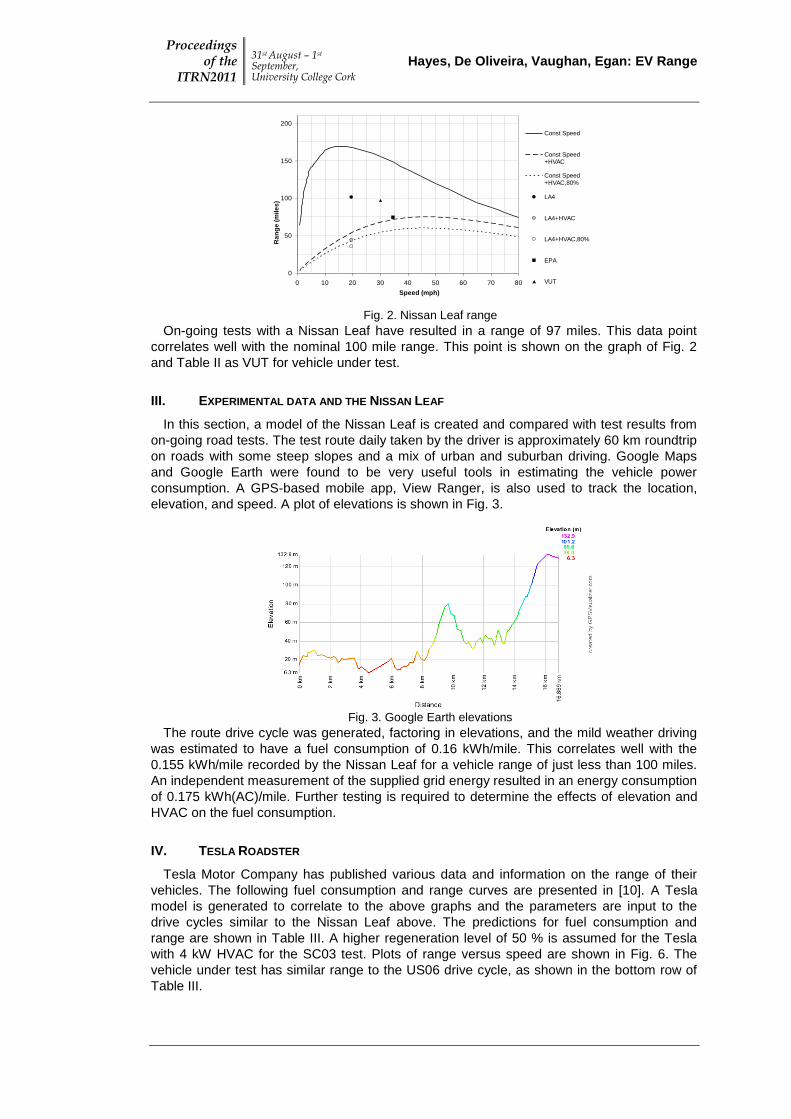
Based on the model developed above, graphs of range versus speed are generated for
the Nissan Leaf as shown in Fig.2.
The curves show the ideal vehicle range for a fixed speed as the upper curve, the middle
curve assumes a significant HVAC load of 6 kW for the Leaf for extreme temperature
conditions. There is a significant reduction in vehicle range as has been suggested in the
Nissan Leaf literature. The lower curve reduces the extreme temperature range to 80 % to
allow for battery degradation with time or long-life mode. As can be seen, the HVAC can
have a very significant impact on the achievable range. Overall range will reduce with time
due to battery degradation.
The graph also shows the range for the LA4 and EPA drive cycles at their respective
average speeds. The LA4 range of about 100 miles for the Leaf can drop to about 44 miles
with full HVAC and close to 35 miles with battery degradation or long-life mode.
Proceedings of the
ITRN2011 31st August – 1st September, University College Cork
Hayes, De Oliveira, Vaughan, Egan: EV Range
0
50
100
150
200
0 10 20 30 40 50 60 70 80
Speed (mph)
Ra
ng
e (
mile
s)
Const Speed
Const Speed+HVAC
Const Speed+HVAC,80%
LA4
LA4+HVAC
LA4+HVAC,80%
EPA
VUT
Fig. 2. Nissan Leaf range
On-going tests with a Nissan Leaf have resulted in a range of 97 miles. This data point
correlates well with the nominal 100 mile range. This point is shown on the graph of Fig. 2
and Table II as VUT for vehicle under test.
III. EXPERIMENTAL DATA AND THE NISSAN LEAF
In this section, a model of the Nissan Leaf is created and compared with test results from
on-going road tests. The test route daily taken by the driver is approximately 60 km roundtrip
on roads with some steep slopes and a mix of urban and suburban driving. Google Maps
and Google Earth were found to be very useful tools in estimating the vehicle power
consumption. A GPS-based mobile app, View Ranger, is also used to track the location,
elevation, and speed. A plot of elevations is shown in Fig. 3.
Fig. 3. Google Earth elevations
The route drive cycle was generated, factoring in elevations, and the mild weather driving
was estimated to have a fuel consumption of 0.16 kWh/mile. This correlates well with the
0.155 kWh/mile recorded by the Nissan Leaf for a vehicle range of just less than 100 miles.
An independent measurement of the supplied grid energy resulted in an energy consumption
of 0.175 kWh(AC)/mile. Further testing is required to determine the effects of elevation and
HVAC on the fuel consumption.
IV. TESLA ROADSTER
Tesla Motor Company has published various data and information on the range of their
vehicles. The following fuel consumption and range curves are presented in [10]. A Tesla
model is generated to correlate to the above graphs and the parameters are input to the
drive cycles similar to the Nissan Leaf above. The predictions for fuel consumption and
range are shown in Table III. A higher regeneration level of 50 % is assumed for the Tesla
with 4 kW HVAC for the SC03 test. Plots of range versus speed are shown in Fig. 6. The
vehicle under test has similar range to the US06 drive cycle, as shown in the bottom row of
Table III.

Hayes, De Oliveira, Vaughan, Egan: EV Range 31st August – 1st September, University College Cork
Proceedings of the
ITRN2011
Wh/mile vs. Speed
0
50
100
150
200
250
300
350
400
450
500
550
600
650
700
0 5 10 15 20 25 30 35 40 45 50 55 60 65 70 75 80 85 90 95 100 105 110 115 120 125
mph
Wh
/mil
e
Fig. 4. Tesla Roadster fuel economy [10]
Range vs. Speed
0
25
50
75
100
125
150
175
200
225
250
275
300
325
350
375
400
425
450
0 5 10 15 20 25 30 35 40 45 50 55 60 65 70 75 80
mph
mil
es
Fig. 5. Tesla Roadster Range [10]
TABLE III
CONSUMPTION AND RANGE FOR THE TESLA ROADSTER
Cycle kWh/mile Range Range, 80%
LA4 0.22 242 194
FTP 0.22 243 194
HFET 0.22 245 196
US06 0.30 175 140
SC03 0.41 129 103
City 0.22 243 195
Highway 0.26 204 164
5-cycle 0.24 221 177
VUT 0.32 166

Proceedings of the
ITRN2011 31st August – 1st September, University College Cork
Hayes, De Oliveira, Vaughan, Egan: EV Range
0
50
100
150
200
250
300
350
400
450
0 10 20 30 40 50 60 70 80
Speed (mph)
Ra
ng
e
Const Speed
Const Speed+HVAC
Const Speed+HVAC,80%
LA4
LA4+HVAC
LA4+HVAC,80%
EPA
Fig. 6. Tesla Roadster range
V. CONCLUSIONS
In this paper, simplified EV power train models are used to estimate range for the Nissan
Leaf and Tesla Roadster. The models are compared with published manufacturer
specifications for range under various route and driving conditions, and for various drive
cycles. The test route topography is modeled using Google Earth and a GPS-based mobile
app. Excellent correlations are demonstrated between the experimental results,
manufacturer data and the model predictions. Impacts of battery degradation with time and
vehicle HVAC loads are considered in the study.
ACKNOWLEDGMENT
The authors wish to thank Prof. Gerry Wrixon for the Nissan Leaf road testing, and Peter
Harte and Celine McInerney for the Tesla Roadster testing.
REFERENCES
[1] Nissan Motor Corporation website, www.nissanusa.com [2] Environmental Protection Agency website, www.epa.gov [3] US EPA, “Fuel Economy of Motor vehicle Revisions to Improve Calculation of Fuel
Economy Estimates,” December 2006. [4] http://www.fueleconomy.gov/feg/fe_test_schedules.shtml [5] C. Park, A.K. Jaura, “Dynamic Thermal Model of Li-Ion Battery for Predictive Behavior in
Hybrid and Fuel Cell Vehicles,” SAE 2003-01-2286. [6] C. Mi, L. Ben, D. Buck, N. Ota, “Advanced Electro-Thermal Modeling of Lithium-Ion
Battery System for Hybrid Electric Vehicle Applications,” IEEE VPPC 2007. [7] M. Ehsani, Y. Gao, A. Emadi, Modern Electric, Hybrid Electric and Fuel Cell Vehicles:
Fundamentals, Theory, and Design, 2nd
Edition, CRC Press, 2009. [8] AVL, www.avl.com [9] B. Randall, “Blowing hot and cold,” www.teslamotors.com/blog/blowing-hot-and-cold.
Dec. 2006. [10] J.B. Staubel, CTO, “Roadster efficiency and range,”
www.teslamotors.com/blog/roadster-efficiency-and-range, Dec. 2008. [11] E.D Tate, M.O. Harpster, P.J. Savagian, “The electrification of the automobile: from
conventional hybrid to plug-in hybrids, and extended-range electric vehicles,” SAE 2008-01-0458.
[12] 2011 Nissan Leaf Owner’s Manual [13] J.G. Hayes, R.P.R. de Oliveira, S. Vaughan, M.G. Egan, “Simplified Electric Vehicle
Power Train Models and Range Estimation,” IEEE Vehicular Power and Propulsion Conference, Chicago, September, 2011.