range wide monitoring of the mojave d tortoise …
TRANSCRIPT

RANGE-WIDE MONITORING OF
THE MOJAVE DESERT
TORTOISE (GOPHERUS
AGASSIZII)
2010 ANNUAL REPORT
PREPARED BY LINDA ALLISON
DESERT TORTOISE MONITORING COORDINATOR
US FISH AND WILDLIFE SERVICE
SEPTEMBER 2012
Recommended Citation US Fish and Wildlife Service 2012 Range-wide Monitoring of the Mojave Desert Tortoise (Gopherus agassizii) 2010 Annual Report Report by the Desert Tortoise Recovery Office US Fish and Wildlife Service Reno Nevada
Erratum Table 7 was corrected and replaced on 10 June 2013
TABLE OF CONTENTS
Executive Summary 5 Introduction 8 Methods 9
Study areas and transect locations 9 Transect completion 11
Modification of previous procedures 13 Proportion of tortoises available for detection by line distance sampling G0 15 Field observer training 16
Telemetry training 16 Distance sampling training 16
Data management including quality assurance and quality control 19 Tortoise encounter rate and development of detection functions 20 Proportion of available tortoises detected on the transect centerline g(0) 21 Estimates of tortoise density 22 Estimating the area of each stratum sampled and the number of tortoises in that area 24
Modification of previous procedures 25 Debriefing to describe strengths and weaknesses of project preparation and execution 25
Results 25 Field observer training 25
Proportion of tortoises detected at distances from the transect centerline 25 Quality assurance and quality control 30 Transect completion 30 Tortoise encounter rates and detection functions 36 Proportion of tortoises available for detection by line distance sampling G0 39 Proportion of available tortoises detected on the transect centerline g(0) 39 Estimates of tortoise density 40 Area of each stratum sampled and the number of tortoises in that area 42
Evaluating transect classification 42 Proportion of each stratum walked 43
Debriefing to identify strengths and weaknesses in preparation for future years 45 Need for more central responsibility for planning data 45 Training improvements to make more effective use of same time period 45 Current hardware is less trustworthy and cannot utilize improved software 45 Not all QAQC errors remedied by the end of field season 45
Discussion 45 Sampling representatively in all monitoring strata 45 Training developments 46 Improving ability to detect trends in desert tortoise abundance 46
Literature Cited 47
i
LIST OF TABLES
Table 1 Training schedule for 2010 17 Table 2 Proportion of tortoise models detected within 1- 2- or 5-m of the transect centerline
Values that scored below the target of 090 at 1- or 2-m are highlighted 26 Table 3 Diagnostics for individual teams after training 27 Table 4 Number and type of transects in each stratum Stratum abbreviations as in Fig 1 31 Table 5 Availability of tortoises (G0) during the period in 2010 when transects were walked in
each group of neighboring strata 39 Table 6 Recovery unit and stratum-level encounters and densities in 2010 for tortoises with
Table 7 Estimated density of desert tortoises in monitored areas of each recovery unit in the MCL ge 180mm 41
Mojave and Colorado deserts in 2010 42 Table 8 Transects completed other than as planned and any resulting reclassification 42 Table 9 Proportion of each stratum that can be sampled Stratum abbreviations as in Fig 1 43 Table 10 Estimated tortoise abundance in sampled areas of each stratum The ldquoproportion
sampledrdquo column is based on evaluation of all transects in the sample set from 2008 through 2011 Stratum abbreviations as in Fig 1 44
LIST OF FIGURES
Figure 1 Sampled areas 2010 10 Figure 2 Planned (dotted lines) and reflected transect paths at administrative boundaries now
also applied to stratum edges A) One-corner reflection B) Two-corner reflection 14 Figure 3 Data flow from collection through final products 20 Figure 4 Relationship between single-observer detections (by the leader p) and dual-observer
(team) detections g(0) 22 Figure 5 Process for developing density estimates in 2010 For each type of estimate the full set
of data was subdivided appropriately USFWS (1994) recovery units are used for this analysis 23
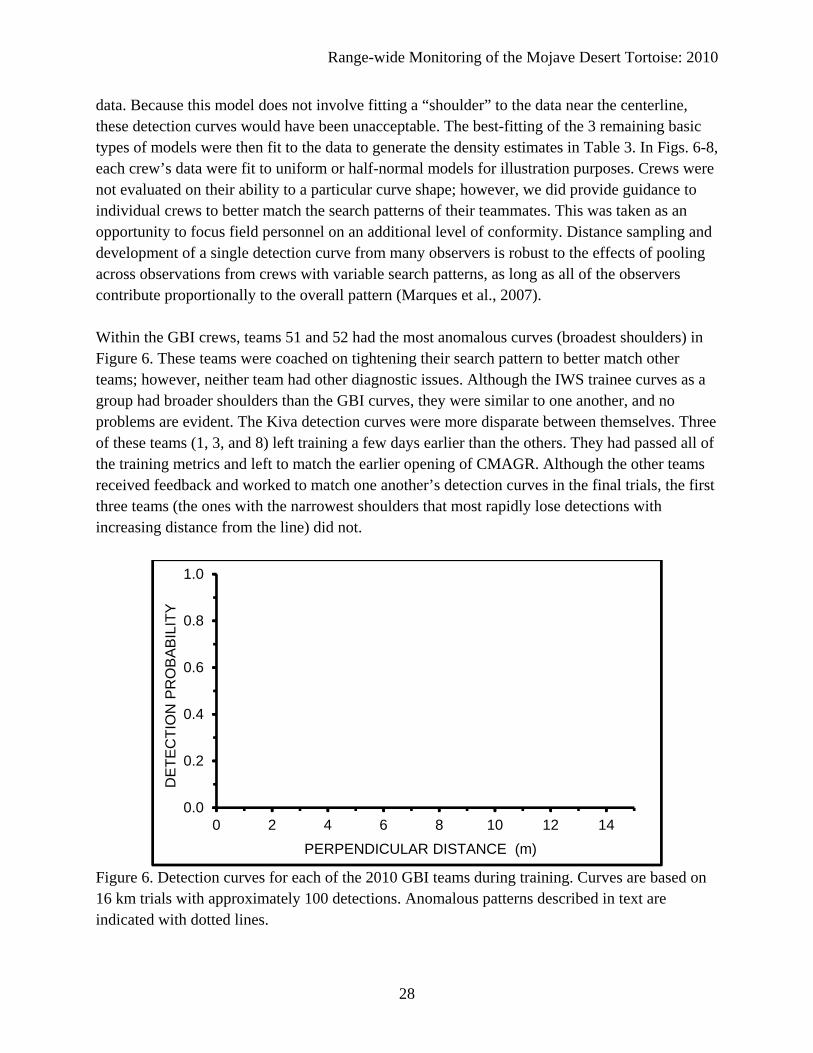
Figure 6 Detection curves for each of the 2010 GBI teams during training Curves are based on 16 km trials with approximately 100 detections Anomalous patterns described in text are indicated with dotted lines 28
Figure 7 Detection curves for each of the 2010 IWS trainee teams Curves are based on 16 km trials with approximately 100 detections 29
Figure 8 Detection curves for each of the 2010 Kiva trainee teams Curves are based on 16 km trials with approximately 100 detections Anomalous patterns described in text are indicated with dotted lines 29
ii
Figure 9 Distribution of distance sampling transects and live tortoise observations in the Northeastern Mojave Recovery Unit (Coyote Springs Valley Mormon Mesa Beaver Dam Slope and Gold Butte-Pakoon monitoring strata) 32
Figure 10 Distribution of distance sampling transects and live tortoise observations in the Eastern Mojave Recovery Unit (Piute-Eldorado Ivanpah and Fenner monitoring strata) and the Northern Colorado Recovery Unit (Chemehuevi monitoring stratum) 33
Figure 11 Distribution of distance sampling transects and live tortoise observations in the northern portion of the Western Mojave Recovery Unit (Fremont-Kramer Superior-Cronese and Ord-Rodman monitoring strata) 34
Figure 12 Distribution of distance sampling transects and live tortoise observations in the southern portion of the Western Mojave Recovery Unit (Pinto Mountains and Joshua Tree monitoring strata) and the Eastern Colorado Recovery Unit (Chuckwalla and Chocolate Mountain monitoring strata) 35
Figure 13 Observed detections (histogram) and the resulting detection function (smooth curve) for live tortoises with MCL ge 180mm found by GBI This curve uses only the 164 tortoise seen within 16 m of the centerline 37
Figure 14 Observed detections (histogram) and the resulting detection function (smooth curve) for live tortoises with MCL ge 180mm found by IWS This curve uses only the 111 tortoises seen within 14 m of the centerline 37
Figure 15 Observed detections (histogram) and the resulting detection function (smooth curve) for live tortoises with MCL ge 180mm found by Kiva in Fremont-Kramer Superior-Cronese and Ord-Rodman This curve uses only the 92 tortoises seen within 12 m of the centerline 38
Figure 16 Observed detections (histogram) and fitted detection function (smooth curve) for live tortoises with MCL ge 180mm found by Kiva in Joshua Tree Pinto Mountains Chuckwalla and on CMAGR This curve uses only the 85 tortoises seen within 8 m of the centerline 38
Figure 17 Detection pattern for the leader (p) and by the team (g(0)) based on all observations out to a given distance (x) from the centerline in 2010 Note convergence of g(0) on 10 at the transect centerline as x goes to 0 40
iii
ACKNOWLEDGEMENTS
Funding or support-in-kind was provided by Fort Irwin National Training Center Chocolate Mountain Aerial Gunnery Range Joshua Tree National Park the National Park Service portion of Grand Canyon-Parashant National Monument the California Desert District of the Bureau of Land Management and the Arizona Strip Office of the Bureau of Land Management
The original design for this project and considerations for optimizing it based on new information and experience were first set out in Anderson and Burnham (1996) and Anderson et al (2001) Estimation methods were further refined during a 2008 workshop for distance sampling held by S Buckland L Thomas T Marques E Rexstad and D Harris in Marshall California
Personnel from Kiva Biological Consulting (California) led by I Daly from the Institute for Wildlife Studies (California and Nevada) led by J Young and from the Great Basin Institute (Nevada Arizona and the Beaver Dam Slope of Utah) led by T Christopher conducted the field surveys The field monitors from these teams and from Joshua Tree National Park who did the hard work of collecting and verifying the data were P Aplin L Baierl L Baltic T Bartels M Bassett S Boisvert D Buchner A Carlson S Carlton H Converse C Conway I Daly E Davis J Dear A dEpremesnil RJ DePond A Devens K Dutcher S Dykman K Foley M Fossum S Fritts P Fuchs C Giuliano C Glassbrenner K Goodale D Halbruner P Havlik J Helvey K Holcomb J Houck M-E Jacques D Kaleta S Karinen L Keener-Eck D Kent G Keyes C Klehm K Lalumiere W Lee S Lillie P Livingston T Magart E Mastrelli C McClurg O Miano N Mikle L Mjos B Nieto B OBrien T Ose J Reilly T Rodgers K Rohling S Root A Salonikios K Schmidt K Shelp B Sparks A Steeley S Treu C Truettner R Vaghini A Wiley N Wiley K Yasuda
R Patil (University of Nevada Reno) M Brenneman (Topoworks) J Johnson (Arizona Exotic Animal Hospital) P Kahn and N Lamberski (San Diego Zoo) and T Christopher B Sparks and K Dutcher (GBI) provided specialized training instruction for field crews D Zeliff R Schultz and L Powell (Mojave Desert Ecosystem Program) provided preseason GIS support as well as independent review and post-processing of data submitted by both field groups R Patil (University of Nevada Reno) updated the electronic data-collection forms and procedures used in 2010 M Brenneman developed GIS procedures for correctly reflecting transect paths into monitoring strata where they would otherwise have overlapped She also developed the final databases
iv
EXECUTIVE SUMMARY
The recovery program for desert tortoises in the Mojave and Colorado deserts (USFWS 2011) requires range-wide long-term monitoring to determine whether recovery goals are met Specifically will population trends within recovery units increase for a period of 25 years In 1999 the Desert Tortoise Management Oversight Group endorsed the use of line distance sampling (Buckland et al 2001) as the method for estimating range-wide desert tortoise density From 2001 to 2005 and again from 2007 through 2010 desert tortoise populations in 5 of the 6 recovery units have been part of a coordinated range-wide monitoring program using line distance sampling (The Upper Virgin River Recovery Unit is monitored by Utah Division of Wildlife Resources (McLuckie et al 2012)) The first 5 years of monitoring culminated in a summary report (USFWS 2006) that included eleven recommendations seven of which were tied to functioning of the monitoring program and are paraphrased here
1 The range-wide monitoring program should continue under a formal study plan subject to scientific review
2 Refine [line distance sampling] techniques to improve sampling efficiency and estimates of trends
3 Evaluate the spatial scale of the monitoring program 4 Improve training lines 5 Evaluate the use of independent field teams to improve data consistency and quality 6 Refine and formalizedocument the QAQC process 7 Identify and assess options for securing continued funding for range-wide population
monitoring
This report describes the full set of quality assurance steps and final results for the 2010 monitoring effort The above issues continue to drive review and improvement of the program so that reporting also addresses these aspects of the annual effort The range-wide monitoring effort is directed each year at 15 strata that will be used to describe long-term trends Data were collected on transects by field personnel working with three different groups Kiva Biological (18 personnel) the Institute for Wildlife Studies (15 personnel) and Great Basin Institute (30 personnel) Four personnel from Joshua Tree National Park also collected telemetry data in the Park After an intensive 12-day specialized training session crews completed 878 transects (9401km) between 22 March and 28 May In the course of these surveys they reported 540 live tortoises
Training is provided each year so that field crews are familiar with the specifics of distance sampling Training also ensures consistency between the many crews collecting data Inexperienced crews as well as those with prior experience participated in preseason training and testing provided by the USFWS Crews were passed after demonstrating appropriate detection
5
Range-wide Monitoring of the Mojave Desert Tortoise 2010
patterns (including detection proportion on the transect line) measurement accuracy from tortoise models to the transect line and other skills Two of the teams passed after retesting with a different partner
Four parameter estimates contribute to final reported tortoise densities in each monitoring stratum The basis for distance sampling is the estimation of the number of tortoises detected at increasing distances from the walked transect As surveyors look farther from the transect centerline they will detect fewer and fewer of the tortoises that are actually there so describing the way detections decrease with distance allows for estimation of the proportion that were present but not detected within a given distance of the centerline Second an estimate is made of the proportion above ground or visible in their burrows and available to be detected on transects Third the first two estimates are combined with the number of tortoises encountered per kilometer walked to provide the actual density in each stratum Finally the proportion detected on the line must be estimated Unless all tortoises were detected on the centerline the density estimate must be adjusted to account for the occurrence of these additional tortoises
Separate detection curves were used to describe the decreasing ability of each team to see tortoises that were farther from the walked transect line These detection curves will capture any differences between teams in application of the protocol but are mostly expected to reflect the terrain as well as the extent to which vegetation obscures the view in different parts of the range since the curves account for tortoises that were present in the same area but not seen In the southern part of the range Kiva crews detected 67 of tortoises within 8 m of the transect centerline and 58 out to 12 m from the line in the northern area that they sampled GBI detected 41 out to 16 m and IWS detected 59 to 14 m The proportion of tortoises that were visible to be counted (G0) varied in different parts of the range which were surveyed at different times during the spring season Visibility was as high as 96 in the Superior-Cronese telemetry site during the last 2 weeks of April The lowest visibility was measured at 77 at the Gold Butte telemetry site also monitored during the first 2 weeks of April On average crews walked 23 km for each tortoise that was observed but this number varied considerably between monitoring strata Although densities in the Northeastern Mojave Recovery Unit had been estimated at less than 2km2 in previous years the density was estimated at 32 tortoiseskm2 this year similar to 2009 The Western and Eastern Mojave recovery units also had densities under 4km2 whereas the 2 recovery units in the Colorado Desert measured at 42km2 (Northern Colorado) and 57km2 (Eastern Colorado) Within the Eastern Colorado Recovery Unit the BLM areas had a density of only 37km2 whereas we estimated the density of tortoises on CMAGR at 138 tortoiseskm2 The Fenner and Ord-Rodman CHUs also had notably high density estimates at 69 and 75 tortoiseskm2 respectively This pattern of higher densities in these 3 monitoring strata has been fairly consistent over the years
6
Range-wide Monitoring of the Mojave Desert Tortoise 2010
To enable field crews to complete transects in previously unsampled areas within strata a set of guidelines was implemented in 2008 and 2009 for modifying transects in areas with rugged terrain or other obstacles (USFWS 2012) These rules did enable crews to sample entire strata in a more representative way however in areas of California with lower funding the resulting substrata never had enough transects or tortoise observations to separately evaluate tortoise densities in flat compared to rugged terrain For this reason in 2010 all transects in all recovery units except the Northeastern Mojave were to be completed to the extent possible along the original 12 km path Mountainous terrain in the path was circumnavigated without searching for tortoises and the path was resumed when possible This method keeps transects in representative areas and also allows the proportion of unwalkable terrain to be estimated The proportion of kilometers actually walked under this new method matched the expected number of kilometers based on the earlier modified-transect protocols
Finally the success of the range-wide monitoring program also depends on developing reliable adequate and consistent funding Results from earlier years of this project illustrated clearly that sufficient effort (transects) in each stratum is needed to encounter several tortoises otherwise estimates are not possible In 2010 funding enabled estimation of tortoise densities in all strata to at least a minimum extent better than any year since 2005 Effective implementation of this program requires stable funding so that monitoring effort matches planning requirements rather than funding limitations
7
Range-wide Monitoring of the Mojave Desert Tortoise 2010
RANGE-WIDE MONITORING OF THE MOJAVE DESERT TORTOISE
2010
INTRODUCTION
The Mojave Desert population of the desert tortoise (Gopherus agassizii) was listed as threatened under the Endangered Species Act in 1990 This group of desert tortoises north and west of the Colorado River are now recognized as the species G agassizii separate from G morafkai south and east of the Colorado River (Murphy et al 2011) The original (USFWS 1994) and revised recovery plan (USFWS 2011) designate recovery units to which decisions about continued listing status should be applied Because the 2010 monitoring effort preceded the revised recovery plan data records were associated with the original recovery units so results reported here also use those recovery units The recovery plan specifies that consideration of delisting should only proceed when populations in each recovery unit have increased for at least one tortoise generation (25 years) and the only means to determine trend is by a rigorous program of long-term monitoring Before the tortoise was listed populations were monitored either using strip transects (Luckenbach 1982) where indications of tortoise presence (live or dead tortoises scats burrows or tracks) were converted to tortoise abundance categories based on calibration transects conducted in areas of better-known tortoise density or by using capture-recapture population estimates on a limited number of (usually) 1-mi2 study plots (Berry and Nicholson 1984) Although data have continued to be collected on transects and study plots in recent years these methods suffer statistical deficiencies andor logistical constraints that render them unsuited for monitoring trends in abundance applicable to entire recovery units (Corn 1994 Anderson et al 2001 Tracy et al 2004) In 1999 the Desert Tortoise Management Oversight Group endorsed the use of line distance sampling (Buckland et al 2001) for estimating range-wide desert tortoise density
Distance sampling methods use measurements taken from the center of the transect lines to tortoises to model detection as a function of distance from the walked path tortoises farther from the travelled path have a lower probability of detection In order to anchor the curve and estimate the true (not relative) proportion of tortoises detection within a given distance from the center of the transect all tortoises must be detected on the transect centerline (Anderson et al 2001 Buckland et al 2001) There are additional assumptions in distance analysis ndash that distance is measured to the point where the animal was first detected and that distance is measured accurately ndash but these are easily satisfied in line distance sampling of desert tortoises The assumption that detection at the centerline of the transect is perfect however can be violated during line distance sampling of tortoises but the use of two observers minimizes the probability that tortoises are missed on the centerline and provides a correction factor in the form of an estimate of the number of tortoises on the line that were missed (USFWS 2009)
8
Range-wide Monitoring of the Mojave Desert Tortoise 2010
Distance methods have been applied to estimate abundance of Sonoran Desert Tortoises (G morafkai) since 2000 (Swann et al 2002 Averill-Murray and Averill-Murray 2005) and for G agassizii in the Upper Virgin River Recovery Unit in Utah since a pilot study in 1997 (McLuckie et al 2012) The USFWS used line distance sampling to estimate abundance of tortoises in the remaining five recovery units for G agassizii in Utah Arizona Nevada and California starting in 2001 (USFWS 2006 2009 and 2012) This report includes results of training exercises for field crews describes implementation of monitoring in 2010 and presents the analysis of desert tortoise density in 2010
METHODS
Study areas and transect locations Long-term monitoring strata (Fig 1) will be used over the life of the project to describe population trends in areas managed to conserve tortoises (ldquotortoise conservation areasrdquo TCAs) Generally each critical habitat unit (CHU) is treated as one monitoring stratum although the portion of Mormon Mesa CHU that is associated with Coyote Springs Valley is treated as a separate stratum Chuckwalla CHU is also treated as dual monitoring strata with potentially unequal sampling effort in the areas managed by the Department of Defense (Chocolate Mountain Aerial Gunnery Range CMAGR) and by the Bureau of Land Management (BLM) The Piute and Eldorado Valleys are currently treated as one monitoring stratum although they are in different recovery units The Joshua Tree stratum does not encompass all suitable habitat for desert tortoises in Joshua Tree National Park (JTNP) The national park designation and current boundaries just post-date the designation of CHUs so some of the Pinto Mountains and Chuckwalla CHUs (and monitoring strata) are in the current JTNP
The optimal number of transects in a monitoring stratum was determined by evaluating how these samples would contribute to the precision of the annual density estimate for a given recovery unit (Anderson and Burnham 1996) Power to detect an increasing population size is a function of 1) the magnitude of the increasing trend 2) the ldquobackground noiserdquo against which the trend operates and 3) the period of time (even a small annual population increase will result in a noticeably larger population size if the increase continues for many years)
The magnitude of the population trend is a function of recovery activities and the population dynamics of the tortoise ndash neither of these elements are affected by monitoring design and sample size The second contributor to the power to detect a trend ndash the level of background variability in the density estimates ndash is directly affected by the number length and placement of transects in the monitoring strata Anderson and Burnham (1996) recommended that transect number and length be chosen to target precision reflected in a coefficient of variation (CV) of 10-15 for the estimate of importance (here density for tortoise conservation areas in each recovery unit) The CV describes the standard deviation (a measure of variability) as a
9
Range-wide Monitoring of the Mojave Desert Tortoise 2010
Figure 1 Sampled areas 2010
10
Range-wide Monitoring of the Mojave Desert Tortoise 2010
proportion of the mean and is often converted to a percentage Since recovery criteria target trends within recovery units (USFWS 1994 and 2011) precision in that density estimate was the focus The target CV is achieved based on the number of tortoises that might be encountered there (some strata currently have higher densities than others) as well as the area of the stratum ndash its proportional contribution to the recovery unit density estimate (Buckland et al 2001)
The actual number of transects assigned in each stratum was a function of the optimal numbers described above as well as on available funding Once the number of transects in a stratum was determined these were laid out systematically across strata with a random origin for the lattice of transects In strata with more assigned transects nested lattices with smaller spacing (3 km) were used to ensure sufficient transects In strata with fewer transects lattices 9 km spacing were used Systematic placement provides more even coverage of the entire stratum something that may not occur when strictly random placement of transects is used In both cases transects are located at random with respect to the location of desert tortoises
Transect completion One adaptation that tortoises have for living in the desert is to restrict surface activity to fairly narrow windows of time during the year In general tortoises emerge from deep within shelters (burrows) from mid-March through mid-May and then again (less predictably) in the fall These periods coincide with flowering of their preferred food plants (in spring) and with annual mating cycles (in fall) The annual range-wide monitoring effort is scheduled to match the spring activity period for tortoises
During this season not all tortoises are above ground or visible in burrows To encounter as many tortoises as possible monitoring is scheduled for early in the day and to be completed before the hottest time of day Because tortoises are located visually monitoring is restricted to daylight hours Based on past experience we expect tortoises to become most active after 7am at the beginning of April (it is usually too cool before this time) but to emerge earlier and earlier until their optimal activity period includes sunrise by the beginning of May In May we also expect daytime temperatures to limit tortoise above-ground activity as the morning progresses to afternoon
Field crews complete transects during this optimal period each day Start times are decided a week in advance so crews arrive at transects at similar times on a given morning However completion times will be more variable as a consequence of terrain air temperature number of tortoises encountered etc Under normal conditions each team walked one 12 km square transect each day Teams were comprised of 2 field personnel who switched lead and follow positions at each corner of each transect so they each spent an equal amount of time in the leader and follower positions The leader walked on the designated compass bearing while pulling a 25 m length of durable cord the walked path is also the transect centerline and was indicated by the
11
Range-wide Monitoring of the Mojave Desert Tortoise 2010
location of the cord The length of cord also spaced the two independent observers guiding the path of the follower when the cord was placed on the ground after a tortoise or carcass was detected it facilitated measurement of the local transect bearing The walked length of each transect was calculated as the straight-line distance between GPS point coordinates that were recorded at 500 m intervals (waypoints) along the transect andor whenever the transect bearing changed
Both leader and follower scanned for tortoises independently without leaving the centerline and the role of the crew member finding each tortoise was recorded in the data Although the leader saw most of the tortoises the role of the follower was to see any remaining tortoises near the centerline so the follower role is crucial to unbiased estimation of tortoise densities
Distance sampling requires that distance from the transect centerline to tortoises is measured accurately When a tortoise was observed crews 1) used a compass to determine the local transect bearing based on the orientation of the 25 m centerline 2) used a compass to determine the bearing from the point of observation to the tortoise and 3) used a measuring tape to determine the distance from the observer to the tortoise These data are sufficient to calculate the perpendicular distance from the observed tortoise to the local transect line If the tortoise was outside of a burrow was handled enough to take mass and midline carapace length (MCL) to determine its sex and to apply a small numbered tag to one scute If a tortoise could not be measured because it was in a burrow because temperatures precluded handling or for any other reason crews attempted to establish by other means whether the animal was larger than 180 mm MCL the criterion for including animals in density estimates
Because transects are 3 km on one side it is not unusual for that path to cross through varied terrain or even be blocked by an obstacle such as an interstate highway In the first years of this program smaller transects in inconvenient locations were shifted or replaced but this compromised the representative nature of the sample Since 2007 the basic rules for modifying transects involve 1) reflecting or elongating transects to avoid obstacles associated with human infrastructure (large roads private inholdings etc) or 2) shortening transects in rugged terrain Substrate and access to transects can also make it difficult to complete transects during the optimal period of times so 3) transects could be shortened to enable completion before 4 pm each day
In 2008 and 2009 the rules for shortening transects were made more restrictive Crews had the option to complete transects that were 12 km long (in low-relief terrain) or 6 km long (where higher-relief terrain precluded completion of 12 km in a working day) In the latter case to avoid crews selecting particular terrain the only way to shorten the transect was to walk it in the southwestern quadrant of the intended 12 km square If the southwestern quadrant was judged too rugged to be completed safely by transect walkers the final option was to not complete the
12
Range-wide Monitoring of the Mojave Desert Tortoise 2010
transect at all As in previous years unwalked transects were replaced from the list of alternates More situations were anticipated by additional rules in 2010 as described below
Modification of previous procedures After the 2009 field season it was clear that funding uncertainties in California meant that sufficient transects might not be completed in order to substratify analyses for 12 km and 6 km transects However substratification continued to hold promise for analyses in the Northeastern Mojave Recovery Unit In 2010 the same option to shorten transects to 6 km in rugged terrain were made available to GBI crews However IWS and Kiva crews shortened transects by following as much of the planned 12 km route as was possible If it was anticipated that fewer than 4 km could be walked the transect should be replaced instead with a transect from the alternate list Instead of estimating the proportion of the area that is unwalkable based on the proportion of transects that were unwalkable we would use the proportion of total planned kilometers (12 X number of planned transects) that were unwalkable
In addition transects that crossed stratum boundaries into public lands had previously been walked as planned (squares) Although this added sampling just outside the stratum it seemed reasonable to assume the land management and tortoise fate would be similar on each side of the invisible boundary Walking in a square is also less likely to introduce other problems compared to reflecting the transect Nonetheless starting in 2010 the protocol used to modify transects that intersected private lands or interstates since 2007 was applied to the portion of any transect that crossed out of monitoring strata reflecting that portion into the stratum Whether the segments of those transects outside the boundaries were walked outside the stratum or as a mirror image inside the stratum the same length of transect is walked at the same distance from the stratum boundary avoiding undersampling of areas on stratum boundaries (Figure 2) The impetus for this change was the recent large scale development and construction on public lands often just along the borders of critical habitat especially for renewable energy facilities and transmission lines Since the monitoring program was initiated other activities that are incompatible with tortoise conservation have become more common on public lands immediately adjacent to TCAs
Specifics of how transect paths were to be modified for rugged terrain (shortened) or for administrative boundaries (reflected) can be found in the 2010 Desert Tortoise Monitoring Handbook (USFWS 2010)
13
Range-wide Monitoring of the Mojave Desert Tortoise 2010
B
A
Figure 2 Planned (dotted lines) and reflected transect paths at administrative boundaries now also applied to stratum edges A) One-corner reflection B) Two-corner reflection
14
Range-wide Monitoring of the Mojave Desert Tortoise 2010
Proportion of tortoises available for detection by line distance sampling G0
Although we have general expectations about when tortoises are most active each day and plan our sampling to match the best season and time of day the fact remains that basing our density estimates only on the tortoises that are visible will result in density estimates that are consistently underestimated (biased low) Instead we use telemetry to estimate the proportion of tortoises available for sampling G0 (ldquogee-sub-zerordquo) which is incorporated in the equation for estimating tortoise density and to correct this bias
Telemetry allows us to locate radio-equipped tortoises that are as well as those that are otherwise undetectable in deep burrows or well hidden in dense vegetation To quantify the proportion that were available for detection (ldquovisiblerdquo) in 2010 telemetry technicians used a VHF radio receiver and directional antenna to locate 8-12 radio-equipped G0 tortoises in each of 10 sites throughout the Mojave and Colorado deserts (Fig 1) Each time a transmittered tortoise was located the observer determined whether the tortoise was visible (yes or no) Through careful coordination observers at telemetry sites monitored visibility during the same daily time period when field crews were walking transects in the same region of the desert Observers completed a survey circuit of all focal animals as many times as possible during the allotted time recording visibility each time Bootstrapped estimates of G0 started by selecting one visibility record at random for each tortoise on each day it was located The average visibility of all tortoise observations at a site on a given day was calculated and used to estimate the mean and variance of G0 at that site When there was more than one site in a given area the G0 estimate was calculated as the grand mean of all G0 sites in the group One thousand bootstrap samples were generated in PASW Statistics (release 1802 SPSS Inc 2 April 2010) to estimate G0 and its standard error
Use of radio transmittersreceivers to locate tortoises is a technique that is very different from the method used to detect tortoises on line transects Therefore in addition to stating whether any part of the tortoise is visible when located since 2008 behavioral observers and transect walkers have categorized all ldquovisiblerdquo tortoises and burrows (when tortoises are found in burrows) as low medium or high visibility based on the ability to see part of the tortoise or its burrow from any angle of approach For the telemetry observers it is a matter of locating a tortoise (visible or not) after they have determined its general location aurally whereas transect walkers are not searching with certainty of locating a tortoise ndash they rely only on visual cues and have no leading information when a tortoise is in the vicinity We would therefore not be surprised if the distance sampling method results in detection of a higher proportion of ldquohighrdquo visibility and a lower proportion of ldquolowrdquo visibility tortoisesburrows than when tortoises are located using telemetry If the odds be being detected differ not only by distance from the line but also a combination of method of detection used (visual or radio receiver) and visibility we should be able to describe this difference and be able to modify our calculation of visibility following radio-receiver information to more accurately match the visibility to transect walkers
15
Range-wide Monitoring of the Mojave Desert Tortoise 2010
Field observer training Training for careful data collection and consistency between crews is a fundamental part of quality assurance for this project This training includes instruction as well as required practice time on skills such as tortoise handling walking practice transects and developing detection and distance-measuring techniques (Table 1) The monitoring handbook developed in 2008 was comprehensive and serves as a training manual and documentation of training that is provided Chapters posted to the Desert Tortoise Recovery Office website and printed for training have been updated each year as needed (httpwwwfwsgovnevadadesert_tortoisereports)
In 2010 three teams of field observers participated Kiva Biological (Kiva) supplied crews for monitoring in the West Mojave and Eastern Colorado recovery units The Institute for Wildlife Studies (IWS) participated for the first time monitoring in the Northern Colorado and Eastern Mojave recovery units Great Basin Institute (GBI) supplied crews for monitoring in the Northeastern Mojave About half the personnel for Kiva were trained for the first time in 2008 and returned each year One of the 15 personnel for IWS had previous experience with this monitoring program and 9 of the 30 personnel for GBI were returnees Due to the large number of trainees and to accommodate an earlier monitoring window on CMAGR the three teams were trained in 2 overlapping periods with some experienced Kiva personnel leaving the training group after rapid evaluation (Table 1) Where possible the same trainers were used in both training sessions and across teams Also for small-group training experienced personnel from each team worked with the trainees from other teams
Telemetry training The primary goal of G0 training is successful implementation of the G0 protocol by telemetry crews This includes correct use of telemetry equipment understanding G0 data collection fields observation of as many radio-equipped tortoises as possible during the day and covering a window of observation that overlaps the dayrsquos transect time window for each sampling area Although all telemetry crews had some prior telemetry experience performance on this project differs from others that do not require confirmation of the exact location of the tortoise Unless the exact location is determined its visibility cannot be accurately recorded Beyond instruction and testing on use of the equipment in desert terrain several days of practice were compulsory to be able to troubleshoot locating the tortoise and confirming the location when it could not be seen In addition some instruction for telemetry and transect crews overlapped to help each group better understand the purpose their data serve and how they fit with data that were collected under the other protocol
Distance sampling training Transect walkers were given classroom instruction field demonstrations practice transects to complete and ultimately each team was evaluated based on performance on a field arena outfitted with a high density of polystyrene tortoise models placed in measured locations (Anderson et al 2001)
16
Range-wide Monitoring of the Mojave Desert Tortoise 2010
Table 1 Training schedule for 2010 IWS Trainees GBI Trainees Kiva Trainees
DayDate Activity Trainer Activity Trainer Activity Trainer WEEK 0 G0 only
Thurs 11-Mar
Beginning on-site G0 instruction Sparks Beginning on-site G0 instruction Sparks
Fri 12-Mar
Familiarize G0 with River Mtns Sparks Familiarize G0 with River Mtns Sparks
WEEK 1 WEEK 1 Monday 15-Mar
Transect methods overview 6km transect
Allison Return crews
Transect methods overview 6km transect
Allison Return crews
Tuesday 16-Mar
Introductions and DT RecoveryMonitoring
Programmatic Overview Working on Public Lands
Tortoise ActivityG0
Distance Sampling Transect methods lecture Non-standard transects
RDABT GPS Pendragon Database Lecture and Exercises Quality control procedures for field crews CompassGPS Lecture
Allison ldquo ldquo ldquo ldquo ldquo
Patil
Patil Allison G0 on scheduled visit Sparks
Introductions and DT RecoveryMonitoring
Programmatic Overview Working on Public Lands
Tortoise ActivityG0
Distance Sampling Transect methods lecture Non-standard transects
RDABT GPS Pendragon Database Lecture and Exercises Quality control procedures for field crews CompassGPS Lecture
Allison ldquo ldquo ldquo ldquo ldquo
Patil
Patil Allison
Wednesday
17-Mar
Tortoise biology and handling instruction Tortoise handling and data collection - small groups Pen search image exercise Training line lecture amp crew quality control procedures CompassGPS Exercise Data transfer and QAQC (QAQC specialists only)
Staff Christopher
ldquo ldquo
Allison Brenneman
Allison
Patil
RDABT GPS Pendragon Database Lecture and Exercises Quality control procedures for field crews (transect and G0) G0 in River Mtns -AM
Data transfer and QAQC (QAQC specialists only)
Patil
ldquo Sparks
Patil
Tortoise biology and handling instruction Tortoise handling and data collection - small groups Pen search image exercise Training line lecture amp crew quality control procedures CompassGPS Exercise
Staff Christopher
ldquo ldquo
Allison Brenneman
Allison
Thursday
18-Mar
Training Lines (practice 8km) Begin data download Beginning on-site G0 instruction
Allison Young Sparks
Training Lines (practice 8km) Begin data download
Allison Young
Friday
19-Mar
Training Lines (practice 8km)
G0 on-site training Initial QAQC (specialists only)
Sparks Brenneman Initial QAQC (specialists only) Brenneman
Training Lines (practice 8km) Begin data download from RDAs
Saturday 20-Mar
Full transects (12km)
17
Range-wide Monitoring of the Mojave Desert Tortoise 2010
IWS Trainees GBI Trainees Kiva Trainees DayDate Activity Trainer Activity Trainer Activity Trainer
WEEK 2 Monday
22-Mar
Tortoise handling
Training line debriefing
Staff
Allison
Transect methods overview 6km transect
Allison Experienced crews
Tortoise handling Staff
Training line debriefing Allison
Tuesday 23-Mar
Training Lines (evaluation 8km)
Introductions and RecoveryMonitoring Program
Overview Same as IWS on 16 Mar
Allison Training Lines (evaluation 8km)
Wednesday 24-Mar
Training Lines (evaluation 8km) Tortoise biology and handling instruction Same as IWS on 17 Mar
Staff Christopher
Training Lines (evaluation 8km)
Thursday 25-Mar
Full transects (12km) (12 crew) G0activity observation -12 crew Sparks
Training Lines (practice 8km) Begin data download
Allison
Young Friday
26-Mar
Full transects (12km) (half crew) G0 activity observation (half crew) Sparks
Training Lines (practice 8km)
WEEK 3 Monday 29-Mar
Tortoise handling Training line debriefing Allison
Full transects (12km) (12 crew) G0 activity observation (12 crew) Sparks
Tuesday30-Mar
Full transects (non-standard)or repeat training lines as needed G0 on-site practice Sparks
Tortoise handling
Training line debriefing
Staff
Allison Wednesday
31-Mar Repeat training lines as needed Begin field data collection
Training Lines (evaluation 8km)
Thursday 1-Apr
Training Lines (evaluation 8km)
Friday 2-Apr
Full transects (12km) (12 crew) G0 activity observation (12 crew) Sparks
WEEK 4 Monday
5-Apr Deliver QAQCrsquod data from practice transects to ftp site
Tortoise handling Training line debriefing
Tuesday 6-Apr
Full transects (non-standard) or repeat training lines as needed G0 on-site practice
Wednesday 7-Apr
Repeat training lines as needed Begin field data collection
WEEK 5 Monday 12-Apr
Deliver QAQCrsquod data
18
Range-wide Monitoring of the Mojave Desert Tortoise 2010
Polystyrene models of desert tortoises (ldquomodelsrdquo) are set out on the training course each year using placement instructions (vegetation or open placement distance along training line and distance perpendicular from training line) This course is used to determine whether 1) individual teams are able to detect all models on the transect centerline 2) whether their survey techniques yield useful detection functions and 3) whether they can accurately report the distance of each model from the transect centerline For each purpose many opportunities must be provided so the course is populated at a very high density of models (410km2)
Crews were sent on transects and training lines as paired independent observers That is the follower was 25 m behind the leader with the opportunity to detect models not found by the leader If the leader detects 80 of all tortoises that are found the assumption is that the follower detects 80 of the tortoises that are missed by the leader If this assumption is true in this example the pair together will detect 080 + (080 X (1 ndash 080)) = 096 of all tortoises on the centerline Because the location of all models was known data from training lines were also used to 1) assess the dual-observer assumption that all models were equally detectable (detections attributed to the follower occur at the same rate as original detection rate by leader) and 2) to estimate the detection rate using this technique for tortoises elsewhere in the Mojave Desert These data on models were used to evaluate and correct crew performance before the field season but were not used in any way to estimate densities of live tortoises once field surveys began
Data management including quality assurance and quality control
Two sets of data tables are maintained through the field season organizing data collected on transects and at the G0 sites Collection data forms sheets applications and databases are designed to minimize data entry errors and facilitate data verification and validation Data were collected in both electronic and paper formats by the two survey organizations then combined and processed in a series of phases to create final database products Data quality assurance and quality control (data QAQC also known as verification and validation) is performed during the data collection data integration and data finalization phases During the second data integration phase after combining data from separate groups some attribute fields are added and all fields are formatted for final processing The third phase data finalization involves consolidation resolution of data inconsistencies and generation of final spatial and non-spatial data products used for analysis After data analysis and reporting are completed electronic data are actively hosted for download from the internet through httpwwwmojavedatagovdeserttortoise_govrecoverydataphp Figure 3 describes the overall data flow
19
Range-wide Monitoring of the Mojave Desert Tortoise 2010
Figure 3 Data flow from collection through final products
Tortoise encounter rate and development of detection functions The number of tortoises seen in each stratum and their distances from the line are used to estimate the encounter rate (tortoises seen per kilometer walked) the detection rate (proportion of available tortoises that are detected out to a given distance from the transect centerline) and their respective variances Detection function estimation is ldquopooling robustrdquo under most conditions (Buckland et al 2001) This property holds as long as factors that cause variability in the curve shape are represented proportionately (Marques et al 2007) Factors that can affect curve shape include vegetation that differentially obscures vision with distance and different detection protocols used by individual crews (pairs) Field teams (IWS GBI Kiva) typically walk a different proportion of the transects so I expected to develop at least one curve for each field team which also corresponds to different regions of the desert The encounter rate is less sensitive to small sample sizes so it was estimated for each stratum separately
I used Program DISTANCE Version 6 Release 2 (Thomas et al 2010) to fit appropriate detection functions to estimate the encounter rate of tortoises in each stratum and to calculate the associated variances One record was created for each transect with additional records for
20
Range-wide Monitoring of the Mojave Desert Tortoise 2010
each additional tortoise on that transect Analysis was applied to all live tortoises larger than 180 mm MCL Transects were packaged into monitoring strata (ldquoregionsrdquo in Program DISTANCE) I truncated observations to improve model fit as judged by the simplicity (reasonableness) of the resulting detection function estimate (Buckland et al 2001) Using truncated data I used the Akaike Information Criterion (AIC) to compare detection-function models (uniform half normal and hazard-rate) and key functionseries expansions (none cosine simple polynomial hermite polynomial) recommended in Buckland et al (2001)
Proportion of available tortoises detected on the transect centerline g(0) Transects were conducted by 2-person crews using the method adopted beginning in 2004 (USFWS 2006) Transects were walked in a square with the lead crew member walking a straight line on a specified compass bearing trailing about 25 m of line and the second crew member following at the end of the line This technique involves little lateral movement off the transect centerline where attention is focused Use of two observers allows estimation of the proportion of tortoises detected on the line this provides a test of the assumption is that all tortoises on the transect centerline are recorded (g(0) = 1) The capture probability (p) for tortoises within increasing distances from the transect centerline was estimated as for a 2-pass removal estimator (White et al 1982) p = (leadndashfollow)lead where lead = the number of tortoises first seen by the observer in the leading position and follow = the number of tortoises seen by the observer in the follower position The corresponding proportion detected on the line by two observers was estimated by g = 1 ndash q2 where q = 1 ndash p Figure 4 graphs the relationship between the single-observer detection rate (p) and the corresponding dual-observer detection rate (g(0) ldquogee at zerordquo) The actual proportion detected can be estimated but to avoid the necessity of compensating for imperfect detection during training field crews (pairs) are expected to detect 96 of all models within 1 m of the transect centerline This corresponds to the leader being responsible for at least 80 of the teamrsquos detections near on the centerline in order to meet this standard (Fig 4) and is the basis for one of the training metrics (see Table 3)
Few or no tortoises are located exactly on the line and even examining a small interval (such as 1 m on each side of the transect line) results in few observations to precisely estimate g(0) Instead my test of the assumption involves examination of the lead and follow proportions starting with counts of tortoises in larger intervals from the line moving to smaller intervals centered on the transect centerline As the intervals get smaller the sample sizes also get smaller but the estimates are more relevant to the area right at the transect centerline The expectation is that the estimates should converge on g(0) = 10
If the test does not indicate that all tortoises were seen on the transect centerline the variance of p can be estimated as the binomial variance = q(1 + q)np (White et al 1982) where n = the estimated number of tortoises within 1 m of the transect centerline and the variance of g(0) is estimated as twice the variance of p
21
Range-wide Monitoring of the Mojave Desert Tortoise 2010
0
02
04
06
08
1
05 06 07 08 09 1
Tea
m d
etec
tio
n o
n t
he
line
g(0
)
Leader Detection (p)
Figure 4 Relationship between single-observer detections (by the leader p) and dual-observer (team) detections g(0)
Estimates of tortoise density Each year the density of tortoises is estimated at the level of the recovery unit The calculation of these densities starts with estimates of the density of tortoises in each stratum from Program DISTANCE as well as their variance estimates
nD
2wLPaG0 g 0 where L is the total length of kilometers walked in each stratum and w is the distance to which observations are truncated so 2wL is the area searched in each stratum This is a known quantity (not estimated) Pa is the proportion of desert tortoises detected within w meters of the transect centerline and was estimated using detection curves in Program DISTANCE The encounter rate (nL) and its variance were estimated in Program DISTANCE for each stratum Calculation of D requires estimation of nL Pa G0 and g(0) This means that the variance of D depends on the variance of these quantities as well
For desert tortoise densities the encounter rate (nL) is estimated independently for each stratum whereas proportion of available tortoises and proportion of available tortoises detected on the transect centerline are estimated jointly for all strata (g(0)) or for all strata in the recovery unit (G0) The detection function which comes into the above equation as Pa may be estimated jointly or separately depending on the number and quality of observations In 2010 separate detection curves were created for GBI and IWS pooled across all strata surveyed by each team Although a single detection curve was also considered for Kiva detections the patterns were very different in the south (mostly Colorado Desert) compared to the north (Mojave Desert) so
22
Range-wide Monitoring of the Mojave Desert Tortoise 2010
separate curves were developed for strata in the two areas (see Results) A schematic of the process leading to density estimates is given in Figure 5 Contributing estimates in the four left-hand columns are listed with the subsets of the data on which they are based These estimates combined from left to right to generate stratum and recovery unit density estimates Because transect records were associated with recovery units under the USFWS (1994) recovery plan those recovery units are used here although the data for 2010 and earlier years will be repackaged to later describe trends in the USFWS (2011) recovery units
Whereas the number of tortoises in the set of strata representing a recovery unit can simply be added together the variance must be arrived at by accounting for whether this involves pooled or independent estimates As described above three of the four estimates that contribute to calculating density in a stratum were based on data ldquopooledrdquo from other strata as well so when data from these strata are combined the correlated nature of the variances has to be accounted for Specifically the method described in Buckland et al (200189) was used to combine density variances correctly and arrive at the variance (and confidence intervals and CV) for the recovery unit Variance estimates cannot currently be combined within Program DISTANCE as required for the analysis described here so final construction of density mean and variance estimates from the above components was completed without specialized software
Tortoise encounter rate
Proportion that are
visible G0
Detection rate Pa
Proportion seen on the line g(0)
Density Density
Stratum or Neighboring
G0 sites
Data collection
group Overall Stratum Recovery unit
FK Ord-Rodman + Superior- Cronese
Kiva north
Full set of tortoise observations
FK
Western Mojave
SC SC
OR OR
JT Joshua Tree
NP + Chuckwalla
Kiva south
JT
PT PT
CK CK Eastern Colorado
AG AG
CM Piute +
Chemehuevi + Ivanpah
IWS
CM Northern Colorado
FE FE
Eastern Mojave IV IV
PI PI
GB Gold Butte +
Halfway Wash to 22 April
GBI
GB
Northeastern Mojave BD Halfway Wash
after 22 April BD
MM MM
CS Coyote Springs CS
Figure 5 Process for developing density estimates in 2010 For each type of estimate the full set of data was subdivided appropriately USFWS (1994) recovery units are used for this analysis
23
Range-wide Monitoring of the Mojave Desert Tortoise 2010
Estimating the area of each stratum sampled and the number of tortoises in that area Before the 2008 field season based on experience in 2007 and visual examination of DEM overlays all assigned transects were classified as possible for completion as 12k 6k or as unwalkable (USFWS 2012) These classifications before the field season are advisory only because exact ground conditions weather and crew condition all affect the ability to complete a transect If a non-standard transect (not 12 km square) is walked crews indicate the obstacles they encountered that forced the change in protocol In addition to the above named factors substrate that is very loose on a steep slope or that includes large boulders can make progress so slow or treacherous that crews modify the transect
Each year some transects are repeated providing new information on ground conditions and new transects are attempted At the end of each field season transects that were completed differently from expected are evaluated At that point a decision is made whether to reclassify the transect The classification is used to advise future transect completion but also to estimate the proportion of each monitoring stratum that is actually represented by the walked transects
Because each transect of any length is built off of the southwestern corner how that transect is completed is one representation of transects built on all possible southwestern corners In order to avoid selection bias by crews there were only 3 classification options for entire transects so that only 0- 6- or 12-km were actually walked but of course all of the distances between these options might actually have been walkable Transects that were not walked represent all transects that could be walked for lengths of 0- to 6-km It is parsimonious to therefore assume that on average 3 km could have been walked for each transect classified as ldquounwalkablerdquo Transects completed using the 6km option represent all of those that could have been completed for distances of 6- to 12-km averaging 9 km so that is the expected value for all of those transects Transects completed as 12 km represent the 100 completion option The total area of the stratum that is unwalkable is estimated as
௧௦௧௦ሻ ାହሺ௨௪ሻ௧௦௧௦ሺଶହൌ ݐݎݎ ݓݑ ௧௦௧௦ ௦௦ௗ ௦ ଶ
If a given stratum covers 5000 km2 but only 90 was walkable and represented by our sampling design then the density estimates applies to 4500 km2 and can be used to generate an estimate for the number of tortoises in those 4500 km2 Using these area estimates adds another source of imprecision so abundance estimates are slightly less precise than the density estimates they derive from The additional error of this estimate is calculated as the error for a binomial proportion
24
Range-wide Monitoring of the Mojave Desert Tortoise 2010
Modification of previous procedures In 2010 two new procedures for walking transects affect how we use transect completion information to estimate the proportion of each stratum that is walkable First in acknowledgment that public lands outside tortoise conservation areas increasingly used for activities that are not compatible with tortoise conservation transects are now reflected inward from the [usually] invisible stratum boundaries This new procedure has also caused the reclassification of some transects to walkable where stratum boundaries exclude mountain ranges for instance Next crews completed all transects except those walked by GBI in Nevada using the 12 km square path completing as much of that path as possible The calculation of unwalkable area in these strata now based on the proportion of unwalkable kilometers not unwalkable transects
Debriefing to describe strengths and weaknesses of project preparation and execution At the end of each field season a debriefing meeting was held to review tasks and responsibilities strengths and weaknesses of the program and to plan for the next field season Because the field teams had disbanded by then field crew members were surveyed prior to the end of the field season to nonetheless gather their direct input as we identified training and logistical issues to target for improvement before the next field season Although issues andor tasks may be ascribed to individual entities this meeting is most beneficial in identifying where centralized andor coordinated response is required to improve the quality of the program
RESULTS
Field observer training The smaller Kiva and IWS groups trained alongside one another and mostly separate from GBI although experienced crews worked between all three teams Training started on 11 March and continued through 6 April in 2 staggered sessions (Table 1) Final tests of field detection abilities occurred toward the end of this period
Proportion of tortoises detected at distances from the transect centerline Table 2 reports the proportion of models that were available and were detected by each team at 1- 2- and 5-meters from the transect centerline Teams were tested after a trial run on the detection lines (GBI and IWS crews) or after walking practice transects for returning crews that wanted to refresh the search pattern (Kiva) Detection on the centerline should be 100 and many crews achieved this First-year trainees detected a similar proportion of models at 1- and 2-m compared to experienced crews with first-year trainees detecting fewer models at 5 m
Table 3 reports further statistics for each team after collecting data on 16 km on the evaluation lines Column 4 reports the average absolute difference between the expected and measured perpendicular distances from the model to the walked line All measurements for all models during the 2-day trial are used for this estimate and capture inaccuracies from 1) using a compass and measuring tape to record distances to the models plus 2) inaccurately following the
25
Range-wide Monitoring of the Mojave Desert Tortoise 2010
trajectory of the transect The latter source of error does not occur on monitoring transects because the walked transect is the true transect In contrast on training lines error in measurements is increased if crews do not walk on exactly the measured line that was used to place the models On average the measured distance of models to the centerline was 21 cm closer than the actual distance with increasing bias for models farther from the line The ldquoAvailable Models Detected by Leaderrdquo column reports the proportion of all models that were found first by the leader During training this number is easily calculated and is used to identify crews in which one of the observers is not finding at least 80 of all detected With an 80 detection rate for the leader a 96 detection rate is expected for the team
Table 2 Proportion of tortoise models detected within 1- 2- or 5-m of the transect centerline Values that scored below the target of 090 at 1- or 2-m are highlighted
Proportion of existing models within a given distance detected by the team
Team 1m 2m 5m
1 093 096 087 2 100 096 091 3 092 096 094 4 100 088 087 5 100 093 095 6 100 092 088 7 085 090 086 8 100 100 090 21 100 089 093 22 093 089 088 23 100 100 097 24 085 089 088 26 100 100 097 27 088 093 094 28 100 100 094 51 100 096 095 52 100 100 094 53 100 096 093 54 100 100 090 55 093 096 093 56 100 093 090 57 093 096 096 58 100 100 094 59 100 096 091 60 100 096 092 61 100 096 088 62 100 100 094
GBI 099 097 093 Kiva 096 094 090 IWS 095 094 093
Overall 097 095 092
26
Range-wide Monitoring of the Mojave Desert Tortoise 2010
Table 3 Diagnostics for individual teams after training
Team
Available models detected Measured v exact model distance (m) Estimated
abundance
95 confidence interval
Within 2m of centerline by
leader
Within 2m of centerline by
team Lower limit Upper limit
1 085 096 079 396 3023 5193
2 081 096 079 377 3268 4346
3 089 096 096 409 3437 4855
5 081 088 077 443 3596 5460
6 086 093 084 397 3451 4574
7 088 092 073 375 3197 4397
8 087 090 078 378 3415 4173
21 093 100 079 682 5243 8881
22 085 089 076 356 3184 3989
23 085 089 114 433 3941 4746
24 096 100 089 408 3269 5096
26 089 089 079 366 3241 4122
27 100 100 082 427 3135 5823
28 086 093 074 402 2960 5472
51 100 100 087 390 3253 4675
52 086 096 080 370 3308 4138
53 100 100 087 403 3652 4438
54 085 096 075 441 3697 5260
55 092 100 055 345 2946 4031
56 088 096 101 475 3881 5805
57 089 093 080 384 2868 5133
58 081 096 081 451 3772 5397
59 086 100 063 464 3801 5663
60 086 096 102 477 3558 6395
61 089 096 080 343 2978 3941
62 096 096 113 461 3841 5538
Target gt080 gt090 lt1 410
GBI 091 097 083 4152
IWS 097 094 086 3974
Kiva 092 094 081 4321
Overall 093 095 083 4156
During training personnel on 2 teams were switched after unsuccessful practice runs The resulting 2 teams are included in Tables 2 and 3 Although some individual metrics were below-par (gray cells in the above tables) the teams were all judged to perform well overall and no further changes were made During training various detection curves were fit to each crewrsquos set of tortoise model observations In no case did a negative exponential model best describe the
27
Range-wide Monitoring of the Mojave Desert Tortoise 2010
data Because this model does not involve fitting a ldquoshoulderrdquo to the data near the centerline these detection curves would have been unacceptable The best-fitting of the 3 remaining basic types of models were then fit to the data to generate the density estimates in Table 3 In Figs 6-8 each crewrsquos data were fit to uniform or half-normal models for illustration purposes Crews were not evaluated on their ability to a particular curve shape however we did provide guidance to individual crews to better match the search patterns of their teammates This was taken as an opportunity to focus field personnel on an additional level of conformity Distance sampling and development of a single detection curve from many observers is robust to the effects of pooling across observations from crews with variable search patterns as long as all of the observers contribute proportionally to the overall pattern (Marques et al 2007)
Within the GBI crews teams 51 and 52 had the most anomalous curves (broadest shoulders) in Figure 6 These teams were coached on tightening their search pattern to better match other teams however neither team had other diagnostic issues Although the IWS trainee curves as a group had broader shoulders than the GBI curves they were similar to one another and no problems are evident The Kiva detection curves were more disparate between themselves Three of these teams (1 3 and 8) left training a few days earlier than the others They had passed all of the training metrics and left to match the earlier opening of CMAGR Although the other teams received feedback and worked to match one anotherrsquos detection curves in the final trials the first three teams (the ones with the narrowest shoulders that most rapidly lose detections with increasing distance from the line) did not
00
02
04
06
08
10
0 2 4 6 8 10 12 14
DE
TE
CT
ION
PR
OB
AB
ILIT
Y
PERPENDICULAR DISTANCE (m)
Figure 6 Detection curves for each of the 2010 GBI teams during training Curves are based on 16 km trials with approximately 100 detections Anomalous patterns described in text are indicated with dotted lines
28
Range-wide Monitoring of the Mojave Desert Tortoise 2010
00
02
04
06
08
10
0 2 4 6 8 10 12 14
DE
TE
CT
ION
PR
OB
AB
ILIT
Y
PERPENDICULAR DISTANCE (m)
Figure 7 Detection curves for each of the 2010 IWS trainee teams Curves are based on 16 km trials with approximately 100 detections
00
02
04
06
08
10
0 2 4 6 8 10 12 14
DE
TE
CT
ION
PR
OB
AB
ILIT
Y
PERPENDICULAR DISTANCE (m)
Figure 8 Detection curves for each of the 2010 Kiva trainee teams Curves are based on 16 km trials with approximately 100 detections Anomalous patterns described in text are indicated with dotted lines
29
Range-wide Monitoring of the Mojave Desert Tortoise 2010
Quality assurance and quality control There were 23710 transect records and 5762 G0 records associated with the monitoring effort in 2010 After data specialists with the field teams had finished verifying and validating the data there were still 706 cases where data were inconsistent with constraints and expectations (Many more issues are addressed by data specialists for field crews before the field data are submitted) Of these 681 were errors created by the field crews (sometimes faulty equipment other times data entry error) Two hundred fifty of these could be corrected based on information collected on paper datasheets while fields that should have been populated by faulty equipment could not be addressed Another 22 errors were ldquoprocessingrdquo errors Processing steps are associated with correcting other errors (perhaps a word is misspelled) or with adding new fields or any other manipulation that occurs after the data have been collected This year the bulk of the processing errors involved additional decimals in the elevation field
Transect completion Table 4 reports the number of assigned and completed transects in each stratum Kiva was assigned 328 transects and walked this number but were not always able to replace assigned unwalked transects with alternates in the same strata As a result too few transects were completed in Chuckwalla Joshua Tree and Pinto Mountain strata and all 7 of these transects were later completed in northern strata All assigned transects were completed or replaced by IWS One transect was inadvertently walked twice (counted once) and at the end of the field season one crew was able to complete an additional transect that was not a replacement for any assigned one GBI completed more transects then the other 2 teams and also had more errors Eight transects were walked on two separate occasions (duplicates are counted as one transect in Table 4) Three of the duplicated transects were purposely repeated when the first attempt was not completed to protocol or when illness interrupted the first attempt For a variety of reasons including logistical ones 8 assigned transects were neither completed nor replaced by alternates in their strata and 2 additional transects were completed in strata that did not need replacements
Great Basin Institute began to address the issue of route-less areas that have not been accessible in any past years Base-camping into these areas allowed crews to be provisioned with supplies including water This resulted in completion of 24 transects where crews would otherwise have had to hike 5 km or more one way to access transects Any field personnel provisioning these base camps for other crews are not themselves walking transects
Table 4 indicates the number of assigned transects that could be completed as standard square 12km transects (column 4) as well as the number that were completed by reflecting around obstacles These transects are all considered to represent flatter topography in the monitoring stratum An additional number (column 5) were completed as 6 km squares (GBI) or shortened as little as possible (IWS and Kiva) and represent more rugged terrain Finally some transects were considered unwalkable (column 6)
30
Range-wide Monitoring of the Mojave Desert Tortoise 2010
The last 2 columns of Table 4 represent situations that were not anticipated Crews were to shorten or abandon transects if the terrain presented too much of an obstacle but reflecting around terrain was not a planned option However on some relatively rare occasions (column 7) crews had partially walked a transect before determining that it could not be completed following the correct protocol In these situations they would not have sufficient time to move to an alternate transect on the same day so they instead reflected around terrain to collect data for the lower topography portion of the current transect
Column 8 reports transects that appear walkable based on remote imagery but were not completed All of these were reevaluated and some were reclassified based on this [additional] year of field information (see Evaluating transect classification below) Note that transects on military installations (CMAGR Ft Irwin China Lake and Edwards AFB) are regularly but unpredictably inaccessible due to military activities This corresponds to the 7 transects listed here for CMAGR (AG) 2 on Superior-Cronese and 1 on Fremont-Kramer Figures 9 through 12 show locations of transects and observations of live tortoises
Table 4 Number and type of transects in each stratum Stratum abbreviations as in Fig 1
Assigned
Assigned and alternate transects
Assigned completed
Assigned completed
Assigned judged
unwalkable
Assigned completed by reflecting to
Assigned judged
walkable but Stratum transects completed 12k shortened avoid terrain not walked
AG 33 33 22 3 8 7 BD 68 66 38 22 6 1 CK 64 61 34 21 6 3 CM 40 40 30 2 8 1 2 CS 100 99 58 21 20 9 FE 20 20 18 2 0 FK 50 50 41 7 2 2 GB 130 128 59 46 23 4 7 IV 30 31 23 3 4 1 JT 27 25 11 11 3 1
MM 132 132 65 52 13 7 OR 25 25 14 7 4 1 PI 44 44 30 8 6 3 2 PT 20 21 8 6 4 SC 109 113 91 12 6 3
Total 892 888 542 223 113 8 46
GBI 430 425 220 141 62 4 24 IWS 134 135 101 15 18 4 5 Kiva 328 328 221 67 33 0 17
Assigned transects that were not walked were supposed to be replaced by alternates
31
Range-wide Monitoring of the Mojave Desert Tortoise 2010
Figure 9 Distribution of distance sampling transects and live tortoise observations in the Northeastern Mojave Recovery Unit (Coyote Springs Valley Mormon Mesa Beaver Dam Slope and Gold Butte-Pakoon monitoring strata)
32
Range-wide Monitoring of the Mojave Desert Tortoise 2010
Figure 10 Distribution of distance sampling transects and live tortoise observations in the Eastern Mojave Recovery Unit (Piute-Eldorado Ivanpah and Fenner monitoring strata) and the Northern Colorado Recovery Unit (Chemehuevi monitoring stratum)
33
Range-wide Monitoring of the Mojave Desert Tortoise 2010
Figure 11 Distribution of distance sampling transects and live tortoise observations in the northern portion of the Western Mojave Recovery Unit (Fremont-Kramer Superior-Cronese and Ord-Rodman monitoring strata)
34
Range-wide Monitoring of the Mojave Desert Tortoise 2010
Figure 12 Distribution of distance sampling transects and live tortoise observations in the southern portion of the Western Mojave Recovery Unit (Pinto Mountains and Joshua Tree monitoring strata) and the Eastern Colorado Recovery Unit (Chuckwalla and Chocolate Mountain monitoring strata)
35
Range-wide Monitoring of the Mojave Desert Tortoise 2010
Tortoise encounter rates and detection functions In 2010 all pairs worked together from the beginning to the end of the season Each Kiva crew walked a median of 41 transects and overall they detected 196 tortoises over 180 mm MCL GBI crews walked a median of 35 transects and detected 179 tortoises and IWS crews had considerably lower effort with a median of 23 transects (days of work) However each IWS observer subsequently walked 1-person distance transects in a separate study at the Large Scale Translocation Site near Jean Nevada altogether IWS personnel completed 40 days of work and the team observed 122 tortoises and the LSTS encounters were used to model the overall IWS detection probability illustrated in Fig 14 There were sufficient observations to generate separate detection curves for each team so I planned a minimum of 3 detection curves
Figures 13 to 16 are histograms of the observed number of tortoises seen at increasing distance from the transect centerline There is one histogram each for IWS and GBI plus separate histograms for Kiva detections in the northern and southern areas that they surveyed These observations were used to model detection curves overlaid in the same figures Based on detection function behavior it is typical to discard a few observations in the tails of the histograms in order to build a more robust model (Buckland et al 2001) Each figure indicates the customized truncation distance that was applied Any observations that are not used to estimate detection functions will also not be used to estimate the encounter rate (tortoises detected per kilometer walked) Tortoise encounter rates are low enough that this becomes a factor in considering how to truncate observations to develop detection functions Truncation was conservative in order to maximize the number of observations per stratum
For GBI the best half-normal and uniform models were within ΔAIC=147 of the better-fitting hazard rate model with much better precision for the half-normal model but no meaningful difference in density estimate between the half-normal and hazard rate models On the basis of precision I used the half-normal model with second-order cosine adjustment to fit the detection function The second-order adjustment is seen in the extra inflections in the tail of the curve (Fig 13) This additional data fitting was called for unless observations were truncated at 8 m with an unacceptable loss of 38 additional observations For IWS data were truncated at 14 m and fit best to a uniform model with a single cosine adjustment I evaluated separate curves for northern and southern detections by Kiva because there were sufficient detections for two curves and because these transects represent a long north-south gradient The AIC for the single model was greater than the sum of AICs for the separate models with the same truncation distance (same data) so separate models better fit the data In the north (Fremont-Kramer Ord-Rodman and Superior-Cronese) the data were truncated at 12 m and fitted best to a uniform model with cosine adjustment In the south data were truncated at 8 m and fit to a half-normal model
36
Range-wide Monitoring of the Mojave Desert Tortoise 2010
Figure 13 Observed detections (histogram) and the resulting detection function (smooth curve) for live tortoises with MCL ge 180mm found by GBI This curve uses only the 164 tortoise seen within 16 m of the centerline
Figure 14 Observed detections (histogram) and the resulting detection function (smooth curve) for live tortoises with MCL ge 180mm found by IWS This curve uses only the 111 tortoises seen within 14 m of the centerline
00
02
04
06
08
10
12
0 2 4 6 8 10 12 14 16
Det
ectio
n P
roba
bilit
y
Perpendicular distance (m)
00
02
04
06
08
10
12
0 1 2 3 4 5 6 7 8 9 10 11 12 13 14
Det
ectio
n P
roba
bilit
y
Perpendicular (m)
37
Range-wide Monitoring of the Mojave Desert Tortoise 2010
Figure 15 Observed detections (histogram) and the resulting detection function (smooth curve) for live tortoises with MCL ge 180mm found by Kiva in Fremont-Kramer Superior-Cronese and Ord-Rodman This curve uses only the 92 tortoises seen within 12 m of the centerline
Figure 16 Observed detections (histogram) and fitted detection function (smooth curve) for live tortoises with MCL ge 180mm found by Kiva in Joshua Tree Pinto Mountains Chuckwalla and on CMAGR This curve uses only the 85 tortoises seen within 8 m of the centerline
00
02
04
06
08
10
12
0 1 2 3 4 5 6 7 8 9 10 11 12
Det
ectio
n P
roba
bilit
y
Perpendicular distance (m)
00
02
04
06
08
10
12
0 1 2 3 4 5 6 7 8
Det
ectio
n P
roba
bilit
y
Perpendicular distance (m)
38
Range-wide Monitoring of the Mojave Desert Tortoise 2010
The area below each of the curves in Figs 13ndash16 is the proportion of tortoises that were detected Pa estimated as far as the truncation distance (the farthest distance on the x-axis in each figure) Based on these curves GBI detected 412 of the visible tortoises within 16 m of the centerline (CV=0085) The corresponding estimate of Pa for strata surveyed by IWS was 586 (CV=0060) within 14 m for Kiva in the north was 583 (CV=0070) within 12 m and for Kiva in the south it was 671 (CV=0100) within 8 m
Proportion of tortoises available for detection by line distance sampling G0
In general telemetry sites and associated transects were completed sequentially from south to north This pattern corresponds to the expected timing of tortoise activity peaking first in the south Tortoise availability was estimated separately transects in each of these areas Dates total days monitored and G0 estimates are given in Table 5
Table 5 Availability of tortoises (G0) during the period in 2010 when transects were walked in each group of neighboring strata
G0 sites
Gold-Butte Halfway Wash
Strata
Gold Butte
Dates
7 Apr ndash 22 Apr
Days
16
G0
(Std Error)
077 (0177)
Halfway Wash Beaver Dam Slope Mormon Mesa
23 Apr ndash 15 May 23 080 (0115)
Coyote Springs Valley
Piute Ivanpah Chemehuevi
Joshua Tree Chuckwalla
Coyote Springs
Piute-Eldorado Chemehuevi Fenner Ivanpah
Chocolate Mtns Chuckwalla Joshua Tree Pinto Mtns
16 May ndash 28 May
31 Mar ndash 29 Apr
23 Mar ndash 10 Apr
13
30
19
086 (0130)
082 (0179)
089 (0122)
Ord-Rodman Superior-Cronese
Fremont-Kramer Ord-Rodman Superior-Cronese
13 Apr ndash 6 May 24 096 (0066)
Proportion of available tortoises detected on the transect centerline g(0) Because they are cryptic even tortoises that are visible (not covered by dense vegetation or out of sight in a burrow) may not be detected For 50 detections of tortoises within 1 m of the transect centerline 44 were found by the observer in the lead position and 6 by the follower so that the probability of detection by single observer p = 0864 and the proportion detected using the dual observer method g(0 to 1 m) = 0981 (SE = 006) Figure 17 shows that g(0) was converging on 10 indicating the assumption of perfect detection on the centerline was met consequently no adjustment was made to the final density estimate The curves since 2004 all
39
Range-wide Monitoring of the Mojave Desert Tortoise 2010
support the premise that complete detection on the transect line was achieved for years in which the dual-observer method was used (USFWS 2009 2012)
000
020
040
060
080
100
0 2 4 6 8 10 12
Pro
port
ion
dete
cted
Distance x from transect centerline (m)
p
g(0)
Figure 17 Detection pattern for the leader (p) and by the team (g(0)) based on all observations out to a given distance (x) from the centerline in 2010 Note convergence of g(0) on 10 at the transect centerline as x goes to 0
Estimates of tortoise density Density estimates were generated separately for each monitoring stratum (Table 6) then weighted by stratum area to arrive at average density in the monitored area of each recovery unit (Table 7) Although encounter rates were estimated separately for each stratum and have independent variances the detection function and G0 were estimated jointly pooling data from multiple strata so these variances are not independent (Fig 5 illustrates how estimates were pooled for 2010)
When the annual estimates are imprecise it should not be expected that there will be a close match from one year to the next Over a period of many years however any underlying trend in the number of tortoises should be obvious through this ldquobackground noiserdquo The CVs in 2010 represent an overall improvement in precision from previous years a function of improved funding in this one year
40
Range-wide Monitoring of the Mojave Desert Tortoise 2010
Table 6 Recovery unit and stratum-level encounters and densities in 2010 for tortoises with MCL ge 180mm
Sampling Dates nRecovery Area Number of Total transect Field Density
Stratum (tortoises CV(n) CV(Density) Unit (km2) Transects length (km) Begin End Observers (km2)observed)
Northeastern Mojave 4889 425 4265 7-Apr 28-May 164 32 158
Beaver Dam Slope BD 828 66 662 23-Apr 15-May GBI 23 22 8 33 282
Coyote Springs Valley CS 1117 99 1046 16-May 28-May GBI 43 167 36 240
Gold Butte-Pakoon GB 1977 128 1258 7-Apr 22-Apr GBI 22 250 17 351
Mormon Mesa MM 968 132 1298 24-Apr 16-May GBI 76 123 55 207
Eastern Mojave 6763 95 1096 31-Mar 29-Apr 46 33 296
Fenner FE 1862 20 246 31-Mar 27-Apr IWS 23 283 69 361
Ivanpah IV 2567 31 365 1-Apr 29-Apr IWS 5 416 10 473
Piute-Eldorado PI 2334 44 485 31-Mar 29-Apr IWS 18 246 27 333
Northern Colorado 4038 40 458 31-Mar 30-Apr 26 247 42 334
Chemehuevi CM 4038 40 458 31-Mar 30-Apr IWS 26 247 42 334
Western Mojave 9336 234 2591 23-Mar 6-May 105 31 148
Fremont-Kramer FK 2462 50 574 15-Apr 6-May Kiva 19 225 25 245
Joshua Tree JT 1567 25 227 25-Mar 13-Apr Kiva 6 539 28 565
Ord-Rodman OR 1124 25 270 17-Apr 4-May Kiva 27 228 75 248
Pinto Mountains PT 751 21 213 25-Mar 10-Apr Kiva 7 514 34 542
Superior-Cronese SC 3447 113 1307 13-Apr 6-May Kiva 46 159 26 187
Eastern Colorado 4263 94 991 23-Mar 10-Apr 72 57 189
Chocolate Mountain AG 755 33 378 25-Mar 5-Apr Kiva 50 192 138 256
Chuckwalla CK 3509 61 613 23-Mar 10-Apr Kiva 22 253 37 304
41
Range-wide Monitoring of the Mojave Desert Tortoise 2010
Table 7 Estimated density of desert tortoises in monitored areas of each recovery unit in the Mojave and Colorado deserts in 2010
Lower limit Upper limit Area Kilometers Tortoises Density 95 CI 95 CI CV
Recovery Unit (km2) walked detected (km2) (Density) (Density) (Density)
Northeastern Mojave 4889 4265 164 32 236 438 158 Eastern Mojave 6763 1096 46 33 186 579 296 Northern Colorado 4038 458 26 42 222 795 334 Western Mojave 9236 2591 105 31 236 420 148 Eastern Colorado 4263 991 72 57 397 828 189
Area of each stratum sampled and the number of tortoises in that area
Evaluating transect classification In 2010 196 of the 888 walked transects were not completed as predicted The following table summarizes conclusions after examining these transects
Table 8 Transects completed other than as planned and any resulting reclassification
Previous New Number of Situation
substratum substratum transects 12k On-the-ground observation differs from imagery 6k 21
Shortened in 2010 but previous experience or correct 12k 12k 52
modification would allow completion 6k On-the-ground observation differs from imagery 12k 31
Unwalkable On-the-ground observation differs from imagery 12k 16 New rules to reflect into stratum moved transect out of too-
Unwalkable 12k 12rugged terrain
Unwalkable On-the-ground observation differs from imagery 6k 19 Lengthened in 2010 but other crews might be unable to walk
6k 6k 18as a 12k Crew completed the transect using incorrect protocols or
Unwalkable Unwalkable 11attempted new rules but couldnrsquot walk at least 6km New shortening rules allowed at least 6km completed but
Unwalkable Shortened 16earlier rules would have classified these as unwalkable
Twenty-eight transects that would have been unwalkable under the previous protocols were attempted and completed this year using new rules to reflect into stratum boundaries (range-wide) and to shorten transects by walking only the safely walkable portions of the 12 km route (Kiva and IWS field teams only) In the first case 12 transects were completed because they were correctly reflected into strata under new rules These otherwise unwalkable transects were completed because stratum boundaries were often drawn to exclude more rugged topography Sixteen previously unwalkable transects were walked for at least 6 km using new rules to shorten transects without completing the SW quadrant These would still be ldquounwalkablerdquo under the original classification system
42
Range-wide Monitoring of the Mojave Desert Tortoise 2010
After the field season 168 anomalous transects were reviewed Of these 87 were reclassified based on crew experience In some cases the crews encountered substrate or other features that were not apparent from imagery in many others the original classification based on imagery was ambiguous because over the course of a 12 km transect terrain is so variable to that it was not a simple matter to evaluate the time required for a typical crew to complete it The remaining 81 anomalous transects were not reclassified either because the classification still seems ambiguous or because the crewrsquos modification was based on access illness or considerations unrelated to terrain
Proportion of each stratum walked The proportion of each stratum walked in 2010 could be calculated based on the proportion of transects shortened andor replaced (GBI) or based on the proportion of kilometers walked based on the expectation that 12 km should be walked for each transect assigned (Kiva and IWS) In 2008 and 2009 only the previous method was used and all transects assigned in 2010 had already been classified as 12k 6k or unwalkable To test the comparability of estimating the unsampled part of each stratum I calculated the number of kilometers expected to be walked based on the 12k6kunwalkable classification of each assigned transect then compared this to the proportion of kilometers estimate (Table 9)
Table 9 Proportion of each stratum that can be sampled Stratum abbreviations as in Fig 1
Proportion assigned transects expected to be walked ashellip Km walked
Assigned Stratum transects 12k 6k Replaced Expected Observed Chi-sq
AG 33 848 121 3 375 2886 198 BD 66 606 303 91 600 5905 01 CK 61 639 18 18 600 5652 20 CM 40 775 75 15 417 3772 38 CS 99 606 273 121 882 8243 38 FE 20 100 0 0 240 2335 02 FK 50 94 6 0 591 5496 29 GB 128 484 352 164 1014 9902 05 IV 30 867 0 133 324 3051 11 JT 25 56 24 20 237 1976 66
MM 130 531 392 77 1134 10915 16 OR 25 68 20 12 258 2329 24 PI 44 705 182 114 459 4175 38 PT 18 50 111 389 147 1406 03 SC 109 89 64 46 1242 12029 12
Total 878 8520 8007 501 GBI 423 3630 3496 61 IWS 134 1440 1333 89 Kiva 321 3449 3177 352
43
Range-wide Monitoring of the Mojave Desert Tortoise 2010
Chi-squared values in the final column indicate a poor fit between predictions and completion at CMAGR which is not surprising given constraints on access to different parts of the range each year (crews frequently cannot get access to otherwise walkable transects so these transects are replaced) With the exception of CMAGR the strata individually and for each group combined indicate that the completed kilometers were accurately predicted regardless of method used to estimate unwalkable terrain
This means we can use the observed kilometers walked to estimate the area over which our density estimates apply For strata walked by GBI we can use the proportion of transects classified as 12k6kunwalkable instead Because this project uses the same base set of transects each year the majority of transects have been walked in multiple years Table 9 demonstrates that the 2 methods of estimating the proportion of area sampled are equivalent so we can develop a more representative estimate of the walkable area of these strata if we use empirical data from all transects walked between 2008 and 2011 (the latest set of compiled data) Since 2008 2464 separate transects have been evaluated in these strata this is a much larger (representative) sample than the 878 evaluated only in 2010 Table 10 gives the area of each stratum the proportion covered by our density estimates and converts the density in each stratum into an estimate of tortoise abundance
Table 10 Estimated tortoise abundance in sampled areas of each stratum The ldquoproportion sampledrdquo column is based on evaluation of all transects in the sample set from 2008 through 2011 Stratum abbreviations as in Fig 1
Area Proportion SE(Prop Sampled N (number 95 Confidence Interval Stratum (km2) sampled Sampled) area (km2) of tortoises) Lower Limit Upper Limit
AG 755 095 0024 715 9863 60058 161977 BD 828 089 0032 738 2422 14013 41853 CK 3509 082 0030 2890 10804 60077 194313 CM 4038 093 0023 3755 15788 83362 299009 CS 1117 086 0031 958 3471 21707 55514 FE 1862 096 0020 1790 12419 62465 246911 FK 2462 096 0017 2372 5869 36520 94318 GB 1977 081 0027 1604 2782 14224 54410 IV 2567 095 0021 2442 2476 10247 59806 JT 1567 074 0033 1159 3197 11360 89963
MM 968 086 0034 836 4624 30712 69628 OR 1124 073 0040 821 6119 37498 99865 PI 2334 082 0024 1911 5249 27733 99354 PT 751 069 0051 522 1785 6553 48634 SC 3332 095 0015 3149 8276 57509 119102
Total 29190 0879 24656 95145 770367 1175107
44
Range-wide Monitoring of the Mojave Desert Tortoise 2010
Debriefing to identify strengths and weaknesses in preparation for future years This meeting was held on 8 June about 1 week after all field work was completed The following issues were identified for coordinated effort rather than by efforts of single parties
Need for more central responsibility for planning data It was decided that starting in 2011 MDEP will host server-based [GIS] information for use by mapmakers Through 2010 MDEP has provided Mojave-wide data layers to individual field teams and assigned transects were identified by the UTM coordinates of their southwestern corners Because there was little central oversight over how these data were acquired and used different field teams had variable map quality and occasionally shifted transects when processing the corner coordinates into full square transects This processing including any planned shortening andor reflections should be repeatable each time the same transect is assigned so centralized responsibility for this would be a better option
Training improvements to make more effective use of same time period In 2010 there were more trainees from more teams in the same areas for training at the same time Use of the Desert Tortoise Conservation Center would be improved by setting up more stations (with more instructors) for smaller groups of trainees Also although objectives have been articulated for instructed material this is not the case for the many days available for designated field practice On those days additional oversight and specific objectives that can be evaluated would improve effectiveness and provide additional feedback to crews
Current hardware is less trustworthy and cannot utilize improved software Since 2007 responsibility for providing the same data collection systems to all field teams has been centralized with the USFWS Those units (data collection systems including connected GPS) are now outdated and will be replaced under advisement from MDEP and UNR
Not all QAQC errors remedied by the end of field season Two types of errors occurred during the field season and were not corrected effectively This resulted in 7 of the 888 transects inadvertently being walked twice and in different types of first-level QAQC reporting errors from the 2 different data specialists Although they were trained together by UNR their approaches seemed to diverge as they addressed data errors In 2011 the ldquoend-userrdquo (Topoworks) will spend more time training specialists This work will also emphasize steps to take to avoid duplicating effort on any transects
DISCUSSION
Sampling representatively in all monitoring strata Since 2007 transects have been placed systematically in monitoring strata the placement scheme itself had a random origin so that transects were located at random with respect to tortoises The goal of systematic placement is used to provide better coverage of sampled areas yet the random aspect of this design also allows inference about the entire sampled area Because
45
Range-wide Monitoring of the Mojave Desert Tortoise 2010
the same set of potential transect locations will be used to sample from in future years it is meaningful to collect information describing access and completion of each transect so that this information is available when planning to walk this transect location in future years
The current sampling design allows us to 1) estimate the actual area to which our density estimates apply some areas are too rugged for humans to access and therefore 2) apply the density estimate to this sampled area to arrive at an abundance estimate in each monitoring stratum
Training developments Training has received focused attention each year This training improves the performance of individual crews but also helps to standardize the application of protocols among different field teams In 2010 experienced crew personnel worked with new trainees in their own and in different teams to add a new level of cohesiveness between field teams This attention to standardized procedures is maintained during the field season with frequent customized written crew evaluations and we attribute continued high performance in 2010 directly to this focus on standardized training and implementation of protocols No correction for failure to detect visible tortoises on the centerline have been made to density estimates since 2004 (prior to that a 3-pass method was used to ensure all tortoises were detected) Training data in 2010 indicate that crews were detecting all tortoise models on the testing centerline and by the end of training first-year crews were performing as well as experienced crews
Improving ability to detect trends in desert tortoise abundance The primary goal of the monitoring program is to provide population estimates that are relevant to the recovery plan criteria (USFWS 2011) The related priority is therefore to improve ability to detect trends in desert tortoise abundance at the recovery unit level
There were new and enhanced funding sources in 2010 so that all strata had more than the minimum number of transects Associated with the relatively high estimates of tortoise visibility (G0) more tortoises were seen in some recovery units even accounting for the enhanced level of effort Whereas funding opportunities are under agency control the particularly mild spring season also contributed to improved density estimates in most of the range The notable exception was the Eastern MojaveNorthern Colorado where the number of funded transects was still below optimal and the spring weather was cooler than optimal for tortoises to be out and visible most of the time In the remaining 3 monitored recovery units the coefficient of variation for density estimates was between 15 and 20 of the density estimate ndash reflecting an extremely successful field season The Eastern MojaveNorthern Colorado recovery units had density estimates with lower precision (CV=295 and 334 respectively) a reminder that insufficient funding and unseasonable conditions can act separately to thwart our coordinated efforts for range-wide density estimates
46
Range-wide Monitoring of the Mojave Desert Tortoise 2010
LITERATURE CITED
Anderson DR and KP Burnham 1996 A monitoring program for the desert tortoise Report to the Desert Tortoise Management Oversight Group
Anderson DR KP Burnham BC Lubow L Thomas PS Corn PA Medica and RW Marlow 2001 Field trials of line transect methods applied to estimation of desert tortoise abundance Journal of Wildlife Management 65583-597
Averill-Murray RC and A Averill-Murray 2005 Regional-scale estimation of density and habitat use of the desert tortoise (Gopherus agassizii) in Arizona Journal of Herpetology 3965ndash72
Berry KH and LL Nicholson 1984 The distribution and density of desert tortoise populations in California in the 1970rsquos Chapter 2 in KH Berry (ed) The status of the desert tortoise (Gopherus agassizii) in the United States Desert Tortoise Council Report to the US Fish and Wildlife Service Order No 11310-0083-81
Buckland ST DR Anderson KP Burnham JL Laake DL Borchers and L Thomas 2001 Introduction to Distance Sampling Estimating Abundance of Biological Populations Oxford Univ Press Oxford 432 pp
Corn PS 1994 Recent trends of desert tortoise populations in the Mojave Desert Fish and Wildlife Research 1385-93
Luckenbach RA 1982 Ecology and management of the desert tortoise (Gopherus agassizii) in California In RB Bury (ed) North American Tortoises Conservation and Ecology US Fish and Wildlife Service Wildlife Research Report 12 Washington DC
Marques TA L Thomas SG Fancy and ST Buckland 2007 Improving estimates of bird density using multiple-covariate distance sampling The Auk 124(4) 1229-1243
McLuckie AM M Ratchford and RA Fridell 2012 Regional desert tortoise monitoring in the Red Cliffs Desert Reserve 2011 Salt Lake City Utah Division of Wildlife Resources Publication Number 12-13 54 pp
Murphy RW KH Berry T Edwards AE Leviton A Lathrop JD Riedle 2011 The dazed and confused identity of Agassizs land tortoise Gopherus agassizii (Testudines Testudinidae) with the description of a new species and its consequences for conservation ZooKeys 113 33-71 doi 103897zookeys1131353
47
Range-wide Monitoring of the Mojave Desert Tortoise 2010
SPSS Inc 2010 PASW Statistics Rel 1802 Chicago SPSS Inc
Swann DE RC Averill-Murray and CR Schwalbe 2002 Distance sampling for Sonoran desert tortoises Journal of Wildlife Management 66969ndash975
Thomas L ST Buckland EA Rexstad JL Laake S Strindberg SL Hedley JRB Bishop TA Marques and KP Burnham 2010 Distance software design and analysis of distance sampling surveys for estimating population size Journal of Applied Ecology 475-14
Tracy CR RC Averill-Murray WI Boarman D Delehanty JS Heaton ED McCoy DJ Morafka KE Nussear BE Hagerty and PA Medica 2004 Desert Tortoise Recovery Plan Assessment Report to the US Fish and Wildlife Service Reno Nevada
[USFWS] US Fish and Wildlife Service 1994 Desert Tortoise (Mojave Population) Recovery Plan US Fish and Wildlife Service Portland Oregon
[USFWS] US Fish and Wildlife Service 2006 Range-wide Monitoring of the Mojave Population of the Desert Tortoise 2001-2005 Summary Report Report by the Desert Tortoise Recovery Office US Fish and Wildlife Service Reno Nevada
[USFWS] US Fish and Wildlife Service 2009 Range-wide Monitoring of the Mojave Population of the Desert Tortoise 2007 Annual Report Report by the Desert Tortoise Recovery Office US Fish and Wildlife Service Reno Nevada
[USFWS] US Fish and Wildlife Service 2010 Desert Tortoise Monitoring Handbook Desert Tortoise Recovery Office US Fish and Wildlife Service Reno Nevada Version 2 March 2010 httpwwwfwsgovnevadadesert_tortoisereports
[USFWS] US Fish and Wildlife Service 2011 Revised recovery plan for the Mojave Population of the desert tortoise (Gopherus agassizii) US Fish and Wildlife Service Pacific Southwest Region Sacramento California 222 pp
[USFWS] US Fish and Wildlife Service 2012 Range-wide Monitoring of the Mojave Desert Tortoise 2008 and 2009 Reporting Report by the Desert Tortoise Recovery Office US Fish and Wildlife Service Reno Nevada
White GC DR Anderson KP Burnham and DL Otis 1982 Capture-recapture and removal methods for sampling closed populations LA-87-87-NERP Los Alamos National Laboratory Los Alamos NM 235pp
48

Recommended Citation US Fish and Wildlife Service 2012 Range-wide Monitoring of the Mojave Desert Tortoise (Gopherus agassizii) 2010 Annual Report Report by the Desert Tortoise Recovery Office US Fish and Wildlife Service Reno Nevada
Erratum Table 7 was corrected and replaced on 10 June 2013
TABLE OF CONTENTS
Executive Summary 5 Introduction 8 Methods 9
Study areas and transect locations 9 Transect completion 11
Modification of previous procedures 13 Proportion of tortoises available for detection by line distance sampling G0 15 Field observer training 16
Telemetry training 16 Distance sampling training 16
Data management including quality assurance and quality control 19 Tortoise encounter rate and development of detection functions 20 Proportion of available tortoises detected on the transect centerline g(0) 21 Estimates of tortoise density 22 Estimating the area of each stratum sampled and the number of tortoises in that area 24
Modification of previous procedures 25 Debriefing to describe strengths and weaknesses of project preparation and execution 25
Results 25 Field observer training 25
Proportion of tortoises detected at distances from the transect centerline 25 Quality assurance and quality control 30 Transect completion 30 Tortoise encounter rates and detection functions 36 Proportion of tortoises available for detection by line distance sampling G0 39 Proportion of available tortoises detected on the transect centerline g(0) 39 Estimates of tortoise density 40 Area of each stratum sampled and the number of tortoises in that area 42
Evaluating transect classification 42 Proportion of each stratum walked 43
Debriefing to identify strengths and weaknesses in preparation for future years 45 Need for more central responsibility for planning data 45 Training improvements to make more effective use of same time period 45 Current hardware is less trustworthy and cannot utilize improved software 45 Not all QAQC errors remedied by the end of field season 45
Discussion 45 Sampling representatively in all monitoring strata 45 Training developments 46 Improving ability to detect trends in desert tortoise abundance 46
Literature Cited 47
i
LIST OF TABLES
Table 1 Training schedule for 2010 17 Table 2 Proportion of tortoise models detected within 1- 2- or 5-m of the transect centerline
Values that scored below the target of 090 at 1- or 2-m are highlighted 26 Table 3 Diagnostics for individual teams after training 27 Table 4 Number and type of transects in each stratum Stratum abbreviations as in Fig 1 31 Table 5 Availability of tortoises (G0) during the period in 2010 when transects were walked in
each group of neighboring strata 39 Table 6 Recovery unit and stratum-level encounters and densities in 2010 for tortoises with
Table 7 Estimated density of desert tortoises in monitored areas of each recovery unit in the MCL ge 180mm 41
Mojave and Colorado deserts in 2010 42 Table 8 Transects completed other than as planned and any resulting reclassification 42 Table 9 Proportion of each stratum that can be sampled Stratum abbreviations as in Fig 1 43 Table 10 Estimated tortoise abundance in sampled areas of each stratum The ldquoproportion
sampledrdquo column is based on evaluation of all transects in the sample set from 2008 through 2011 Stratum abbreviations as in Fig 1 44
LIST OF FIGURES
Figure 1 Sampled areas 2010 10 Figure 2 Planned (dotted lines) and reflected transect paths at administrative boundaries now
also applied to stratum edges A) One-corner reflection B) Two-corner reflection 14 Figure 3 Data flow from collection through final products 20 Figure 4 Relationship between single-observer detections (by the leader p) and dual-observer
(team) detections g(0) 22 Figure 5 Process for developing density estimates in 2010 For each type of estimate the full set
of data was subdivided appropriately USFWS (1994) recovery units are used for this analysis 23
Figure 6 Detection curves for each of the 2010 GBI teams during training Curves are based on 16 km trials with approximately 100 detections Anomalous patterns described in text are indicated with dotted lines 28
Figure 7 Detection curves for each of the 2010 IWS trainee teams Curves are based on 16 km trials with approximately 100 detections 29
Figure 8 Detection curves for each of the 2010 Kiva trainee teams Curves are based on 16 km trials with approximately 100 detections Anomalous patterns described in text are indicated with dotted lines 29
ii
Figure 9 Distribution of distance sampling transects and live tortoise observations in the Northeastern Mojave Recovery Unit (Coyote Springs Valley Mormon Mesa Beaver Dam Slope and Gold Butte-Pakoon monitoring strata) 32
Figure 10 Distribution of distance sampling transects and live tortoise observations in the Eastern Mojave Recovery Unit (Piute-Eldorado Ivanpah and Fenner monitoring strata) and the Northern Colorado Recovery Unit (Chemehuevi monitoring stratum) 33
Figure 11 Distribution of distance sampling transects and live tortoise observations in the northern portion of the Western Mojave Recovery Unit (Fremont-Kramer Superior-Cronese and Ord-Rodman monitoring strata) 34
Figure 12 Distribution of distance sampling transects and live tortoise observations in the southern portion of the Western Mojave Recovery Unit (Pinto Mountains and Joshua Tree monitoring strata) and the Eastern Colorado Recovery Unit (Chuckwalla and Chocolate Mountain monitoring strata) 35
Figure 13 Observed detections (histogram) and the resulting detection function (smooth curve) for live tortoises with MCL ge 180mm found by GBI This curve uses only the 164 tortoise seen within 16 m of the centerline 37
Figure 14 Observed detections (histogram) and the resulting detection function (smooth curve) for live tortoises with MCL ge 180mm found by IWS This curve uses only the 111 tortoises seen within 14 m of the centerline 37
Figure 15 Observed detections (histogram) and the resulting detection function (smooth curve) for live tortoises with MCL ge 180mm found by Kiva in Fremont-Kramer Superior-Cronese and Ord-Rodman This curve uses only the 92 tortoises seen within 12 m of the centerline 38
Figure 16 Observed detections (histogram) and fitted detection function (smooth curve) for live tortoises with MCL ge 180mm found by Kiva in Joshua Tree Pinto Mountains Chuckwalla and on CMAGR This curve uses only the 85 tortoises seen within 8 m of the centerline 38
Figure 17 Detection pattern for the leader (p) and by the team (g(0)) based on all observations out to a given distance (x) from the centerline in 2010 Note convergence of g(0) on 10 at the transect centerline as x goes to 0 40
iii
ACKNOWLEDGEMENTS
Funding or support-in-kind was provided by Fort Irwin National Training Center Chocolate Mountain Aerial Gunnery Range Joshua Tree National Park the National Park Service portion of Grand Canyon-Parashant National Monument the California Desert District of the Bureau of Land Management and the Arizona Strip Office of the Bureau of Land Management
The original design for this project and considerations for optimizing it based on new information and experience were first set out in Anderson and Burnham (1996) and Anderson et al (2001) Estimation methods were further refined during a 2008 workshop for distance sampling held by S Buckland L Thomas T Marques E Rexstad and D Harris in Marshall California
Personnel from Kiva Biological Consulting (California) led by I Daly from the Institute for Wildlife Studies (California and Nevada) led by J Young and from the Great Basin Institute (Nevada Arizona and the Beaver Dam Slope of Utah) led by T Christopher conducted the field surveys The field monitors from these teams and from Joshua Tree National Park who did the hard work of collecting and verifying the data were P Aplin L Baierl L Baltic T Bartels M Bassett S Boisvert D Buchner A Carlson S Carlton H Converse C Conway I Daly E Davis J Dear A dEpremesnil RJ DePond A Devens K Dutcher S Dykman K Foley M Fossum S Fritts P Fuchs C Giuliano C Glassbrenner K Goodale D Halbruner P Havlik J Helvey K Holcomb J Houck M-E Jacques D Kaleta S Karinen L Keener-Eck D Kent G Keyes C Klehm K Lalumiere W Lee S Lillie P Livingston T Magart E Mastrelli C McClurg O Miano N Mikle L Mjos B Nieto B OBrien T Ose J Reilly T Rodgers K Rohling S Root A Salonikios K Schmidt K Shelp B Sparks A Steeley S Treu C Truettner R Vaghini A Wiley N Wiley K Yasuda
R Patil (University of Nevada Reno) M Brenneman (Topoworks) J Johnson (Arizona Exotic Animal Hospital) P Kahn and N Lamberski (San Diego Zoo) and T Christopher B Sparks and K Dutcher (GBI) provided specialized training instruction for field crews D Zeliff R Schultz and L Powell (Mojave Desert Ecosystem Program) provided preseason GIS support as well as independent review and post-processing of data submitted by both field groups R Patil (University of Nevada Reno) updated the electronic data-collection forms and procedures used in 2010 M Brenneman developed GIS procedures for correctly reflecting transect paths into monitoring strata where they would otherwise have overlapped She also developed the final databases
iv
EXECUTIVE SUMMARY
The recovery program for desert tortoises in the Mojave and Colorado deserts (USFWS 2011) requires range-wide long-term monitoring to determine whether recovery goals are met Specifically will population trends within recovery units increase for a period of 25 years In 1999 the Desert Tortoise Management Oversight Group endorsed the use of line distance sampling (Buckland et al 2001) as the method for estimating range-wide desert tortoise density From 2001 to 2005 and again from 2007 through 2010 desert tortoise populations in 5 of the 6 recovery units have been part of a coordinated range-wide monitoring program using line distance sampling (The Upper Virgin River Recovery Unit is monitored by Utah Division of Wildlife Resources (McLuckie et al 2012)) The first 5 years of monitoring culminated in a summary report (USFWS 2006) that included eleven recommendations seven of which were tied to functioning of the monitoring program and are paraphrased here
1 The range-wide monitoring program should continue under a formal study plan subject to scientific review
2 Refine [line distance sampling] techniques to improve sampling efficiency and estimates of trends
3 Evaluate the spatial scale of the monitoring program 4 Improve training lines 5 Evaluate the use of independent field teams to improve data consistency and quality 6 Refine and formalizedocument the QAQC process 7 Identify and assess options for securing continued funding for range-wide population
monitoring
This report describes the full set of quality assurance steps and final results for the 2010 monitoring effort The above issues continue to drive review and improvement of the program so that reporting also addresses these aspects of the annual effort The range-wide monitoring effort is directed each year at 15 strata that will be used to describe long-term trends Data were collected on transects by field personnel working with three different groups Kiva Biological (18 personnel) the Institute for Wildlife Studies (15 personnel) and Great Basin Institute (30 personnel) Four personnel from Joshua Tree National Park also collected telemetry data in the Park After an intensive 12-day specialized training session crews completed 878 transects (9401km) between 22 March and 28 May In the course of these surveys they reported 540 live tortoises
Training is provided each year so that field crews are familiar with the specifics of distance sampling Training also ensures consistency between the many crews collecting data Inexperienced crews as well as those with prior experience participated in preseason training and testing provided by the USFWS Crews were passed after demonstrating appropriate detection
5
Range-wide Monitoring of the Mojave Desert Tortoise 2010
patterns (including detection proportion on the transect line) measurement accuracy from tortoise models to the transect line and other skills Two of the teams passed after retesting with a different partner
Four parameter estimates contribute to final reported tortoise densities in each monitoring stratum The basis for distance sampling is the estimation of the number of tortoises detected at increasing distances from the walked transect As surveyors look farther from the transect centerline they will detect fewer and fewer of the tortoises that are actually there so describing the way detections decrease with distance allows for estimation of the proportion that were present but not detected within a given distance of the centerline Second an estimate is made of the proportion above ground or visible in their burrows and available to be detected on transects Third the first two estimates are combined with the number of tortoises encountered per kilometer walked to provide the actual density in each stratum Finally the proportion detected on the line must be estimated Unless all tortoises were detected on the centerline the density estimate must be adjusted to account for the occurrence of these additional tortoises
Separate detection curves were used to describe the decreasing ability of each team to see tortoises that were farther from the walked transect line These detection curves will capture any differences between teams in application of the protocol but are mostly expected to reflect the terrain as well as the extent to which vegetation obscures the view in different parts of the range since the curves account for tortoises that were present in the same area but not seen In the southern part of the range Kiva crews detected 67 of tortoises within 8 m of the transect centerline and 58 out to 12 m from the line in the northern area that they sampled GBI detected 41 out to 16 m and IWS detected 59 to 14 m The proportion of tortoises that were visible to be counted (G0) varied in different parts of the range which were surveyed at different times during the spring season Visibility was as high as 96 in the Superior-Cronese telemetry site during the last 2 weeks of April The lowest visibility was measured at 77 at the Gold Butte telemetry site also monitored during the first 2 weeks of April On average crews walked 23 km for each tortoise that was observed but this number varied considerably between monitoring strata Although densities in the Northeastern Mojave Recovery Unit had been estimated at less than 2km2 in previous years the density was estimated at 32 tortoiseskm2 this year similar to 2009 The Western and Eastern Mojave recovery units also had densities under 4km2 whereas the 2 recovery units in the Colorado Desert measured at 42km2 (Northern Colorado) and 57km2 (Eastern Colorado) Within the Eastern Colorado Recovery Unit the BLM areas had a density of only 37km2 whereas we estimated the density of tortoises on CMAGR at 138 tortoiseskm2 The Fenner and Ord-Rodman CHUs also had notably high density estimates at 69 and 75 tortoiseskm2 respectively This pattern of higher densities in these 3 monitoring strata has been fairly consistent over the years
6
Range-wide Monitoring of the Mojave Desert Tortoise 2010
To enable field crews to complete transects in previously unsampled areas within strata a set of guidelines was implemented in 2008 and 2009 for modifying transects in areas with rugged terrain or other obstacles (USFWS 2012) These rules did enable crews to sample entire strata in a more representative way however in areas of California with lower funding the resulting substrata never had enough transects or tortoise observations to separately evaluate tortoise densities in flat compared to rugged terrain For this reason in 2010 all transects in all recovery units except the Northeastern Mojave were to be completed to the extent possible along the original 12 km path Mountainous terrain in the path was circumnavigated without searching for tortoises and the path was resumed when possible This method keeps transects in representative areas and also allows the proportion of unwalkable terrain to be estimated The proportion of kilometers actually walked under this new method matched the expected number of kilometers based on the earlier modified-transect protocols
Finally the success of the range-wide monitoring program also depends on developing reliable adequate and consistent funding Results from earlier years of this project illustrated clearly that sufficient effort (transects) in each stratum is needed to encounter several tortoises otherwise estimates are not possible In 2010 funding enabled estimation of tortoise densities in all strata to at least a minimum extent better than any year since 2005 Effective implementation of this program requires stable funding so that monitoring effort matches planning requirements rather than funding limitations
7
Range-wide Monitoring of the Mojave Desert Tortoise 2010
RANGE-WIDE MONITORING OF THE MOJAVE DESERT TORTOISE
2010
INTRODUCTION
The Mojave Desert population of the desert tortoise (Gopherus agassizii) was listed as threatened under the Endangered Species Act in 1990 This group of desert tortoises north and west of the Colorado River are now recognized as the species G agassizii separate from G morafkai south and east of the Colorado River (Murphy et al 2011) The original (USFWS 1994) and revised recovery plan (USFWS 2011) designate recovery units to which decisions about continued listing status should be applied Because the 2010 monitoring effort preceded the revised recovery plan data records were associated with the original recovery units so results reported here also use those recovery units The recovery plan specifies that consideration of delisting should only proceed when populations in each recovery unit have increased for at least one tortoise generation (25 years) and the only means to determine trend is by a rigorous program of long-term monitoring Before the tortoise was listed populations were monitored either using strip transects (Luckenbach 1982) where indications of tortoise presence (live or dead tortoises scats burrows or tracks) were converted to tortoise abundance categories based on calibration transects conducted in areas of better-known tortoise density or by using capture-recapture population estimates on a limited number of (usually) 1-mi2 study plots (Berry and Nicholson 1984) Although data have continued to be collected on transects and study plots in recent years these methods suffer statistical deficiencies andor logistical constraints that render them unsuited for monitoring trends in abundance applicable to entire recovery units (Corn 1994 Anderson et al 2001 Tracy et al 2004) In 1999 the Desert Tortoise Management Oversight Group endorsed the use of line distance sampling (Buckland et al 2001) for estimating range-wide desert tortoise density
Distance sampling methods use measurements taken from the center of the transect lines to tortoises to model detection as a function of distance from the walked path tortoises farther from the travelled path have a lower probability of detection In order to anchor the curve and estimate the true (not relative) proportion of tortoises detection within a given distance from the center of the transect all tortoises must be detected on the transect centerline (Anderson et al 2001 Buckland et al 2001) There are additional assumptions in distance analysis ndash that distance is measured to the point where the animal was first detected and that distance is measured accurately ndash but these are easily satisfied in line distance sampling of desert tortoises The assumption that detection at the centerline of the transect is perfect however can be violated during line distance sampling of tortoises but the use of two observers minimizes the probability that tortoises are missed on the centerline and provides a correction factor in the form of an estimate of the number of tortoises on the line that were missed (USFWS 2009)
8
Range-wide Monitoring of the Mojave Desert Tortoise 2010
Distance methods have been applied to estimate abundance of Sonoran Desert Tortoises (G morafkai) since 2000 (Swann et al 2002 Averill-Murray and Averill-Murray 2005) and for G agassizii in the Upper Virgin River Recovery Unit in Utah since a pilot study in 1997 (McLuckie et al 2012) The USFWS used line distance sampling to estimate abundance of tortoises in the remaining five recovery units for G agassizii in Utah Arizona Nevada and California starting in 2001 (USFWS 2006 2009 and 2012) This report includes results of training exercises for field crews describes implementation of monitoring in 2010 and presents the analysis of desert tortoise density in 2010
METHODS
Study areas and transect locations Long-term monitoring strata (Fig 1) will be used over the life of the project to describe population trends in areas managed to conserve tortoises (ldquotortoise conservation areasrdquo TCAs) Generally each critical habitat unit (CHU) is treated as one monitoring stratum although the portion of Mormon Mesa CHU that is associated with Coyote Springs Valley is treated as a separate stratum Chuckwalla CHU is also treated as dual monitoring strata with potentially unequal sampling effort in the areas managed by the Department of Defense (Chocolate Mountain Aerial Gunnery Range CMAGR) and by the Bureau of Land Management (BLM) The Piute and Eldorado Valleys are currently treated as one monitoring stratum although they are in different recovery units The Joshua Tree stratum does not encompass all suitable habitat for desert tortoises in Joshua Tree National Park (JTNP) The national park designation and current boundaries just post-date the designation of CHUs so some of the Pinto Mountains and Chuckwalla CHUs (and monitoring strata) are in the current JTNP
The optimal number of transects in a monitoring stratum was determined by evaluating how these samples would contribute to the precision of the annual density estimate for a given recovery unit (Anderson and Burnham 1996) Power to detect an increasing population size is a function of 1) the magnitude of the increasing trend 2) the ldquobackground noiserdquo against which the trend operates and 3) the period of time (even a small annual population increase will result in a noticeably larger population size if the increase continues for many years)
The magnitude of the population trend is a function of recovery activities and the population dynamics of the tortoise ndash neither of these elements are affected by monitoring design and sample size The second contributor to the power to detect a trend ndash the level of background variability in the density estimates ndash is directly affected by the number length and placement of transects in the monitoring strata Anderson and Burnham (1996) recommended that transect number and length be chosen to target precision reflected in a coefficient of variation (CV) of 10-15 for the estimate of importance (here density for tortoise conservation areas in each recovery unit) The CV describes the standard deviation (a measure of variability) as a
9
Range-wide Monitoring of the Mojave Desert Tortoise 2010
Figure 1 Sampled areas 2010
10
Range-wide Monitoring of the Mojave Desert Tortoise 2010
proportion of the mean and is often converted to a percentage Since recovery criteria target trends within recovery units (USFWS 1994 and 2011) precision in that density estimate was the focus The target CV is achieved based on the number of tortoises that might be encountered there (some strata currently have higher densities than others) as well as the area of the stratum ndash its proportional contribution to the recovery unit density estimate (Buckland et al 2001)
The actual number of transects assigned in each stratum was a function of the optimal numbers described above as well as on available funding Once the number of transects in a stratum was determined these were laid out systematically across strata with a random origin for the lattice of transects In strata with more assigned transects nested lattices with smaller spacing (3 km) were used to ensure sufficient transects In strata with fewer transects lattices 9 km spacing were used Systematic placement provides more even coverage of the entire stratum something that may not occur when strictly random placement of transects is used In both cases transects are located at random with respect to the location of desert tortoises
Transect completion One adaptation that tortoises have for living in the desert is to restrict surface activity to fairly narrow windows of time during the year In general tortoises emerge from deep within shelters (burrows) from mid-March through mid-May and then again (less predictably) in the fall These periods coincide with flowering of their preferred food plants (in spring) and with annual mating cycles (in fall) The annual range-wide monitoring effort is scheduled to match the spring activity period for tortoises
During this season not all tortoises are above ground or visible in burrows To encounter as many tortoises as possible monitoring is scheduled for early in the day and to be completed before the hottest time of day Because tortoises are located visually monitoring is restricted to daylight hours Based on past experience we expect tortoises to become most active after 7am at the beginning of April (it is usually too cool before this time) but to emerge earlier and earlier until their optimal activity period includes sunrise by the beginning of May In May we also expect daytime temperatures to limit tortoise above-ground activity as the morning progresses to afternoon
Field crews complete transects during this optimal period each day Start times are decided a week in advance so crews arrive at transects at similar times on a given morning However completion times will be more variable as a consequence of terrain air temperature number of tortoises encountered etc Under normal conditions each team walked one 12 km square transect each day Teams were comprised of 2 field personnel who switched lead and follow positions at each corner of each transect so they each spent an equal amount of time in the leader and follower positions The leader walked on the designated compass bearing while pulling a 25 m length of durable cord the walked path is also the transect centerline and was indicated by the
11
Range-wide Monitoring of the Mojave Desert Tortoise 2010
location of the cord The length of cord also spaced the two independent observers guiding the path of the follower when the cord was placed on the ground after a tortoise or carcass was detected it facilitated measurement of the local transect bearing The walked length of each transect was calculated as the straight-line distance between GPS point coordinates that were recorded at 500 m intervals (waypoints) along the transect andor whenever the transect bearing changed
Both leader and follower scanned for tortoises independently without leaving the centerline and the role of the crew member finding each tortoise was recorded in the data Although the leader saw most of the tortoises the role of the follower was to see any remaining tortoises near the centerline so the follower role is crucial to unbiased estimation of tortoise densities
Distance sampling requires that distance from the transect centerline to tortoises is measured accurately When a tortoise was observed crews 1) used a compass to determine the local transect bearing based on the orientation of the 25 m centerline 2) used a compass to determine the bearing from the point of observation to the tortoise and 3) used a measuring tape to determine the distance from the observer to the tortoise These data are sufficient to calculate the perpendicular distance from the observed tortoise to the local transect line If the tortoise was outside of a burrow was handled enough to take mass and midline carapace length (MCL) to determine its sex and to apply a small numbered tag to one scute If a tortoise could not be measured because it was in a burrow because temperatures precluded handling or for any other reason crews attempted to establish by other means whether the animal was larger than 180 mm MCL the criterion for including animals in density estimates
Because transects are 3 km on one side it is not unusual for that path to cross through varied terrain or even be blocked by an obstacle such as an interstate highway In the first years of this program smaller transects in inconvenient locations were shifted or replaced but this compromised the representative nature of the sample Since 2007 the basic rules for modifying transects involve 1) reflecting or elongating transects to avoid obstacles associated with human infrastructure (large roads private inholdings etc) or 2) shortening transects in rugged terrain Substrate and access to transects can also make it difficult to complete transects during the optimal period of times so 3) transects could be shortened to enable completion before 4 pm each day
In 2008 and 2009 the rules for shortening transects were made more restrictive Crews had the option to complete transects that were 12 km long (in low-relief terrain) or 6 km long (where higher-relief terrain precluded completion of 12 km in a working day) In the latter case to avoid crews selecting particular terrain the only way to shorten the transect was to walk it in the southwestern quadrant of the intended 12 km square If the southwestern quadrant was judged too rugged to be completed safely by transect walkers the final option was to not complete the
12
Range-wide Monitoring of the Mojave Desert Tortoise 2010
transect at all As in previous years unwalked transects were replaced from the list of alternates More situations were anticipated by additional rules in 2010 as described below
Modification of previous procedures After the 2009 field season it was clear that funding uncertainties in California meant that sufficient transects might not be completed in order to substratify analyses for 12 km and 6 km transects However substratification continued to hold promise for analyses in the Northeastern Mojave Recovery Unit In 2010 the same option to shorten transects to 6 km in rugged terrain were made available to GBI crews However IWS and Kiva crews shortened transects by following as much of the planned 12 km route as was possible If it was anticipated that fewer than 4 km could be walked the transect should be replaced instead with a transect from the alternate list Instead of estimating the proportion of the area that is unwalkable based on the proportion of transects that were unwalkable we would use the proportion of total planned kilometers (12 X number of planned transects) that were unwalkable
In addition transects that crossed stratum boundaries into public lands had previously been walked as planned (squares) Although this added sampling just outside the stratum it seemed reasonable to assume the land management and tortoise fate would be similar on each side of the invisible boundary Walking in a square is also less likely to introduce other problems compared to reflecting the transect Nonetheless starting in 2010 the protocol used to modify transects that intersected private lands or interstates since 2007 was applied to the portion of any transect that crossed out of monitoring strata reflecting that portion into the stratum Whether the segments of those transects outside the boundaries were walked outside the stratum or as a mirror image inside the stratum the same length of transect is walked at the same distance from the stratum boundary avoiding undersampling of areas on stratum boundaries (Figure 2) The impetus for this change was the recent large scale development and construction on public lands often just along the borders of critical habitat especially for renewable energy facilities and transmission lines Since the monitoring program was initiated other activities that are incompatible with tortoise conservation have become more common on public lands immediately adjacent to TCAs
Specifics of how transect paths were to be modified for rugged terrain (shortened) or for administrative boundaries (reflected) can be found in the 2010 Desert Tortoise Monitoring Handbook (USFWS 2010)
13
Range-wide Monitoring of the Mojave Desert Tortoise 2010
B
A
Figure 2 Planned (dotted lines) and reflected transect paths at administrative boundaries now also applied to stratum edges A) One-corner reflection B) Two-corner reflection
14
Range-wide Monitoring of the Mojave Desert Tortoise 2010
Proportion of tortoises available for detection by line distance sampling G0
Although we have general expectations about when tortoises are most active each day and plan our sampling to match the best season and time of day the fact remains that basing our density estimates only on the tortoises that are visible will result in density estimates that are consistently underestimated (biased low) Instead we use telemetry to estimate the proportion of tortoises available for sampling G0 (ldquogee-sub-zerordquo) which is incorporated in the equation for estimating tortoise density and to correct this bias
Telemetry allows us to locate radio-equipped tortoises that are as well as those that are otherwise undetectable in deep burrows or well hidden in dense vegetation To quantify the proportion that were available for detection (ldquovisiblerdquo) in 2010 telemetry technicians used a VHF radio receiver and directional antenna to locate 8-12 radio-equipped G0 tortoises in each of 10 sites throughout the Mojave and Colorado deserts (Fig 1) Each time a transmittered tortoise was located the observer determined whether the tortoise was visible (yes or no) Through careful coordination observers at telemetry sites monitored visibility during the same daily time period when field crews were walking transects in the same region of the desert Observers completed a survey circuit of all focal animals as many times as possible during the allotted time recording visibility each time Bootstrapped estimates of G0 started by selecting one visibility record at random for each tortoise on each day it was located The average visibility of all tortoise observations at a site on a given day was calculated and used to estimate the mean and variance of G0 at that site When there was more than one site in a given area the G0 estimate was calculated as the grand mean of all G0 sites in the group One thousand bootstrap samples were generated in PASW Statistics (release 1802 SPSS Inc 2 April 2010) to estimate G0 and its standard error
Use of radio transmittersreceivers to locate tortoises is a technique that is very different from the method used to detect tortoises on line transects Therefore in addition to stating whether any part of the tortoise is visible when located since 2008 behavioral observers and transect walkers have categorized all ldquovisiblerdquo tortoises and burrows (when tortoises are found in burrows) as low medium or high visibility based on the ability to see part of the tortoise or its burrow from any angle of approach For the telemetry observers it is a matter of locating a tortoise (visible or not) after they have determined its general location aurally whereas transect walkers are not searching with certainty of locating a tortoise ndash they rely only on visual cues and have no leading information when a tortoise is in the vicinity We would therefore not be surprised if the distance sampling method results in detection of a higher proportion of ldquohighrdquo visibility and a lower proportion of ldquolowrdquo visibility tortoisesburrows than when tortoises are located using telemetry If the odds be being detected differ not only by distance from the line but also a combination of method of detection used (visual or radio receiver) and visibility we should be able to describe this difference and be able to modify our calculation of visibility following radio-receiver information to more accurately match the visibility to transect walkers
15
Range-wide Monitoring of the Mojave Desert Tortoise 2010
Field observer training Training for careful data collection and consistency between crews is a fundamental part of quality assurance for this project This training includes instruction as well as required practice time on skills such as tortoise handling walking practice transects and developing detection and distance-measuring techniques (Table 1) The monitoring handbook developed in 2008 was comprehensive and serves as a training manual and documentation of training that is provided Chapters posted to the Desert Tortoise Recovery Office website and printed for training have been updated each year as needed (httpwwwfwsgovnevadadesert_tortoisereports)
In 2010 three teams of field observers participated Kiva Biological (Kiva) supplied crews for monitoring in the West Mojave and Eastern Colorado recovery units The Institute for Wildlife Studies (IWS) participated for the first time monitoring in the Northern Colorado and Eastern Mojave recovery units Great Basin Institute (GBI) supplied crews for monitoring in the Northeastern Mojave About half the personnel for Kiva were trained for the first time in 2008 and returned each year One of the 15 personnel for IWS had previous experience with this monitoring program and 9 of the 30 personnel for GBI were returnees Due to the large number of trainees and to accommodate an earlier monitoring window on CMAGR the three teams were trained in 2 overlapping periods with some experienced Kiva personnel leaving the training group after rapid evaluation (Table 1) Where possible the same trainers were used in both training sessions and across teams Also for small-group training experienced personnel from each team worked with the trainees from other teams
Telemetry training The primary goal of G0 training is successful implementation of the G0 protocol by telemetry crews This includes correct use of telemetry equipment understanding G0 data collection fields observation of as many radio-equipped tortoises as possible during the day and covering a window of observation that overlaps the dayrsquos transect time window for each sampling area Although all telemetry crews had some prior telemetry experience performance on this project differs from others that do not require confirmation of the exact location of the tortoise Unless the exact location is determined its visibility cannot be accurately recorded Beyond instruction and testing on use of the equipment in desert terrain several days of practice were compulsory to be able to troubleshoot locating the tortoise and confirming the location when it could not be seen In addition some instruction for telemetry and transect crews overlapped to help each group better understand the purpose their data serve and how they fit with data that were collected under the other protocol
Distance sampling training Transect walkers were given classroom instruction field demonstrations practice transects to complete and ultimately each team was evaluated based on performance on a field arena outfitted with a high density of polystyrene tortoise models placed in measured locations (Anderson et al 2001)
16
Range-wide Monitoring of the Mojave Desert Tortoise 2010
Table 1 Training schedule for 2010 IWS Trainees GBI Trainees Kiva Trainees
DayDate Activity Trainer Activity Trainer Activity Trainer WEEK 0 G0 only
Thurs 11-Mar
Beginning on-site G0 instruction Sparks Beginning on-site G0 instruction Sparks
Fri 12-Mar
Familiarize G0 with River Mtns Sparks Familiarize G0 with River Mtns Sparks
WEEK 1 WEEK 1 Monday 15-Mar
Transect methods overview 6km transect
Allison Return crews
Transect methods overview 6km transect
Allison Return crews
Tuesday 16-Mar
Introductions and DT RecoveryMonitoring
Programmatic Overview Working on Public Lands
Tortoise ActivityG0
Distance Sampling Transect methods lecture Non-standard transects
RDABT GPS Pendragon Database Lecture and Exercises Quality control procedures for field crews CompassGPS Lecture
Allison ldquo ldquo ldquo ldquo ldquo
Patil
Patil Allison G0 on scheduled visit Sparks
Introductions and DT RecoveryMonitoring
Programmatic Overview Working on Public Lands
Tortoise ActivityG0
Distance Sampling Transect methods lecture Non-standard transects
RDABT GPS Pendragon Database Lecture and Exercises Quality control procedures for field crews CompassGPS Lecture
Allison ldquo ldquo ldquo ldquo ldquo
Patil
Patil Allison
Wednesday
17-Mar
Tortoise biology and handling instruction Tortoise handling and data collection - small groups Pen search image exercise Training line lecture amp crew quality control procedures CompassGPS Exercise Data transfer and QAQC (QAQC specialists only)
Staff Christopher
ldquo ldquo
Allison Brenneman
Allison
Patil
RDABT GPS Pendragon Database Lecture and Exercises Quality control procedures for field crews (transect and G0) G0 in River Mtns -AM
Data transfer and QAQC (QAQC specialists only)
Patil
ldquo Sparks
Patil
Tortoise biology and handling instruction Tortoise handling and data collection - small groups Pen search image exercise Training line lecture amp crew quality control procedures CompassGPS Exercise
Staff Christopher
ldquo ldquo
Allison Brenneman
Allison
Thursday
18-Mar
Training Lines (practice 8km) Begin data download Beginning on-site G0 instruction
Allison Young Sparks
Training Lines (practice 8km) Begin data download
Allison Young
Friday
19-Mar
Training Lines (practice 8km)
G0 on-site training Initial QAQC (specialists only)
Sparks Brenneman Initial QAQC (specialists only) Brenneman
Training Lines (practice 8km) Begin data download from RDAs
Saturday 20-Mar
Full transects (12km)
17
Range-wide Monitoring of the Mojave Desert Tortoise 2010
IWS Trainees GBI Trainees Kiva Trainees DayDate Activity Trainer Activity Trainer Activity Trainer
WEEK 2 Monday
22-Mar
Tortoise handling
Training line debriefing
Staff
Allison
Transect methods overview 6km transect
Allison Experienced crews
Tortoise handling Staff
Training line debriefing Allison
Tuesday 23-Mar
Training Lines (evaluation 8km)
Introductions and RecoveryMonitoring Program
Overview Same as IWS on 16 Mar
Allison Training Lines (evaluation 8km)
Wednesday 24-Mar
Training Lines (evaluation 8km) Tortoise biology and handling instruction Same as IWS on 17 Mar
Staff Christopher
Training Lines (evaluation 8km)
Thursday 25-Mar
Full transects (12km) (12 crew) G0activity observation -12 crew Sparks
Training Lines (practice 8km) Begin data download
Allison
Young Friday
26-Mar
Full transects (12km) (half crew) G0 activity observation (half crew) Sparks
Training Lines (practice 8km)
WEEK 3 Monday 29-Mar
Tortoise handling Training line debriefing Allison
Full transects (12km) (12 crew) G0 activity observation (12 crew) Sparks
Tuesday30-Mar
Full transects (non-standard)or repeat training lines as needed G0 on-site practice Sparks
Tortoise handling
Training line debriefing
Staff
Allison Wednesday
31-Mar Repeat training lines as needed Begin field data collection
Training Lines (evaluation 8km)
Thursday 1-Apr
Training Lines (evaluation 8km)
Friday 2-Apr
Full transects (12km) (12 crew) G0 activity observation (12 crew) Sparks
WEEK 4 Monday
5-Apr Deliver QAQCrsquod data from practice transects to ftp site
Tortoise handling Training line debriefing
Tuesday 6-Apr
Full transects (non-standard) or repeat training lines as needed G0 on-site practice
Wednesday 7-Apr
Repeat training lines as needed Begin field data collection
WEEK 5 Monday 12-Apr
Deliver QAQCrsquod data
18
Range-wide Monitoring of the Mojave Desert Tortoise 2010
Polystyrene models of desert tortoises (ldquomodelsrdquo) are set out on the training course each year using placement instructions (vegetation or open placement distance along training line and distance perpendicular from training line) This course is used to determine whether 1) individual teams are able to detect all models on the transect centerline 2) whether their survey techniques yield useful detection functions and 3) whether they can accurately report the distance of each model from the transect centerline For each purpose many opportunities must be provided so the course is populated at a very high density of models (410km2)
Crews were sent on transects and training lines as paired independent observers That is the follower was 25 m behind the leader with the opportunity to detect models not found by the leader If the leader detects 80 of all tortoises that are found the assumption is that the follower detects 80 of the tortoises that are missed by the leader If this assumption is true in this example the pair together will detect 080 + (080 X (1 ndash 080)) = 096 of all tortoises on the centerline Because the location of all models was known data from training lines were also used to 1) assess the dual-observer assumption that all models were equally detectable (detections attributed to the follower occur at the same rate as original detection rate by leader) and 2) to estimate the detection rate using this technique for tortoises elsewhere in the Mojave Desert These data on models were used to evaluate and correct crew performance before the field season but were not used in any way to estimate densities of live tortoises once field surveys began
Data management including quality assurance and quality control
Two sets of data tables are maintained through the field season organizing data collected on transects and at the G0 sites Collection data forms sheets applications and databases are designed to minimize data entry errors and facilitate data verification and validation Data were collected in both electronic and paper formats by the two survey organizations then combined and processed in a series of phases to create final database products Data quality assurance and quality control (data QAQC also known as verification and validation) is performed during the data collection data integration and data finalization phases During the second data integration phase after combining data from separate groups some attribute fields are added and all fields are formatted for final processing The third phase data finalization involves consolidation resolution of data inconsistencies and generation of final spatial and non-spatial data products used for analysis After data analysis and reporting are completed electronic data are actively hosted for download from the internet through httpwwwmojavedatagovdeserttortoise_govrecoverydataphp Figure 3 describes the overall data flow
19
Range-wide Monitoring of the Mojave Desert Tortoise 2010
Figure 3 Data flow from collection through final products
Tortoise encounter rate and development of detection functions The number of tortoises seen in each stratum and their distances from the line are used to estimate the encounter rate (tortoises seen per kilometer walked) the detection rate (proportion of available tortoises that are detected out to a given distance from the transect centerline) and their respective variances Detection function estimation is ldquopooling robustrdquo under most conditions (Buckland et al 2001) This property holds as long as factors that cause variability in the curve shape are represented proportionately (Marques et al 2007) Factors that can affect curve shape include vegetation that differentially obscures vision with distance and different detection protocols used by individual crews (pairs) Field teams (IWS GBI Kiva) typically walk a different proportion of the transects so I expected to develop at least one curve for each field team which also corresponds to different regions of the desert The encounter rate is less sensitive to small sample sizes so it was estimated for each stratum separately
I used Program DISTANCE Version 6 Release 2 (Thomas et al 2010) to fit appropriate detection functions to estimate the encounter rate of tortoises in each stratum and to calculate the associated variances One record was created for each transect with additional records for
20
Range-wide Monitoring of the Mojave Desert Tortoise 2010
each additional tortoise on that transect Analysis was applied to all live tortoises larger than 180 mm MCL Transects were packaged into monitoring strata (ldquoregionsrdquo in Program DISTANCE) I truncated observations to improve model fit as judged by the simplicity (reasonableness) of the resulting detection function estimate (Buckland et al 2001) Using truncated data I used the Akaike Information Criterion (AIC) to compare detection-function models (uniform half normal and hazard-rate) and key functionseries expansions (none cosine simple polynomial hermite polynomial) recommended in Buckland et al (2001)
Proportion of available tortoises detected on the transect centerline g(0) Transects were conducted by 2-person crews using the method adopted beginning in 2004 (USFWS 2006) Transects were walked in a square with the lead crew member walking a straight line on a specified compass bearing trailing about 25 m of line and the second crew member following at the end of the line This technique involves little lateral movement off the transect centerline where attention is focused Use of two observers allows estimation of the proportion of tortoises detected on the line this provides a test of the assumption is that all tortoises on the transect centerline are recorded (g(0) = 1) The capture probability (p) for tortoises within increasing distances from the transect centerline was estimated as for a 2-pass removal estimator (White et al 1982) p = (leadndashfollow)lead where lead = the number of tortoises first seen by the observer in the leading position and follow = the number of tortoises seen by the observer in the follower position The corresponding proportion detected on the line by two observers was estimated by g = 1 ndash q2 where q = 1 ndash p Figure 4 graphs the relationship between the single-observer detection rate (p) and the corresponding dual-observer detection rate (g(0) ldquogee at zerordquo) The actual proportion detected can be estimated but to avoid the necessity of compensating for imperfect detection during training field crews (pairs) are expected to detect 96 of all models within 1 m of the transect centerline This corresponds to the leader being responsible for at least 80 of the teamrsquos detections near on the centerline in order to meet this standard (Fig 4) and is the basis for one of the training metrics (see Table 3)
Few or no tortoises are located exactly on the line and even examining a small interval (such as 1 m on each side of the transect line) results in few observations to precisely estimate g(0) Instead my test of the assumption involves examination of the lead and follow proportions starting with counts of tortoises in larger intervals from the line moving to smaller intervals centered on the transect centerline As the intervals get smaller the sample sizes also get smaller but the estimates are more relevant to the area right at the transect centerline The expectation is that the estimates should converge on g(0) = 10
If the test does not indicate that all tortoises were seen on the transect centerline the variance of p can be estimated as the binomial variance = q(1 + q)np (White et al 1982) where n = the estimated number of tortoises within 1 m of the transect centerline and the variance of g(0) is estimated as twice the variance of p
21
Range-wide Monitoring of the Mojave Desert Tortoise 2010
0
02
04
06
08
1
05 06 07 08 09 1
Tea
m d
etec
tio
n o
n t
he
line
g(0
)
Leader Detection (p)
Figure 4 Relationship between single-observer detections (by the leader p) and dual-observer (team) detections g(0)
Estimates of tortoise density Each year the density of tortoises is estimated at the level of the recovery unit The calculation of these densities starts with estimates of the density of tortoises in each stratum from Program DISTANCE as well as their variance estimates
nD
2wLPaG0 g 0 where L is the total length of kilometers walked in each stratum and w is the distance to which observations are truncated so 2wL is the area searched in each stratum This is a known quantity (not estimated) Pa is the proportion of desert tortoises detected within w meters of the transect centerline and was estimated using detection curves in Program DISTANCE The encounter rate (nL) and its variance were estimated in Program DISTANCE for each stratum Calculation of D requires estimation of nL Pa G0 and g(0) This means that the variance of D depends on the variance of these quantities as well
For desert tortoise densities the encounter rate (nL) is estimated independently for each stratum whereas proportion of available tortoises and proportion of available tortoises detected on the transect centerline are estimated jointly for all strata (g(0)) or for all strata in the recovery unit (G0) The detection function which comes into the above equation as Pa may be estimated jointly or separately depending on the number and quality of observations In 2010 separate detection curves were created for GBI and IWS pooled across all strata surveyed by each team Although a single detection curve was also considered for Kiva detections the patterns were very different in the south (mostly Colorado Desert) compared to the north (Mojave Desert) so
22
Range-wide Monitoring of the Mojave Desert Tortoise 2010
separate curves were developed for strata in the two areas (see Results) A schematic of the process leading to density estimates is given in Figure 5 Contributing estimates in the four left-hand columns are listed with the subsets of the data on which they are based These estimates combined from left to right to generate stratum and recovery unit density estimates Because transect records were associated with recovery units under the USFWS (1994) recovery plan those recovery units are used here although the data for 2010 and earlier years will be repackaged to later describe trends in the USFWS (2011) recovery units
Whereas the number of tortoises in the set of strata representing a recovery unit can simply be added together the variance must be arrived at by accounting for whether this involves pooled or independent estimates As described above three of the four estimates that contribute to calculating density in a stratum were based on data ldquopooledrdquo from other strata as well so when data from these strata are combined the correlated nature of the variances has to be accounted for Specifically the method described in Buckland et al (200189) was used to combine density variances correctly and arrive at the variance (and confidence intervals and CV) for the recovery unit Variance estimates cannot currently be combined within Program DISTANCE as required for the analysis described here so final construction of density mean and variance estimates from the above components was completed without specialized software
Tortoise encounter rate
Proportion that are
visible G0
Detection rate Pa
Proportion seen on the line g(0)
Density Density
Stratum or Neighboring
G0 sites
Data collection
group Overall Stratum Recovery unit
FK Ord-Rodman + Superior- Cronese
Kiva north
Full set of tortoise observations
FK
Western Mojave
SC SC
OR OR
JT Joshua Tree
NP + Chuckwalla
Kiva south
JT
PT PT
CK CK Eastern Colorado
AG AG
CM Piute +
Chemehuevi + Ivanpah
IWS
CM Northern Colorado
FE FE
Eastern Mojave IV IV
PI PI
GB Gold Butte +
Halfway Wash to 22 April
GBI
GB
Northeastern Mojave BD Halfway Wash
after 22 April BD
MM MM
CS Coyote Springs CS
Figure 5 Process for developing density estimates in 2010 For each type of estimate the full set of data was subdivided appropriately USFWS (1994) recovery units are used for this analysis
23
Range-wide Monitoring of the Mojave Desert Tortoise 2010
Estimating the area of each stratum sampled and the number of tortoises in that area Before the 2008 field season based on experience in 2007 and visual examination of DEM overlays all assigned transects were classified as possible for completion as 12k 6k or as unwalkable (USFWS 2012) These classifications before the field season are advisory only because exact ground conditions weather and crew condition all affect the ability to complete a transect If a non-standard transect (not 12 km square) is walked crews indicate the obstacles they encountered that forced the change in protocol In addition to the above named factors substrate that is very loose on a steep slope or that includes large boulders can make progress so slow or treacherous that crews modify the transect
Each year some transects are repeated providing new information on ground conditions and new transects are attempted At the end of each field season transects that were completed differently from expected are evaluated At that point a decision is made whether to reclassify the transect The classification is used to advise future transect completion but also to estimate the proportion of each monitoring stratum that is actually represented by the walked transects
Because each transect of any length is built off of the southwestern corner how that transect is completed is one representation of transects built on all possible southwestern corners In order to avoid selection bias by crews there were only 3 classification options for entire transects so that only 0- 6- or 12-km were actually walked but of course all of the distances between these options might actually have been walkable Transects that were not walked represent all transects that could be walked for lengths of 0- to 6-km It is parsimonious to therefore assume that on average 3 km could have been walked for each transect classified as ldquounwalkablerdquo Transects completed using the 6km option represent all of those that could have been completed for distances of 6- to 12-km averaging 9 km so that is the expected value for all of those transects Transects completed as 12 km represent the 100 completion option The total area of the stratum that is unwalkable is estimated as
௧௦௧௦ሻ ାହሺ௨௪ሻ௧௦௧௦ሺଶହൌ ݐݎݎ ݓݑ ௧௦௧௦ ௦௦ௗ ௦ ଶ
If a given stratum covers 5000 km2 but only 90 was walkable and represented by our sampling design then the density estimates applies to 4500 km2 and can be used to generate an estimate for the number of tortoises in those 4500 km2 Using these area estimates adds another source of imprecision so abundance estimates are slightly less precise than the density estimates they derive from The additional error of this estimate is calculated as the error for a binomial proportion
24
Range-wide Monitoring of the Mojave Desert Tortoise 2010
Modification of previous procedures In 2010 two new procedures for walking transects affect how we use transect completion information to estimate the proportion of each stratum that is walkable First in acknowledgment that public lands outside tortoise conservation areas increasingly used for activities that are not compatible with tortoise conservation transects are now reflected inward from the [usually] invisible stratum boundaries This new procedure has also caused the reclassification of some transects to walkable where stratum boundaries exclude mountain ranges for instance Next crews completed all transects except those walked by GBI in Nevada using the 12 km square path completing as much of that path as possible The calculation of unwalkable area in these strata now based on the proportion of unwalkable kilometers not unwalkable transects
Debriefing to describe strengths and weaknesses of project preparation and execution At the end of each field season a debriefing meeting was held to review tasks and responsibilities strengths and weaknesses of the program and to plan for the next field season Because the field teams had disbanded by then field crew members were surveyed prior to the end of the field season to nonetheless gather their direct input as we identified training and logistical issues to target for improvement before the next field season Although issues andor tasks may be ascribed to individual entities this meeting is most beneficial in identifying where centralized andor coordinated response is required to improve the quality of the program
RESULTS
Field observer training The smaller Kiva and IWS groups trained alongside one another and mostly separate from GBI although experienced crews worked between all three teams Training started on 11 March and continued through 6 April in 2 staggered sessions (Table 1) Final tests of field detection abilities occurred toward the end of this period
Proportion of tortoises detected at distances from the transect centerline Table 2 reports the proportion of models that were available and were detected by each team at 1- 2- and 5-meters from the transect centerline Teams were tested after a trial run on the detection lines (GBI and IWS crews) or after walking practice transects for returning crews that wanted to refresh the search pattern (Kiva) Detection on the centerline should be 100 and many crews achieved this First-year trainees detected a similar proportion of models at 1- and 2-m compared to experienced crews with first-year trainees detecting fewer models at 5 m
Table 3 reports further statistics for each team after collecting data on 16 km on the evaluation lines Column 4 reports the average absolute difference between the expected and measured perpendicular distances from the model to the walked line All measurements for all models during the 2-day trial are used for this estimate and capture inaccuracies from 1) using a compass and measuring tape to record distances to the models plus 2) inaccurately following the
25
Range-wide Monitoring of the Mojave Desert Tortoise 2010
trajectory of the transect The latter source of error does not occur on monitoring transects because the walked transect is the true transect In contrast on training lines error in measurements is increased if crews do not walk on exactly the measured line that was used to place the models On average the measured distance of models to the centerline was 21 cm closer than the actual distance with increasing bias for models farther from the line The ldquoAvailable Models Detected by Leaderrdquo column reports the proportion of all models that were found first by the leader During training this number is easily calculated and is used to identify crews in which one of the observers is not finding at least 80 of all detected With an 80 detection rate for the leader a 96 detection rate is expected for the team
Table 2 Proportion of tortoise models detected within 1- 2- or 5-m of the transect centerline Values that scored below the target of 090 at 1- or 2-m are highlighted
Proportion of existing models within a given distance detected by the team
Team 1m 2m 5m
1 093 096 087 2 100 096 091 3 092 096 094 4 100 088 087 5 100 093 095 6 100 092 088 7 085 090 086 8 100 100 090 21 100 089 093 22 093 089 088 23 100 100 097 24 085 089 088 26 100 100 097 27 088 093 094 28 100 100 094 51 100 096 095 52 100 100 094 53 100 096 093 54 100 100 090 55 093 096 093 56 100 093 090 57 093 096 096 58 100 100 094 59 100 096 091 60 100 096 092 61 100 096 088 62 100 100 094
GBI 099 097 093 Kiva 096 094 090 IWS 095 094 093
Overall 097 095 092
26
Range-wide Monitoring of the Mojave Desert Tortoise 2010
Table 3 Diagnostics for individual teams after training
Team
Available models detected Measured v exact model distance (m) Estimated
abundance
95 confidence interval
Within 2m of centerline by
leader
Within 2m of centerline by
team Lower limit Upper limit
1 085 096 079 396 3023 5193
2 081 096 079 377 3268 4346
3 089 096 096 409 3437 4855
5 081 088 077 443 3596 5460
6 086 093 084 397 3451 4574
7 088 092 073 375 3197 4397
8 087 090 078 378 3415 4173
21 093 100 079 682 5243 8881
22 085 089 076 356 3184 3989
23 085 089 114 433 3941 4746
24 096 100 089 408 3269 5096
26 089 089 079 366 3241 4122
27 100 100 082 427 3135 5823
28 086 093 074 402 2960 5472
51 100 100 087 390 3253 4675
52 086 096 080 370 3308 4138
53 100 100 087 403 3652 4438
54 085 096 075 441 3697 5260
55 092 100 055 345 2946 4031
56 088 096 101 475 3881 5805
57 089 093 080 384 2868 5133
58 081 096 081 451 3772 5397
59 086 100 063 464 3801 5663
60 086 096 102 477 3558 6395
61 089 096 080 343 2978 3941
62 096 096 113 461 3841 5538
Target gt080 gt090 lt1 410
GBI 091 097 083 4152
IWS 097 094 086 3974
Kiva 092 094 081 4321
Overall 093 095 083 4156
During training personnel on 2 teams were switched after unsuccessful practice runs The resulting 2 teams are included in Tables 2 and 3 Although some individual metrics were below-par (gray cells in the above tables) the teams were all judged to perform well overall and no further changes were made During training various detection curves were fit to each crewrsquos set of tortoise model observations In no case did a negative exponential model best describe the
27
Range-wide Monitoring of the Mojave Desert Tortoise 2010
data Because this model does not involve fitting a ldquoshoulderrdquo to the data near the centerline these detection curves would have been unacceptable The best-fitting of the 3 remaining basic types of models were then fit to the data to generate the density estimates in Table 3 In Figs 6-8 each crewrsquos data were fit to uniform or half-normal models for illustration purposes Crews were not evaluated on their ability to a particular curve shape however we did provide guidance to individual crews to better match the search patterns of their teammates This was taken as an opportunity to focus field personnel on an additional level of conformity Distance sampling and development of a single detection curve from many observers is robust to the effects of pooling across observations from crews with variable search patterns as long as all of the observers contribute proportionally to the overall pattern (Marques et al 2007)
Within the GBI crews teams 51 and 52 had the most anomalous curves (broadest shoulders) in Figure 6 These teams were coached on tightening their search pattern to better match other teams however neither team had other diagnostic issues Although the IWS trainee curves as a group had broader shoulders than the GBI curves they were similar to one another and no problems are evident The Kiva detection curves were more disparate between themselves Three of these teams (1 3 and 8) left training a few days earlier than the others They had passed all of the training metrics and left to match the earlier opening of CMAGR Although the other teams received feedback and worked to match one anotherrsquos detection curves in the final trials the first three teams (the ones with the narrowest shoulders that most rapidly lose detections with increasing distance from the line) did not
00
02
04
06
08
10
0 2 4 6 8 10 12 14
DE
TE
CT
ION
PR
OB
AB
ILIT
Y
PERPENDICULAR DISTANCE (m)
Figure 6 Detection curves for each of the 2010 GBI teams during training Curves are based on 16 km trials with approximately 100 detections Anomalous patterns described in text are indicated with dotted lines
28
Range-wide Monitoring of the Mojave Desert Tortoise 2010
00
02
04
06
08
10
0 2 4 6 8 10 12 14
DE
TE
CT
ION
PR
OB
AB
ILIT
Y
PERPENDICULAR DISTANCE (m)
Figure 7 Detection curves for each of the 2010 IWS trainee teams Curves are based on 16 km trials with approximately 100 detections
00
02
04
06
08
10
0 2 4 6 8 10 12 14
DE
TE
CT
ION
PR
OB
AB
ILIT
Y
PERPENDICULAR DISTANCE (m)
Figure 8 Detection curves for each of the 2010 Kiva trainee teams Curves are based on 16 km trials with approximately 100 detections Anomalous patterns described in text are indicated with dotted lines
29
Range-wide Monitoring of the Mojave Desert Tortoise 2010
Quality assurance and quality control There were 23710 transect records and 5762 G0 records associated with the monitoring effort in 2010 After data specialists with the field teams had finished verifying and validating the data there were still 706 cases where data were inconsistent with constraints and expectations (Many more issues are addressed by data specialists for field crews before the field data are submitted) Of these 681 were errors created by the field crews (sometimes faulty equipment other times data entry error) Two hundred fifty of these could be corrected based on information collected on paper datasheets while fields that should have been populated by faulty equipment could not be addressed Another 22 errors were ldquoprocessingrdquo errors Processing steps are associated with correcting other errors (perhaps a word is misspelled) or with adding new fields or any other manipulation that occurs after the data have been collected This year the bulk of the processing errors involved additional decimals in the elevation field
Transect completion Table 4 reports the number of assigned and completed transects in each stratum Kiva was assigned 328 transects and walked this number but were not always able to replace assigned unwalked transects with alternates in the same strata As a result too few transects were completed in Chuckwalla Joshua Tree and Pinto Mountain strata and all 7 of these transects were later completed in northern strata All assigned transects were completed or replaced by IWS One transect was inadvertently walked twice (counted once) and at the end of the field season one crew was able to complete an additional transect that was not a replacement for any assigned one GBI completed more transects then the other 2 teams and also had more errors Eight transects were walked on two separate occasions (duplicates are counted as one transect in Table 4) Three of the duplicated transects were purposely repeated when the first attempt was not completed to protocol or when illness interrupted the first attempt For a variety of reasons including logistical ones 8 assigned transects were neither completed nor replaced by alternates in their strata and 2 additional transects were completed in strata that did not need replacements
Great Basin Institute began to address the issue of route-less areas that have not been accessible in any past years Base-camping into these areas allowed crews to be provisioned with supplies including water This resulted in completion of 24 transects where crews would otherwise have had to hike 5 km or more one way to access transects Any field personnel provisioning these base camps for other crews are not themselves walking transects
Table 4 indicates the number of assigned transects that could be completed as standard square 12km transects (column 4) as well as the number that were completed by reflecting around obstacles These transects are all considered to represent flatter topography in the monitoring stratum An additional number (column 5) were completed as 6 km squares (GBI) or shortened as little as possible (IWS and Kiva) and represent more rugged terrain Finally some transects were considered unwalkable (column 6)
30
Range-wide Monitoring of the Mojave Desert Tortoise 2010
The last 2 columns of Table 4 represent situations that were not anticipated Crews were to shorten or abandon transects if the terrain presented too much of an obstacle but reflecting around terrain was not a planned option However on some relatively rare occasions (column 7) crews had partially walked a transect before determining that it could not be completed following the correct protocol In these situations they would not have sufficient time to move to an alternate transect on the same day so they instead reflected around terrain to collect data for the lower topography portion of the current transect
Column 8 reports transects that appear walkable based on remote imagery but were not completed All of these were reevaluated and some were reclassified based on this [additional] year of field information (see Evaluating transect classification below) Note that transects on military installations (CMAGR Ft Irwin China Lake and Edwards AFB) are regularly but unpredictably inaccessible due to military activities This corresponds to the 7 transects listed here for CMAGR (AG) 2 on Superior-Cronese and 1 on Fremont-Kramer Figures 9 through 12 show locations of transects and observations of live tortoises
Table 4 Number and type of transects in each stratum Stratum abbreviations as in Fig 1
Assigned
Assigned and alternate transects
Assigned completed
Assigned completed
Assigned judged
unwalkable
Assigned completed by reflecting to
Assigned judged
walkable but Stratum transects completed 12k shortened avoid terrain not walked
AG 33 33 22 3 8 7 BD 68 66 38 22 6 1 CK 64 61 34 21 6 3 CM 40 40 30 2 8 1 2 CS 100 99 58 21 20 9 FE 20 20 18 2 0 FK 50 50 41 7 2 2 GB 130 128 59 46 23 4 7 IV 30 31 23 3 4 1 JT 27 25 11 11 3 1
MM 132 132 65 52 13 7 OR 25 25 14 7 4 1 PI 44 44 30 8 6 3 2 PT 20 21 8 6 4 SC 109 113 91 12 6 3
Total 892 888 542 223 113 8 46
GBI 430 425 220 141 62 4 24 IWS 134 135 101 15 18 4 5 Kiva 328 328 221 67 33 0 17
Assigned transects that were not walked were supposed to be replaced by alternates
31
Range-wide Monitoring of the Mojave Desert Tortoise 2010
Figure 9 Distribution of distance sampling transects and live tortoise observations in the Northeastern Mojave Recovery Unit (Coyote Springs Valley Mormon Mesa Beaver Dam Slope and Gold Butte-Pakoon monitoring strata)
32
Range-wide Monitoring of the Mojave Desert Tortoise 2010
Figure 10 Distribution of distance sampling transects and live tortoise observations in the Eastern Mojave Recovery Unit (Piute-Eldorado Ivanpah and Fenner monitoring strata) and the Northern Colorado Recovery Unit (Chemehuevi monitoring stratum)
33
Range-wide Monitoring of the Mojave Desert Tortoise 2010
Figure 11 Distribution of distance sampling transects and live tortoise observations in the northern portion of the Western Mojave Recovery Unit (Fremont-Kramer Superior-Cronese and Ord-Rodman monitoring strata)
34
Range-wide Monitoring of the Mojave Desert Tortoise 2010
Figure 12 Distribution of distance sampling transects and live tortoise observations in the southern portion of the Western Mojave Recovery Unit (Pinto Mountains and Joshua Tree monitoring strata) and the Eastern Colorado Recovery Unit (Chuckwalla and Chocolate Mountain monitoring strata)
35
Range-wide Monitoring of the Mojave Desert Tortoise 2010
Tortoise encounter rates and detection functions In 2010 all pairs worked together from the beginning to the end of the season Each Kiva crew walked a median of 41 transects and overall they detected 196 tortoises over 180 mm MCL GBI crews walked a median of 35 transects and detected 179 tortoises and IWS crews had considerably lower effort with a median of 23 transects (days of work) However each IWS observer subsequently walked 1-person distance transects in a separate study at the Large Scale Translocation Site near Jean Nevada altogether IWS personnel completed 40 days of work and the team observed 122 tortoises and the LSTS encounters were used to model the overall IWS detection probability illustrated in Fig 14 There were sufficient observations to generate separate detection curves for each team so I planned a minimum of 3 detection curves
Figures 13 to 16 are histograms of the observed number of tortoises seen at increasing distance from the transect centerline There is one histogram each for IWS and GBI plus separate histograms for Kiva detections in the northern and southern areas that they surveyed These observations were used to model detection curves overlaid in the same figures Based on detection function behavior it is typical to discard a few observations in the tails of the histograms in order to build a more robust model (Buckland et al 2001) Each figure indicates the customized truncation distance that was applied Any observations that are not used to estimate detection functions will also not be used to estimate the encounter rate (tortoises detected per kilometer walked) Tortoise encounter rates are low enough that this becomes a factor in considering how to truncate observations to develop detection functions Truncation was conservative in order to maximize the number of observations per stratum
For GBI the best half-normal and uniform models were within ΔAIC=147 of the better-fitting hazard rate model with much better precision for the half-normal model but no meaningful difference in density estimate between the half-normal and hazard rate models On the basis of precision I used the half-normal model with second-order cosine adjustment to fit the detection function The second-order adjustment is seen in the extra inflections in the tail of the curve (Fig 13) This additional data fitting was called for unless observations were truncated at 8 m with an unacceptable loss of 38 additional observations For IWS data were truncated at 14 m and fit best to a uniform model with a single cosine adjustment I evaluated separate curves for northern and southern detections by Kiva because there were sufficient detections for two curves and because these transects represent a long north-south gradient The AIC for the single model was greater than the sum of AICs for the separate models with the same truncation distance (same data) so separate models better fit the data In the north (Fremont-Kramer Ord-Rodman and Superior-Cronese) the data were truncated at 12 m and fitted best to a uniform model with cosine adjustment In the south data were truncated at 8 m and fit to a half-normal model
36
Range-wide Monitoring of the Mojave Desert Tortoise 2010
Figure 13 Observed detections (histogram) and the resulting detection function (smooth curve) for live tortoises with MCL ge 180mm found by GBI This curve uses only the 164 tortoise seen within 16 m of the centerline
Figure 14 Observed detections (histogram) and the resulting detection function (smooth curve) for live tortoises with MCL ge 180mm found by IWS This curve uses only the 111 tortoises seen within 14 m of the centerline
00
02
04
06
08
10
12
0 2 4 6 8 10 12 14 16
Det
ectio
n P
roba
bilit
y
Perpendicular distance (m)
00
02
04
06
08
10
12
0 1 2 3 4 5 6 7 8 9 10 11 12 13 14
Det
ectio
n P
roba
bilit
y
Perpendicular (m)
37
Range-wide Monitoring of the Mojave Desert Tortoise 2010
Figure 15 Observed detections (histogram) and the resulting detection function (smooth curve) for live tortoises with MCL ge 180mm found by Kiva in Fremont-Kramer Superior-Cronese and Ord-Rodman This curve uses only the 92 tortoises seen within 12 m of the centerline
Figure 16 Observed detections (histogram) and fitted detection function (smooth curve) for live tortoises with MCL ge 180mm found by Kiva in Joshua Tree Pinto Mountains Chuckwalla and on CMAGR This curve uses only the 85 tortoises seen within 8 m of the centerline
00
02
04
06
08
10
12
0 1 2 3 4 5 6 7 8 9 10 11 12
Det
ectio
n P
roba
bilit
y
Perpendicular distance (m)
00
02
04
06
08
10
12
0 1 2 3 4 5 6 7 8
Det
ectio
n P
roba
bilit
y
Perpendicular distance (m)
38
Range-wide Monitoring of the Mojave Desert Tortoise 2010
The area below each of the curves in Figs 13ndash16 is the proportion of tortoises that were detected Pa estimated as far as the truncation distance (the farthest distance on the x-axis in each figure) Based on these curves GBI detected 412 of the visible tortoises within 16 m of the centerline (CV=0085) The corresponding estimate of Pa for strata surveyed by IWS was 586 (CV=0060) within 14 m for Kiva in the north was 583 (CV=0070) within 12 m and for Kiva in the south it was 671 (CV=0100) within 8 m
Proportion of tortoises available for detection by line distance sampling G0
In general telemetry sites and associated transects were completed sequentially from south to north This pattern corresponds to the expected timing of tortoise activity peaking first in the south Tortoise availability was estimated separately transects in each of these areas Dates total days monitored and G0 estimates are given in Table 5
Table 5 Availability of tortoises (G0) during the period in 2010 when transects were walked in each group of neighboring strata
G0 sites
Gold-Butte Halfway Wash
Strata
Gold Butte
Dates
7 Apr ndash 22 Apr
Days
16
G0
(Std Error)
077 (0177)
Halfway Wash Beaver Dam Slope Mormon Mesa
23 Apr ndash 15 May 23 080 (0115)
Coyote Springs Valley
Piute Ivanpah Chemehuevi
Joshua Tree Chuckwalla
Coyote Springs
Piute-Eldorado Chemehuevi Fenner Ivanpah
Chocolate Mtns Chuckwalla Joshua Tree Pinto Mtns
16 May ndash 28 May
31 Mar ndash 29 Apr
23 Mar ndash 10 Apr
13
30
19
086 (0130)
082 (0179)
089 (0122)
Ord-Rodman Superior-Cronese
Fremont-Kramer Ord-Rodman Superior-Cronese
13 Apr ndash 6 May 24 096 (0066)
Proportion of available tortoises detected on the transect centerline g(0) Because they are cryptic even tortoises that are visible (not covered by dense vegetation or out of sight in a burrow) may not be detected For 50 detections of tortoises within 1 m of the transect centerline 44 were found by the observer in the lead position and 6 by the follower so that the probability of detection by single observer p = 0864 and the proportion detected using the dual observer method g(0 to 1 m) = 0981 (SE = 006) Figure 17 shows that g(0) was converging on 10 indicating the assumption of perfect detection on the centerline was met consequently no adjustment was made to the final density estimate The curves since 2004 all
39
Range-wide Monitoring of the Mojave Desert Tortoise 2010
support the premise that complete detection on the transect line was achieved for years in which the dual-observer method was used (USFWS 2009 2012)
000
020
040
060
080
100
0 2 4 6 8 10 12
Pro
port
ion
dete
cted
Distance x from transect centerline (m)
p
g(0)
Figure 17 Detection pattern for the leader (p) and by the team (g(0)) based on all observations out to a given distance (x) from the centerline in 2010 Note convergence of g(0) on 10 at the transect centerline as x goes to 0
Estimates of tortoise density Density estimates were generated separately for each monitoring stratum (Table 6) then weighted by stratum area to arrive at average density in the monitored area of each recovery unit (Table 7) Although encounter rates were estimated separately for each stratum and have independent variances the detection function and G0 were estimated jointly pooling data from multiple strata so these variances are not independent (Fig 5 illustrates how estimates were pooled for 2010)
When the annual estimates are imprecise it should not be expected that there will be a close match from one year to the next Over a period of many years however any underlying trend in the number of tortoises should be obvious through this ldquobackground noiserdquo The CVs in 2010 represent an overall improvement in precision from previous years a function of improved funding in this one year
40
Range-wide Monitoring of the Mojave Desert Tortoise 2010
Table 6 Recovery unit and stratum-level encounters and densities in 2010 for tortoises with MCL ge 180mm
Sampling Dates nRecovery Area Number of Total transect Field Density
Stratum (tortoises CV(n) CV(Density) Unit (km2) Transects length (km) Begin End Observers (km2)observed)
Northeastern Mojave 4889 425 4265 7-Apr 28-May 164 32 158
Beaver Dam Slope BD 828 66 662 23-Apr 15-May GBI 23 22 8 33 282
Coyote Springs Valley CS 1117 99 1046 16-May 28-May GBI 43 167 36 240
Gold Butte-Pakoon GB 1977 128 1258 7-Apr 22-Apr GBI 22 250 17 351
Mormon Mesa MM 968 132 1298 24-Apr 16-May GBI 76 123 55 207
Eastern Mojave 6763 95 1096 31-Mar 29-Apr 46 33 296
Fenner FE 1862 20 246 31-Mar 27-Apr IWS 23 283 69 361
Ivanpah IV 2567 31 365 1-Apr 29-Apr IWS 5 416 10 473
Piute-Eldorado PI 2334 44 485 31-Mar 29-Apr IWS 18 246 27 333
Northern Colorado 4038 40 458 31-Mar 30-Apr 26 247 42 334
Chemehuevi CM 4038 40 458 31-Mar 30-Apr IWS 26 247 42 334
Western Mojave 9336 234 2591 23-Mar 6-May 105 31 148
Fremont-Kramer FK 2462 50 574 15-Apr 6-May Kiva 19 225 25 245
Joshua Tree JT 1567 25 227 25-Mar 13-Apr Kiva 6 539 28 565
Ord-Rodman OR 1124 25 270 17-Apr 4-May Kiva 27 228 75 248
Pinto Mountains PT 751 21 213 25-Mar 10-Apr Kiva 7 514 34 542
Superior-Cronese SC 3447 113 1307 13-Apr 6-May Kiva 46 159 26 187
Eastern Colorado 4263 94 991 23-Mar 10-Apr 72 57 189
Chocolate Mountain AG 755 33 378 25-Mar 5-Apr Kiva 50 192 138 256
Chuckwalla CK 3509 61 613 23-Mar 10-Apr Kiva 22 253 37 304
41
Range-wide Monitoring of the Mojave Desert Tortoise 2010
Table 7 Estimated density of desert tortoises in monitored areas of each recovery unit in the Mojave and Colorado deserts in 2010
Lower limit Upper limit Area Kilometers Tortoises Density 95 CI 95 CI CV
Recovery Unit (km2) walked detected (km2) (Density) (Density) (Density)
Northeastern Mojave 4889 4265 164 32 236 438 158 Eastern Mojave 6763 1096 46 33 186 579 296 Northern Colorado 4038 458 26 42 222 795 334 Western Mojave 9236 2591 105 31 236 420 148 Eastern Colorado 4263 991 72 57 397 828 189
Area of each stratum sampled and the number of tortoises in that area
Evaluating transect classification In 2010 196 of the 888 walked transects were not completed as predicted The following table summarizes conclusions after examining these transects
Table 8 Transects completed other than as planned and any resulting reclassification
Previous New Number of Situation
substratum substratum transects 12k On-the-ground observation differs from imagery 6k 21
Shortened in 2010 but previous experience or correct 12k 12k 52
modification would allow completion 6k On-the-ground observation differs from imagery 12k 31
Unwalkable On-the-ground observation differs from imagery 12k 16 New rules to reflect into stratum moved transect out of too-
Unwalkable 12k 12rugged terrain
Unwalkable On-the-ground observation differs from imagery 6k 19 Lengthened in 2010 but other crews might be unable to walk
6k 6k 18as a 12k Crew completed the transect using incorrect protocols or
Unwalkable Unwalkable 11attempted new rules but couldnrsquot walk at least 6km New shortening rules allowed at least 6km completed but
Unwalkable Shortened 16earlier rules would have classified these as unwalkable
Twenty-eight transects that would have been unwalkable under the previous protocols were attempted and completed this year using new rules to reflect into stratum boundaries (range-wide) and to shorten transects by walking only the safely walkable portions of the 12 km route (Kiva and IWS field teams only) In the first case 12 transects were completed because they were correctly reflected into strata under new rules These otherwise unwalkable transects were completed because stratum boundaries were often drawn to exclude more rugged topography Sixteen previously unwalkable transects were walked for at least 6 km using new rules to shorten transects without completing the SW quadrant These would still be ldquounwalkablerdquo under the original classification system
42
Range-wide Monitoring of the Mojave Desert Tortoise 2010
After the field season 168 anomalous transects were reviewed Of these 87 were reclassified based on crew experience In some cases the crews encountered substrate or other features that were not apparent from imagery in many others the original classification based on imagery was ambiguous because over the course of a 12 km transect terrain is so variable to that it was not a simple matter to evaluate the time required for a typical crew to complete it The remaining 81 anomalous transects were not reclassified either because the classification still seems ambiguous or because the crewrsquos modification was based on access illness or considerations unrelated to terrain
Proportion of each stratum walked The proportion of each stratum walked in 2010 could be calculated based on the proportion of transects shortened andor replaced (GBI) or based on the proportion of kilometers walked based on the expectation that 12 km should be walked for each transect assigned (Kiva and IWS) In 2008 and 2009 only the previous method was used and all transects assigned in 2010 had already been classified as 12k 6k or unwalkable To test the comparability of estimating the unsampled part of each stratum I calculated the number of kilometers expected to be walked based on the 12k6kunwalkable classification of each assigned transect then compared this to the proportion of kilometers estimate (Table 9)
Table 9 Proportion of each stratum that can be sampled Stratum abbreviations as in Fig 1
Proportion assigned transects expected to be walked ashellip Km walked
Assigned Stratum transects 12k 6k Replaced Expected Observed Chi-sq
AG 33 848 121 3 375 2886 198 BD 66 606 303 91 600 5905 01 CK 61 639 18 18 600 5652 20 CM 40 775 75 15 417 3772 38 CS 99 606 273 121 882 8243 38 FE 20 100 0 0 240 2335 02 FK 50 94 6 0 591 5496 29 GB 128 484 352 164 1014 9902 05 IV 30 867 0 133 324 3051 11 JT 25 56 24 20 237 1976 66
MM 130 531 392 77 1134 10915 16 OR 25 68 20 12 258 2329 24 PI 44 705 182 114 459 4175 38 PT 18 50 111 389 147 1406 03 SC 109 89 64 46 1242 12029 12
Total 878 8520 8007 501 GBI 423 3630 3496 61 IWS 134 1440 1333 89 Kiva 321 3449 3177 352
43
Range-wide Monitoring of the Mojave Desert Tortoise 2010
Chi-squared values in the final column indicate a poor fit between predictions and completion at CMAGR which is not surprising given constraints on access to different parts of the range each year (crews frequently cannot get access to otherwise walkable transects so these transects are replaced) With the exception of CMAGR the strata individually and for each group combined indicate that the completed kilometers were accurately predicted regardless of method used to estimate unwalkable terrain
This means we can use the observed kilometers walked to estimate the area over which our density estimates apply For strata walked by GBI we can use the proportion of transects classified as 12k6kunwalkable instead Because this project uses the same base set of transects each year the majority of transects have been walked in multiple years Table 9 demonstrates that the 2 methods of estimating the proportion of area sampled are equivalent so we can develop a more representative estimate of the walkable area of these strata if we use empirical data from all transects walked between 2008 and 2011 (the latest set of compiled data) Since 2008 2464 separate transects have been evaluated in these strata this is a much larger (representative) sample than the 878 evaluated only in 2010 Table 10 gives the area of each stratum the proportion covered by our density estimates and converts the density in each stratum into an estimate of tortoise abundance
Table 10 Estimated tortoise abundance in sampled areas of each stratum The ldquoproportion sampledrdquo column is based on evaluation of all transects in the sample set from 2008 through 2011 Stratum abbreviations as in Fig 1
Area Proportion SE(Prop Sampled N (number 95 Confidence Interval Stratum (km2) sampled Sampled) area (km2) of tortoises) Lower Limit Upper Limit
AG 755 095 0024 715 9863 60058 161977 BD 828 089 0032 738 2422 14013 41853 CK 3509 082 0030 2890 10804 60077 194313 CM 4038 093 0023 3755 15788 83362 299009 CS 1117 086 0031 958 3471 21707 55514 FE 1862 096 0020 1790 12419 62465 246911 FK 2462 096 0017 2372 5869 36520 94318 GB 1977 081 0027 1604 2782 14224 54410 IV 2567 095 0021 2442 2476 10247 59806 JT 1567 074 0033 1159 3197 11360 89963
MM 968 086 0034 836 4624 30712 69628 OR 1124 073 0040 821 6119 37498 99865 PI 2334 082 0024 1911 5249 27733 99354 PT 751 069 0051 522 1785 6553 48634 SC 3332 095 0015 3149 8276 57509 119102
Total 29190 0879 24656 95145 770367 1175107
44
Range-wide Monitoring of the Mojave Desert Tortoise 2010
Debriefing to identify strengths and weaknesses in preparation for future years This meeting was held on 8 June about 1 week after all field work was completed The following issues were identified for coordinated effort rather than by efforts of single parties
Need for more central responsibility for planning data It was decided that starting in 2011 MDEP will host server-based [GIS] information for use by mapmakers Through 2010 MDEP has provided Mojave-wide data layers to individual field teams and assigned transects were identified by the UTM coordinates of their southwestern corners Because there was little central oversight over how these data were acquired and used different field teams had variable map quality and occasionally shifted transects when processing the corner coordinates into full square transects This processing including any planned shortening andor reflections should be repeatable each time the same transect is assigned so centralized responsibility for this would be a better option
Training improvements to make more effective use of same time period In 2010 there were more trainees from more teams in the same areas for training at the same time Use of the Desert Tortoise Conservation Center would be improved by setting up more stations (with more instructors) for smaller groups of trainees Also although objectives have been articulated for instructed material this is not the case for the many days available for designated field practice On those days additional oversight and specific objectives that can be evaluated would improve effectiveness and provide additional feedback to crews
Current hardware is less trustworthy and cannot utilize improved software Since 2007 responsibility for providing the same data collection systems to all field teams has been centralized with the USFWS Those units (data collection systems including connected GPS) are now outdated and will be replaced under advisement from MDEP and UNR
Not all QAQC errors remedied by the end of field season Two types of errors occurred during the field season and were not corrected effectively This resulted in 7 of the 888 transects inadvertently being walked twice and in different types of first-level QAQC reporting errors from the 2 different data specialists Although they were trained together by UNR their approaches seemed to diverge as they addressed data errors In 2011 the ldquoend-userrdquo (Topoworks) will spend more time training specialists This work will also emphasize steps to take to avoid duplicating effort on any transects
DISCUSSION
Sampling representatively in all monitoring strata Since 2007 transects have been placed systematically in monitoring strata the placement scheme itself had a random origin so that transects were located at random with respect to tortoises The goal of systematic placement is used to provide better coverage of sampled areas yet the random aspect of this design also allows inference about the entire sampled area Because
45
Range-wide Monitoring of the Mojave Desert Tortoise 2010
the same set of potential transect locations will be used to sample from in future years it is meaningful to collect information describing access and completion of each transect so that this information is available when planning to walk this transect location in future years
The current sampling design allows us to 1) estimate the actual area to which our density estimates apply some areas are too rugged for humans to access and therefore 2) apply the density estimate to this sampled area to arrive at an abundance estimate in each monitoring stratum
Training developments Training has received focused attention each year This training improves the performance of individual crews but also helps to standardize the application of protocols among different field teams In 2010 experienced crew personnel worked with new trainees in their own and in different teams to add a new level of cohesiveness between field teams This attention to standardized procedures is maintained during the field season with frequent customized written crew evaluations and we attribute continued high performance in 2010 directly to this focus on standardized training and implementation of protocols No correction for failure to detect visible tortoises on the centerline have been made to density estimates since 2004 (prior to that a 3-pass method was used to ensure all tortoises were detected) Training data in 2010 indicate that crews were detecting all tortoise models on the testing centerline and by the end of training first-year crews were performing as well as experienced crews
Improving ability to detect trends in desert tortoise abundance The primary goal of the monitoring program is to provide population estimates that are relevant to the recovery plan criteria (USFWS 2011) The related priority is therefore to improve ability to detect trends in desert tortoise abundance at the recovery unit level
There were new and enhanced funding sources in 2010 so that all strata had more than the minimum number of transects Associated with the relatively high estimates of tortoise visibility (G0) more tortoises were seen in some recovery units even accounting for the enhanced level of effort Whereas funding opportunities are under agency control the particularly mild spring season also contributed to improved density estimates in most of the range The notable exception was the Eastern MojaveNorthern Colorado where the number of funded transects was still below optimal and the spring weather was cooler than optimal for tortoises to be out and visible most of the time In the remaining 3 monitored recovery units the coefficient of variation for density estimates was between 15 and 20 of the density estimate ndash reflecting an extremely successful field season The Eastern MojaveNorthern Colorado recovery units had density estimates with lower precision (CV=295 and 334 respectively) a reminder that insufficient funding and unseasonable conditions can act separately to thwart our coordinated efforts for range-wide density estimates
46
Range-wide Monitoring of the Mojave Desert Tortoise 2010
LITERATURE CITED
Anderson DR and KP Burnham 1996 A monitoring program for the desert tortoise Report to the Desert Tortoise Management Oversight Group
Anderson DR KP Burnham BC Lubow L Thomas PS Corn PA Medica and RW Marlow 2001 Field trials of line transect methods applied to estimation of desert tortoise abundance Journal of Wildlife Management 65583-597
Averill-Murray RC and A Averill-Murray 2005 Regional-scale estimation of density and habitat use of the desert tortoise (Gopherus agassizii) in Arizona Journal of Herpetology 3965ndash72
Berry KH and LL Nicholson 1984 The distribution and density of desert tortoise populations in California in the 1970rsquos Chapter 2 in KH Berry (ed) The status of the desert tortoise (Gopherus agassizii) in the United States Desert Tortoise Council Report to the US Fish and Wildlife Service Order No 11310-0083-81
Buckland ST DR Anderson KP Burnham JL Laake DL Borchers and L Thomas 2001 Introduction to Distance Sampling Estimating Abundance of Biological Populations Oxford Univ Press Oxford 432 pp
Corn PS 1994 Recent trends of desert tortoise populations in the Mojave Desert Fish and Wildlife Research 1385-93
Luckenbach RA 1982 Ecology and management of the desert tortoise (Gopherus agassizii) in California In RB Bury (ed) North American Tortoises Conservation and Ecology US Fish and Wildlife Service Wildlife Research Report 12 Washington DC
Marques TA L Thomas SG Fancy and ST Buckland 2007 Improving estimates of bird density using multiple-covariate distance sampling The Auk 124(4) 1229-1243
McLuckie AM M Ratchford and RA Fridell 2012 Regional desert tortoise monitoring in the Red Cliffs Desert Reserve 2011 Salt Lake City Utah Division of Wildlife Resources Publication Number 12-13 54 pp
Murphy RW KH Berry T Edwards AE Leviton A Lathrop JD Riedle 2011 The dazed and confused identity of Agassizs land tortoise Gopherus agassizii (Testudines Testudinidae) with the description of a new species and its consequences for conservation ZooKeys 113 33-71 doi 103897zookeys1131353
47
Range-wide Monitoring of the Mojave Desert Tortoise 2010
SPSS Inc 2010 PASW Statistics Rel 1802 Chicago SPSS Inc
Swann DE RC Averill-Murray and CR Schwalbe 2002 Distance sampling for Sonoran desert tortoises Journal of Wildlife Management 66969ndash975
Thomas L ST Buckland EA Rexstad JL Laake S Strindberg SL Hedley JRB Bishop TA Marques and KP Burnham 2010 Distance software design and analysis of distance sampling surveys for estimating population size Journal of Applied Ecology 475-14
Tracy CR RC Averill-Murray WI Boarman D Delehanty JS Heaton ED McCoy DJ Morafka KE Nussear BE Hagerty and PA Medica 2004 Desert Tortoise Recovery Plan Assessment Report to the US Fish and Wildlife Service Reno Nevada
[USFWS] US Fish and Wildlife Service 1994 Desert Tortoise (Mojave Population) Recovery Plan US Fish and Wildlife Service Portland Oregon
[USFWS] US Fish and Wildlife Service 2006 Range-wide Monitoring of the Mojave Population of the Desert Tortoise 2001-2005 Summary Report Report by the Desert Tortoise Recovery Office US Fish and Wildlife Service Reno Nevada
[USFWS] US Fish and Wildlife Service 2009 Range-wide Monitoring of the Mojave Population of the Desert Tortoise 2007 Annual Report Report by the Desert Tortoise Recovery Office US Fish and Wildlife Service Reno Nevada
[USFWS] US Fish and Wildlife Service 2010 Desert Tortoise Monitoring Handbook Desert Tortoise Recovery Office US Fish and Wildlife Service Reno Nevada Version 2 March 2010 httpwwwfwsgovnevadadesert_tortoisereports
[USFWS] US Fish and Wildlife Service 2011 Revised recovery plan for the Mojave Population of the desert tortoise (Gopherus agassizii) US Fish and Wildlife Service Pacific Southwest Region Sacramento California 222 pp
[USFWS] US Fish and Wildlife Service 2012 Range-wide Monitoring of the Mojave Desert Tortoise 2008 and 2009 Reporting Report by the Desert Tortoise Recovery Office US Fish and Wildlife Service Reno Nevada
White GC DR Anderson KP Burnham and DL Otis 1982 Capture-recapture and removal methods for sampling closed populations LA-87-87-NERP Los Alamos National Laboratory Los Alamos NM 235pp
48

Range-wide Monitoring of the Mojave Desert Tortoise 2010
Proportion of tortoises available for detection by line distance sampling G0
Although we have general expectations about when tortoises are most active each day and plan our sampling to match the best season and time of day the fact remains that basing our density estimates only on the tortoises that are visible will result in density estimates that are consistently underestimated (biased low) Instead we use telemetry to estimate the proportion of tortoises available for sampling G0 (ldquogee-sub-zerordquo) which is incorporated in the equation for estimating tortoise density and to correct this bias
Telemetry allows us to locate radio-equipped tortoises that are as well as those that are otherwise undetectable in deep burrows or well hidden in dense vegetation To quantify the proportion that were available for detection (ldquovisiblerdquo) in 2010 telemetry technicians used a VHF radio receiver and directional antenna to locate 8-12 radio-equipped G0 tortoises in each of 10 sites throughout the Mojave and Colorado deserts (Fig 1) Each time a transmittered tortoise was located the observer determined whether the tortoise was visible (yes or no) Through careful coordination observers at telemetry sites monitored visibility during the same daily time period when field crews were walking transects in the same region of the desert Observers completed a survey circuit of all focal animals as many times as possible during the allotted time recording visibility each time Bootstrapped estimates of G0 started by selecting one visibility record at random for each tortoise on each day it was located The average visibility of all tortoise observations at a site on a given day was calculated and used to estimate the mean and variance of G0 at that site When there was more than one site in a given area the G0 estimate was calculated as the grand mean of all G0 sites in the group One thousand bootstrap samples were generated in PASW Statistics (release 1802 SPSS Inc 2 April 2010) to estimate G0 and its standard error
Use of radio transmittersreceivers to locate tortoises is a technique that is very different from the method used to detect tortoises on line transects Therefore in addition to stating whether any part of the tortoise is visible when located since 2008 behavioral observers and transect walkers have categorized all ldquovisiblerdquo tortoises and burrows (when tortoises are found in burrows) as low medium or high visibility based on the ability to see part of the tortoise or its burrow from any angle of approach For the telemetry observers it is a matter of locating a tortoise (visible or not) after they have determined its general location aurally whereas transect walkers are not searching with certainty of locating a tortoise ndash they rely only on visual cues and have no leading information when a tortoise is in the vicinity We would therefore not be surprised if the distance sampling method results in detection of a higher proportion of ldquohighrdquo visibility and a lower proportion of ldquolowrdquo visibility tortoisesburrows than when tortoises are located using telemetry If the odds be being detected differ not only by distance from the line but also a combination of method of detection used (visual or radio receiver) and visibility we should be able to describe this difference and be able to modify our calculation of visibility following radio-receiver information to more accurately match the visibility to transect walkers
15
Range-wide Monitoring of the Mojave Desert Tortoise 2010
Field observer training Training for careful data collection and consistency between crews is a fundamental part of quality assurance for this project This training includes instruction as well as required practice time on skills such as tortoise handling walking practice transects and developing detection and distance-measuring techniques (Table 1) The monitoring handbook developed in 2008 was comprehensive and serves as a training manual and documentation of training that is provided Chapters posted to the Desert Tortoise Recovery Office website and printed for training have been updated each year as needed (httpwwwfwsgovnevadadesert_tortoisereports)
In 2010 three teams of field observers participated Kiva Biological (Kiva) supplied crews for monitoring in the West Mojave and Eastern Colorado recovery units The Institute for Wildlife Studies (IWS) participated for the first time monitoring in the Northern Colorado and Eastern Mojave recovery units Great Basin Institute (GBI) supplied crews for monitoring in the Northeastern Mojave About half the personnel for Kiva were trained for the first time in 2008 and returned each year One of the 15 personnel for IWS had previous experience with this monitoring program and 9 of the 30 personnel for GBI were returnees Due to the large number of trainees and to accommodate an earlier monitoring window on CMAGR the three teams were trained in 2 overlapping periods with some experienced Kiva personnel leaving the training group after rapid evaluation (Table 1) Where possible the same trainers were used in both training sessions and across teams Also for small-group training experienced personnel from each team worked with the trainees from other teams
Telemetry training The primary goal of G0 training is successful implementation of the G0 protocol by telemetry crews This includes correct use of telemetry equipment understanding G0 data collection fields observation of as many radio-equipped tortoises as possible during the day and covering a window of observation that overlaps the dayrsquos transect time window for each sampling area Although all telemetry crews had some prior telemetry experience performance on this project differs from others that do not require confirmation of the exact location of the tortoise Unless the exact location is determined its visibility cannot be accurately recorded Beyond instruction and testing on use of the equipment in desert terrain several days of practice were compulsory to be able to troubleshoot locating the tortoise and confirming the location when it could not be seen In addition some instruction for telemetry and transect crews overlapped to help each group better understand the purpose their data serve and how they fit with data that were collected under the other protocol
Distance sampling training Transect walkers were given classroom instruction field demonstrations practice transects to complete and ultimately each team was evaluated based on performance on a field arena outfitted with a high density of polystyrene tortoise models placed in measured locations (Anderson et al 2001)
16
Range-wide Monitoring of the Mojave Desert Tortoise 2010
Table 1 Training schedule for 2010 IWS Trainees GBI Trainees Kiva Trainees
DayDate Activity Trainer Activity Trainer Activity Trainer WEEK 0 G0 only
Thurs 11-Mar
Beginning on-site G0 instruction Sparks Beginning on-site G0 instruction Sparks
Fri 12-Mar
Familiarize G0 with River Mtns Sparks Familiarize G0 with River Mtns Sparks
WEEK 1 WEEK 1 Monday 15-Mar
Transect methods overview 6km transect
Allison Return crews
Transect methods overview 6km transect
Allison Return crews
Tuesday 16-Mar
Introductions and DT RecoveryMonitoring
Programmatic Overview Working on Public Lands
Tortoise ActivityG0
Distance Sampling Transect methods lecture Non-standard transects
RDABT GPS Pendragon Database Lecture and Exercises Quality control procedures for field crews CompassGPS Lecture
Allison ldquo ldquo ldquo ldquo ldquo
Patil
Patil Allison G0 on scheduled visit Sparks
Introductions and DT RecoveryMonitoring
Programmatic Overview Working on Public Lands
Tortoise ActivityG0
Distance Sampling Transect methods lecture Non-standard transects
RDABT GPS Pendragon Database Lecture and Exercises Quality control procedures for field crews CompassGPS Lecture
Allison ldquo ldquo ldquo ldquo ldquo
Patil
Patil Allison
Wednesday
17-Mar
Tortoise biology and handling instruction Tortoise handling and data collection - small groups Pen search image exercise Training line lecture amp crew quality control procedures CompassGPS Exercise Data transfer and QAQC (QAQC specialists only)
Staff Christopher
ldquo ldquo
Allison Brenneman
Allison
Patil
RDABT GPS Pendragon Database Lecture and Exercises Quality control procedures for field crews (transect and G0) G0 in River Mtns -AM
Data transfer and QAQC (QAQC specialists only)
Patil
ldquo Sparks
Patil
Tortoise biology and handling instruction Tortoise handling and data collection - small groups Pen search image exercise Training line lecture amp crew quality control procedures CompassGPS Exercise
Staff Christopher
ldquo ldquo
Allison Brenneman
Allison
Thursday
18-Mar
Training Lines (practice 8km) Begin data download Beginning on-site G0 instruction
Allison Young Sparks
Training Lines (practice 8km) Begin data download
Allison Young
Friday
19-Mar
Training Lines (practice 8km)
G0 on-site training Initial QAQC (specialists only)
Sparks Brenneman Initial QAQC (specialists only) Brenneman
Training Lines (practice 8km) Begin data download from RDAs
Saturday 20-Mar
Full transects (12km)
17
Range-wide Monitoring of the Mojave Desert Tortoise 2010
IWS Trainees GBI Trainees Kiva Trainees DayDate Activity Trainer Activity Trainer Activity Trainer
WEEK 2 Monday
22-Mar
Tortoise handling
Training line debriefing
Staff
Allison
Transect methods overview 6km transect
Allison Experienced crews
Tortoise handling Staff
Training line debriefing Allison
Tuesday 23-Mar
Training Lines (evaluation 8km)
Introductions and RecoveryMonitoring Program
Overview Same as IWS on 16 Mar
Allison Training Lines (evaluation 8km)
Wednesday 24-Mar
Training Lines (evaluation 8km) Tortoise biology and handling instruction Same as IWS on 17 Mar
Staff Christopher
Training Lines (evaluation 8km)
Thursday 25-Mar
Full transects (12km) (12 crew) G0activity observation -12 crew Sparks
Training Lines (practice 8km) Begin data download
Allison
Young Friday
26-Mar
Full transects (12km) (half crew) G0 activity observation (half crew) Sparks
Training Lines (practice 8km)
WEEK 3 Monday 29-Mar
Tortoise handling Training line debriefing Allison
Full transects (12km) (12 crew) G0 activity observation (12 crew) Sparks
Tuesday30-Mar
Full transects (non-standard)or repeat training lines as needed G0 on-site practice Sparks
Tortoise handling
Training line debriefing
Staff
Allison Wednesday
31-Mar Repeat training lines as needed Begin field data collection
Training Lines (evaluation 8km)
Thursday 1-Apr
Training Lines (evaluation 8km)
Friday 2-Apr
Full transects (12km) (12 crew) G0 activity observation (12 crew) Sparks
WEEK 4 Monday
5-Apr Deliver QAQCrsquod data from practice transects to ftp site
Tortoise handling Training line debriefing
Tuesday 6-Apr
Full transects (non-standard) or repeat training lines as needed G0 on-site practice
Wednesday 7-Apr
Repeat training lines as needed Begin field data collection
WEEK 5 Monday 12-Apr
Deliver QAQCrsquod data
18
Range-wide Monitoring of the Mojave Desert Tortoise 2010
Polystyrene models of desert tortoises (ldquomodelsrdquo) are set out on the training course each year using placement instructions (vegetation or open placement distance along training line and distance perpendicular from training line) This course is used to determine whether 1) individual teams are able to detect all models on the transect centerline 2) whether their survey techniques yield useful detection functions and 3) whether they can accurately report the distance of each model from the transect centerline For each purpose many opportunities must be provided so the course is populated at a very high density of models (410km2)
Crews were sent on transects and training lines as paired independent observers That is the follower was 25 m behind the leader with the opportunity to detect models not found by the leader If the leader detects 80 of all tortoises that are found the assumption is that the follower detects 80 of the tortoises that are missed by the leader If this assumption is true in this example the pair together will detect 080 + (080 X (1 ndash 080)) = 096 of all tortoises on the centerline Because the location of all models was known data from training lines were also used to 1) assess the dual-observer assumption that all models were equally detectable (detections attributed to the follower occur at the same rate as original detection rate by leader) and 2) to estimate the detection rate using this technique for tortoises elsewhere in the Mojave Desert These data on models were used to evaluate and correct crew performance before the field season but were not used in any way to estimate densities of live tortoises once field surveys began
Data management including quality assurance and quality control
Two sets of data tables are maintained through the field season organizing data collected on transects and at the G0 sites Collection data forms sheets applications and databases are designed to minimize data entry errors and facilitate data verification and validation Data were collected in both electronic and paper formats by the two survey organizations then combined and processed in a series of phases to create final database products Data quality assurance and quality control (data QAQC also known as verification and validation) is performed during the data collection data integration and data finalization phases During the second data integration phase after combining data from separate groups some attribute fields are added and all fields are formatted for final processing The third phase data finalization involves consolidation resolution of data inconsistencies and generation of final spatial and non-spatial data products used for analysis After data analysis and reporting are completed electronic data are actively hosted for download from the internet through httpwwwmojavedatagovdeserttortoise_govrecoverydataphp Figure 3 describes the overall data flow
19
Range-wide Monitoring of the Mojave Desert Tortoise 2010
Figure 3 Data flow from collection through final products
Tortoise encounter rate and development of detection functions The number of tortoises seen in each stratum and their distances from the line are used to estimate the encounter rate (tortoises seen per kilometer walked) the detection rate (proportion of available tortoises that are detected out to a given distance from the transect centerline) and their respective variances Detection function estimation is ldquopooling robustrdquo under most conditions (Buckland et al 2001) This property holds as long as factors that cause variability in the curve shape are represented proportionately (Marques et al 2007) Factors that can affect curve shape include vegetation that differentially obscures vision with distance and different detection protocols used by individual crews (pairs) Field teams (IWS GBI Kiva) typically walk a different proportion of the transects so I expected to develop at least one curve for each field team which also corresponds to different regions of the desert The encounter rate is less sensitive to small sample sizes so it was estimated for each stratum separately
I used Program DISTANCE Version 6 Release 2 (Thomas et al 2010) to fit appropriate detection functions to estimate the encounter rate of tortoises in each stratum and to calculate the associated variances One record was created for each transect with additional records for
20
Range-wide Monitoring of the Mojave Desert Tortoise 2010
each additional tortoise on that transect Analysis was applied to all live tortoises larger than 180 mm MCL Transects were packaged into monitoring strata (ldquoregionsrdquo in Program DISTANCE) I truncated observations to improve model fit as judged by the simplicity (reasonableness) of the resulting detection function estimate (Buckland et al 2001) Using truncated data I used the Akaike Information Criterion (AIC) to compare detection-function models (uniform half normal and hazard-rate) and key functionseries expansions (none cosine simple polynomial hermite polynomial) recommended in Buckland et al (2001)
Proportion of available tortoises detected on the transect centerline g(0) Transects were conducted by 2-person crews using the method adopted beginning in 2004 (USFWS 2006) Transects were walked in a square with the lead crew member walking a straight line on a specified compass bearing trailing about 25 m of line and the second crew member following at the end of the line This technique involves little lateral movement off the transect centerline where attention is focused Use of two observers allows estimation of the proportion of tortoises detected on the line this provides a test of the assumption is that all tortoises on the transect centerline are recorded (g(0) = 1) The capture probability (p) for tortoises within increasing distances from the transect centerline was estimated as for a 2-pass removal estimator (White et al 1982) p = (leadndashfollow)lead where lead = the number of tortoises first seen by the observer in the leading position and follow = the number of tortoises seen by the observer in the follower position The corresponding proportion detected on the line by two observers was estimated by g = 1 ndash q2 where q = 1 ndash p Figure 4 graphs the relationship between the single-observer detection rate (p) and the corresponding dual-observer detection rate (g(0) ldquogee at zerordquo) The actual proportion detected can be estimated but to avoid the necessity of compensating for imperfect detection during training field crews (pairs) are expected to detect 96 of all models within 1 m of the transect centerline This corresponds to the leader being responsible for at least 80 of the teamrsquos detections near on the centerline in order to meet this standard (Fig 4) and is the basis for one of the training metrics (see Table 3)
Few or no tortoises are located exactly on the line and even examining a small interval (such as 1 m on each side of the transect line) results in few observations to precisely estimate g(0) Instead my test of the assumption involves examination of the lead and follow proportions starting with counts of tortoises in larger intervals from the line moving to smaller intervals centered on the transect centerline As the intervals get smaller the sample sizes also get smaller but the estimates are more relevant to the area right at the transect centerline The expectation is that the estimates should converge on g(0) = 10
If the test does not indicate that all tortoises were seen on the transect centerline the variance of p can be estimated as the binomial variance = q(1 + q)np (White et al 1982) where n = the estimated number of tortoises within 1 m of the transect centerline and the variance of g(0) is estimated as twice the variance of p
21
Range-wide Monitoring of the Mojave Desert Tortoise 2010
0
02
04
06
08
1
05 06 07 08 09 1
Tea
m d
etec
tio
n o
n t
he
line
g(0
)
Leader Detection (p)
Figure 4 Relationship between single-observer detections (by the leader p) and dual-observer (team) detections g(0)
Estimates of tortoise density Each year the density of tortoises is estimated at the level of the recovery unit The calculation of these densities starts with estimates of the density of tortoises in each stratum from Program DISTANCE as well as their variance estimates
nD
2wLPaG0 g 0 where L is the total length of kilometers walked in each stratum and w is the distance to which observations are truncated so 2wL is the area searched in each stratum This is a known quantity (not estimated) Pa is the proportion of desert tortoises detected within w meters of the transect centerline and was estimated using detection curves in Program DISTANCE The encounter rate (nL) and its variance were estimated in Program DISTANCE for each stratum Calculation of D requires estimation of nL Pa G0 and g(0) This means that the variance of D depends on the variance of these quantities as well
For desert tortoise densities the encounter rate (nL) is estimated independently for each stratum whereas proportion of available tortoises and proportion of available tortoises detected on the transect centerline are estimated jointly for all strata (g(0)) or for all strata in the recovery unit (G0) The detection function which comes into the above equation as Pa may be estimated jointly or separately depending on the number and quality of observations In 2010 separate detection curves were created for GBI and IWS pooled across all strata surveyed by each team Although a single detection curve was also considered for Kiva detections the patterns were very different in the south (mostly Colorado Desert) compared to the north (Mojave Desert) so
22
Range-wide Monitoring of the Mojave Desert Tortoise 2010
separate curves were developed for strata in the two areas (see Results) A schematic of the process leading to density estimates is given in Figure 5 Contributing estimates in the four left-hand columns are listed with the subsets of the data on which they are based These estimates combined from left to right to generate stratum and recovery unit density estimates Because transect records were associated with recovery units under the USFWS (1994) recovery plan those recovery units are used here although the data for 2010 and earlier years will be repackaged to later describe trends in the USFWS (2011) recovery units
Whereas the number of tortoises in the set of strata representing a recovery unit can simply be added together the variance must be arrived at by accounting for whether this involves pooled or independent estimates As described above three of the four estimates that contribute to calculating density in a stratum were based on data ldquopooledrdquo from other strata as well so when data from these strata are combined the correlated nature of the variances has to be accounted for Specifically the method described in Buckland et al (200189) was used to combine density variances correctly and arrive at the variance (and confidence intervals and CV) for the recovery unit Variance estimates cannot currently be combined within Program DISTANCE as required for the analysis described here so final construction of density mean and variance estimates from the above components was completed without specialized software
Tortoise encounter rate
Proportion that are
visible G0
Detection rate Pa
Proportion seen on the line g(0)
Density Density
Stratum or Neighboring
G0 sites
Data collection
group Overall Stratum Recovery unit
FK Ord-Rodman + Superior- Cronese
Kiva north
Full set of tortoise observations
FK
Western Mojave
SC SC
OR OR
JT Joshua Tree
NP + Chuckwalla
Kiva south
JT
PT PT
CK CK Eastern Colorado
AG AG
CM Piute +
Chemehuevi + Ivanpah
IWS
CM Northern Colorado
FE FE
Eastern Mojave IV IV
PI PI
GB Gold Butte +
Halfway Wash to 22 April
GBI
GB
Northeastern Mojave BD Halfway Wash
after 22 April BD
MM MM
CS Coyote Springs CS
Figure 5 Process for developing density estimates in 2010 For each type of estimate the full set of data was subdivided appropriately USFWS (1994) recovery units are used for this analysis
23
Range-wide Monitoring of the Mojave Desert Tortoise 2010
Estimating the area of each stratum sampled and the number of tortoises in that area Before the 2008 field season based on experience in 2007 and visual examination of DEM overlays all assigned transects were classified as possible for completion as 12k 6k or as unwalkable (USFWS 2012) These classifications before the field season are advisory only because exact ground conditions weather and crew condition all affect the ability to complete a transect If a non-standard transect (not 12 km square) is walked crews indicate the obstacles they encountered that forced the change in protocol In addition to the above named factors substrate that is very loose on a steep slope or that includes large boulders can make progress so slow or treacherous that crews modify the transect
Each year some transects are repeated providing new information on ground conditions and new transects are attempted At the end of each field season transects that were completed differently from expected are evaluated At that point a decision is made whether to reclassify the transect The classification is used to advise future transect completion but also to estimate the proportion of each monitoring stratum that is actually represented by the walked transects
Because each transect of any length is built off of the southwestern corner how that transect is completed is one representation of transects built on all possible southwestern corners In order to avoid selection bias by crews there were only 3 classification options for entire transects so that only 0- 6- or 12-km were actually walked but of course all of the distances between these options might actually have been walkable Transects that were not walked represent all transects that could be walked for lengths of 0- to 6-km It is parsimonious to therefore assume that on average 3 km could have been walked for each transect classified as ldquounwalkablerdquo Transects completed using the 6km option represent all of those that could have been completed for distances of 6- to 12-km averaging 9 km so that is the expected value for all of those transects Transects completed as 12 km represent the 100 completion option The total area of the stratum that is unwalkable is estimated as
௧௦௧௦ሻ ାହሺ௨௪ሻ௧௦௧௦ሺଶହൌ ݐݎݎ ݓݑ ௧௦௧௦ ௦௦ௗ ௦ ଶ
If a given stratum covers 5000 km2 but only 90 was walkable and represented by our sampling design then the density estimates applies to 4500 km2 and can be used to generate an estimate for the number of tortoises in those 4500 km2 Using these area estimates adds another source of imprecision so abundance estimates are slightly less precise than the density estimates they derive from The additional error of this estimate is calculated as the error for a binomial proportion
24
Range-wide Monitoring of the Mojave Desert Tortoise 2010
Modification of previous procedures In 2010 two new procedures for walking transects affect how we use transect completion information to estimate the proportion of each stratum that is walkable First in acknowledgment that public lands outside tortoise conservation areas increasingly used for activities that are not compatible with tortoise conservation transects are now reflected inward from the [usually] invisible stratum boundaries This new procedure has also caused the reclassification of some transects to walkable where stratum boundaries exclude mountain ranges for instance Next crews completed all transects except those walked by GBI in Nevada using the 12 km square path completing as much of that path as possible The calculation of unwalkable area in these strata now based on the proportion of unwalkable kilometers not unwalkable transects
Debriefing to describe strengths and weaknesses of project preparation and execution At the end of each field season a debriefing meeting was held to review tasks and responsibilities strengths and weaknesses of the program and to plan for the next field season Because the field teams had disbanded by then field crew members were surveyed prior to the end of the field season to nonetheless gather their direct input as we identified training and logistical issues to target for improvement before the next field season Although issues andor tasks may be ascribed to individual entities this meeting is most beneficial in identifying where centralized andor coordinated response is required to improve the quality of the program
RESULTS
Field observer training The smaller Kiva and IWS groups trained alongside one another and mostly separate from GBI although experienced crews worked between all three teams Training started on 11 March and continued through 6 April in 2 staggered sessions (Table 1) Final tests of field detection abilities occurred toward the end of this period
Proportion of tortoises detected at distances from the transect centerline Table 2 reports the proportion of models that were available and were detected by each team at 1- 2- and 5-meters from the transect centerline Teams were tested after a trial run on the detection lines (GBI and IWS crews) or after walking practice transects for returning crews that wanted to refresh the search pattern (Kiva) Detection on the centerline should be 100 and many crews achieved this First-year trainees detected a similar proportion of models at 1- and 2-m compared to experienced crews with first-year trainees detecting fewer models at 5 m
Table 3 reports further statistics for each team after collecting data on 16 km on the evaluation lines Column 4 reports the average absolute difference between the expected and measured perpendicular distances from the model to the walked line All measurements for all models during the 2-day trial are used for this estimate and capture inaccuracies from 1) using a compass and measuring tape to record distances to the models plus 2) inaccurately following the
25
Range-wide Monitoring of the Mojave Desert Tortoise 2010
trajectory of the transect The latter source of error does not occur on monitoring transects because the walked transect is the true transect In contrast on training lines error in measurements is increased if crews do not walk on exactly the measured line that was used to place the models On average the measured distance of models to the centerline was 21 cm closer than the actual distance with increasing bias for models farther from the line The ldquoAvailable Models Detected by Leaderrdquo column reports the proportion of all models that were found first by the leader During training this number is easily calculated and is used to identify crews in which one of the observers is not finding at least 80 of all detected With an 80 detection rate for the leader a 96 detection rate is expected for the team
Table 2 Proportion of tortoise models detected within 1- 2- or 5-m of the transect centerline Values that scored below the target of 090 at 1- or 2-m are highlighted
Proportion of existing models within a given distance detected by the team
Team 1m 2m 5m
1 093 096 087 2 100 096 091 3 092 096 094 4 100 088 087 5 100 093 095 6 100 092 088 7 085 090 086 8 100 100 090 21 100 089 093 22 093 089 088 23 100 100 097 24 085 089 088 26 100 100 097 27 088 093 094 28 100 100 094 51 100 096 095 52 100 100 094 53 100 096 093 54 100 100 090 55 093 096 093 56 100 093 090 57 093 096 096 58 100 100 094 59 100 096 091 60 100 096 092 61 100 096 088 62 100 100 094
GBI 099 097 093 Kiva 096 094 090 IWS 095 094 093
Overall 097 095 092
26
Range-wide Monitoring of the Mojave Desert Tortoise 2010
Table 3 Diagnostics for individual teams after training
Team
Available models detected Measured v exact model distance (m) Estimated
abundance
95 confidence interval
Within 2m of centerline by
leader
Within 2m of centerline by
team Lower limit Upper limit
1 085 096 079 396 3023 5193
2 081 096 079 377 3268 4346
3 089 096 096 409 3437 4855
5 081 088 077 443 3596 5460
6 086 093 084 397 3451 4574
7 088 092 073 375 3197 4397
8 087 090 078 378 3415 4173
21 093 100 079 682 5243 8881
22 085 089 076 356 3184 3989
23 085 089 114 433 3941 4746
24 096 100 089 408 3269 5096
26 089 089 079 366 3241 4122
27 100 100 082 427 3135 5823
28 086 093 074 402 2960 5472
51 100 100 087 390 3253 4675
52 086 096 080 370 3308 4138
53 100 100 087 403 3652 4438
54 085 096 075 441 3697 5260
55 092 100 055 345 2946 4031
56 088 096 101 475 3881 5805
57 089 093 080 384 2868 5133
58 081 096 081 451 3772 5397
59 086 100 063 464 3801 5663
60 086 096 102 477 3558 6395
61 089 096 080 343 2978 3941
62 096 096 113 461 3841 5538
Target gt080 gt090 lt1 410
GBI 091 097 083 4152
IWS 097 094 086 3974
Kiva 092 094 081 4321
Overall 093 095 083 4156
During training personnel on 2 teams were switched after unsuccessful practice runs The resulting 2 teams are included in Tables 2 and 3 Although some individual metrics were below-par (gray cells in the above tables) the teams were all judged to perform well overall and no further changes were made During training various detection curves were fit to each crewrsquos set of tortoise model observations In no case did a negative exponential model best describe the
27
Range-wide Monitoring of the Mojave Desert Tortoise 2010
data Because this model does not involve fitting a ldquoshoulderrdquo to the data near the centerline these detection curves would have been unacceptable The best-fitting of the 3 remaining basic types of models were then fit to the data to generate the density estimates in Table 3 In Figs 6-8 each crewrsquos data were fit to uniform or half-normal models for illustration purposes Crews were not evaluated on their ability to a particular curve shape however we did provide guidance to individual crews to better match the search patterns of their teammates This was taken as an opportunity to focus field personnel on an additional level of conformity Distance sampling and development of a single detection curve from many observers is robust to the effects of pooling across observations from crews with variable search patterns as long as all of the observers contribute proportionally to the overall pattern (Marques et al 2007)
Within the GBI crews teams 51 and 52 had the most anomalous curves (broadest shoulders) in Figure 6 These teams were coached on tightening their search pattern to better match other teams however neither team had other diagnostic issues Although the IWS trainee curves as a group had broader shoulders than the GBI curves they were similar to one another and no problems are evident The Kiva detection curves were more disparate between themselves Three of these teams (1 3 and 8) left training a few days earlier than the others They had passed all of the training metrics and left to match the earlier opening of CMAGR Although the other teams received feedback and worked to match one anotherrsquos detection curves in the final trials the first three teams (the ones with the narrowest shoulders that most rapidly lose detections with increasing distance from the line) did not
00
02
04
06
08
10
0 2 4 6 8 10 12 14
DE
TE
CT
ION
PR
OB
AB
ILIT
Y
PERPENDICULAR DISTANCE (m)
Figure 6 Detection curves for each of the 2010 GBI teams during training Curves are based on 16 km trials with approximately 100 detections Anomalous patterns described in text are indicated with dotted lines
28
Range-wide Monitoring of the Mojave Desert Tortoise 2010
00
02
04
06
08
10
0 2 4 6 8 10 12 14
DE
TE
CT
ION
PR
OB
AB
ILIT
Y
PERPENDICULAR DISTANCE (m)
Figure 7 Detection curves for each of the 2010 IWS trainee teams Curves are based on 16 km trials with approximately 100 detections
00
02
04
06
08
10
0 2 4 6 8 10 12 14
DE
TE
CT
ION
PR
OB
AB
ILIT
Y
PERPENDICULAR DISTANCE (m)
Figure 8 Detection curves for each of the 2010 Kiva trainee teams Curves are based on 16 km trials with approximately 100 detections Anomalous patterns described in text are indicated with dotted lines
29
Range-wide Monitoring of the Mojave Desert Tortoise 2010
Quality assurance and quality control There were 23710 transect records and 5762 G0 records associated with the monitoring effort in 2010 After data specialists with the field teams had finished verifying and validating the data there were still 706 cases where data were inconsistent with constraints and expectations (Many more issues are addressed by data specialists for field crews before the field data are submitted) Of these 681 were errors created by the field crews (sometimes faulty equipment other times data entry error) Two hundred fifty of these could be corrected based on information collected on paper datasheets while fields that should have been populated by faulty equipment could not be addressed Another 22 errors were ldquoprocessingrdquo errors Processing steps are associated with correcting other errors (perhaps a word is misspelled) or with adding new fields or any other manipulation that occurs after the data have been collected This year the bulk of the processing errors involved additional decimals in the elevation field
Transect completion Table 4 reports the number of assigned and completed transects in each stratum Kiva was assigned 328 transects and walked this number but were not always able to replace assigned unwalked transects with alternates in the same strata As a result too few transects were completed in Chuckwalla Joshua Tree and Pinto Mountain strata and all 7 of these transects were later completed in northern strata All assigned transects were completed or replaced by IWS One transect was inadvertently walked twice (counted once) and at the end of the field season one crew was able to complete an additional transect that was not a replacement for any assigned one GBI completed more transects then the other 2 teams and also had more errors Eight transects were walked on two separate occasions (duplicates are counted as one transect in Table 4) Three of the duplicated transects were purposely repeated when the first attempt was not completed to protocol or when illness interrupted the first attempt For a variety of reasons including logistical ones 8 assigned transects were neither completed nor replaced by alternates in their strata and 2 additional transects were completed in strata that did not need replacements
Great Basin Institute began to address the issue of route-less areas that have not been accessible in any past years Base-camping into these areas allowed crews to be provisioned with supplies including water This resulted in completion of 24 transects where crews would otherwise have had to hike 5 km or more one way to access transects Any field personnel provisioning these base camps for other crews are not themselves walking transects
Table 4 indicates the number of assigned transects that could be completed as standard square 12km transects (column 4) as well as the number that were completed by reflecting around obstacles These transects are all considered to represent flatter topography in the monitoring stratum An additional number (column 5) were completed as 6 km squares (GBI) or shortened as little as possible (IWS and Kiva) and represent more rugged terrain Finally some transects were considered unwalkable (column 6)
30
Range-wide Monitoring of the Mojave Desert Tortoise 2010
The last 2 columns of Table 4 represent situations that were not anticipated Crews were to shorten or abandon transects if the terrain presented too much of an obstacle but reflecting around terrain was not a planned option However on some relatively rare occasions (column 7) crews had partially walked a transect before determining that it could not be completed following the correct protocol In these situations they would not have sufficient time to move to an alternate transect on the same day so they instead reflected around terrain to collect data for the lower topography portion of the current transect
Column 8 reports transects that appear walkable based on remote imagery but were not completed All of these were reevaluated and some were reclassified based on this [additional] year of field information (see Evaluating transect classification below) Note that transects on military installations (CMAGR Ft Irwin China Lake and Edwards AFB) are regularly but unpredictably inaccessible due to military activities This corresponds to the 7 transects listed here for CMAGR (AG) 2 on Superior-Cronese and 1 on Fremont-Kramer Figures 9 through 12 show locations of transects and observations of live tortoises
Table 4 Number and type of transects in each stratum Stratum abbreviations as in Fig 1
Assigned
Assigned and alternate transects
Assigned completed
Assigned completed
Assigned judged
unwalkable
Assigned completed by reflecting to
Assigned judged
walkable but Stratum transects completed 12k shortened avoid terrain not walked
AG 33 33 22 3 8 7 BD 68 66 38 22 6 1 CK 64 61 34 21 6 3 CM 40 40 30 2 8 1 2 CS 100 99 58 21 20 9 FE 20 20 18 2 0 FK 50 50 41 7 2 2 GB 130 128 59 46 23 4 7 IV 30 31 23 3 4 1 JT 27 25 11 11 3 1
MM 132 132 65 52 13 7 OR 25 25 14 7 4 1 PI 44 44 30 8 6 3 2 PT 20 21 8 6 4 SC 109 113 91 12 6 3
Total 892 888 542 223 113 8 46
GBI 430 425 220 141 62 4 24 IWS 134 135 101 15 18 4 5 Kiva 328 328 221 67 33 0 17
Assigned transects that were not walked were supposed to be replaced by alternates
31
Range-wide Monitoring of the Mojave Desert Tortoise 2010
Figure 9 Distribution of distance sampling transects and live tortoise observations in the Northeastern Mojave Recovery Unit (Coyote Springs Valley Mormon Mesa Beaver Dam Slope and Gold Butte-Pakoon monitoring strata)
32
Range-wide Monitoring of the Mojave Desert Tortoise 2010
Figure 10 Distribution of distance sampling transects and live tortoise observations in the Eastern Mojave Recovery Unit (Piute-Eldorado Ivanpah and Fenner monitoring strata) and the Northern Colorado Recovery Unit (Chemehuevi monitoring stratum)
33
Range-wide Monitoring of the Mojave Desert Tortoise 2010
Figure 11 Distribution of distance sampling transects and live tortoise observations in the northern portion of the Western Mojave Recovery Unit (Fremont-Kramer Superior-Cronese and Ord-Rodman monitoring strata)
34
Range-wide Monitoring of the Mojave Desert Tortoise 2010
Figure 12 Distribution of distance sampling transects and live tortoise observations in the southern portion of the Western Mojave Recovery Unit (Pinto Mountains and Joshua Tree monitoring strata) and the Eastern Colorado Recovery Unit (Chuckwalla and Chocolate Mountain monitoring strata)
35
Range-wide Monitoring of the Mojave Desert Tortoise 2010
Tortoise encounter rates and detection functions In 2010 all pairs worked together from the beginning to the end of the season Each Kiva crew walked a median of 41 transects and overall they detected 196 tortoises over 180 mm MCL GBI crews walked a median of 35 transects and detected 179 tortoises and IWS crews had considerably lower effort with a median of 23 transects (days of work) However each IWS observer subsequently walked 1-person distance transects in a separate study at the Large Scale Translocation Site near Jean Nevada altogether IWS personnel completed 40 days of work and the team observed 122 tortoises and the LSTS encounters were used to model the overall IWS detection probability illustrated in Fig 14 There were sufficient observations to generate separate detection curves for each team so I planned a minimum of 3 detection curves
Figures 13 to 16 are histograms of the observed number of tortoises seen at increasing distance from the transect centerline There is one histogram each for IWS and GBI plus separate histograms for Kiva detections in the northern and southern areas that they surveyed These observations were used to model detection curves overlaid in the same figures Based on detection function behavior it is typical to discard a few observations in the tails of the histograms in order to build a more robust model (Buckland et al 2001) Each figure indicates the customized truncation distance that was applied Any observations that are not used to estimate detection functions will also not be used to estimate the encounter rate (tortoises detected per kilometer walked) Tortoise encounter rates are low enough that this becomes a factor in considering how to truncate observations to develop detection functions Truncation was conservative in order to maximize the number of observations per stratum
For GBI the best half-normal and uniform models were within ΔAIC=147 of the better-fitting hazard rate model with much better precision for the half-normal model but no meaningful difference in density estimate between the half-normal and hazard rate models On the basis of precision I used the half-normal model with second-order cosine adjustment to fit the detection function The second-order adjustment is seen in the extra inflections in the tail of the curve (Fig 13) This additional data fitting was called for unless observations were truncated at 8 m with an unacceptable loss of 38 additional observations For IWS data were truncated at 14 m and fit best to a uniform model with a single cosine adjustment I evaluated separate curves for northern and southern detections by Kiva because there were sufficient detections for two curves and because these transects represent a long north-south gradient The AIC for the single model was greater than the sum of AICs for the separate models with the same truncation distance (same data) so separate models better fit the data In the north (Fremont-Kramer Ord-Rodman and Superior-Cronese) the data were truncated at 12 m and fitted best to a uniform model with cosine adjustment In the south data were truncated at 8 m and fit to a half-normal model
36
Range-wide Monitoring of the Mojave Desert Tortoise 2010
Figure 13 Observed detections (histogram) and the resulting detection function (smooth curve) for live tortoises with MCL ge 180mm found by GBI This curve uses only the 164 tortoise seen within 16 m of the centerline
Figure 14 Observed detections (histogram) and the resulting detection function (smooth curve) for live tortoises with MCL ge 180mm found by IWS This curve uses only the 111 tortoises seen within 14 m of the centerline
00
02
04
06
08
10
12
0 2 4 6 8 10 12 14 16
Det
ectio
n P
roba
bilit
y
Perpendicular distance (m)
00
02
04
06
08
10
12
0 1 2 3 4 5 6 7 8 9 10 11 12 13 14
Det
ectio
n P
roba
bilit
y
Perpendicular (m)
37
Range-wide Monitoring of the Mojave Desert Tortoise 2010
Figure 15 Observed detections (histogram) and the resulting detection function (smooth curve) for live tortoises with MCL ge 180mm found by Kiva in Fremont-Kramer Superior-Cronese and Ord-Rodman This curve uses only the 92 tortoises seen within 12 m of the centerline
Figure 16 Observed detections (histogram) and fitted detection function (smooth curve) for live tortoises with MCL ge 180mm found by Kiva in Joshua Tree Pinto Mountains Chuckwalla and on CMAGR This curve uses only the 85 tortoises seen within 8 m of the centerline
00
02
04
06
08
10
12
0 1 2 3 4 5 6 7 8 9 10 11 12
Det
ectio
n P
roba
bilit
y
Perpendicular distance (m)
00
02
04
06
08
10
12
0 1 2 3 4 5 6 7 8
Det
ectio
n P
roba
bilit
y
Perpendicular distance (m)
38
Range-wide Monitoring of the Mojave Desert Tortoise 2010
The area below each of the curves in Figs 13ndash16 is the proportion of tortoises that were detected Pa estimated as far as the truncation distance (the farthest distance on the x-axis in each figure) Based on these curves GBI detected 412 of the visible tortoises within 16 m of the centerline (CV=0085) The corresponding estimate of Pa for strata surveyed by IWS was 586 (CV=0060) within 14 m for Kiva in the north was 583 (CV=0070) within 12 m and for Kiva in the south it was 671 (CV=0100) within 8 m
Proportion of tortoises available for detection by line distance sampling G0
In general telemetry sites and associated transects were completed sequentially from south to north This pattern corresponds to the expected timing of tortoise activity peaking first in the south Tortoise availability was estimated separately transects in each of these areas Dates total days monitored and G0 estimates are given in Table 5
Table 5 Availability of tortoises (G0) during the period in 2010 when transects were walked in each group of neighboring strata
G0 sites
Gold-Butte Halfway Wash
Strata
Gold Butte
Dates
7 Apr ndash 22 Apr
Days
16
G0
(Std Error)
077 (0177)
Halfway Wash Beaver Dam Slope Mormon Mesa
23 Apr ndash 15 May 23 080 (0115)
Coyote Springs Valley
Piute Ivanpah Chemehuevi
Joshua Tree Chuckwalla
Coyote Springs
Piute-Eldorado Chemehuevi Fenner Ivanpah
Chocolate Mtns Chuckwalla Joshua Tree Pinto Mtns
16 May ndash 28 May
31 Mar ndash 29 Apr
23 Mar ndash 10 Apr
13
30
19
086 (0130)
082 (0179)
089 (0122)
Ord-Rodman Superior-Cronese
Fremont-Kramer Ord-Rodman Superior-Cronese
13 Apr ndash 6 May 24 096 (0066)
Proportion of available tortoises detected on the transect centerline g(0) Because they are cryptic even tortoises that are visible (not covered by dense vegetation or out of sight in a burrow) may not be detected For 50 detections of tortoises within 1 m of the transect centerline 44 were found by the observer in the lead position and 6 by the follower so that the probability of detection by single observer p = 0864 and the proportion detected using the dual observer method g(0 to 1 m) = 0981 (SE = 006) Figure 17 shows that g(0) was converging on 10 indicating the assumption of perfect detection on the centerline was met consequently no adjustment was made to the final density estimate The curves since 2004 all
39
Range-wide Monitoring of the Mojave Desert Tortoise 2010
support the premise that complete detection on the transect line was achieved for years in which the dual-observer method was used (USFWS 2009 2012)
000
020
040
060
080
100
0 2 4 6 8 10 12
Pro
port
ion
dete
cted
Distance x from transect centerline (m)
p
g(0)
Figure 17 Detection pattern for the leader (p) and by the team (g(0)) based on all observations out to a given distance (x) from the centerline in 2010 Note convergence of g(0) on 10 at the transect centerline as x goes to 0
Estimates of tortoise density Density estimates were generated separately for each monitoring stratum (Table 6) then weighted by stratum area to arrive at average density in the monitored area of each recovery unit (Table 7) Although encounter rates were estimated separately for each stratum and have independent variances the detection function and G0 were estimated jointly pooling data from multiple strata so these variances are not independent (Fig 5 illustrates how estimates were pooled for 2010)
When the annual estimates are imprecise it should not be expected that there will be a close match from one year to the next Over a period of many years however any underlying trend in the number of tortoises should be obvious through this ldquobackground noiserdquo The CVs in 2010 represent an overall improvement in precision from previous years a function of improved funding in this one year
40
Range-wide Monitoring of the Mojave Desert Tortoise 2010
Table 6 Recovery unit and stratum-level encounters and densities in 2010 for tortoises with MCL ge 180mm
Sampling Dates nRecovery Area Number of Total transect Field Density
Stratum (tortoises CV(n) CV(Density) Unit (km2) Transects length (km) Begin End Observers (km2)observed)
Northeastern Mojave 4889 425 4265 7-Apr 28-May 164 32 158
Beaver Dam Slope BD 828 66 662 23-Apr 15-May GBI 23 22 8 33 282
Coyote Springs Valley CS 1117 99 1046 16-May 28-May GBI 43 167 36 240
Gold Butte-Pakoon GB 1977 128 1258 7-Apr 22-Apr GBI 22 250 17 351
Mormon Mesa MM 968 132 1298 24-Apr 16-May GBI 76 123 55 207
Eastern Mojave 6763 95 1096 31-Mar 29-Apr 46 33 296
Fenner FE 1862 20 246 31-Mar 27-Apr IWS 23 283 69 361
Ivanpah IV 2567 31 365 1-Apr 29-Apr IWS 5 416 10 473
Piute-Eldorado PI 2334 44 485 31-Mar 29-Apr IWS 18 246 27 333
Northern Colorado 4038 40 458 31-Mar 30-Apr 26 247 42 334
Chemehuevi CM 4038 40 458 31-Mar 30-Apr IWS 26 247 42 334
Western Mojave 9336 234 2591 23-Mar 6-May 105 31 148
Fremont-Kramer FK 2462 50 574 15-Apr 6-May Kiva 19 225 25 245
Joshua Tree JT 1567 25 227 25-Mar 13-Apr Kiva 6 539 28 565
Ord-Rodman OR 1124 25 270 17-Apr 4-May Kiva 27 228 75 248
Pinto Mountains PT 751 21 213 25-Mar 10-Apr Kiva 7 514 34 542
Superior-Cronese SC 3447 113 1307 13-Apr 6-May Kiva 46 159 26 187
Eastern Colorado 4263 94 991 23-Mar 10-Apr 72 57 189
Chocolate Mountain AG 755 33 378 25-Mar 5-Apr Kiva 50 192 138 256
Chuckwalla CK 3509 61 613 23-Mar 10-Apr Kiva 22 253 37 304
41
Range-wide Monitoring of the Mojave Desert Tortoise 2010
Table 7 Estimated density of desert tortoises in monitored areas of each recovery unit in the Mojave and Colorado deserts in 2010
Lower limit Upper limit Area Kilometers Tortoises Density 95 CI 95 CI CV
Recovery Unit (km2) walked detected (km2) (Density) (Density) (Density)
Northeastern Mojave 4889 4265 164 32 236 438 158 Eastern Mojave 6763 1096 46 33 186 579 296 Northern Colorado 4038 458 26 42 222 795 334 Western Mojave 9236 2591 105 31 236 420 148 Eastern Colorado 4263 991 72 57 397 828 189
Area of each stratum sampled and the number of tortoises in that area
Evaluating transect classification In 2010 196 of the 888 walked transects were not completed as predicted The following table summarizes conclusions after examining these transects
Table 8 Transects completed other than as planned and any resulting reclassification
Previous New Number of Situation
substratum substratum transects 12k On-the-ground observation differs from imagery 6k 21
Shortened in 2010 but previous experience or correct 12k 12k 52
modification would allow completion 6k On-the-ground observation differs from imagery 12k 31
Unwalkable On-the-ground observation differs from imagery 12k 16 New rules to reflect into stratum moved transect out of too-
Unwalkable 12k 12rugged terrain
Unwalkable On-the-ground observation differs from imagery 6k 19 Lengthened in 2010 but other crews might be unable to walk
6k 6k 18as a 12k Crew completed the transect using incorrect protocols or
Unwalkable Unwalkable 11attempted new rules but couldnrsquot walk at least 6km New shortening rules allowed at least 6km completed but
Unwalkable Shortened 16earlier rules would have classified these as unwalkable
Twenty-eight transects that would have been unwalkable under the previous protocols were attempted and completed this year using new rules to reflect into stratum boundaries (range-wide) and to shorten transects by walking only the safely walkable portions of the 12 km route (Kiva and IWS field teams only) In the first case 12 transects were completed because they were correctly reflected into strata under new rules These otherwise unwalkable transects were completed because stratum boundaries were often drawn to exclude more rugged topography Sixteen previously unwalkable transects were walked for at least 6 km using new rules to shorten transects without completing the SW quadrant These would still be ldquounwalkablerdquo under the original classification system
42
Range-wide Monitoring of the Mojave Desert Tortoise 2010
After the field season 168 anomalous transects were reviewed Of these 87 were reclassified based on crew experience In some cases the crews encountered substrate or other features that were not apparent from imagery in many others the original classification based on imagery was ambiguous because over the course of a 12 km transect terrain is so variable to that it was not a simple matter to evaluate the time required for a typical crew to complete it The remaining 81 anomalous transects were not reclassified either because the classification still seems ambiguous or because the crewrsquos modification was based on access illness or considerations unrelated to terrain
Proportion of each stratum walked The proportion of each stratum walked in 2010 could be calculated based on the proportion of transects shortened andor replaced (GBI) or based on the proportion of kilometers walked based on the expectation that 12 km should be walked for each transect assigned (Kiva and IWS) In 2008 and 2009 only the previous method was used and all transects assigned in 2010 had already been classified as 12k 6k or unwalkable To test the comparability of estimating the unsampled part of each stratum I calculated the number of kilometers expected to be walked based on the 12k6kunwalkable classification of each assigned transect then compared this to the proportion of kilometers estimate (Table 9)
Table 9 Proportion of each stratum that can be sampled Stratum abbreviations as in Fig 1
Proportion assigned transects expected to be walked ashellip Km walked
Assigned Stratum transects 12k 6k Replaced Expected Observed Chi-sq
AG 33 848 121 3 375 2886 198 BD 66 606 303 91 600 5905 01 CK 61 639 18 18 600 5652 20 CM 40 775 75 15 417 3772 38 CS 99 606 273 121 882 8243 38 FE 20 100 0 0 240 2335 02 FK 50 94 6 0 591 5496 29 GB 128 484 352 164 1014 9902 05 IV 30 867 0 133 324 3051 11 JT 25 56 24 20 237 1976 66
MM 130 531 392 77 1134 10915 16 OR 25 68 20 12 258 2329 24 PI 44 705 182 114 459 4175 38 PT 18 50 111 389 147 1406 03 SC 109 89 64 46 1242 12029 12
Total 878 8520 8007 501 GBI 423 3630 3496 61 IWS 134 1440 1333 89 Kiva 321 3449 3177 352
43
Range-wide Monitoring of the Mojave Desert Tortoise 2010
Chi-squared values in the final column indicate a poor fit between predictions and completion at CMAGR which is not surprising given constraints on access to different parts of the range each year (crews frequently cannot get access to otherwise walkable transects so these transects are replaced) With the exception of CMAGR the strata individually and for each group combined indicate that the completed kilometers were accurately predicted regardless of method used to estimate unwalkable terrain
This means we can use the observed kilometers walked to estimate the area over which our density estimates apply For strata walked by GBI we can use the proportion of transects classified as 12k6kunwalkable instead Because this project uses the same base set of transects each year the majority of transects have been walked in multiple years Table 9 demonstrates that the 2 methods of estimating the proportion of area sampled are equivalent so we can develop a more representative estimate of the walkable area of these strata if we use empirical data from all transects walked between 2008 and 2011 (the latest set of compiled data) Since 2008 2464 separate transects have been evaluated in these strata this is a much larger (representative) sample than the 878 evaluated only in 2010 Table 10 gives the area of each stratum the proportion covered by our density estimates and converts the density in each stratum into an estimate of tortoise abundance
Table 10 Estimated tortoise abundance in sampled areas of each stratum The ldquoproportion sampledrdquo column is based on evaluation of all transects in the sample set from 2008 through 2011 Stratum abbreviations as in Fig 1
Area Proportion SE(Prop Sampled N (number 95 Confidence Interval Stratum (km2) sampled Sampled) area (km2) of tortoises) Lower Limit Upper Limit
AG 755 095 0024 715 9863 60058 161977 BD 828 089 0032 738 2422 14013 41853 CK 3509 082 0030 2890 10804 60077 194313 CM 4038 093 0023 3755 15788 83362 299009 CS 1117 086 0031 958 3471 21707 55514 FE 1862 096 0020 1790 12419 62465 246911 FK 2462 096 0017 2372 5869 36520 94318 GB 1977 081 0027 1604 2782 14224 54410 IV 2567 095 0021 2442 2476 10247 59806 JT 1567 074 0033 1159 3197 11360 89963
MM 968 086 0034 836 4624 30712 69628 OR 1124 073 0040 821 6119 37498 99865 PI 2334 082 0024 1911 5249 27733 99354 PT 751 069 0051 522 1785 6553 48634 SC 3332 095 0015 3149 8276 57509 119102
Total 29190 0879 24656 95145 770367 1175107
44
Range-wide Monitoring of the Mojave Desert Tortoise 2010
Debriefing to identify strengths and weaknesses in preparation for future years This meeting was held on 8 June about 1 week after all field work was completed The following issues were identified for coordinated effort rather than by efforts of single parties
Need for more central responsibility for planning data It was decided that starting in 2011 MDEP will host server-based [GIS] information for use by mapmakers Through 2010 MDEP has provided Mojave-wide data layers to individual field teams and assigned transects were identified by the UTM coordinates of their southwestern corners Because there was little central oversight over how these data were acquired and used different field teams had variable map quality and occasionally shifted transects when processing the corner coordinates into full square transects This processing including any planned shortening andor reflections should be repeatable each time the same transect is assigned so centralized responsibility for this would be a better option
Training improvements to make more effective use of same time period In 2010 there were more trainees from more teams in the same areas for training at the same time Use of the Desert Tortoise Conservation Center would be improved by setting up more stations (with more instructors) for smaller groups of trainees Also although objectives have been articulated for instructed material this is not the case for the many days available for designated field practice On those days additional oversight and specific objectives that can be evaluated would improve effectiveness and provide additional feedback to crews
Current hardware is less trustworthy and cannot utilize improved software Since 2007 responsibility for providing the same data collection systems to all field teams has been centralized with the USFWS Those units (data collection systems including connected GPS) are now outdated and will be replaced under advisement from MDEP and UNR
Not all QAQC errors remedied by the end of field season Two types of errors occurred during the field season and were not corrected effectively This resulted in 7 of the 888 transects inadvertently being walked twice and in different types of first-level QAQC reporting errors from the 2 different data specialists Although they were trained together by UNR their approaches seemed to diverge as they addressed data errors In 2011 the ldquoend-userrdquo (Topoworks) will spend more time training specialists This work will also emphasize steps to take to avoid duplicating effort on any transects
DISCUSSION
Sampling representatively in all monitoring strata Since 2007 transects have been placed systematically in monitoring strata the placement scheme itself had a random origin so that transects were located at random with respect to tortoises The goal of systematic placement is used to provide better coverage of sampled areas yet the random aspect of this design also allows inference about the entire sampled area Because
45
Range-wide Monitoring of the Mojave Desert Tortoise 2010
the same set of potential transect locations will be used to sample from in future years it is meaningful to collect information describing access and completion of each transect so that this information is available when planning to walk this transect location in future years
The current sampling design allows us to 1) estimate the actual area to which our density estimates apply some areas are too rugged for humans to access and therefore 2) apply the density estimate to this sampled area to arrive at an abundance estimate in each monitoring stratum
Training developments Training has received focused attention each year This training improves the performance of individual crews but also helps to standardize the application of protocols among different field teams In 2010 experienced crew personnel worked with new trainees in their own and in different teams to add a new level of cohesiveness between field teams This attention to standardized procedures is maintained during the field season with frequent customized written crew evaluations and we attribute continued high performance in 2010 directly to this focus on standardized training and implementation of protocols No correction for failure to detect visible tortoises on the centerline have been made to density estimates since 2004 (prior to that a 3-pass method was used to ensure all tortoises were detected) Training data in 2010 indicate that crews were detecting all tortoise models on the testing centerline and by the end of training first-year crews were performing as well as experienced crews
Improving ability to detect trends in desert tortoise abundance The primary goal of the monitoring program is to provide population estimates that are relevant to the recovery plan criteria (USFWS 2011) The related priority is therefore to improve ability to detect trends in desert tortoise abundance at the recovery unit level
There were new and enhanced funding sources in 2010 so that all strata had more than the minimum number of transects Associated with the relatively high estimates of tortoise visibility (G0) more tortoises were seen in some recovery units even accounting for the enhanced level of effort Whereas funding opportunities are under agency control the particularly mild spring season also contributed to improved density estimates in most of the range The notable exception was the Eastern MojaveNorthern Colorado where the number of funded transects was still below optimal and the spring weather was cooler than optimal for tortoises to be out and visible most of the time In the remaining 3 monitored recovery units the coefficient of variation for density estimates was between 15 and 20 of the density estimate ndash reflecting an extremely successful field season The Eastern MojaveNorthern Colorado recovery units had density estimates with lower precision (CV=295 and 334 respectively) a reminder that insufficient funding and unseasonable conditions can act separately to thwart our coordinated efforts for range-wide density estimates
46
Range-wide Monitoring of the Mojave Desert Tortoise 2010
LITERATURE CITED
Anderson DR and KP Burnham 1996 A monitoring program for the desert tortoise Report to the Desert Tortoise Management Oversight Group
Anderson DR KP Burnham BC Lubow L Thomas PS Corn PA Medica and RW Marlow 2001 Field trials of line transect methods applied to estimation of desert tortoise abundance Journal of Wildlife Management 65583-597
Averill-Murray RC and A Averill-Murray 2005 Regional-scale estimation of density and habitat use of the desert tortoise (Gopherus agassizii) in Arizona Journal of Herpetology 3965ndash72
Berry KH and LL Nicholson 1984 The distribution and density of desert tortoise populations in California in the 1970rsquos Chapter 2 in KH Berry (ed) The status of the desert tortoise (Gopherus agassizii) in the United States Desert Tortoise Council Report to the US Fish and Wildlife Service Order No 11310-0083-81
Buckland ST DR Anderson KP Burnham JL Laake DL Borchers and L Thomas 2001 Introduction to Distance Sampling Estimating Abundance of Biological Populations Oxford Univ Press Oxford 432 pp
Corn PS 1994 Recent trends of desert tortoise populations in the Mojave Desert Fish and Wildlife Research 1385-93
Luckenbach RA 1982 Ecology and management of the desert tortoise (Gopherus agassizii) in California In RB Bury (ed) North American Tortoises Conservation and Ecology US Fish and Wildlife Service Wildlife Research Report 12 Washington DC
Marques TA L Thomas SG Fancy and ST Buckland 2007 Improving estimates of bird density using multiple-covariate distance sampling The Auk 124(4) 1229-1243
McLuckie AM M Ratchford and RA Fridell 2012 Regional desert tortoise monitoring in the Red Cliffs Desert Reserve 2011 Salt Lake City Utah Division of Wildlife Resources Publication Number 12-13 54 pp
Murphy RW KH Berry T Edwards AE Leviton A Lathrop JD Riedle 2011 The dazed and confused identity of Agassizs land tortoise Gopherus agassizii (Testudines Testudinidae) with the description of a new species and its consequences for conservation ZooKeys 113 33-71 doi 103897zookeys1131353
47
Range-wide Monitoring of the Mojave Desert Tortoise 2010
SPSS Inc 2010 PASW Statistics Rel 1802 Chicago SPSS Inc
Swann DE RC Averill-Murray and CR Schwalbe 2002 Distance sampling for Sonoran desert tortoises Journal of Wildlife Management 66969ndash975
Thomas L ST Buckland EA Rexstad JL Laake S Strindberg SL Hedley JRB Bishop TA Marques and KP Burnham 2010 Distance software design and analysis of distance sampling surveys for estimating population size Journal of Applied Ecology 475-14
Tracy CR RC Averill-Murray WI Boarman D Delehanty JS Heaton ED McCoy DJ Morafka KE Nussear BE Hagerty and PA Medica 2004 Desert Tortoise Recovery Plan Assessment Report to the US Fish and Wildlife Service Reno Nevada
[USFWS] US Fish and Wildlife Service 1994 Desert Tortoise (Mojave Population) Recovery Plan US Fish and Wildlife Service Portland Oregon
[USFWS] US Fish and Wildlife Service 2006 Range-wide Monitoring of the Mojave Population of the Desert Tortoise 2001-2005 Summary Report Report by the Desert Tortoise Recovery Office US Fish and Wildlife Service Reno Nevada
[USFWS] US Fish and Wildlife Service 2009 Range-wide Monitoring of the Mojave Population of the Desert Tortoise 2007 Annual Report Report by the Desert Tortoise Recovery Office US Fish and Wildlife Service Reno Nevada
[USFWS] US Fish and Wildlife Service 2010 Desert Tortoise Monitoring Handbook Desert Tortoise Recovery Office US Fish and Wildlife Service Reno Nevada Version 2 March 2010 httpwwwfwsgovnevadadesert_tortoisereports
[USFWS] US Fish and Wildlife Service 2011 Revised recovery plan for the Mojave Population of the desert tortoise (Gopherus agassizii) US Fish and Wildlife Service Pacific Southwest Region Sacramento California 222 pp
[USFWS] US Fish and Wildlife Service 2012 Range-wide Monitoring of the Mojave Desert Tortoise 2008 and 2009 Reporting Report by the Desert Tortoise Recovery Office US Fish and Wildlife Service Reno Nevada
White GC DR Anderson KP Burnham and DL Otis 1982 Capture-recapture and removal methods for sampling closed populations LA-87-87-NERP Los Alamos National Laboratory Los Alamos NM 235pp
48

Range-wide Monitoring of the Mojave Desert Tortoise 2010
0
02
04
06
08
1
05 06 07 08 09 1
Tea
m d
etec
tio
n o
n t
he
line
g(0
)
Leader Detection (p)
Figure 4 Relationship between single-observer detections (by the leader p) and dual-observer (team) detections g(0)
Estimates of tortoise density Each year the density of tortoises is estimated at the level of the recovery unit The calculation of these densities starts with estimates of the density of tortoises in each stratum from Program DISTANCE as well as their variance estimates
nD
2wLPaG0 g 0 where L is the total length of kilometers walked in each stratum and w is the distance to which observations are truncated so 2wL is the area searched in each stratum This is a known quantity (not estimated) Pa is the proportion of desert tortoises detected within w meters of the transect centerline and was estimated using detection curves in Program DISTANCE The encounter rate (nL) and its variance were estimated in Program DISTANCE for each stratum Calculation of D requires estimation of nL Pa G0 and g(0) This means that the variance of D depends on the variance of these quantities as well
For desert tortoise densities the encounter rate (nL) is estimated independently for each stratum whereas proportion of available tortoises and proportion of available tortoises detected on the transect centerline are estimated jointly for all strata (g(0)) or for all strata in the recovery unit (G0) The detection function which comes into the above equation as Pa may be estimated jointly or separately depending on the number and quality of observations In 2010 separate detection curves were created for GBI and IWS pooled across all strata surveyed by each team Although a single detection curve was also considered for Kiva detections the patterns were very different in the south (mostly Colorado Desert) compared to the north (Mojave Desert) so
22
Range-wide Monitoring of the Mojave Desert Tortoise 2010
separate curves were developed for strata in the two areas (see Results) A schematic of the process leading to density estimates is given in Figure 5 Contributing estimates in the four left-hand columns are listed with the subsets of the data on which they are based These estimates combined from left to right to generate stratum and recovery unit density estimates Because transect records were associated with recovery units under the USFWS (1994) recovery plan those recovery units are used here although the data for 2010 and earlier years will be repackaged to later describe trends in the USFWS (2011) recovery units
Whereas the number of tortoises in the set of strata representing a recovery unit can simply be added together the variance must be arrived at by accounting for whether this involves pooled or independent estimates As described above three of the four estimates that contribute to calculating density in a stratum were based on data ldquopooledrdquo from other strata as well so when data from these strata are combined the correlated nature of the variances has to be accounted for Specifically the method described in Buckland et al (200189) was used to combine density variances correctly and arrive at the variance (and confidence intervals and CV) for the recovery unit Variance estimates cannot currently be combined within Program DISTANCE as required for the analysis described here so final construction of density mean and variance estimates from the above components was completed without specialized software
Tortoise encounter rate
Proportion that are
visible G0
Detection rate Pa
Proportion seen on the line g(0)
Density Density
Stratum or Neighboring
G0 sites
Data collection
group Overall Stratum Recovery unit
FK Ord-Rodman + Superior- Cronese
Kiva north
Full set of tortoise observations
FK
Western Mojave
SC SC
OR OR
JT Joshua Tree
NP + Chuckwalla
Kiva south
JT
PT PT
CK CK Eastern Colorado
AG AG
CM Piute +
Chemehuevi + Ivanpah
IWS
CM Northern Colorado
FE FE
Eastern Mojave IV IV
PI PI
GB Gold Butte +
Halfway Wash to 22 April
GBI
GB
Northeastern Mojave BD Halfway Wash
after 22 April BD
MM MM
CS Coyote Springs CS
Figure 5 Process for developing density estimates in 2010 For each type of estimate the full set of data was subdivided appropriately USFWS (1994) recovery units are used for this analysis
23
Range-wide Monitoring of the Mojave Desert Tortoise 2010
Estimating the area of each stratum sampled and the number of tortoises in that area Before the 2008 field season based on experience in 2007 and visual examination of DEM overlays all assigned transects were classified as possible for completion as 12k 6k or as unwalkable (USFWS 2012) These classifications before the field season are advisory only because exact ground conditions weather and crew condition all affect the ability to complete a transect If a non-standard transect (not 12 km square) is walked crews indicate the obstacles they encountered that forced the change in protocol In addition to the above named factors substrate that is very loose on a steep slope or that includes large boulders can make progress so slow or treacherous that crews modify the transect
Each year some transects are repeated providing new information on ground conditions and new transects are attempted At the end of each field season transects that were completed differently from expected are evaluated At that point a decision is made whether to reclassify the transect The classification is used to advise future transect completion but also to estimate the proportion of each monitoring stratum that is actually represented by the walked transects
Because each transect of any length is built off of the southwestern corner how that transect is completed is one representation of transects built on all possible southwestern corners In order to avoid selection bias by crews there were only 3 classification options for entire transects so that only 0- 6- or 12-km were actually walked but of course all of the distances between these options might actually have been walkable Transects that were not walked represent all transects that could be walked for lengths of 0- to 6-km It is parsimonious to therefore assume that on average 3 km could have been walked for each transect classified as ldquounwalkablerdquo Transects completed using the 6km option represent all of those that could have been completed for distances of 6- to 12-km averaging 9 km so that is the expected value for all of those transects Transects completed as 12 km represent the 100 completion option The total area of the stratum that is unwalkable is estimated as
௧௦௧௦ሻ ାହሺ௨௪ሻ௧௦௧௦ሺଶହൌ ݐݎݎ ݓݑ ௧௦௧௦ ௦௦ௗ ௦ ଶ
If a given stratum covers 5000 km2 but only 90 was walkable and represented by our sampling design then the density estimates applies to 4500 km2 and can be used to generate an estimate for the number of tortoises in those 4500 km2 Using these area estimates adds another source of imprecision so abundance estimates are slightly less precise than the density estimates they derive from The additional error of this estimate is calculated as the error for a binomial proportion
24
Range-wide Monitoring of the Mojave Desert Tortoise 2010
Modification of previous procedures In 2010 two new procedures for walking transects affect how we use transect completion information to estimate the proportion of each stratum that is walkable First in acknowledgment that public lands outside tortoise conservation areas increasingly used for activities that are not compatible with tortoise conservation transects are now reflected inward from the [usually] invisible stratum boundaries This new procedure has also caused the reclassification of some transects to walkable where stratum boundaries exclude mountain ranges for instance Next crews completed all transects except those walked by GBI in Nevada using the 12 km square path completing as much of that path as possible The calculation of unwalkable area in these strata now based on the proportion of unwalkable kilometers not unwalkable transects
Debriefing to describe strengths and weaknesses of project preparation and execution At the end of each field season a debriefing meeting was held to review tasks and responsibilities strengths and weaknesses of the program and to plan for the next field season Because the field teams had disbanded by then field crew members were surveyed prior to the end of the field season to nonetheless gather their direct input as we identified training and logistical issues to target for improvement before the next field season Although issues andor tasks may be ascribed to individual entities this meeting is most beneficial in identifying where centralized andor coordinated response is required to improve the quality of the program
RESULTS
Field observer training The smaller Kiva and IWS groups trained alongside one another and mostly separate from GBI although experienced crews worked between all three teams Training started on 11 March and continued through 6 April in 2 staggered sessions (Table 1) Final tests of field detection abilities occurred toward the end of this period
Proportion of tortoises detected at distances from the transect centerline Table 2 reports the proportion of models that were available and were detected by each team at 1- 2- and 5-meters from the transect centerline Teams were tested after a trial run on the detection lines (GBI and IWS crews) or after walking practice transects for returning crews that wanted to refresh the search pattern (Kiva) Detection on the centerline should be 100 and many crews achieved this First-year trainees detected a similar proportion of models at 1- and 2-m compared to experienced crews with first-year trainees detecting fewer models at 5 m
Table 3 reports further statistics for each team after collecting data on 16 km on the evaluation lines Column 4 reports the average absolute difference between the expected and measured perpendicular distances from the model to the walked line All measurements for all models during the 2-day trial are used for this estimate and capture inaccuracies from 1) using a compass and measuring tape to record distances to the models plus 2) inaccurately following the
25
Range-wide Monitoring of the Mojave Desert Tortoise 2010
trajectory of the transect The latter source of error does not occur on monitoring transects because the walked transect is the true transect In contrast on training lines error in measurements is increased if crews do not walk on exactly the measured line that was used to place the models On average the measured distance of models to the centerline was 21 cm closer than the actual distance with increasing bias for models farther from the line The ldquoAvailable Models Detected by Leaderrdquo column reports the proportion of all models that were found first by the leader During training this number is easily calculated and is used to identify crews in which one of the observers is not finding at least 80 of all detected With an 80 detection rate for the leader a 96 detection rate is expected for the team
Table 2 Proportion of tortoise models detected within 1- 2- or 5-m of the transect centerline Values that scored below the target of 090 at 1- or 2-m are highlighted
Proportion of existing models within a given distance detected by the team
Team 1m 2m 5m
1 093 096 087 2 100 096 091 3 092 096 094 4 100 088 087 5 100 093 095 6 100 092 088 7 085 090 086 8 100 100 090 21 100 089 093 22 093 089 088 23 100 100 097 24 085 089 088 26 100 100 097 27 088 093 094 28 100 100 094 51 100 096 095 52 100 100 094 53 100 096 093 54 100 100 090 55 093 096 093 56 100 093 090 57 093 096 096 58 100 100 094 59 100 096 091 60 100 096 092 61 100 096 088 62 100 100 094
GBI 099 097 093 Kiva 096 094 090 IWS 095 094 093
Overall 097 095 092
26
Range-wide Monitoring of the Mojave Desert Tortoise 2010
Table 3 Diagnostics for individual teams after training
Team
Available models detected Measured v exact model distance (m) Estimated
abundance
95 confidence interval
Within 2m of centerline by
leader
Within 2m of centerline by
team Lower limit Upper limit
1 085 096 079 396 3023 5193
2 081 096 079 377 3268 4346
3 089 096 096 409 3437 4855
5 081 088 077 443 3596 5460
6 086 093 084 397 3451 4574
7 088 092 073 375 3197 4397
8 087 090 078 378 3415 4173
21 093 100 079 682 5243 8881
22 085 089 076 356 3184 3989
23 085 089 114 433 3941 4746
24 096 100 089 408 3269 5096
26 089 089 079 366 3241 4122
27 100 100 082 427 3135 5823
28 086 093 074 402 2960 5472
51 100 100 087 390 3253 4675
52 086 096 080 370 3308 4138
53 100 100 087 403 3652 4438
54 085 096 075 441 3697 5260
55 092 100 055 345 2946 4031
56 088 096 101 475 3881 5805
57 089 093 080 384 2868 5133
58 081 096 081 451 3772 5397
59 086 100 063 464 3801 5663
60 086 096 102 477 3558 6395
61 089 096 080 343 2978 3941
62 096 096 113 461 3841 5538
Target gt080 gt090 lt1 410
GBI 091 097 083 4152
IWS 097 094 086 3974
Kiva 092 094 081 4321
Overall 093 095 083 4156
During training personnel on 2 teams were switched after unsuccessful practice runs The resulting 2 teams are included in Tables 2 and 3 Although some individual metrics were below-par (gray cells in the above tables) the teams were all judged to perform well overall and no further changes were made During training various detection curves were fit to each crewrsquos set of tortoise model observations In no case did a negative exponential model best describe the
27
Range-wide Monitoring of the Mojave Desert Tortoise 2010
data Because this model does not involve fitting a ldquoshoulderrdquo to the data near the centerline these detection curves would have been unacceptable The best-fitting of the 3 remaining basic types of models were then fit to the data to generate the density estimates in Table 3 In Figs 6-8 each crewrsquos data were fit to uniform or half-normal models for illustration purposes Crews were not evaluated on their ability to a particular curve shape however we did provide guidance to individual crews to better match the search patterns of their teammates This was taken as an opportunity to focus field personnel on an additional level of conformity Distance sampling and development of a single detection curve from many observers is robust to the effects of pooling across observations from crews with variable search patterns as long as all of the observers contribute proportionally to the overall pattern (Marques et al 2007)
Within the GBI crews teams 51 and 52 had the most anomalous curves (broadest shoulders) in Figure 6 These teams were coached on tightening their search pattern to better match other teams however neither team had other diagnostic issues Although the IWS trainee curves as a group had broader shoulders than the GBI curves they were similar to one another and no problems are evident The Kiva detection curves were more disparate between themselves Three of these teams (1 3 and 8) left training a few days earlier than the others They had passed all of the training metrics and left to match the earlier opening of CMAGR Although the other teams received feedback and worked to match one anotherrsquos detection curves in the final trials the first three teams (the ones with the narrowest shoulders that most rapidly lose detections with increasing distance from the line) did not
00
02
04
06
08
10
0 2 4 6 8 10 12 14
DE
TE
CT
ION
PR
OB
AB
ILIT
Y
PERPENDICULAR DISTANCE (m)
Figure 6 Detection curves for each of the 2010 GBI teams during training Curves are based on 16 km trials with approximately 100 detections Anomalous patterns described in text are indicated with dotted lines
28
Range-wide Monitoring of the Mojave Desert Tortoise 2010
00
02
04
06
08
10
0 2 4 6 8 10 12 14
DE
TE
CT
ION
PR
OB
AB
ILIT
Y
PERPENDICULAR DISTANCE (m)
Figure 7 Detection curves for each of the 2010 IWS trainee teams Curves are based on 16 km trials with approximately 100 detections
00
02
04
06
08
10
0 2 4 6 8 10 12 14
DE
TE
CT
ION
PR
OB
AB
ILIT
Y
PERPENDICULAR DISTANCE (m)
Figure 8 Detection curves for each of the 2010 Kiva trainee teams Curves are based on 16 km trials with approximately 100 detections Anomalous patterns described in text are indicated with dotted lines
29
Range-wide Monitoring of the Mojave Desert Tortoise 2010
Quality assurance and quality control There were 23710 transect records and 5762 G0 records associated with the monitoring effort in 2010 After data specialists with the field teams had finished verifying and validating the data there were still 706 cases where data were inconsistent with constraints and expectations (Many more issues are addressed by data specialists for field crews before the field data are submitted) Of these 681 were errors created by the field crews (sometimes faulty equipment other times data entry error) Two hundred fifty of these could be corrected based on information collected on paper datasheets while fields that should have been populated by faulty equipment could not be addressed Another 22 errors were ldquoprocessingrdquo errors Processing steps are associated with correcting other errors (perhaps a word is misspelled) or with adding new fields or any other manipulation that occurs after the data have been collected This year the bulk of the processing errors involved additional decimals in the elevation field
Transect completion Table 4 reports the number of assigned and completed transects in each stratum Kiva was assigned 328 transects and walked this number but were not always able to replace assigned unwalked transects with alternates in the same strata As a result too few transects were completed in Chuckwalla Joshua Tree and Pinto Mountain strata and all 7 of these transects were later completed in northern strata All assigned transects were completed or replaced by IWS One transect was inadvertently walked twice (counted once) and at the end of the field season one crew was able to complete an additional transect that was not a replacement for any assigned one GBI completed more transects then the other 2 teams and also had more errors Eight transects were walked on two separate occasions (duplicates are counted as one transect in Table 4) Three of the duplicated transects were purposely repeated when the first attempt was not completed to protocol or when illness interrupted the first attempt For a variety of reasons including logistical ones 8 assigned transects were neither completed nor replaced by alternates in their strata and 2 additional transects were completed in strata that did not need replacements
Great Basin Institute began to address the issue of route-less areas that have not been accessible in any past years Base-camping into these areas allowed crews to be provisioned with supplies including water This resulted in completion of 24 transects where crews would otherwise have had to hike 5 km or more one way to access transects Any field personnel provisioning these base camps for other crews are not themselves walking transects
Table 4 indicates the number of assigned transects that could be completed as standard square 12km transects (column 4) as well as the number that were completed by reflecting around obstacles These transects are all considered to represent flatter topography in the monitoring stratum An additional number (column 5) were completed as 6 km squares (GBI) or shortened as little as possible (IWS and Kiva) and represent more rugged terrain Finally some transects were considered unwalkable (column 6)
30
Range-wide Monitoring of the Mojave Desert Tortoise 2010
The last 2 columns of Table 4 represent situations that were not anticipated Crews were to shorten or abandon transects if the terrain presented too much of an obstacle but reflecting around terrain was not a planned option However on some relatively rare occasions (column 7) crews had partially walked a transect before determining that it could not be completed following the correct protocol In these situations they would not have sufficient time to move to an alternate transect on the same day so they instead reflected around terrain to collect data for the lower topography portion of the current transect
Column 8 reports transects that appear walkable based on remote imagery but were not completed All of these were reevaluated and some were reclassified based on this [additional] year of field information (see Evaluating transect classification below) Note that transects on military installations (CMAGR Ft Irwin China Lake and Edwards AFB) are regularly but unpredictably inaccessible due to military activities This corresponds to the 7 transects listed here for CMAGR (AG) 2 on Superior-Cronese and 1 on Fremont-Kramer Figures 9 through 12 show locations of transects and observations of live tortoises
Table 4 Number and type of transects in each stratum Stratum abbreviations as in Fig 1
Assigned
Assigned and alternate transects
Assigned completed
Assigned completed
Assigned judged
unwalkable
Assigned completed by reflecting to
Assigned judged
walkable but Stratum transects completed 12k shortened avoid terrain not walked
AG 33 33 22 3 8 7 BD 68 66 38 22 6 1 CK 64 61 34 21 6 3 CM 40 40 30 2 8 1 2 CS 100 99 58 21 20 9 FE 20 20 18 2 0 FK 50 50 41 7 2 2 GB 130 128 59 46 23 4 7 IV 30 31 23 3 4 1 JT 27 25 11 11 3 1
MM 132 132 65 52 13 7 OR 25 25 14 7 4 1 PI 44 44 30 8 6 3 2 PT 20 21 8 6 4 SC 109 113 91 12 6 3
Total 892 888 542 223 113 8 46
GBI 430 425 220 141 62 4 24 IWS 134 135 101 15 18 4 5 Kiva 328 328 221 67 33 0 17
Assigned transects that were not walked were supposed to be replaced by alternates
31
Range-wide Monitoring of the Mojave Desert Tortoise 2010
Figure 9 Distribution of distance sampling transects and live tortoise observations in the Northeastern Mojave Recovery Unit (Coyote Springs Valley Mormon Mesa Beaver Dam Slope and Gold Butte-Pakoon monitoring strata)
32
Range-wide Monitoring of the Mojave Desert Tortoise 2010
Figure 10 Distribution of distance sampling transects and live tortoise observations in the Eastern Mojave Recovery Unit (Piute-Eldorado Ivanpah and Fenner monitoring strata) and the Northern Colorado Recovery Unit (Chemehuevi monitoring stratum)
33
Range-wide Monitoring of the Mojave Desert Tortoise 2010
Figure 11 Distribution of distance sampling transects and live tortoise observations in the northern portion of the Western Mojave Recovery Unit (Fremont-Kramer Superior-Cronese and Ord-Rodman monitoring strata)
34
Range-wide Monitoring of the Mojave Desert Tortoise 2010
Figure 12 Distribution of distance sampling transects and live tortoise observations in the southern portion of the Western Mojave Recovery Unit (Pinto Mountains and Joshua Tree monitoring strata) and the Eastern Colorado Recovery Unit (Chuckwalla and Chocolate Mountain monitoring strata)
35
Range-wide Monitoring of the Mojave Desert Tortoise 2010
Tortoise encounter rates and detection functions In 2010 all pairs worked together from the beginning to the end of the season Each Kiva crew walked a median of 41 transects and overall they detected 196 tortoises over 180 mm MCL GBI crews walked a median of 35 transects and detected 179 tortoises and IWS crews had considerably lower effort with a median of 23 transects (days of work) However each IWS observer subsequently walked 1-person distance transects in a separate study at the Large Scale Translocation Site near Jean Nevada altogether IWS personnel completed 40 days of work and the team observed 122 tortoises and the LSTS encounters were used to model the overall IWS detection probability illustrated in Fig 14 There were sufficient observations to generate separate detection curves for each team so I planned a minimum of 3 detection curves
Figures 13 to 16 are histograms of the observed number of tortoises seen at increasing distance from the transect centerline There is one histogram each for IWS and GBI plus separate histograms for Kiva detections in the northern and southern areas that they surveyed These observations were used to model detection curves overlaid in the same figures Based on detection function behavior it is typical to discard a few observations in the tails of the histograms in order to build a more robust model (Buckland et al 2001) Each figure indicates the customized truncation distance that was applied Any observations that are not used to estimate detection functions will also not be used to estimate the encounter rate (tortoises detected per kilometer walked) Tortoise encounter rates are low enough that this becomes a factor in considering how to truncate observations to develop detection functions Truncation was conservative in order to maximize the number of observations per stratum
For GBI the best half-normal and uniform models were within ΔAIC=147 of the better-fitting hazard rate model with much better precision for the half-normal model but no meaningful difference in density estimate between the half-normal and hazard rate models On the basis of precision I used the half-normal model with second-order cosine adjustment to fit the detection function The second-order adjustment is seen in the extra inflections in the tail of the curve (Fig 13) This additional data fitting was called for unless observations were truncated at 8 m with an unacceptable loss of 38 additional observations For IWS data were truncated at 14 m and fit best to a uniform model with a single cosine adjustment I evaluated separate curves for northern and southern detections by Kiva because there were sufficient detections for two curves and because these transects represent a long north-south gradient The AIC for the single model was greater than the sum of AICs for the separate models with the same truncation distance (same data) so separate models better fit the data In the north (Fremont-Kramer Ord-Rodman and Superior-Cronese) the data were truncated at 12 m and fitted best to a uniform model with cosine adjustment In the south data were truncated at 8 m and fit to a half-normal model
36
Range-wide Monitoring of the Mojave Desert Tortoise 2010
Figure 13 Observed detections (histogram) and the resulting detection function (smooth curve) for live tortoises with MCL ge 180mm found by GBI This curve uses only the 164 tortoise seen within 16 m of the centerline
Figure 14 Observed detections (histogram) and the resulting detection function (smooth curve) for live tortoises with MCL ge 180mm found by IWS This curve uses only the 111 tortoises seen within 14 m of the centerline
00
02
04
06
08
10
12
0 2 4 6 8 10 12 14 16
Det
ectio
n P
roba
bilit
y
Perpendicular distance (m)
00
02
04
06
08
10
12
0 1 2 3 4 5 6 7 8 9 10 11 12 13 14
Det
ectio
n P
roba
bilit
y
Perpendicular (m)
37
Range-wide Monitoring of the Mojave Desert Tortoise 2010
Figure 15 Observed detections (histogram) and the resulting detection function (smooth curve) for live tortoises with MCL ge 180mm found by Kiva in Fremont-Kramer Superior-Cronese and Ord-Rodman This curve uses only the 92 tortoises seen within 12 m of the centerline
Figure 16 Observed detections (histogram) and fitted detection function (smooth curve) for live tortoises with MCL ge 180mm found by Kiva in Joshua Tree Pinto Mountains Chuckwalla and on CMAGR This curve uses only the 85 tortoises seen within 8 m of the centerline
00
02
04
06
08
10
12
0 1 2 3 4 5 6 7 8 9 10 11 12
Det
ectio
n P
roba
bilit
y
Perpendicular distance (m)
00
02
04
06
08
10
12
0 1 2 3 4 5 6 7 8
Det
ectio
n P
roba
bilit
y
Perpendicular distance (m)
38
Range-wide Monitoring of the Mojave Desert Tortoise 2010
The area below each of the curves in Figs 13ndash16 is the proportion of tortoises that were detected Pa estimated as far as the truncation distance (the farthest distance on the x-axis in each figure) Based on these curves GBI detected 412 of the visible tortoises within 16 m of the centerline (CV=0085) The corresponding estimate of Pa for strata surveyed by IWS was 586 (CV=0060) within 14 m for Kiva in the north was 583 (CV=0070) within 12 m and for Kiva in the south it was 671 (CV=0100) within 8 m
Proportion of tortoises available for detection by line distance sampling G0
In general telemetry sites and associated transects were completed sequentially from south to north This pattern corresponds to the expected timing of tortoise activity peaking first in the south Tortoise availability was estimated separately transects in each of these areas Dates total days monitored and G0 estimates are given in Table 5
Table 5 Availability of tortoises (G0) during the period in 2010 when transects were walked in each group of neighboring strata
G0 sites
Gold-Butte Halfway Wash
Strata
Gold Butte
Dates
7 Apr ndash 22 Apr
Days
16
G0
(Std Error)
077 (0177)
Halfway Wash Beaver Dam Slope Mormon Mesa
23 Apr ndash 15 May 23 080 (0115)
Coyote Springs Valley
Piute Ivanpah Chemehuevi
Joshua Tree Chuckwalla
Coyote Springs
Piute-Eldorado Chemehuevi Fenner Ivanpah
Chocolate Mtns Chuckwalla Joshua Tree Pinto Mtns
16 May ndash 28 May
31 Mar ndash 29 Apr
23 Mar ndash 10 Apr
13
30
19
086 (0130)
082 (0179)
089 (0122)
Ord-Rodman Superior-Cronese
Fremont-Kramer Ord-Rodman Superior-Cronese
13 Apr ndash 6 May 24 096 (0066)
Proportion of available tortoises detected on the transect centerline g(0) Because they are cryptic even tortoises that are visible (not covered by dense vegetation or out of sight in a burrow) may not be detected For 50 detections of tortoises within 1 m of the transect centerline 44 were found by the observer in the lead position and 6 by the follower so that the probability of detection by single observer p = 0864 and the proportion detected using the dual observer method g(0 to 1 m) = 0981 (SE = 006) Figure 17 shows that g(0) was converging on 10 indicating the assumption of perfect detection on the centerline was met consequently no adjustment was made to the final density estimate The curves since 2004 all
39
Range-wide Monitoring of the Mojave Desert Tortoise 2010
support the premise that complete detection on the transect line was achieved for years in which the dual-observer method was used (USFWS 2009 2012)
000
020
040
060
080
100
0 2 4 6 8 10 12
Pro
port
ion
dete
cted
Distance x from transect centerline (m)
p
g(0)
Figure 17 Detection pattern for the leader (p) and by the team (g(0)) based on all observations out to a given distance (x) from the centerline in 2010 Note convergence of g(0) on 10 at the transect centerline as x goes to 0
Estimates of tortoise density Density estimates were generated separately for each monitoring stratum (Table 6) then weighted by stratum area to arrive at average density in the monitored area of each recovery unit (Table 7) Although encounter rates were estimated separately for each stratum and have independent variances the detection function and G0 were estimated jointly pooling data from multiple strata so these variances are not independent (Fig 5 illustrates how estimates were pooled for 2010)
When the annual estimates are imprecise it should not be expected that there will be a close match from one year to the next Over a period of many years however any underlying trend in the number of tortoises should be obvious through this ldquobackground noiserdquo The CVs in 2010 represent an overall improvement in precision from previous years a function of improved funding in this one year
40
Range-wide Monitoring of the Mojave Desert Tortoise 2010
Table 6 Recovery unit and stratum-level encounters and densities in 2010 for tortoises with MCL ge 180mm
Sampling Dates nRecovery Area Number of Total transect Field Density
Stratum (tortoises CV(n) CV(Density) Unit (km2) Transects length (km) Begin End Observers (km2)observed)
Northeastern Mojave 4889 425 4265 7-Apr 28-May 164 32 158
Beaver Dam Slope BD 828 66 662 23-Apr 15-May GBI 23 22 8 33 282
Coyote Springs Valley CS 1117 99 1046 16-May 28-May GBI 43 167 36 240
Gold Butte-Pakoon GB 1977 128 1258 7-Apr 22-Apr GBI 22 250 17 351
Mormon Mesa MM 968 132 1298 24-Apr 16-May GBI 76 123 55 207
Eastern Mojave 6763 95 1096 31-Mar 29-Apr 46 33 296
Fenner FE 1862 20 246 31-Mar 27-Apr IWS 23 283 69 361
Ivanpah IV 2567 31 365 1-Apr 29-Apr IWS 5 416 10 473
Piute-Eldorado PI 2334 44 485 31-Mar 29-Apr IWS 18 246 27 333
Northern Colorado 4038 40 458 31-Mar 30-Apr 26 247 42 334
Chemehuevi CM 4038 40 458 31-Mar 30-Apr IWS 26 247 42 334
Western Mojave 9336 234 2591 23-Mar 6-May 105 31 148
Fremont-Kramer FK 2462 50 574 15-Apr 6-May Kiva 19 225 25 245
Joshua Tree JT 1567 25 227 25-Mar 13-Apr Kiva 6 539 28 565
Ord-Rodman OR 1124 25 270 17-Apr 4-May Kiva 27 228 75 248
Pinto Mountains PT 751 21 213 25-Mar 10-Apr Kiva 7 514 34 542
Superior-Cronese SC 3447 113 1307 13-Apr 6-May Kiva 46 159 26 187
Eastern Colorado 4263 94 991 23-Mar 10-Apr 72 57 189
Chocolate Mountain AG 755 33 378 25-Mar 5-Apr Kiva 50 192 138 256
Chuckwalla CK 3509 61 613 23-Mar 10-Apr Kiva 22 253 37 304
41
Range-wide Monitoring of the Mojave Desert Tortoise 2010
Table 7 Estimated density of desert tortoises in monitored areas of each recovery unit in the Mojave and Colorado deserts in 2010
Lower limit Upper limit Area Kilometers Tortoises Density 95 CI 95 CI CV
Recovery Unit (km2) walked detected (km2) (Density) (Density) (Density)
Northeastern Mojave 4889 4265 164 32 236 438 158 Eastern Mojave 6763 1096 46 33 186 579 296 Northern Colorado 4038 458 26 42 222 795 334 Western Mojave 9236 2591 105 31 236 420 148 Eastern Colorado 4263 991 72 57 397 828 189
Area of each stratum sampled and the number of tortoises in that area
Evaluating transect classification In 2010 196 of the 888 walked transects were not completed as predicted The following table summarizes conclusions after examining these transects
Table 8 Transects completed other than as planned and any resulting reclassification
Previous New Number of Situation
substratum substratum transects 12k On-the-ground observation differs from imagery 6k 21
Shortened in 2010 but previous experience or correct 12k 12k 52
modification would allow completion 6k On-the-ground observation differs from imagery 12k 31
Unwalkable On-the-ground observation differs from imagery 12k 16 New rules to reflect into stratum moved transect out of too-
Unwalkable 12k 12rugged terrain
Unwalkable On-the-ground observation differs from imagery 6k 19 Lengthened in 2010 but other crews might be unable to walk
6k 6k 18as a 12k Crew completed the transect using incorrect protocols or
Unwalkable Unwalkable 11attempted new rules but couldnrsquot walk at least 6km New shortening rules allowed at least 6km completed but
Unwalkable Shortened 16earlier rules would have classified these as unwalkable
Twenty-eight transects that would have been unwalkable under the previous protocols were attempted and completed this year using new rules to reflect into stratum boundaries (range-wide) and to shorten transects by walking only the safely walkable portions of the 12 km route (Kiva and IWS field teams only) In the first case 12 transects were completed because they were correctly reflected into strata under new rules These otherwise unwalkable transects were completed because stratum boundaries were often drawn to exclude more rugged topography Sixteen previously unwalkable transects were walked for at least 6 km using new rules to shorten transects without completing the SW quadrant These would still be ldquounwalkablerdquo under the original classification system
42
Range-wide Monitoring of the Mojave Desert Tortoise 2010
After the field season 168 anomalous transects were reviewed Of these 87 were reclassified based on crew experience In some cases the crews encountered substrate or other features that were not apparent from imagery in many others the original classification based on imagery was ambiguous because over the course of a 12 km transect terrain is so variable to that it was not a simple matter to evaluate the time required for a typical crew to complete it The remaining 81 anomalous transects were not reclassified either because the classification still seems ambiguous or because the crewrsquos modification was based on access illness or considerations unrelated to terrain
Proportion of each stratum walked The proportion of each stratum walked in 2010 could be calculated based on the proportion of transects shortened andor replaced (GBI) or based on the proportion of kilometers walked based on the expectation that 12 km should be walked for each transect assigned (Kiva and IWS) In 2008 and 2009 only the previous method was used and all transects assigned in 2010 had already been classified as 12k 6k or unwalkable To test the comparability of estimating the unsampled part of each stratum I calculated the number of kilometers expected to be walked based on the 12k6kunwalkable classification of each assigned transect then compared this to the proportion of kilometers estimate (Table 9)
Table 9 Proportion of each stratum that can be sampled Stratum abbreviations as in Fig 1
Proportion assigned transects expected to be walked ashellip Km walked
Assigned Stratum transects 12k 6k Replaced Expected Observed Chi-sq
AG 33 848 121 3 375 2886 198 BD 66 606 303 91 600 5905 01 CK 61 639 18 18 600 5652 20 CM 40 775 75 15 417 3772 38 CS 99 606 273 121 882 8243 38 FE 20 100 0 0 240 2335 02 FK 50 94 6 0 591 5496 29 GB 128 484 352 164 1014 9902 05 IV 30 867 0 133 324 3051 11 JT 25 56 24 20 237 1976 66
MM 130 531 392 77 1134 10915 16 OR 25 68 20 12 258 2329 24 PI 44 705 182 114 459 4175 38 PT 18 50 111 389 147 1406 03 SC 109 89 64 46 1242 12029 12
Total 878 8520 8007 501 GBI 423 3630 3496 61 IWS 134 1440 1333 89 Kiva 321 3449 3177 352
43
Range-wide Monitoring of the Mojave Desert Tortoise 2010
Chi-squared values in the final column indicate a poor fit between predictions and completion at CMAGR which is not surprising given constraints on access to different parts of the range each year (crews frequently cannot get access to otherwise walkable transects so these transects are replaced) With the exception of CMAGR the strata individually and for each group combined indicate that the completed kilometers were accurately predicted regardless of method used to estimate unwalkable terrain
This means we can use the observed kilometers walked to estimate the area over which our density estimates apply For strata walked by GBI we can use the proportion of transects classified as 12k6kunwalkable instead Because this project uses the same base set of transects each year the majority of transects have been walked in multiple years Table 9 demonstrates that the 2 methods of estimating the proportion of area sampled are equivalent so we can develop a more representative estimate of the walkable area of these strata if we use empirical data from all transects walked between 2008 and 2011 (the latest set of compiled data) Since 2008 2464 separate transects have been evaluated in these strata this is a much larger (representative) sample than the 878 evaluated only in 2010 Table 10 gives the area of each stratum the proportion covered by our density estimates and converts the density in each stratum into an estimate of tortoise abundance
Table 10 Estimated tortoise abundance in sampled areas of each stratum The ldquoproportion sampledrdquo column is based on evaluation of all transects in the sample set from 2008 through 2011 Stratum abbreviations as in Fig 1
Area Proportion SE(Prop Sampled N (number 95 Confidence Interval Stratum (km2) sampled Sampled) area (km2) of tortoises) Lower Limit Upper Limit
AG 755 095 0024 715 9863 60058 161977 BD 828 089 0032 738 2422 14013 41853 CK 3509 082 0030 2890 10804 60077 194313 CM 4038 093 0023 3755 15788 83362 299009 CS 1117 086 0031 958 3471 21707 55514 FE 1862 096 0020 1790 12419 62465 246911 FK 2462 096 0017 2372 5869 36520 94318 GB 1977 081 0027 1604 2782 14224 54410 IV 2567 095 0021 2442 2476 10247 59806 JT 1567 074 0033 1159 3197 11360 89963
MM 968 086 0034 836 4624 30712 69628 OR 1124 073 0040 821 6119 37498 99865 PI 2334 082 0024 1911 5249 27733 99354 PT 751 069 0051 522 1785 6553 48634 SC 3332 095 0015 3149 8276 57509 119102
Total 29190 0879 24656 95145 770367 1175107
44
Range-wide Monitoring of the Mojave Desert Tortoise 2010
Debriefing to identify strengths and weaknesses in preparation for future years This meeting was held on 8 June about 1 week after all field work was completed The following issues were identified for coordinated effort rather than by efforts of single parties
Need for more central responsibility for planning data It was decided that starting in 2011 MDEP will host server-based [GIS] information for use by mapmakers Through 2010 MDEP has provided Mojave-wide data layers to individual field teams and assigned transects were identified by the UTM coordinates of their southwestern corners Because there was little central oversight over how these data were acquired and used different field teams had variable map quality and occasionally shifted transects when processing the corner coordinates into full square transects This processing including any planned shortening andor reflections should be repeatable each time the same transect is assigned so centralized responsibility for this would be a better option
Training improvements to make more effective use of same time period In 2010 there were more trainees from more teams in the same areas for training at the same time Use of the Desert Tortoise Conservation Center would be improved by setting up more stations (with more instructors) for smaller groups of trainees Also although objectives have been articulated for instructed material this is not the case for the many days available for designated field practice On those days additional oversight and specific objectives that can be evaluated would improve effectiveness and provide additional feedback to crews
Current hardware is less trustworthy and cannot utilize improved software Since 2007 responsibility for providing the same data collection systems to all field teams has been centralized with the USFWS Those units (data collection systems including connected GPS) are now outdated and will be replaced under advisement from MDEP and UNR
Not all QAQC errors remedied by the end of field season Two types of errors occurred during the field season and were not corrected effectively This resulted in 7 of the 888 transects inadvertently being walked twice and in different types of first-level QAQC reporting errors from the 2 different data specialists Although they were trained together by UNR their approaches seemed to diverge as they addressed data errors In 2011 the ldquoend-userrdquo (Topoworks) will spend more time training specialists This work will also emphasize steps to take to avoid duplicating effort on any transects
DISCUSSION
Sampling representatively in all monitoring strata Since 2007 transects have been placed systematically in monitoring strata the placement scheme itself had a random origin so that transects were located at random with respect to tortoises The goal of systematic placement is used to provide better coverage of sampled areas yet the random aspect of this design also allows inference about the entire sampled area Because
45
Range-wide Monitoring of the Mojave Desert Tortoise 2010
the same set of potential transect locations will be used to sample from in future years it is meaningful to collect information describing access and completion of each transect so that this information is available when planning to walk this transect location in future years
The current sampling design allows us to 1) estimate the actual area to which our density estimates apply some areas are too rugged for humans to access and therefore 2) apply the density estimate to this sampled area to arrive at an abundance estimate in each monitoring stratum
Training developments Training has received focused attention each year This training improves the performance of individual crews but also helps to standardize the application of protocols among different field teams In 2010 experienced crew personnel worked with new trainees in their own and in different teams to add a new level of cohesiveness between field teams This attention to standardized procedures is maintained during the field season with frequent customized written crew evaluations and we attribute continued high performance in 2010 directly to this focus on standardized training and implementation of protocols No correction for failure to detect visible tortoises on the centerline have been made to density estimates since 2004 (prior to that a 3-pass method was used to ensure all tortoises were detected) Training data in 2010 indicate that crews were detecting all tortoise models on the testing centerline and by the end of training first-year crews were performing as well as experienced crews
Improving ability to detect trends in desert tortoise abundance The primary goal of the monitoring program is to provide population estimates that are relevant to the recovery plan criteria (USFWS 2011) The related priority is therefore to improve ability to detect trends in desert tortoise abundance at the recovery unit level
There were new and enhanced funding sources in 2010 so that all strata had more than the minimum number of transects Associated with the relatively high estimates of tortoise visibility (G0) more tortoises were seen in some recovery units even accounting for the enhanced level of effort Whereas funding opportunities are under agency control the particularly mild spring season also contributed to improved density estimates in most of the range The notable exception was the Eastern MojaveNorthern Colorado where the number of funded transects was still below optimal and the spring weather was cooler than optimal for tortoises to be out and visible most of the time In the remaining 3 monitored recovery units the coefficient of variation for density estimates was between 15 and 20 of the density estimate ndash reflecting an extremely successful field season The Eastern MojaveNorthern Colorado recovery units had density estimates with lower precision (CV=295 and 334 respectively) a reminder that insufficient funding and unseasonable conditions can act separately to thwart our coordinated efforts for range-wide density estimates
46
Range-wide Monitoring of the Mojave Desert Tortoise 2010
LITERATURE CITED
Anderson DR and KP Burnham 1996 A monitoring program for the desert tortoise Report to the Desert Tortoise Management Oversight Group
Anderson DR KP Burnham BC Lubow L Thomas PS Corn PA Medica and RW Marlow 2001 Field trials of line transect methods applied to estimation of desert tortoise abundance Journal of Wildlife Management 65583-597
Averill-Murray RC and A Averill-Murray 2005 Regional-scale estimation of density and habitat use of the desert tortoise (Gopherus agassizii) in Arizona Journal of Herpetology 3965ndash72
Berry KH and LL Nicholson 1984 The distribution and density of desert tortoise populations in California in the 1970rsquos Chapter 2 in KH Berry (ed) The status of the desert tortoise (Gopherus agassizii) in the United States Desert Tortoise Council Report to the US Fish and Wildlife Service Order No 11310-0083-81
Buckland ST DR Anderson KP Burnham JL Laake DL Borchers and L Thomas 2001 Introduction to Distance Sampling Estimating Abundance of Biological Populations Oxford Univ Press Oxford 432 pp
Corn PS 1994 Recent trends of desert tortoise populations in the Mojave Desert Fish and Wildlife Research 1385-93
Luckenbach RA 1982 Ecology and management of the desert tortoise (Gopherus agassizii) in California In RB Bury (ed) North American Tortoises Conservation and Ecology US Fish and Wildlife Service Wildlife Research Report 12 Washington DC
Marques TA L Thomas SG Fancy and ST Buckland 2007 Improving estimates of bird density using multiple-covariate distance sampling The Auk 124(4) 1229-1243
McLuckie AM M Ratchford and RA Fridell 2012 Regional desert tortoise monitoring in the Red Cliffs Desert Reserve 2011 Salt Lake City Utah Division of Wildlife Resources Publication Number 12-13 54 pp
Murphy RW KH Berry T Edwards AE Leviton A Lathrop JD Riedle 2011 The dazed and confused identity of Agassizs land tortoise Gopherus agassizii (Testudines Testudinidae) with the description of a new species and its consequences for conservation ZooKeys 113 33-71 doi 103897zookeys1131353
47
Range-wide Monitoring of the Mojave Desert Tortoise 2010
SPSS Inc 2010 PASW Statistics Rel 1802 Chicago SPSS Inc
Swann DE RC Averill-Murray and CR Schwalbe 2002 Distance sampling for Sonoran desert tortoises Journal of Wildlife Management 66969ndash975
Thomas L ST Buckland EA Rexstad JL Laake S Strindberg SL Hedley JRB Bishop TA Marques and KP Burnham 2010 Distance software design and analysis of distance sampling surveys for estimating population size Journal of Applied Ecology 475-14
Tracy CR RC Averill-Murray WI Boarman D Delehanty JS Heaton ED McCoy DJ Morafka KE Nussear BE Hagerty and PA Medica 2004 Desert Tortoise Recovery Plan Assessment Report to the US Fish and Wildlife Service Reno Nevada
[USFWS] US Fish and Wildlife Service 1994 Desert Tortoise (Mojave Population) Recovery Plan US Fish and Wildlife Service Portland Oregon
[USFWS] US Fish and Wildlife Service 2006 Range-wide Monitoring of the Mojave Population of the Desert Tortoise 2001-2005 Summary Report Report by the Desert Tortoise Recovery Office US Fish and Wildlife Service Reno Nevada
[USFWS] US Fish and Wildlife Service 2009 Range-wide Monitoring of the Mojave Population of the Desert Tortoise 2007 Annual Report Report by the Desert Tortoise Recovery Office US Fish and Wildlife Service Reno Nevada
[USFWS] US Fish and Wildlife Service 2010 Desert Tortoise Monitoring Handbook Desert Tortoise Recovery Office US Fish and Wildlife Service Reno Nevada Version 2 March 2010 httpwwwfwsgovnevadadesert_tortoisereports
[USFWS] US Fish and Wildlife Service 2011 Revised recovery plan for the Mojave Population of the desert tortoise (Gopherus agassizii) US Fish and Wildlife Service Pacific Southwest Region Sacramento California 222 pp
[USFWS] US Fish and Wildlife Service 2012 Range-wide Monitoring of the Mojave Desert Tortoise 2008 and 2009 Reporting Report by the Desert Tortoise Recovery Office US Fish and Wildlife Service Reno Nevada
White GC DR Anderson KP Burnham and DL Otis 1982 Capture-recapture and removal methods for sampling closed populations LA-87-87-NERP Los Alamos National Laboratory Los Alamos NM 235pp
48