ranking by net income
Post on 11-Jun-2016
217 views
TRANSCRIPT
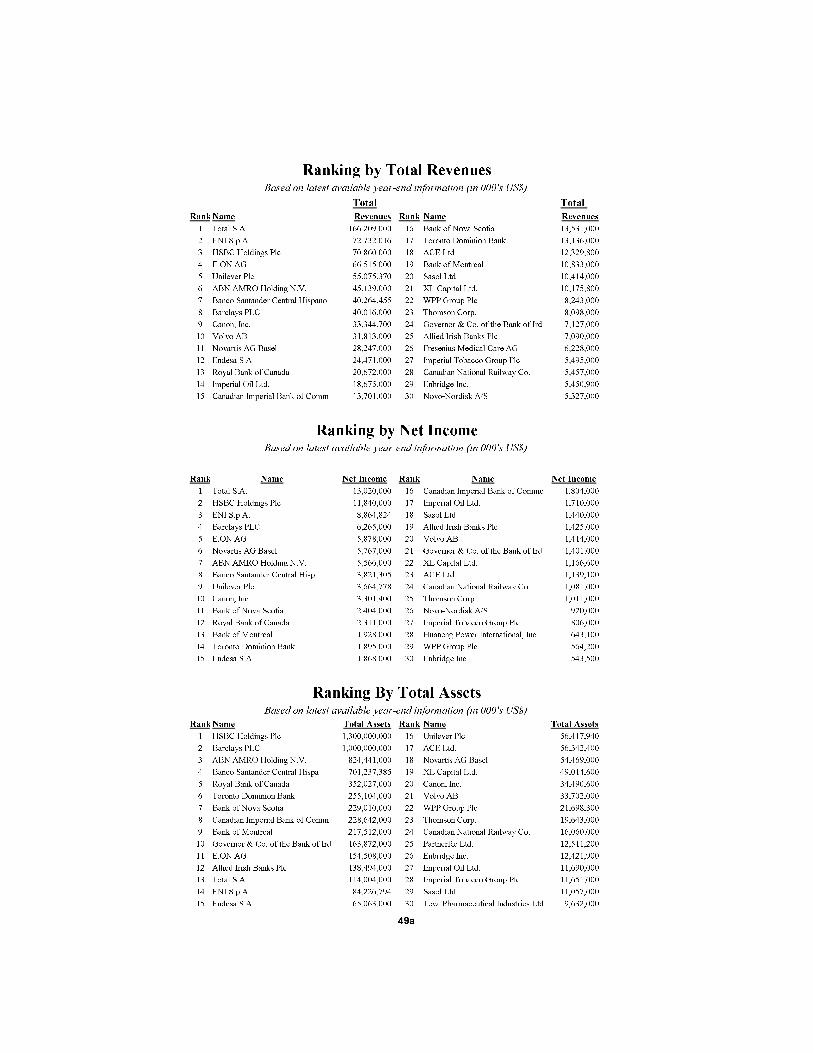
Total Total
Rank Name Revenues Rank Name Revenues
1 Total S.A. 166,209,000 16 Bank of Nova Scotia 13,531,000
2 ENI S.p.A. 72,732,016 17 Toronto Dominion Bank 13,136,000
3 HSBC Holdings Plc 70,860,000 18 ACE Ltd. 12,329,800
4 E.ON AG 66,515,000 19 Bank of Montreal 10,833,000
5 Unilever Plc 55,075,370 20 Sasol Ltd. 10,414,000
6 ABN AMRO Holding N.V. 45,139,000 21 XL Capital Ltd. 10,175,800
7 Banco Santander Central Hispano 40,264,455 22 WPP Group Plc 8,243,000
8 Barclays PLC 40,016,000 23 Thomson Corp. 8,098,000
9 Canon, Inc. 33,344,700 24 Governor & Co. of the Bank of Ird 7,127,000
10 Volvo AB 31,813,000 25 Allied Irish Banks Plc 7,090,000
11 Novartis AG Basel 28,247,000 26 Fresenius Medical Care AG 6,228,000
12 Endesa S.A. 24,471,000 27 Imperial Tobacco Group Plc 5,495,000
13 Royal Bank of Canada 20,672,000 28 Canadian National Railway Co. 5,457,000
14 Imperial Oil Ltd. 18,675,000 29 Enbridge Inc. 5,450,900
15 Canadian Imperial Bank of Comm. 13,701,000 30 Novo-Nordisk A/S 5,327,000
Rank Name Net Income Rank Name Net Income
1 Total S.A. 13,020,000 16 Canadian Imperial Bank of Comme 1,804,000
2 HSBC Holdings Plc 11,840,000 17 Imperial Oil Ltd. 1,710,000
3 ENI S.p.A. 8,864,824 18 Sasol Ltd. 1,440,000
4 Barclays PLC 6,265,000 19 Allied Irish Banks Plc 1,425,000
5 E.ON AG 5,878,000 20 Volvo AB 1,414,000
6 Novartis AG Basel 5,767,000 21 Governor & Co. of the Bank of Ird 1,401,000
7 ABN AMRO Holding N.V. 5,566,000 22 XL Capital Ltd. 1,166,600
8 Banco Santander Central Hisp. 3,821,305 23 ACE Ltd. 1,139,100
9 Unilever Plc 3,664,778 24 Canadian National Railway Co. 1,081,000
10 Canon, Inc. 3,301,400 25 Thomson Corp. 1,011,000
11 Bank of Nova Scotia 2,404,000 26 Novo-Nordisk A/S 920,000
12 Royal Bank of Canada 2,311,000 27 Imperial Tobacco Group Plc 806,000
13 Bank of Montreal 1,928,000 28 Huaneng Power International, Inc 643,100
14 Toronto Dominion Bank 1,895,000 29 WPP Group Plc 564,200
15 Endesa S.A. 1,868,000 30 Enbridge Inc. 543,500
Rank Name Total Assets Rank Name Total Assets
1 HSBC Holdings Plc 1,300,000,000 16 Unilever Plc 56,417,940
2 Barclays PLC 1,000,000,000 17 ACE Ltd. 56,342,400
3 ABN AMRO Holding N.V. 824,441,000 18 Novartis AG Basel 54,469,000
4 Banco Santander Central Hispa. 701,237,385 19 XL Capital Ltd. 49,014,600
5 Royal Bank of Canada 352,027,000 20 Canon, Inc. 34,490,600
6 Toronto Dominion Bank 255,104,000 21 Volvo AB 33,702,000
7 Bank of Nova Scotia 229,010,000 22 WPP Group Plc 21,698,300
8 Canadian Imperial Bank of Comm. 228,642,000 23 Thomson Corp. 19,643,000
9 Bank of Montreal 217,512,000 24 Canadian National Railway Co. 16,060,000
10 Governor & Co. of the Bank of Ird 163,872,000 25 PartnerRe Ltd. 12,511,200
11 E.ON AG 154,508,000 26 Enbridge Inc. 12,421,900
12 Allied Irish Banks Plc 138,494,000 27 Imperial Oil Ltd. 11,690,000
13 Total S.A. 114,004,000 28 Imperial Tobacco Group Plc 11,651,000
14 ENI S.p.A. 84,226,794 29 Sasol Ltd. 11,057,000
15 Endesa S.A. 65,063,000 30 Teva Pharmaceutical Industries Ltd 9,632,000
Based on latest available year-end information (in 000's US$)
Ranking by Total Revenues
Ranking by Net Income
Ranking By Total Assets
Based on latest available year-end information (in 000's US$)
Based on latest available year-end information (in 000's US$)
49a