ranking of u.s. states by millionaires per capita... 845.876.8228 global wealth monitor affluent...
TRANSCRIPT
www.Phoenixmi.com
845.876.8228
Global Wealth Monitor Affluent Market Intelligence
Ranking of U.S. States By Millionaires Per Capita
2006-2013
2 | Copyright © Phoenix Marketing International 2014. All rights reserved.
Introduction
Market Sizing Report
The Phoenix Global Wealth Monitor (GWM) U.S. Sizing Report is intended to provide estimates of the number of affluent
and wealthy households in the country. Sizing estimates are provided at the State level as well as by Core-Based
Statistical Areas (CBSAs). A Core-Based Statistical Area is comprised of Metropolitan and Micropolitan Statistical Areas
which are defined as follows:
• Metropolitan statistical areas have at least one urbanized area of 50,000 or more population, plus adjacent territory
that has a high degree of social and economic integration with the core as measured by commuting ties.
• Micropolitan statistical areas have at least one urban cluster of at least 10,000 but less than 50,000 population, plus
adjacent territory that has a high degree of social and economic integration with the core as measured by commuting
ties.
Currently, there are 942 Metropolitan and Micropolitan statistical areas in the United States.
Methodology
The GWM sizing estimates are developed using a combination of sources including the Survey of Consumer Finance
(SCF), as well as Nielsen-Claritas. The SCF provides the framework and allows us to determine the general distribution of
households by their level of investable assets. Estimates are further refined using the age and income distributions
provided by Claritas. Together, these inputs enable us to estimate the number of households by investable assets at a
national level. Formulas are then created by applying national estimates to closely linked variables developed by the
Census This allows us to obtain estimates at smaller units of geography. Please not that the numbers provided in this
report are approximations, not actual number of households. They can best be used for comparative purposes.

3 | Copyright © Phoenix Marketing International 2014. All rights reserved.
The Phoenix Global Wealth Monitor (GWM) forms the core of our Affluent
Practice at Phoenix Marketing International. GWM is a syndicated
marketing-research platform that continuously tracks the needs, attitudes and
behaviors of affluent and high net worth (HNW) investors in North America
and Europe. Our clients, the world’s leading wealth management firms, rely
on our intelligence to better understand the needs and outlook of the ever-
changing affluent consumer market.
Our trended data comes from online interviews with thousands of investors.
We partner with the very best consumer research panels, and maintain very
strict standards for quality control. We have developed a proprietary data
weighting model to balance our data to the overall household populations in
each country
About The Phoenix Global Wealth Monitor
U.S. CANADA EUROPE ASIA (FUTURE)
• Over 10,000 qualified
interviews per year
• Fields monthly
• Trending since 2003
• About 3,000 interviews
per year
• Fields twice yearly
• Trending since 2007
• France, Germany, Italy,
Spain, Switzerland, UK
• About 5,500 qualified
interviews per year
• China, Hong Kong,
Indonesia, Japan,
Singapore

4 | Copyright © Phoenix Marketing International 2014. All rights reserved.
Ranking of U.S. States
By Millionaires Per Capita
Global Wealth Monitor Affluent Market Intelligence
5 | Copyright © Phoenix Marketing International 2014. All rights reserved.
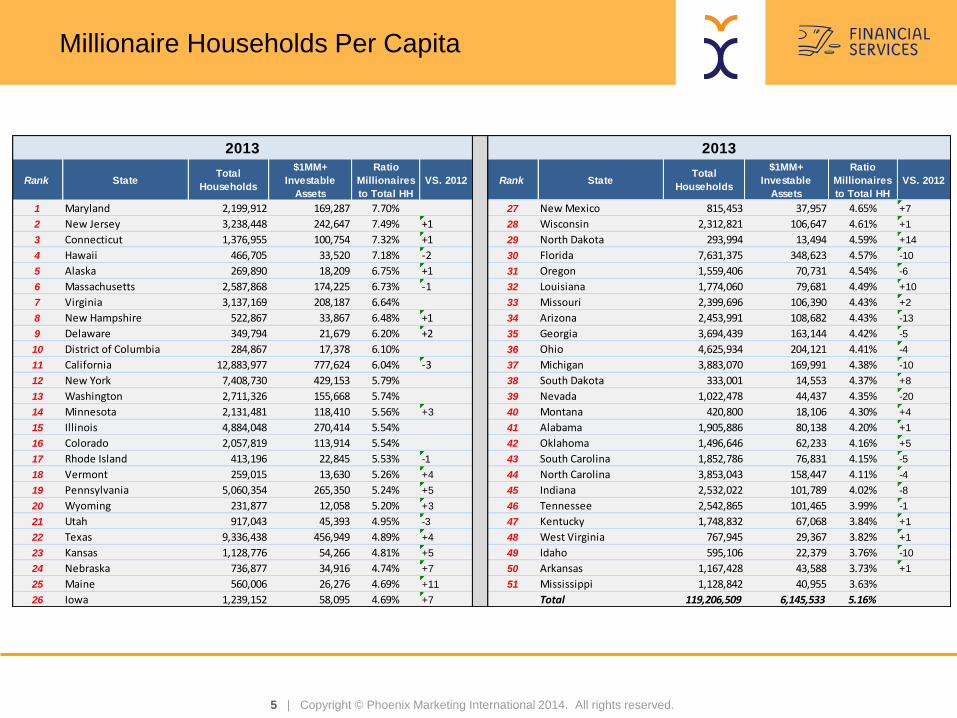
Millionaire Households Per Capita
Rank StateTotal
Households
$1MM+
Investable
Assets
Ratio
Millionaires
to Total HH
VS. 2012 Rank StateTotal
Households
$1MM+
Investable
Assets
Ratio
Millionaires
to Total HH
VS. 2012
1 Maryland 2,199,912 169,287 7.70% 27 New Mexico 815,453 37,957 4.65% +7
2 New Jersey 3,238,448 242,647 7.49% +1 28 Wisconsin 2,312,821 106,647 4.61% +1
3 Connecticut 1,376,955 100,754 7.32% +1 29 North Dakota 293,994 13,494 4.59% +14
4 Hawaii 466,705 33,520 7.18% -2 30 Florida 7,631,375 348,623 4.57% -10
5 Alaska 269,890 18,209 6.75% +1 31 Oregon 1,559,406 70,731 4.54% -6
6 Massachusetts 2,587,868 174,225 6.73% -1 32 Louisiana 1,774,060 79,681 4.49% +10
7 Virginia 3,137,169 208,187 6.64% 33 Missouri 2,399,696 106,390 4.43% +2
8 New Hampshire 522,867 33,867 6.48% +1 34 Arizona 2,453,991 108,682 4.43% -13
9 Delaware 349,794 21,679 6.20% +2 35 Georgia 3,694,439 163,144 4.42% -5
10 District of Columbia 284,867 17,378 6.10% 36 Ohio 4,625,934 204,121 4.41% -4
11 California 12,883,977 777,624 6.04% -3 37 Michigan 3,883,070 169,991 4.38% -10
12 New York 7,408,730 429,153 5.79% 38 South Dakota 333,001 14,553 4.37% +8
13 Washington 2,711,326 155,668 5.74% 39 Nevada 1,022,478 44,437 4.35% -20
14 Minnesota 2,131,481 118,410 5.56% +3 40 Montana 420,800 18,106 4.30% +4
15 Illinois 4,884,048 270,414 5.54% 41 Alabama 1,905,886 80,138 4.20% +1
16 Colorado 2,057,819 113,914 5.54% 42 Oklahoma 1,496,646 62,233 4.16% +5
17 Rhode Island 413,196 22,845 5.53% -1 43 South Carolina 1,852,786 76,831 4.15% -5
18 Vermont 259,015 13,630 5.26% +4 44 North Carolina 3,853,043 158,447 4.11% -4
19 Pennsylvania 5,060,354 265,350 5.24% +5 45 Indiana 2,532,022 101,789 4.02% -8
20 Wyoming 231,877 12,058 5.20% +3 46 Tennessee 2,542,865 101,465 3.99% -1
21 Utah 917,043 45,393 4.95% -3 47 Kentucky 1,748,832 67,068 3.84% +1
22 Texas 9,336,438 456,949 4.89% +4 48 West Virginia 767,945 29,367 3.82% +1
23 Kansas 1,128,776 54,266 4.81% +5 49 Idaho 595,106 22,379 3.76% -10
24 Nebraska 736,877 34,916 4.74% +7 50 Arkansas 1,167,428 43,588 3.73% +1
25 Maine 560,006 26,276 4.69% +11 51 Mississippi 1,128,842 40,955 3.63%
26 Iowa 1,239,152 58,095 4.69% +7 Total 119,206,509 6,145,533 5.16%
2013 2013
6 | Copyright © Phoenix Marketing International 2014. All rights reserved.
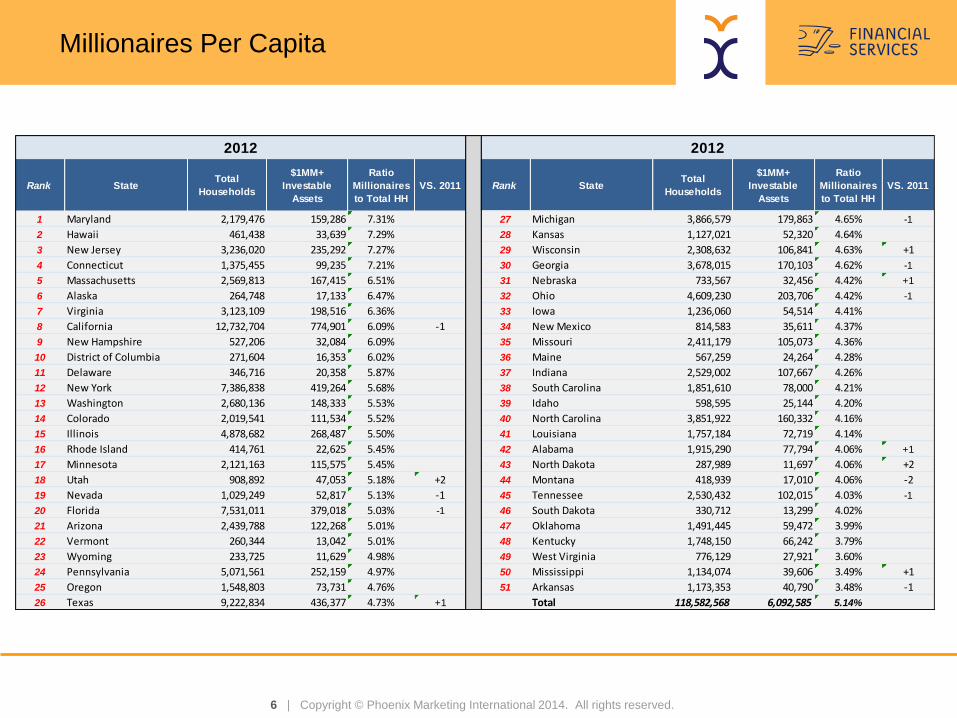
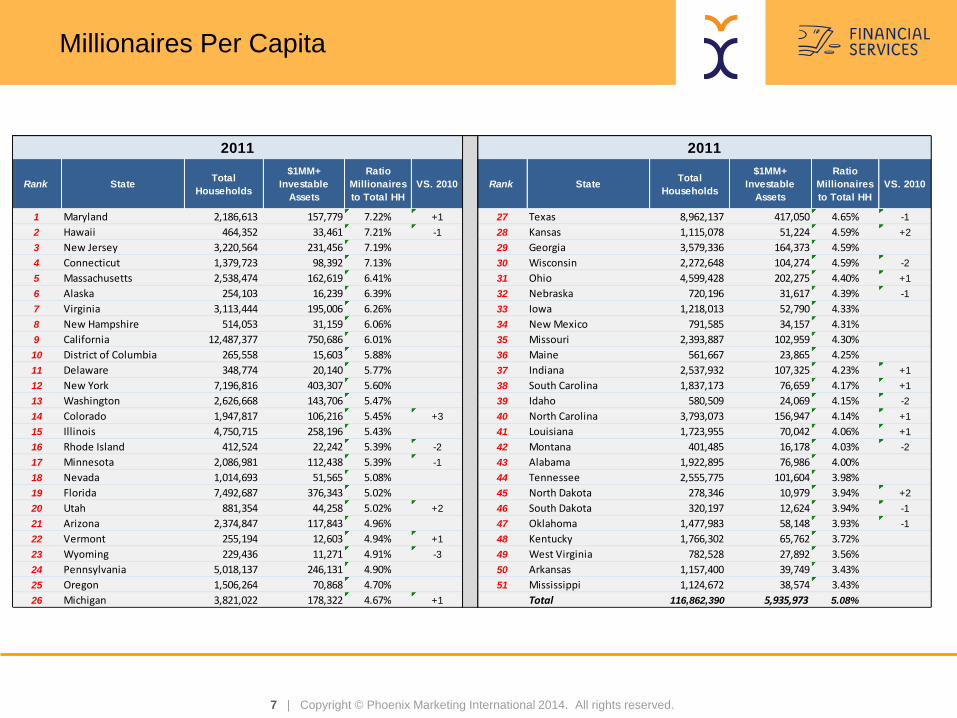
Millionaires Per Capita
Rank StateTotal
Households
$1MM+
Investable
Assets
Ratio
Millionaires
to Total HH
VS. 2011 Rank StateTotal
Households
$1MM+
Investable
Assets
Ratio
Millionaires
to Total HH
VS. 2011
1 Maryland 2,179,476 159,286 7.31% 27 Michigan 3,866,579 179,863 4.65% -1
2 Hawaii 461,438 33,639 7.29% 28 Kansas 1,127,021 52,320 4.64%
3 New Jersey 3,236,020 235,292 7.27% 29 Wisconsin 2,308,632 106,841 4.63% +1
4 Connecticut 1,375,455 99,235 7.21% 30 Georgia 3,678,015 170,103 4.62% -1
5 Massachusetts 2,569,813 167,415 6.51% 31 Nebraska 733,567 32,456 4.42% +1
6 Alaska 264,748 17,133 6.47% 32 Ohio 4,609,230 203,706 4.42% -1
7 Virginia 3,123,109 198,516 6.36% 33 Iowa 1,236,060 54,514 4.41%
8 California 12,732,704 774,901 6.09% -1 34 New Mexico 814,583 35,611 4.37%
9 New Hampshire 527,206 32,084 6.09% 35 Missouri 2,411,179 105,073 4.36%
10 District of Columbia 271,604 16,353 6.02% 36 Maine 567,259 24,264 4.28%
11 Delaware 346,716 20,358 5.87% 37 Indiana 2,529,002 107,667 4.26%
12 New York 7,386,838 419,264 5.68% 38 South Carolina 1,851,610 78,000 4.21%
13 Washington 2,680,136 148,333 5.53% 39 Idaho 598,595 25,144 4.20%
14 Colorado 2,019,541 111,534 5.52% 40 North Carolina 3,851,922 160,332 4.16%
15 Illinois 4,878,682 268,487 5.50% 41 Louisiana 1,757,184 72,719 4.14%
16 Rhode Island 414,761 22,625 5.45% 42 Alabama 1,915,290 77,794 4.06% +1
17 Minnesota 2,121,163 115,575 5.45% 43 North Dakota 287,989 11,697 4.06% +2
18 Utah 908,892 47,053 5.18% +2 44 Montana 418,939 17,010 4.06% -2
19 Nevada 1,029,249 52,817 5.13% -1 45 Tennessee 2,530,432 102,015 4.03% -1
20 Florida 7,531,011 379,018 5.03% -1 46 South Dakota 330,712 13,299 4.02%
21 Arizona 2,439,788 122,268 5.01% 47 Oklahoma 1,491,445 59,472 3.99%
22 Vermont 260,344 13,042 5.01% 48 Kentucky 1,748,150 66,242 3.79%
23 Wyoming 233,725 11,629 4.98% 49 West Virginia 776,129 27,921 3.60%
24 Pennsylvania 5,071,561 252,159 4.97% 50 Mississippi 1,134,074 39,606 3.49% +1
25 Oregon 1,548,803 73,731 4.76% 51 Arkansas 1,173,353 40,790 3.48% -1
26 Texas 9,222,834 436,377 4.73% +1 Total 118,582,568 6,092,585 5.14%
2012 2012
7 | Copyright © Phoenix Marketing International 2014. All rights reserved.
Millionaires Per Capita
Rank StateTotal
Households
$1MM+
Investable
Assets
Ratio
Millionaires
to Total HH
VS. 2010 Rank StateTotal
Households
$1MM+
Investable
Assets
Ratio
Millionaires
to Total HH
VS. 2010
1 Maryland 2,186,613 157,779 7.22% +1 27 Texas 8,962,137 417,050 4.65% -1
2 Hawaii 464,352 33,461 7.21% -1 28 Kansas 1,115,078 51,224 4.59% +2
3 New Jersey 3,220,564 231,456 7.19% 29 Georgia 3,579,336 164,373 4.59%
4 Connecticut 1,379,723 98,392 7.13% 30 Wisconsin 2,272,648 104,274 4.59% -2
5 Massachusetts 2,538,474 162,619 6.41% 31 Ohio 4,599,428 202,275 4.40% +1
6 Alaska 254,103 16,239 6.39% 32 Nebraska 720,196 31,617 4.39% -1
7 Virginia 3,113,444 195,006 6.26% 33 Iowa 1,218,013 52,790 4.33%
8 New Hampshire 514,053 31,159 6.06% 34 New Mexico 791,585 34,157 4.31%
9 California 12,487,377 750,686 6.01% 35 Missouri 2,393,887 102,959 4.30%
10 District of Columbia 265,558 15,603 5.88% 36 Maine 561,667 23,865 4.25%
11 Delaware 348,774 20,140 5.77% 37 Indiana 2,537,932 107,325 4.23% +1
12 New York 7,196,816 403,307 5.60% 38 South Carolina 1,837,173 76,659 4.17% +1
13 Washington 2,626,668 143,706 5.47% 39 Idaho 580,509 24,069 4.15% -2
14 Colorado 1,947,817 106,216 5.45% +3 40 North Carolina 3,793,073 156,947 4.14% +1
15 Illinois 4,750,715 258,196 5.43% 41 Louisiana 1,723,955 70,042 4.06% +1
16 Rhode Island 412,524 22,242 5.39% -2 42 Montana 401,485 16,178 4.03% -2
17 Minnesota 2,086,981 112,438 5.39% -1 43 Alabama 1,922,895 76,986 4.00%
18 Nevada 1,014,693 51,565 5.08% 44 Tennessee 2,555,775 101,604 3.98%
19 Florida 7,492,687 376,343 5.02% 45 North Dakota 278,346 10,979 3.94% +2
20 Utah 881,354 44,258 5.02% +2 46 South Dakota 320,197 12,624 3.94% -1
21 Arizona 2,374,847 117,843 4.96% 47 Oklahoma 1,477,983 58,148 3.93% -1
22 Vermont 255,194 12,603 4.94% +1 48 Kentucky 1,766,302 65,762 3.72%
23 Wyoming 229,436 11,271 4.91% -3 49 West Virginia 782,528 27,892 3.56%
24 Pennsylvania 5,018,137 246,131 4.90% 50 Arkansas 1,157,400 39,749 3.43%
25 Oregon 1,506,264 70,868 4.70% 51 Mississippi 1,124,672 38,574 3.43%
26 Michigan 3,821,022 178,322 4.67% +1 Total 116,862,390 5,935,973 5.08%
2011 2011

8 | Copyright © Phoenix Marketing International 2014. All rights reserved.
Millionaires Per Capita
Rank StateTotal
Households
$1MM+
Investable
Assets
Ratio
Millionaires
to Total HH
VS. 2009 Rank StateTotal
Households
$1MM+
Investable
Assets
Ratio
Millionaires
to Total HH
VS. 2009
1 Hawaii 444,202 30,793 6.93% - 27 Michigan 3,846,728 166,611 4.33% -1
2 Maryland 2,129,773 144,686 6.79% - 28 Wisconsin 2,252,664 97,266 4.32% -1
3 New Jersey 3,175,894 212,396 6.69% - 29 Georgia 3,639,796 156,943 4.31% -
4 Connecticut 1,347,693 89,647 6.65% - 30 Kansas 1,096,736 47,226 4.31% -
5 Massachusetts 2,521,928 150,844 5.98% +1 31 Nebraska 704,049 29,272 4.16% +2
6 Alaska 248,009 14,805 5.97% +1 32 Ohio 4,566,369 188,908 4.14% -1
7 Virginia 3,043,091 180,638 5.94% -2 33 Iowa 1,204,906 49,451 4.10% -1
8 New Hampshire 514,667 29,790 5.79% - 34 New Mexico 766,050 31,145 4.07% +2
9 California 12,653,856 716,316 5.66% - 35 Missouri 2,364,933 95,312 4.03% -1
10 District of Columbia 262,976 14,533 5.53% - 36 Maine 553,493 22,191 4.01% -1
11 Delaware 343,322 18,412 5.36% - 37 Idaho 575,621 22,917 3.98% +2
12 New York 7,263,927 381,197 5.25% - 38 Indiana 2,501,280 99,440 3.98% -1
13 Washington 2,577,274 133,582 5.18% - 39 South Carolina 1,802,904 71,114 3.94% -1
14 Rhode Island 409,575 20,873 5.10% +1 40 Montana 394,196 15,491 3.93% -
15 Illinois 4,800,176 242,536 5.05% +1 41 North Carolina 3,725,318 144,029 3.87% -
16 Minnesota 2,057,554 103,641 5.04% +2 42 Louisiana 1,701,745 65,382 3.84% +1
17 Colorado 1,949,583 98,085 5.03% - 43 Alabama 1,881,966 71,224 3.78% -1
18 Nevada 990,855 48,220 4.87% -4 44 Tennessee 2,519,914 94,560 3.75% -
19 Florida 7,455,767 362,285 4.86% - 45 South Dakota 317,030 11,865 3.74% +2
20 Wyoming 219,309 10,631 4.85% +1 46 Oklahoma 1,442,985 53,910 3.74% -1
21 Arizona 2,458,106 117,094 4.76% -1 47 North Dakota 265,786 9,907 3.73% -1
22 Utah 891,901 42,238 4.74% - 48 Kentucky 1,743,587 61,315 3.52% -
23 Vermont 252,584 11,806 4.67% - 49 West Virginia 761,493 26,090 3.43% -
24 Pennsylvania 4,934,144 227,680 4.61% - 50 Arkansas 1,138,318 36,854 3.24% -
25 Oregon 1,513,336 66,839 4.42% - 51 Mississippi 1,113,217 35,847 3.22% -
26 Texas 8,796,031 381,165 4.33% +2 Total 116,136,617 5,555,002 4.78%
2010 2010
9 | Copyright © Phoenix Marketing International 2014. All rights reserved.
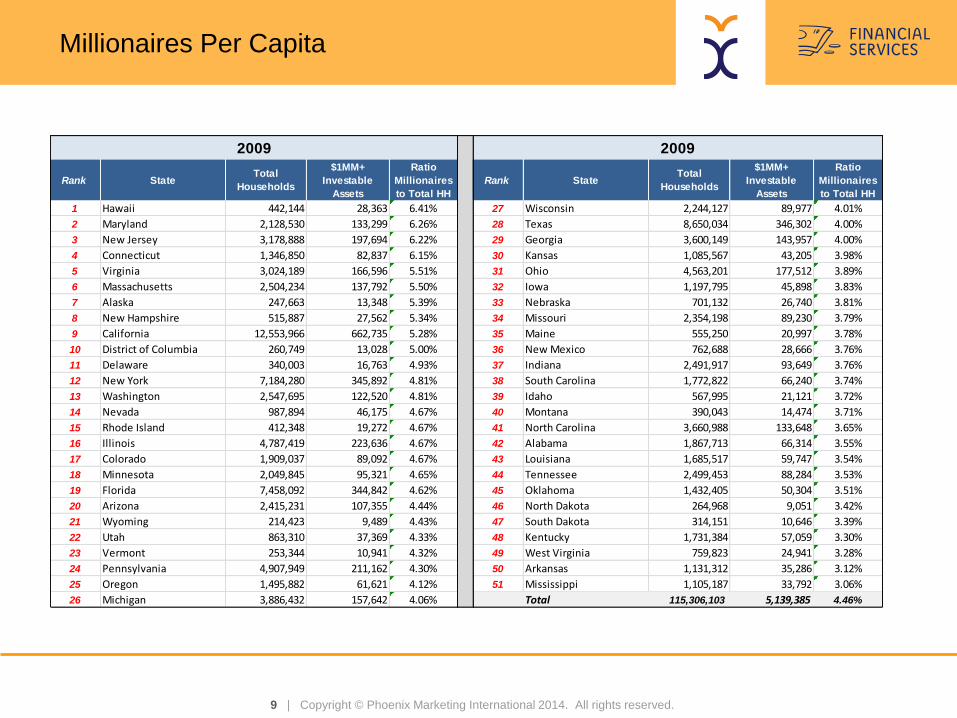
Millionaires Per Capita
Rank StateTotal
Households
$1MM+
Investable
Assets
Ratio
Millionaires
to Total HH
Rank StateTotal
Households
$1MM+
Investable
Assets
Ratio
Millionaires
to Total HH
1 Hawaii 442,144 28,363 6.41% 27 Wisconsin 2,244,127 89,977 4.01%
2 Maryland 2,128,530 133,299 6.26% 28 Texas 8,650,034 346,302 4.00%
3 New Jersey 3,178,888 197,694 6.22% 29 Georgia 3,600,149 143,957 4.00%
4 Connecticut 1,346,850 82,837 6.15% 30 Kansas 1,085,567 43,205 3.98%
5 Virginia 3,024,189 166,596 5.51% 31 Ohio 4,563,201 177,512 3.89%
6 Massachusetts 2,504,234 137,792 5.50% 32 Iowa 1,197,795 45,898 3.83%
7 Alaska 247,663 13,348 5.39% 33 Nebraska 701,132 26,740 3.81%
8 New Hampshire 515,887 27,562 5.34% 34 Missouri 2,354,198 89,230 3.79%
9 California 12,553,966 662,735 5.28% 35 Maine 555,250 20,997 3.78%
10 District of Columbia 260,749 13,028 5.00% 36 New Mexico 762,688 28,666 3.76%
11 Delaware 340,003 16,763 4.93% 37 Indiana 2,491,917 93,649 3.76%
12 New York 7,184,280 345,892 4.81% 38 South Carolina 1,772,822 66,240 3.74%
13 Washington 2,547,695 122,520 4.81% 39 Idaho 567,995 21,121 3.72%
14 Nevada 987,894 46,175 4.67% 40 Montana 390,043 14,474 3.71%
15 Rhode Island 412,348 19,272 4.67% 41 North Carolina 3,660,988 133,648 3.65%
16 Illinois 4,787,419 223,636 4.67% 42 Alabama 1,867,713 66,314 3.55%
17 Colorado 1,909,037 89,092 4.67% 43 Louisiana 1,685,517 59,747 3.54%
18 Minnesota 2,049,845 95,321 4.65% 44 Tennessee 2,499,453 88,284 3.53%
19 Florida 7,458,092 344,842 4.62% 45 Oklahoma 1,432,405 50,304 3.51%
20 Arizona 2,415,231 107,355 4.44% 46 North Dakota 264,968 9,051 3.42%
21 Wyoming 214,423 9,489 4.43% 47 South Dakota 314,151 10,646 3.39%
22 Utah 863,310 37,369 4.33% 48 Kentucky 1,731,384 57,059 3.30%
23 Vermont 253,344 10,941 4.32% 49 West Virginia 759,823 24,941 3.28%
24 Pennsylvania 4,907,949 211,162 4.30% 50 Arkansas 1,131,312 35,286 3.12%
25 Oregon 1,495,882 61,621 4.12% 51 Mississippi 1,105,187 33,792 3.06%
26 Michigan 3,886,432 157,642 4.06% Total 115,306,103 5,139,385 4.46%
2009 2009

10 | Copyright © Phoenix Marketing International 2014. All rights reserved.
Millionaires Per Capita
Rank StateTotal
Households
$1MM+
Investable
Assets
Ratio
Millionaires
to Total HH
Rank StateTotal
Households
$1MM+
Investable
Assets
Ratio
Millionaires
to Total HH
1 Hawaii 442,274 32,103 7.26% 27 Kansas 1,082,385 47,613 4.40%
2 Maryland 2,144,808 148,395 6.92% 28 Wisconsin 2,233,105 98,109 4.39%
3 New Jersey 3,199,900 220,372 6.89% 29 Georgia 3,548,295 153,975 4.34%
4 Connecticut 1,353,564 92,282 6.82% 30 Texas 8,469,530 362,693 4.28%
5 Massachusetts 2,502,147 150,906 6.03% 31 Nebraska 702,723 30,013 4.27%
6 Virginia 3,003,153 179,752 5.99% 32 New Mexico 755,993 32,274 4.27%
7 California 12,588,862 722,681 5.74% 33 Ohio 4,573,875 193,712 4.24%
8 District of Columbia 257,819 14,781 5.73% 34 Iowa 1,200,922 50,214 4.18%
9 New Hampshire 518,560 29,277 5.65% 35 Missouri 2,349,919 97,030 4.13%
10 Alaska 242,687 13,417 5.53% 36 Maine 559,364 23,068 4.12%
11 Delaware 334,883 18,322 5.47% 37 Indiana 2,484,730 101,987 4.10%
12 New York 7,204,492 379,745 5.27% 38 South Carolina 1,734,072 70,185 4.05%
13 Florida 7,398,258 386,077 5.22% 39 North Carolina 3,573,460 143,984 4.03%
14 Rhode Island 416,379 21,698 5.21% 40 Alabama 1,859,096 74,162 3.99%
15 Illinois 4,786,787 247,165 5.16% 41 South Dakota 308,611 12,151 3.94%
16 Minnesota 2,040,608 104,435 5.12% 42 Montana 385,847 15,149 3.93%
17 Nevada 980,068 49,574 5.06% 43 Louisiana 1,660,624 65,163 3.92%
18 Washington 2,526,352 127,726 5.06% 44 Idaho 556,843 21,739 3.90%
19 Colorado 1,877,779 93,605 4.98% 45 Tennessee 2,454,617 95,024 3.87%
20 Arizona 2,374,996 114,744 4.83% 46 North Dakota 263,107 10,148 3.86%
21 Pennsylvania 4,916,414 233,349 4.75% 47 Oklahoma 1,421,631 53,689 3.78%
22 Vermont 254,932 11,967 4.69% 48 Kentucky 1,718,125 63,991 3.72%
23 Michigan 3,916,061 181,748 4.64% 49 West Virginia 762,655 27,629 3.62%
24 Wyoming 209,951 9,735 4.64% 50 Arkansas 1,129,118 39,597 3.51%
25 Oregon 1,480,382 66,590 4.50% 51 Mississippi 1,097,900 37,170 3.39%
26 Utah 835,538 37,074 4.44% Total 114,694,201 5,607,989 4.89%
2008 2008

11 | Copyright © Phoenix Marketing International 2014. All rights reserved.
Millionaires Per Capita
Rank StateTotal
Households
$1MM+
Investable
Assets
Ratio
Millionaires
to Total HH
Rank StateTotal
Households
$1MM+
Investable
Assets
Ratio
Millionaires
to Total HH
1 New Jersey 3,210,592 228,442 7.12% 27 Wyoming 207,248 10,160 4.90%
2 Maryland 2,143,128 151,756 7.08% 28 Ohio 4,578,456 224,305 4.90%
3 Connecticut 1,358,170 95,028 7.00% 29 Oregon 1,456,021 71,046 4.88%
4 Hawaii 438,893 29,365 6.69% 30 Kansas 1,075,666 51,580 4.80%
5 Massachusetts 2,493,707 156,208 6.26% 31 Indiana 2,468,351 118,306 4.79%
6 Virginia 2,979,225 186,576 6.26% 32 Texas 8,333,041 393,640 4.72%
7 Delaware 333,263 20,274 6.08% 33 Iowa 1,191,013 56,235 4.72%
8 Alaska 240,842 14,594 6.06% 34 Nebraska 697,600 32,896 4.72%
9 New Hampshire 517,725 30,918 5.97% 35 Missouri 2,330,315 109,256 4.69%
10 California 12,461,651 720,733 5.78% 36 Maine 557,043 25,960 4.66%
11 Colorado 1,841,538 105,351 5.72% 37 New Mexico 750,428 34,610 4.61%
12 Minnesota 2,026,451 115,587 5.70% 38 South Carolina 1,704,376 78,285 4.59%
13 Illinois 4,760,856 269,098 5.65% 39 North Carolina 3,496,649 160,307 4.58%
14 Michigan 3,936,519 214,069 5.44% 40 Alabama 1,841,006 81,994 4.45%
15 Washington 2,489,441 133,812 5.38% 41 Tennessee 2,415,110 107,355 4.45%
16 Nevada 952,864 51,153 5.37% 42 Idaho 540,847 23,652 4.37%
17 Rhode Island 424,216 22,550 5.32% 43 Montana 382,778 16,511 4.31%
18 Florida 7,308,878 387,886 5.31% 44 Louisiana 1,632,824 69,296 4.24%
19 New York 7,235,413 381,786 5.28% 45 Kentucky 1,699,590 70,720 4.16%
20 District of Columbia 261,792 13,776 5.26% 46 Oklahoma 1,406,412 57,789 4.11%
21 Arizona 2,297,734 120,116 5.23% 47 South Dakota 306,176 12,563 4.10%
22 Vermont 253,582 13,163 5.19% 48 North Dakota 262,501 10,763 4.10%
23 Pennsylvania 4,916,948 252,326 5.13% 49 West Virginia 759,937 30,374 4.00%
24 Wisconsin 2,228,294 112,692 5.06% 50 Arkansas 1,112,643 43,533 3.91%
25 Utah 801,821 39,670 4.95% 51 Mississippi 1,108,629 42,703 3.85%
26 Georgia 3,439,800 170,160 4.95% Total 113,668,003 5,970,929 5.25%
2007 2007
12 | Copyright © Phoenix Marketing International 2014. All rights reserved.
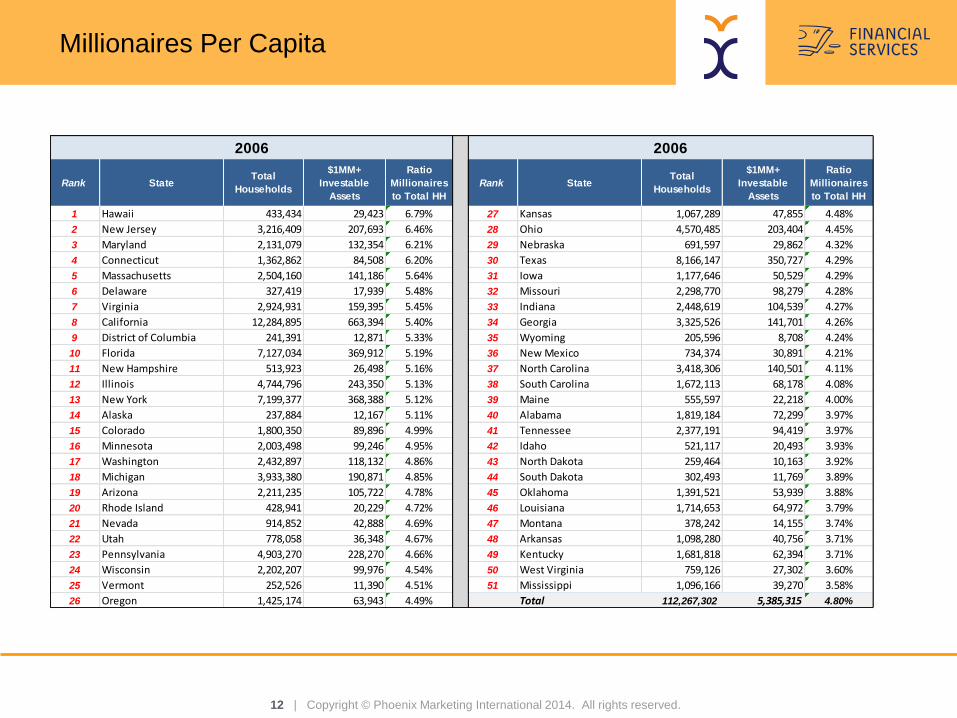
Millionaires Per Capita
Rank StateTotal
Households
$1MM+
Investable
Assets
Ratio
Millionaires
to Total HH
Rank StateTotal
Households
$1MM+
Investable
Assets
Ratio
Millionaires
to Total HH
1 Hawaii 433,434 29,423 6.79% 27 Kansas 1,067,289 47,855 4.48%
2 New Jersey 3,216,409 207,693 6.46% 28 Ohio 4,570,485 203,404 4.45%
3 Maryland 2,131,079 132,354 6.21% 29 Nebraska 691,597 29,862 4.32%
4 Connecticut 1,362,862 84,508 6.20% 30 Texas 8,166,147 350,727 4.29%
5 Massachusetts 2,504,160 141,186 5.64% 31 Iowa 1,177,646 50,529 4.29%
6 Delaware 327,419 17,939 5.48% 32 Missouri 2,298,770 98,279 4.28%
7 Virginia 2,924,931 159,395 5.45% 33 Indiana 2,448,619 104,539 4.27%
8 California 12,284,895 663,394 5.40% 34 Georgia 3,325,526 141,701 4.26%
9 District of Columbia 241,391 12,871 5.33% 35 Wyoming 205,596 8,708 4.24%
10 Florida 7,127,034 369,912 5.19% 36 New Mexico 734,374 30,891 4.21%
11 New Hampshire 513,923 26,498 5.16% 37 North Carolina 3,418,306 140,501 4.11%
12 Illinois 4,744,796 243,350 5.13% 38 South Carolina 1,672,113 68,178 4.08%
13 New York 7,199,377 368,388 5.12% 39 Maine 555,597 22,218 4.00%
14 Alaska 237,884 12,167 5.11% 40 Alabama 1,819,184 72,299 3.97%
15 Colorado 1,800,350 89,896 4.99% 41 Tennessee 2,377,191 94,419 3.97%
16 Minnesota 2,003,498 99,246 4.95% 42 Idaho 521,117 20,493 3.93%
17 Washington 2,432,897 118,132 4.86% 43 North Dakota 259,464 10,163 3.92%
18 Michigan 3,933,380 190,871 4.85% 44 South Dakota 302,493 11,769 3.89%
19 Arizona 2,211,235 105,722 4.78% 45 Oklahoma 1,391,521 53,939 3.88%
20 Rhode Island 428,941 20,229 4.72% 46 Louisiana 1,714,653 64,972 3.79%
21 Nevada 914,852 42,888 4.69% 47 Montana 378,242 14,155 3.74%
22 Utah 778,058 36,348 4.67% 48 Arkansas 1,098,280 40,756 3.71%
23 Pennsylvania 4,903,270 228,270 4.66% 49 Kentucky 1,681,818 62,394 3.71%
24 Wisconsin 2,202,207 99,976 4.54% 50 West Virginia 759,126 27,302 3.60%
25 Vermont 252,526 11,390 4.51% 51 Mississippi 1,096,166 39,270 3.58%
26 Oregon 1,425,174 63,943 4.49% Total 112,267,302 5,385,315 4.80%
2006 2006