rapid cycle pilots: lessons learned from math trials in six … · 2018-03-07 · rapid cycle...
TRANSCRIPT
Accelerating Change | 1www.digitalpromise.org
Rapid Cycle Pilots:
Lessons Learned from Math Trials in Six Districts
November, 2016Authored byChristina C. Luke, Ph.D.Aubrey T. Francisco, Ph.D.

Rapid Cycle Pilots: Lessons Learned from Math Trials in Six Districts | 2
Table of Contents
Executive Summary . . . . . . . . . . . . . . . . . . . . . . . . . . . . . . . . . . . . 3
Introduction . . . . . . . . . . . . . . . . . . . . . . . . . . . . . . . . . . . . . . . . . . 4
School District and Product Selection . . . . . . . . . . . . . . . . . . . . 6
Methodology . . . . . . . . . . . . . . . . . . . . . . . . . . . . . . . . . . . . . . . . . 8
District Results . . . . . . . . . . . . . . . . . . . . . . . . . . . . . . . . . . . . . . . 10
Process Results . . . . . . . . . . . . . . . . . . . . . . . . . . . . . . . . . . . . . . 15
Product Results . . . . . . . . . . . . . . . . . . . . . . . . . . . . . . . . . . . . . . 16
Discussion . . . . . . . . . . . . . . . . . . . . . . . . . . . . . . . . . . . . . . . . . . . 18
Conclusion . . . . . . . . . . . . . . . . . . . . . . . . . . . . . . . . . . . . . . . . . . 20
Appendix A: Pilot Study Briefs . . . . . . . . . . . . . . . . . . . . . . . . . . 21
Kettle Moraine Mathspace Pilot Study Brief . . . . . . . . . . . . 22
Mineola Mathspace Pilot Study Brief . . . . . . . . . . . . . . . . . . 24
Onslow Mathspace Pilot Study Brief . . . . . . . . . . . . . . . . . . 27
Mathspace Pilot Study Brief . . . . . . . . . . . . . . . . . . . . . . . . . . 30
Vista Mathspace Pilot Study Brief . . . . . . . . . . . . . . . . . . . . . 33
Highline Ratio Rancher Pilot Study Brief . . . . . . . . . . . . . . . 36

Executive SummaryOver the past year, Digital Promise identified common challenges in K-12 education that might be addressed using innovative education technology (ed-tech) products, and supported school districts as they piloted products designed to address these challenges. The goals of this effort were to influence ed-tech providers to improve their products, to influence school districts to improve their ed-tech piloting practices, and to increase awareness of ed-tech pilot best practices among K-12 district leaders.
In spring 2016, Digital Promise worked with six League of Innovative Schools districts to conduct pilot studies of two middle school math products. We also supported both companies in designing and conducting the pilot study, and provided formative feedback throughout the process. At the end of the study, district staff reported an improved understanding of the pilot process and the value of conducting pilots before purchasing new ed-tech products. The companies reported that the feedback they received ultimately improved their products.
The following recommendations, based on key findings from this study, can help other districts and product developers conduct successful ed-tech pilots. These include:
• Establish Educator Buy-in: When educators are involved in choosing and deciding to pilot a tool, their engagement with the education technology is higher and the tools are implemented with greater fidelity.
• Consider Pilot Size: Pilots should include a sample of the student and teacher population who might benefit from the tool, leaving a non-user group with whom to compare results. Smaller-scale pilots are also easier to implement because they require less time for professional learning, IT integration, and data analysis.
• Maintain Open Communication Among Stakeholders: Cooperation and communication between educators, school leaders, product companies, and researchers is essential to ensure common goals and expectations throughout the process.
• Prepare for Purchasing: When planning for an ed-tech pilot, consider what type of evidence will be needed in order to make an informed purchasing decision at the end of the process.
• Academic Rigor is Important: Educator buy-in is improved when they feel the tools are academically rigorous and well aligned to the curriculum.
• Setup and Rostering: Simplifying student and teacher account registration can help prevent frustration for educators and IT departments, and ensure the pilot rollout is successful.
• Offer Educator Support: Educators appreciate having use cases to observe when trying a new tool, and benefit from ongoing support throughout the pilot’s implementation.

Rapid Cycle Pilots: Lessons Learned from Math Trials in Six Districts | 4
Perhaps more troubling is the fact that there is limited research on which products are most effective in which contexts. This lack of reliable evidence leads to uncertainty among school leaders about how to select the right products for their needs4. Even when quality evidence about ed-tech products exists, school districts struggle to access, validate, and apply findings to their unique setting. For example, many district leaders question whether studies published or funded by product developers are biased. Additionally, results from studies conducted within a particular context or with a specific student population are difficult to generalize to a different population. Finally, because traditional evaluation research in education takes years to complete, many
studies are out of date and no longer relevant to current school contexts.
With limited evidence in the ed-tech marketplace, districts frequently rely on pilot studies to inform decision making5; however, these pilots are often informal and do not generate sufficient information for making purchasing decisions.
Over the past year, Digital Promise, with support from the Overdeck Family Foundation, worked with 6 U.S. public school districts conducting their own pilot studies. This report highlights results from pilots conducted in spring 2016. Six school districts from Digital Promise’s League of Innovative Schools piloted
School districts are increasingly recognizing the potential of education technology (ed-tech) to support learning, and districts are now spending a sizable portion of their budgets on ed-tech products. In 2015, U.S. elementary, middle, and high schools spent $6.6 billion on ed-tech1. However, many struggle to choose tools from an overwhelming array of options. A recent study2 found that the 3,100 teachers surveyed use a total of 964 unique digital products. And although relatively new, EdSurge’s “Product Index” is already tracking more than 1,600 unique education products and services in more than 60 categories3.
Introduction
1 http://www.centerdigitaled.com/higher-ed/US-Education-Institutions-Spend-66-Billion-on-IT-in-2015.html 2 https://www.edsurge.com/news/2014-04-22-what-teachers-need-from-digital-technology 3 https://www.edsurge.com/product-reviews/ 4 http://digitalpromise.org/wp-content/uploads/2016/02/IDEO-Digital-Promise-Report-Evolving-Ed-Tech
Procurement-in-School-Districts.pdf 5 http://digitalpromise.org/wp-content/uploads/2016/02/IDEO-Digital-Promise-Report-Evolving-Ed-Tech-
Procurement-in-School-Districts.pdf

5Spring Math Pilot |
two middle school math programs. The districts are located in California, New York, North Carolina, Wisconsin, and Washington, and the studies included over 5,000 students and 100 teachers.
The primary goal of this study was to evaluate the implementation of two math products piloted in varying district contexts, and to gather evidence to support each district’s purchasing decision. A secondary goal of this study was to understand the process by which
districts conduct ed tech pilots, and the type of research support they need to improve these practices.
The research team used a mixed method data collection approach that was customized according to district variances (including readiness for change, level of usage, demographics, etc.). Still, each district’s unique context should be carefully considered when extrapolating findings from this research to other settings.

Rapid Cycle Pilots: Lessons Learned from Math Trials in Six Districts | 6
Digital Promise met with leaders from each of the six school districts to define their instructional priorities and goals for the pilot. All districts were interested in finding adaptive math tools to help develop students’ math skills. Digital Promise generated a list of 6 math tools that fit district-specific parameters, including curricular goal, IT environment, time commitment to train teachers and implement the tool, student privacy policy, research base, and cost. From this list, five districts chose Mathspace and one chose Ratio Rancher. Ten schools across five states, representing 5,131 students and 102 teachers, participated in the pilots (see Table 1 for more information).
The two math products have very different purposes. Mathspace is an adaptive program that provides students with automated feedback on every step of a math problem. Depending on the student’s responses, Mathspace will provide students with higher or lower difficulty items to either reinforce skill gap areas or offer more challenging content. Tasks and curricula are mapped to Common Core State Standards, and a comprehensive teacher dashboard provides information about student progress on each problem and assignment.
Ratio Rancher, on the other hand, is a game designed to improve students’ understanding of ratios and proportions. In the game, students assume the role of a rancher who needs to feed animals appropriate ratios and proportions of food. The game is designed to meet Common Core State Standards for ratio skills in a very short time (one week minimum). Compared to Mathspace, Ratio Rancher was a very low-risk tool to pilot, both in terms of cost and student and teacher time.
The size, context, and goals of each pilot varied significantly. Kettle Moraine, Mineola, Onslow, and Vista conducted pilots of similar size, but represent a mix of rural and suburban contexts, and range from highly homogeneous to highly heterogeneous student populations. Rowan Salisbury chose to pilot with all sixth through eighth grade classrooms, so the size and scope of their pilot was much larger than the other districts. Highline’s pilot was small, but a large sample size was not necessary because the risk of piloting a modestly priced, single-skill tool like Ratio Rancher was low.
Implementation models varied across and within districts. For instance, teachers in Kettle Moraine each used Mathspace in a
In October 2015, Digital Promise polled district leaders from the League of Innovative Schools (League) to identify common problems in K-12 education that could potentially be addressed using an ed-tech product. District leaders identified middle school math instruction as a key area for which they needed more support. In December 2015, Digital Promise identified districts interested in piloting a math ed-tech product; ultimately six chose to participate.
School District and Product Selection
7Spring Math Pilot |
School District Product Students Teachers Grade Level Pilot Goal
Kettle Moraine Mathspace 200 7 6 - 8
To find an ed-tech tool that would provide
remedial and supplementary math education
for 6th - 8th grade students.
Mineola Mathspace 191 4 5
To provide support for 5th grade students in
math by offering a tool that could help them
review and enrich their skills.
Onslow Mathspace 203 2 7
To improve students' mathematics
understanding by implementing a standards-
based mathematics technology tool.
Rowan
SalisburyMathspace 4,197 76 6 - 8
To increase student mathematical skills and
close gaps in achievement.
Vista Mathspace 264 10 6 - 8
To improve struggling students’ attitudes
towards math and provide the opportunity
for students to practice their math skills
inside and outside of class.
Highline
Public Schools
Ratio
Rancher76 3 7
To strengthen students’ understanding of
ratios as applied to real world situations.
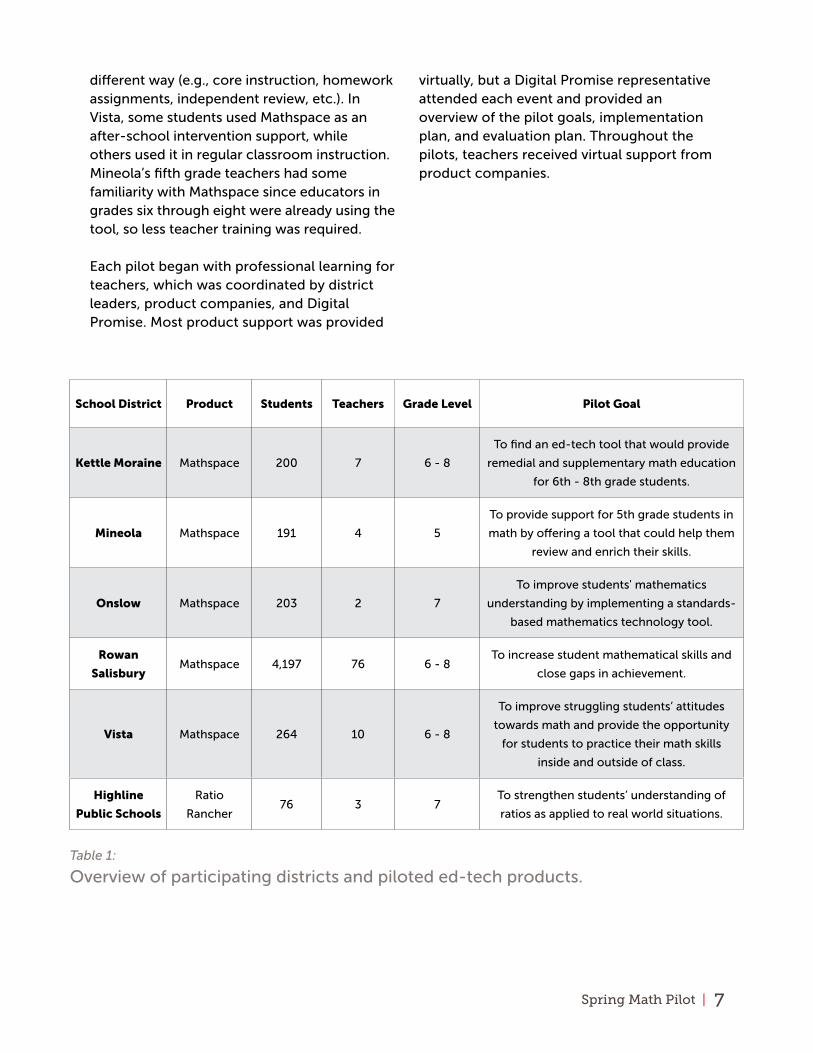
different way (e.g., core instruction, homework assignments, independent review, etc.). In Vista, some students used Mathspace as an after-school intervention support, while others used it in regular classroom instruction. Mineola’s fifth grade teachers had some familiarity with Mathspace since educators in grades six through eight were already using the tool, so less teacher training was required.
Each pilot began with professional learning for teachers, which was coordinated by district leaders, product companies, and Digital Promise. Most product support was provided
virtually, but a Digital Promise representative attended each event and provided an overview of the pilot goals, implementation plan, and evaluation plan. Throughout the pilots, teachers received virtual support from product companies.
Table 1:
Overview of participating districts and piloted ed-tech products.

Rapid Cycle Pilots: Lessons Learned from Math Trials in Six Districts | 8
While each district identified a pilot goal unique to their challenges, Digital Promise sought to capture changes in teacher and student knowledge, attitudes, and skills over the course of the pilot (February to May, 2016).
Digital Promise gathered information before, during, and after the pilots through student and teacher surveys, teacher and administrator interviews, product usage data, and existing student learning measures (i.e., NWEA MAP benchmark scores, see Table 2). Because districts are wary of product efficacy results from contexts dissimilar than their own, Digital Promise captured district context variables, including student demographics, IT environments, and educator readiness for change.
We intended to link student learning data to survey and usage data through student identification numbers. Unfortunately, despite the large number of student users and responses, many entered their identification numbers incorrectly. Because so few cases were able to be linked across the three data sources, we were unable to report the linked results.
For these pilots, it was our top priority to provide the types of evidence districts found most useful in making ed-tech purchasing decisions. At the end of the pilot, each district received a complete case study report6 identifying teacher and student changes over the course of the pilot. In addition, we produced pilot study briefs for each pilot (see Appendix A), as a way to publicly share product evidence with other districts. Our secondary priorities were to learn more about best practices in ed-tech pilot processes, and provide feedback to product developers to improve their products.
The next section presents a summary of district outcomes, findings related to the pilot process, and findings about the two products.
Methodology
6 For access to district case study reports, email [email protected].

9Spring Math Pilot |
School District
Dimension of Product Efficacy
MeasureKettle
MoraineMineola Onslow
Rowan Salisbury
Vista Highline
Student Knowledge
Log Data ✓ ✓ ✓ ✓ ✓ ✓
Pre-Post Test ✓
NWEA, STAR, or CCSS benchmark assessments
✓ ✓ ✓ ✓ ✓
Interview / Focus Group ✓ ✓ ✓ ✓ ✓
Student Attitudes and Skills
Log Data ✓ ✓ ✓ ✓ ✓ ✓
Pre-Post Survey ✓ ✓ ✓ ✓ ✓ ✓
Interview / Focus Group ✓ ✓ ✓ ✓ ✓ ✓
Classroom Observations ✓ ✓ ✓ ✓ ✓ ✓
Student Engagement
Log Data ✓ ✓ ✓ ✓ ✓ ✓
Pre-Post Survey ✓ ✓ ✓ ✓ ✓ ✓
Interviews/ Focus Groups ✓ ✓ ✓ ✓ ✓ ✓
Teacher Attitudes and Skills
Pre-Post Survey ✓ ✓ ✓ ✓ ✓ ✓
Interviews/ Focus Groups ✓ ✓ ✓ ✓ ✓ ✓
District Context Pre-Post Survey ✓ ✓ ✓ ✓ ✓ ✓
Interviews/ Focus Groups ✓ ✓ ✓ ✓ ✓ ✓
Table 2:
Overview of Measures used to Assess Product Efficacy

Rapid Cycle Pilots: Lessons Learned from Math Trials in Six Districts | 10
Student LearningAnalysis showed promising, statistically significant student learning gains for five of the six districts. Highline was able to provide comparison scores for seventh grade math students who did not use Ratio Rancher. Students using the tool scored 7.3% higher than their counterparts on the ratio skills portion of their benchmark assessment. Districts using Mathspace did not have comparison group scores, but did provide
pre- and post- benchmark scores; these data were analyzed using a paired T-test approach. The analysis showed that students’ benchmark scores in Mineola and Vista increased by 17% from the beginning to the end of the pilot. Kettle Moraine and Rowan Salisbury students saw modest, but still significant, gains over the same time period. Because so many students in Rowan Salisbury participated in the pilot, even a very modest increase was a significant change. In Onslow, student scores decreased
Pilot results for student learning, attitudes and skills, and engagement are presented in the section below. We also analyze how differences in district contexts influenced study outcomes.
District ResultsC
han
ge
in S
tud
ent
Lear
nin
g P
re t
o P
ost
-2.0%
0.0%
-0.3%
2.0%
4.0%
6.0%
8.0%
10.0%
12.0%
14.0%
16.0%
18.0%
Kettle Moraine Mineola Onslow
District
*
*
*
*
Rowan Salisbury Vista
Change in Benchmark Data
Figure 1
Changes in Pre-Post Student Learning Scores—Mathspace * indicates statistical significance at p<0.05

11Spring Math Pilot |
very slightly, but it was not a significant change. Significant changes in student learning scores are identified with an asterisk (see Figure 1).
In addition to student benchmark assessment data, Digital Promise captured changes in teacher and student attitudes, behavior, and engagement through pre-post surveys, interviews, and classroom observations. The surveys measured only a few statistically significant changes in student and teacher attitudes and skills; however, qualitative survey, interview, and observation data yielded useful information about teacher and student satisfaction. Product data also offered insights into student and teacher usage.
Teacher Attitudes and SkillsTeachers were enthusiastic about using instructional technology tools. Survey data suggested that almost all the teachers
believed digital literacy is important, and reported frequent use of technology tools and resources to deliver instruction. They were largely comfortable with integrating new technology and felt the tools were easy to use. In addition, most educators agreed that Mathspace aligned well with state and district curriculum and standards (see Figure 2).
At the end of the pilot, three-quarters of teachers piloting Mathspace and all teachers piloting Ratio Rancher said they would recommend the tool to a colleague. Teachers varied in their attitudes about pilots in general; we suspect this could be attributed to the varying levels of autonomy districts provided teachers when choosing whether and how to participate in a pilot. Teachers were split on whether this pilot experience would make them more likely to engage in a pilot in the future.
Mathspace helped improve my students’ math application
Figure 21:
Teacher Attitudes about Mathspace
I was excited to use Mathspace in my classroom
Mathspace aligns with district curriculum
Mathspace aligns with state standards
I would recommend this product to my colleagues
Mathspace helped improve my students’ problem solving skills
0% 20% 40% 60% 80% 100%
Strongly Disagree
Disagree
Agree
Strongly Agree!
3% 7% 70%
60%
53%
63%
63%
60%
20%
20%
10%
7%
20%
20%
3%
3%
3%
3%
17%
23%
23%
27%
20%
12Spring Math Pilot |
Student Attitudes and Skills
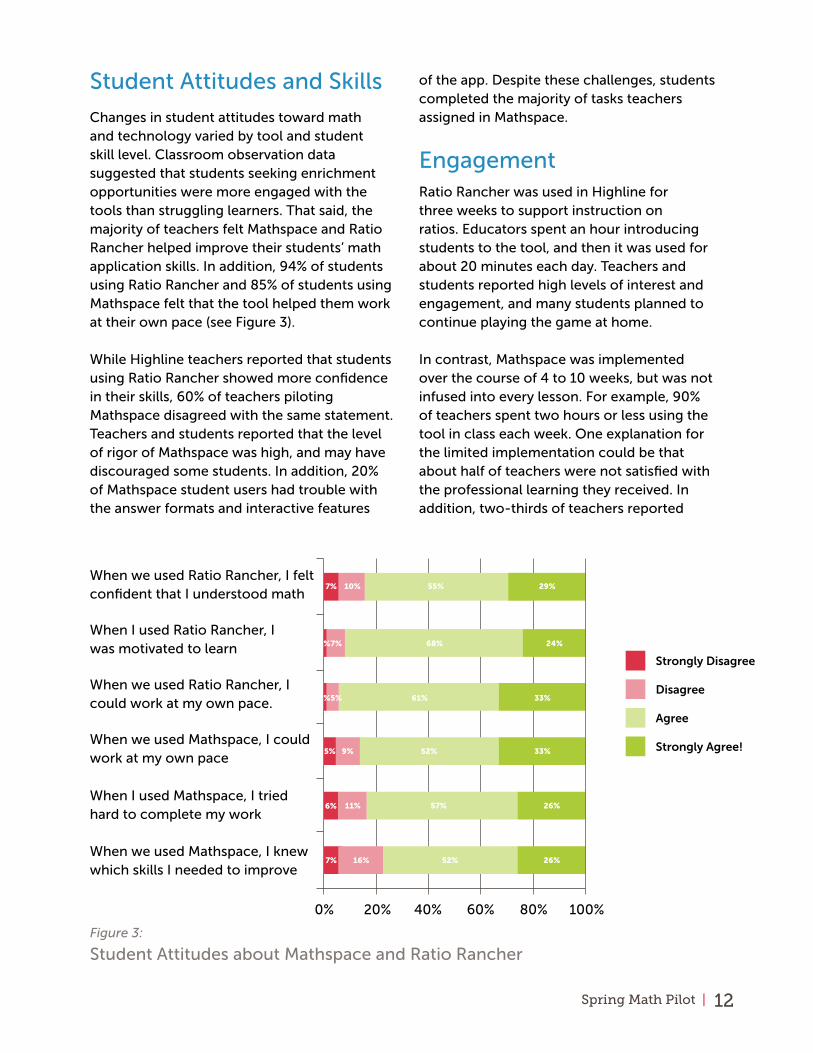
Changes in student attitudes toward math and technology varied by tool and student skill level. Classroom observation data suggested that students seeking enrichment opportunities were more engaged with the tools than struggling learners. That said, the majority of teachers felt Mathspace and Ratio Rancher helped improve their students’ math application skills. In addition, 94% of students using Ratio Rancher and 85% of students using Mathspace felt that the tool helped them work at their own pace (see Figure 3).
While Highline teachers reported that students using Ratio Rancher showed more confidence in their skills, 60% of teachers piloting Mathspace disagreed with the same statement. Teachers and students reported that the level of rigor of Mathspace was high, and may have discouraged some students. In addition, 20% of Mathspace student users had trouble with the answer formats and interactive features
of the app. Despite these challenges, students completed the majority of tasks teachers assigned in Mathspace.
EngagementRatio Rancher was used in Highline for three weeks to support instruction on ratios. Educators spent an hour introducing students to the tool, and then it was used for about 20 minutes each day. Teachers and students reported high levels of interest and engagement, and many students planned to continue playing the game at home.
In contrast, Mathspace was implemented over the course of 4 to 10 weeks, but was not infused into every lesson. For example, 90% of teachers spent two hours or less using the tool in class each week. One explanation for the limited implementation could be that about half of teachers were not satisfied with the professional learning they received. In addition, two-thirds of teachers reported
Figure 3:
Student Attitudes about Mathspace and Ratio Rancher
When we used Ratio Rancher, I felt confident that I understood math
When I used Ratio Rancher, I was motivated to learn
When we used Ratio Rancher, I could work at my own pace.
When we used Mathspace, I could work at my own pace
When we used Mathspace, I knew which skills I needed to improve
When I used Mathspace, I tried hard to complete my work
0% 20% 40% 60% 80% 100%
Strongly Disagree
Disagree
Agree
Strongly Agree!
7%
5%
6%
7%
2%
2%
10%
9%
11%
16%
7%
5%
55%
52%
57%
52%
68%
61%
29%
33%
26%
26%
24%
33%
13Spring Math Pilot |
having technical challenges with Mathspace in class (e.g., confusing student instructions, strict student answer formats, and student handwriting recognition issues).
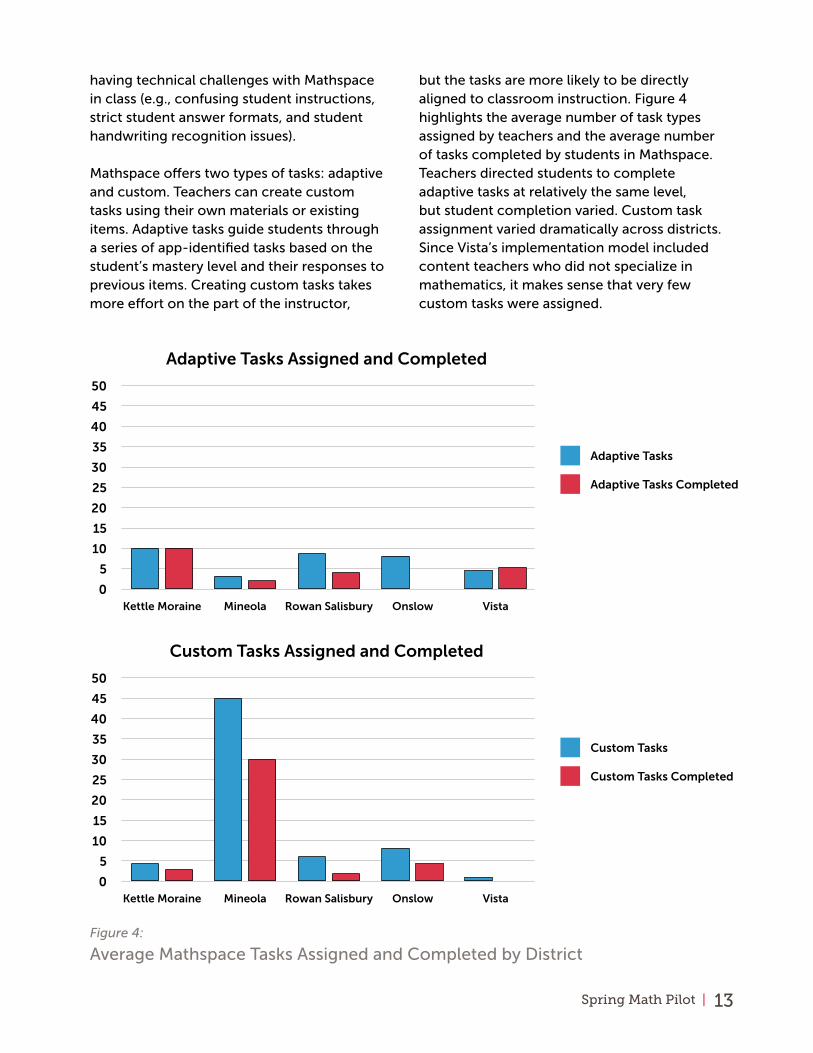
Mathspace offers two types of tasks: adaptive and custom. Teachers can create custom tasks using their own materials or existing items. Adaptive tasks guide students through a series of app-identified tasks based on the student’s mastery level and their responses to previous items. Creating custom tasks takes more effort on the part of the instructor,
but the tasks are more likely to be directly aligned to classroom instruction. Figure 4 highlights the average number of task types assigned by teachers and the average number of tasks completed by students in Mathspace. Teachers directed students to complete adaptive tasks at relatively the same level, but student completion varied. Custom task assignment varied dramatically across districts. Since Vista’s implementation model included content teachers who did not specialize in mathematics, it makes sense that very few custom tasks were assigned.
Adaptive Tasks Assigned and Completed
0
5
10
15
20
25
30
35
40
45
50
Kettle Moraine Mineola Rowan Salisbury Onslow Vista
Custom Tasks Assigned and Completed
0
5
10
15
20
25
30
35
40
45
50
Kettle Moraine Mineola Rowan Salisbury Onslow Vista
Adaptive Tasks
Adaptive Tasks Completed
Custom Tasks
Custom Tasks Completed
Figure 4:
Average Mathspace Tasks Assigned and Completed by District
14Spring Math Pilot |
District Context and Readiness
Piloting a new ed-tech tool can be difficult if educators do not have buy-in, or do not feel supported. In these math pilots, the majority of teachers reported on surveys that they felt confident their school was ready to pilot a new ed-tech tool successfully (92%), and they felt supported by their school leaders (89%). However, teacher interviews and focus groups suggested that implementation support varied, and some teachers were so dissatisfied with the pilot process that they did not complete the teacher survey. Therefore, teacher attitudes about their district’s readiness to pilot an ed-tech product were difficult to triangulate across data sources.
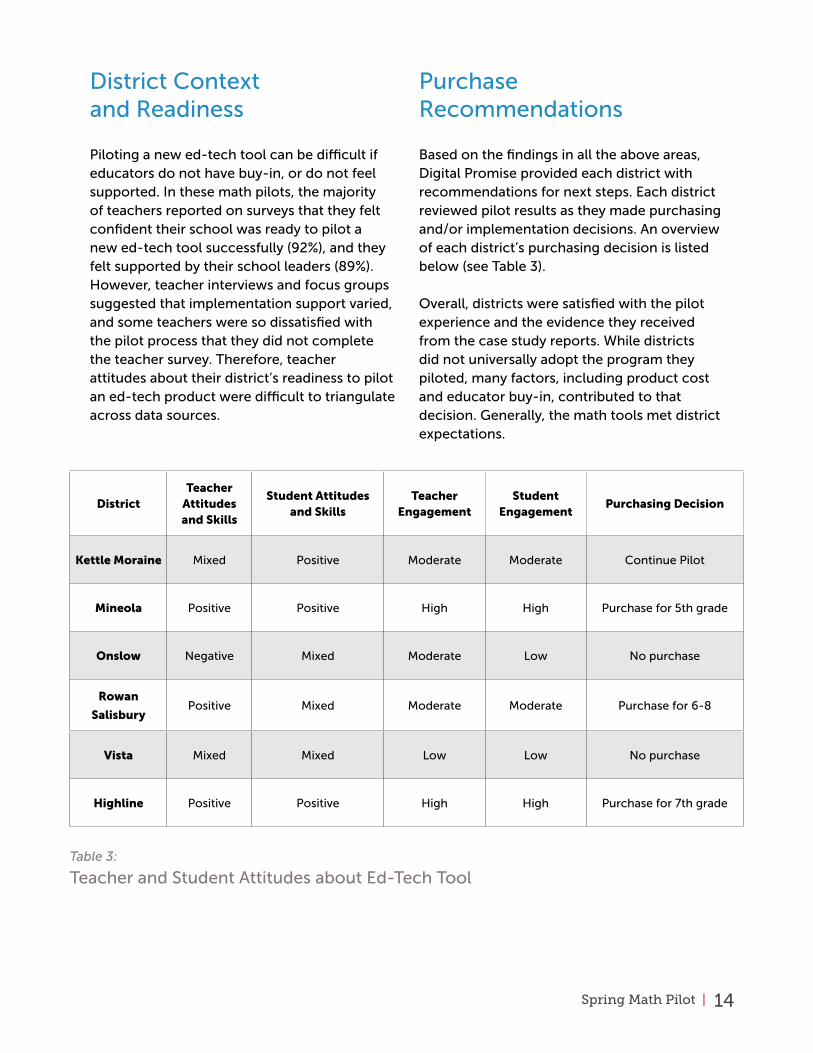
Purchase Recommendations
Based on the findings in all the above areas, Digital Promise provided each district with recommendations for next steps. Each district reviewed pilot results as they made purchasing and/or implementation decisions. An overview of each district’s purchasing decision is listed below (see Table 3).
Overall, districts were satisfied with the pilot experience and the evidence they received from the case study reports. While districts did not universally adopt the program they piloted, many factors, including product cost and educator buy-in, contributed to that decision. Generally, the math tools met district expectations.
DistrictTeacher
Attitudes and Skills
Student Attitudes and Skills
Teacher Engagement
Student Engagement
Purchasing Decision
Kettle Moraine Mixed Positive Moderate Moderate Continue Pilot
Mineola Positive Positive High High Purchase for 5th grade
Onslow Negative Mixed Moderate Low No purchase
Rowan
SalisburyPositive Mixed Moderate Moderate Purchase for 6-8
Vista Mixed Mixed Low Low No purchase
Highline Positive Positive High High Purchase for 7th grade
Table 3:
Teacher and Student Attitudes about Ed-Tech Tool
Rapid Cycle Pilots: Lessons Learned from Math Trials in Six Districts | 15
Educator Buy-inKettle Moraine decided future pilots should require more specific expectations for teachers and district leaders to ensure products are implemented with fidelity, and pilot results are easier to interpret.
Several districts recognized the importance of involving teachers in the decision to pilot a tool. In Mineola, a product endorsement from colleagues encouraged other teachers to be involved in the pilot. In Onslow, however, teachers felt they had limited voice in tool selection or pilot implementation. This lack of autonomy contributed to their low usage and negative feelings about the tool.
Many districts were interested in learning how educators’ level of interest and experience with technology affected their ability to pilot and implement tools. In many sites, educators with a strong interest and experience in technology were selected to pilot the tool; however, as a result, educators reported uncertainty around how the tool would work for their less tech savvy peers.
Pilot SizeRowan Salisbury Schools engaged in a large pilot large pilot with all 6th-8th grade teachers and students in seven schools. It was difficult to gather data across the district, and to provide support to all teachers and students involved. Additionally, implementation varied
significantly between schools which made it challenging to draw clear district-wide conclusions.
CommunicationEducators and leaders in every school district agreed that cooperation and partnership with the product company is essential. Educators who felt that companies responded quickly to resolve product issues were more likely to be satisfied with the tool than those who felt the product company was slow to respond to questions.
PurchasingAfter receiving case study reports, some districts were interested in options for purchasing limited product licenses. Through the pilot process, they realized that their district was not ready to scale up implementation, and therefore district-wide procurement was unwise.
Additionally, one district was not aware how much Mathspace cost when they agreed to pilot the tool. Later, they realized the cost would likely be prohibitive, and that student outcomes would have to be even more impressive than previously thought if they were to gain support for a more expensive purchase. Going forward, the district plans to discuss product cost at the beginning of the pilot to avoid confusion and disappointment.
Throughout the pilot process, districts learned important lessons about conducting pilots. Specifically, districts reported the following key takeaways and plans for improving their pilot practices.
Process Results
Rapid Cycle Pilots: Lessons Learned from Math Trials in Six Districts | 16
Math InstructionBoth Mathspace and Ratio Rancher were widely praised for the level of rigor they offered. Educators using Mathspace also appreciated the opportunity to share teacher-created assignments with colleagues, and found powerful ways to differentiate instruction with the tool. For example, some teachers assigned Mathspace tasks to a group of students to complete independently while they pulled aside smaller groups for review. A majority of teachers were impressed with the tool’s alignment to state standards and district curriculum.
Educators using Ratio Rancher were impressed by the clever way a difficult concept was woven into an engaging and fun game. Students mastered the application of ratio concepts to real-world settings, and one teacher reported that Ratio Rancher helped her students achieve proficiency in ratios much faster than in the past. After the ratio instructional unit was complete, many students were still engaged with the game and played it outside of class time.
SetupEstablishing student accounts can be challenging in large pilots. Managing classes, logins, and assignments was initially difficult and distracting for some educators. Using a third party rostering system could alleviate this administrative burden for districts.
Additionally, school districts are often more aware of student privacy risks than product developers. At least one district challenged the product’s privacy policy at the outset of the pilot, and the company adjusted its policy and practice to comply with the district’s guidelines.
Implementation GuidanceThe two math products varied in terms of implementation complexity. While Ratio Rancher focuses on a single-skill and has a two-week implementation window, Mathspace can be used as a core instructional tool and is aligned to Common Core State Standards for grades 5-12. Mathspace implementation, therefore, was more complex than Ratio Rancher.
Educators reported that they could have benefited from additional professional learning and support from Mathspace. In particular, they would have liked to see examples of how the tool is used in other classrooms, and to become familiar with the different features in the teacher and student versions of the app. Offering more structured implementation guidance at the outset is especially important for educators who are emerging technology users.
ModificationsDigital Promise provided product developers with both formative and summative feedback
Throughout the pilot, teachers and school staff offered targeted feedback to product developers to help improve the user experience and product implementation. Developers used this feedback to make several product improvements.
Product Results

17Spring Math Pilot |
on product functionality and implementation. As a result, Mathspace reported making the following adjustments to their products and service delivery:
• User experience modifications, including handwriting recognition and revising Australian vernacular to American phrasing
• Professional learning modifications, including use cases for teachers
• Teacher platform improvements that provide more transparent student usage and scoring data
• Expanded applications, including a Spanish language version and an early years curriculum
• Formal six-month pilot process to allow districts time to try the tool before purchasing
Mathspace, in particular, reported that the pilot experience was incredibly valuable. The product company has offered to provide their tool for free to Kettle Moraine for the 2016-2017 school year, in exchange for continued monthly feedback on the product and user experience.
Rapid Cycle Pilots: Lessons Learned from Math Trials in Six Districts | 18
Articulate Instructional Need
District leaders must first articulate the problem they hope to solve using an ed-tech solution. The more specific this need is, the easier it is to determine whether a product successfully meets that need. For instance, seventh grade students at Highline Public Schools consistently scored low on standardized math test questions that required them to conceptualize ratios. District leaders wanted a way to address this problem, and help students apply ratios to the real-world. Ratio Rancher clearly aligned with this need.
Use Clear Criteria to Review Potential ProductsWhen reviewing potential products, districts must consider their IT environment, the scope of the pilot, the users’ level of experience using technology, educators’ level of interest in technology solutions, and the available funding, should the district decide to purchase the product. For instance, a Mineola School District administrator said he learned early on to, “Start [a pilot] with a class or two and make sure your infrastructure is ready to handle it. You have to make sure the wifi works for 30 [students] before you try it with 600.” Additionally, districts that engage educators in
product selection see higher levels of interest and usage of the tool. For instance, a group of teachers at Highline Public Schools reviewed the capabilities of several different math tools before recommending Ratio Rancher to district administrators. These teachers continued to be highly engaged in the pilot, and implemented the tool with fidelity.
Involve Educators in Carefully Planning for Pilot SuccessOnce a tool is selected, product developers, district stakeholders (including leaders, educators, and IT professionals), and any research support staff should discuss both the implementation and data collection plan. To start, it is important for districts and companies to articulate the goal of the pilot, and identify the type of information needed to make a purchasing decision. This decision will help determine the types of data to collect (e.g., surveys, interviews, focus groups, observations, product usage data, etc.). Then, the team can discuss implementation details, such as expectations for the tool’s usage and educator support, communication frequency and norms, and measures of success. An administrator from Mineola Public Schools praised Mathspace’s support and patience during planning. He said, “We tend to be on
Throughout this project, we facilitated conversations between product developers and educators to explore ways to make pilots more efficient. As a result, we identified the following best practices for conducting ed-tech pilots. Other districts can use these recommendations to generate meaningful evidence to support decision making.
Discussion

19Spring Math Pilot |
the cutting edge until it becomes the bleeding edge. What is most successful for us is when we find a company that is a partner, not just a salesperson who walks away.” Pilots are more successful when ed-tech companies are willing to act as thought partners during the planning phase.
Support Educators Throughout PilotBefore the pilot begins, there should be time to establish student accounts, orient educators to the tool’s features, and provide information about troubleshooting and support services. Educators in this study universally said that it was invaluable to see a tool in action prior to a pilot. A teacher in Vista Unified School District said, “I watched the tutorials, but for me it’s a lot different to be able to see other teachers and how they did things.” It is also important for educators and students to use the tool for a sufficient time period, in order to determine if it is user-friendly and effective. For example, a Kettle Moraine principal said many teachers in his pilot often forgot to use the new tool, because it was only a recommended supplement to their teaching. He plans to require teachers in future pilots to use the product for a minimum amount of time and offer ongoing support as they implement the tool. Another way to encourage consistent implementation is through weekly or biweekly check-ins (via short surveys or meetings) with educators. This also allows administrators to get a pulse on product usage and barriers to implementation.
Gather Data from All UsersRegardless of the pilot size, data should be gathered from educators, leaders, students, and the product itself to best understand user experiences and learning outcomes. Particularly for large scale pilots, it is helpful to track changes in users’ performance over time (pre-post testing), and how these changes compare to a control group of non-users. When determining how and when to gather
data, district leaders should also consider academic calendars and when other tests are administered, so students and teachers are not overburdened.
Make Decisions Based on DataDistricts can analyze pilot data to determine the extent to which the ed-tech product solved their need, and whether or not to scale up implementation. For example, Mineola teachers provided students with the option to use Mathspace or other math tools. They found that students who chose to use Mathspace were looking for enrichment, whereas struggling students preferred other apps. District leaders used this information to purchase an appropriate number of Mathspace licenses at the end of the pilot.
Discuss Purchasing Options with Product DevelopersIf districts find they need additional information prior to making a purchase, they can negotiate for a partial purchase and second round of piloting with additional users. These additional pilots often benefit product developers, too. For example, Kettle Moraine teachers provided such useful feedback that Mathspace agreed to continue the pilot into the subsequent school year so they could continue to gather user feedback. With open lines of communication, districts and product developers can reach mutually beneficial decisions.
Share Results with OthersIncreasing the amount of evidence in the ed-tech marketplace is an important goal of this work. Digital Promise will share results from pilot studies as pilot study briefs, produced by and for educators. These briefs will support district leaders searching for products that have been tested in contexts similar to their own.

Rapid Cycle Pilots: Lessons Learned from Math Trials in Six Districts | 20
As more ed-tech products enter the market, the need to generate valid and reliable findings about products will continue to grow. In order to improve supply and demand in the ed-tech marketplace, Digital Promise plans to facilitate communication among stakeholders, add product efficacy research to the marketplace, and share the results of ed-tech pilots.
Ed-tech pilots offer an opportunity for districts to gather evidence to inform purchasing decisions, and find ed-tech solutions that meet their unique needs.
Conclusion
AcknowledgementsDigital Promise acknowledges the district administrators, teachers, and students in Highline Public Schools, Kettle Moraine School District, Mineola Union Free School District, Onslow County Schools, Rowan-Salisbury Schools, and Vista Unified School District, and the cooperation of Mathspace and Ratio Rancher for their participation in this pilot project. This research would not be possible without the support of the Overdeck Family Foundation and the Research team at Digital Promise including Alyssa Belcher, Jiaming Cheng, Kelsey Gross, and Christa Simone.

Rapid Cycle Pilots: Lessons Learned from Math Trials in Six Districts | 21
Appendix A: Pilot Study Briefs
Rapid Cycle Pilots: Lessons Learned from Math Trials in Six Districts | 22
Product Info
Kettle Moraine Mathspace Pilot Study Brief
Number of Students in
Pilot
Number of Teachers in
Pilot
% Free or Reduced
Lunch
Speak English at
Home
Grade Levels in
Pilot
K-12 Students with Access to a
Device (1:1)
Students with Access to High Speed
Broadband at School
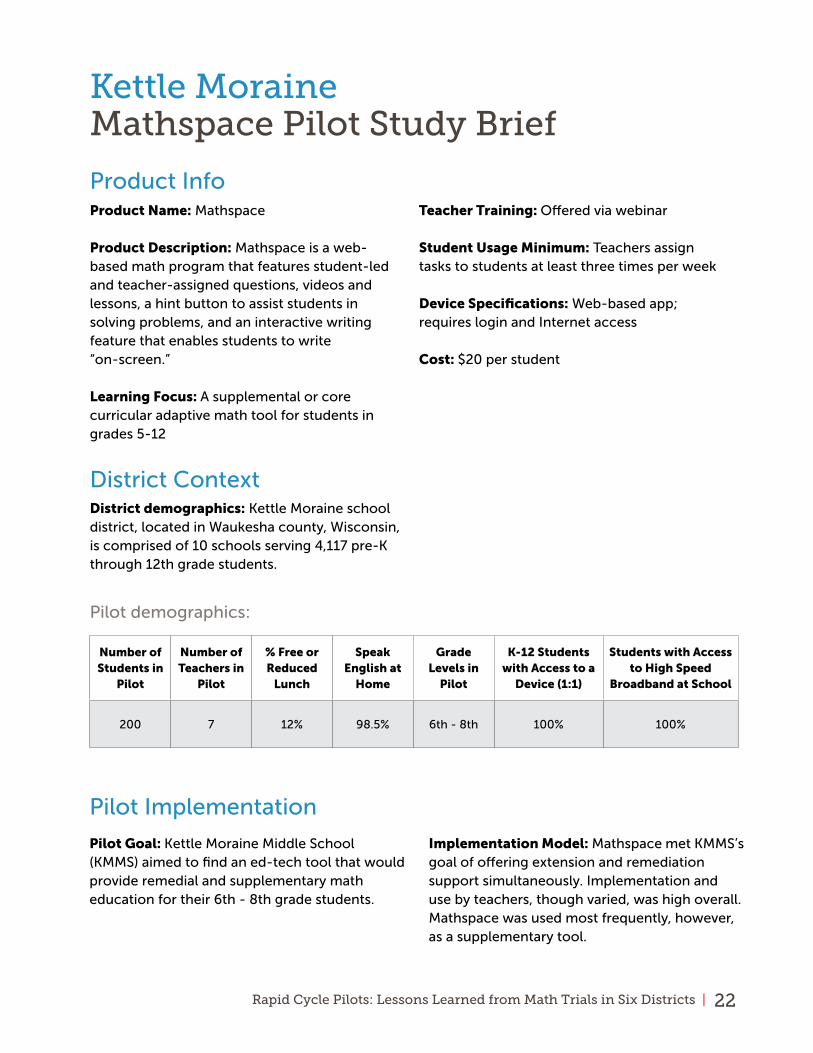
200 7 12% 98.5% 6th - 8th 100% 100%
Pilot demographics:
Product Name: Mathspace
Product Description: Mathspace is a web-based math program that features student-led and teacher-assigned questions, videos and lessons, a hint button to assist students in solving problems, and an interactive writing feature that enables students to write “on-screen.”
Learning Focus: A supplemental or core curricular adaptive math tool for students in grades 5-12
Teacher Training: Offered via webinar
Student Usage Minimum: Teachers assign tasks to students at least three times per week
Device Specifications: Web-based app; requires login and Internet access
Cost: $20 per student
District ContextDistrict demographics: Kettle Moraine school district, located in Waukesha county, Wisconsin, is comprised of 10 schools serving 4,117 pre-K through 12th grade students.
Pilot Implementation
Pilot Goal: Kettle Moraine Middle School (KMMS) aimed to find an ed-tech tool that would provide remedial and supplementary math education for their 6th - 8th grade students.
Implementation Model: Mathspace met KMMS’s goal of offering extension and remediation support simultaneously. Implementation and use by teachers, though varied, was high overall. Mathspace was used most frequently, however, as a supplementary tool.
Rapid Cycle Pilots: Lessons Learned from Math Trials in Six Districts | 23
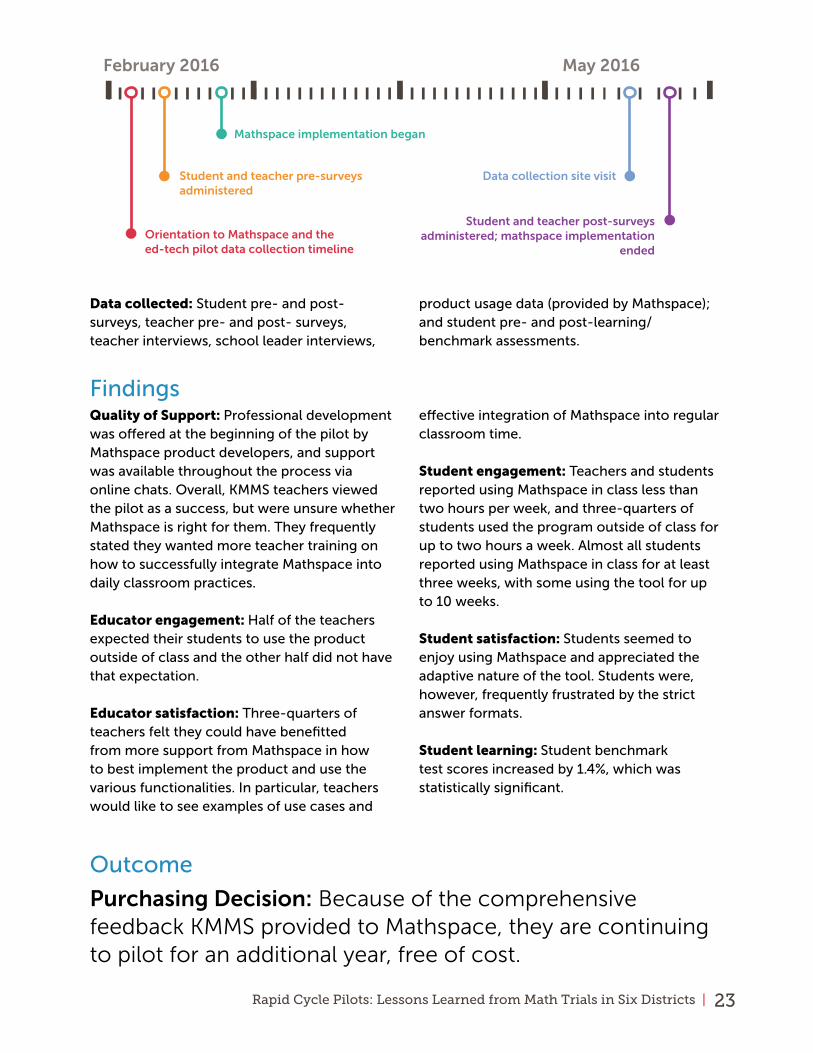
February 2016 May 2016
Orientation to Mathspace and the ed-tech pilot data collection timeline
Student and teacher pre-surveys administered
Mathspace implementation began
Data collection site visit
Student and teacher post-surveys administered; mathspace implementation
ended
Data collected: Student pre- and post- surveys, teacher pre- and post- surveys, teacher interviews, school leader interviews,
product usage data (provided by Mathspace); and student pre- and post-learning/benchmark assessments.
FindingsQuality of Support: Professional development was offered at the beginning of the pilot by Mathspace product developers, and support was available throughout the process via online chats. Overall, KMMS teachers viewed the pilot as a success, but were unsure whether Mathspace is right for them. They frequently stated they wanted more teacher training on how to successfully integrate Mathspace into daily classroom practices.
Educator engagement: Half of the teachers expected their students to use the product outside of class and the other half did not have that expectation.
Educator satisfaction: Three-quarters of teachers felt they could have benefitted from more support from Mathspace in how to best implement the product and use the various functionalities. In particular, teachers would like to see examples of use cases and
effective integration of Mathspace into regular classroom time.
Student engagement: Teachers and students reported using Mathspace in class less than two hours per week, and three-quarters of students used the program outside of class for up to two hours a week. Almost all students reported using Mathspace in class for at least three weeks, with some using the tool for up to 10 weeks.
Student satisfaction: Students seemed to enjoy using Mathspace and appreciated the adaptive nature of the tool. Students were, however, frequently frustrated by the strict answer formats.
Student learning: Student benchmark test scores increased by 1.4%, which was statistically significant.
Outcome
Purchasing Decision: Because of the comprehensive feedback KMMS provided to Mathspace, they are continuing to pilot for an additional year, free of cost.

Rapid Cycle Pilots: Lessons Learned from Math Trials in Six Districts | 24
White/Caucasian
Hispanic
Asian
African American
Multiracial or Other
White/Caucasian
Hispanic
Asian
African American
Multiracial or Other
Product Info
Mineola Mathspace Pilot Study Brief
Product Name: Mathspace
Product Description: Mathspace is a web-based math program that features student-led and teacher-assigned questions, videos and lessons, a hint button to assist students in solving problems, and an interactive writing feature that enables students to write “on-screen.”
Learning Focus: A supplemental or core curricular adaptive math tool for students in grades 5-12
Teacher Training: Offered via webinar
Student Usage Minimum: Teachers assign tasks to students at least three times per week
Device Specifications: Web-based app; requires login and Internet access
Cost: $20 per student
District Context
Mineola Union Free School District Mineola Middle School
63%63%
22% 20%
12% 12%
District demographics: Mineola Union Free School District (MUFSD) is located in Mineola County, New York and serves 2,850 students in five schools.
Pilot demographics: Mineola Middle School serves approximately 600 students in grades 5 through 7.

Rapid Cycle Pilots: Lessons Learned from Math Trials in Six Districts | 25
Number of Students in
Pilot
Number of Teachers in
Pilot
% Free or Reduced
Lunch
Speak English at
Home
Grade Levels in
Pilot
K-12 Students with Access to a Personal
School-Provided Device (1:1)
Students with Access to High
Speed Broadband at School
191 4 28% 87.1% 5th 100% 100%
Pilot Implementation
Pilot Goal: At the start of the pilot, Mineola had already purchased Mathspace and successfully implemented it in the 6th through 8th grades.
For this study, MUFSD wanted to pilot the product with 5th grade students to help them review and enrich their skills.
January 2016 February 2016 May 2016
Orientation to Mathspace and the ed-tech pilot data collection timeline
Student and teacher pre-surveys administered; Mathspace implementation began
Data collection site visit
Student and teacher post-surveys
administered
Mathspace implementation ended
Implementation Model: Teachers and students used Mathspace regularly for over six weeks. Teachers reported using Mathspace in class for 1-2 hours per week, and students were also expected to use Mathspace outside of class.
Data collected: Student pre- and post-surveys, teacher pre- and post-surveys, teacher interviews, school leader interviews, product usage data (provided by Mathspace); and student pre- and post- learning/benchmark assessments.
FindingsQuality of Support: Professional development was offered at the beginning of the pilot by Mathspace product developers and support was available throughout the process via online chats. Teachers and school leaders reported that they relied more frequently on support from colleagues, who were already familiar with and using Mathspace, than the professional development they received.
Educator engagement: In general, teachers assigned more custom tasks than adaptive tasks in Mathspace. Because custom tasks require more time to create, this indicates that teachers were consistently and actively engaged.
Educator satisfaction: Teachers were overwhelmingly positive about Mathspace.

Rapid Cycle Pilots: Lessons Learned from Math Trials in Six Districts | 26
In particular, they praised Mathspace-generated reports for giving them greater insight into their students’ performance and math understanding.
Student engagement: Despite some challenges, 70% of students found Mathspace easy to use and completed assigned adaptive tasks at a rate of 100%.
Student satisfaction: Students were generally satisfied with Mathspace, and particularly enjoyed the ability to work at their own pace.
Student learning: Students had a statistically significant 17% increase in test scores from the beginning to the end of the pilot.
Outcome
Purchasing Decision: After the pilot, MUFSD adopted Mathspace for 5th grade students. The district also continues to use the tool with 6th-8th grade students, and is now piloting a beta version with 4th grade students.

Rapid Cycle Pilots: Lessons Learned from Math Trials in Six Districts | 27
Onslow Mathspace Pilot Study Brief
White/Caucasian
African American
Hispanic
Multiracial
Asian
American Indian or Pacific Islander
Product InfoProduct Name: Mathspace
Product Description: Mathspace is a web-based math program that features student-led and teacher-assigned questions, videos and lessons, a hint button to assist students in solving problems, and an interactive writing feature that enables students to write “on-screen.”
Learning Focus: A supplemental or core curricular adaptive math tool for students in grades 5-12
Teacher Training: Offered via webinar
Student Usage Minimum: Teachers assign tasks to students at least three times per week
Device Specifications: Web-based app; requires login and Internet access
Cost: $20 per student
District Context
Onslow County School System Dixon Middle School
58% 77%
19%
9%
8%
13%
8%4%
District demographics: Onslow County School System, located on the eastern coast of North Carolina, is comprised of 37 educational facilities, serving approximately 26,000 students.
Pilot demographics: Dixon Middle School serves approximately 653 students in grades 6 through 8.
White/Caucasian
African American
Hispanic
Multiracial
Asian
American Indian or Pacific Islander

Rapid Cycle Pilots: Lessons Learned from Math Trials in Six Districts | 28
Number of Students in
Pilot
Number of Teachers in
Pilot
% Free or Reduced
Lunch
Speak English at
Home
Grade Levels in
Pilot
K-12 Students with Access to a Device
(1:1)
Students with Access to High
Speed Broadband at School
203 2 43.1% 97.8% 7th 42% 100%
Pilot Implementation
Pilot Goal: The initial goal was to improve students’ mathematics understanding by implementing a standards-based mathematics technology tool. The goal may have shifted
over the course of the pilot, however, as various teachers and school-level administrators described the goal in different ways.
February 2016 April 2016 May 2016 June 2016
Orientation to Mathspace and the ed-tech pilot data collection timeline
Student and teacher pre-surveys administered
Mathspace implementation began
Data collection site visit
Student and teacher post-surveys administered
Mathspace implementation ended
Implementation Model: Student-reported Mathspace use varied considerably, but in general there was limited use of the product, both in and outside of class. Despite the option to create custom and adaptive tasks, teachers only assigned eight custom tasks over the course of the pilot.
Data collected: Student pre- and post- surveys, teacher pre- and post- surveys, teacher interviews, school leader interviews, product usage data (provided by Mathspace); and student pre- and post- learning/benchmark assessments.
Findings
Quality of Support: Teachers involved in the pilot had little buy-in or autonomy in the process, and received limited training. As a result the tool’s instructional and data-
analysis features were not utilized. Teachers were frequently frustrated by the lack of administrator support.

Rapid Cycle Pilots: Lessons Learned from Math Trials in Six Districts | 29
Educator engagement: Onslow teachers noted positive changes in student attitude and behavior, but were largely skeptical of Mathspace as an instructional tool because they felt it was not well-aligned to their curriculum.
Educator satisfaction: Teachers felt there was an inadequate amount of support in learning the features of Mathspace, and how to best integrate it into their instruction.
Student engagement: Onslow students who already felt secure about math learning enjoyed using the product for the extra
practice and rigor it offered, whereas it left less confident students feeling frustrated.
Student satisfaction: While students had positive feedback about Mathspace, they frequently reported disliking their teachers’ use of the tool.
Student learning: Student benchmark scores decreased over the period of the pilot; these results were not, however, statistically significant.
Outcome
Purchasing Decision: Onslow decided not to adopt Mathspace because of low student and teacher satisfaction, and because student assessment scores decreased.
Rapid Cycle Pilots: Lessons Learned from Math Trials in Six Districts | 30
Rowan Salisbury Mathspace Pilot Study Brief
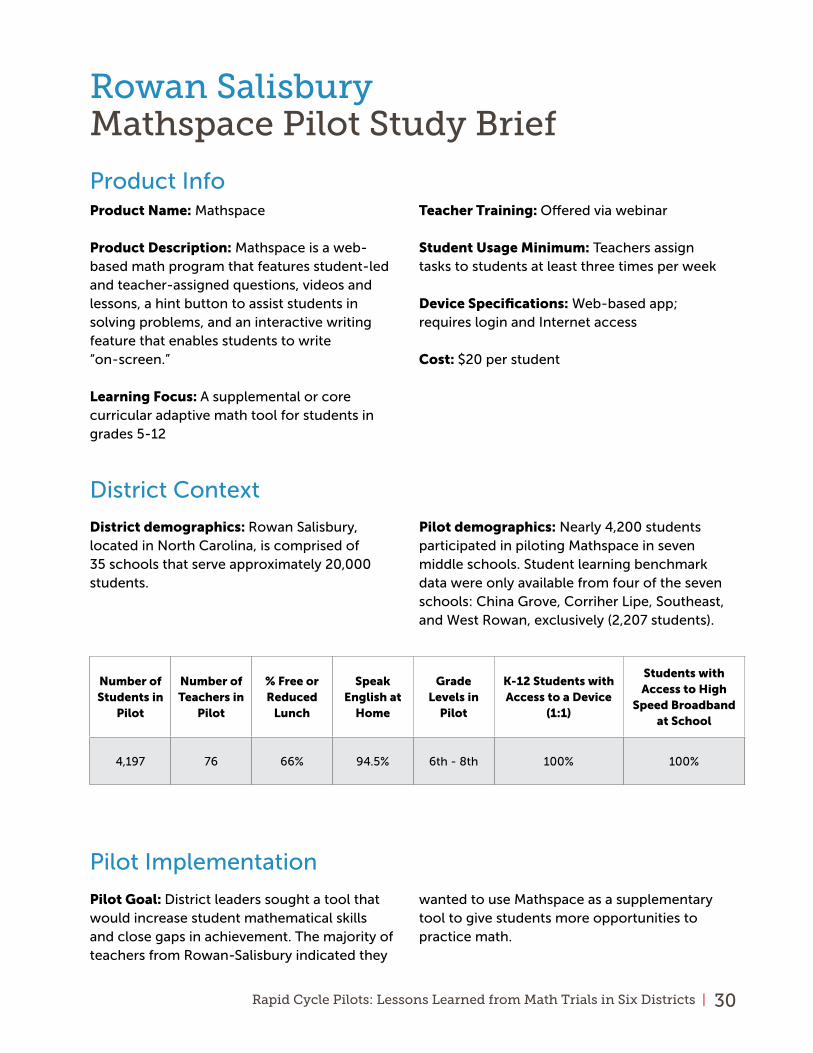
Product InfoProduct Name: Mathspace
Product Description: Mathspace is a web-based math program that features student-led and teacher-assigned questions, videos and lessons, a hint button to assist students in solving problems, and an interactive writing feature that enables students to write “on-screen.”
Learning Focus: A supplemental or core curricular adaptive math tool for students in grades 5-12
Teacher Training: Offered via webinar
Student Usage Minimum: Teachers assign tasks to students at least three times per week
Device Specifications: Web-based app; requires login and Internet access
Cost: $20 per student
District Context
District demographics: Rowan Salisbury, located in North Carolina, is comprised of 35 schools that serve approximately 20,000 students.
Pilot demographics: Nearly 4,200 students participated in piloting Mathspace in seven middle schools. Student learning benchmark data were only available from four of the seven schools: China Grove, Corriher Lipe, Southeast, and West Rowan, exclusively (2,207 students).
Number of Students in
Pilot
Number of Teachers in
Pilot
% Free or Reduced
Lunch
Speak English at
Home
Grade Levels in
Pilot
K-12 Students with Access to a Device
(1:1)
Students with Access to High
Speed Broadband at School
4,197 76 66% 94.5% 6th - 8th 100% 100%
Pilot Implementation
Pilot Goal: District leaders sought a tool that would increase student mathematical skills and close gaps in achievement. The majority of teachers from Rowan-Salisbury indicated they
wanted to use Mathspace as a supplementary tool to give students more opportunities to practice math.

Rapid Cycle Pilots: Lessons Learned from Math Trials in Six Districts | 31
February 2016 May 2016April 2016
Orientation to Mathspace and the ed-tech pilot data collection timeline
Student and teacher pre-surveys administered
Mathspace implementation began
Data collection site visit
Student and teacher post-surveys administered
Mathspace implementation ended
Implementation Model: Mathspace implementation in Rowan Salisbury varied dramatically across schools and classrooms, but the majority of pilot teachers did not meet the product developer’s recommended implementation threshold.
Data collected: Student pre- and post-surveys, teacher pre- and post-surveys, teacher interviews, school leader interviews, product usage data (provided by Mathspace), and student pre- and post- learning/benchmark assessments.
FindingsQuality of Support: Mathspace offered initial professional development to Rowan Salisbury school-based technology facilitators, and support was available throughout the pilot via online chats. Technology facilitators then trained teachers in how to use the tool. Many teachers felt they could benefit from additional professional support in integrating Mathspace into their practice as a supplementary learning tool.
Educator engagement: Of the teachers who used Mathspace, feedback was overwhelmingly positive.
Educator satisfaction: Teachers from Rowan Salisbury felt that Mathspace met their expectations by providing individualized student feedback, which allowed them to use the product as a supplementary tool.
Student engagement: Highly engaged and motivated students had very positive feedback about Mathspace, but those who lacked motivation and confidence in math were discouraged by the format of the problems and the rigorous content.
Student satisfaction: Classroom implementation models that focused on differentiating instruction and allowed students opportunities to collaborate with each other yielded the most positive student feedback.

Rapid Cycle Pilots: Lessons Learned from Math Trials in Six Districts | 32
District Change in Benchmark Data
Rowan Salisbury - China Grove 0.9% increase
Rowan Salisbury - Corriher Lipe No change
Rowan Salisbury - Southeast 0.5% increase (statistically significant)
Rowan Salisbury - West Rowan 0.2% decrease
Outcome
Purchasing Decision: Rowan Salisbury chose to purchase Mathspace for district-wide use, largely because of the quality support they received from Mathspace and positive student and teacher feedback.
Student learning:

Rapid Cycle Pilots: Lessons Learned from Math Trials in Six Districts | 33
Vista Mathspace Pilot Study Brief
Hispanic
White/Caucasian
Asian, Filipino, or Pacific Islander
African American
Multiracial
Hispanic
White/Caucasian
Asian, Filipino, or Pacific Islander
African American
Multiracial
Product InfoProduct Name: Mathspace
Product Description: Mathspace is a web-based math program that features student-led and teacher-assigned questions, videos and lessons, a hint button to assist students in solving problems, and an interactive writing feature that enables students to write “on-screen.”
Learning Focus: A supplemental or core curricular adaptive math tool for students in grades 5-12
Teacher Training: Offered via webinar
Student Usage Minimum: Teachers assign tasks to students at least three times per week
Device Specifications: Web-based app; requires login and Internet access
Cost: $20 per student
District Context
Vista Unified School District Rancho Minerva Middle School
60% 87%
28%
7%5%
4%
District demographics: Vista Unified School District (VUSD) is one of San Diego (California) County’s largest school districts, with 29 schools and approximately 1,100 teachers serving more than 22,000 students between pre-K and 12th grades.
Pilot demographics: Rancho Minerva Middle School (RMMS) is one of five middle schools within VUSD. It serves approximately 900 students in grades 6 through 8.

Rapid Cycle Pilots: Lessons Learned from Math Trials in Six Districts | 34
Number of Students in
Pilot
Number of Teachers in
Pilot
Eligible for Free or Reduced
Lunch
Speak English at
Home
Grade Levels in
Pilot
K-12 Students with Access to a Device
(1:1)
Students with Access to High
Speed Broadband at School
264 10 87% 55.2% 6th - 8th 60% 100%
Pilot Implementation
Pilot Goal: RMMS teachers had two main goals for piloting Mathspace: to change students’ attitudes towards math, and to give students the opportunity to practice their math skills.
January 2016 February 2016 May 2016
Orientation to Mathspace and the ed-tech pilot data collection timeline
Student and teacher pre-surveys administered
Mathspace implementation began
Data collection site visit
Student and teacher post-surveys administered
Mathspace implementation ended
Implementation varied by teacher subject area expertise (Mathspace was used by math and non-math teachers), and by the amount and type of tasks assigned. In addition, most teachers used Mathspace in an after-school intervention program as opposed to during regular class time.
Data collected: Student pre- and post-surveys, teacher pre- and post-surveys, teacher interviews, school leader interviews, product usage data (provided by Mathspace), and student pre- and post- learning/benchmark assessments.

Rapid Cycle Pilots: Lessons Learned from Math Trials in Six Districts | 35
Quality of Support: Mathspace offered initial professional development, and then support was available throughout the pilot via online chats.
Educator engagement: Teachers’ self-reported frequency and duration of product use ranged from less than one week to more than six weeks. Teachers assigned more tasks in the classroom context than in after school interventions.
Educator satisfaction: Teachers felt they could have received more comprehensive professional development in using Mathspace. Inconsistency in teacher use within the district, combined with “pilot fatigue” from
participating in multiple pilots, likely added to teachers’ negative perceptions. Student engagement: The majority of students who used the tool in-class reported much longer use (six weeks or more) than students who used it as an intervention (three weeks or less).
Student satisfaction: Most students (77%) found Mathspace easy and enjoyable to use.
Student learning: While there was a statistically significant decrease in students’ self-reported understanding of what they were being taught in math class, there was a statistically significant 17% increase in students’ benchmark test scores.
Outcome
Purchasing Decision: Vista chose not to purchase Mathspace because they wanted to redesign their intervention program. In addition, Mathspace was not easy for non-math teachers to use, and did not engage struggling students as well as other options.
Findings
Rapid Cycle Pilots: Lessons Learned from Math Trials in Six Districts | 36
Highline Ratio Rancher Pilot Study Brief
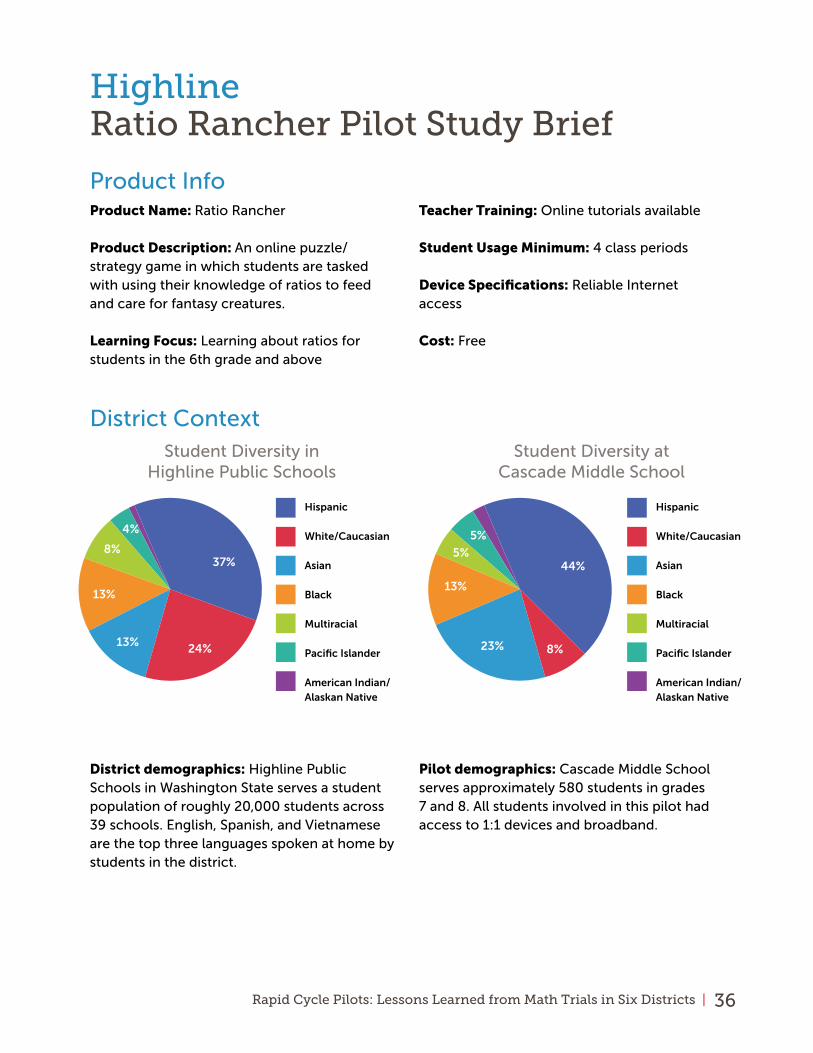
Product InfoProduct Name: Ratio Rancher
Product Description: An online puzzle/strategy game in which students are tasked with using their knowledge of ratios to feed and care for fantasy creatures.
Learning Focus: Learning about ratios for students in the 6th grade and above
Teacher Training: Online tutorials available
Student Usage Minimum: 4 class periods
Device Specifications: Reliable Internet access
Cost: Free
District ContextStudent Diversity in
Highline Public SchoolsStudent Diversity at
Cascade Middle School
37% 44%
8%23%
13%
24%
5%
5%
13%
13%
8%
4%
District demographics: Highline Public Schools in Washington State serves a student population of roughly 20,000 students across 39 schools. English, Spanish, and Vietnamese are the top three languages spoken at home by students in the district.
Pilot demographics: Cascade Middle School serves approximately 580 students in grades 7 and 8. All students involved in this pilot had access to 1:1 devices and broadband.
Hispanic
White/Caucasian
Asian
Black
Multiracial
Pacific Islander
American Indian/ Alaskan Native
Hispanic
White/Caucasian
Asian
Black
Multiracial
Pacific Islander
American Indian/ Alaskan Native

Rapid Cycle Pilots: Lessons Learned from Math Trials in Six Districts | 37
Number of Students in
Pilot
Number of Teachers in
Pilot
% Free or Reduced
Lunch
Speak English at
Home
Grade Levels in
Pilot
K-12 Students with Access to a Device
(1:1)
Students with Access to High
Speed Broadband at School
76 3 59.5% 75% 7th 12% 75%
Pilot Implementation
Pilot Goal: To strengthen students’ understanding of ratios as applied to real-world situations.
February 2016 March 2016
Orientation to Ratio Rancher and the ed-tech pilot data collection timeline
Ratio Rancher implementation
began
Data collection site visit
Student and teacher post-surveys administered; Ratio Rancher
implementation ended
Implementation Model: Most students used Ratio Rancher in class for about two hours each week, for 3-6 weeks. They did not use Ratio Rancher outside of class.
Data collected: Student pre- and post-surveys, teacher pre- and post-surveys, teacher interviews, school leader interviews, product usage data (provided by Ratio Rancher), and student pre- and post-learning/benchmark assessments.
FindingsQuality of Support: Students and teachers said they would have benefitted from more support and guidance on how to optimize the use of the tool.
Educator engagement: Teachers used Ratio Rancher in a variety of ways, including regular
classroom use, as a supplementary review, and as an optional homework assignment.
Educator satisfaction: Teachers were pleased by the results of the pilot.

Rapid Cycle Pilots: Lessons Learned from Math Trials in Six Districts | 38
Minimum Maximum Mean
Total number of games played 2 153 26
Number of bonus games played 1 29 4
Number of challenges failed 0 29 6
Number of challenges completed 1 96 15
Average time spent per game (in minutes) 14 240 43
Student engagement:
Student satisfaction: Students enjoyed using Ratio Rancher because it was graphically pleasing, competitive, applied to a real-world situation, and made learning new math skills fun. Further, the majority of students found the product easy to use.
Student learning: Students that piloted Ratio Rancher were compared to a control group that did not use the tool. Pilot participants had statistically significant higher scores on the ratio and proportions section of a Common Core State Standards benchmark assessment.
Outcome
Purchasing Decision: Highline chose to expand the use of Ratio Rancher beyond the pilot group in the 2016-2017 school year.