rapid development of non-alcoholic steatohepatitis in
TRANSCRIPT

Rapid Development of Non-Alcoholic Steatohepatitis inPsammomys obesus (Israeli Sand Rat)Briana Spolding1*, Timothy Connor1, Carrie Wittmer2, Lelia L. F. Abreu1, Antony Kaspi3, Mark Ziemann3,
Gunveen Kaur4, Adrian Cooper1, Shona Morrison1, Scott Lee1, Andrew Sinclair1, Yann Gibert1,
James L. Trevaskis2, Jonathon D. Roth2, Assam El-Osta3, Richard Standish1, Ken Walder1
1 Metabolic Research Unit, School of Medicine, Deakin University, Geelong, Victoria, Australia, 2 Amylin Pharmaceuticals, LLC., San Diego, California, United States of
America, 3 Baker IDI Heart and Diabetes Institute, Melbourne, Victoria, Australia, 4 Institute of Sport, Exercise and Active Living (ISEAL), Victoria University, Melbourne,
Victoria, Australia
Abstract
Background and Aims: A major impediment to establishing new treatments for non-alcoholic steatohepatitis is the lack ofsuitable animal models that accurately mimic the biochemical and metabolic characteristics of the disease. The aim of thisstudy was to explore a unique polygenic animal model of metabolic disease as a model of non-alcoholic steatohepatitis bydetermining the effects of 2% dietary cholesterol supplementation on metabolic and liver endpoints in Psammomys obesus(Israeli sand rat).
Methods: P. obesus were provided ad libitum access to either a standard rodent diet (20% kcal/fat) or a standard rodent dietsupplemented with 2% cholesterol (w/w) for 4 weeks. Histological sections of liver from animals on both diets wereexamined for key features of non-alcoholic steatohepatitis. The expression levels of key genes involved in hepatic lipidmetabolism were measured by real-time PCR.
Results: P. obesus fed a cholesterol-supplemented diet exhibited profound hepatomegaly and steatosis, and higher plasmatransaminase levels. Histological analysis identified extensive steatosis, inflammation, hepatocyte injury and fibrosis. Hepaticgene expression profiling revealed decreased expression of genes involved in delivery and uptake of lipids, and fatty acidand triglyceride synthesis, and increased expression of genes involved in very low density lipoprotein cholesterol synthesis,triglyceride and cholesterol export.
Conclusions: P. obesus rapidly develop non-alcoholic steatohepatitis when fed a cholesterol-supplemented diet thatappears to be histologically and mechanistically similar to patients.
Citation: Spolding B, Connor T, Wittmer C, Abreu LLF, Kaspi A, et al. (2014) Rapid Development of Non-Alcoholic Steatohepatitis in Psammomys obesus (IsraeliSand Rat). PLoS ONE 9(3): e92656. doi:10.1371/journal.pone.0092656
Editor: Jean-Marc A. Lobaccaro, Clermont Universite, France
Received May 23, 2013; Accepted February 26, 2014; Published March 20, 2014
Copyright: � 2014 Spolding et al. This is an open-access article distributed under the terms of the Creative Commons Attribution License, which permitsunrestricted use, distribution, and reproduction in any medium, provided the original author and source are credited.
Funding: This research was supported in part by Amylin Pharmaceuticals, Inc., San Diego, USA, and in part by the Deakin University Molecular and MedicalResearch Strategic Research Centre. The funders had no role in study design, data collection and analysis, decision to publish, or preparation of the manuscript.
Competing Interests: The authors wish to declare that CW, JLT and JDR were employed by Amylin Pharmaceuticals while this study was conducted. This doesnot alter the authors’ adherence to all the PLOS ONE policies on sharing data and materials.
* E-mail: [email protected]
Introduction
Non-alcoholic fatty liver disease (NAFLD) is the world’s most
common form of chronic liver disease, and affects approximately
75% of patients with obesity and type 2 diabetes [1]. The presence
of NAFLD worsens outcomes in these patients, as it exacerbates
diabetes, and can lead to cirrhosis and liver cancer [2]. It is
estimated that approximately 20% of NAFLD patients will go on
to develop non-alcoholic steatohepatitis (NASH), and approxi-
mately 20% of NASH patients will progress to life-threatening
cirrhosis [3]. The presence of NASH in human patients is
confirmed by key histological features including steatosis, inflam-
mation, hepatocyte injury, and fibrosis [4,5].
Current management of NASH generally focuses on weight loss
and treatment of co-morbidities (such as insulin resistance [6]). A
major impediment to establishing and characterising new treat-
ments for NASH is the lack of suitable animal models that
accurately mimic the biochemical and metabolic characteristics of
NASH in human patients [7]. Current animal models of NAFLD
or NASH can be broadly categorised as either dietary-induced or
genetic. The most widely used dietary-based model is rodents fed a
methionine- and choline-deficient (MCD) diet high in sucrose and
fat, resulting in the prevention of hepatic b-oxidation and
impaired production of very low density lipoprotein (VLDL). This
leads to the accumulation of intrahepatic lipid, fibrosis and
decreased VLDL synthesis. However, the MCD diet is associated
with considerable weight loss and toxicity [7,8]. Additionally, the
metabolic profile of animals fed this diet includes decreased plasma
insulin and glucose levels, in contrast to the metabolic profile
observed in the majority of human patients with NAFLD/NASH
[7,8]. Db/db mice, which have a mutated leptin receptor gene, are
a widely used genetic model of NAFLD. These animals develop
obesity, insulin resistance, diabetes and hepatic steatosis, however
PLOS ONE | www.plosone.org 1 March 2014 | Volume 9 | Issue 3 | e92656
brought to you by COREView metadata, citation and similar papers at core.ac.uk
provided by Victoria University Eprints Repository

only progress to NASH following additional intervention such as
exposure to the MCD diet [9]. Although some of these animal
models are useful for investigation into particular aspects of human
NAFLD/NASH, none display all of the histological characteristics
present in the human disease state and in the context of metabolic
disease.
Psammomys obesus (Israeli sand rat) is a gerbil that is a unique
animal model of the Metabolic Syndrome. In its native desert
environment, P. obesus remain lean and healthy. However, when
housed under laboratory conditions and fed a standard rodent diet
(20% kcal/fat), a proportion of P. obesus become obese and type 2
diabetic, while others remain lean and healthy [10–14]. Previous
studies have shown P. obesus to be susceptible to steatosis when fed
a standard rodent diet with added fibre (30% wheat straw),
however key features of human NASH such as fibrosis, hepatocyte
injury and inflammation were absent [15]. The majority of
previously reported rodent models of NAFLD/NASH utilize diets
high in fat and/or supplemented with cholesterol. As P. obesus will
not consume highly palatable energy-rich diets, we tested whether
NASH could be induced in P. obesus via addition of cholesterol (2%
w/w) to their standard rodent diet (20% kcal/fat). In this study we
show that dietary cholesterol supplementation for 4 weeks induces
NASH in P. obesus with a profile similar to that seen in patients.
Materials and Methods
Ethics StatementAnimals were maintained in accordance with the Code of
Practice of the National Health and Medical Research Council of
Australia, and all procedures were carried out subject to the
approval of the Deakin University Animal Ethics Committee
(permit number A59-2010). All efforts were made to minimise
animal suffering.
Experimental animalsA colony of outbred P. obesus is maintained at Deakin
University, Geelong, Australia. All animals were housed in a
temperature-controlled room (2261uC) with a 12–12 h light-dark
cycle (light 06:00–18:00 h).
Male animals aged 8–10 weeks were randomly allocated to the
following groups: 1) Standard diet (20% kcal/fat, 0% cholesterol;
n = 8), or 2) Cholesterol-supplemented diet (20% kcal/fat, 2%
cholesterol (w/w); n = 9). Both diets contained 16% kcal/protein
and 64% kcal/carbohydrate, and had total digestible energy of
15 MJ/kg. The source of fat for both diets was mixed vegetable
oils. There was no difference in % fatty acid profile or total
digestible energy between the two diets. All animals were allowed
to consume their respective diet ad libitum for 4 weeks. Food intake
was measured weekly by rate of disappearance, and body weight
was measured weekly.
Histological and biochemical analyses of liver tissueAnimals were humanely killed and 1 g of liver tissue (left lobe)
was removed and fixed in 10% neutral-buffered formalin. The
liver tissue was paraffin-embedded, sectioned (5 mM), mounted
and stained with hematoxylin and eosin, or Masson trichrome
stain (Sigma-Aldrich, St Louis, MO) to visualise fibrosis. All
histological analyses were conducted by a pathologist blinded to
the treatment conditions.
Pictures of Masson trichrome stained liver sections were taken
on an Axioskop 2 microscope (Zeiss; magnification 200x) and
collagen content was quantitated using ImageJ software (NIH). For
each animal, 10 fields per liver section were selected randomly and
blue staining (representing collagen) was highlighted. The area of
staining was measured as number of pixels per picture and the
data collated to give a mean area of staining per field for each
animal in the study.
An additional portion of the liver (right lobe) was used to
measure lipid content. Lipid was extracted using a modified Folch
protocol [16]. The tissue was homogenised in 2:1 chloroform/
methanol solution (10 ml), and filtered. An additional 5 ml of 2:1
chloroform/methanol solution was added, followed by 2.5 ml of
0.9% NaCl. After mixing, the extract was centrifuged for 5 min at
2 000 g at 10uC. After discarding the aqueous layer, the organic
layer was dried under nitrogen, and total lipid content assessed by
weighing.
To assess the types of lipid present, a 1 g portion of the liver
(right lobe) was minced and lipids extracted essentially as
previously described [17]. The lipid extract was reconstituted in
200 ml of dichloromethane and the lipids were then separated by
thin layer chromatography. The lipid extracts were spotted onto
silica gel plates (Silica gel 60 G, Merck, Germany) and developed
in 85:15:2 (v/v) petroleum ether: diethylether: acetic acid in paper-
lined tanks. The lipids were visualised under ultraviolet light after
reacting with 0.1% (w/v) 29,79 –dichlorofluroescein indicator in
ethanol (Scharlau, Spain).
Plasma enzyme and metabolite analysesBlood glucose was measured on days 0 and 28 using a
glucometer (Accuchek II; Roche, Castle Hill, Australia). Plasma
triglyceride, total cholesterol, HDL-cholesterol, ALT and AST
levels were measured using an Olympus AU400e Bioanalyzer
(Olympus America Diagnostics, Center Valley, PA). Plasma
insulin concentration was measured using an ultra-sensitive ELISA
kit (Crystal Chem Inc, Downers Grove, IL, USA).
RNA Extraction and Gene Expression AnalysisTotal RNA was extracted from 100 mg of liver tissue using
TRIzol (Invitrogen Life Technologies, Carlsbad, USA) and
RNeasy columns (Qiagen, Hilden, Germany). Quality and
concentration of mRNA was established using RNA 6000 Nano
Assay on a Bioanalyser (Agilent Technologies, USA), and cDNA
was generated from total RNA using Superscript First-Strand
Synthesis System for RT-PCR (Invitrogen). Gene expression levels
were measured using FastStart Universal SYBR Green Master
(Roche Australia) on a Mx3005P cycler (Stratagene), and
normalised to cyclophilin. RT-PCR primer sequences are listed
in Table 1.
Statistical AnalysisData distribution was tested for normality using a Kolmogorov-
Smirnov test. Group mean differences were assessed using
Student’s unpaired t-test (for normally distributed data) or
Mann-Whitney U-test. Correlation between continuous variables
was assessed using Pearson (for normally distributed data) or
Spearman rho tests as appropriate. All analyses were performed
using Statistical Package for the Social Sciences software (SPSS
version 20; USA). Data were considered statistically significant at
p,0.05.
Results
We evaluated the effects of feeding lean, non-diabetic P. obesus a
standard rodent diet (20% kcal/fat) supplemented with 2%
cholesterol for 4 weeks. There was no difference in food intake
between the groups (standard diet 5263 v. cholesterol-supple-
mented diet 4763 g/kg/d, p = 0.26). The mean body weight of
the two groups was not different at the start or end of the study,
NASH in Psammomys obesus
PLOS ONE | www.plosone.org 2 March 2014 | Volume 9 | Issue 3 | e92656

and body weight gain in the two groups was similar (standard diet
+41.064.1 v. cholesterol-supplemented diet +36.163.7 g,
p = 0.40). Blood glucose levels increased marginally in the
standard diet group (+0.560.2 mmol/L, p = 0.04) and decreased
slightly in the cholesterol-supplemented group (20.460.1 mmol/
L, p = 0.03). However, these changes are considered minor since
all animals in the study remained normoglycemic (range 3.2–
5.1 mmol/L).
Visual examination of livers at necropsy revealed grossly
enlarged and pale livers in the animals fed the cholesterol-
supplemented diet, and these livers had a firm, rubbery texture
(Fig. 1A,B.). Liver weights were significantly greater in animals fed
the cholesterol-supplemented diet (p,0.001, Fig. 1C.). Corre-
spondingly, liver lipid levels were also markedly elevated
(p,0.001, Fig. 1D.). Thin layer chromatography analysis showed
that the lipid species present in the liver were predominantly
triglycerides and, in the case of the animals fed the cholesterol-
supplemented diet, cholesterol esters (Fig. 2.).
Hepatocyte injury and impaired liver function were also
apparent, with plasma ALT and AST activity significantly
elevated in the animals fed the cholesterol-supplemented diet
(p = 0.02 and p = 0.03, respectively, Fig. 1E.). Plasma total
cholesterol levels were 4-fold higher in the animals fed the
cholesterol-supplemented diet (1141618 v. 2796165 mg/dL,
p = 0.003), while HDL cholesterol levels were reduced by 37%
(4266 v. 6765 mg/dL, p = 0.014). There was no difference in
plasma triglycerides between the groups (74630 v. 97632 mg/
dL, p = 0.62).
Liver sections from animals on both diets were examined for
histological features of NASH (Fig. 3.). Blinded histopathological
analysis confirmed the presence of steatosis, inflammation,
hepatocyte injury and fibrosis in the cholesterol-supplemented
group. Steatosis was marked, with abundant large and small lipid
droplets (Fig. 3B,D.). Inflammation was demonstrated by the
presence of neutrophil-containing parenchymal inflammatory foci
(Fig. 3C.), and in addition sinusoidal foamy macrophages were
seen in some livers (Fig. 3B.). This was supported by greater
mRNA expression of proinflammatory markers including CD68,
interleukin 1 beta (IL1B), chemokine (C-C motif) ligand 2 (CCL2) and egf-
like module containing, mucin-like, hormone receptor-like 1 (EMR1) (Fig. 4,
p,0.05 for each gene). Hepatocyte injury was noted, including
focal necrosis in some cases, and there was architectural disruption
including fibrous expansion of portal tracts, early septum
formation, and both pericellular and perisinusoidal fibrosis
(Fig. 3D,E,F.). This fibrosis was reflected by markedly higher
collagen 1 alpha (COL1A1), actin, alpha 2, smooth muscle, aorta (ACTA2)
and transforming growth factor, beta 1 (TGFB1) gene expression (Fig. 4,
p,0.05 for each gene). Collagen content was 30-fold increased in
the cholesterol-supplemented group compared with controls as
assessed by quantitative imaging (1175665859 vs. 3786224 pixels
per field, p,0.002).
NAFLD activity scores were calculated based on the method of
Kleiner and Brunt [18]. The overall scores were 4.460.5 in the
cholesterol-supplemented group and 1.860.4 in the control group
(p,0.001). Scores were significantly different for steatosis (2.360.3
vs. 1.360.2, p = 0.007) and inflammation (2.160.4 vs. 0.560.3,
p = 0.003). Histologically, P. obesus showed the key features of
NASH after only 4 weeks of dietary cholesterol supplementation.
The effect on the liver by simply adding cholesterol to the diet
(without increasing dietary fat content) was profound in P. obesus
compared with effects seen previously in other rodents, suggesting
increased susceptibility to NASH in these animals. Therefore, we
profiled the hepatic expression of key genes involved in lipid
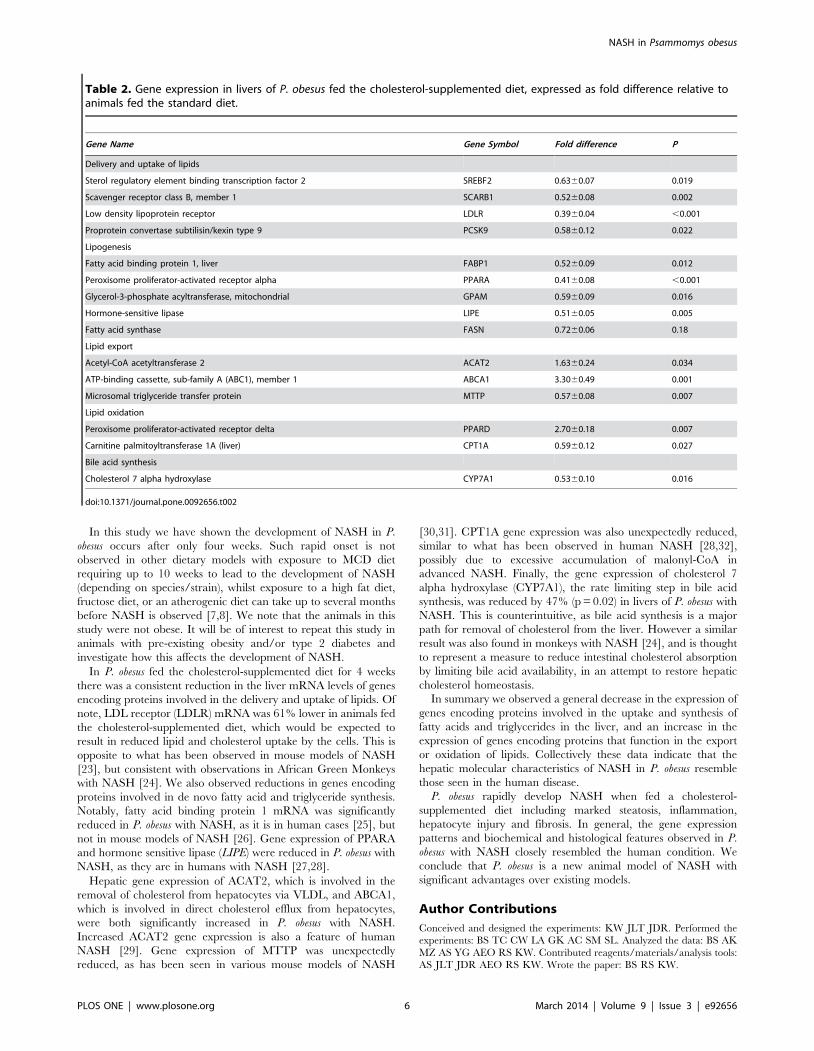
metabolism in P. obesus fed the two diets. Expression of genes
involved in delivery and uptake of lipids were consistently lower in
the cholesterol-supplemented group (SREBF2 237%, p = 0.019;
SCARB1 248%, p = 0.002; LDLR 261%, p,0.001; PCSK9
250%, p = 0.022; Table 2), while genes involved in fatty acid
and triglyceride synthesis were also lower in the cholesterol-
supplemented group (FABP1 248%, p = 0.012; PPARA 259%,
p,0.001; GPAM 241%, p = 0.016; LIPE 249%, p = 0.005;
Table 2). In general, genes encoding proteins involved in VLDL
synthesis, triglyceride and cholesterol export from the cells were
higher in the cholesterol-supplemented group (ACAT2 +63%,
p = 0.034; ABCA1 +230%, p = 0.001; Table 2), however expression
of MTTP was unexpectedly lower (243%, p = 0.007). PPARD gene
expression was increased (+170%, p = 0.007), presumably to
increase transcription of genes involved in fatty acid oxidation,
however CPT1A mRNA was decreased (241%, p = 0.027).
Finally, the expression of cholesterol 7 alpha hydroxylase
(CYP7A1), the rate-limiting step in bile acid synthesis, was reduced
in livers of P. obesus fed the cholesterol-supplemented diet (247%,
p = 0.016).
Discussion
Here we have shown that P. obesus exhibit key features of NASH
when exposed to a cholesterol-supplemented diet. Four weeks of
dietary cholesterol supplementation resulted in these animals
displaying extensive steatosis, inflammation, hepatocyte injury and
fibrosis. These histological phenotypes closely resemble the NASH
disease profile observed in human patients. Additionally, hepatic
Table 1. PCR primer sequences.
Gene Forward primer (59-39) Reverse primer (59-39)
CD68 ggacagcttacctttggattcaa ctgtgggaaggacacattgtattc
IL1B atcagcacttcccaagcaga agagacggattccaaggtga
CCL2 catagcggtcactccgacag catgcacctgcagctaatgc
EMR1 gcaagatcctcagtgcgtct gcataccagggagatgaccg
COL1A1 ggtgacaagggtgagacag agagggaccttgttcacc
ACTA2 cttggggttcagtggtgctt tccaatcgaacacggaatcatc
TGFB1 aaagccctgtatgccgtctc cagcaacaattcctggcgtt
SREBF2 ctccgcagacgaggatcatccag cagggctgccatctgtgttcag
SCARB1 gtctacagggagttcagaca taggcagtacaatgtagtcac
LDLR tgacgggctggcggtagact cccaatctgtccagtacatgaagcc
PCSK9 ctgaagttgccccatgtggagta ggtatctaagagatacacctccac
FABP1 gcccatatgaacttctccggcaagtac ctgggatccctaaattctcttgctgactctctt
PPARA tgcatgtccgtggagaccgt cagcatcccgtctttgttcatca
GPAM tgatcagccaggagcagctg agacagtatgtggcactctc
HSL cgagacaggcctcagtgtga aactctgggtctatggcgaatc
LIPE tcgggtgtggtgggtttgg gcgtgagatgtgttgctgagg
MTTP gttctcctctccttcgtcag ccaaccttgtgtcctctcc
ACAT2 tagcattcctcacccaac ccagtccatagccatagg
ABCA1 aaaggaggacagtgtttc gatgaggttggagatagc
PPARD gcccttcagtgacatcattgagccc gcagcttggggaagaggtactgg
CPT1A tgcaaagatcaatcggaccc acgccactcacgatgttcttc
CYP7A1 ctatgatgagggctttgag aataggaggagcattggc
Cyclophilin cccaccgtgttcttcgaca ccagtgctcagagcacgaaa
doi:10.1371/journal.pone.0092656.t001
NASH in Psammomys obesus
PLOS ONE | www.plosone.org 3 March 2014 | Volume 9 | Issue 3 | e92656

gene expression data confirmed that the NASH in P. obesus
appears to be mechanistically similar to that in patients with
NASH.
Brunt and colleagues [4,5] have established criteria for the
histological diagnosis of NASH. The key features are steatosis,
hepatocyte injury and inflammation, typically localised in zone 3,
with or without fibrosis. In this study we have shown the presence
of all of these key features of NASH in livers of P. obesus fed a
cholesterol-supplemented diet for 4 weeks. The steatosis was
closely associated with foci of inflammation, and was particularly
evident in hepatic zone 3. Our evidence for hepatocyte injury were
less clear, although the histological appearance suggested signif-
icant disruption of the cellular architecture, and this was supported
by increased plasma levels of transaminases that are known to be
released from injured hepatocytes. Furthermore, patches of
necrosis observed in two of the animals also support the suggestion
of hepatocyte injury, even though necrosis is not a common
feature of human NASH [4,5]. Overall, the histological appear-
ance of NASH in P. obesus closely resembles that seen in human
patients.
In contrast to other dietary based animal models, the diet used
in this study involved only a minor modification to a standard
rodent diet. Other dietary models are either based on nutrient
deficiency (e.g. MCD diet) or unrealistically high energy diet (e.g.
60–80% kcal/fat, 80% fructose) [7,8]. In this study we added 2%
cholesterol to a standard rodent diet, from which 20% of energy
was derived from fat, which is not considered to be a high fat diet.
The addition of 2% cholesterol to the diet can be considered
relatively high when compared with previous studies using 0.5–1%
dietary cholesterol [19,20]. However, more recently, 2% dietary
cholesterol in the context of high fat, high fructose diet (where the
Figure 1. Effects of dietary cholesterol supplementation on P. obesus liver. A&B) Livers from P. obesus fed the standard diet or cholesterol-supplemented diet. C) Liver weight, *p,0.001, D) Liver lipid, *p,0.001, and E) plasma ALT and AST in P. obesus fed either the standard diet (20% kcal/fat, 0% cholesterol; n = 8) or cholesterol-supplemented diet (20% kcal/fat, 2% cholesterol; n = 9).doi:10.1371/journal.pone.0092656.g001
Figure 2. Hepatic lipid species in P. obesus. Thin layer chroma-tography analysis of hepatic lipid species in P. obesus fed either thestandard diet or cholesterol-supplemented diet. Note that thistechnique is not quantitative, as equal amounts of lipid were analysedin each lane. CE = cholesterol esters, TAG = triacylglycerides, FFA = freefatty acids, PL = phospholipids.doi:10.1371/journal.pone.0092656.g002
NASH in Psammomys obesus
PLOS ONE | www.plosone.org 4 March 2014 | Volume 9 | Issue 3 | e92656

source of fat was trans-fat) elicited fibrosis in leptin-deficient mice,
but not in normal C57BL6 mice [21], suggesting that multiple
insults are required in other rodent models for the full spectrum of
NASH, not just increased dietary cholesterol [22]. The presence of
significant hepatic damage induced by relatively minor dietary
variation suggests that P. obesus may be an attractive model for
future NASH research compared with other dietary-based models.
Figure 3. Histopathology of NASH in P. obesus. Masson’s trichrome stained livers at 6400 magnification except F (x40). A: Control group withminimal steatosis and no fibrosis, B: Lipid droplets in most cells, and sinusoidal foamy macrophages (arrows), C: Parenchymal inflammation withneutrophils (arrow), D: Strands of pericellular and perisinusoidal collagen (arrows), E: Fibrous expansion of portal tracts, with oval cells/ductularreaction, F: Distorted architecture, with portal septum formation.doi:10.1371/journal.pone.0092656.g003
Figure 4. Hepatic gene expression in P. obesus with NASH. Gene expression of markers of inflammation and fibrosis in livers of P. obesus withNASH, n = 8–9 per group. *p,0.05, **p,0.005.doi:10.1371/journal.pone.0092656.g004
NASH in Psammomys obesus
PLOS ONE | www.plosone.org 5 March 2014 | Volume 9 | Issue 3 | e92656
In this study we have shown the development of NASH in P.
obesus occurs after only four weeks. Such rapid onset is not
observed in other dietary models with exposure to MCD diet
requiring up to 10 weeks to lead to the development of NASH
(depending on species/strain), whilst exposure to a high fat diet,
fructose diet, or an atherogenic diet can take up to several months
before NASH is observed [7,8]. We note that the animals in this
study were not obese. It will be of interest to repeat this study in
animals with pre-existing obesity and/or type 2 diabetes and
investigate how this affects the development of NASH.
In P. obesus fed the cholesterol-supplemented diet for 4 weeks
there was a consistent reduction in the liver mRNA levels of genes
encoding proteins involved in the delivery and uptake of lipids. Of
note, LDL receptor (LDLR) mRNA was 61% lower in animals fed
the cholesterol-supplemented diet, which would be expected to
result in reduced lipid and cholesterol uptake by the cells. This is
opposite to what has been observed in mouse models of NASH
[23], but consistent with observations in African Green Monkeys
with NASH [24]. We also observed reductions in genes encoding
proteins involved in de novo fatty acid and triglyceride synthesis.
Notably, fatty acid binding protein 1 mRNA was significantly
reduced in P. obesus with NASH, as it is in human cases [25], but
not in mouse models of NASH [26]. Gene expression of PPARA
and hormone sensitive lipase (LIPE) were reduced in P. obesus with
NASH, as they are in humans with NASH [27,28].
Hepatic gene expression of ACAT2, which is involved in the
removal of cholesterol from hepatocytes via VLDL, and ABCA1,
which is involved in direct cholesterol efflux from hepatocytes,
were both significantly increased in P. obesus with NASH.
Increased ACAT2 gene expression is also a feature of human
NASH [29]. Gene expression of MTTP was unexpectedly
reduced, as has been seen in various mouse models of NASH
[30,31]. CPT1A gene expression was also unexpectedly reduced,
similar to what has been observed in human NASH [28,32],
possibly due to excessive accumulation of malonyl-CoA in
advanced NASH. Finally, the gene expression of cholesterol 7
alpha hydroxylase (CYP7A1), the rate limiting step in bile acid
synthesis, was reduced by 47% (p = 0.02) in livers of P. obesus with
NASH. This is counterintuitive, as bile acid synthesis is a major
path for removal of cholesterol from the liver. However a similar
result was also found in monkeys with NASH [24], and is thought
to represent a measure to reduce intestinal cholesterol absorption
by limiting bile acid availability, in an attempt to restore hepatic
cholesterol homeostasis.
In summary we observed a general decrease in the expression of
genes encoding proteins involved in the uptake and synthesis of
fatty acids and triglycerides in the liver, and an increase in the
expression of genes encoding proteins that function in the export
or oxidation of lipids. Collectively these data indicate that the
hepatic molecular characteristics of NASH in P. obesus resemble
those seen in the human disease.
P. obesus rapidly develop NASH when fed a cholesterol-
supplemented diet including marked steatosis, inflammation,
hepatocyte injury and fibrosis. In general, the gene expression
patterns and biochemical and histological features observed in P.
obesus with NASH closely resembled the human condition. We
conclude that P. obesus is a new animal model of NASH with
significant advantages over existing models.
Author Contributions
Conceived and designed the experiments: KW JLT JDR. Performed the
experiments: BS TC CW LA GK AC SM SL. Analyzed the data: BS AK
MZ AS YG AEO RS KW. Contributed reagents/materials/analysis tools:
AS JLT JDR AEO RS KW. Wrote the paper: BS RS KW.
Table 2. Gene expression in livers of P. obesus fed the cholesterol-supplemented diet, expressed as fold difference relative toanimals fed the standard diet.
Gene Name Gene Symbol Fold difference P
Delivery and uptake of lipids
Sterol regulatory element binding transcription factor 2 SREBF2 0.6360.07 0.019
Scavenger receptor class B, member 1 SCARB1 0.5260.08 0.002
Low density lipoprotein receptor LDLR 0.3960.04 ,0.001
Proprotein convertase subtilisin/kexin type 9 PCSK9 0.5860.12 0.022
Lipogenesis
Fatty acid binding protein 1, liver FABP1 0.5260.09 0.012
Peroxisome proliferator-activated receptor alpha PPARA 0.4160.08 ,0.001
Glycerol-3-phosphate acyltransferase, mitochondrial GPAM 0.5960.09 0.016
Hormone-sensitive lipase LIPE 0.5160.05 0.005
Fatty acid synthase FASN 0.7260.06 0.18
Lipid export
Acetyl-CoA acetyltransferase 2 ACAT2 1.6360.24 0.034
ATP-binding cassette, sub-family A (ABC1), member 1 ABCA1 3.3060.49 0.001
Microsomal triglyceride transfer protein MTTP 0.5760.08 0.007
Lipid oxidation
Peroxisome proliferator-activated receptor delta PPARD 2.7060.18 0.007
Carnitine palmitoyltransferase 1A (liver) CPT1A 0.5960.12 0.027
Bile acid synthesis
Cholesterol 7 alpha hydroxylase CYP7A1 0.5360.10 0.016
doi:10.1371/journal.pone.0092656.t002
NASH in Psammomys obesus
PLOS ONE | www.plosone.org 6 March 2014 | Volume 9 | Issue 3 | e92656

References
1. Masterton GS, Plevris JN, Hayes PC (2010) Omega-3 fatty acids - a promising
novel therapy for non-alcoholic fatty liver disease. Aliment Pharmacol Ther 31:
679–92.
2. Williams CD, Stengel J, Asike MI, Torres DM, Shaw J, et al. (2011) Prevalence
of nonalcoholic fatty liver disease and non-alcoholic steatohepatitis among a
largely middle-aged population utilizing ultrasound and liver biopsy: a
prospective study. Gastroenterology 140: 124–31.
3. Obika M, Noguchi H (2012) Diagnosis and evaluation of nonalcoholic fatty liver
disease. Exp Diabetes Res 145754. doi: 10.1155/2012/145754.
4. Brunt EM (2010) Pathology of nonalcoholic fatty liver disease. Nat Rev
Gastroenterol Hepatol 7: 195–203.
5. Kleiner DE, Brunt EM, Van Natta M, Behling C, Contos MJ, et al. (2005)
Design and validation of a histological scoring system for nonalcoholic fatty liver
disease. Hepatology 41: 1313–21.
6. Moseley RH (2008) Therapy for nonalcoholic fatty liver disease. J Clin
Gastroenterol 42: 332–5.
7. Hebbard L, George J (2011) Animal models of nonalcoholic fatty liver disease.
Nat Rev Gastroenterol Hepatol 8: 35–44.
8. Takahashi Y, Soejima Y, Fukusoto T (2012) Animal models of non-alcoholic
fatty liver disease/non-alcoholic steatohepatitis. W Journal Gastroenterology 18:
2300–2308.
9. Postic C, Girard J (2008) Contribution of de novo fatty acid synthesis to hepatic
steatosis and insulin resistance: lessons from genetically engineered mice. J Clin
Invest; 118: 829–38.
10. Barnett M, Collier GR, Collier FM, Zimmet P, O’Dea K (1994) A cross-
sectional and shortterm longitudinal characterisation of NIDDM in Psammomys
obesus. Diabetologia 37: 671–6.
11. Walder KR, Fahey RP, Morton GJ, Zimmet PZ, Collier GR (2000)
Characterization of obesity phenotypes in Psammomys obesus (Israeli sand
rats). Int J Exp Diabetes Res 1: 177–84.
12. Walder K, Oakes N, Fahey RP, Cooney G, Zimmet PZ, et al. (2002) Profile of
dyslipidemia in Psammomys obesus, an animal model of the metabolic
syndrome. Endocr Regul 36: 1–8.
13. Collier GR, McMillan JS, Windmill K, Walder K, Tenne-Brown J, et al. (2000)
Beacon: a novel gene involved in the regulation of energy balance. Diabetes; 49:
1766–71.
14. Walder K, Kantham L, McMillan JS, Trevaskis J, Kerr L, et al. (2002) Tanis: a
link between type 2 diabetes and inflammation? Diabetes 51: 1859–66.
15. Maislos M, Medvedovskv V, Sztarkier I, Yaari A, Sikuler E (2006) Psammomys
obesus (sand rat), a new animal model of non-alcoholic fatty liver disease.
Diabetes Research and Clinical Practice 72: 1–5.
16. Folch J, Lees M, Sloane Stanley GH (1957) A simple method for the isolation
and purification of total lipides from animal tissues. J Biol Chem 226: 497–509.
17. Sinclair AJ, O’Dea K, Dunstan G, Ireland PD, Niall M (1987) Effects on plasma
lipids and fatty acid composition of very low fat diets enriched with fish or
kangaroo meat. Lipids 22: 523–9.
18. Kleiner DE, Brunt EM (2012) Nonalcoholic fatty liver disease: Pathologic
patterns and biopsy evaluation in clinical research. Semin Liver Dis 32: 3–13.19. Maxwell KN, Soccio RE, Duncan EM, Sehayek E, Breslow JL (2003) Novel
putative SREBP and LXR target genes identified by microanalysis in liver ofcholesterol-fed mice. J Lipid Research 44: 2109–2119.
20. Boone LR, Brooks PA, Niesen MI, Ness GC (2011) Mechanism of resistance to
dietary cholesterol. J Lipidsdoi:10.1155/2011/101242.21. Trevaskis JL, Griffin PS, Wittmer C, Neuschwander-Tetri BA, Brunt EM, et al.
(2012) Glucagon-like peptide-1 receptor agonism improves metabolic, biochem-ical, and histopathological indices of nonalcoholic steatohepatitis in mice.
Am J Physiol Gastrointest Liver Physiol 302: G762–G772.
22. Savard C, Tartaglione EV, Kuver R, Geoffrey Haigh W, Farrell GC, et al.(2012) Synergistic interaction of dietary cholesterol and dietary fat in inducing
experimental steatohepatitis. Hepatology doi: 10.1002/hep.25789.23. Du R, Xue J, Wang HB, Zhang Y, Xie ML (2011) Osthol ameliorates fat milk-
induced fatty liver in mice by regulation of hepatic sterol regulatory element-binding protein-1c/2-mediated target gene expression. Eur J Pharmacol 666:
183–8.
24. Rudel L, Deckelman C, Wilson M, Scobey M, Anderson R (1994) Dietarycholesterol and downregulation of cholesterol 7 alpha-hydroxylase and
cholesterol absorption in African green monkeys. J Clin Invest 93: 2463–72.25. Charlton M, Viker K, Krishnan A, Sanderson S, Veldt B, et al. (2009)
Differential expression of lumican and fatty acid binding protein-1: new insights
into the histologic spectrum of nonalcoholic fatty liver disease. Hepatology 49:1375–84.
26. Harano Y, Yasui K, Toyama T, Nakajima T, Mitsuyoshi H, et al. (2006)Fenofibrate, a peroxisome proliferator-activated receptor alpha agonist, reduces
hepatic steatosis and lipid peroxidation in fatty liver Shionogi mice withhereditary fatty liver. Liver Int 26: 613–20.
27. Mitsuyoshi H, Yasui K, Harano Y, Endo M, Tsuji K, et al. (2009) Analysis of
hepatic genes involved in the metabolism of fatty acids and iron in nonalcoholicfatty liver disease. Hepatol Res 39: 366–73.
28. Kohjima M, Enjoji M, Higuchi N, Kato M, Kotoh K, et al. (2007) Re-evaluation of fatty acid metabolism-related gene expression in nonalcoholic fatty
liver disease. Int J Mol Med 20: 351–8.
29. Caballero F, Fernandez A, De Lacy AM, Fernandez-Checa JC, Caballerıa J, etal. (2009) Enhanced free cholesterol, SREBP-2 and StAR expression in human
NASH. J Hepatol 50: 789–96.30. Chang X, Yan H, Fei J, Jiang M, Zhu H, et al. (2010) Berberine reduces
methylation of the MTTP promoter and alleviates fatty liver induced by a high-fat diet in rats. J Lipid Res 51: 2504–15.
31. Zhang B, Xue C, Hu X, Xu J, Li Z, et al. (2012) Dietary sea cucumber
cerebroside alleviates orotic acid-induced excess hepatic adipopexis in rats.Lipids Health Dis 11: 48. doi: 10.1186/1476-511X-11-48.
32. Nakamuta M, Kohjima M, Morizono S, Kotoh K, Yoshimoto T, et al. (2005)Evaluation of fatty acid metabolism-related gene expression in nonalcoholic fatty
liver disease. Int J Mol Med 16: 631–5.
NASH in Psammomys obesus
PLOS ONE | www.plosone.org 7 March 2014 | Volume 9 | Issue 3 | e92656