rapid differentiation of closely related citrus genotypes ... · dayse drielly souza...
TRANSCRIPT

Advances in Bioscience and Biotechnology, 2014, 5, 903-914 Published Online October 2014 in SciRes. http://www.scirp.org/journal/abb http://dx.doi.org/10.4236/abb.2014.511105
How to cite this paper: Santana-Vieira, D.D.S., et al. (2014) Rapid Differentiation of Closely Related Citrus Genotypes by Fluorescence Spectroscopy. Advances in Bioscience and Biotechnology, 5, 903-914. http://dx.doi.org/10.4236/abb.2014.511105
Rapid Differentiation of Closely Related Citrus Genotypes by Fluorescence Spectroscopy Dayse Drielly Souza Santana-Vieira1,2, Débora Marcondes Bastos Pereira Milori3, Paulino Ribeiro Villas Boas3, Marina França e Silva3, Magno Guimarães Santos1, Fernanda Amato Gaiotto2, Walter dos Santos Soares Filho1, Abelmon da Silva Gesteira1,2* 1Embrapa Cassava and Fruits, Cruz das Almas, Brazil 2Department of Biological Sciences, State University of Santa Cruz, Ilhéus, Brazil 3Embrapa Instrumentation, São Carlos, Brazil Email: *[email protected] Received 25 August 2014; revised 25 September 2014; accepted 23 October 2014
Copyright © 2014 by authors and Scientific Research Publishing Inc. This work is licensed under the Creative Commons Attribution International License (CC BY). http://creativecommons.org/licenses/by/4.0/
Abstract The differentiation of closely related Citrus genotypes is a meticulous, laborious, and time-con- suming task that involves the assessment of complex traits such as growth, tolerance to stress, photosynthetic efficiency, yield, and many others. Such a task is generally accomplished either by analyzing specific features of adult plants or by applying molecular markers to young trees. On one hand, only after plants start yielding can distinct genotypes be differentiated by comparing their fruit sizes, shapes, taste, and the number of seeds. On the other hand, molecular markers are expensive, and demand expertise and time for the analysis of a larger number of plants. For these reasons, the development of techniques that could assist in an early, quick and accurate differen-tiation of closely related Citrus varieties is of utmost importance. In this context, laser-induced fluorescence spectroscopy (LIFS) is a promising technique, since it is rapid, highly sensitive, and inexpensive. Previous studies showed that LIFS can differentiate a variety of sweet orange. How-ever, this new study aimed to determine LIFS accuracy in the differentiation and grouping of very closely varieties of four Sunki mandarin selections: Comum, Florida, Tropical, and Maravilha. Furthermore we compared the results with ISSR and SSR molecular markers for the same varieties. LIFS technique distinguished the four selections with accuracy greater than 70%. Only with mole-cular markers was possible distinguishing clearly Tropical from Maravilha, but not Comum from Florida selections. In this way the results suggest that LIFS may be a sound tool for helping the identification of closely Citrus varieties.
*Corresponding author.
D. D. S. Santana-Vieira et al.
904
Keywords Differentiation of Citrus Genotypes, Sunki, LIFS, Molecular Markers, PLSR
1. Introduction Species of the genus Citrus (Linnaeus) are cultivated worldwide and have great economic importance. The great diversity of species, hybrids, and clones [1] observed in this genus originated from three base species, which are regarded as true: mandarin (Citrus reticulata Blanco), pomelo [Citrus grandis (L.) Osbeck], and citron (Citrus medica L.) [2]. Among all Citrus species, the orange is probably one of the most important one in the world due to its high consumption in many countries. Brazil is the world’s largest producer of concentrated orange juice. Although Brazilian production potential is much higher, it has been restricted in recent years by problems caused by different pathogens [3].
The difficulty in controlling these pathogens arises from the predominant use of a single rootstock, mainly the Rangpur lime (Citrus limonia Osbeck), in Citrus groves. A strategy to minimize the vulnerability of groves is the use of different rootstocks [4] [5], and a promising alternative for this purpose is the Sunki mandarin [Citrus Sunki (Hayata) hort. Ex Tanaka]. This species originates from southeastern China [6], is compatible with several scion varieties, and can be grafted onto sweet orange trees [Citrus sinensis (L.) Osbeck], pomelo trees (Citrus paradisi Macfad.), and mandarins (several species) [7]. The use of Sunki mandarin as rootstock results in vi-gorous scions, with high fruit-yield, tolerance to Citrus triteza virus, xyloporosis, sorosis, Citrus decline, Citrus sudden death, adaptation to saline soils, and moderate tolerance to drought [7] [8]. However, the variety Com-mon Sunki shows high susceptibility to Phytophthora root rot and a reduced number of seeds per fruit [9].
Two selections of mandarin Sunki were reported by the Citrus Breeding Program at EMBRAPA Mandioca e Fruticultura (Citrus PMG-CNPMF): the tropical [5], selected from Common Sunki, and Maravilha [10], selected from Florida Sunki, which usually show maternal traits, but higher numbers of seeds, higher percentage of po-lyembryony, and resistance to Phytophthora root rot [10]. Morphological traits are currently used to identify these selections―Common, Florida, Tropical and Maravilha, but it is very costly due to the long time required for fruit production and subsequent evaluation.
Another widely used tool for the identification of Citrus species and varieties are molecular markers, such as SSRs (simple sequence repeats) [11]-[13] and ISSRs (inter-simple sequence repeats) [14]-[17]. These markers are advantageous as they allow the use of any plant tissue, at any developmental stage. However, the use of such markers in breeding programs or by seedling producers that have a larger number of plants is unfeasible due to the high cost and time required for analysis [13] [18]. Alternative tools that can be complementary in this type of selection have been extensively researched. One promising possibility in this case is the photonic techniques [19]-[26].
Studies using spectroscopic techniques have been carried out for differentiation of species of forest trees [19], varieties Syrian wheat [20] and commercial cultivars of strawberry [21]. A potential alternative is fluorescence spectroscopy, which does not require intense sample treatment and is highly sensitive, inexpensive, fast, and hence can be employed on large-scale analyses.
This technique has been applied to the diagnosis of biotic and abiotic stresses [22]-[24], such as differentiat-ing diseases in Citrus such as Huanglongbing (HLB, Ex greening) and Citrus variegated chlorosis (CVC) [25] [26]. More recently the laser-induced fluorescence spectroscopy (LIFS) was used to identify Citrus varieties of sweet orange with around 100% rate of success [27]. Based on the previous results, this study aimed to: 1) verify LIFS accuracy for the differentiation of very closely related varieties such as the Sunki selections; 2) differen-tiate Sunki selections using SSR and ISSR molecular markers; and 3) compare the results obtained by both techniques using statistical tools, pattern recognition algorithms, and clustering methods to build dendrograms.
2. Material and Methods 2.1. Samples The Sunki mandarin selections―Tropical (TSKTR), Maravilha (TSKMA), Florida (TSKFL) and Comum (TS-
D. D. S. Santana-Vieira et al.
905
KC)―analyzed in this study belong to the Citrus Germplasm Bank of EMBRAPA Mandioca e Fruticultura, Cruz das Almas, Bahia, Brazil. All Sunki plants selected at EMBRAPA and evaluated in this study were clones grafted on different rootstocks.
Each of these selections was grafted onto two different rootstocks. TSKC and TSKFL were grafted onto Cleopatra mandarin (Citrus reshni hort. Ex Tanaka); TSKTR and TSKMA were grafted onto Santa Cruz Rang-pur lime; and all selections were grafted onto Volkameriano lemon (Citrus volkameriana V. Ten. & Pasq.). For molecular analyses, three leaves of each Sunki selection, from the same rootstocks―Volkameriano lemon— were collected. For LIFS measurements, 10 leaves were collected from each selection from both rootstocks, as shown in Table 1.
2.2. Laser-Induced Fluorescence Spectroscopy—LIFS Two different LIFS systems were used for the analysis of the four selections, both of which were assembled at the Laboratory of Optics and Photonics of Embrapa Instrumentação. The main difference between the two sys-tems is their excitation sources: a 561 nm diode laser COMPASS model and a 405 nm Cube laser model both produced by Coherent. Each system will be henceforth referred to as LIFS-405 and LIFS-561, regarding the dif-ferent excitation lasers. Spectroscopic measurements were performed using USB2000 mini-spectrometers man-ufactured by Ocean Optics ranging from 194 to 894 nm for LIFS-405, and from 500 to 1200 nm for LIFS-561. Figure 1 illustrates a LIFS schematic system. In both systems, a fluorescent probe composed of six outer optical fibers is used to excite the sample, whereas a central fiber is used to capture the fluorescence emission signal. Also, an adjustable optical filter and a notebook with a program specially designed to collect and process data are used.
The spectrometer parameters subject to adjustments were: integration time, number of averages, and boxcar. The first parameter was the time in which the spectrometer captures light emission for each spectrum, the second sets the number of spectra measured for the average, and the third is a median smoothing method. In re-gard to the LIFS-405 system, the following acquisition parameters were adopted: integration time of 60 ms, 20 spectral averages, and boxcar 2. For the LIFS-561 system, the parameters were: integration time of 2 ms, 20 spectral average, and boxcar 2. With respect to each measurement, the spectrum collection was carried out after a time interval of 2.5 seconds, which was sufficient for the intensity to reach its maximum value. LIFS mea-surements were performed on leaves in natura, at the bottom of the abaxial side next to the midrib.
2.3. DNA Extraction, ISSR and SSR Analysis Total genomic DNA extraction was performed using the Invisorb Spin Plant Mini Kit (Invitek, Berlin, Germany). The concentration and quality of samples were evaluated in 0.8% agarose gels by electrophoresis and Nano-
Table 1. Number of plants and leaves collected from the Sunki man-darin [C. sunki (Hayata) hort. Ex Tanaka] selections grafted onto dif-ferent rootstocks, Cruz das Almas, Bahia, Brazil.
Selection1 Rootstock2 Number of Plants Number of Leaves
TSKC CLEO 4 40
TSKFL CLEO 4 40
TSKTR LCRSTC 4 40
TSKMA LCRSTC 4 40
TSKC LVK 1 10
TSKFL LVK 4 40
TSKTR LVK 4 40
TSKMA LVK 4 40 1TSKC―Sunki Common; TSKFL―Sunki Florida; TSKTR―Sunki Tropical; TSK- MA―Sunki Maravilha Mandarin Selections. 2CLEO―Cleopatra Mandarin (C. reshni hort Ex Tanaka); LCRSTC―Santa Cruz Rangpur Lime; LVK―Volkameriano Lemon (C. volkameriana V. Ten. & Pasq.).

D. D. S. Santana-Vieira et al.
906
Figure 1. Scheme of laser-induced fluorescence spectroscopy (LIFS) systems.
DropTM 8000 (Thermo Fisher Scientific, Wilmington, Denmark). The final concentration of all samples was standardized to 10 ng∙μL−1.
For DNA amplification, the Eppendorf Gradiente Master Cycler thermocycler was employed. Six ISSR pri-mers, presented in Table 2, the program and PCR reaction conditions used followed the procedure described in [28]. Visualization of the amplified bands was carried out in 2% agarose gels with 1X TBE, stained with ethi-dium bromide (0.5 µg bromide/100 mL of 1X TBE) at 90 volts for 2 - 3 h. Visualization was performed using a UV Loccus transilluminator.
Nine SSR primers, presented in Table 3, were used with the following amplification program: 1) 94˚C for 1 minute; 2) 94˚C for 40 seconds; 3) 60˚C for 40 seconds (−1˚C per cycle); 4) 72˚C for 1 minute; 5) 94˚C for 40 seconds; 6) 50˚C for 40 seconds; 7) 72˚C for 1 minute; 8) 72˚C for 4 minutes. Steps 2, 3, and 4 were repeated for 10 cycles, whereas steps 5, 6, and 7 were repeated for 25 cycles.
PCR reactions were carried out in 20-µL reactions, containing 50 ng DNA, 2 pmols of each primer, 2.5 mM MgCl2, 0.2 mM dNTPs, 10X Buffer Taq, and 1 unit of Taq (Fermentas). Analysis of the amplified bands was carried out in 4% agarose gels (high resolution, Invitrogen) stained with ethidium bromide (0.5 µg bromide/100 mL of 1X TBE). Visualization was performed using a UV Loccus transilluminator.
2.4. Data Processing and Classification Models In order to be comparable, the LIFS spectra were processed by applying offset removal and area normalization. The offset was determined by the average of each spectrum between 875 and 880 nm, and the normalization was performed by dividing each spectrum by their respective area. Thus, the spectra are only differentiated by varia-tions in spectral intensity.
To assess whether the spectral leaf of different varieties grafted onto the same rootstock can be differentiated by LIFS, classification techniques [29] were employed. “Classify” means selecting amongst various classes, the one that, according to some previously defined criteria, most closely resembles the element tested. From the set of processed spectra, one part is randomly chosen for constructing the classifier, whereas the other part is used for testing.
The technique selected for building the classifier was the classification via regression, using the partial least squares (PLS) method (e.g. [30]). This method has been widely used for evaluating the concentration of chemi-cal compounds in unknown samples [30] and has the advantage of using the correlation between input va-riables—spectrum points—and the variable of interest, i.e., the concentration of certain compounds. The PLS regression method applied in classification problems has to be adapted to correlate the input data with the classes, i.e., different selections grafted onto the same rootstock. Since the PLS method has been developed for
D. D. S. Santana-Vieira et al.
907
Table 2. List of ISSR primers used in the analyses.
Primer identification Nucleotide Sequence (5’-3’)
ISSR 809 AGAGAGAGAGAGAGAGG
ISSR 810 GAGAGAGAGAGAGAGAT
ISSR 814 CTCTCTCTCTCTCTCTA
ISSR 844 CTCTCTCTCTCTCTCTAGC
ISSR 861 ACCACCACCACCACCACC
ISSR 868 GAAGAAGAAGAAGAAGAA
Table 3. List of the SSR primers, F and R primer sequence, and expected fragment size. PCRs were performed in a gradient of temperature from 60˚ to 50˚ during 10 cy- cles and total of 25 cycles.
Locus Primer Sequence (5’-3’) Expected Fragment Size (bp)
CCSM 227 F: CGGTAATAACGCCGTCAAGT
131 R: TACTTTTAACGGCGTCACCC
CCSM 228 F: CTATTACCGACGGCCAAAAC
171 R: TGCTTGTTTCCCAAGCTTCT
TAA 1 F: GACAACATCAACAACAGCAAGAGC
161 - 181 R: AAGAAGAAGAGCCCCCATTAGC
TAA 3 F: AGAGAAGAAACATTTGCGGAGC
143 - 149 R: GATGGGACTTGGTTCATCACG
CAG 01 F: AACACTCGCACCAAATCCTC
123 - 126 R: TAAATGGCAACCCCAGCTTTG
CMS 4 F: CCTCAAACCTTCTTCCAATCC R:CTGTAAAGTACATGCATGTTGG 165 - 215
CMS 14 F: FGGCTTCTCTTCTACTAGAACGG R: ACGCCACGTAAGCAATAACC 132 - 171
CMS 19 F: GGCTTTTGCCCAATGATG
146 - 164 R: GTTGACCTAAAAGGGGGGAG
CMS 30 F: AACACCCCTTGGAGGGAG
146 - 170 R: GCTGTTCACACACACAACCC
numerical regression, the classes have to be represented by numbers, e.g., 0 for the class to be evaluated and 1 for the others [31]. Thus, one classifier is designed for every class, and the corresponding PLS regression me-thod determines the probability of each tested leaf to belonging to that class. Other models are designed for the other classes, and the same leaf is tested on all of them. Therefore, the tested leaf will belong to the class with the highest probability.
To construct the dendrogram that determines the hierarchy between classes, the agglomerative hierarchical clustering method [32] was adopted in which the Euclidean distance was the similarity measurement, and the Ward method [33] was used to determine the clustering between classes. This analysis was performed in the R software package [34].
Differentiation between all selections was performed two by two, according to the number of leaves from each rootstock (see Table 1). The first comparison was carried out between the leaves from TSKC and TSKFL
D. D. S. Santana-Vieira et al.
908
on the Cleopatra (CLEO) mandarin rootstock whereas the second, between the leaves from TSKMA and TSKTR, on the Santa Cruz Rangpur lime rootstock (LCRSTC). Finally, all selections on the Volkameriano lemon tree rootstock (LVK) were compared.
For constructing the dendrogram, 10 leaves of all selections on the Volkameriano lemon tree rootstock (LVK) were used. In cases in which there were more than 10 leaves per selection, they were randomly chosen.
The molecular markers were analyzed by visual assessment. For ISSRs, a binary system was applied, where 1 denotes presence and 0 denotes absence of band; in SSRs, in turn, genotyping was carried out through allele identification. After this evaluation, the Jaccard’s coefficient was calculated and the dendrogram constructed us-ing the Ward’s clustering method with Euclidean distance similarity measurement with the R software package [33].
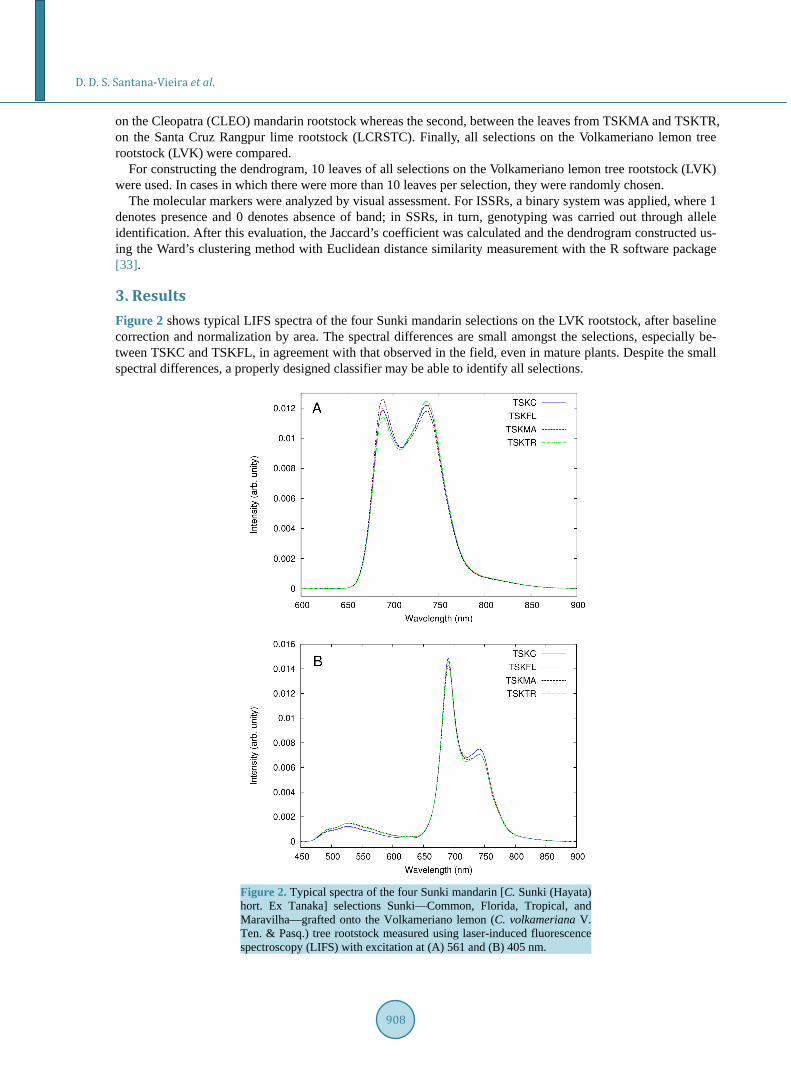
3. Results Figure 2 shows typical LIFS spectra of the four Sunki mandarin selections on the LVK rootstock, after baseline correction and normalization by area. The spectral differences are small amongst the selections, especially be-tween TSKC and TSKFL, in agreement with that observed in the field, even in mature plants. Despite the small spectral differences, a properly designed classifier may be able to identify all selections.
Figure 2. Typical spectra of the four Sunki mandarin [C. Sunki (Hayata) hort. Ex Tanaka] selections Sunki—Common, Florida, Tropical, and Maravilha—grafted onto the Volkameriano lemon (C. volkameriana V. Ten. & Pasq.) tree rootstock measured using laser-induced fluorescence spectroscopy (LIFS) with excitation at (A) 561 and (B) 405 nm.
D. D. S. Santana-Vieira et al.
909
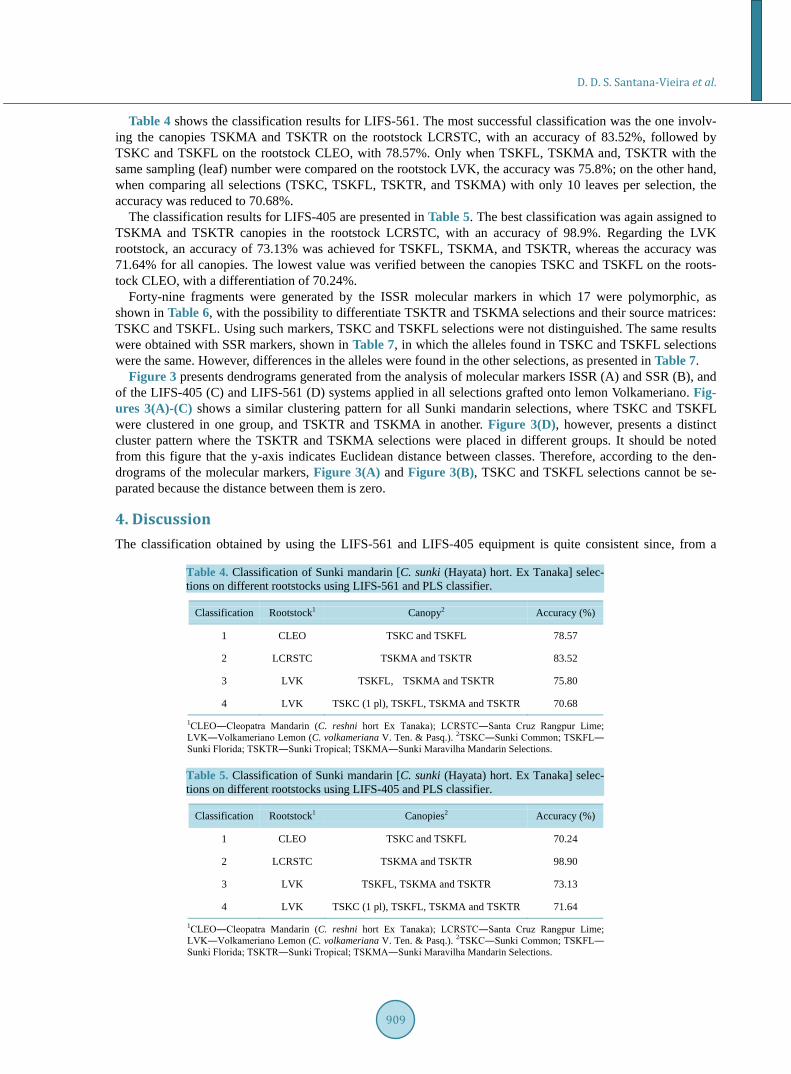
Table 4 shows the classification results for LIFS-561. The most successful classification was the one involv-ing the canopies TSKMA and TSKTR on the rootstock LCRSTC, with an accuracy of 83.52%, followed by TSKC and TSKFL on the rootstock CLEO, with 78.57%. Only when TSKFL, TSKMA and, TSKTR with the same sampling (leaf) number were compared on the rootstock LVK, the accuracy was 75.8%; on the other hand, when comparing all selections (TSKC, TSKFL, TSKTR, and TSKMA) with only 10 leaves per selection, the accuracy was reduced to 70.68%.
The classification results for LIFS-405 are presented in Table 5. The best classification was again assigned to TSKMA and TSKTR canopies in the rootstock LCRSTC, with an accuracy of 98.9%. Regarding the LVK rootstock, an accuracy of 73.13% was achieved for TSKFL, TSKMA, and TSKTR, whereas the accuracy was 71.64% for all canopies. The lowest value was verified between the canopies TSKC and TSKFL on the roots-tock CLEO, with a differentiation of 70.24%.
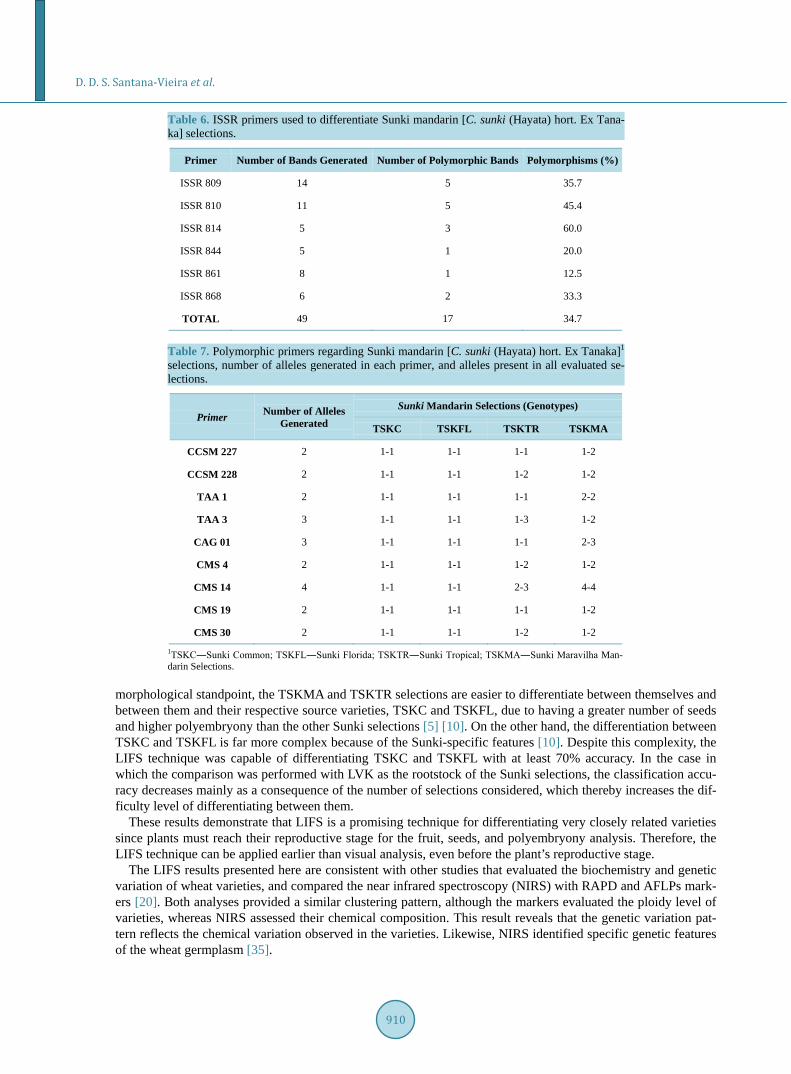
Forty-nine fragments were generated by the ISSR molecular markers in which 17 were polymorphic, as shown in Table 6, with the possibility to differentiate TSKTR and TSKMA selections and their source matrices: TSKC and TSKFL. Using such markers, TSKC and TSKFL selections were not distinguished. The same results were obtained with SSR markers, shown in Table 7, in which the alleles found in TSKC and TSKFL selections were the same. However, differences in the alleles were found in the other selections, as presented in Table 7.
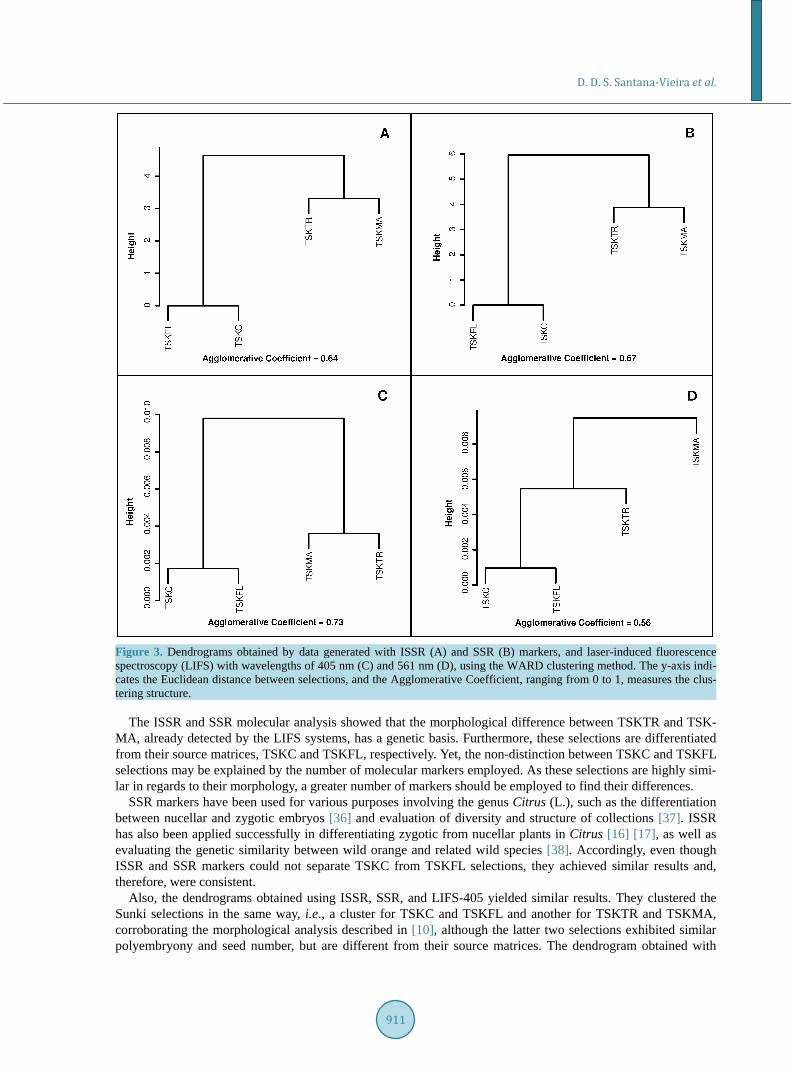
Figure 3 presents dendrograms generated from the analysis of molecular markers ISSR (A) and SSR (B), and of the LIFS-405 (C) and LIFS-561 (D) systems applied in all selections grafted onto lemon Volkameriano. Fig- ures 3(A)-(C) shows a similar clustering pattern for all Sunki mandarin selections, where TSKC and TSKFL were clustered in one group, and TSKTR and TSKMA in another. Figure 3(D), however, presents a distinct cluster pattern where the TSKTR and TSKMA selections were placed in different groups. It should be noted from this figure that the y-axis indicates Euclidean distance between classes. Therefore, according to the den-drograms of the molecular markers, Figure 3(A) and Figure 3(B), TSKC and TSKFL selections cannot be se-parated because the distance between them is zero.
4. Discussion The classification obtained by using the LIFS-561 and LIFS-405 equipment is quite consistent since, from a
Table 4. Classification of Sunki mandarin [C. sunki (Hayata) hort. Ex Tanaka] selec-tions on different rootstocks using LIFS-561 and PLS classifier.
Classification Rootstock1 Canopy2 Accuracy (%)
1 CLEO TSKC and TSKFL 78.57
2 LCRSTC TSKMA and TSKTR 83.52
3 LVK TSKFL, TSKMA and TSKTR 75.80
4 LVK TSKC (1 pl), TSKFL, TSKMA and TSKTR 70.68
1CLEO―Cleopatra Mandarin (C. reshni hort Ex Tanaka); LCRSTC―Santa Cruz Rangpur Lime; LVK―Volkameriano Lemon (C. volkameriana V. Ten. & Pasq.). 2TSKC―Sunki Common; TSKFL― Sunki Florida; TSKTR―Sunki Tropical; TSKMA―Sunki Maravilha Mandarin Selections.
Table 5. Classification of Sunki mandarin [C. sunki (Hayata) hort. Ex Tanaka] selec-tions on different rootstocks using LIFS-405 and PLS classifier.
Classification Rootstock1 Canopies2 Accuracy (%)
1 CLEO TSKC and TSKFL 70.24
2 LCRSTC TSKMA and TSKTR 98.90
3 LVK TSKFL, TSKMA and TSKTR 73.13
4 LVK TSKC (1 pl), TSKFL, TSKMA and TSKTR 71.64
1CLEO―Cleopatra Mandarin (C. reshni hort Ex Tanaka); LCRSTC―Santa Cruz Rangpur Lime; LVK―Volkameriano Lemon (C. volkameriana V. Ten. & Pasq.). 2TSKC―Sunki Common; TSKFL― Sunki Florida; TSKTR―Sunki Tropical; TSKMA―Sunki Maravilha Mandarin Selections.
D. D. S. Santana-Vieira et al.
910
Table 6. ISSR primers used to differentiate Sunki mandarin [C. sunki (Hayata) hort. Ex Tana-ka] selections.
Primer Number of Bands Generated Number of Polymorphic Bands Polymorphisms (%)
ISSR 809 14 5 35.7
ISSR 810 11 5 45.4
ISSR 814 5 3 60.0
ISSR 844 5 1 20.0
ISSR 861 8 1 12.5
ISSR 868 6 2 33.3
TOTAL 49 17 34.7
Table 7. Polymorphic primers regarding Sunki mandarin [C. sunki (Hayata) hort. Ex Tanaka]1 selections, number of alleles generated in each primer, and alleles present in all evaluated se-lections.
Primer Number of Alleles Generated
Sunki Mandarin Selections (Genotypes)
TSKC TSKFL TSKTR TSKMA
CCSM 227 2 1-1 1-1 1-1 1-2
CCSM 228 2 1-1 1-1 1-2 1-2
TAA 1 2 1-1 1-1 1-1 2-2
TAA 3 3 1-1 1-1 1-3 1-2
CAG 01 3 1-1 1-1 1-1 2-3
CMS 4 2 1-1 1-1 1-2 1-2
CMS 14 4 1-1 1-1 2-3 4-4
CMS 19 2 1-1 1-1 1-1 1-2
CMS 30 2 1-1 1-1 1-2 1-2
1TSKC―Sunki Common; TSKFL―Sunki Florida; TSKTR―Sunki Tropical; TSKMA―Sunki Maravilha Man-darin Selections.
morphological standpoint, the TSKMA and TSKTR selections are easier to differentiate between themselves and between them and their respective source varieties, TSKC and TSKFL, due to having a greater number of seeds and higher polyembryony than the other Sunki selections [5] [10]. On the other hand, the differentiation between TSKC and TSKFL is far more complex because of the Sunki-specific features [10]. Despite this complexity, the LIFS technique was capable of differentiating TSKC and TSKFL with at least 70% accuracy. In the case in which the comparison was performed with LVK as the rootstock of the Sunki selections, the classification accu-racy decreases mainly as a consequence of the number of selections considered, which thereby increases the dif-ficulty level of differentiating between them.
These results demonstrate that LIFS is a promising technique for differentiating very closely related varieties since plants must reach their reproductive stage for the fruit, seeds, and polyembryony analysis. Therefore, the LIFS technique can be applied earlier than visual analysis, even before the plant’s reproductive stage.
The LIFS results presented here are consistent with other studies that evaluated the biochemistry and genetic variation of wheat varieties, and compared the near infrared spectroscopy (NIRS) with RAPD and AFLPs mark-ers [20]. Both analyses provided a similar clustering pattern, although the markers evaluated the ploidy level of varieties, whereas NIRS assessed their chemical composition. This result reveals that the genetic variation pat-tern reflects the chemical variation observed in the varieties. Likewise, NIRS identified specific genetic features of the wheat germplasm [35].
D. D. S. Santana-Vieira et al.
911
Figure 3. Dendrograms obtained by data generated with ISSR (A) and SSR (B) markers, and laser-induced fluorescence spectroscopy (LIFS) with wavelengths of 405 nm (C) and 561 nm (D), using the WARD clustering method. The y-axis indi-cates the Euclidean distance between selections, and the Agglomerative Coefficient, ranging from 0 to 1, measures the clus-tering structure.
The ISSR and SSR molecular analysis showed that the morphological difference between TSKTR and TSK- MA, already detected by the LIFS systems, has a genetic basis. Furthermore, these selections are differentiated from their source matrices, TSKC and TSKFL, respectively. Yet, the non-distinction between TSKC and TSKFL selections may be explained by the number of molecular markers employed. As these selections are highly simi-lar in regards to their morphology, a greater number of markers should be employed to find their differences.
SSR markers have been used for various purposes involving the genus Citrus (L.), such as the differentiation between nucellar and zygotic embryos [36] and evaluation of diversity and structure of collections [37]. ISSR has also been applied successfully in differentiating zygotic from nucellar plants in Citrus [16] [17], as well as evaluating the genetic similarity between wild orange and related wild species [38]. Accordingly, even though ISSR and SSR markers could not separate TSKC from TSKFL selections, they achieved similar results and, therefore, were consistent.
Also, the dendrograms obtained using ISSR, SSR, and LIFS-405 yielded similar results. They clustered the Sunki selections in the same way, i.e., a cluster for TSKC and TSKFL and another for TSKTR and TSKMA, corroborating the morphological analysis described in [10], although the latter two selections exhibited similar polyembryony and seed number, but are different from their source matrices. The dendrogram obtained with

D. D. S. Santana-Vieira et al.
912
LIFS-561, however, separated TSKMA from TSKTR, and identified the former as the most distinct of the four analyzed selections. Similarly, this fact can be observed in the SSR marker analysis in Table 7, as shown by the presence of distinct alleles in TSKMA and TSKTR, which were not present in the other evaluated selections.
5. Conclusions This study used two different technical, LIFS and molecular markers, to identicaty four Sunki selections—TS- KC, TSKFL, TSKMA, and TSKTR by analyzing their leaves.
TSKMA and TSKTR are selections derived from TSKC and TSKFL, respectively. We employed two types of molecular markers: ISSR and SSR, and two types of LIFS systems, with excitations at 561 and 405 nm. The re-sults obtained for both techniques differed. Both LIFS systems differentiated all selections with accuracy above 70%. However, molecular markers used were able only to differentiate the TSKMA and TSKTR selections among themselves and between them and their source matrices, but not between TSKC and TSKFL selections. It is worth mentioning here that the differences between the TSKC and TSKFL selections are very subtle, and very difficult to detect even with many molecular markers or with the plants in the reproductive stage. Thus, the LIFS technique was very successful at differentiating distinct selections, though without very high accuracy. The LIFS technique presents advantages as low cost and fast measurements, which enable its use in large scale. In this point the LIFS technique could help in breeding programs or seedling producers for identify hybrids or natural mutants before application of other technical with more accuracy. Future studies include validation of the LIFS technique in a larger number of plants per selection, application of this technique in other selections, and ana-lyses with the LIFS systems with excitation at other wavelengths or combining different excitations in the same equipment.
References [1] Coletta Filho, H.D., Machado, M.A., Targon, M.L.P.N., Moreira, M. and Pompeu, J. (1998) Analysis of the Genetic
Diversity among Mandarins (Citrus spp.) Using RAPD Markers. Euphytica, Berlin, 102133-102139. http://dx.doi.org/10.1023/A:1018300900275
[2] Froelicher, Y., Dambier, D., Bassene, J.B., Costantino, G., Lotfy, S., Didout, C., Beaumont, V., Brottier, P., Risterucci, A.M., Luro, F. and Ollitrault, P. (2008) Characterization of Microsatellite Markers in Mandarin Orange (Citrus reticu-lata Blanco). Molecular Ecology Resources, 8, 119-112. http://dx.doi.org/10.1111/j.1471-8286.2007.01893.x
[3] Gottwald, T.R., Graça, J.V. and Bassanezi, R.B. (2007) Citrus Huanglongbing: The Pathogen and Its Impact. Plant Management Network. http://dx.doi.org/10.1094/php-2007-0906-01-rv
[4] Pereira, W.E., de Siqueira, D.L., Puiatti, M., Martínez, C.A., Salomão, L.C.C. and Cecon, P.R. (2003) Growth of Ci-trus Rootstocks under Aluminium Stress in Hydroponics. Scientia Agricola, 60, 31-41. http://dx.doi.org/10.1590/S0103-90162003000100006
[5] Soares Filho, W.S., Diamantino, M.S.A.S., Moitinho, E.D.B., da Cunha Sobrinho, A.P. and Passos, O.S. (2002) “Tropical”: Uma nova seleção de tangerina Sunki. Revista Brasileira de Fruticultura, 24, 127-132. http://dx.doi.org/10.1590/S0100-29452002000100028
[6] Hodgson, R.W. (1967) Horticultural Varieties of Citrus. In: Reuther, W., Webber, H.J. and Batchelor, L.D., Eds., The Citrus Industry, University of California, Berkeley, 431-459.
[7] Pompeu Jr., J. (1980) Porta-Enxertos Para Citros. In: Rodriguez, O. and Viégas, F.C.P., Eds., Citricultura Brasileira, Fundação Cargill, Campinas, 279-296.
[8] Pompeu Jr., J. (2005) Porta-Enxertos. In: Mattos Jr., D., de Negri, J.D., Pio, R.M. and Pompeu Jr., J., Eds., Citros, Instituto Agronômico e Fun-dag, Campinas, 61-104.
[9] de Carvalho, M.T., Bordignon, R., Ballvé, R.M.L., Pinto-Maglio, C.A.F. and Medina Filho, H.P. (1997) Aspectos biológicos do reduzido número de sementes da tangerina “Sunki”. Bragantia, 56, 69-77. http://dx.doi.org/10.1590/S0006-87051997000100007
[10] Soares Filho, W.S., da Cunha Sobrinho, A.P., Passos, O.S. and Moitinho, E.D.B. (2003) “Maravilha”: Uma nova seleção de tangerina Sunki. Revista Brasileira de Fruticultura, 25, 268-271. http://dx.doi.org/10.1590/S0100-29452003000200021
[11] Ahmad, R., Struss, D. and Southwick, S.M. (2003) Development and Characterization of Microsatellite Markers in Ci-trus. Journal of the American Society for Horticultural Science, 128, 584-590.
[12] Liu, Y., Liu, D.-C., Wu, B. and Sun, Z.-H. (2006) Genetic Diversity of Pummelo (Citrus grandis Osbeck) and Its Rela-
D. D. S. Santana-Vieira et al.
913
tives Based on Simple Sequence Repeat Markers. Chinese Journal of Agricultural Biotechnology, 3, 119-126. http://dx.doi.org/10.1079/CJB2006102
[13] Oliveira, A.C., Novelli, V.M., Garcia, A.N., Cristofani, M. and Machado, M.A. (2002) Identification of Citrus Hybrids through the Combination of a Leaf Apex Morphology and SSR Markers. Euphytica, 128, 397-403. http://dx.doi.org/10.1023/A:1021223309212
[14] Fang, D.Q. and Roose, M.L. (1997) Identification of Closely Related Citrus Cultivars with Inter-Simple Sequence Re-peat Markers. Theoretical and Applied Genetics, 95, 408-417. http://dx.doi.org/10.1007/s001220050577
[15] Tusa, N., Abbate, L., Ferrante, S., Lucretti, S. and Scarano, M.T. (2002) Identification of Zygotic and Nucellar Seedl-ings in Citrus Interploid Crosses by Means of Isozymes, Flow Cytometry and ISSR-PCR. Cellular e Molecular Biolo-gy Letters, 7, 703-708.
[16] Shareefa, M., Singh, A.K., Srivastav, M. and Dubey, A.K. (2009) Differentiation of Nucellar and Zygotic Seedlings in Citrus Using ISSR Markers. The Indian Journal of Agricultural Sciences, 79, 884-889.
[17] Lombardo, G., Schicchi, R., Marino, P. and Palla, F. (2011) Genetic Analysis of Citrus aurantium L. (Rutaceae) Cul-tivars by ISSR Molecular Markers. Plant Biosystems, 146, 19-26. http://dx.doi.org/10.1080/11263504.2011.557101
[18] Weiler, R.L., Brugnara, E.C., Bastianel, M., Machado, M.A., Schifino-Wittmann, M.T., Souza, P.V.D. and Schwarz, S.F. (2009) Paternity Test and Agronomic Evaluation of Possible Hybrids of Sunki Tangerine. Scientia Agraria, 10, 429-435.
[19] Ullanh, S., Schlerf, M., Skidmore, A.K. and Hecker, C. (2012) Identifying Plant Species Using Mi-Wave Infrared (2.5 - 6 µm) and Thermal Infrared (8 - 14 µm) Emissivity Spectra. Remote Sensing of Environment, 118, 95-102. http://dx.doi.org/10.1016/j.rse.2011.11.008
[20] Saleh, B. (2012) Biochemical and Genetic Variation of Some Syrian Wheat Varieties Using NIR, RAPD and AFLPs Techniques. Journal of Plant Biology Research, 1, 1-11.
[21] Kim, S.W., Min, S.R., Kim, J., Park, S.K., Kim, T.I. and Liu, J.R. (2009) Rapid Discrimination of Commercial Straw-berry Cultivars Using Fourier Transform Infrared Spectroscopy Data Combined by Multivariate Analysis. Plant Bio-technology Report, 3, 87-93. http://dx.doi.org/10.1007/s11816-008-0078-z
[22] Lichtenthaler, H.K., Wenzel, O., Buschmann, C. and Gitelson, A. (1998) Plant Stress Detection by Reflectance and Fluorescence. Annals New York Academy of Sciences, 851, 271-285. http://dx.doi.org/10.1111/j.1749-6632.1998.tb09002.x
[23] Lichtenthaler, H.K. and Schweiger, J. (1998) Cell Wall Bound Ferulic Acid, the Major Substance of the Blue-Green Fluorescence Emission of Plants. Journal of Plant Physiology, 152, 272-282. http://dx.doi.org/10.1016/S0176-1617(98)80142-9
[24] Kancheva, R.H., Borisova, D.S. and Iliev, I.T. (2008) Chlorophyll Fluorescence Plant as a Stress Indicator. Recent Developments in Remote Sensing From Space, 5, 301-306.
[25] Pereira, F.M.V., Milori, D.M.B.P., Pereira-Filho, E.R., Venâncio, A.L., de Sá Tavares Russo, M., do Brasil Cardinali, M.C., Martins, P.K. and Freitas-Astúa, J. (2001) Laser Induced Fluorescence Imaging Method to Monitor Citrus Greening Disease. Computers and Electronics in Agriculture, 79, 90-93. http://dx.doi.org/10.1016/j.compag.2011.08.002
[26] Cardinali, M.C.B., Villas-Boas, P.R., Milori, D.M.B.P., Ferreira, E.J., Silva, M.F.E., Machado, M.A., Bellete, B.S. and da Silva, M.F.D.F. (2012) Infrared Spectroscopy: A Potential Tool in Huanglongbing and Citrus Variegated Chlorosis Diagnosis. Talanta, 91, 1-6. http://dx.doi.org/10.1016/j.talanta.2012.01.008
[27] Milori, D.M.B.P., Raynaud, M., Villas-Boas, P.R., Venâncio, A.L., Mounier, S., Bassanezi, R.B. and Redon, R. (2013) Identification of Citrus Varieties Using Laser-Induced Fluorescence Spectroscopy (LIFS). Computers and Electronics in Agriculture, 95, 11-18. http://dx.doi.org/10.1016/j.compag.2013.03.008
[28] Biswas, M.K., Xu, Q. and Deng, X. (2010) Utility of RAPD, ISSR, IRAP and REMAP Markers for the Genetic Analy-sis of Citrus Spp. Scientia Horticulturae, 2, 254-261. http://dx.doi.org/10.1016/j.scienta.2009.12.013
[29] Duda, R.O., Hart, P.E. and Stork, D.G. (2000) Pattern Classification. 2nd Edition, John Wiley & Sons, New York. [30] Wold, S., Sjöström, M. and Eriksson, L. (2001) PLS-Regression: A Basic Tool of Chemometrics. Chemometrics and
Intelligent Laboratory Systems, 58, 109-130. http://dx.doi.org/10.1016/S0169-7439(01)00155-1 [31] Frank, E., Wang, Y., Inglis, S., Holmes, G. and Witten, I.H. (1998) Using Model Trees for Classification. Machine
Learning, 32, 63-76. http://dx.doi.org/10.1023/A:1007421302149 [32] Kaufman, L. and Rousseeuw, P.J. (1990) Finding Groups in Data: An Introduction to Cluster Analysis. Wiley, New
York. http://dx.doi.org/10.1002/9780470316801 [33] Everitt, B.S., Landau, S. and Leese, M. (2001) Cluster Analysis. 4th Edition, Oxford University Press, Inc., New York.

D. D. S. Santana-Vieira et al.
914
[34] R Development Core Team (2012) R: A Language and Environment for Statistical Computing. R Foundation for Sta-tistical Computing, Vienna. http://www.R-project.org/
[35] Diepeveen, D., Clarke, G.P.Y., Ryan, K., Tarr, A., Ma, W. and Appels, R. (2012) Molecular Genetic Mapping of NIR Spectra Variation. Journal of Cereal Science, 55, 6-14. http://dx.doi.org/10.1016/j.jcs.2011.07.007
[36] Silva, C.L.S.P., Machado, M.A. and Lemos, E.G.M. (2004) Expressão protéica diferencial entre plântulas apomíticas e zigóticas de citros. Revista Brasileira de Fruticultura, 26, 1-4. http://dx.doi.org/10.1590/S0100-29452004000100003
[37] Barkley, A.N., Roose, L.M., Krueger, R.R. and Federici, T.C. (2006) Assessing Genetic Diversity and Population Structure I a Citrus Germplasm Collection Utilizing Simple Sequence Repeat Markers (SSRs). Theoretical and Ap-plied Genetics, 112, 1519-1531. http://dx.doi.org/10.1007/s00122-006-0255-9
[38] Kumar, L.S., Jena, S.N. and Nair, K.N. (2009) ISSR Polymorphism in Indian Wild Orange (Citrus indica Tanaka, Ru-taceae) and Related Wild Species in Northeast India. Scientia Horticulturae, 3, 350-359.