rapid evidence assessment of the economic and social
TRANSCRIPT

Rapid Evidence Assessment of the economic and social consequences of worsening housing affordability


Rapid Evidence Assessment of the economic and social consequences of worsening housing affordability
Alison Wallace and Anwen Jones (Centre for Housing Policy) Steven Duffy (Centre for Reviews and Dissemination).
May 2009
Centre for Housing Policy The University of York Heslington York YO10 5DD
Tel: 01904 321480 Fax: 01904 321481 Email: [email protected]

AcknowledgementsThe authors would like to thank the members of a virtual user panel who provided valuable comments on the initial protocol that guided the focus of the evidence assessment: Jackie Smith, Shelter; Bob Pannell, Council of Mortgage Lenders; and John Stewart, Home Builders Federation. In addition, we would like to thank Mark Stephens for his advice on early drafts; Lynne Lonsdale and Jane Allen for their support during the course of the project; and Victoria Stewart at the NHPAU for her support and project management.

5
Contents
Executive Summary 8
1 Reviewing the evidence 11 Introduction 11
Establishing review boundaries 12
Searching for the evidence 14
Quality appraisal 15
Study retrieval 16
Interpreting the evidence 16x
Structure of report 17
2 Housing Affordability, Measurement and Trends 18 Introduction 18
Housing affordability 18
Housing market conditions 21
The geography of housing affordability 24
Changed market conditions 26
Why does affordability matter? 29
3 Changing access to homeownership 32 Key points 32
Introduction 32
Market trends 32
Characteristics of first-time buyers 34
Financing the purchase 36
4 Household Formation and Tenure Choices 43 Key Points 43
Introduction 43
Household formation and tenure choices 43
Homeownership 45
Student debt 49
Private rented sector 50
Social rented sector 51
Overcrowding 52

6
Rapid Evidence assessment of the economic and social consequences of worsening housing affordability
5 Public services and the Labour market 55 Key points 55
Introduction 55
Employee affordability problems 55
Impact of recruitment and retention evidence 57
Aspirations of key workers 60
Private sector experiences 61
Residential mobility and the labour market 63
Rural communities 65
6 Sustaining Homeownership 67 Key Points 67
Introduction 67
High housing costs 67
Mortgage products 69
Supporting homeowners 71
The consequences of mortgage default 72
7 The Potential for Homeownership and Housing Wealth 75 Key Points 75
Introduction 75
Value and distribution of housing wealth 76
Use of housing wealth during life course 77
Inheritance 80
Social inequalities 82
Education 87
Health 88
8 Conclusions 87 Introduction 87
Summary of findings 87
Changing market conditions 91
Research gaps and weaknesses 92
References 96
Appendix A – Literature searches 108

7
Contents
List of Tables Table 1.1 Study inclusion and exclusion criteria 13
Table 1.2 Breakdown of references identified 16
Table 2.1 Regional affordability ratios (Average property price by household income 20-39 year olds) 2007 25
Table 2.2 Top 10 least affordable local authority districts 26
Table 2.3 Distributional consequences of higher house prices 30
Table 3.1 Proportion of young households 20-39 unable to purchase in the local market 33
Table 6.1 Social consequences of mortgage repossession 73
Table 7.2 Balancing the potential for homeownership and housing wealth 83
Table 8.1 Some social and economic consequences of worsening housing affordability 88
List of Figures Figure 2.1 Conceptualising housing affordability 19
Figure 2.2 Mix-adjusted average UK House prices 1993-2007 22
Figure 2.3 Ratio of lower quartile earnings to lower quartile house prices 22
Figure 2.4 Mortgage costs to income ratios for first-time buyers 1986-2006 23
Figure 2.5 Mortgage interest payments as a proportion of net household income 24
Figure 2.6 Percentage change mix adjusted average house prices England Q3 2007-Q3 2008 27
Figure 2.7 Absolute change mix adjusted average house prices England Q3 2007-Q3 2008 28
Figure 3.1 Proportion of house purchases made by first-time buyers 34
Figure 3.2 Median age of first-time buyers 1974-2007 35
Figure 3.3 Loan to value ratios for first-time buyers 1974-2008 37
Figure 3.4. Median income multiples for first-time buyers 1974 – 2007 39
Figure 4.1 Overcrowded households by tenure 1984 – 2005/6 53
Figure 6.1 Homes taken into possession 1986 – 2008 72
Figure 7.1. Net personal housing wealth UK 76
Figure 7.2 Equity withdrawal as a proportion of consumer spending 84

8
Executive summary
Housing affordability has constrained access to homeownership over the previous decade and to a degree remains unresolved in the current market downturn. This has meant that widespread aspirations to homeownership have remained unfulfilled for some households. Where people have successfully accessed the tenure, it has been based on increased and sometimes risky borrowing. Furthermore, in addition to unmet housing demand in the system, there is evidence that there have been indirect impacts on the extent of housing need as expressions of housing stress grow. Unsatisfied ambitions for homeownership have created recruitment and retention difficulties for public services in high cost areas as staff relocate to less expensive housing markets to buy a home. There are well founded concerns regarding the wealth disparities between owners and renters, and fears that worsening housing affordability has contributed towards greater social inequalities as households priced out of the market have no access to an important opportunity to accumulate housing wealth. For some marginal households there are some advantages that come at a risk, as for some households drawing upon their housing wealth has led to arrears and repossessions. However, the extent to which households with no or little housing wealth, or for whom homeownership represents a risk, are critically disadvantaged is also influenced by other social policy, housing or welfare, policy agendas.
The National Housing and Planning Advice Unit asked the Centre for Housing Policy at the University of York to provide an evidence assessment of the economic and social consequences of worsening housing affordability. This report is based upon an extensive literature search and appraisal of the evidence retrieved.
Housing affordability is not an absolute measure as its magnitude is influenced by the approaches taken to its measurement, the assumptions made in the analysis and the data available. There are also reasons to suggest that housing affordability measures may not alone be proxy measures of demand, as although most people aspire to be homeowners, they do not all express demand in the market for that tenure. There are some reasons other than housing affordability that explain the decline in the proportion of younger households entering homeownership.
Nevertheless, affordability indicators provide relative expressions of problematic access to homeownership, especially for those households at the margins. These indicators have significantly deteriorated over the last decade, and tighter lending criteria by mortgage providers has counterbalanced any improvements from a falling market over the last year. Access to mortgage finance is now issue in addition to the affordability constraints on entry to homeownership. Demographic pressures on housing demand remain, including increased longevity, relationship breakdown and the growth of single person households, but the credit crisis and the subsequent housing market downturn have adversely affected new housing supply. These factors mean that even when stability returns to the market upward pressures on house prices are likely to reappear.

9
Executive summary
Evidence suggests that affordability problems mainly constrain households’ aspirations and demands for homeownership but may have significant indirect effects on expressions of housing need and housing stress, such as reduced household formation, social housing waiting lists, and households in temporary accommodation.
A number of factors have fuelled the decline in the proportion of young households in homeownership, including lower relative incomes, delayed family formation, marriage, and late entry to the labour market because of remaining longer in full time education. However, young people remain committed to homeownership over the long term. Access routes to homeownership have altered and family support for first-time buyers has become increasingly important, firstly because of high house prices and now because new entrants must find larger deposits to access mortgage finance. This means that homeownership is becoming increasingly accessible only to those whose own parents were also homeowners.
The aspiration to homeownership as households reach their late twenties or early thirties is strong and there is evidence that key public sector workers would leave high cost regions, and therefore their jobs, to secure access to homeownership, causing recruitment and retention difficulties in some areas. Private sector employers also experience labour shortages associated with high housing costs, although a number are able to improve salaries and staff benefits to compensate. High cost areas also deter unemployed households moving to them to access new employment opportunities although they may re-locate to contiguous areas and access buoyant labour markets by commuting.
Homeownership is not risk free and there have been concerns that high housing affordability ratios have threatened the sustainability of the sector. Undoubtedly, lenders and borrowers have engaged in risky mortgage products to support house purchase, but much of the market for non-conforming mortgage loans has been about re-mortgaging and credit repair by older households, rather than about access to homeownership. However, the proportion of income devoted to mortgage costs has grown over the decade and in a low inflation environment the debt burden has not eroded as in the past, increasing the length of time new entrants to homeownership are exposed to the risk of high payments. More recently, for some borrowers, reductions in the bank base rates has meant housing costs are now falling, although refinancing mortgages once initial deals end may be less favourable for borrowers with little equity or other risk factors. High house prices in market housing did not translate into higher private rents, primarily as the supply of stock to the private rented sector also increased during this period.
Homeownership has been a substantial source of personal wealth over the long term and has become the most equally distributed asset-class, albeit that there are large disparities within the sector and that those with the most incomes also attract the largest housing wealth. Constrained access to the tenure therefore raises concerns about growing social inequalities between

10
Rapid Evidence assessment of the economic and social consequences of worsening housing affordability
homeowners and renters. Furthermore, the uneven temporal and geographical distribution of housing wealth also means that equity has the potential to create inequalities within homeownership, especially when some homeowners have multiple properties, and may therefore override inequalities produced by the labour market. Arguments for the potential for housing wealth to materially change the position of lower income households does assume that access to housing wealth is unproblematic. Equity withdrawal often involves further risky borrowing, which is implicated in the number of rising repossessions.
Fears that large amounts of housing wealth would be inherited and transmitted through generations of families has not been realised as the increase in housing bequests has been much slower than anticipated in the 1980s. Older people are more inclined than previous generations to spend their housing wealth and leaving the home as a bequest has declined in importance. Homeowners are also required to sell their home to fund long-term care in old age. However, there is evidence that equity is being withdrawn prior to death to support younger family members into homeownership.
However, the potential for housing wealth to affect change in poorer households may be limited. There is evidence that only a small number of cash-poor housing-rich homeowners can be lifted out of poverty through the use of housing equity, and the changes to those households may be significant.
Homeownership therefore does produce wealth inequalities between owners and non-owners but also produces large inequalities within the tenure as well. However, whether non-owners are critically disadvantaged by not being an owner is largely dependent on what other forms of pension and welfare support are available. Furthermore, whether the advantages of homeownership are a risk worth taking for marginal households is also dependent on the effectiveness of the safety nets available.

11
1. Reviewing the evidence
IntroductionIn June 2008, the National Housing and Planning Advice Unit (NHPAU) commissioned the Centre for Housing Policy at the University of York to undertake a Rapid Evidence Assessment (REA) of the ‘Economic and Social Consequences of Worsening Housing Affordability’.
The cost of market housing has attracted considerable political and media attention over recent years with house prices rising twice as fast as earnings since 1990, producing severe difficulties for first-time buyers in many areas (Barker, 2004). However, it is now clear that 2007 was the peak of the housing market cycle and house prices across England have fallen by four per cent over the past year (CLG, Table 508), and a variety of analysts forecast further falls in 2009. The past year has been characterised by the global financial turbulence and the severe ramifications these monumental events have had on the UK housing market. The ‘credit crunch’ has reduced the ability of banks to lend mortgages, and as economic recession is now apparent in the UK and the labour market weakens, negative sentiment in the market means that many prospective buyers continue to defer house purchases. At this stage the depth and duration of the housing market downturn is uncertain.
Yet, despite house price falls, in the short term, access to homeownership remain as mortgage lending has become more cautious, with lenders requiring larger deposits from first-time buyers and offering less favourable interest rates. This prudent lending market may persist until the financial institutions have been able to re-capitalise but it is possible that the lending environment will remain cautious and more highly regulated in the longer term. Moreover, underlying social and demographic trends, such as the move towards more single person households, relationship breakdown, greater longevity, and migration, are all likely to continue over the long-term, increasing pressure on the demand for housing (Holmans and Whitehead, 2008). House-building targets have been affected by the housing market downturn so the lack of housing supply will remain into the near future, a disjuncture in the market that means that housing affordability still matters (NHPAU, 2008a). Survey data suggests that despite the falling market 68 per cent of people believe house prices remain a concern and view housing affordability as a legitimate concern of the government (NHPAU, 2008b).
This rapid evidence assessment therefore seeks to consider what the impacts of housing affordability problems have been for individual households and the wider economy, and what the consequences might be in terms of social inequalities if some households are unable to achieve homeownership. Rapid evidence assessments are used to review the literature relating to policy concerns and although they are based upon the methods of systematic reviews, they are conducted to a timescale more closely attuned to the needs of policymakers (GSRU, 2007; 2008). Rapid evidence assessments therefore include pragmatic decisions, for example regarding how extensive the literature searches are, but offer a robust evidence review that limits the perceived or potential biases of a traditional literature review. This chapter continues by providing an overview of the methods used to conduct this assessment, explaining the basis for this approach to literature reviewing.
12
Rapid Evidence assessment of the economic and social consequences of worsening housing affordability
Establishing review boundariesThis evidence assessment examines the knowledge base about the economic and social consequences of worsening housing market affordability and the NHPAU identified a number of subsidiary objectives that the evidence review was to address:
1. What has been the impact of worsening housing affordability on national economic growth and on regional economies?
2. What have been the impacts on labour mobility and the delivery of public services?
3. What are the social and economic implications of widening inequalities in housing wealth?
4. Are the social and demographic characteristics of first-time buyers changing and if so why?
5. What has been the impact of worsening affordability on household formation and tenure choice? Consequently, what is the effect of these factors on health, education and employment outcomes?
6. What is the evidence on regional variation in social and economic consequences of worsening affordability?
7. What are the estimates for future economic performance and social inequalities as a result of worsening affordability?
8. Are there any gaps in the evidence base?
A key factor in the success of applying the rapid evidence assessment methods to social policy questions is establishing clear parameters for the review questions, as the wealth of references and literature retrieved could otherwise become overwhelming (Wallace et al., 2004, 2006). The level of precision of health reviews that specify the population, intervention and outcomes in review questions (NHS CRD., 2001) would be inappropriate for a review of this kind, but identifying the boundaries of any evidence assessment in advance is desirable as the questions inform the search strategy and study selection criteria. The set of questions in this evidence assessment were potentially very large and therefore the boundaries of the review were initially set so that any empirically based literature that related housing affordability to any social or economic impacts on individuals or the broader local, regional or national economy would be identified. However, it was apparent that not all work made such direct associations between cause and effect, and the boundaries of the review were extended to ensure that the evidence considered answered the questions. Consequently, the study reviewed both the primary impacts of worsening affordability and any secondary considerations such as to what extent it mattered if people were unable to become homeowners.

13
1. Reviewing the evidence
The purpose of the inclusion criteria is to ensure that the evidence is relevant to the research questions, that we can be confident of their findings and that the selection of studies is consistent. The review team applied the broad inclusion criteria (Table 1.1) to the literature retrieved from the searches. Our focus for the review has been on empirical studies alone; although other discursive material has been useful in shaping the context and background to the evidence assessment but opinion pieces have not been included. However, the research included in the review was not limited to particular study designs, as studies from a range of disciplines have addressed the aims and objectives of the review and have employed very different theoretical or methodological approaches.
The study selection criteria were as follows:
Table 1.1 Study inclusion and exclusion criteria
Inclusion Exclusion
Geographical coverage Studies that relate to the UK.
Studies that relate to countries outside of the UK.
Date Studies published from 1998 onwards.
Studies published before 1998.
Population Studies that address the consequences of worsening housing affordability or the inability to become a homeowner on people and/or the economy.
Studies that do not address the consequences of worsening housing affordability or the inability to become a homeowner on people or the economy.
Relevance to Economic Consequences Studies that focus on any possible economic consequences of worsening housing affordability or the inability to become a homeowner and plausibly demonstrate an association.
Studies that focus on any possible economic consequences of worsening housing affordability or the inability to become a homeowner but do not demonstrate a plausible association.
Relevance to Social Consequences Studies that focus on any possible social consequences of worsening housing affordability or the inability to become a homeowner and plausibly demonstrate an association.
Studies that focus on any possible social consequences of worsening housing affordability or the inability to become a homeowner but do not demonstrate a plausible association.
Study Design Studies are included from a range of research approaches but must include empirical evidence.
Book reviews, discursive opinion, literature reviews are excluded. In cases where there are multiple publications from data from a single study then the main findings only be used to avoid duplication of results.
Quality Criteria Studies must meet all five criteria in the quality assessment tool to ensure confidence in the findings.
Studies that do not meet all five essential criteria and therefore cannot be said to have trustworthy findings.

14
Rapid Evidence assessment of the economic and social consequences of worsening housing affordability
A Virtual User Panel considered the approach to the evidence assessments. The members’ main feedback raised concerns over the emphasis on empirical research alone to inform the REA. Other concerns related to the difficulties in establishing a relevant evidence base in the current financial and housing market turmoil and whether ‘affordability’ should include access to and the sustainability of housing in all tenure. In response, the team still retrieved non-empirical reports, which were used to frame the context to the evidence assessment and assist with identifying the various arguments advanced around the issue of worsening housing affordability. However, the focus remains on homeownership alone and Chapter 3 discusses how housing affordability is conceptualised in this report.
Searching for the evidenceThe review team undertook a series of searches to identify studies about the economic and social consequences of worsening housing affordability. The literature search involved searching electronic databases, citation searches, and Internet searches of relevant organisation and research centre websites. The database search strategy was devised using terms for ‘housing affordability’, but also included terms for other areas of interest to the review team: ‘housing wealth’, ‘first-time buyers’, ‘household formation’, and ‘housing choice’. The review team identified the search terms through discussion within the team, by scanning background literature, and by browsing database thesauri. The searches were restricted to those studies relating to the United Kingdom only and by date range to 1998-2008. The primary search strategy is shown in Appendix A.
The following databases were searched:
International Bibliograph• y of the Social Sciences (IBSS)
EconLit•
Applied Social Science Index and Abstracts (ASSIA)•
Sociological Abstracts•
Social Services Abstracts•
PAIS International•
Social Science Citation Index (SSCI)•
Social Policy and Practice•
OpenSIGLE•
Zetoc•

15
1. Reviewing the evidence
Internet searches were carried out using the specialist search gateway intute www.intute.ac.uk to help identify potentially relevant websites and those websites recommended by the review team. The websites searched were:
intute: Social Sciences•
Council of Mortgage Lenders (CML)•
Communities and Local Government (CLG)•
National Housing and Planning Advice Unit (NHPAU)•
Shelter (England & Scotland)•
HM Treasury•
Home Builders Federation•
Housing Corporation•
Chartered Institute of Housing•
Royal Institution of Chartered Surveyors (inc. RICS Library Catalogue)•
Department for Work and Pensions•
Joseph Rowntree Foundation•
Commission for Rural Communities. Affordable Rural Housing Commission•
Institute of Public Policy Research (ippr)•
To reflect the widening of the scope of the evidence assessment the review team undertook additional searches to retrieve studies relating to: overcrowding, commuting, residential/labour mobility, rural housing, and rural/regional economies. The initial searches for ‘housing wealth’ and ‘household formation’ were revisited. The searches were run in the same databases and websites as those used in the initial literature search listed above. The searches were also restricted to United Kingdom based studies, and by date range to 1998-2008. Citation searches of key included studies from the initial search results were performed in SSCI and Google Scholar.
As a number of databases and Internet websites were searched, some degree of duplication resulted. In order to manage this issue, the titles and abstracts of bibliographic records were downloaded and imported into EndNote software and duplicate records removed.
Quality appraisalStudies that met the inclusion criteria had to be of sufficient quality that the research methods supported the findings. The review team appraised the studies by considering the clarity of the question, study design, sampling, data collection and analysis, which were criteria used in Croucher et al. (2003). The questions are there to aid judgement and the threshold for inclusion was set to be ‘good enough’ and not to exclude anything that was not ‘gold standard’. Whilst most studies found were clearly acceptable, some studies were weaker and the relationship

16
Rapid Evidence assessment of the economic and social consequences of worsening housing affordability
between the findings and the data was unclear. A few studies were rejected but where a study offered a simple finding but also did not overstep the mark in terms of the claims made, then this was included if other criteria were met.
Study retrievalA total of 902 references were identified from the various strands of searching, but as with most evidence assessments and systematic reviews, very few directly assisted in answering the questions posed. The breakdown of how decisions were made about the references is as follows (Table 1.2):
Table 1.2 Breakdown of references identified
Total references 902
Relevant 372Retrieved 293Met inclusion criteria 100Of sufficient quality 99In review 99
Many references were not considered relevant or the studies retrieved for several reasons. Commonly, although certain attributes such as the title or key words may have been applicable, the focus of the report may have been upon the delivery of affordable housing, methodological discussion or some other related topic that was inappropriate for this review. Discussions in magazines or periodicals were also not considered. Furthermore, evidence for England was prioritised over studies from Scotland, Wales or Northern Ireland as the NHPAU’s remit does not cover the whole of the UK. The apparent loss of so many references is common and unproblematic as searching in social science databases is imprecise due to there being multiple interpretations of the words used and no controlled vocabulary.
Interpreting the evidencePrevious evidence reviews have shown that interpreting the evidence drawn from a range of ever changing economic or housing market contexts is problematic (Croucher et al., 2003; Wallace et al., 2006), especially in this current period, where policy, housing, mortgage and economic markets are all in a rapid state of flux. This report includes evidence from studies published over the last decade but those from 1998 onwards that used data from earlier in the 1990s were also included. To overcome some difficulties in translating arguments to the current period, additional publicly available statistical data has been used to update and supplement older data from the studies where appropriate. In addition, the final chapter considers the relevance of the evidence in the light of possible directions of market change.

17
1. Reviewing the evidence
Structure of reportThe report continues in Chapter 2 by discussing the conceptualisation of housing affordability and traces changes over the last decade, and provides a background to the evidence assessment showing why homeownership and housing affordability have become a public and policy concern. The next chapters present the research evidence that addresses the role housing affordability has played in a number of important areas. Chapter 3 considers how affordability pressures have influenced the changing access to homeownership for first-time buyers over the last decade, examining the characteristics of new owners and their finances. The contribution that housing affordability has made to the rate of new households forming and the tenure choices they make are explored in Chapter 4. Chapter 5 examines how housing affordability and the inability of some employees to enter homeownership impacts upon public agencies and private businesses in some areas of high housing costs. Chapter 6 discusses the role housing affordability plays in increased threats to the sustainability of homeownership and Chapter 7 discusses the whether the constrained access to homeownership results in heightened social and wealth inequalities. The report concludes in Chapter 8 by summarising the evidence of the impacts of worsening affordability and considering what this may mean in the current market flux. The gaps and weaknesses in the evidence base are noted.

18
2. Housing affordability, measurement and trends
Key Points Housing affordability is not an absolute measure but one reliant on how it is analysed, the data •and assumptions used, and involves normative judgements about what is ‘unaffordable’.
Nevertheless, by any measure, housing affordability indicators have deteriorated over the last •decade. In addition, a tighter lending market means that affordability concerns have not been resolved by the current market downturn.
Areas of London and Southern England consistently display high affordability problems, as •well as rural districts in the North.
Housing affordability has become a policy concern because of the widespread aspirations •towards homeownership and the concerns that renters will be disadvantaged by having no access to the asset accumulation attributes of homeownership.
IntroductionThis chapter examines the context to the evidence assessment by outlining what is meant by housing affordability, approaches to its measurement, what affordability analysis shows us about the housing market and why affordability has become an important policy concern.
Housing affordability This section provides a conceptual overview of housing affordability. It demonstrates how affordability can encompass other aspects of policy concern, such as the costs of social housing rents or the housing challenges of the lowest income households, but may also relate to how households with marginally higher incomes make trade offs in the housing market. Housing affordability therefore encapsulates a range of factors relating to the costs of housing and a household’s ability to pay, but can operate in different ways.
Bramley and Karley (2005a) provide a useful overview of different levels of ‘affordability’ concerns. Firstly, there are households that directly experience basic problems of housing affordability who cannot afford to access or sustain housing because of very low incomes. Secondly, there are households that are at risk of experiencing payment problems in their current situation, possibly because of changes in their incomes; and thirdly, there are households who face problems accessing mainstream market housing at affordable levels (p691). The first issue relates to primary poverty, or having insufficient income to pay for any and therefore have no other options, the second relates to problems of sustainability and the third relates to problems of affordability and access for households who are unable to enter homeownership. Households in this latter group do have other options available to them, such as to stay at home with parents or rent privately. However, Bramley and Karley argue that, although less direct and much less intense than the former scenarios, the fact that these latter households experience difficulties acts as an indicator of problems within the former groups, and this last group is numerically larger.

19
2. Housing affordability measurement and trends
The following diagram (Figure 2.1), which encompasses both a residual income and housing ratio approach to housing affordability discussed further below, illustrates the different levels of housing affordability. The diagram is adapted from Bramley and Karley (2005a) who provide an illustration based on economic theory that plots a housing consumption standard against non-housing consumption income. The budget line indicating the prevailing house prices intersects the minimum housing quality (Q line) and minimum income (I line). In section A, you can see that households plainly cannot afford good quality housing. In sections B, a trade off exists between quality and price but neither are satisfied at the same time, as either good quality housing is obtained but insufficient income is left over for other non-housing consumption, or vice versa. They also have insufficient income make other housing choices. In sections C and D, some further choices are available when assessing the trade off between quality and income as they are over the budget line, and in section E both households have secured good quality affordable housing. However, note that households at point F will have incomes only just above the applicable amounts relating to welfare benefits, compared to those households at point G who will have a higher level of disposable and residual income. This evidence review is concerned with households either side of the budget line and not with households in section A who are largely not seeking homeownership.
Figure 2.1 Conceptualising housing affordability
D: Has sufficient residual income but not good quality housing
B: Affordability issue relating to affording
A: Unambiguous problem of inability to afford good housing
B: Affordability issue relating to affording good housing
C: Has secured good housing but insufficient residual income
Minimumincome
Minimum housingstandard
Prevailing house prices budget Line
E: Secured quality housing and has sufficient residual income.
F
I
Q
G
Source: Adapted from Bramley and Karley (2005a)

20
Rapid Evidence assessment of the economic and social consequences of worsening housing affordability
As discussed, there are two main ways to assess housing affordability: the residual income approach and a ratio model comparing income to prices or expenditure. Within these broad approaches, there are also differences in the way various authors have used data and made assumptions within the quantitative models. Bramley and Karley note that whatever measurement framework is adopted the threshold at which something is deemed ‘unaffordable’ will always reflect a normative judgement.
The US has displayed more of an appetite for the residual income approach than in the UK, where it has been used to assess affordability by setting a standard as to the minimum acceptable amount left over after housing costs (Stone, 2006). The residual income approach commonly uses the applicable amounts for benefit purposes, although Stone suggests the Family Budget Unit’s ‘Low But Acceptable Standard’ as being a slightly higher standard that may be more acceptable. Stone argues that as this affordability measure is sensitive to household size and income it is likely to increase the number of households identified as having unaffordable housing at low income levels and decrease the number at higher levels of income, compared to those suggested by the ratio approach. Therefore, residual income approaches are more aligned with poverty research and are likely to report that affordability problems are largely resolved as the threshold is set so low and does not accord with policy concerns about housing supply or house prices (Bramley and Karley, 2005a).
Affordability ratios are the more commonly applied measurements of housing stress for policymakers, used to measure access to homeownership, rent setting and calculating housing allowances. On a basic level, the different ratio approaches use various measures of income (the average or lowest quartile household or individual income) and compare them to house prices (lowest decile, lowest quartile or average house price for all or specific types of property) or housing costs (mortgage costs or full housing costs including taxes and bills etc). The scope for different basic measures of housing affordability derived from a range of judgements made in the models is clear.
The Communities and Local Government (CLG) affordability indicator uses the lower quartile house prices to lower quartile incomes, but other models are more complex, using a combination of the ratio and residual income approach (Bramley and Karley, 2003; Bramley et al., 2006). The CLG/Reading model was developed in response to the Barker Review to inform local authorities of housing affordability concerns at the local and regional levels (see Meen et al., 2008). The econometric model incorporates house prices, household formation, tenure and inter-regional migration but is a dynamic model incorporating many factors, as does the Bramley model, such as vacancies, demolitions, earnings etc. These models are sensitive to the data or assumptions used. For example, Bramley et al. (2006) note that increasing the mortgage income multipliers would reduce the proportion of people unable to afford to buy a home, as would using the lowest decile house prices instead of lowest quartile house prices as the entry threshold. Furthermore, the Wilcox (see 2008a) assessments of affordability examine the lower quartile and lower decile as he suggests that the lower quartile could over-estimate the numbers of households completely excluded from the market.

21
2. Housing affordability measurement and trends
This evidence assessment is therefore looking at the affordability of mainstream homeownership and not at the social and economic consequences of bad housing and poverty. The impacts of worsening affordability of homeownership upon other tenures will be included, but not the consequences of affordability within the private rented sector or social housing. There is a danger that doing otherwise would mean the rapid evidence assessment encompasses all the implications of poverty and housing and the problems of low incomes, such as the affordability of social housing rents or disrepair in low income neighbourhoods, for example, which may have other drivers such as poverty or housing finance policies, rather than the cost of market housing. Such a review would be unwieldy in its scope and certainly beyond the resources available for this evidence assessment.
Housing market conditionsUntil the onset of the financial markets crisis, the housing market over the last decade is characterised as one of rising house prices. Although, mortgage interest rates were low, borrowers faced increasingly high housing costs for new entrants to the market. More recently, the house prices have declined but as mortgage costs and access to finance are more limited, entering homeownership remains problematic.
UK house price rises have been high for a number of reasons. The recent upswing in the housing market in a period of sustained economic growth was driven by factors that have influenced both the demand and supply for housing. Housing demand has increased because of people living longer, high levels of relationship breakdown and growth in the number of single person households. Access to low cost finance has also had a positive influence on demand. However, these factors have combined with a limited supply of new housing as construction rates have failed to keep pace with new household formation (Barker, 2003; NHPAU, 2007). There is also evidence that the buy to let market contributed to small increases to house prices (Taylor, R., 2008; NHPAU, 2007).
The long run real house prices trend, adjusted for inflation, for the UK over the last thirty years has been 2.4 per cent per annum, much higher than for most of Europe where real house price growth has been an average of 1.1 per cent per year (Barker, 2003). Nominal house price rises, unadjusted for inflation, had risen at a faster pace (Figure 2.2).

22
Rapid Evidence assessment of the economic and social consequences of worsening housing affordability
Figure 2.2 Mix-adjusted average UK House prices 1993-2007
0
50,000
100,000
150,000
200,000
250,000
2007R2005200320011999199719951993
First-time buyer
Source: CLG Live Tables 507
All dwellings
GB
P (£
)
The ratio of lower quartile house prices to lower quartile earnings shows how rising house prices have led to a rapid rise in housing affordability problems for new buyers since 2000 (Figure 2.3).
Figure 2.3 Ratio of lower quartile earnings to lower quartile house prices
0.00
1.00
2.00
3.00
4.00
5.00
6.00
7.00
8.00
2008200720062005200420032002200120001999199819971996
Rat
io
Source: CLG Live Tables 508
Housing affordability describes more than the rise and fall of house prices but the relationship between housing costs and an individual or households ability to pay for that housing. Mortgage lending mediates this relationship through the provision of funding to purchase the house and is an important factor to consider, especially as interest rates have been historically low. Indeed the

23
2. Characteristics of investors and investment motives
average mortgage rate paid by borrowers in 2003 was only 4.18 per cent, compared to 7.16 per cent in 1995, meaning the costs to service a mortgage have been low. While the cheap cost of borrowing may have contributed to house price inflation, it has also militated against the effects of rising prices. Figure 2.4 shows how the proportion of income devoted to mortgage costs for first-time buyers has largely returned affordability to the levels seen at the peak of the last housing boom between 20 and 25 per cent of income, despite the steep house price rises. Although the North East remains the most affordable region of the UK, the disparities between the regions in this decade has been less than at the peak of the last housing market cycle.
Figure 2.4 Mortgage costs to income ratios for first-time buyers 1986-2006
0
5.0
10.0
15.0
20.0
25.0
30.0
35.0
20062004200220001998199619941992199019881986
United KingdomSouth WestSouth EastLondonEastEast MidlandsWest MidlandsNorth WestYorkshire & The HumberNorth East
Mo
rtg
age
cost
s/in
com
e ra
tio
Source: UK Housing Review 2007/8 (Wilcox, 2008b)
The CML provides another ratio measure of affordability, the proportion of net income taken up by mortgage interest payments (Figure 2.5). This measure shows the gradual increase in affordability over the last ten years but also, on this measure, that the affordability problems of this recent housing cycle peak have not reached the heights of the affordability peak in early 1990s.

24
Rapid Evidence assessment of the economic and social consequences of worsening housing affordability
Figure 2.5 Mortgage interest payments as a proportion of net household income
0
5
10
15
20
25
30
1974
1976
1978
1980
1984
1986
1988
1990
1992
1994
1996
1998
2000
2002
2004
2006
2008
1982
Median interest payments as % of income
Inte
rest
pay
men
ts a
s %
inco
me
Source: Council of Mortgage Lenders ML2
The geography of housing affordabilityThe series of affordability assessments have consistently shown that the regions that reflect the highest degree of housing affordability problems are London, the South West and the South East. One of the most significant findings was the growing affordability problem in the South West. Low local incomes in this region have meant that there are many affordability hotspots in excess of that found in areas within the South East. However, there are affordability hotspots across England, including some rural districts and provincial towns in northern regions.
Bramley and Karley (2003) used 2003 data to show that the number of households in housing need was double that of when the model was run in 1997-8 and identified London, the South East and South West were the regions with the largest volume of households who could not afford market housing. The analysis at that time showed that across England 40 per cent of new households could not afford to buy a home. The proportions were higher in the Northern regions and East Midlands where there were around 50 per cent, but lower in the South West where only a third of new households could buy a home. In London, only 22 per cent of new households could afford to buy.
Wilcox has conducted annual studies since 2002 (Wilcox 2003, 2004, 2005, 2006, 2007, 2008a) detailing the geography of affordability across Britain. The studies consistently suggest that outside London, the South West displays the most problematic affordability levels because of the low wages of the region. For key workers, police officers, nurses, teachers and social workers, London and the South East were the most inaccessible housing markets. These studies identified rural districts within the Midlands and the North, such as in East Yorkshire and Cumbria as having some of the highest affordability ratios for prospective first-time buyers.
25
2. Characteristics of investors and investment motives
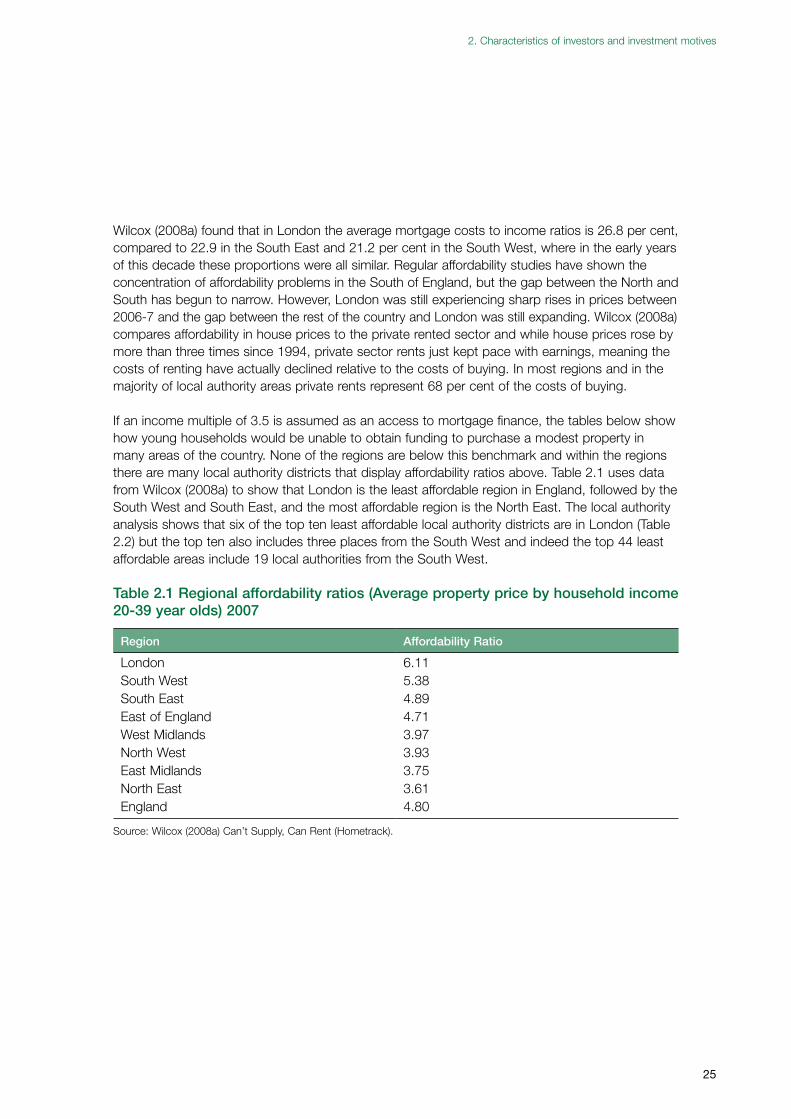
Wilcox (2008a) found that in London the average mortgage costs to income ratios is 26.8 per cent, compared to 22.9 in the South East and 21.2 per cent in the South West, where in the early years of this decade these proportions were all similar. Regular affordability studies have shown the concentration of affordability problems in the South of England, but the gap between the North and South has begun to narrow. However, London was still experiencing sharp rises in prices between 2006-7 and the gap between the rest of the country and London was still expanding. Wilcox (2008a) compares affordability in house prices to the private rented sector and while house prices rose by more than three times since 1994, private sector rents just kept pace with earnings, meaning the costs of renting have actually declined relative to the costs of buying. In most regions and in the majority of local authority areas private rents represent 68 per cent of the costs of buying.
If an income multiple of 3.5 is assumed as an access to mortgage finance, the tables below show how young households would be unable to obtain funding to purchase a modest property in many areas of the country. None of the regions are below this benchmark and within the regions there are many local authority districts that display affordability ratios above. Table 2.1 uses data from Wilcox (2008a) to show that London is the least affordable region in England, followed by the South West and South East, and the most affordable region is the North East. The local authority analysis shows that six of the top ten least affordable local authority districts are in London (Table 2.2) but the top ten also includes three places from the South West and indeed the top 44 least affordable areas include 19 local authorities from the South West.
Table 2.1 Regional affordability ratios (Average property price by household income 20-39 year olds) 2007
Region Affordability Ratio
London 6.11South West 5.38South East 4.89East of England 4.71West Midlands 3.97North West 3.93East Midlands 3.75North East 3.61England 4.80
Source: Wilcox (2008a) Can’t Supply, Can Rent (Hometrack).

26
Rapid Evidence assessment of the economic and social consequences of worsening housing affordability
Table 2.2 Top 10 least affordable local authority districts
Local Authority Region Affordability Ratio
Kensington and Chelsea London 12.04City of London London 10.51Westminster London 9.33Camden London 8.49Penwith South West 8.37Ryedale Yorks and Humberside 8.24Islington London 7.83Christchurch South West 7.48Hammersmith and Fulham London 7.43Carrick South West 7.21
Source: Wilcox (2008a) Can’t Supply, Can’t Rent (Hometrack)
The Wilcox analysis of 2007 data is based upon mortgage multiples of 3.75 for couples and 3.25 for single households, and an 18 per cent deposit based on the average over the last decade. The latest data from the Council of Mortgage Lenders reveals that the typical mortgage lending multiples for first-time buyers was only 3.07 at November 2008, although deposits were comparable to those used by Wilcox. So house prices would have to fall so that ratios fell to 3 to become affordable or accessible to new entrants.
Changed market conditionsAt the time of writing, no studies have comprehensively assessed how the current market has affected affordability. Crude ratios of affordability, comparing house prices to earnings for the Halifax, Nationwide and CLG suggest that affordability ratios are improving but these do not account for mortgage costs and despot constraints. CML data suggests that the deposits required of first-time buyers are growing and the income multiples used by lenders are falling.
A recent YouGov poll for NHPAU (2008b) found that assuming a 10 per cent deposit and income multiples for mortgage borrowing of three times annual income or four times sole income, 75 per cent of non-homeowners said they would need average house prices to fall below £157,000 before they could afford to purchase. At the time of the study only in the North East is the average house price below this figure, although the study does not report the availability of properties that might be accessible at or below this value, especially as first-time buyers are likely to buy at the lower end of the market not at the mean. Nearly a third of non-homeowners did not anticipate they would ever be able to afford to buy a property although they aspired to own.
Financial markets remain in flux and the subsequent downturn in the housing market does not appear to have bottomed out so how affordability may improve by this market correction is yet unknown. The mix adjusted average price of £226,689 in the third quarter of 2007 for England fell to £217,621 in 2008, a drop of 4.2 per cent (CLG Table 508). However, the decline of house prices differs regionally from a 3.2 per cent drop in the South East to a fall of 6.3 per cent in the East Midlands (Figure 2.6). These data indicate that house prices have fallen less in the areas of

27
2. Characteristics of investors and investment motives
high housing affordability than less expensive regions. Further house price falls are widely forecast for 2009/2010.
Figure 2.6 Percentage change mix adjusted average house prices England
–7
–6
–5
–4
–3
–2
–1
0
Q3 2007-Q3 2008
change %
per
cen
t
LondonSouth East
SouthWest
EastEastMids.
WestMids.
Y & HNWNEEngland
Source: CLG Live Table 508
However, the absolute value of falls in house prices is highest for London, which has reduced by £12,000 over the past year, and the South West where homes have lost £10,774 (Figure 2.7). Of note are areas such as the East Midlands, which has the third lowest absolute decline in value, £10,332, and the largest proportionate fall in value of 6.3 per cent. This suggests that the downturn is maybe having a greater effect on the East Midlands compared to regions like the East and South East where house prices have displayed both lower proportionate and absolute losses.

28
Rapid Evidence assessment of the economic and social consequences of worsening housing affordability
Figure 2.7 Absolute change mix adjusted average house prices EnglandQ3 2007-Q3 2008
–14,000
–12,000
–10,000
–8,000
–6,000
–4,000
–2,000
0
LondonSouthEast
SouthWest
EastEastMids.
WestMids.
Y & HNWNEEngland
absolute fall
Source: CLG Live Table 508
The affordability and sustainability of mortgage borrowing is assisted by the recent and rapid fall in the Bank of England base rate, only 0.5 per cent as of March 2009. However, mortgage rates have lost their once close relationship to the BoE base rate and are tracking the inter-bank lending rate, the LIBOR, which has not fallen so fast or as low as the bank base rate. Reductions in the rates offered for new borrowing are not therefore falling so fast. The Crosby Review (2008) highlights the challenges affecting the UK mortgage industry that can no longer fund mortgage lending as they did prior to the onset of the credit crunch in 2007 because of the collapse of the securitisation market. The banks are experiencing a tension between having to recapitalise and the pressure from government on them to increase lending to homes and business. One consequence of these tighter lending conditions is that banks have re-priced new loans and favourable rates of mortgage lending are only available to those buyers who are low risk, have a large deposit or have already accrued large sums of housing equity in their properties. Indeed mortgage brokers are unable to find suitable finance for nearly a fifth of new borrowers and just over a fifth of existing borrowers seeking to refinance (Crosby, 2008). So even with falling house prices and lower base rates, lending constraints mean access to mortgage finance and affordability for many first-time buyers remains problematic.
To what extent the housing market that emerges from the current turmoil will maintain previous trends of high demand, low supply, liberal mortgage lending and repetitions of the housing market cycles is uncertain. Estimates of household growth still suggest that social and demographic changes in population and households’ structures, namely growth in single households, ageing society, relationship breakdown and migration, will continue (Holmans and Whitehead, 2008; NHPAU, 2008a). Furthermore, house completions have fallen sharply as the house-building industry have scaled back their plans for building out sites due to the market downturn, so

29
2. Characteristics of investors and investment motives
ambitions for increasing housing supply outlined in the Housing Green Paper (CLG, 2008) are likely to be challenging. Combined with a cautious lending market, the latent demand pressures and constrained housing supply may mean that when stability returns affordability pressures will return, making the issue of housing affordability still pertinent.
Why does affordability matter? Rising house prices have frequently had a mixed reception in the UK. Homeownership is the dominant tenure and the investment potential has become increasingly important, so house price inflation is not universally viewed negatively, especially not by those who are already homeowners. Conversely, rising markets have meant significant numbers of households have been unable to access homeownership and wide-spread aspirations to the tenure have therefore not been met.
Access to homeownership is a key policy concern for a number of reasons. Firstly, the overwhelming majority of people in the UK would like to be homeowners. Although aspiration to the tenure declined slightly during the 1990s following the last housing market recession, support recovered and remains strong with 82 per cent of households indicating that homeownership is their preferred tenure (Park et al., 2005). Owner occupation is perceived as offering more security and citizenship benefits than other tenures (Quilgars and Jones, 2007; Rohe et al., 2000), and for low-income owners the tenure represents a proxy for safer appealing neighbourhoods (Edwards, 2006). There is a strong ‘discourse’ in favour of homeownership, as it has come to represent abstract notions of security, independence and pride in possession amongst homeowners, but there are also strong material reasons why the tenure is attractive. The chance for there to be no housing costs in old age and the opportunity homeownership offers to accumulate wealth in the home are important factors in the appeal of the tenure (Munro et al., 2005). Therefore, overcoming affordability pressures may be considered a policy concern, not just to meet public aspirations for homeownership, but because of the prospect for further social inequalities arising from homeowners having access to housing equity compared to renters have no recourse to such assets.
Substantial holdings of housing wealth are the most widely held asset class (Stephens et al., 2005) albeit these assets are unevenly distributed (Thomas and Dorling, 2004). Homeowners have increasingly withdrawn housing equity by remortgaging or trading down and have used housing equity to fund consumption in the wider economy (Smith, S., 2005). Furthermore, studies suggest that many homeowners expect to draw on their equity to supplement pensions and possibly pay for care in older age (Elsinga et al., 2007). The benefits of asset holding have prompted a government ambition to increase the rate of homeownership from 70 per cent to 75 per cent by 2016, but high housing affordability problems are perceived to be a barrier to these policy ambitions and household aspirations (Brook Lyndhurst, 2006). Net equity bound up in our homes was worth £2.4 trillion in 2006, rising from 90 per cent of GDP in 1989 to 185 per cent of GDP by 2006 (Wilcox, 2008b). The potential importance of housing wealth to the financial strategies of individual households and to governments looking for alternatives to welfare funding is immense, although the extent to which this wealth can be realised or accessed is considered to be overstated by some (Brook Lyndhurst, 2006). Arising from this are concerns about those households excluded from homeownership who do not have an equity stake in their home and therefore no access to long run wealth accumulation.

30
Rapid Evidence assessment of the economic and social consequences of worsening housing affordability
The opportunity to accumulate housing wealth through homeownership has led to fears that there will be a growing wealth divide between those who are able to access homeownership and those that cannot (HBF, 2002; Barker, 2003; Thomas and Dorling, 2004; Smith, S., 2005). It is a pervasive argument born out of the significant increase in housing wealth witnessed over the last decade. Not only may there be social inequalities within generations between homeowners and non-homeowners but there are arguments that inter-generational social inequalities arise from constrained access to homeownership, and that the recent increases in housing wealth represent a major transfer of wealth from poor young households to more affluent older (baby boomer) households (Islam, 2007). Lloyd (2007) suggests that this apparent transfer of wealth represents a threat to intergenerational solidarity that underpins pension and health policy.
Winners and losers have long been identified in the housing market (Hamnett, 1999) but if house prices had taken a European average over the last few decades, analysis for Barker estimates that first-time buyers would be £32,000 better off and developers and land owners would be worse off. However, existing owners would be worse off. This highlights the complex attitudes towards house prices in the UK where some people benefit from rising prices where others do not (Table 2.3).
Table 2.3 Distributional consequences of higher house prices
Losers Winners
First-time buyers Retirees/home owners trading downHomeowners trading up Property speculatorsInward Migrants Outward MigrantsOther non-homeowners (i.e. all renters) Landowners
Source: Barker (2003)
If the first-time buyers, other homeowners and migrants are able to access homeownership eventually, albeit in sometimes less favourable circumstances, what happens to the people who rent their home and will therefore never be ‘winners’ in UK house prices?
The public remain uneasy about the constrained access to homeownership because of affordability problems. A survey by YouGov for NHPAU (2008b) found that of the 68 per cent of people still thought housing affordability a problem. Their greatest concern related to the ability of young people to afford to buy a home (34 per cent), but other concerns centred on people taking on too much debt and getting into financial difficulties, the local costs of buying a home and only high earners being able to get onto the property ladder. The Home Builders Federation (HBF, 2002) identify affordability as a major reason to increase housing supply, to resolve problems for first-time buyers and key workers unable to get on the property ladder. However, a report for the Council for the Protection for Rural England argues that housing affordability is not just about house prices but the ability to pay (Europe Economics, 2004). Consequently, they suggest that housing affordability is less of a housing problem and more one of the rigidity of public sector pay packages being unable to reflect local conditions, or of the problems within the housing benefit system. The inability to access a home in rural areas is also considered an outcome of the high costs of homeownership (Taylor, M., 2008). There are also anxieties about young households

31
3. Housing quality and voids
over-stretching themselves in order to achieve homeownership (Shelter, 2008), especially in an environment where the mortgage market is highly sophisticated and the risks sometimes complex to understand (Whitehead and Gaus, 2007).
The volatility in house prices has also been a unique feature of the UK housing market. The sensitivity of the wider UK economy to the housing market is a concern as, through processes of ‘wealth effects’ where housing equity leaks into the economy, rising markets may inflate the economy (Barker, 2003) and conversely may exacerbate any market downturn. Our reliance on short-term mortgages and variable interest rates exposes households in Britain to the fortunes of the markets, exacerbating the upswings and deepening the downswings (Miles, 2004).
The limited ability of households to move to take up new employment in higher cost housing areas is also thought to be problematic as housing affordability may constrain growth and increase regional unemployment (Barker, 2003), particularly public sector key workers who can find it hard to afford homes in some high costs regions (HBF, 2002).
The conceptual map of affordability indicates that affordability concerns may have significant indirect impacts on the proportion of households experiencing absolute affordability problems, which may be expressed as increased levels of acute housing need, represented by growing volumes of homelessness, increases in overcrowding and concealed households (Barker, 2003; HBF, 2002).
Having argued that housing affordability and access to homeownership remain significant concerns for policymakers and the public, the report continues by examining the evidence of how access to homeownership for first-time buyers has changed.

32
Rapid Evidence assessment of the economic and social consequences of worsening housing affordability
Key pointsThe proportion of first-time buyers has declined in the market to around 30 per cent. The •contracting market also means the numbers are much lower.
The evidence for people buying at an older age is mixed as after long run increases in the age •of new entrants to homeownership, the age of first-time buyers has recently declined.
Deposits have become a major barrier to homeownership. Half of first-time buyers now •purchase with financial assistance from their family, raising concerns that homeownership is increasingly more accessible to those whose parents are already homeowners.
Assisted first-time buyers have lower incomes, borrow a lower proportion of the value of the •home as a mortgage, and purchase property that is more expensive and are at risk of higher interest rates. Unassisted first-time buyers have higher incomes, borrow at higher loan to value ratios and buy less expensive property and are at risk of negative equity.
There were fewer 100 per cent plus mortgages amongst first-time buyers but until 2007/8, •they used higher income multiples to obtain mortgages and higher deposits. There is also some evidence that first-time buyers have used interest-only mortgages without any investment vehicles to sustain the mortgage.
IntroductionFirst-time buyers are an important component of the housing market as they introduce capital into the system and facilitate other transactions in property chains (Smith, J. et al., 2005; Andrew, 2004). As discussed earlier the impacts of high housing affordability pressures on young households wishing to buy their first home are of concern to the public and policymakers alike. Undoubtedly, housing affordability has had a direct impact on actual and potential first-time buyers. This chapter reviews the evidence on the changing characteristics of new owners and their mortgage finances.
Market trendsIt was beyond the scope of this review to review the evidence relating to the number of households unable to afford market housing, or the scale of housing needs across the country. However, Table 3.1 provides data on the proportion of young households priced out of the market by region. Wilcox (2008a) offers two measures of the number of households unable to purchase in the market. Firstly, a broad figure that includes all those young households in work, whether in receipt of housing benefit or not, who cannot afford to buy at the lower quartile price for a small two or three bedroom property. Secondly, a narrow figure based upon those not reliant on benefits that cannot buy at lower decile prices. Wilcox offers a measure of the potential demand for, what may have the potential to become, an intermediate housing market for each local authority district within the UK, and Table 3.1 below illustrates the proportion of young households excluded from the housing market by region.
3. Changing access to homeownership

33
3. Changing access to homeownershpi
This analysis shows that even at the lowest decile the proportion of young households unable to buy a home is very high, especially in London, the South West, the South East and East of England. Not all households will want to purchase but for those that do, in some areas their choice to buy is severely limited. Wilcox suggested that if house prices were to reduce by 10 per cent this would reduce the proportion of young households within the intermediate market in England by five per cent.
Table 3.1 Proportion of young households aged 20-39 unable to purchase in the local market
Region Broad Intermediate Market Narrow Intermediate Market
East Midlands 39.8 20.3East 55.3 33.6London 64.4 41.0North East 35.0 16.9North West 39.3 19.3South East 57.6 35.8South West 61.6 40.1West Midlands 41.3 22.0Yorkshire and Humber 41.1 20.5England 50.6 29.6
Source: Wilcox (2008a).
Over the past year, the number of first-time buyers in the market has declined, reducing to 30 per cent of the market (CML, 2008a). The proportion of housing market transactions conducted by first-time buyers has a long run average of around 50 per cent, but by 2004 first-time buyers had reduced to only 29 per cent of the market after a peak of around 57 per cent in 1994 (Smith J. et al., 2005). However, right to buy sales to sitting social housing tenants account for a significant proportion of historic sales, reducing the long run average of first-time buyers in the market to around 40 per cent. However, right to buy sales have declined from 2002/3, when the discounts available were reduced, and by 2004 made only 1-2 percentage points difference to the market. Figure 3.1 illustrates the decline in the proportion of first-time buyers in the market, although this only assesses transactions requiring a mortgage.

34
Rapid Evidence assessment of the economic and social consequences of worsening housing affordability
Figure 3.1 Proportion of house purchases made by first-time buyers
% o
f h
ou
se p
urc
has
es
0
10
% FTBS as of all house purchases
20
30
40
50
60
1974
1976
1978
1980
1982
1984
1986
1988
1990
1992
1994
1996
1998
2000
2002
2004
2006
Source: Council of Mortgage Lenders ML2
However, the proportion of first-time buyers in the market may be influenced by local housing affordability pressures. Smith, J. et al. (2005) noted that there were regional differences in the activity rates of first-time buyers. For example, in Northern Ireland in 2004 mortgage payments represented only 20 per cent of income and first-time buyers made up 33 per cent of the market, compared to the South West where mortgage costs were 24 per cent of income and first-time buyers were only 24 per cent of the market.
Characteristics of first-time buyersThe housing market has become more fluid or ‘fuzzy’ as Santer (2008) suggests, in that there are now frequent moves into and out of homeownership and renting, in both directions, and less of a clear pathway through the market. The question of whether households moving into homeownership are actually true first-time buyers or people returning to homeownership after a period renting becomes more salient, especially when interpreting the data on first-time buyers. This section explores the circumstances of those that appear to be first-time buyers in datasets and their age.
After many homeowners in the 1990s exited homeownership due to mortgage default, Holmans (2001) used the Survey of English Housing (SEH) to estimate that there were still 55,000 households retuning to homeownership a year after renting and that they represented 13% of ‘first-time buyers’ in 1997-1999. A higher proportion of the older age groups that appear to be first-time purchasers are in fact returning households, for example, nine per cent of those under 30 were returners compared to 52 per cent of purchasers over 45.

35
3. Changing access to homeownershpi
More recently, Tatch (2006) found that around a fifth of buyers classed as first-time buyers are in fact households returning to homeownership. The characteristics of these returners are very different to true first-time buyers and so there must be caution regarding the interpretation of some data on first-time buyers. These returners are older and have more substantial deposits. Returners account for less than five per cent of recorded first-time buyers aged under 30, around 30 per cent of those aged between 30-40 and 60 per cent of those recorded as first-time buyers aged 40 or over.
The evidence confirming a rise in the age of first-time buyers is unclear. It has been suggested that in periods of high house prices, the age of first-time buyers rises and so in the boom of the late 1980s the average age of first-time buyers was 34 and so it was again in 2004 with a fall in between (Smith, J. et al., 2005). However, the long run rise in the age of first-time buyers has now reversed. Figure 3.2 shows the changes in age of first-time buyers, unadjusted for those who may be returners to homeownership but uses the median as it better depicts the typical characteristics. The inclusion of sitting tenants conducting right to buy sales could be one explanation as they may have served to increase the mean age, so their withdrawal from the market causes a reduction in age. Or, in the face of sustained boom after the small market dip in 2004/5 there may have been a propensity for younger households to bring forward house purchases before prices rose beyond their means. There is some evidence that young people in the UK have a tendency to do this and enter the market earlier than their counterparts in the US (Andrew et al., 2006). However, the reasons behind the decline in the age of first-time buyers from 2004 are uncertain.
Figure 3.2 Median age of first-time buyers 1974-2007
Median age
24
25
26
27
28
29
30
31
32
1974
1976
1978
1980
1982
1984
1986
1988
1990
1992
1994
1996
1998
2000
2002
2004
2006
Source: CML ML2

36
Rapid Evidence assessment of the economic and social consequences of worsening housing affordability
The most significant change in the age of first-time buyers has been amongst those below the age of 25. Using the Survey of Mortgage Lenders and Building Society Mortgage Survey, Holmans (2001) estimates that the number of first-time buyers under 25 for 1998-99 was 54 per cent below that in 1987-88, of which only 15 per cent can be explained by the reduction in the numbers of people in this age group in the population. However, during this period there was a greater propensity of households aged 25-29 to enter homeownership. It was unclear at the time whether this decline in young homebuyers represented a permanent deferment of homeownership or a continuing reduction in the number of young households entering homeownership. The General Household Survey shows a growth in homeownership amongst the general population during the period 1975 to 2003 but declines in the rate of homeownership amongst the under 30s, which was paralleled by the rise in younger household using the private rented sector (Smith, J. et al., 2005). Moreover, the rise in the proportions of the 25-29 age groups in homeownership in the late 1990s fell away as the proportion once again declined and the proportion of 30-35 year olds has been rising (Smith, J. et al., 2005). Holmans (2005) indicates that although some young cohorts were clearly deferring homeownership, in doing so this may mean that fewer people actually ever move into homeownership in the long-term.
One reason behind the rise in first-time buyer rates during the boom of the 1980s was that there were more households at a stage in life that increased their likelihood of buying during the 1980s as a consequence of the children of ‘baby-boomers’ reaching their twenties during the 1980s. As mentioned above, a partial explanation of the decline in the first-time buyer rate during the housing market slump of the early 1990s was that the numbers of young people had also declined (Holmans, 2001). However, as any anticipated demographic change is neutral, demographics are unlikely to account for any change in prospective purchasers’ behaviour after 2001 (Holmans, 2001).
Research into the changing behaviour of first-time buyers by GMAC-RFC (2005) indicated that just over 50 per cent of non-homeowners felt comfortable with buying their first home in their thirties and for them this was no cause for concern. It is unclear to what extent these responses reflect any adapted preferences in the context of affordability constraints. The survey revealed that the mean age owners expected to buy was 31, but younger adults felt that 28 was the appropriate age to buy a home, although those already over 25 felt that 34 was a good age to buy. These findings reflect evidence relating to the recruitment and retention of key workers discussed in Chapter 7.
Financing the purchaseFinancing entry into homeownership has changed for the peak of the housing boom in the late 1980s. Although recent first-time buyers have used 100 per cent mortgages less frequently than in the last housing boom, borrowing has been on the basis of higher income multiples and higher deposits. The current market downturn and mortgage rationing has meant that income multiples have now reduced and even greater deposits are required to secure a mortgage on favourable terms.

37
3. Changing access to homeownershpi
DepositsCredit conditions or the requirement to build up a deposit to reduce the risk to the lender, have grown in significance as a barrier to homeownership for young households and is an important explanation of the declining rate of homeownership amongst young households (Meen et al. 2008). Figure 3.3 illustrates the changing proportion of mortgage loan compared to the house purchase price for first-time buyers. During most of the 1980s and 1990s a 95 per cent mortgage was typical, but this has declined substantially over the last decade. Moreover, by the third quarter 2008 loan to value ratios had declined to 84 per cent reflecting tighter lending conditions, with the average value of these deposits estimated to be around £24,000 (CML, 2008a).
Figure 3.3 Loan to value ratios for first-time buyers 1974-2008
78
80
82
84
86
88
90
92
94
96
1974
1975
1976
1977
1978
1979
1980
1981
1982
1983
1984
1985
1986
1987
1988
1989
1990
1991
1992
1993
1994
1995
1996
1997
1998
1999
2000
2001
2002
2003
2004
2005
2006
1007
2008
Lo
an t
o v
alu
e ra
tio
(%)
YearSource: CML ML2
Saving for a deposit has therefore been a major hurdle for some first-time buyers to overcome. A study of the British Household Panel Survey (BHPS) from 1991 to 2002 suggests that the inability of many to overcome this deposit constraint contributes to the decline in first-time buyers (Meen et al., 2008). The study shows that there are regional variations in how credit conditions act as a barrier to homeownership. The North East offers less of a challenge to married males in their early thirties compared to London, where the deposit constraint would not be overcome at all for those married males on the lower and second quartile earnings and would only be overcome for those in the third and fourth quartiles earnings until a much later date. In 2005, the median deposit was equivalent of 65 per cent of median income in the three least affordable regions, London, South East and South West (Cunningham, 2005).

38
Rapid Evidence assessment of the economic and social consequences of worsening housing affordability
It is unsurprising then to find that the time taken to save for the deposits has increased. Estimates of the time taken to save the deposit vary from five to nine years, but it is unknown how long first-time buyers actually do take to save the deposit (Tatch, 2007). National Savings indicated that buyers are taking up to 50 per cent longer to save for a deposit than a decade ago (Smith, J. et al., 2005). The Survey of Mortgage Lenders provides details of deposits, which shows that in 2003 28 per cent of first-time buyers had deposits at least as large as their gross income. If the fifth of first-time buyers estimated to be actual returners to homeownership rather than true first-time buyers are taken into account, this still leaves 8 per cent with unusually high deposits. It is clear from other studies that some younger households show little appetite for saving and that many would be unable to raise that level of deposit on their income alone.
Although a major barrier to homeownership for first-time buyers, young people do not always see saving for a deposit as a priority. Some young households do save but many would rather seek funds from family. The evidence suggests that there is a greater focus amongst young people. The evidence suggests that young people focus more on buying lifestyle goods, such as clothes and going out, rather than saving for a home deposit (GMAC-RFC, 2005; Andrew, 2006a). Analysis of the BHPS suggests that 58 per cent of young adults did not save, 16 per cent saved for a holiday and 11 per cent for a house, although 37 per cent saved for no reason (Andrew, 2005). This might suggest a greater propensity to save amongst young adults than suggested. However, even where young households were saving, as prospective first-time buyers have noted, house prices were rising up to 2007 at a faster pace than deposits could be accrued (GMAC-RFC, 2005). Key workers would include in any assessments of their standard of living seemingly ‘essential’ consumer activities and be unwilling to make major sacrifices to achieve one major goal, except for young men who would save for a car or sports equipment (Pocket Living, 2007). Moreover, analysis of the BHPS suggests that young people are also less likely to pay into a private pension in 2005 than in 1995 (Boreham and Lloyd, 2007).
In qualitative work undertaken for the CML (BRMB, 2005), few prospective first-time buyers have saved for a deposit but the savings deposits of those that had were in the region of 5-10 per cent and were derived from student loans, inheritances and parental contributions rather than savings. Some young people did save, but these savings were not of the magnitude to affect the household’s social life or lifestyle, and they used these savings to fund the transaction costs of buying rather than a deposit. There was also an expectation that parents would contribute or that inheritance from grandparents would arrive by the time they were ready to purchase. First-time buyers talked of ‘sourcing’ or ‘acquiring’ the deposit for a home rather than saving (GMAC-RFC, 2005). This was also the case in another qualitative study where key workers from fairly affluent backgrounds knew that parents would assist them with the deposit and so did not show the desperation with being unable to afford to buy a home that key workers from less wealthy backgrounds did (CBRE/Hamptons, 2007). Parental advice was valued over other forms of advice about homeownership, especially for key workers from black or ethnic minority backgrounds, and served to reinforce the disadvantages of people from less wealthy backgrounds whose families did not have knowledge about the housing market to draw upon. Some focus group participants suggested that formally seeking parental advice regarding first purchases also served as an opportunity for parents to offer to financially support their sons or daughters entry into the market. Another CML study found that first-time buyers were less

39
3. Changing access to homeownershpi
concerned with saving for a deposit, as they would ask parents to help or use a 100 per cent mortgage product (Smith, J. et al., 2005).
Income MultiplesThe income multiples first-time buyers used to obtain their mortgages have increased as the affordability of homeownership has declined. It is likely that this is because the income multiple constraints were reached before the loan to value constraint in the 1980s and the situation reversed for the 2000s. Andrew (2005) suggests these credit constraints are one important explanation in the decline of first-time buyers. Although the deposits demanded of new buyers are greater, until recently, the income multiples on which first-time buyers have borrowed were also greater. Lenders were able to increase the income multiples used to assess whether a household can afford a mortgage because of historically low interest rates, but this approach did represent a risk should interest rates rise. Figure 3.4 illustrates the changes in income multiples for first-time buyers.
Figure 3.4 Median income multiples for first-time buyers 1974-2007
0
0.5
1.0
1.5
2.0
2.5
3.0
3.5
4.0
1974
Inco
me
mul
tiple
1976
1978
1980
1982
1984
1986
1988
1990
1992
1994
1996
1998
2000
2002
2004
2006
Source: CML Table ML2
In 1984, first-time buyers used income multiples of 1.99 to obtain a mortgage compared to 3.03 in 2004 (Smith, J. et al., 2005). In the mid 1990s, 85 per cent of loans to first-time buyers typically used advance to income multiples of less than three, with less than one per cent using multiples of four or five (Cunningham, 2005). By 2000, the proportion of first-time buyers using multiples of three or under reduced to 80 per cent and by 2005 to only 40 per cent. Furthermore, by 2005 20 per cent of first-time buyers used multiples of over four and 35 per cent had income multiples of between 3.0 and 3.99. The typical first-time buyer has take out 90 per cent loan to value ratios, which have been static since the 1990s, although in 2006 one in five first-time buyers had a deposit of more than their reported income and one in ten had a deposit of more than double their reported income (Tatch, 2007). However, at these levels many young households were still unable to access homeownership. Now the CML confirms that income multiples for first-time

40
Rapid Evidence assessment of the economic and social consequences of worsening housing affordability
buyers have now declined to 3.07 (CML, 2008a) reflecting a more cautious lending environment but which may also serve to limit entry to the market.
MortgagesIn addition to concerns regarding higher income multiples being used to finance entry into homeownership, the types of mortgage products used by some first-time buyers has also changed. Mortgage borrowing has to a degree been more cautious as the incidence of households using 100 per cent mortgages in this property cycle has been much less than in the peak of the housing boom in the late 1980s. In 1989, a half of first-time buyers opted for 100 per cent or more mortgages compared to only around five per cent by 2006 (Whitehead and Gaus, 2007). One interpretation of the higher level of deposits is that not only have banks been more cautious in their lending but buyers have been more cautious about borrowing (Whitehead and Gaus, 2007). Nevertheless, there was evidence of increasing housing costs and households deferring repayments to make mortgage borrowing more affordable.
Although there have been fewer 100 per cent mortgages, BRMB (2005) did find the use of 100 per cent mortgages and interest-free mortgages was noticeable amongst recent first-time buyers who seemed to be operating at the margins of their finances. First-time buyers suggested they had used these mortgage products, as they would otherwise have been unable to buy the home they wanted. This was supported by a study by the Financial Services Authority (FSA ) (2006) who examined the rise in the use of interest-only mortgages as many of these mortgages appeared to be unsupported by a suitable investment product to repay the principal loan. The FSA study interviewed 857 borrowers using interest-only mortgages and revealed that first-time buyers took out 12 per cent of these loans, a third of which suggested that it was the only way to make their home purchase affordable and a way to get on to the property ladder sooner. Many households who took out interest-only loans planned on converting to repayment mortgages after a few years or had other plans to repay the mortgage such as selling the house, but the study considered some of the reported plans as being unrealistic.
Another consequence of using these mortgage products to minimise the impacts of high housing affordability was the reluctance of these purchasers to take out accident, sickness or unemployment type insurances to pay their mortgage (BRMB, 2005). These recent first-time buyers also had few savings so had limited resources on which to rely should there be an interruption in their income.
Parental assistanceAs discussed, affordability problems for young households wishing to enter homeownership have been severe, with the proportion of income applied to mortgage costs for a two-income couple reaching 34 per cent in 2007 the highest since 1990 (Tatch, 2007). However, the entry of first-time buyers to the market has displayed surprising resilience despite these affordability concerns. One explanation of this and the rising level of deposits used by first-time buyers is that, the financial support of parents or other family members has grown significantly in recent years.

41
3. Changing access to homeownershpi
Using the Survey of Mortgage Lending (SML), Tatch (2006) found that the proportion of first-time buyers under 30 whose parents assisted with their deposit was 46 per cent in 2005 rising from less than 10 per cent in 1995. Updated analysis using the new Regulated Mortgage Survey (RMS) shows that 36 per cent of first-time buyers were assisted (Tatch, 2007). In 2008, parents supported half of all first-time buyers into homeownership by wholly, or partially, financing deposits (CML, 2008a). As highlighted by the Pocket Living study above, this has the potential to increase housing inequalities between those families who already own, and therefore can withdraw equity to fund the next generation of homeowners, compared to prospective first-time buyers who do not have families with financial resources to draw upon.
There are regional variations between first-time buyers receiving assistance (Tatch, 2007). Northern Ireland had the highest proportion of assisted first-time buyers at 48 per cent followed by London, 44 per cent and East Anglia, 40 per cent; compared to only 32 per cent in the North and 33 per cent in Scotland. The areas with the highest level of assistance were those with the lowest level of first-time buyer activity. The updated RMS analysis confirms the older SML analysis that the incomes of assisted first-time buyers differ markedly from those who are unassisted. Assisted buyers purchase properties of greater value and used higher income multiples to obtain the mortgage compared to unassisted buyers, meaning that assisted buyers are at greater risk if interest rates rise and unassisted buyers are at greater risk of negative equity. This pattern held for all regions in the UK. Assisted deposits ranged from £12,900 in the North compared to £57,000 in London, and unassisted deposits ranged from £5,350 in the North compared to £12,500 in London. Assisted buyers also have much lower incomes than unassisted buyers, ranging from £22,500 in Scotland to £40,350 in London, compared to unassisted buyers who had incomes of £29,000 in Scotland to £54,500 in London. It is clear that only those with the highest incomes are able to purchase property unassisted (Tatch, 2006). Unassisted buyers bought cheaper property during the period 1995 to 2005, although by 2005 even assisted first-time buyers bought cheaper property (Tatch, 2006).
Tatch (2007) suggested that parental assistance has maintained the levels of first-time buyers in the market during a period where affordability problems have been a prime concern, but this assistance involves the recycling of housing equity from parents to children and may have complex impacts on the wider housing market. Parental assistance may push up house prices for those entering the market, benefiting those already in the housing market but with adverse ramifications for those entering the market unassisted or for those unable to enter homeownership at all. Continued parental assistance may result in the market becoming more polarised, with the children whose parents are already homeowners representing a greater proportion of all new purchases. In his previous analysis, (Tatch, 2006) also notes that if the source of parental assistance, often converted housing equity from the family home, dries up this may have repercussions for the whole housing market. However, it is of interest to note that at a time when the remortgaging market and equity withdrawal has reduced, the proportion of assisted first-time buyers in the market has still increased. This may represent a lag between the equity withdrawal of the parents and house purchase by the children, but may also suggest that the funding is coming from elsewhere, maybe bequests from grandparents. It is uncertain what housing market repercussions there will be of parents having less housing equity now the market has entered a period of downturn.

42
Young people’s income The deterioration of the income of young people relative to others in the labour market during the 1990s was said to be responsible for a significant proportion of the decline in young households entering homeownership (Andrew, 2004). The New Earnings Survey data shows that the relative earnings between people in their early twenties compared to their late twenties declined during the period 1991 to 1996 by five percentage points for men and eight percentage points for women. Again, it was unclear whether this decline was permanent or temporary and whether the effects of the part of the economic cycle examined brought it about or if the decline represents a structural labour market change. If the answer is the latter then the substitution of tenures, owning for renting, implies that a smaller first-time buyer market will be a permanent feature of the housing market in the future.
The next chapter explores further whether housing affordability has influenced the rate at which young people form independent households and how housing costs may influence their tenure choices.
43
6. Conclusions
Key PointsThe rate of household formation has been lower than official trend-based forecasts predicted •and evidence suggests that housing affordability may have constrained young people from forming independent households.
Demographics factors like age are also important but economic factors such as housing costs •and incomes are powerful indicators of tenure choice.
Young households are less disposed to homeownership in the short-term but do aspire to •homeownership like other households in the long-term.
Changing lifestyles, late entry into the labour market, new student debt, low relative wages, •and delayed marriage and family formation all contribute to deferred homeownership for younger households in addition to housing affordability pressures.
Displaced demand from homeownership has been met by an expanded private rented sector. •Younger households are frequently content to rent privately in the short-term as this tenure provides mobility and flexibility to support changing careers and unsettled lifestyles but do not consider renting a long-term alternative to homeownership.
Demand has also been displaced towards the social rented sector but as there has been no •new supply, the expressions of housing stress, like overcrowding, have grown.
IntroductionIt has long been established in the UK that among the general population there is a strong preference for homeownership, but the previous chapters have demonstrated that as housing affordability has deteriorated fewer younger households have been able to purchase a home. However, numerous complex factors interplay to influence the ability and decision to purchase and this chapter explores the extent to which attitudes towards homeownership and household formation may also have altered during this period. First, the chapter presents the evidence surrounding the relationship between housing affordability and household formation, followed by contemporary evidence on the tenure choices made by young and new households.
Household formation and tenure choicesThere is some evidence that although demographic factors are powerful influences over the rate of household formation, housing affordability has contributed to new households not forming, meaning that young people have had to remain with their parents or share homes longer than desired. Thirty-five per cent of people aged 25-29 remain in the family home and the main reason they suggest for not leaving are that they cannot afford to rent or buy (NHPAU, 2008d).
A number of studies have highlighted significant differences between population based projections of household numbers and survey based or market-driven projections and suggest the explanation is that fewer households were able to form due to high housing costs (Blake, 2007; Meen and Andrew, 2007). Analysis of the Labour Force Survey data shows significant departures between the CLG estimates of household numbers and the significantly lower numbers suggested in this survey, particularly from 2001 for younger households and in London (Blake, 2007). Although the survey has small samples, the magnitude of the difference in projected and
4. Household Formation and Tenure Choices

44
Rapid Evidence assessment of the economic and social consequences of worsening housing affordability
suggested actual numbers of new households suggested a truer picture of constrained household formation. There is a clear negative correlation between house price to earnings rations and household representative rates during the last decade. Meen and Andrew (2008) also find a difference between higher official projections and market based modelling that includes housing affordability rather than just trend-based predictions. Again these differences are more acute in regions with high housing affordability problems like London and the South West, although it is noted that the modelling is subject to error but does serve as a framework for thought. Analysis of the SEH also shows that household formation fell 14 per cent between 1999/0 and 2006/7 (NHPAU, 2008d).
This set of analyses do suggest possibly 1.2 million households being unable to form (NHPAU, 2008d), and therefore an increase in the household size, which for the South East is estimated to rise from 2.35 in 2004 to 2.45 in 2029 (Meen and Andrew, 2008). However, analysis is dependent on various assumptions. Firstly, that the private and social rents will rise in line with costs of homeownership, which hasn’t happened. Secondly, the results are dependent on the rate at which the private rented or social rented sector are able to expand to meet the additional demand and lastly, or whether there will be any additional supply of dwellings.
However, there are regional variations and issues of path dependency, as to whether people choose to form or dissolve households when confronted with housing affordability problems (Meen and Andrew, 2008). Where many people live at home the propensity to leave home in times when housing costs are high will be low, compared to areas with an older age profile where more people may have left home already and continue to do so as prices rise, leading to differences in the sensitivity to housing affordability of household formation rates.
Furthermore, during the 1990s, demographic factors contributed to the decline in household formation and economic factors explain the choice of tenure (Andrew and Meen, 2003). As mentioned, Holmans (2001) shows that there were fewer young people during the 1990s than in the 1980s so the rate of household formation declined. The size of particular age cohorts is important but so too is the age, which was found to be a factor that influenced household formation rather than tenure choice, indicating that young people are unconcerned with what type of housing services they consume (Andrew, 2004).
Bramley et al. (2006) also found that demographic factors and age are more influential explanations of household formation amongst young people than income, unemployment and other economic variables or the availability and cost of housing, which while offering some influence over the rate of household formation, were overshadowed by other issues. However, high house prices have a significant negative effect on rate of headship of under 25s, and unemployment increases the rate of household formation for the over 25s, while low social class decreases the rate of household formation for this age group. The supply of housing also influences the rate of headship amongst young households. There is an increase in 16-24 year old households in areas where there is a good supply of private renting or, amongst the under 25s and the 30-34 age group, in areas that have a high supply of social renting. Bramley et al. argue that to a degree this is in accordance with economic theory that suggests higher rates of household formation will occur if there is an increase in housing supply. Ermisch (1999) used

45
4. Household Formation and Tenure Choices
BHPS data from the 1990s to show that higher house prices and tighter housing markets significantly reduced the rate of young people leaving home and that higher house prices discouraged the formation of partnerships. Higher house prices also increased the likelihood that people would remain at home with parents. In addition, unemployment increased the chance of leaving home but along with high house prices, increased the probability of a young person returning home.
Evidence from a study of rural housing markets found further evidence that housing affordability produced delays in young adults forming new households (Monk et al., 2006). This may be because of the additional problem of the restricted supply of rented accommodation in rural areas, resulting in young people remaining in the family home longer than desired, which was a source of family conflict.
The proportion of new households moving away from the family home has remained the same between 2001/2 and 2005/6, but the proportion of newly formed households who said they previously lived with parents reduced from 81 per cent in 1998 to 68 per cent in 2005, and the proportion of those who lived with other people (not partners or parents) rose from 9 per cent to 17 per cent (NHPAU, 2008d). This suggests that young people are increasingly sharing with others before forming fewer separate independent households.
Analysis of the SEH shows that in 1999/0 40 per cent of newly forming households entered the private rented sector, 34 per cent went straight into owner-occupation and 25 per cent into social renting. By 2005/6, the proportion of new households entering the private rented sector rose to 48 per cent, those moving straight to owner-occupation had reduced to 32 per cent and only 20 per cent moved into social renting. For young new households aged 15-35 the transformations are more acute, as 57 per cent of young new households entered private renting and only 22 per cent owner-occupation (NHPAU, 2008d).
The evidence for the effects of housing affordability on tenure choices is clearer. Although attitudes towards homeownership and the private rented sector have shifted, there has been unmet demand for homeownership that has largely been displaced to the private rented sector. Private renting has expanded to meet this demand, unlike the social rented sector where declining supply has increased expressions of housing stress. These issues are discussed below.
Homeownership Homeownership appeals to UK households for several reasons. It offers the physical attributes people desire in a home and neighbourhood, it offers important abstract notions of security, and has become a significant source of material wealth. Exploring the decline in support amongst young households further it seems most young households do still aspire to homeownership in the long term but not in the short-term. This section explores the various reasons that contribute to this sentiment including housing affordability, as well as the relative short-term appeal of the private rented sector amongst this mix.
The level of support for homeownership in the UK has varied but has been consistently high. Support for the tenure reflects the fortunes of the housing market and indeed grew between 2003

46
Rapid Evidence assessment of the economic and social consequences of worsening housing affordability
and 2007. By 2007, some 78 per cent of households suggested homeownership would be their preferred tenure in two years time and 84 per cent in 10 years time (Pannell, 2007). However, although the level of support amongst the under 25s who indicate homeownership is their preferred tenure in two years time has risen to 50 per cent in 2004 from 37 per cent in 2003, in 1989 79 per cent said it was their short-term preferred tenure. There has been a sharp decline in the youngest households short-term aspiration to own, but over the long term, 84 per cent of under-25s say they would like to be homeowners in ten years time reflecting the prevailing rate amongst all households. There are also regional differences in the aspiration to own, largely reflecting the rate of homeownership in each area. In London, the aspiration to own in two years time was over 70 per cent compared to the North West and South West where it was over 80 per cent (Pannell, 2007).
Homeownership has been consistently associated with offering security in a home, pride in possession and independence (Munro, 2005; Jones et al., 2006). Several qualitative studies highlight that the important attributes a home should offer are control, security, good neighbourhood, good amenities, and close proximity to family and friends and these qualities were widely associated with homeownership (Regan et al., 2001; Edwards, 2005; Notting Hill Housing, 2007). However, although homeownership understood to be a proxy for these components of home, people recognised that other tenure could fulfil these qualities as well. Many low-income non-homeowners said that they did not anticipate ever being able to afford a home and for some the risk and responsibility of homeownership outweighed any perceived benefits (Edwards, 2005; Notting Hill Housing, 2007).
The normalisation of homeownership as a tenure has meant that some people felt stigma attached to being unable to purchase a home, with feelings of failure or bitterness at not being able to enter the housing market (CBRE/Hamptons, 2007) especially for those over 30 (Edwards, 2005). In a studies of a house price boom in Edinburgh and of the ability of homeownership to assist those in ill-health (Smith, 2008), participants highlighted the expectation of homeownership in modern society and some respondents felt stigmatised if they remained non-homeowners into middle age.
Becoming increasingly important is the issue of home as an investment good. In Smith, J. et al. (2004) participants were often content renting, but they entered homeownership due to a basket of factors, that included the above sentiments of security and location for example, but also because financial imperatives made it worthwhile to do so. The appeal of citizenship benefits compelled homeowners to purchase less than ‘the very practical, material, raw financial deal they feel the housing system extends to households who rent compared to those who own’ (Smith, S. 2008, p521). It is common across studies for people to discuss renting as ‘dead money’ with nothing back (Jones et al., 2006; Smith J. et al., 2004). Participants in these studies saw renters financially disadvantaged compared to owners because of the financial burden of housing extends into old age for renters and that rent was just ‘lining someone else’s pockets’. Previous generations may have been prompted to purchase because of the desire to raise a family in their own home, but it is the investment potential of homeownership that is a strong motivator of a new generation, an investment that can supplement retirement income and be useful for their children later in life (CBRE/Hamptons, 2007). Key workers were also found to believe that

47
4. Household Formation and Tenure Choices
entering homeownership was the only way in which they would amass any significant wealth in their lives that could support them in retirement and provide a decent home for their children. They believed that in life other tenure were necessary but regrettable.
So, if more people want to own their own home why do fewer young people purchase and defer homeownership?
Sixty-three per cent of prospective first-time buyers surveyed for the CML said that house prices were the most significant factor affecting their entry to homeownership, while 56 per cent said that they would be encouraged to buy if house prices fell (Smith, J., 2005). However, the prospect of falling house prices also deterred 11 per cent of first-time buyers. Low incomes and job insecurity were cited by over 30 per cent of prospective buyers and ten per cent thought the greatest barriers were the deposit and transaction costs. Andrew (2005) analysed the BHPS and found that even controlling for lower rates of household formation amongst young households credit constraints remained an important barrier to homeownership. A qualitative study of young adults found that other factors conspire to delay house purchase, such as later entry into the labour market fuelled by an increase in higher education and delayed marriage and starting a family, was of similar importance to financial considerations (GMAC-RFC, 2005). Young people described changing lifestyle preferences where it was important to have freedoms and independence into the late twenties at the expense of making a commitment to house purchase. This study suggests that interpreting the cultural shift in the tenure preferences of young adults and the rising age of first-time buyers being indicative of a cohort of people priced out of the market is wrong.
Several studies identified delays in getting married and starting a family. As mentioned, young adults often associate house purchase with ‘settling down’ and common triggers of starting a family or getting married are happening much later. The average age of marriage for men is 31 and for women is 29 compared to 25 and 21 respectively just 20 years ago (GMAC-RFC, 2005). Similarly, the age when people have their first child has risen from 25 to 27 during the same period. BRMB (2005) found that there was a ‘right time’ in terms of life stage when it was appropriate to buy a home. A secure and settled relationship, prior to or just after marriage, prior to the birth of children, and ‘around 30’ which was seen as a settling down age. In the South of England career and relationships were perceived to be settled by the late 20s or early 30s, compared to those in the North of England considering these issues to be resolved by their mid to late twenties. Qualitative research in the South East, where house prices are generally high, showed how some households had deferred house purchase but accepted this and suggested that the decision to buy was dependent on feeling settled in work or in their personal lives and that maintaining their lifestyle was important to them (Smith, J. et al., 2005).
Andrew (2004) examined the BPHS for evidence of the impact of various events or circumstances on the rate of household formation, to establish their role in explaining the lower rates of ownership amongst young households. The presence of a child raises the likelihood of entering social housing, perhaps as it increases ‘housing need’ a threshold used to ration this resource. Marriage increases the chance of a household being owners, as does acquiring a partner, but ill health reduces the chances of ownership. Similar negative events, such as unemployment and relationship breakdown increase the likelihood of renting in the social or private sector rather than

48
Rapid Evidence assessment of the economic and social consequences of worsening housing affordability
owning. Half of all those who marry would enter homeownership compared to only 11 per cent of those entering cohabitation (Ermisch and Halpin, 2000). This association of homeownership with life events such as forming a couple and starting a family were also identified as a factor in the retention of experienced staff in the public sector who had reached an age when they wished to move into homeownership and is discussed in Chapter 7.
Young households’ unwillingness to compromise on the quality of the property they could afford and a preference for renting in fashionable areas close to city centres is highlighted as another barrier to homeownership (GMAC-RFC, 2005). One study found that would be first-time buyers sought common characteristics from an area in which they would buy: a safe neighbourhood, an easy commute and near a station and near to family and friends (CBRE/Hamptons, 2007). Prospective buyers would only consider locations if they met the above criteria and would not move somewhere just for lower prices, with some saying they would rather rent than buy in a bad area. BRMB (2005) found that the first-time buyers who had actually bought were realistic about the types of areas that they could afford and once settled on an area made compromises about the type of property they purchased, buying a flat rather than a house, for example. However, the study did not reveal the property or locational preferences of those who had not bought.
CML data (CLG Table 534) reveals that more first-time buyers are buying flats and maisonettes and the number buying semi-detached, detached and terraced housing has declined. There are two ways to interpret this data. On the one hand, buying flats may reflect a choice to consume less housing because of the affordability constraints as first-time buyers can no longer afford to buy higher up the ‘property ladder’. On the other hand, the data may reflect the greater volume of development of new build flats in recent years. Indeed a recent report cited that the housing affordability problems of first-time buyers as one factor that has contributed to the growth in the number of apartment developments in recent years, alongside the growth in the buy to let market and intense competition for land under planning policy (DTZ Consulting, 2007). DTZ suggest that affordability pressures have influenced the vicious circle that has led to the development of small apartments as first-time buyers want smaller property at lower prices, but also those who cannot afford to buy rent, which has in turn fed the buy-to-let market.
The growth in solo living also has implications for the affordability and rate of homeownership. Thirteen per cent of the population lived alone in 2006, four times the amount in 1960, and this may rise to 18 per cent by 2026 (Bennett and Dixon, 2006). Although the elderly remain the most likely group to live alone, most commonly because they have outlived a partner, there has been a sharp rise in people aged 25-44 living alone permanently, especially amongst young men. There are more single people in homeownership but there has been a decline in the aspiration to and the expectation of achieving homeownership amongst single people (Bennett and Dixon, 2006). The gap between the aspiration and expectation has widened. Furthermore, the SEH shows a decline in the rate of homeownership amongst young households, as discussed, but this decline is also apparent amongst single people under 45. Single adult households only have one earner, which is likely to increase the impact of affordability problems, but also exposes households to increased risk as a loss of employment removes all household income.

49
4. Household Formation and Tenure Choices
Social class also increases the probability that a household would enter homeownership, and analysis of the BHPS supported this even when controlling for family formation, education, income and employment (Ermisch and Halpin, 2000). Increasing income and employment also raises the chance of entering homeownership, but 20 per cent of those in managerial or professional employment entered homeownership per year compared to only five per cent of people in manual occupations. They highlight that social inequality explains entry to homeownership as the entry rate reflect class gradients, but that this is compounded by the institutional support for those in less advantaged positions entering social housing. This study pre-dates the significance of parental assistance to first-time buyers but does underline concerns about the potential of homeownership to reinforce social inequalities.
Student debtThe previous sections have highlighted the importance of extended education and deferred entry to the labour market as factors that contribute to delayed entry to homeownership. One outcome of the expansion of higher education is the common incidence of large sums of student debt that may also affect entry to homeownership.
Ninety per cent of adults complete their education by the age of 23 and therefore attending full-time further education cannot be an explanation for the reduced homeownership rates amongst young households (Andrew, 2004). Rather, higher education does have consequences for current wealth and meeting lenders credit requirements, as there have been limited opportunities to save because of the delayed entry to the labour market and the accumulation of debt.
Potential first-time buyers in a qualitative research study all suggested that lenders do not consider student loans for mortgage applications (BRMB, 2005). However, Spencer (2003) notes that lenders treat student debt as any other debt and discount the proportion of income devoted to maintaining repayments on the loan, when assessing the mortgage. The lenders surveyed by Spencer did offer some flexibility for certain professions as lenders tried to accommodate changing circumstances of less risky first-time buyers, and provided specialised mortgage products such as guarantor mortgages (where a parent may undertake to meet any repayment arrears). Estimates of student debt doubled between 2000 and 2002, but the increase in student debt has been more apparent in the C2DE than AB social groups. Spencer suggested the impact of student debt on the firs- time buyer market might be more significant in the future.
A study into graduate homeownership in the early 1990s showed that student debt did not have a significant impact on the rate of homeownership, suggesting that dual incomes, length of time in employment and whether a gift or inheritance was available were greater factors that contributed to whether a graduate household would purchase (Rosser, 1999). In England, the student loan system and the introduction of top up fees have changed since this early study. A new student loan system was introduced from 2006/7 and the impacts of the anticipated increases in student debt were simulated by Andrew and Meen (2006). Under this new system, students from families earning under £25,000 were expected to accumulate £19,340 debt compared to £12,340 under the previous system of funding higher education.

50
Rapid Evidence assessment of the economic and social consequences of worsening housing affordability
Their simulation model examined a range of young households who were non-graduates, graduates and high-flying graduates and found that the new student loan system would delay most graduate households’ entry into homeownership. As more young people have attended higher education, the grade inflation in the labour market has meant that the expected returns from having a degree have not materialised in quite the way expected when the student loan system was introduced. There are now graduates in non-graduate jobs that have the debt burden of higher education but not the higher graduate income with which to repay the debt. Andrew and Meen (2006) found that the time taken for a typical male graduate to repay his loan would rise from 11 years to 18, and for female graduate from 12 years to 25 (if career breaks for children are assumed) under the new regime. Graduate high flyers are likely to repay student debt more quickly at only 15/16 years respectively. A typical graduate couple would wait four more years before becoming a homeowner. This analysis did not factor in parental assistance, which may reduce the time to purchase for these households, but the analysis suggests that graduate entry to homeownership is constrained for longer than under the previous student loan system. Estimates therefore suggest that higher student debt is a significant barrier to homeownership, especially for graduate households who do not command graduate salaries.
Although the full impact of the new student loan system is yet to be realised, there was mixed evidence about how young adults perceived the impact of student debt. Qualitative work by BRMB found that first-time buyers did not feel that student debt or other unsecured borrowing impacted upon their decision to buy (Smith, J. et al., 2005). However, young non-homeowners did feel that other debts, like car loans, credit cards and debts to parents added to the student debt, and acted as a barrier to homeownership meaning many felt unable to save for a deposit or make a commitment to take on more mortgage debt (GMAC-RFC, 2005).
Private rented sectorHousing affordability may have impacted upon the rate at which young households have entered homeownership, but there has been a parallel expansion as a result of displaced demand in the private rented sector over the last decade.
The private rented sector has increased from nine per cent of all households in 1988 to 12 per cent by 2008, and the proportion of under-30s that rent privately has increased from 33 per cent in 2001 to 43 per cent in 2007 (Rugg and Rhodes, 2008). A number of studies suggest that young households prefer the private rented sector for a number of reasons. The mobility private renting affords people in the early stages of their career is important and sharing with other young professionals can provide a social life and ensure a higher quality of property can be obtained than would otherwise be possible should they have bought or rented alone (Heath and Kenyon, 2001). Indeed three quarters of non-homeowners in a survey suggested that renting gave them the independence to move out of the parental home without the financial commitment of homeownership (GMAC-RFC, 2005). Furthermore, 70 per cent said that renting allowed them to move within the labour market or live close to their friends. Young people were often influenced by their parents’ homeownership and therefore remained committed to homeownership and saw it as traditional and part of growing up (BRMB, 2005). Renting and living at home were short- to medium-term acceptable alternatives that allowed young adults the opportunity to save and renting provided flexibility enabling them to move relatively quickly and had limited responsibilities.

51
4. Household Formation and Tenure Choices
In contrast to house prices private rents have only kept pace with earnings growth and have actually fallen relative to house prices and housing costs (Wilcox, 2008a). Sharing a rented home also provided emotional support for some young professionals but also provided additional pressures when new relationships were formed (Heath and Kenyon, 2001).
Social rented sectorIt has not been the intention of this report to duplicate the evidence assessment of the impacts of worsening affordability on the social rented sector already conducted for the NHPAU (NHPAU, 2008c). However, the literature searching identified a few studies that contained evidence relevant to the NHPAU questions. The social rented sector has not increased supply to match the displaced demand and so the indicators of housing need and stress have grown.
The impact of housing affordability on the sector has been to both increase demand for the sector and reduce supply, which has meant that the indicators of housing stress have risen (NHPAU, 2008c). The Bramley model estimates that the net annual housing need for social housing rose from 93,000 in 2002 to 155,000 by 2006. However, the letting rates for social housing have reduced during the period of rising prices. In 1998/9 there were 334,000 new lets compared to only 210,000 by 2006/7.
A series of mixed method studies formed part of an examination into the future demand for social housing by CCHPR (Clarke et al., 2008). Young households with children who cannot afford homeownership are the most likely to make applications for social housing in preference to the private rented sector because of the additional security and affordability it offers and these households have increased in some areas (Clarke et al., 2008). Demand for social housing relative to supply is greatest in London, but the sector is no longer characterised by low demand in the North, as the geographical divide is now one of the degree to which social housing is in demand. Furthermore, the high cost of market housing has meant that social housing re-lets have declined as those tenants who were willing and able to leave have been constrained from doing so because of high housing affordability in the homeownership market. There has been a trend towards further residualisation of the social housing sector so that as it shrinks it is only available to those with the least resources to purchase or rent in the private sector. Evidence suggests that single unemployed tenants move in and couple working households move out. However, housing affordability problems mean that households that move into employment whilst social housing tenants, and would otherwise have moved on to homeownership, are no longer able to do so, so long-term trends may mean that the proportion of employed households in social housing increases. However, the low and declining rate of re-lets means that any changes are slow to display themselves.
Analysis of the Bramley-Leishman model and CLG Affordability model both support the view that low affordability reduces the number of vacancies in the social and rented sectors and so inhibits household formation (NHPAU, 2008d). This can lead to a reversal of the downward trend in the size of households, as at the most, possibly a million new households are prevented from forming if the private rented sector does not expand further or social lets do not become available. Overcoming housing affordability problems in the owner-occupied sector can therefore have positive impacts on the social and private rented sectors. The analysis supports the view that

52
Rapid Evidence assessment of the economic and social consequences of worsening housing affordability
building of more social homes alone would not resolve the affordability problems in the wider homeownership market.
There was little evidence of links between homelessness and housing affordability and it is unsure if this is because few studies have focussed upon the relationship between the wider housing market and homelessness or, perhaps more likely, a function of the searching terms. Data on homelessness is difficult to interpret. Homelessness applications and acceptances were rising until 2004/5, but since then the numbers have declined, as the way homeless advice and applications are handled has emphasised prevention.
OvercrowdingOne possible outcome of housing affordability pressures is that there may be a higher incidence of overcrowding. There is little evidence directly linking the affordability of market housing to the incidence of overcrowding in any tenure, but the evidence of increased pressure on social housing sector is an important context to the following evidence about overcrowding. This section firstly addresses the scale of overcrowding generally, the extent of overcrowding within homeownership and the effects that overcrowding has on household members.
The current statutory definition of overcrowding dates back to 1935 and as it includes most rooms as habitable space is inapplicable to today’s accepted standards of living. Families must endure extreme levels of overcrowding for a household to be statutorily overcrowded For example, children under 12 months are not counted, living rooms and large kitchens may be acceptable places for children to sleep and children under 10 are only counted as half a person (Shelter, 2005). The most common definition of overcrowding today is the Bedroom Standard, which states that a single bedroom is applicable for: couples, people over 21, pairs of children under 10 regardless of gender, pairs of children aged 10-21 if same gender, and an unpaired child may share with a person 10-20 of same gender.
A report by Shelter (2004b) found that nearly 75 per cent of households who are overcrowded are families with children, and that nearly one child in ten in England live in overcrowded conditions. Over a third of overcrowded households live in London and that nearly one child in three in London’s social housing sector are raised in an overcrowded home, and one in four children in the private rented sector. Households from black and ethnic minority (BME) groups are more than six times more likely to be overcrowded and half of overcrowded households in London are from BME groups.
Using the Bedroom Standard, the latest figures from the SEH (2006/7) suggest that 2.7 per cent of households overall are overcrowded but this differs regionally: in the south, 3.2 per cent of households are overcrowded compared to 2.0 per cent in the north. Within these regions, the rate of crowding differs, with London having 6.0 per cent of households below the bedroom standard, compared to the South West where 1.5 per cent are overcrowded. The rate of overcrowding differs between tenure as well. Only 1.4 per cent of homeowners in England are overcrowded compared to 5.1 per cent of private renters and 5.9 per cent of social renters. In the south, the number of social renters in overcrowded conditions rises to 8.0 per cent, compared to 3.3 per cent in the north. The rate of overcrowding amongst homeowners is the same across the regions

53
4. Household Formation and Tenure Choices
suggesting the pressure is on social renting and private renting particularly in the southern regions. However, it would be a mistake to assume that overcrowding was not a problem in owner occupation. Homeownership is the dominant tenure so although the proportion of crowded homes is less, in absolute terms the problem may be considered comparable to social housing, as there are 200,000 homes in owner occupation that are overcrowded, compared to 125,000 in private renting and 229,000 in social renting.
Although in terms of the numbers of households, the incidence of overcrowding amongst homeowners is comparable to that in private and social renting, unlike those tenure, the extent of overcrowding has been reducing in homeownership, whereas it has been increasing amongst private and social renters (Figure 4.1).
Figure 4.1 Overcrowded households by tenure 1984-2005/6
0
500
1000
1500
2000
2500
3000
owner-occupied private rented social rented
1984
1988
1993
/4
1996
/7
1997
/8
1998
/9
1999
/0
2000
/1
2001
/2 -
nw
2002
/3
2003
/4
2004
/5
2005
/6
hous
eho
lds
tho
usan
ds
Source: Survey of English Housing Live Tables S132
A systematically conducted literature review suggests that there is good evidence of a relationship between overcrowding and the health of children and adults (ODPM, 2004). In addition, there is evidence that overcrowding in childhood also influences adult health. There was a clear evidence of the relationship between overcrowding and meningitis, some evidence of the overcrowding affecting respiratory problems (although the confounding factors of household deprivation, mould and damp requires further investigation), and tuberculosis. There was mixed evidence relating the effect of overcrowding on mental health, but good evidence that drew out the differential effects of overcrowding on health, education or people from ethnic backgrounds was absent. There was some evidence of overcrowding affecting children’s social and emotional development and physical stature but it was unclear as to whether this was independent of any confounding factors.

54
Rapid Evidence assessment of the economic and social consequences of worsening housing affordability
Parents also report severe problems that threaten their health and wellbeing. Shelter (2005) surveyed 505 households on waiting lists for social housing to examine the impact of household overcrowding. Almost all households had children, 437 were overcrowded, 152 of these severely, and most of these households lived in one or two bedrooms flats. The six effects of overcrowding that households agreed were the priority were the lack of privacy in the home (92 per cent); depression, anxiety and stress (88 per cent); not enough room for children to play (84 per cent); children argue and fight (81 per cent); sleep disturbance (75 per cent) and not being able to have friends over (72 per cent). When invited to convey in their own words what impact overcrowding had on their lives, households reported strained family relationships (65 per cent), poor child education and development (49 per cent), health problems made worse (48 per cent) and no privacy or space (44 per cent). Around three quarters of people had children sleeping in their rooms. Half of severely overcrowded and a quarter of overcrowded households said they had a child sleeping in a room not designed as a bedroom, usually the living room. One in ten overcrowded families also reported teenage children of the opposite sex sharing bedrooms, which was a major cause of conflict or anxiety. The study does not indicate the tenure profile of the survey respondents, although it is likely most are already in social housing, but 11 per cent indicated that the reason they were overcrowded was because they could not afford a larger property. Seventy-two per cent cited the reason behind their overcrowding as the short supply of larger accommodation and this is a particular pressure within the social housing sector.
The following chapter explores the impacts of housing affordability constraints on the labour market, business and the delivery of public services

X. Xx
55
Key pointsKey workers are amongst the households excluded from the housing market in several •regions or local hotspots, especially in Southern England. Some studies may overestimate the problem as they use single earnings alone and not household income, which would recognise that some key workers have working partners.
The impact on recruitment and retention of key workers appears to be problematic in several •locations and is particularly linked to the retention of skilled key workers once they have been in post a few years and reach the age at which they wish to settle and buy a home. In some places, this has an impact on services, as there are instances of younger less experienced people in key responsible posts.
Labour market impacts of low housing affordability are not confined to the public sector, but •are experienced less intensely but other employers.
The evidence on the impact of high housing costs on employment related mobility is mixed. •Although some assert that homeownership reduces mobility, the evidence suggests that homeowners do move away from regions of high unemployment, but, although high cost regions deter mobility, people move to contiguous regions and commute.
IntroductionWorsening housing affordability has meant wide-spread aspirations towards homeownership have remained unfulfilled for many households, which may have served to frustrate many, or has meant that some people experience stigma. However, it is clear that the high costs of entry to homeownership have also contributed to problems regarding recruitment and retention in some sections of the labour market. Employees are willing to move to ensure that their aspirations to ownership are met.
Professional or workplace factors contribute to recruitment and retention problems within key public services. However, the inability to achieve homeownership in some locations has meant that some experienced staff have moved away from high cost areas and been hard to replace. This causes problems for service delivery through vacant posts and high staff turnover.
The private sector has also experienced problems with high housing costs but in some instances has a greater ability to increase salaries or staff benefits, or even provide low cost accommodation for some groups of workers.
This chapter examines the impact of high housing affordability problems on local labour markets. The evidence for recruitment and retention problems within core public services and the private sector is considered. Lastly, the chapter briefly examines the impact of housing affordability on labour markets and communities within rural areas.
Employee affordability problemsSeveral studies indicate that key public sector workers are amongst those households priced out of the market in some areas of England. In 2007, the average house price was unaffordable for all key worker occupations in 70 per cent of towns across Great Britain compared to 65 per cent in
5. Public services and the Labour market

56
Rapid Evidence assessment of the economic and social consequences of worsening housing affordability
2002 (Halifax, 2007). Nurses and fire-fighters faced the greatest hurdles in accessing homeownership, 99 per cent of towns were unaffordable to a nurse and 97 per cent of towns were unaffordable to a fire-fighter. For teachers, 77 per cent of towns were unaffordable compared to only 45 per cent in 2002. Seventy-two per cent of towns were unaffordable for police officers in 2007 compared to only 36 per cent in 2002. The average house was unaffordable to key workers in all 32 London boroughs and all 34 towns surveyed in the South West. Truro in the South West and Buxton in the East Midlands had experienced the greatest deterioration in affordability over the previous five years. Surrey was the least affordable county for key workers, and Gerrards Cross in Buckinghamshire was the least affordable town, followed by Kensington and Chelsea in London and Weybridge in Surrey.
Some areas have localised problems. Evidence from Devon found that coastal areas, rural areas and Exeter are affordability hotspots for this group (EKOS Consulting, 2007). Local housing market analysis showed that although key workers have a preference for homeownership, entry to the lowest end of the market, a one bedroom flat in Exeter, was unaffordable for 46 per cent of local authority staff, 33 per cent of nurses, 29 per cent of those in education and 21 per cent of police officers. Some areas of Northamptonshire like Corby were affordable to key workers, but other areas like South Northamptonshire displayed affordability problems in excess of those found in some areas of the South East , but did not attract investment to assist key workers into homes (Sherwood and Jones, 2005).
Evidence emerged to suggest widespread affordability problems for key workers but also surprisingly high rates of homeownership amongst key workers. Other factors influence the propensity to buy and one of the obvious factors is that many affordability studies base analysis on single purchasers not couples. In addition, the timing and location of entry to homeownership will also explain the existing rate of homeownership where as the studies are examining only current affordability problems for new entrants (EKOS Consulting, 2007; Sherwood and Jones, 2005). The Halifax analysis is based upon the earnings of individual key workers salaries obtained from the Annual Survey of Hours and Earnings, compared to the average first-time buyer house price for a given region or town. However, this analysis provides only a crude illustration of the affordability issues as the analysis omits mortgage costs and household rather than individual earnings. The Halifax data is therefore likely to over-estimate the impacts of low housing affordability upon key workers.
Roger Tyms (2003) acknowledged that some key workers might have partners. In a study of key workers in the Cambridge area only a third of the under 25s had partners, but for 25-29 year olds half had a second income in the household and for those over 30 over 60 per cent had a partner. A study of key workers in Hertfordshire found key workers would require partners on substantial earnings to be able to buy in high cost areas like St. Albans (CCPHR, 2004). A 5 per cent deposit and income multiples of 3.5 were assumed, but key workers in their late twenties earning between £19,000 and £25,000 per year, would need a partner to earn in the region of £30,000 to £36,000 to purchase. There were several places in the region where homes for two income households including a key worker were affordable for partners’ earnings around £20,000; two thirds of local authorities were affordable for nurses in this situation and 38 out of 49 districts for teachers. Including household rather than individual income gives a more accurate assessment of the extent of affordability issues for prospective first-time buyers and key workers (Wilcox, 2003).

57
5. Public services and the Labour market
The stock of key worker jobs has increased 25 per cent in England between 1998 and 2005, which may explain why this issue gained prominence (EKOS Consulting, 2007). High housing affordability is problematic for public sector workers as they frequently command lower wages with fixed salary scales and their employers are unable to respond to local housing conditions so easily. Salaries of public sector workers in the Cambridge sub-region are largely above median earnings except for nurses who only reach above median earnings after three years in post (CCHPR, 2001). For the pressured areas of Cambridge City in 2001 a single person would require an income of £39,285 to purchase an average priced house or £47,790 for a couple. Neither the mean nor the median incomes in the local area approach these high levels with the mean income in Cambridge City at £20,800 per year and the median £15,000 per year. In other areas of Cambridgeshire the earnings are significantly less and so there are many households unable to afford to buy in the area. However, a study in Surrey (Morrison and Monk, 2006) found that both public and private sector employees were affected by the housing affordability problems in the county, which had the potential to impact adversely on the local economy. Households finding it difficult to access homeownership would also find it difficult to access adequate housing in the private rented sector. Pay for nurses, teachers and police officers are below the average income in the county and key worker employees would require income multiples of over six to afford home on their own (Morrison and Monk, 2006)
Impact of recruitment and retentionThere have been national problems with recruitment and retention in some public services for a number of reasons: because of demographics (in that there are fewer young people entering the labour market), uncompetitive pay rates, the declining status of the professions and the increasing range of other opportunities available (GLA, 2001). A number of studies have examined how the recent housing affordability problems have influenced the labour market, and whether they have contributed to the recruitment and retention problems of public sector workers in particular. The evidence suggests that key workers and other public sector employees were priced out of the market in several areas.
Although the relationship between housing affordability and recruitment and retention in the public sector is complex, there is evidence to suggest that high housing costs have been a contributory factor that has influenced staff turnover and service delivery (GLA, 2001; Battye et al., 2006; Morgan et al., 2005; CCPHR, 2001; EKOS Consulting, 2007). In the South East, a survey of employers found 78 per cent of public service workplaces experienced recruitment difficulties, which 63 per cent attributed to the high cost of housing in the region (Roger Tyms, 2003). There was a strong correlation between high housing costs and recruitment and retention problems in those areas of high housing affordability ratios in the South East (Roger Tyms, 2003). Places with attractive lifestyles for young people could overcome some recruitment of newly qualified staff, but high housing costs still caused retention problems when these same staff get older and wished to settle. A third of public sector employers thought retention was a less of a problem than recruitment. However, all education employers’ surveyed said retention was difficult as there is a problem of retaining teachers in the profession entirely and, if they chose to stay, retaining them in the South East. Housing costs seem to have a stronger influence on retention than recruitment.

58
Rapid Evidence assessment of the economic and social consequences of worsening housing affordability
In West Kent, a survey and interviews with local private and public employers found almost all had recruitment and retention difficulties, 40 per cent of which claiming this was a frequent problem (Elizabeth Haggart Associates, 2004). Three-quarters said the problem had worsened in recent years and that the main reasons were skill shortages and the high cost of housing in the area. While professional and management jobs and skilled trades were the most difficult to recruit and retain, 29 jobs were identified reflecting widespread problems. Teachers and care workers were the most frequently mentioned jobs.
Although it was recognised that there are essential public sector workers on lower incomes, the police, nurses, bus drivers and teachers were the focus of a London study in to key worker housing for the capital which showed the range of experiences of different groups (GLA, 2001). All services had higher staff turnover and vacancy rates than other parts of the country at the time of the study and although employers accepted that to a certain extent London acted as a training ground for much of the country, the issue was of serious concern to the employers. Employers tried to recruit from outside London but the police found it hard to attract families because it was expensive to buy in London. Young teachers were content to share a house with friends or colleagues but when they wanted to form an independent household or buy a property, they left the capital. This had an adverse affect on the services, as there are many young teachers in senior positions because the older more experienced staff had left the city.
Regan et al.’s (2001) qualitative study of housing choices, in Reading in the South and Darlington in the North of England, included some evidence of recruitment problems in the Reading area. Employers offered posts that applicants subsequently declined because they could not find affordable local housing. This was felt to be a problem amongst public sector workers, but in Darlington public sector pay was more in tune with local house prices. Whereas in Reading a nurse would have to earn £21,700 to purchase a home, in Darlington a nurse only had to earn £11,404 to purchase the same entry level small terrace house.
Almost all employers interviewed across the public and private sectors in Surrey felt there was a strong relationship between housing affordability and the recruitment and retention problems they experienced in the area (Morrison and Monk, 2006). However, housing costs intertwine with other factors affecting employment. Employers faced particular problems recruiting nationally advertised public sector professional posts, compared to locally recruited lower grade manual or administrative posts, often drawing from already housed people. Professional staff had higher mobility and could choose to live in lower cost areas and, again, there were many incidents of people turning down posts because of high housing costs. The health service had problems recruiting qualified nurses, particularly paediatric nurses, radiographers, occupational therapists, physiotherapists, paramedics, and technicians. Approved social workers, police officers and probation officers were also difficult to recruit in the county. Retaining newly qualified staff who trained in the local area was also hard, and some employers felt that this was because London weighting meant staff were attracted by jobs in the capital, which was easily accessible by commuting. Furthermore, nurses were said to leave the county altogether once they no longer wished to share accommodation and wanted to live independently. Some areas of South-West London were less expensive than Surrey so staff commonly commuted 40 miles each way to work in Surrey (Morrison and Monk, 2006).
59
5. Public services and the Labour market
All employers in the Devon study (EKOS Consulting, 2007) were also aware of staff frequently commuting to work from less expensive areas because of housing affordability issues, which was not environmentally sustainable. Employers were equally split as to whether recruiting key workers was more difficult or the same as recruiting other staff, but some felt that recruiting skilled workers in Devon was problematic. Half of employers mentioned housing as a being a barrier to recruitment, but opinion varied between organisations even within the same professions or sectors. Many employers suggested that job applicants had already found accommodation, so even if house prices are high recruitment was not problematic. Over all respondents in this area found housing to be more of a barrier to recruitment than retention.
In the East of England, there was evidence that housing affordability problems affected recruitment and retention of key workers (CCPHR, 2004). Health care providers had particularly problems in areas close to London, while there were problems with police retention rather than recruitment in Hertfordshire, and Cambridge had problems with Cambridge city itself but less so in Fenland. Schools in the case study areas had mixed problems. While it was common for staff to leave due to high housing costs, the situation was not desperate. Employers however were less confident of the ability of the key worker initiatives to resolve this situation. In accordance with national policy, health employers recruited staff from overseas, as it was difficult to recruit from other regions in the UK because the cost of housing in the area was prohibitive. These problems were not universal across the public services and are localised to particular housing ‘hotspots’.
An evaluation of the Starter Home Initiative1 suggested that the role of housing costs within staff decisions to leave was uncertain, and so the scale of the impact of such schemes to improve retention is therefore also uncertain (Morgan et al., 2005). However, employers thought that the schemes have had a positive effect on staff retention. The evaluation of the Key Worker Living (KWL) scheme provided some evidence of the impact of high housing affordability problems on public services (Battye et al., 2006). Employers supported the view that the provision of housing to key workers had reduced churn amongst staff since the schemes started. For example, an employer had reduced the vacancy rate from 300 to 100 in only two years and attributed this to the KWL scheme. Of the key workers surveyed, 23 per cent of those who bought a Homebuy property, typically mid-career employees, said they would have left their post if the opportunity to buy through the KWL had not arisen, and 32 per cent of those who bought a new build property through KWL, typically early-career employees, said likewise. Furthermore, 12 per cent of Homebuy purchasers and 22 per cent of New Build purchasers said they would have left the profession entirely were it not for the opportunity provided by KWL. The report concluded that housing interventions could only influence recruitment and retention if they were integrated with other human resources activities aimed at improving recruitment and retention of staff. The Starter Home Initiative has also been effective in positively influencing retention rather than recruitment, and employers’ felt retaining skilled staff was a more pressing issue than new recruitment (Morgan et al., 2005).
1 The Starter Home Initiative and Key Worker Living scheme provide access to sub-market rents and low cost home-ownership (shared equity or shared ownership) schemes for a range of key workers in areas that display high housing affordability problems. The intention was to stem the loss of key staff in essential services that found it difficult to buy affordable homes accessible to their workplace.

60
Rapid Evidence assessment of the economic and social consequences of worsening housing affordability
Employers felt that housing costs alone were not contributing to staff turnover but that the overall picture was complex and involved a series of other factors that employers must also consider (Morgan et al., 2005). Employers, especially in the NHS, also noted that low paid staff would always need rented or very low shared ownership schemes and felt that this group of staff had therefore not benefited from the Starter Home Initiative. This was borne out by the fact that applicants who did not proceed to the purchase of low cost homeownership options still found properties too expensive even with assistance.
Aspirations of key workersAlthough the access to and affordability of the private and social rented sectors was also raised as problematic by employees in some areas, it was the unfulfilled ambition for homeownership that was critical. Key workers overwhelmingly aspired to become homeowners, certainly once they reached their late twenties or early thirties, but this differed between different professions, however, the affordability of private renting was occasionally raised as problematic. In West Kent, the essential workers required both rented housing and houses to buy (Elizabeth Haggart Associates, 2004), and a quarter of employers across the South East thought the problems were with both renting and buying (Roger Tyms, 2003). However, Roger Tyms’ study concluded that in the South East the main problem was the high cost of homeownership, rather than renting costs, which caused the problems within the public sector. Social renting could meet some key worker housing needs but key workers aspired to become homeowners and they did not generally have access to this tenure.
There were different aspirations to homeownership amongst the different professions, and the capacity to become a homeowner changed between jobs. Starting salaries in London for nurses and teachers are on par with the average male manual worker salary and compares unfavourably with the average earnings of first-time buyers, although many of those rely on two incomes (GLA, 2001). Police starting salaries are higher but the nature of their work and their higher aspirations also limit their likelihood of securing housing in some cheaper locations. Ninety-three per cent of police renters wanted to buy within three years, compared to 71 per cent of teachers, 55 per cent of nurses and 41 per cent of bus drivers. Bus drivers were the lowest paid, followed by nurses, teachers then police officers and they all had different requirements from housing. Bus drivers frequently rented and lived close to their work, compared to police officers who had a high preference to homeownership, and more frequently had achieved homeownership and did not wish to live near their place of work. Nurses had a high desire for homeownership and to live near their work but 29 per cent of them commuted over ten miles a day compared to only 12 per cent of bus drivers.
In Cambridge, public sector employees on fixed salary scales faced hefty challenges to enter the local housing market and resulted in employees, particularly those on low incomes, living further away from the city. Further examination of key workers in Cambridge area shows that while few will change career to obtain housing, many will move area, although those in their early 30s are also willing to leave their job to get the house they want (Roger Tyms, 2003).
Several studies highlight that housing affordability alone does not contribute to the recruitment and retention of key workers. For example, the stresses of employment in London public services also

61
5. Public services and the Labour market
contributed to staff turnover, including the fall out from the Stephen Lawrence enquiry, problems in inner-city schools, problems of congestion and violence on buses, and the reduced status and decline in wages for other comparable jobs to police, nurses and teachers (GLA, 2001). Clatworthy and Crush (2005) provide a useful qualitative study that explores the relationship between housing and staff decisions to join or stay with an employer. The main findings related to how staff make assessments about their quality of life, and the relative contributions of their employment and whether they considered their housing aspirations to be fulfilled. Their life-stage, job satisfaction, perceptions of London/South East and their living costs influenced their decisions. Key workers’ housing situations exacerbated negative feelings about their employment if they felt overburdened and under-valued in their jobs. If they could meet their housing aspirations, they may tolerate employment problems.
The importance of housing and life stage was apparent from many studies which showed that early career nurses and teachers may feel content sharing and renting but once they get to their late twenties or reach 30 thoughts of forming partnerships, starting a family, career aspirations and buying a first home all become apparent. Public service professionals are potentially very mobile as their services are required across the country, so they have not met their employment or housing aspirations these staff may leave the capital, or indeed their profession, in order to satisfy them. Clatworthy and Crush (2005) indicate that the crucial decision time is generally five years into a key workers’ career where people then begin to search for the quality of life factors they value. Housing, or rather homeownership, is important in this assessment as key workers felt that it enables people to build roots and a sense of belonging where they live, develop a greater sense of security, stability and self-esteem and invest in their future. Retention of experienced teachers in the South East was also a major problem for local education authorities who reported that once a teacher has been in post between 3-7 years they thought about being more settled and knew their wages would go further in other regions or less expensive areas (Roger Tyms, 2003).
Several studies related staff commuting long distances, but the evidence was mixed as surveys often revealed that it was those staff on higher salaries that commuted the longest distances, although lower-income staff did travel from less expensive areas.
Private sector experiencesThe problems of recruitment and retention in public services were not reflected in the private sector to the same degree, although many businesses did report concerns about housing affordability. Other factors such as skill shortages were also apparent, but employers were able to improve staff salaries and benefits packages to compensate. Employers chose to remain in areas of high housing costs as there were other advantages to their business to be in a region close to London and Europe. The problems of rigid national pay scales meant that in some areas, public sector employers were unable to react to local conditions, but in some locations, the private sector were also affected by high housing affordability issues.
Roger Tyms (2003) found that 28 per cent of private sector employers surveyed across the South East of England identified difficulties with staff recruitment, compared to 78 per cent of public sector employers. Of the employers with recruitment problems, 40 per cent attributed these difficulties to high local housing costs, but the pressures in the private sector were less intense

62
Rapid Evidence assessment of the economic and social consequences of worsening housing affordability
than amongst public employers. The study highlights differences in responses from employers when asked about the extent of recruitment problems and the relationship of these problems to housing, suggesting that if affordable housing is not mentioned then fewer employers cite it as problematic. However, the survey for Roger Tyms’ study found a weak but positive correlation between high housing costs and recruitment and retention problems in the South East.
Across the region, Roger Tyms’ study found 32 per cent of business units in higher price band 2 had recruitment problems, compared to 27 per cent in cheaper band 3 areas and 23 per cent in cheapest band 4 areas. The most affected areas were Brighton where sixty per cent of employers reported recruitment difficulties, 44 per cent in Reading and 36 per cent in Oxfordshire. The study noted that Reading was in price band 3 and so the relationship between low cost areas and recruitment problems was complex. Moreover, low cost areas such as the Medway towns in Kent displayed fewer recruitment problems, but Milton Keynes one of the most affordable areas in the region, displayed staff shortages. The businesses reported that they had the most difficulties in recruiting lower wage (50 per cent) and graduate staff (38 per cent), and the sectors that were most affected were hotels and restaurants and transport and communications where half or almost half of these business reported problems. About a quarter of other businesses like construction, banking and finance, and manufacturing reported similar staff recruitment problems. Retention of staff seemed less of a problem than recruitment with only five per cent of 200 private businesses reporting this was a problem. Ten per cent of businesses had increased pay to overcome problems associated with high housing costs. A third of those companies reporting recruitment problems, while many others drew employees from different sections of the workforce: older workers who were already housed, younger people who lived at home, and mothers who were more concerned about flexible hours than wages and were already housed. High-grade employers were willing to pay whatever the market demanded, while others improved their benefits packages and career development structures to improve recruitment.
In Surrey, bus companies reported difficulties recruiting bus drivers and the retail sector found junior shop staff were difficult to retain after the initial training period, and found that once these employees wanted to settle they left the area (Morrison and Monk, 2006). Private sector employers who reported no recruitment or retention problems were most likely to be in growth sectors like high tech electronics companies, airport services or large international companies. These employers were able to be more flexible with salaries and employees benefits packages, compared to lower grade service sector employment, or public sector employers constrained by national pay agreements (Morrison and Monk, 2006).
The Cambridge sub-region key worker housing need study surveyed a range of small, medium and large public and private sector employers (CCHPR, 2001). Eighty one per cent of employers had difficulties recruiting staff and under half had problems retaining staff. Twelve per cent of companies reported no recruitment problems, one of which was a hotel that attributed this to the fact that they provided housing for their employees. In the Cambridgeshire area, 56 per cent of employers believed high house prices contributed to their recruitment and retention problems, 31 per cent because of the high cost of renting and 56 per cent because housing costs in the region compared unfavourably with other areas. But employers also saw their difficulties as a reflection of a tight labour market, 39 per cent cited national salary scales or low average wages, two thirds

63
5. Public services and the Labour market
believed that skill shortages created staffing problems and 44 per cent that direction competition for staff within their industry was a factor. Employers responded by advertising posts on higher rates of pay, offering relocation packages, which included temporary lodgings, travel costs, meeting utility and furniture costs and additional paid leave to seek housing.
A reflection of the degree to which employers in the Cambridge sub-region were uneasy about housing affordability is that 33 per cent said they would consider offering higher wages, 48 per cent said they would offer relocation assistance, while 52 per cent already offer relocation packages. Thirteen per cent were willing to offer mortgage allowances, and 21 per cent were willing to offer cheap loans and 10 per cent were willing to consider deposit savings schemes. Half of the employers would like to see a Cambridge salary weighting and 31 per cent would like to see an increase in pay for certain staff. All employer types except hairdressers supported more tied or key worker housing schemes (CCHPR, 2001). In West Kent, smaller employers did more to improve training and development of staff while larger employers were able to increase staff benefits packages and increase flexible working (Elizabeth Haggart Associates, 2004).
Another response to recruitment and retention problems from private employers has been the investment in capital to replace the reliance on people, for example, hotels have invested in kitchen equipment that means they require less staff (Roger Tyms, 2003). Where this has not been possible, hotels also reported recruiting from overseas and giving these migrant workers accommodation, which is attractive to young overseas employees. Only 10 per cent of companies had considered relocating out of the South East to avoid the problems associated with high housing costs, but these companies were not exclusively the ones experiencing recruitment difficulties. The survey suggested that the locational advantages of being in the South East outweighed any problems. Companies committed to the location were research, pharmaceuticals, airport related business and business services who all had reasons to remain in the South East in close proximity to their markets and business clusters. Other companies related to manufacturing and engineering were less committed to the area and thought they would be more profitable elsewhere in the UK, such as the Midlands. Some manufacturing companies were parts of multinational companies who were increasingly investing in other countries like France or Rumania. The study concluded that the loss of such cost-sensitive low value businesses were not necessarily a loss to the region as it provided resources for higher value business to thrive in region, however, the impending recession may mean this sentiment no longer holds.
Residential mobility and the labour marketResidential mobility is important for employers so that they have wide access to potential employees and for employees in less buoyant labour markets to access job opportunities. There have been concerns that homeownership adversely affects the functioning of the labour market. Employers in some high cost areas have expressed concerns about housing affordability as discussed. The evidence on the relationship between affordability and mobility is mixed but there is evidence to suggest that employees do move to take up jobs in high cost areas but may do so by moving to contiguous areas and commuting.
Analysis of the BHPS shows that between 10-12 per cent of working age households move each year (Dixon, 2003). However, more recent SEH data suggests that mobility for mortgaged

64
Rapid Evidence assessment of the economic and social consequences of worsening housing affordability
households has declined from 10 per cent in 1999/2000 to around seven per cent by 2006 (CLG Live Table S212). No studies specifically examined why mobility in the wider market has declined, although housing affordability may restrict existing homeowners from trading up, or reduced mobility may be a function of the decline in the number of first-time buyers. Of the moves that do occur, Dixon (2003) found that the majority of moves occur within the same local authority district, two per cent move between different local authorities within the same region and a further two per cent to another region all together. Few households attribute their moves to employment but long distance moves are more likely to report that this is the case, especially by more senior, skilled or professional and managerial staff.
The prevailing housing market conditions also influence the rates of migration. Henley (1998) used BHPS data and found that the experience of negative equity during the 1990s had an adverse impact on mobility within the housing market. He estimated that twice as many people with negative equity may have moved if there was a moratorium on debts (i.e. if they could have taken their debt with them by porting their existing mortgage to a new home).
Residential mobility appears to be unresponsive to labour market conditions because owner-occupiers do not move from high unemployment areas to areas with higher housing costs, but there was some evidence that high housing costs did increase the incidence of commuting (Henley, 1998). More recent evidence found less support for high housing costs deterring in-migration. Battu et al. (2008) use the BHPS to examine the impact of housing tenure on labour market mobility. They find little support for the hypothesis2 that unemployed homeowners are less likely to move to obtain employment, but this was sensitive to the modelling employed. Robson (2003) also found little support for the thesis that homeownership inhibits mobility; rather social housing in areas of high unemployment prevents movement to higher cost/higher employment regions. Boheim and Taylor (1999) found that the unemployed homeowners are mobile and do move to access jobs. Other studies have found some support for homeowners moving especially if it is to contiguous areas. Although buoyant economic conditions can draw employees into regions, strong housing market conditions can prevent movement of households and give rise to commuting to access employment in high housing cost areas (Murphy et al., 2006; Cameron et al., 2005 Cameron and Muellbauer, 1998).
Cameron et al.’s (2005) study used data from Regional trends, NHS and Office of National Statistics to examine household movement between regions. They found that high house prices do not automatically reduce migration, as the expected rate of (investment) return on housing was also a factor that influenced movement, so the South East continued to attract households despite rising prices. In addition, high house price regions with good labour markets may increase migration to contiguous areas, from where people might commute to the high cost region. Another econometric study also found that an impact on constrained migration to high house price areas was the increased incidence of commuting (Cameron and Muellbauer, 1998). Commuting patterns act in the reverse to migration patterns, so that people will commute to high cost areas from contiguous lower cost regions, offsetting the constraints on the labour market in areas of high housing costs. The authors suggest that commuting does not overcome all problems associated with the regional imbalances in the labour market produced from low housing affordability, and does have environmental costs through vehicle emissions.
2 See Oswald (1999)

65
5. Public services and the Labour market
A largely qualitative study of economic impacts of high housing costs found mixed evidence of commuting as a response to housing affordability problems (Roger Tyms, 2003). Public sector workers were reported to commute at all levels, where as private sector employers reported both lower and higher grades were likely to commute long distances. Other factors can contribute to the incidence of commuting, such as trying to satisfy labour market demands from dual-income households and people willing to commute greater distances for managerial positions, so housing is only one factor that contributes to commuting. Moreover, a study of regional commuting patterns found that homeowners, those with higher qualifications and those who work in large plants or offices spend more time commuting but it was unclear as to the role of housing affordability in this analysis (Benito and Oswald, 2000).
Rural communitiesThere was evidence that rural housing affordability impacts upon the local rural economy and on the character of rural communities. The impacts of worsening affordability may be particularly acute in rural areas because of the combined pressures of a lack of housing supply and problems accessing private or social renting. This has generated concern about the social mix of villages and the impacts on the rural economy. It is likely that in some urban locations, similar processes of social exchange as a result of the operation of the housing market and high housing costs are evident, but was not apparent in the literature retrieved for this review. Encompassing literature that discusses gentrification may reveal further consequences of worsening housing affordability.
Wilcox (2008a) found many rural housing markets across England, including areas in the north, had acute housing affordability problems. Shelter (2004a) found that in six out of the eight English regions, rural homes are less affordable than in urban areas. In 2003, 37 per cent of the rural population spend more than 50 per cent of their income on housing costs, and between 1999/0 to 2002/3 homeless applications rose by 24 per cent in rural areas and by 30 per cent in remote rural areas.
The Monk et al. (2006) study found that it was not just those on the lowest incomes that were priced out of the housing market in rural areas, but many dual earner middle-income households could also not afford entry-level housing. In some rural areas such as Stratford upon Avon, 83 per cent of households were unable to enter the housing market. The focus groups for this study found that it was generally young people who were could not get access to either social housing or homeownership in rural areas most affected by the affordability problems. An IPSOS/MORI poll (CRC, 2006) showed that the loss of young people and young families in rural communities because of the high cost of housing was of great concern for most people. The loss of young people in rural areas, who moved away or could not return because of affordability problems, was described as ‘killing off’ the local community, turning villages into dormitory or retirement spaces. The housing market facilitated this social exchange, causing transformations of the many rural areas as older wealthier income households, retirees or commuters replaced younger less affluent households (Monk et al., 2006; CRC, 2005). With fewer families, there was a concern about social cohesion and a sense of community declining, an evident tension between the wealthier incomers and less affluent people who had grown up in villages.

66
Rapid Evidence assessment of the economic and social consequences of worsening housing affordability
In addition to being part of the process whereby the demographic and socio-economic profile of rural districts has changed, housing affordability problems have had impacts upon the rural economy, and for some employers, had caused labour shortages. Some informants suggested that local rural business found it difficult to recruit low paid staff in their local areas (Monk et al., 2006). In some areas, hotel staff or migrant workers were supplied with accommodation by their employers, although staff apparently often perceived this to be of poor quality. Other employers relocated to urban areas where low wage employees were more plentiful, meaning that housing affordability problems may also contribute to a lack of some employment opportunities in rural areas.
Reverse commuting is evident, whereby lower income employees commuted from urban areas to service lower grade jobs in rural areas, rather than affluent commuters driving from rural areas to urban employment centres (Monk et al., 2006). However, analysis of travel to work patterns reveals commuting is very complex with flows in all directions. At the individual level, reverse commuting may adversely affect family budgets and quality of life, however, at the aggregate level the general mobility of all employees overshadowed reverse commuting. Therefore, there was no evidence that high housing costs had caused additional commuting and subsequent environmental problems, as many people choose to commute. Furthermore, commuting was also a cause of rural housing affordability problems as wealthier people could still access their jobs in towns and cities, rather than a consequence of the affordability problems alone.
The next chapter continues by considering the impact changing access to homeownership and housing affordability has had on the sustainability of homeownership.

67
Sectionhead
Key PointsHousing affordability problems have meant that the proportion of income dedicated to •mortgage costs has increased for new borrowers, meaning interest rates rises, either from bank base rates rising or lenders re-pricing new deals upwards, could overstretch many borrowers.
There is evidence of riskier borrowing based on high income multiples, interest only mortgages •and secondary lending (prompted by rising markets and access to credit) that also pose a risk to borrowers.
However, rising markets have also meant many borrowers have some equity which may •cushion falls in the market, although this is being eroded rapidly, and lower interest rates may help some struggling borrowers.
Mortgage arrears and repossessions have increased from 2004/5, however, the economic •climate is now less benign, and the effectiveness of the government’s measures to stem repossessions is yet to be established.
The social consequences of mortgage debt and housing repossession are detrimental to •homeowners’ health and wellbeing, and may depress and therefore prolong, the market and economic downturn.
IntroductionPrevious chapters have discussed how the period of widespread housing affordability problems has changed the nature of access to homeownership. Although first-time buyers have used greater deposits, frequently supplied by their families, the income multiples used to obtain the mortgages are also greater than were used by previous cohorts of new homeowners. Furthermore, prior to the onset of the credit crisis, housing costs as a proportion of incomes had been rising. Home mortgage repossessions have been rising since 2004, before the market downturn and when the economy remained benign. With the UK now entering a recession and repossessions rising more rapidly, the issue of sustainability within homeownership has come to the fore. This chapter examines what if anything housing affordability has contributed to this situation.
The recent period of rising house prices did not expose existing borrowers to great risk as the benign economic climate offered low interest rates and low unemployment. In addition, the growth in house prices means that most homeowners had accrued housing equity (assuming no significant additional equity withdrawals have been made) that could both act as a cushion against negative equity in a changed market and can mean that lenders would be more willing to extend greater forbearance in circumstances of payment default. However, housing affordability problems have contributed towards the risks associated with homeownership in a number of ways. These may include increased housing costs as a proportion of income and the risks associated with borrowing, such as high income multiples and the type of mortgage product used. In addition, the rising housing market increased housing wealth, and homeowners used equity withdrawal and secondary secured lending products to draw on the wealth stored in their home. The changing market has exposed these issues as threats to the sustainability of homeownership. This chapter therefore considers to what extent worsening housing affordability has contributed to the current increase in mortgage arrears and what the consequences of mortgage default might be.
6. Sustaining Homeownership

68
Rapid Evidence assessment of the economic and social consequences of worsening housing affordability
High housing costsDespite a period when mortgage borrowing has been historically inexpensive the sums borrowed due to high house prices have led to many paying a larger proportion of their income on mortgage costs. Interest rates rose from 5.39 in 2003 to 7.44 in July 2007 (Stephens et al., 2008). This period accompanied a rise in the numbers of homeowners falling into mortgage arrears or having their homes repossessed, although in 2007, they remained a fraction of those that had mortgage debt in the early 1990s. Until 2007/8 there was a rapid growth in outstanding gross mortgage debt but the ratio of mortgage payments to post-tax household income for new borrowers remained relatively steady during the period 1993 to the end of 2003, at about 18 per cent of income (Cunningham, 2005). However, since 2003 the ratio has escalated to around 27 per cent in 2005, almost at the last peak in 1990 when it reached around 29 per cent. Furthermore, the Expenditure and Food Survey shows that 40 per cent of those buying a property in 2004-5 were spending 30 per cent or more of their income on housing related costs (including taxation, insurance and water and sewerage bills), raising the prospect of problems if interests rates were to rise or income to be lost (Whitehead and Gaus, 2007).
Research for Shelter (2008) reveals that nine per cent of households pay over half of their income on housing costs and a further 4.1 per cent of households pay over two-thirds of their income on housing. Households in London are the most likely to pay over half (12 per cent), although there are only slightly less households in the North East and South East who pay this proportion of their income on housing (10 per cent). A greater proportion of private renters (24 per cent) pay in excess of half their income on housing costs compared to 15 per cent of social renters and seven per cent of those in homeownership. As homeownership is the largest tenure by a substantial margin, the low number of owners still represents one third of all those households paying over 50 per cent of their income on housing costs.
The Shelter research illustrates the consequences of the struggle to meet high housing costs, but the study disappointingly does not disaggregate all the findings by tenure. Sixteen per cent of households have used a credit card in order to meet their housing costs, 11 per cent have sold possessions and nine per cent have not bought clothes for their children in order to meet their housing commitments. The struggle to meet housing costs has resulted in over a quarter of households suffering stress or depression. Private renters and households in the North East were more likely to report depression and stress. Households in London, lone parents and black and minority ethnic households are all more likely than their counterparts to report difficulties in meeting their housing costs. Twenty three per cent of struggling homeowners in Shelter’s survey said they would rely on state benefits to meet their housing costs if they could not meet these payments themselves, even though between 1995 and 2009 state help has not assisted with mortgage interest payments for the first nine months of any claim.
Repossessions began to rise from 2004 onwards when interest rates began to rise. However, the substantial reduction in Bank of England base rates from December 2008 has meant that mortgage costs for many have significantly reduced. Mortgages that tracked base rates have so far reduced proportionately, however, lenders have only passed on some of the fall in interest rates to mortgages discounted from their standard variable rate and borrowers using fixed rate products, which reached half of all borrowing at 2007, will have seen no corresponding reduction

69
6. Sustaining Homeownership
in their borrowing costs. There are concerns about the ability of borrowers coming off fixed rate deals to obtain mortgages at competitive rates unless they have substantial equity, but the interest rate reductions should assist some borrowers who may otherwise have been struggling with their mortgage repayments.
The risk associated with the high income multiples new entrants to the market have used is primarily associated with rises in interest rates, which may have been alleviated for some with the lower bank base rates. However, this may become problematic if households are unable to refinance on favourable terms and have to move on to lenders’ high standard variable rates. The risks of high loan to value ratios used by some borrowers lies in the threat of negative equity. At the time of writing, no studies have analysed the extent of negative equity in the changed housing market as yet, but this means that struggling homeowners are going to be unable to repay their loans through the sale of the house or by refinancing should they need to do so.
Mortgage productsAnother indicator that households have stretched their finances to achieve homeownership may be the type of mortgage product used.
Borrowers have a choice regarding how they repay their mortgage loan, commonly choosing to pay standard repayment mortgages, which include sums for both repayment and interest on the loan. Since the early 1980s, borrowers have used interest-only mortgages to reduce the monthly mortgage costs, but a repayment investment plan was purchased that would repay the full loan at the end of the mortgage period. Since the early 1990s, CML data shows that the proportion of interest-only mortgages not supported by a repayment vehicle, like an endowment or Individual Savings Accounts (ISA), rose from less than 10 per cent in 1993 to around a fifth of all mortgages by 2006 (Tatch, 2006). Tatch (2006) found that these mortgages were associated with higher loan to value ratios, a history of impaired credit and self-certified borrowing but other aspects such as lower repayments may militate against these risks.
Tatch notes that borrowers’ motivation to take out these mortgages was poorly understood, but suggested that there was little evidence to show that housing affordability pressures have contributed to the rise in the use of interest-only mortgages. However, a later FSA study does highlight some concerns about this form of borrowing.
The Regulated Mortgage Survey shows that first-time buyers bought 17 per cent of interest-only mortgages without a repayment vehicle, but the proportion varied depending on how the borrower accessed their mortgage (Tatch, 2006). Twenty-one per cent of those first-time buyers who bought through mortgage intermediaries bought the mortgages with no supporting repayment plan and 10 per cent by those first-time buyers who bought direct from the lender. However, the FSA (2006) found first-time buyers represented 12 per cent of the unsupported interest-only mortgages they examined in their survey. These new borrowers did so because they said it meant they could afford the house they wanted. Most borrowers with these mortgages felt they were reasonably financially literate and yet substantial numbers of these borrowers had no recognised alternative savings or repayment plans in place. Although most respondents said they would switch to a repayment mortgage as their finances improved, the researchers doubted the potential of many of the borrowers’ strategies to repay the loans.

70
Rapid Evidence assessment of the economic and social consequences of worsening housing affordability
Some borrowers on unsupported interest only loans did not understand the risks involved. Eighteen per cent of borrowers recognised there was a risk that they would be unable to repay the loan, and nine per cent thought that it might be more expensive over the long-term. Younger first-time buyers did worry that they were not repaying any of the loan, partly because they were more likely to have larger loans than older borrowers who had re-mortgaged small sums. Alarmingly, nine per cent of the borrowers surveyed were unaware that the lender could sell the house at the end of the mortgage period if the loan was not repaid. Seventeen per cent of borrowers who felt that finances ‘were best left to the experts’ were unaware of the lenders ability to sell the home, compared to four per cent of those who felt they were very good at finances. Nineteen per cent of those with no repayment vehicle in place and no definite plans for repayment were unaware of this provision. Furthermore, one in five respondents said they would struggle to meet their repayments if interest rates increased by only one per cent so there are doubts regarding the sustainability of some of these mortgages.
It is already noted that the low inflation environment extends the debt burden of new borrowers so the value of the debt is not eroded by higher wages, but using interest only mortgages and later converting to repayment may also serve to lengthen the period of time when mortgage repayments take up high levels of income.
Another development in the mortgage market has been that of the ‘sub-prime’ mortgage, a suite of products offered by specialist companies or (subsidiaries of) mainstream lenders providing mortgage lending to households with impaired credit or to those who could not prove their income (Munro et al., 2005). It seems high housing costs and housing affordability may not have been the key contributory factors in the drivers of this market, but other features of the financial services and labour markets drove the development of this form of lending. Munro et al. outline how the expansion of credit markets from the 1980s and the persistent recovery of arrears amongst privatised utility companies and local councils. These actions produced more indebtedness and a greater number of households in default situations, with county court judgements, bankruptcy and similar actions taken against them. Mainstream lending routinely excluded these households because of the automated credit scoring adopted by mortgage lenders during this period. The industry response to these events and the greater flexible employment practices and self-employed households, who could not prove their income, have driven the growth in sub-prime lending market. Sub-prime lending has therefore both helped sustain homeownership for those with debt problems, but also threatened sustainability because of the high charges, aggressive repossession practices and high loan to value rates such as 125 per cent mortgages.
Sub-prime lending is more expensive than conventional lending but cheaper than other debt consolidation loans, but it does make homeownership more costly and risky. A survey of lenders in 2005 found that the rate of mortgage arrears in the non-prime sector was four times that of prime lending, and the rate of repossessions was ten times greater (Stephens and Quilgars, 2007). In addition, the FSA (2007) found weaknesses in responsible lending amongst non-conforming loans and the affordability assessments undertaken were inadequate. The proportion of first-time buyers that used non-conforming lending to access homeownership is unknown, but the sector is associated with remortgaging amongst older middle age households who had developed credit problems (Stephens and Quilgars, 2008).

71
6. Sustaining Homeownership
Supporting homeownersStephens et al. (2008) note that in the last housing market recession safety nets for homeowners were inadequate and 300,000 households lost their homes through repossession. At that time, the main safety net was Income Support for Mortgage Interest (ISMI), which met the interest payments for borrowers who were claiming Income Support. In 1995, the waiting time before ISMI payments would begin was extended from 8 to 39 weeks and a standardised rate of interest was used in calculations, rather than the actual rate charged by the lender. Even when borrowers were entitled to ISMI, these changes caused borrowers to still accrue arrears. In addition, ISMI had not kept pace with the rising housing market and the qualifying limits had been set at mortgages under £100,000 since the 1990s. In addition, ISMI was only payable on first loans secured against a home, which did not reflect the extent of re-mortgaging or secondary lending that borrowers had engaged in during the last decade. The government’s strategy switched to promoting the take up of private Mortgage Payment Protection Insurance, but there were then concerns about companies not paying out in some circumstances, the high costs and the poor take up (see Croucher et al., 2003). In 2000, a third of borrowers took out mortgage payment protection insurance, but by 2007, this figure had reduced to 18 per cent (CML Statistics PP12).
A new range of state supported safety nets is in place from 2009. Firstly, the government announced that there would be a reduction of the waiting time for ISMI to 13 weeks. Secondly, a Homeowner Mortgage Support Scheme, which provides government guaranteed interest payment holidays and extensions of the mortgage period, will support households with a partial or temporary loss of income. And lastly, a Mortgage Rescue Scheme, where housing associations will purchase an equity stake in people’s homes to reduce outgoings and repay debt or, in more enduring circumstances of loss of income, convert the home to social renting (see www.communities.gov.uk). These new safety nets are as yet untested but it is anticipated that they may only provide assistance to a small portion of the households expected to face repossession in the coming period.
Figure 6.1 shows the number of homes repossessed since 1986. The CML forecast 75,000 possessions for 2009, although have not yet included the new government initiatives in these estimates, but there is a high chance with increased unemployment that the market may return to seeing the volume of people losing their homes as in the last housing market recession.

72
Rapid Evidence assessment of the economic and social consequences of worsening housing affordability
Figure 6.1 Homes taken into possession 1986-2008
Num
ber
of
Ho
useh
old
s
0
10,000
20,000
30,000
40,000
50,000
60,000
70,000
80,000
1986
1988
1990
1992
1994
1996
1998
2000
2002
2004
2006
2008
Source: CML AP4. (NB.: 2008 figure CML forecast)
Interest payments for some existing borrowers have significantly reduced, as the base rates have dropped to only 2 per cent and are set to fall further, which should assist borrowers who are struggling to pay their mortgage. In this initial phase of the market downturn, NACAB (2007) observe that the people who sought advice about mortgage debt were people from low-income households, particularly those who have borrowed from sub-prime lenders and who have taken out additional secured loans secured against the property. Attempts to benefit from the additional wealth in their home have therefore led many lower income households to lose their homes. The understanding of the risks amongst many of these households was poor and the advice they received was inadequate. NACAB suggest that the purchase price or housing affordability had not been the sole or main factor that led these householders into mortgage debt, but that it is the ineffectiveness of the mortgage safety nets, the court system and the regulation of lenders that is threatening sustainable homeownership (p7-8). As the economy moves into recession, it may be that unemployment becomes a greater risk to sustainability.
The consequences of mortgage defaultFor those who do experience arrears or repossession the impact can be damaging. An analysis of the BHPS showed that mortgage debt had an independent negative effect on the subjective well-being of men and women and that it was associated with more frequent visits to the doctor for men (Nettleton et al., 1998). Although the findings do not prove causality, the association between mortgage indebtedness and mental health held even when they controlled for household income, employment status and physical health. A qualitative study of borrowers whose homes were being repossessed spoke of how the process of home repossession evoked extreme emotional responses that negatively influenced the health and well-being of the former homeowners (Nettleton and Burrows, 1999). Repossession affected the households’ social status and identity;

73
6. Sustaining Homeownership
caused further problems in their personal lives; damaged their future hopes and aspirations and, for women especially, was associated with a pathway into poverty.
Table 6.1 illustrates the range of social consequences mortgage repossession has on household members in more detail.
Table 6.1 Social consequences of mortgage repossession
Quality of life Social status and identity
Personal and family relationships
Future aspirations Health and wellbeing
Homelessness Stigma Marital breakdown
Financial insecurity Poor mental health
Los of lifestyle Humiliation Relationship tension
Fear of the future Poor physical health
Poverty Embarrassment Split up household
Fear can’t buy again
Depression
Long-term debts Loss of owners’ status
Arguments Loss of ‘hopes and dreams’
Stress
Insecure tenancy Sense of failure Inability to invest trust in relationships
No independence
Social isolation Letting family down
Parenting difficulties
Poverty in old age
Loss of jobLoss of friendsUnsuitable accommodationLack of spaceLoss of personal possessionsNo access to creditLoss of pets
Source: Nettleton and Burrows (1999).
In the light of the widespread mortgage default, foreclosures and the collapse of the housing market in the United States, we might also add financial and reputational risks to lending institutions and negative macro-economic effects to the above table. Housing affordability has played only a part in this story of a housing ‘bubble’, as the regulation and operation of financial and mortgage markets are also implicated. However, in addition to the individual consequences of repossession, it is clear there are also consequences for institutions and the wider economy.
Thinking about the future, Brook Lyndhurst (2006) identified housing affordability as the largest risk

74
Rapid Evidence assessment of the economic and social consequences of worsening housing affordability
to the government’s previous ambitions to expand homeownership from 70 to 75 per cent. Quantitative scenario building for CLG reveals that expanding homeownership in such a way would mean increasing the numbers of homeowners by 2010 by 1.5 million households. These households would largely be drawn from the south of England and involve attracting more single and couple households into the tenure. Affordability is the major barrier to these households, and a risk to the sustainability of homeownership. The labour market poses a greater risk to single adult households as they have only one earner, and as there is already a high rate of homeownership amongst two adult households, expansion would mean drawing in increasingly marginal couple households on lower-incomes. The CML has suggested a debate is required about what level of mortgage lending to marginal borrowers and the accompanying level of safety nets to support them is desirable once stability returns to the market (CML, 2008b).
Notwithstanding the risks associated with homeownership, there are concerns that constrained access to homeownership can contribute to increasing inequalities between homeowners and non-homeowners. The next chapter considers the extent to which it matters that some people cannot to benefit from the opportunity to accrue housing wealth, and other possible advantages of homeownership, because of housing affordability problems.

75
7. The Potential for Homeownership and Housing Wealth
Key PointsThe value of housing wealth has grown from 101 per cent of GDP in 1980 to 185 per cent of •GDP by 2007, and has increased in significance for households and policymakers.
Homeownership offers long run equity gains, mostly but not exclusively to those with other •financial or pension wealth and higher incomes. In the short term homeowners can suffer equity losses as well.
There is evidence that suggests that the housing wealth that children in the UK are likely to •inherit divides them and their life opportunities more so than inequalities generated by the labour market. The geography of housing wealth is important as homeowners in low cost areas generate lower absolute values of housing equity.
Assumptions made about the potential of housing wealth to cascade down the generations is •based on older homeowners not spending their wealth, which they are more inclined to do, or that it is not spent on long-term care. The ‘nation of inheritors’ is being realised more slowly and to a lesser value than anticipated twenty years ago.
Benefits do accrue to homeowners in a number of ways as there are no housing costs (or •larger imputed rental incomes) in retirement, and scope for housing wealth to lift a small but significant number of ‘income-poor asset-rich’ older homeowners out of poverty. Housing equity is being used to support future generations of homeowners through parental assistance to first-time buyers.
Researchers guard against housing wealth being a substitute for pension policies and the •extent to which non-owners are disadvantaged by tenure is influenced by other social and welfare policies.
IntroductionThis chapter considers the potential for homeownership and housing wealth to support homeowners over the life course, and the degree to which households that are unable to purchase a home may therefore be disadvantaged. Many benefits are claimed for homeownership including better outcomes for children, families and communities, although much of this evidence is drawn from the US (see Rohe et al., 2000). In the UK context, the potential that homeownership provides to accumulate housing equity is implicated in assisting households during different periods, such as supporting families with children while they are growing or left as a bequest to them when the parents die. In addition, households can draw upon equity to smooth income and expenditure whilst working and can use equity to supplement income in retirement. This chapter therefore considers the evidence on the benefits of homeownership regarding wealth accumulation, and briefly on health and education. The impact of housing wealth to influence the wider economy is also considered.
Value and distribution of housing wealthHousing wealth has risen substantially over the course of the last thirty years. An estimate of the value of net housing wealth in Britain in 2007 was £2.6 trillion (Wilcox, 2008b). In 2002, housing wealth represented 42 per cent of total wealth and the proportion of personal wealth held in the form of housing has doubled between 1971 and 2002 during which time the value rose fifty times

76
Rapid Evidence assessment of the economic and social consequences of worsening housing affordability
(Thomas and Dorling, 2004). In 1980, housing equity was roughly equal to UK GDP, but by 2007, housing wealth was equivalent to 185 per cent of the GDP (Wilcox, 2008b). Figure 7.1 illustrates the growth in net personal housing wealth.
Figure 7.1 Net personal housing wealth UK
£ b
illio
n
0
500
1,000
1,500
2,000
2,500
3,000
1970 1975 1980 1985 1990 1995 1996 1997 1998 1999 2000 2001 2002 2003 2004 2005 2006
Source: UK Housing Review 2007/8 (Wilcox, 2008b)
Housing wealth is the most widely distributed asset class, compared to financial wealth, such as stocks and shares, or pension wealth, such as annuities and bonds (Rowlingson et al., 1999; Hamnet, 1999). Nevertheless, although a widely held asset, the socio-economic and geographic distribution of housing wealth differs greatly and has changed over time. Thomas and Dorling (2004) highlight the inequalities resulting from the recent period of increasing housing wealth as homeowners have acquired housing equity at different rates across the country. For example, for the average price of a property in Kensington, London, in 2003 you could purchase 24 properties in Leven, Fife, but in 1983 you could buy only three and in 1993 only two. In their analysis of census areas, they found that half of the cheapest 25 areas were in Scotland, with the rest being in Wales or Northern England; while all the top 25 areas were in London and the South East, with 16 being in London. Moreover, the increase in housing wealth for the period 1993 to 2003 for the top decile of the population was 322 per cent, compared to that of the worst off decile, which was 102 per cent. Of course, during this period those who rent their home did not benefit from any increase in the rise in house prices at all. In absolute terms, the mean average increase in wealth was £132,618 for the top decile, and only £16,720 for the lowest decile. The wealthiest areas of Britain hold over five times more than the poorest areas and are concentrated in Southern England. England and Wales hold more than 22 times the wealth of Scotland despite only having ten times the number of people. While, comparing equity gains across regions between the bottom and top of the market may be problematic due to lags in price rises in different areas, the point regarding geographical disparities remains.

77
7. The Potential for Homeownership and Housing Wealth
Although a source of wealth over the long-term, during parts of the housing market cycle, homeownership can also provide wide scale losses (Hamnet, 1999). Hamnet argued that capital gains from homeownership were not inevitable. The existence of wide scale losses in the early 1990s was a reminder that the distribution of gains and losses is highly uneven. Hamnet also highlighted the inequality, not just between homeowners and non-homeowners, but within the tenure and found class and income are important determinants of the extent to which gains are made from homeownership, with professionals and managers making the largest gains. Furthermore, absolute gains from more expensive properties were greater and higher earners are likely to have purchased houses of greater value or more than one house. The timing of entry into homeownership was another important factor influencing the gains and losses made. Hamnett found that the purchase date seems to be the key determinant of capital gains and losses, outweighing class, income, age and area. However, managers and professionals gained almost twice as much housing wealth in absolute terms as manual groups over their entire housing career.
More recently, Boreham and Lloyd (2007) analysed the BHPS and found that housing wealth had increased for all owners. In 1995 net property assets of 25-34 year olds were £9,000 and for 45-54 year olds £54,000, compared to £95,000 and £182,000 respectively by 2005. Although the absolute increase was greater for the older cohort, the proportionate increase was actually larger for the younger group. The older group had six times the amount of younger households in 1995, but by 2005, older households only had two times the net assets of younger households. Furthermore, the wealth inequality (including financial as well as property assets) had decreased during the decade, with the top decile of 45-54 year olds having 4.4 times the mean net assets of that age group in 1995, but only 3.3 times mean net assets by 2005.
Use of housing wealth during life courseIt may not be easy accessing housing wealth, but it is easier to access than pension or life assurance funds that are only realisable on death or retirement (Thomas and Dorling, 2004). Furthermore, the development of remortgaging and other equity withdrawal products have meant that housing equity is more fungible (Smith and Searle, 2006) and certainly more so in the UK than other countries with less liberal mortgage markets (Scanlon and Whitehead, 2004).
Thomas and Dorling consider what this increase in housing wealth inequality may mean for future generations, suggesting that children born into households with housing wealth will benefit as they grow up and also may benefit from possible inheritance on the death of their parents as well as financial assistance when young adults through equity release. Those children born to parents with no or little housing wealth will inherit almost nothing and will not have access to financial help.
The study estimated and mapped housing wealth by census tract district. In the top decile of wealthiest areas, the housing wealth per child has increased by more than 20 times compared to the lowest decile during period 1993 to 2003. Indeed the share of housing wealth held in the lowest decile reduced from four per cent to three per cent during this decade. In absolute terms, the share of housing wealth per child was £11,671 for the lowest decile areas, which rose 87 per cent from 1993 to 2003, compared to £82,480 per child in the top decile areas, which rose 262 per cent over the decade. The top 30 per cent of the children had access to 42 per cent of housing wealth in 1993 compared to 50 per cent by 2003. Over time, the place a child is born

78
Rapid Evidence assessment of the economic and social consequences of worsening housing affordability
has become more important in determining their potential wealth than the social circumstances of their parents. A poorer family who bought into a lower cost place in London during the 1980s will have more housing wealth than a more affluent family who bought a home in Scotland, where house prices have risen more modestly. Thomas and Dorling argue that children are born more financially unequal by virtue of their parents housing tenure and are less likely to be able to earn their way out of this situation in the future. The housing market therefore can bring benefits of significant magnitude to many households in some areas, but cannot be expected to provide equality (Thomas and Dorling, 2004).
Homeowners increasingly value the assets in their homes for allowing them to meet welfare needs and consumer wants (Jarvis, 2008; Smith and Searle, 2006). In a qualitative study of how middle class residents in the US and UK used their homes, Jarvis (2008) found that homeownership offers financial and emotional security and control over their housing assets. Homeowners altered the home to provide study space, to provide for home employment, or to provide additional space for growing family or spare room to rent out, so they could generate income. In addition, the pursuit of wealth generation also meant that homeowners are inclined to consume more housing in order to maximise that wealth for use in later life or to fund spending on other things (Jarvis, 2008; Smith and Searle, 2006). However, households who chose a less career and more family orientated lifestyle, or who had only a single earner, would be unable to buy more house and therefore would produce less (housing equity) protection in retirement (Jarvis, 2008).
Over the recent period, households and the state have increasingly seen housing wealth as a substitute or supplement to pension assets. Banks, et al. (2005) find that pension wealth is unevenly distributed as the top ten per cent have pension assets totalling £874,000 compared to the bottom ten per cent having only £48,000 on average, but housing wealth is not a substitute for pension wealth as those with the greatest pension assets also hold the most housing wealth. The economic life-course model suggests that households will accumulate wealth during their working years and run down this stock of wealth during their retirement. Evidence suggests that in previous years retired households did not use this stock of wealth as quickly as predicted, maybe because extracting housing wealth through trading down incurs transaction costs or because equity release schemes are not well functioning (Banks and Tanner, 2000). Another explanation for not spending housing wealth maybe that people may view housing wealth differently to other assets and that they wish to bequest these assets to younger generations. Banks and Tanner noted that this view may be eroded as people have to use housing assets to fund long-term care or fund their retirement and this is borne out by more recent evidence.
Households are changing their attitudes to inheritance in that people are less likely to believe that old people should alter their behaviour in order to leave a bequest to family members (Rowlingson and Mckay, 2005). People do not wish to ‘live poor to die rich’ but neither do they wish to spend their assets unnecessarily. Two thirds with something they could leave say that they will enjoy life and are not worried about leaving a bequest, compared to over a quarter that said they would be careful with their money so that there was something left to leave. Owner occupiers did not generally see their homes as potential bequests, but those over 70, along with lone parents, those in social class E and those on low incomes are more likely to take this view than other owner occupiers. People also consider property a better way of providing for retirement than pensions,

79
7. The Potential for Homeownership and Housing Wealth
although a quarter of homeowners have taken equity out of their home already, most commonly by re-mortgaging but also by trading down. This was mostly to fund property repairs but also to repay debts and buy essential items. Most people did not know if they would access equity in the future, but of those who answered the question, trading down was the most common response to how equity would be accessed later in life as equity release schemes are complex, poorly understood and there was little trust in the providers (Rowlingson and McKay, 2005). Similarly, while 80 per cent of owners surveyed for the CML were aware of equity release schemes only 11 per cent would consider using one (Smith,J., 2004b). Younger homeowners are more likely to consider using their housing wealth to fund their retirement compared to currently retired homeowners and a small but growing proportion expect to rely on their property as their main source of income in retirement (Smith,J. 2004b). While 69 per cent of those aged 65-80 want to leave their house as a bequest, only 46 per cent of those homeowners aged 45-54 would do the same.
So, we see younger households more willing to use their housing wealth to fund retirement but what is the potential of this wealth to combat low-incomes in retirement? Hancock (1998a; 1998b) found that equity release cannot overcome poverty for those retired households on the lowest incomes but equity release could bring some small but significant benefits to some of the oldest homeowners. Estimating the scale of potential beneficiaries requires a number of assumptions about benefit levels, annuity rates and mortgage rates. For example, the timing of equity release in old age would be important. Nevertheless, although the poorest older households are not homeowners, Hancock supports the view that housing wealth can alleviate the need for some older households to claim mean-tested benefits and reduce income inequality in old age. Rowlingson (2006) estimated the scope that housing equity had to improve retirement income for low-income pensioners and found that 22 per cent of population in 1995/6 were asset rich but income poor. More recently, Sodha (2005) used the English Longitudinal Study of Ageing to see how many households were housing rich but income poor. At a macro level, there was limited scope for housing wealth to bring households with inadequate pension provision up to a Modest but Adequate3 income, although there are a small but significant minority of households who would benefit in this way. Therefore, although Sodha cautions against the belief that housing wealth can be a solution to pension inadequacy, making equity release products fairer and easier to access has the potential to support some retired households in the future.
The rise in the number of older people who are homeowners is forecast to rise from 71 per cent in 2006 to 75 per cent by 2026, but this does not mean that the number of older people renting will decline. The number of renting older households will increase between 300,000 to 400,000 to bring to the total up to about 3 million by 2026. However, none of these households will have access to any housing equity. Any models that anticipate using housing wealth to pay for care and support in old age will not work for this group of older households. Increasing the proportion of homeowners in society to 85 per cent (from the current 70 per cent) to widen asset holding, would only bring 1.2 million additional households into the sector and is unlikely to happen. Furthermore, Holmans argues that the low value of some of the dwellings in the owner occupied sector means that they would provide insufficient finance for long-term care or to provide an income in old age.
3 A Modest but Adequate (MBA) income is defined by Age Concern as one which allows a lifestyle above poverty but below luxury and enables the person to opportunity to play a full part in society. For example the MBA rate provides for two five-day breaks in the UK a year but not holidays abroad and does not include provision to run a car.

80
Rapid Evidence assessment of the economic and social consequences of worsening housing affordability
InheritanceThe growth of homeownership during the latter half of last century brought the prospect of greatly increased levels of inherited wealth to Britain; bringing the benefits of equity gains not only to the individual homeowner but raises the prospect of this wealth being transmitted to other generations. Noted above are changing attitudes to leaving bequests and inheritance, but the issue of the extent to which Britain was to become a ‘Nation of Inheritors’, as Nigel Lawson the Chancellor of the Exchequer stated in 1988, has been much debated (see for example Saunders, 1990; Forrest et al. 1990).
Hamnet (1999) suggests that claims regarding the future of housing wealth inheritance are made on the assumption that homeowners leave the property to their beneficiaries, and do not in fact extract that equity themselves and spend the money prior to their death. The greater the level of equity extraction the less housing wealth can be transmitted to younger generations via inheritance, unless of course, equity is extracted for the purposes of assisting younger generations into homeownership by providing deposits (Tatch, 2007). Hamnet studied Inland Revenue statistics and found only a modest increase between 1969/70 and 1993/4 in the number of estates passing at death that included housing. A substantial number of these estates passing at death will be transferring to spouses rather than to the next generation of beneficiaries. The value of these estates remains of substantial value however, rising from £465,000 in 1968-9 to £9.46 billion in 1989-90. Furthermore, the value of housing inheritance rose twice as fast during this period than other forms of wealth. The distribution of the value of housing estates passed on varies hugely, the greatest number of estates arise of values between £25,000 and £100,000. The distribution of inherited housing wealth reflects the distribution of homeownership a generation ago where the tenure was much more restricted to the middle classes, but Hamnet argued that by the 1990s the prospects for housing wealth to radically change the wealth accumulation of ordinary households through inheritance were not apparent.
Similarly, Holmans (2008) recently found that housing wealth actually finds itself passed on in the form of inheritances very slowly. He estimates that people inherited £16 billion of housing equity in 2006 and that by 2026 it would only reach £19-30 billion, depending on the assumptions made about house price growth over the long-term. Even if the take up of equity release products and lifetime mortgages were increased, the anticipated creation of a ‘Nation of Inheritors’ is unlikely to be realised in the near future.
In addition to concerns about wealth inequalities between owners and non-owners or even between homeowners, are concerns about wealth inequalities between generations or cohorts. Holmans (2008) suggests that as fewer younger households are entering homeownership housing wealth is slowly but surely becoming concentrated in the hands of older households. The number of older homeowners is anticipated to increase significantly, as those who bought into homeownership in previous decades work their way through to old age. Between 2006 and 2026 there are likely to be a further 2.8 million older homeowners. This is a product of demographics in that the bulge in births in the 1950s and 1960s reach retirement but also reflects the expansion of homeownership since the war. The amount of un-mortgaged equity held by older homeowners was valued at about £1000 billion in 2006, representing 44 per cent of all housing equity. Holmans’ projections of older homeowners does not project past 2026 when younger households

81
7. The Potential for Homeownership and Housing Wealth
who are finding it difficult to access homeownership at the moment will reach retirement, so it is unclear what the prospects for these cohorts will be in the future.
Rowlingson and McKay (2005) show that more than half the population do not expect to receive any inheritance, 14 per cent think they definitely will and a further 14 per cent believe they might receive an inheritance. Younger people have the greatest expectations especially if their parents are homeowners, but some people were uncertain because the assets may be used up to fund long-term care, or they were unclear about who will receive the assets, especially in circumstances of divorce and re-marriages. Amongst those who may leave a bequest, only a quarter of people with children believe their children will need to receive an inheritance. This response was the same among those in social class A as those in social renting in social class D and E, however, social class and tenure influence the likelihood of receiving an inheritance, with owner occupiers and those in a professional classes more likely to receive something.
Social inequalitiesBefore considering what housing affordability and access to the wealth generating opportunity provided by homeownership means for social inequalities it is important to note that the debate is under-pinned with assumptions that the current welfare support mechanisms will persist, or decline. Although this may be likely it is not a given. As Jarvis (2008) notes, the UK has a choice to make regarding the direction of welfare policy and homeownership’s role within that, compared to the US that already has a more developed market based system of welfare.
Maxwell and Sodha (2006) argue that homeownership has heightened wealth inequalities and that the government should promote other forms of asset investment. As discussed above, Thomas and Dorling (2004) highlight the substantial differences in the housing equity accumulated by homeowners and their families in different parts of the country. Furthermore, non-owners have no recourse to housing wealth at all. Different households are able to attain housing wealth at different rates, which can fuel further inequalities. Jarvis (2008) notes the inability of single earner households to accumulate as much housing equity due to their reduced borrowing capacity. Some people do not have any housing equity because they rent their home or because any outstanding debts or mortgage loans are equal to or more than the value of their home. Furthermore, homeowners also have higher than average levels of savings and more financial assets than non-homeowners (Banks and Tanner, 2000). Therefore, equity gains can both provide assets to a wider range of households but also magnify social inequalities.
The extent to which lower income households can benefit from homeownership is reliant on being able to sustainably access wealth or for housing equity to remain intact in old age. As we saw in Chapter 3, the phenomenon of parental support for homeownership is increasing. Therefore, although older homeowners may have an increased propensity to spend the equity themselves, it is already being passed on to the next generation in the form of deposits for first-time buyers from parents or from the estate of grandparents. This may have implications for older homeowners as well. This equity withdrawal reduces the amount of money the parental homeowners can draw upon to supplement their own pension funds in retirement, and their remaining equity and pension funds will now have fallen in value in the present market downturn. It is possible that these concerns will affect the rate of such parental support in the future. It is also clear that this early

82
Rapid Evidence assessment of the economic and social consequences of worsening housing affordability
bequest to younger generations increases the divide between homeowner and non-homeowner families as it maintains demand at higher prices, unattainable to unassisted first-time buyers unless they have higher incomes.
Another concern is the cost and sustainability of relying on equity withdrawal. Sub-prime lending and secondary secured loans are common amongst the households currently experiencing arrears and repossessions (NACAB, 2007; Bramley et al., 2009). Lower income households have therefore risked their home by attempting to access their housing wealth. Brook Lyndhurst (2006) suggests that some reports may overstate the ability of some households to benefit from housing equity. This may illustrate the problems of relying on housing equity for welfare purposes. This was especially evident amongst homeowners in the US than UK, where although they had some positive experiences of market gains, they also experienced anxieties, as a person’s home became their security in a period where the state was rolling back provision from only the neediest (Jarvis, 2008).
Although, at the time of Jarvis’ study, the issue of wealth generation was a more represented experience of homeownership than narratives of repossession or unmanageable debt, the reliance on housing equity also exposed households to risk and anxiety, especially for those American household where the state safety net was minimal. Smith, S. et al. (2004) highlight that homeownership and housing wealth does not work for all households in securing their welfare or housing needs. Homeowners with poor health were motivated to own for choice, investment and security reasons as other homeowners but were either excluded from ownership because their ill-health posed a risk to lending or found the home difficult to sustain because their income had been affected by their illness. The study highlights that housing wealth and homeownership did not provide the support for these households, in an environment where access to alternative social housing was limited. Smith, S. (2005) also notes that there are risks inherent in most households holding their wealth in a limited portfolio with often only one asset, their home, with no mechanisms available for people to protect or hedge the risk of losing their only asset. So while homeownership encourages people to use housing wealth as a pension plan or welfare support it generates inequalities between renters and owners, but there are also a variety of experiences within homeownership where the investment in home for some could become unsustainable and a risky proposition.
The evidence suggests that homeownership can provide a number of benefits for households at various points during the life course, but does so at a risk of exposing households further to the vicissitudes of the market. The debate is only salient amongst lower income households at the margins of homeownership, as it is likely that higher earners will continue to be homeowners. Table 7.2 outlines what might be some advantages and disadvantages of housing wealth as an instrument of social policy. The debate centres on a normative judgement concerning the level of risk that is tolerable to both the individual and wider society and the direction of travel of other social policy and welfare policies as to whether having no access to housing wealth critically disadvantages non-homeowners.

83
7. The Potential for Homeownership and Housing Wealth
Table 7.2 Balancing the potential for homeownership and housing wealth
Advantages Disadvantages
Lower income households with opportunity to accumulate assets.
Accessing housing wealth involves risky additional mortgage borrowing, unless equity leaks through moving home. Or through the use of home reversion schemes in retirement
No major housing costs in old age.Timing of entry to homeownership and location may influence accumulation of housing wealth.
Housing wealth remains unevenly distributed with professional and higher income groups having the most housing wealth.
Can overcome labour market inequalities. Can increase inequalities between owners and non-owners as well as within the tenure.
Assets can generate additional consumption in the economy through equity withdrawal and ‘feel good factors’. Can be used to supplement income, repay debts.
Equity withdrawal increases risks to lower income households and threatens sustainability.
Can supplement income in retirement by downsizing or equity release products.
Currently, only small numbers of cash poor-housing rich homeowners can be raised out of poverty by housing equity.
Equity release products are perceived as poor value for money.
Can support younger generations into homeownership
Can retain housing wealth within families, increasing inequalities between owning and non-owning families.
Wealth effects This section briefly examines the impact of housing wealth on the wider economy. Rising housing markets may affect the economy in two ways (Roger Tyms, 2003). Housing affordability problems contribute to upward pressures on wages, particularly in relation to new entrants, which in turn may produce rising prices, further fuelling demands for higher wages. Indeed, Roger Tyms’ survey of employers in the South East found that 10 per cent of companies had increased wages due to problems with housing affordability. The second way in which high housing costs may influence inflation is by the wealth effects, where increased housing wealth produces positive consumer sentiment amongst owners who are induced to increase consumer spending. The importance of housing equity to the UK economy is disputed but is discussed below.
Figure 7.1 shows that equity withdrawal rose to £58 billion in 2006, equivalent to 7.3 per cent of annual consumer spending (Wilcox, 2008b), but this reduced during 2007 and in 2008. The Crosby Review (2008) suggests that net lending may be negative in 2009, meaning more money will be repaid than advanced in new or additional loans. The link between equity withdrawal, housing wealth and the economy is important because there is concern that volatility in the

84
Rapid Evidence assessment of the economic and social consequences of worsening housing affordability
housing market can be transmitted into volatility in the wider economy (Barrell et al., 2003; Miles, 2004). Barrell and Kirby (2008) suggest that there has been a strong and well supported link between housing wealth and consumption for some time, and that a falling housing market will have an adverse impact on consumption. A 10 per cent drop in house prices is estimated to reduce housing wealth by £357 billion and reduce GDP by between 0.2 and 0.85 per cent over each of the first three years of a downturn.
However, analysis of the 2003 SEH data (Benito and Power, 2004) suggests a relatively weak relationship between equity withdrawal and consumption. This study found that withdrawn equity released by trading down is not spent in the near term but spent on repaying debt or saved, where as equity released from re-mortgaging is more likely to be spent but represents only a quarter of equity withdrawals. Similarly, Bridges et al. (2004) found that homeownership has extended the lines of credit available to households but that most equity withdrawal is amongst older homeowners who are usually reducing their debt and that there was no association between greater housing equity and greater unsecured debt or greater arrears of debt. The analysis of the BHPS used mostly the 2000 wave of panel data. They do raise the prospect of a ‘debt overhang’ once the period of rising house prices end and it would be interesting to note if there analysis holds in later waves and in this period of a falling market.
Figure 7.2 Equity withdrawal as a proportion of consumer spending
£ m
illio
n
1975 1980 1985 1990 1995 1996 1997 1998 1999 2000 2001 2002 2003 2004 2005 2006-2
0
2
4
6
8
10
Source: UK Housing Review (Wilcox, 2008b)
Furthermore, qualitative data for NACAB (2007) and Bramley et al. (2009) found high incidences of secondary lending amongst defaulting homeowners. However, a further study (Benito et al., 2006) finds the relationship between consumption and housing wealth changes over time and is subtle and less stable than supposed. Other factors like rising prices reducing the disposable income of first-time buyers may result in less consumption, or sentiment about the future direction of house prices and wealth may mean households do not react to house price changes by spending in the short-term. The number of transactions in the market also changes with house prices and greater transactions may prompt greater consumer spending although this is likely to be a short-lived effect.

85
7. The Potential for Homeownership and Housing Wealth
Aron et al. (2006) acknowledge the widespread disagreement on the relationship between housing wealth and consumption but their analysis confirms the link between consumer spending and levels of housing equity. The transmission measure is not direct equity withdrawal but the propensity to access credit if they can draw upon collateral. Muellbauer (2007) takes this work further to suggest that before the credit liberalisation of the 1980s, there were no ‘wealth effects’ but that there is now a housing collateral effect.
Access to homeownership therefore may provide an opportunity for households to share in this additional necessary or consumer spending in a rising market, or in a falling market, the risk of unsustainable debt. The extent to which this happens is less a product of house price fluctuations alone but, until recently, complex interactions with liberalised access to credit as the basis of mortgage lending.
EducationIf the potential for housing wealth provides both benefits and risks for some households, studies in the US suggest homeownership can confer additional benefits to social policy, relating to households, their children and neighbourhoods. The chapter continues by considering possible positive educational and health outcomes associated with homeownership. Few studies were retrieved in the searches that related to housing affordability, but the studies suggest the literature in this area may be small.
Few studies explore the relationship between homeownership and education beyond the impacts of poor housing on educational achievement in the UK. Much of the evidence claiming benefit to educational outcomes from tenure comes from North America and is reviewed in Bramley and Karley (2007). The operation and effectiveness of the school is important for educational outcomes, but a range of non-school factors have been considered influential determinants of positive educational results, which include social class, parental educational background, poverty and social exclusion. The relationship of housing tenure to these other factors is complex. Homeownership is associated with social class and better occupations and higher educational achievement, but is homeownership a cause of these effects or is homeownership an outcome of other attributes of the homeowners? In the US, studies have shown homeownership to be associated with overcoming financial exclusion, increasing social capital, stability and commitment to neighbourhood is said to produce positive effects on children and moderating their behaviour as well as positive community effects and the educational achievements of children (Rohe et al, 2000). However, there is little exploration of any similar claims made for the benefits of homeownership in the UK context.
Bramley and Karley (2007) sought to explore this gap by examining the role of homeownership in pupil attainment. Their previous study (Bramley and Karley, 2005b) found that homeownership contributed positively to school attainment, by a similar size as the most influential parental attribute, their own education. This new study, based on modelling data in England and Scotland, found that there was a great deal of overlap between positive attributes of pupils, parents and attainment and homeownership and other social variables. Homeownership appeared to have a greater positive effect at the secondary school level rather than primary and at the micro-neighbourhood level. Although the overall fit of the model did not increase significantly by the

86
Rapid Evidence assessment of the economic and social consequences of worsening housing affordability
addition of the homeownership variables, the authors suggest that there is reason to believe that homeownership does have effects but the transmission mechanism is unclear. It is also the case that homeownership may be an outcome of factors that pre-dispose some households to the tenure as well as positive educational achievement and requires further investigation.
HealthThe report already has highlighted the adverse health affects of unsustainable homeownership (see Nettleton et al., 1998; Nettleton and Burrows, 1999; Smith et al., 2004) and overcrowding (Shelter, 2004b; 2005).
Another study showed how housing tenure affects death rates, with homeowners having lower rates of death than people who live in the social or private rented sectors (Filatki and Fox, 1995 cited in Shaw et al., 1999). However, homeownership is so dominant that it includes a gradient of circumstances from households struggling to repay mortgages to those who hold hundreds of thousands of pounds of housing equity, meaning tenure is too blunt a tool to indicate relative social position (Shaw et al., 1999). Shaw et al. go beyond tenure and use housing wealth as an indicator of social position. They found that people in the wards with the greatest housing wealth have a longer life expectancy. The relationship is not linear however, the greatest gains in life expectancy were made between average housing wealth values of £5000 and £9999 and £10,000 and £14,999 as these were the categories that meant people rose from living in poverty to having a low to average standard. No further gains in life expectancy were made once housing wealth rose above £60,000. Shaw et al. suggest that using tenure alone as a proxy for a beneficial position should be done cautiously as housing wealth shows a great deal of variation within homeownership alone and that it is lifting people out of poverty that is a more powerful factor influencing health outcomes. The role that housing wealth plays in alleviating poverty is not explored in this study and it may be the amount of wealth only reflects a household’s relative social position. We cannot conclude that homeownership per se can alter that relative position and can be the mechanism through which poverty is reduced.
The prevailing association of homeownership is with higher incomes or affluence but as the tenure is so large and diverse, this depiction no longer holds. Burrows (1999) used the Poverty and Social Exclusion Survey and found that although other housing tenure contain larger proportions of poorer households, because homeownership is so large, 50 per cent of poorer households are homeowners (18 per cent outright owners and 32 per cent owners with a mortgage). This means that tenure cannot be used as a proxy for advantage or disadvantage and that both lower income renters and owners both experienced factors that may adversely affect their health. Lower income households in rented accommodation more frequently lived in unhealthy neighbourhoods, had poorer physical health, and were more socially excluded than homeowners. Poor homeowners, on the other hand, tended to experience greater levels of problems associated with physical repair of the homes and poor mental health.

87
8. Conclusions
IntroductionThis rapid evidence assessment examined the literature regarding the economic and social consequences of worsening housing affordability and considered whether problems allied to the apparent constraints on access to homeownership contribute to social inequalities.
Housing affordability essentially appraises the relationship between housing costs and a household’s ability to pay, but a range of factors may influence these issues and the ability to pay for housing operates at different levels of intensity. The report was concerned with housing affordability and how it relates to access to homeownership, rather than affordability problems produced as a result of poverty income levels. As the evidence makes clear, the existence of affordability problems in the mainstream market serve as indicators of housing need for those on lower incomes. The evidence presented demonstrates the complexity of the relationships between the housing market, labour market and the economy, and between individual behaviours and that of public agencies and private institutions. Housing affordability blends with these other factors to produce the various social and economic outcomes, which are the subject of this report. It is clear that worsening housing affordability has contributed to a number of adverse impacts, which this chapter briefly summarises. Whether restricted access to homeownership significantly disadvantages renters is also discussed. Interpreting the evidence in a period of rapidly changing market conditions is also a challenge, thIS chapter considers what aspects of the market have or might change, and which influences may remain the same. Finally, the report identifies some weaknesses and gaps in the knowledge base on housing affordability, homeownership and social inequalities.
Summary of findingsTable 8.1 illustrates the range of consequences to which worsening housing affordability has contributed for individuals, businesses, the wider economy and the government. It is clear that affordability pressures are yet to be overcome despite the falling housing market due to the tighter lending conditions. Housing affordability appears to suggest that demand for, or ambitions towards, homeownership have been unfulfilled for many households and that this has produced second order impacts upon households with housing needs seeking social housing.
However, young households have a weaker disposition to homeownership in the short-term compared to previous cohorts, but reflect similar levels of aspirations for homeownership in the long term. Delayed entry to the labour market, high levels of student debt, the need for labour market mobility when establishing a career, delayed family formation and a commitment to a consumerist lifestyle, all contribute to weaker demand for homeownership amongst younger age groups. Therefore, although the behaviour of younger households has changed the aspirations to homeownership of many have been unfulfilled because of the affordability constraints. There is evidence to suggest that the market will continue to challenge first-time buyers for some time.

88
Rapid Evidence assessment of the economic and social consequences of worsening housing affordability
Tab
le 8
.1 S
om
e so
cial
and
eco
nom
ic c
ons
eque
nces
of
wo
rsen
ing
ho
usin
g a
ffo
rdab
ility
Ind
ivid
ual/
Ho
useh
old
Em
plo
yers
Wid
er E
cono
my
Go
vern
men
t
Acc
ess
to
hom
eow
ners
hip
Hou
seho
lds
pric
ed o
ut o
f •
mar
ket.
Acc
essi
bilit
y in
crea
sed
if pa
rent
s •
are
also
hom
eow
ners
as
depo
sit/
cred
it co
nstr
aint
s m
ajor
ba
rrie
r to
hom
eow
ners
hip.
Unf
ulfil
led
aspi
ratio
ns.
•
Rec
ruitm
ent
and
•re
tent
ion
prob
lem
s in
so
me
publ
ic
agen
cies
.
Som
e em
ploy
ers
•re
spon
ded
by
incr
easi
ng w
ages
.
Infla
tiona
ry
•pr
essu
res
as
wag
es
incr
ease
d.
Pre
ssur
e to
sub
sidi
se
•ac
cess
for
first
-tim
e bu
yers
.
Pla
ns t
o ex
pand
•
hom
eow
ners
hip
limite
d.
Acc
ess
to o
ther
te
nure
Unf
ulfil
led
dem
and
for
•ho
meo
wne
rshi
p di
spla
ced
to
priv
ate
rent
ing,
whi
ch e
xpan
ded
to m
eet
dem
and.
Incr
ease
d de
man
d fo
r so
cial
•
hous
ing
but
no a
dditi
onal
sup
ply
prod
uced
gre
ater
exp
ress
ions
of
hous
ing
stre
ss, s
uch
as
over
crow
ding
, wai
ting
lists
etc
.
Rec
ruitm
ent
•pr
oble
ms
asso
ciat
ed
with
lack
of p
rovi
sion
of
affo
rdab
le h
ousi
ng,
part
icul
arly
in r
ural
ar
eas.
Cos
ts t
o em
ploy
er in
•
prov
idin
g ac
com
mod
atio
n to
em
ploy
ees.
Cos
ts t
o su
ppor
t •
hous
ehol
ds in
te
mpo
rary
ac
com
mod
atio
n, a
nd
cons
eque
nces
of
hous
ing
stre
ss, e
.g.
heal
th a
nd e
duca
tiona
l ou
tcom
es o
n ch
ildre
n of
ove
rcro
wdi
ng.
Sus
tain
abili
ty o
f ho
meo
wne
rshi
pH
igh
hous
ing
cost
s, h
igh
inco
me
•m
ultip
les
or h
igh
LTV
s al
l in
crea
se r
isk
of d
efau
lt.
Low
infla
tion
envi
ronm
ent
•in
crea
ses
dura
tion
of d
ebt
burd
en fo
r ne
w e
ntra
nts.
Con
sequ
ence
s of
mor
tgag
e •
defa
ult
impa
ct u
pon
stat
us,
child
ren’
s ou
tcom
es, s
elf-
este
em, h
ealth
and
wel
l-bei
ng.
Rep
osse
ssio
ns
•de
pres
s ho
usin
g m
arke
t an
d co
nsum
er
spen
ding
.
Rev
iew
•
hom
eow
ners
hip
safe
ty
nets
to
min
imis
e w
ider
so
cial
and
eco
nom
ic
impa
cts
of m
ortg
age
defa
ult.

89
8. Conclusions
Tab
le 8
.1 S
om
e so
cial
and
eco
nom
ic c
ons
eque
nces
of
wo
rsen
ing
ho
usin
g a
ffo
rdab
ility
(co
ntin
ued
)
Ind
ivid
ual/
Ho
useh
old
Em
plo
yers
Wid
er E
cono
my
Go
vern
men
t
Acc
ess
to
hous
ing
wea
lthIn
crea
sed
inci
denc
e of
•
re-m
ortg
agin
g an
d se
cond
ary
lend
ing,
has
pos
ed r
isks
to
sust
aina
bilit
y.
Sm
all n
umbe
rs o
f old
er p
eopl
e •
lifte
d ou
t of
pov
erty
in o
ld a
ge.
Use
d to
sup
plem
ent
inco
me
and
•in
crea
se c
onsu
mer
spe
ndin
g an
d us
ed t
o su
ppor
t fa
mily
m
embe
rs a
cces
s to
ten
ure.
Mor
tgag
e eq
uity
•
with
draw
al
cont
ribut
es
mon
ey in
to
econ
omy,
fu
ellin
g ad
ditio
nal
cons
umpt
ion.
Sen
sitiv
ity t
o •
hous
ing
mar
ket
fluct
uatio
ns c
an
caus
e vo
latil
ity in
w
ider
eco
nom
y.
Pot
entia
l for
sta
te t
o •
rely
on
peop
le fu
ndin
g th
eir
retir
emen
t, in
com
e in
terr
uptio
ns
and
othe
r w
elfa
re
situ
atio
ns t
hrou
gh
thei
r ho
usin
g eq
uity
.
Wel
fare
sup
port
to
•re
nter
s an
d de
faul
ting
hom
eow
ners
.
So
cial
in
equa
litie
sG
eogr
aphy
and
dat
e of
ent
ry o
f •
hom
eow
ners
hip
can
influ
ence
th
e am
ount
of h
ousi
ng w
ealth
ge
nera
ted.
Dis
parit
ies
betw
een
owne
rs a
nd
•no
n-ow
ners
, but
als
o be
twee
n di
ffere
nt h
omeo
wne
rs a
s m
ore
afflu
ent
owne
rs a
ccru
e gr
eate
r ho
usin
g w
ealth
.
Man
age
ineq
ualit
ies
•pr
oduc
ed b
y ho
usin
g m
arke
t as
ren
ters
ha
ve n
o ac
cess
to
hous
ing
wea
lth.

90
Rapid Evidence assessment of the economic and social consequences of worsening housing affordability
The impacts of being priced out of the market are various. Some young households have been able to buy but have done so using higher income multiples, higher deposits (often with help from their parents) or interest-only mortgages. Higher lending multiples and housing costs as a proportion of income mean that they are at risk from increases in interest rates. Although base interest rates are dropping rapidly, it is uncertain to what extent the mortgage rates charged to some existing and new first-time borrowers reflects this reduction.
The private rented sector has expanded to accommodate displaced demand from homeownership but as the supply of social renting has not increased, it is this sector that presents some of the most acute consequences of housing affordability problems in the open market. Affordability problems have meant that social tenant households that would previously have moved into homeownership as their circumstances improved have not been able to do so, reducing the number of re-lets available for new households. This has caused an increase in the numbers of people waiting to be re-housed.
There have been significantly fewer new households formed recently than official trend-based projections forecast. The cost of market housing is likely to have influenced these lower rates of new household formation, especially in areas of few rented alternatives, but age and demographics are also important. Young people appear to be leaving home at the same rate but sharing longer before establishing independent households. Economic factors are likely to have a stronger influence on the tenure choices made by younger households. There is some evidence of people remaining at home longer in some areas, which can cause family tension or conflict. The disaffection with sharing past a certain age was cited in a few studies.
There is strong evidence that in the recent period of rising markets that housing affordability negatively influenced recruitment and retention within some workplaces, mostly amongst public sector employers in hotspots London, the South East and the South West. Housing affordability has adversely affected many rural communities but this may also be a product of a limited supply of rented alternatives. The evidence suggests that key workers assessed the value of their profession or their employment location by comparing work satisfaction to their ability to enter homeownership in their late twenties or early thirties. If key workers found homeownership was unattainable and job satisfaction low, they were likely to move to lower cost areas to fulfil their housing ambitions or, to a lesser extent, leave their profession altogether. Private sector employers also experienced some recruitment problems but the issues were less intense and many private companies had scope to improve staff benefits and salaries to attract the staff they wanted.
Mobility within the open market has reduced seemingly in parallel with rises in housing affordability, but no studies examined this in detail. There are concerns that homeownership reduces labour market mobility, but recent studies have shown that homeowners do move for employment opportunities in high cost areas but do so by buying into contiguous less expensive regions and then commuting.
Homeownership can offer a range of benefits but this comes with a cost, in that the tenure also increases the risk and exposure to the market for many households.

91
8. Conclusions
The prime example of the benefits of homeownership is the opportunity to accumulate housing wealth. In the short-term, studies from the last housing market recession show that there can be capital losses as well as capital gains but during the past thirty years the tendency has been for the market to continue to experience long run rises. Whether this continues or adjusts at lower levels following this downturn is not known. However, gains have been made but those households who have housing wealth are largely those households who have the greatest holdings of other assets such as pension or financial wealth, and even family resources in terms of the greatest prospects for inheritance. However, locational disparities in housing values mean that housing wealth accumulated in some locations is unevenly distributed and may even transcend inequalities generated by income and class.
There is scope for housing equity to assist a small number of current cash-poor housing-rich households to overcome poverty in old age. However, some claims for the potential for housing wealth to overcome and/or perpetuate inequalities generated by the labour market are hampered by assumptions that housing equity is not spent prior to or in retirement, or that housing wealth is of such significance that it can materially change a persons circumstances. Furthermore, recent evidence suggests that lower income households’ access to housing wealth has been often based on risky borrowing and has contributed to them risking repossession. The widespread flow of housing inheritance into the housing market is being realised much more slowly and at a lower level than previously anticipated. On the other hand, wealth is already being transmitted prior to death by families supporting children into homeownership, and the capacity to repay debt or buy additional services or goods by equity withdrawal cannot be under-estimated.
Benefits to health from homeownership were found because of the ability of the tenure to lift some households out of poverty. However, there was limited evidence on other ‘opportunity sets’ of homeownership, as much of the evidence that claims benefits for positive citizenship, community benefits and educational outcomes is from America. The transmission mechanism that confers benefits upon homeowners and their families or communities in which they live is poorly understood (Brook Lyndhurst, 2006). For example, is homeownership a cause of these effects or an outcome?
However, there is clearly UK evidence that homeownership has many advantages, such as no mortgage payments in old age, but that these come at a cost of increased risk and exposure to the fluctuations in the wider housing, financial and labour markets earlier in life. An enhanced safety net package is available to homeowners facing repossession from 2009, which may reduce the risks of losing the home for some homeowners rendering the benefits more worthwhile. However, the effectiveness of these new initiatives are untested but it is hoped that they will limit the number of households experiencing repossession, the impacts of which are severe and can adversely affect former borrowers’ health and wellbeing.
Changing market conditionsThe studies presented in the report largely predate the impacts of the credit crunch upon the economy and housing market, which presents a challenge to interpreting the salience of the evidence. No-one has perfect insight into future market trends but this section considers what factors in a changing market may alter the findings of the evidence assessment.

92
Rapid Evidence assessment of the economic and social consequences of worsening housing affordability
A key concern must be the extent to which future mortgage lending will support marginal homeownership (see CML, 2008b). The ‘reach’ of the mortgage lending to support entry into homeownership (Stephens, 2006) may be limited in the near future. Mortgage lending could very well remain more prudent, cautious and expensive requiring greater deposits of new buyers, provide lower income multiples and more expensive rates as mortgage rates depart from base rates in the short- to medium-term. This may make the market for homeownership more akin to that before the credit liberalisation of the 1980s. Mortgage lending may not support as many lower income homeowners into homeownership as the industry has done in the past, but lower rates of homeownership may be tolerable. Indeed, a more prudent less risky homeownership may be highly desirable and arguably be a positive outcome of the current turbulence. However, sustaining marginal homeowners in the market may be possible if effective safety nets were available.
Following the last housing market recession, the aspiration to own amongst young households waned and took some time to recover to the same extent as older households. However, this has coincided with other social and structural changes that have meant young households do not consider homeownership to be applicable at certain life stages. Following this housing market downturn, it is uncertain how sentiment towards homeownership will change for young households in the short or long term? Will young people still remain committed to the tenure or will young people who have deferred homeownership in their twenties continue to do so into their thirties? Will private renting become an acceptable long term alternative to homeownership rather than a transitional tenure? Moreover, the contraction of the housing market and therefore the limited ability to trade down, together with the reduction in the volume of remortgaging and equity extraction, may affect the rate at which older homeowners in the short-term feel confident to support adult children’s entry into homeownership. Older homeowners may also be reluctant to release equity because of any declines in pension funds over this period of financial turmoil and recession.
However, some aspects of the market will remain and are likely to still be apparent once stability returns to the housing market. The long-term demographic trends may be unaffected by any housing market changes. Increasing longevity will continue to mean that cohorts who became homeowners in earlier periods move through into retirement without relinquishing their homes. The rate of divorce and relationship breakdown, and the increased propensity for people to form single adult households may also remain. The under supply of new homes also continues, as the house building industry experienced the early impacts of the market downturn and recession. These issues could combine to increase the number of households and exert pressure on housing market demand with subsequent affects on house prices.
Research gaps and weaknessesThe NHPAU asked a series of subsidiary questions that the evidence assessment must address:
What has been the impact of worsening housing affordability on national economic growth 1. and on regional economies?
What have been the impacts on labour mobility and the delivery of public services?2.
What are the social and economic implications of widening inequalities in housing wealth? 3.

93
8. Conclusions
Are the social and demographic characteristics of first-time buyers changing and if so why? 4.
What has been the impact of worsening affordability on household formation and tenure 5. choice? Consequently, what is the effect of these factors on health, education and employment outcomes?
What is the evidence on regional variation in social and economic consequences of worsening 6. affordability?
What are the estimates for future economic performance and social inequalities as a result of 7. worsening affordability?
Are there any gaps in the evidence base? 8.
An obvious but important point to make about researching housing affordability and outcomes is that the complexities and range of influences that can affect housing market and social outcomes are wide and sometimes difficult to unpack in terms of research. A key characteristic of some of the research is that proving causality beyond correlation is problematic, so although plausible associations are made there may be other mediating factors that also influence outcomes. Having said that, the evidence presented in the report addresses many of these subsidiary questions in detail, such as our understanding of key workers, first-time buyers and tenure choices. However, there are notable gaps in our understanding of some of the issues raised, particularly where the economic impacts of worsening affordability are concerned. Moreover, there are weaknesses in our understanding of some issues where the evidence is contested, such as our understanding of the strength of the contribution housing affordability has made to reduced household formation and residential mobility. There are also many questions remaining unanswered with regard to the potential for homeownership and housing wealth to both create and overcome social inequalities. Specific research gaps are set out below, but as the markets and policy responses are rapidly changing, it is a challenge to determine what trends will continue and therefore what tools we need for the market circumstances that will emerge from the current downturn. Perhaps of prime importance is the requirement for fresh affordability assessments to be conducted from 2008 onwards to reflect the changed mortgage and housing market circumstances of the post-credit crunch housing market.
None of the studies reviewed specifically addressed how worsening affordability influenced national economic growth or regional economies. These issues were addressed in the literature at the macro-level by discussing the wealth effects produced from the rising markets, people’s propensity to save and consumption activity relating to equity withdrawal, or at the regional level in terms of the recruitment and retention in the labour market, but no data was offered that linked affordability to lower GDP outputs. However, whether a person’s constrained access to homeownership, and the prospect of a smaller homeownership market, would adversely affect the wider economy is uncertain, as there are a multitude of other perhaps stronger factors that could influence the outcomes. Undoubtedly, the current financial crisis in the markets is related to housing affordability and speculation within housing markets, but the weight of the contribution these factors made over and above government regulation or other issues will be long debated.

94
Rapid Evidence assessment of the economic and social consequences of worsening housing affordability
The decline in residential mobility during the period of worsening affordability has not been addressed in the literature and it is unclear whether this relates to the decline in first-time buyers who underpin market transactions or whether it also relates to the difficulties second or third time buyers face in moving through homeownership. This is important in terms of households satisfying their housing needs or aspirations, but again relates to the importance that residential mobility plays in facilitating the labour market.
Social inequalities as a result of the wide distribution of housing wealth or because of renters having no access to housing wealth are an area important to future research. There are a number of issues that would benefit from greater understanding. Homeownership is such a large disparate tenure there are a range of experiences within it, and the benefits and risks of housing wealth for lower income homeowners, perhaps in comparison to matched social or private sector renters, should be explored. The argument about whether homeownership is beneficial is only salient at the margins of the tenure. This would feed into long term policy discussions relating to whether further expansion of the tenure should be pursued. Inheritance of housing wealth is increasing more slowly and at lower amounts than anticipated, but examining other forms of wealth transmission through families and the impacts on older homeowners would also be interesting in the light of the significant proportion of new homeowners being supported by their families. The area may also benefit from a focus, not on the advantages of housing wealth but considerations of why the current welfare system has the potential to disadvantage non-homeowners. Both the advantages and disadvantages of housing wealth are influenced by the social welfare context of support across all tenures.
The potential for housing affordability issues to be a cause of inter-generational conflict as older homeowners increasingly hold housing wealth is an issue that should be examined further. Boreham and Lloyd (2007) suggest that the rise in mortgage debt by young households and the increase in housing wealth by older homeowners indicate a transfer has taken place that could threaten the principles of inter-generational solidarity on which pensions and the health service are founded. However, liquidity is always input at the beginning of a housing market chain or market and extracted as people exit the sector through equity release or death. It could be that this is a result of a mature housing market as less young first-time buyers enter and may not be problematic in the long run as a new stability or equilibrium is reached. The issue is of importance to existing welfare principles so would benefit from further examination, especially in the context of increased parental assistance.
Although there is some recent evidence of indirect impacts on social housing and expressions of housing need and stress, such as overcrowding and longer waiting lists, the interactions of the different parts of the market in areas of poor housing affordability would strengthen this evidence base. Again there are other factors that influence the supply of social housing that may be unrelated to housing affordability, so to identify the magnitude of the role affordability plays in bringing about adverse conditions for households not in market housing would be beneficial.
Rural communities are identified as disproportionately suffering from poor housing affordability ratios, but the literature on the impacts and consequences for local households and businesses appeared under-explored. There was some evidence on issues relating to the social exchange of

95
8. Conclusions
rich and poor households, as both a consequence and cause of housing affordability problems, and on the loss of young people and families from the countryside. It could be that as many of the problems of housing affordability are localised and so evidence conducted at the local level might not always find its way into the public domain, but a stronger evidence base for rural impacts might have been anticipated. The affordability problems for young people were often at an aggregate level and included the lack of social and private rented sector opportunities as well as the availability of affordable properties for homeownership. Much of the rural literature appeared to address the delivery of affordable housing rather than explore the consequences of outstanding need and demand.
Evidence from other countries suggests similar patterns of constrained access to housing and homeownership amongst young households and this issue warrants further consideration. An extension of Meen and Andrews work that identified lower relative earnings of young households in the early 1990s might be of interest in this country. This could establish, not only the impact of house prices on housing affordability, but also of the impact of any changed earning capacity derived from the more established flexible service sector based labour market might also be worth consideration.
Several studies by Mulder raised the issue of the impact of homeownership on fertility and women’s participation in the labour force. These studies were comparative and offered little UK analysis. However, the assertion that homeownership reduces fertility because of the high costs of homeownership, and consequently also increases the participation of women in the labour market, may also warrant further examination in a UK context. Lloyd (2007) also highlights the increased mortgage debt burden of young households and recommends further examination of the impact of homeownership upon family formation.
Lastly, the UK literature has under-explored the potential opportunity sets of homeownership as evidence has mostly been derived from US studies. Further consideration of the outcomes and transmission mechanisms through which the claimed benefits of homeownership work, would also be valuable, and would support any evaluation of the extent to which non-homeowners are disadvantaged or otherwise.

96
References
Andrew, M. (2004) A Permanent Change In The Route To Owner Occupation? Scottish Journal of Political Economy, 51, 24-48.
Andrew, M. (2005) The Changing Route To Owner Occupation: The Impact Of Household Formation And Borrowing Constraints On Young Adult Homeownership In Britain. Economic and Social Research Council.
Andrew, M. (2006) Housing Tenure Choices by the Young. Housing Finance, 1-13.
Andrew, M. and Meen, G. (2006) Changing Route to Owner Occupation: Student Debt. Mimeo.
Andrew M, Haurin, D., Munasib, A. (2006), ‘Explaining the Route to Owner Occupation: A Transatlantic Comparison’, Journal of Housing Economics, 15(3), p.189-216
Andrew, M. and Meen, G. (2003) Housing Transactions and The Changing Decisions Of Young Households In Britain: The Microeconomic Evidence. Real Estate Economics, 31, 117-38.
Aron, J., Muellbauer, J. and Murphy, A. (2006) Housing Wealth and UK Consumption. Economic Outlook, 30, 11-20.
Banks, J. and Tanner, S. (2000) Home-Ownership and Saving In The UK. Housing Finance, 45, 25-9.
Banks, J., Emmerson, C. and Oldfield, Z. (2005) Prepared For Retirement? The Adequacy and Distribution of Retirement Resources In England, London, Institute For Fiscal Studies.
Barker, K. (2003) Review of Housing Supply: Securing our Future Housing Needs (Interim Report). London, HM Treasury.
Barker, K. (2004) Review Of Housing Supply: Delivering Stability: Securing Our Future Housing Needs: Final Report, Recommendations, London, HM Treasury.
Barrell, R. and Kirby, S. (2008) Consumption, Housing Wealth and Financial Crises. National Institute Economic Review, 57-60.
Barrell, R., Choy, A. and Riley, R. (2003) Consumption and Housing Wealth In The Uk. National Institute Economic Review, 53-56.
Battu, H., Ma, A. and Phimister, E. (2008) Housing Tenure, Job Mobility And Unemployment In The UK. Economic Journal, 118, 311-328.
Battye, F., Bishop, B., Harris, P., Murie, A., Rowlands, R., Tice, A. and GHK Consulting Ltd (2006) Evaluation Of Key Worker Living: Final Report, London, Department For Communities And Local Government Publications.

97
References
Benito, A. and Oswald, A. (2000) ‘Commuting In Great Britain in the 1990s’. Working Paper, University of Warwick.
Benito, A. and Power, J. (2004) Housing Equity and Consumption: Insights From The Survey Of English Housing. Bank of England Quarterly Bulletin, 44, 302-309.
Benito, A., Thompson, J. and Waldron, M. (2006) House Prices And Consumer Spending, Bank Of England Quarterly Bulletin.
Bennett, J. and Dixon, M. (2006) Single Person Households and Social Policy: Looking Forwards. York, Joseph Rowntree Foundation.
Blake, N. (2007) Recent Trends in Household Formation – Evidence from the LFS. London, Communities and Local Government.
BMRB Social Research (2005) First-time buyers: The Decision to Buy. London, Council of Mortgage Lenders.
Böheim, R. and Taylor, M. P. (1999) Residential Mobility, Housing Tenure and The Labour Market In Britain. Economic and Social Research Council.
Boreham, R. and Lloyd, J. (2007) Asset Accumulation across the Life course. London, International Longevity Centre.
Bramley, G. and Karley, N. (2003) Potential Need and Demand for Low Cost Home Ownership. Edinburgh, School of the Built Environment, Heriot-Watt University.
Bramley, G. and Karley, N. K. (2005a) How Much Extra Affordable Housing Is Needed In England? Housing Studies, 20, 685-715.
Bramley, G. & Karley, N. K. (2005b) Home-Ownership, Poverty and Educational Achievement: individual, school and neighbourhood effects, Report to Scottish Executive.
Bramley, G. and Karley, N. (2007) Homeownership, Poverty and Educational Achievement: School Effects as Neighbourhood Effects. Housing Studies, 22, 693-722.
Bramley, G., Karley, N. and Watkins, D. (2006) Local Housing Need and Affordability Model For Scotland: Update (2005 Based), Edinburgh, Communities Scotland.
Bramley, G., Karley, N., Lederle, N., Littlewood, M., Morgan, J., Sosenk, P., Stephens, M. and Wallace, A. (2009) Research to Evaluate the National Mortgage to Rent Scheme. Edinburgh, Scottish Government.

98
Rapid Evidence assessment of the economic and social consequences of worsening housing affordability
Bridges, S., Disney, R., Henley, A., 2004, “Housing wealth and the accumulation of financial debt: evidence from UK households”, in The Economics of Consumer Credit Eds Bertola, G., Disney, R., and C. Grant, MIT Press, Cambridge, MA. 135 – 180.
BRMB (2005) First-time buyers: Qualitative Research. London, Council of Mortgage Lenders.
Brook Lyndhurst (2006) New Horizons Research Programme: Social Mobility And Homeownership: A Risk Assessment: Final Report, Department For Communities And Local Government.
Burrows, R. (1999) Poverty and Homeownership in Contemporary Britain, York, Joseph Rowntree Foundation.
Burrows, R. and Wilcox, S. (2000) Half The Poor? The Growth Of Low Income Home-Ownership. Housing Finance, 47, 47-54.
Cambridge Sub Regional Affordable Housing Group (2003) Cambridge Sub-Region Key Worker Housing Research. Final Report. August 2003. London, Roger Tym and Partners.
Cameron, G. and Muellbauer, J. (1998) The Housing Market And Regional Commuting And Migration Choices. Scottish Journal of Political Economy, 45, 420-446.
Cameron, G., Muellbauer, J. and Murphy, A. (2005) Migration within England And Wales and The Housing Market. Economic Outlook, 29, 9-19.
CBRE/Hamptons (2007) The Potential Demand For Key Worker Living Accommodation. London, Pocket Living/ Commonweal Housing.
CCHPR (2001) Cambridge Sub-Region Key Worker Housing Need Study. Cambridge, Cambridge Centre for Housing and Planning Research.
CCHPR (2004) Provision For Key Workers And Unmet Housing Need (East Of England Affordable Housing Study Stage 2). Cambridge, Cambridge Centre for Housing and Planning Research.
Clarke, A., Fenton, A., Holmans, A., Jones, M., Markkhenan, S., Monk, S. and Whitehead, C. (2008) Understanding demographic, spatial and economic impacts on future affordable housing demand. Source Document. London, Housing Corporation.
Clatworthy, T. and Crush, D. (2005) Key Public Sector Workers: Exploring Recruitment and Retention Issues and Housing Preferences. London. Communities and Local Government.
CLG (2008) Facing the Housing Challenge, Action Today, Innovation Tomorrow. London, Communities and Local Government.
CML (2008a) ‘Lending declines further in August’ Press Release 14 October 2008.

99
References
CML (2008b) ‘The coming debate: lending, consumer choice, aspirations and risk.’ CML News and Views Issue 20-21 October 2008.
CRC (2005) State of the Countryside 2005. London, Commission for Rural Communities.
CRC (2006) Rural Housing: A Place in The Countryside. London, Commission for Rural Communities.
Crosby, J. (2008) Mortgage Finance: Final Report and Recommendations. London, HM Treasury.
Croucher, K.; Quilgars, D.; Wallace, A.; Baldwin, S. and Mather, L (2003) Paying the Mortgage? A Systematic Literature Review of Safety Nets for Homeowners York: University of York, Department of Social Policy and Social Work.
Cunningham, J. (2005) Affordability Pressures Build. Housing Finance, 1-11.
DTZ Consulting. (2007) Housing Type and Size In The South East. South East England Regional Assembly.
Dixon, S. (2003) Migration within Britain for Job Reasons. Labour Market Trends.
Doling, J. H. and Horsewood, N. (2003) Home Ownership And Early Retirement: European Experience In The 1990s. Journal of the Built Environment, 18, 229-308.
Edwards, L. (2005) Home Truths: The Reality Behind Our Housing Aspirations, London, Shelter.
EKOS Consulting (2007) Devon Key Worker Housing Study. Devon Local Area Assessment Strategic Housing Group.
Elizabeth Haggart Associates (2004) Employer Engagement in Essential Worker Housing. London, West Kent Partnerships/ Housing Corporation.
Elsinga, M., De Decker, P., Teller, N. and J. Toussaint (2007) Home ownership beyond asset and security: perceptions of housing related security and insecurity in eight European countries, Delft: Delft University Press.
Ermisch, J. (1999) Prices, Parents and Young People’s Household Formation. Journal of Urban Economics. 45 (1) 47-71.
Ermisch, J. and Halpin, B. (2000) Becoming A Homeowner In Britain In The 1990s, University Of Essex, Colchester, Institute For Social And Economic Research.
Europe Economics (2004) A Basis on Which to Build? An Economic Critique of the Barker Review Interim Report. London, Campaign to Protect Rural England.

100
Rapid Evidence assessment of the economic and social consequences of worsening housing affordability
Filatiki, H. and Fox, J.(1995) Differences in mortality by housing tenure and by car access from the OPCS longitudinal study. Population Trends, 27-30.
Forrest, R., Murie, A. and Williams, P. (1990) Homeownership: Differentiation and Fragmentation. London, Unwin Hyman.
FSA (2006) Interest-Only Mortgages- Consumer Risks. London, Financial Services Authority.
FSA (2007) ‘FSA finds poor practice by intermediaries and lenders within sub-prime market’ Press Release 4 July 2007.
GLA (2001) Key Issues For Key Workers Affordable Housing In London: Final Report Of The Affordable Housing Scrutiny Committee, London, Greater London Authority.
GMAC-RFC (2005) First-time buyers: understanding new trends. London, GMAC-RFC.
GSRU (2007) ‘Background Paper 2: What do we already know? Harnessing Existing Research’ London: Government Social Research Unit (HM Treasury).
GSRU (2008) ‘Rapid Evidence Assessment Toolkit’ London: Government Social Research Unit (HM Treasury) http://www.gsr.gov.uk/professional_guidance/rea_toolkit/index.asp
Halifax (2007) Halifax Key Worker Housing Review 2007.Leeds, Halifax plc.
Hamilton, R. (2003) Trends in Households’ Aggregate Secured Debt. Bank Of England Quarterly Bulletin, 43, 271-80.
Hamnet, C. (1999) Winners and Loser: Homeownership in Modern Britain. London, Routledge.
Hancock, R. (1998a) Can Housing Wealth Alleviate Poverty among Britain’s Older Population? Fiscal Studies, 19, 249-272.
Hancock, R. (1998b) Housing Wealth, Income and Financial Wealth of Older People In Britain. Ageing and Society, 18, 5-33.
Heath, S. and Kenyon, E. (2001) Single young professionals and shared household living. Journal of Youth Studies, 4, (1), 83-100.
HBF (2002) Building a Crisis: Housing Under Supply in England. London, Home Builders Federation.
Henley, A. (1998) Residential Mobility, Housing Equity and the Labour Market. Economic Journal, 108, 414-27.

101
References
Henley, A., Bridges, S. and Disney, R. (2006) Housing Wealth and The Accumulation Of Financial Debt: Evidence From UK Households. Cambridge Ma, MIT Press.
Holmans, A. (2001) First-Time Buyers in the United Kingdom: An Updated Age Analysis. Housing Finance, 27-35.
Holmans, A. E. (2005) Recent Trends in Numbers Of First-Time Buyers: A Review Of Recent Evidence. Technical Report. London, Council of Mortgage Lenders.
Holmans, A. (2008) Prospects for UK Housing Wealth and Inheritance. Cambridge, Cambridge Centre for Housing and Planning Research.
Holmans, A. and Whitehead, C. (2008) ‘New and Higher Projections of future-population in England.’ Town and Country Planning Tomorrow Series Paper 10.
Islam, F. (2007) ‘The Great Generational Robbery’ New Statesman, 5 March.
Jarvis, H. (2008) ‘Doing Deals on the House’ In A ‘Post-Welfare’ Society: Evidence Of Micro-Market Practices From Britain and The USA. Housing Studies, 23, 213-231.
Jones, A., Elsinga, M., Quilgars, D., and Toussaint, J. (2006) Security In Tenure: Households Perspectives On Risk And Housing Across The EU. European Network for Housing Researchers Conference. Ljubjana 2-5th July 2006.
Lloyd, J. (2007) Asset Accumulation in Focus: The Challenges Ahead. International Longevity Centre.
Maxwell, D. and Sodha, S. (2006) Housing Wealth: First Timers to Old Timers. London, Institute for Public Policy Research.
May, O., Tudela, M. and Young, G. (2004) British Household Indebtedness and Financial Stress: A Household-Level Picture. Bank of England Quarterly Bulletin, 44, 414-28.
Meen, G. and Andrew, M. (2008) Planning for Housing in the Post-barker Era: Affordability, Household formation and choice. Oxford Review of Economic Policy, 24(1),79-98;
Meen, G., Andrew, M., Ball, M., Goody, J., Kasparova, D., Pryce, G., Whitehead, C. and Wood, G. (2008) Recent Developments In The Communities And Local Government Affordability Model, London, Communities And Local Government.
Miles, D. (2004) The UK Mortgage Market: taking a longer term view. London, HM Treasury.
102
Rapid Evidence assessment of the economic and social consequences of worsening housing affordability
Monk, S., Clarke, A., Fenton, A., Luanaigh, A. N., Shorten, J., Daniels, I., Bridges, M. and Chitonga, M. (2006) Extent And Impact Of Rural Housing Need. Prepared for the Department for the Environment, Food And Rural Affairs By Cambridge Centre For Housing And Planning Research And Land Use Consultants. London, DEFRA.
Monk, S., Morrison, N. and Smith, K. (2002) Research Into Key Worker And Affordable Housing In The Cambridge Area Final Report, Cambridge, Cambridge Housing And Planning Research.
Morgan, J., Bramley, G., Cousins, L., Dunmore, K. and Office of The Deputy Prime Minister (2005) Evaluation Of The Starter Home Initiative: Final Report, London, Office Of The Deputy Prime Minister.
Morrison, N. and Monk, S. (2006) Job-Housing Mismatch: Affordability Crisis In Surrey, South East England. Environment and Planning A, 38, 1115-1130.
Muellbauer, J. (2007) Housing, Credit and Consumer Expenditure. Paper prepared for Kansas Federal Reserve’s Jackson Hole Symposium 31 August-1 September 2007.
Munro, M. (2005) Evaluating Policy Towards Increasing Owner Occupation Housing Studies 22 (2) 243 – 260.
Munro, M., Ford, J., Leishman, C. and Karley, N. (2005) Lending To Higher Risk Borrowers: Sub-Prime Credit and Sustainable Home Ownership. York, Joseph Rowntree Foundation.
Murphy, A., Muellbauer, J. and Cameron, G. (2006) Housing Market Dynamics and Regional Migration in Britain. Discussion Paper Series No. 275. Dept Economics, University of Oxford.
Nationwide (2008) ‘Rate of price Fall Moderates in November’. Press Release 27 November 2008.
NACAB (2007) Set Up to Fail: CAB’s Clients Experiences of Mortgages and Secured Loan Arrears Problems. London, National Association of Citizen Advice Bureaux.
Nettleton, S. B., Burrows, R., England, J. and Seavers, J. (1998) Mortgage Debt, Insecure Home Ownership And Health? An Exploratory Analysis. Sociology of Health and Illness, 20, 731-753.
Nettleton, S. B. and Burrows, R. (1999) The social consequences of mortgage repossession for parents and their children. York, Joseph Rowntree Foundation.
NHPAU (2007) Affordability Matters. Fareham, National Housing and Planning Advice Unit.
NHPAU (2008a) Affordability Still Matters. Fareham, National Housing and Planning Advice Unit.
NHPAU (2008b) Public Attitudes towards the Affordability Of Market Housing. Fareham, National Housing and Planning Advice Unit.

103
References
NHPAU (2008c) Impact of Worsening Affordability on Demand for Social and Affordable Housing: Tenure Choice and Household Formation. Fareham, National Housing and Planning Advice Unit.
NHPAU (2008d) Impact of worsening affordability on demand for social and affordable housing: tenure choice and household formation. NHPAU research findings number 2. Fareham, National Housing and Planning Advice Unit.
NHS CRD (2001) Undertaking systematic reviews of research on effectiveness: CRD’s guidance for carrying out or commissioning reviews (2nd Edition). CRD Report 4. York, NHS Centre for Reviews and Dissemination, University of York.
Notting Hill Housing (2007) Assets and Opportunities: What Social Housing Tenants Think about Home Ownership? London, Notting Hill Housing Trust.
ODPM (2004) The Impact of Overcrowding on Health and Education. London, Office of the Deputy Prime Minister.
Oswald, A.J. (1999) The Housing Market and Europe’s Unemployment: A Nontechnical Paper, mimeo University of Warwick.
Pannell, B. (2007) Improving Attitudes to Home-Ownership. Housing Finance, 1-8.
Park, A., Curtice, J., Thompson, K., Bromley, C., Phillips, M. and Johnson, M. (2005) British Social Attitudes: The 22nd Report. Two Terms of New Labour: the Public’s Reaction. London: Sage Publications.
Pocket Living (2006) Key Workers Buying Starter Homes Their Challenges And Aspirations. London, Pocket Living/ Commonweal Housing.
Quilgars, D. and Jones, A. (2007) ‘United Kingdom: Safe as houses?’ in M. Elsinga; P. De Decker; N. Teller and J. Toussaint, Home ownership beyond asset and security: perceptions of housing related security and insecurity in eight European countries, Delft: Delft University Press.
Rainer, H. and Smith, I. (2008) Staying together for the sake of the home? House price shocks and partnership dissolution in the UK. St Andrews, Institute for Social and Economic Research.
Regan, S., Patrick, R. and Edwards, L. (2001) Squeezed Out: Choice And Affordability In Housing, London, Institute For Public Policy Research.
Reynolds, L. and Robinson, N. (2005) Full House? How Overcrowded Housing Affects Families. London, Shelter.
Reynolds, L., Parsons, H., Baxendale, A., Dennison, A. and Zimmermann, S. (2008) Breaking Point: How Unaffordable Housing Is Pushing Us To The Limit, London, Shelter.

104
Rapid Evidence assessment of the economic and social consequences of worsening housing affordability
RICS (2008) RICS Housing Accessibility and Affordability Update For Great Britain. Accessibility Worsens Despite Falling House Prices. Royal Institute of Chartered Surveyors Economics. Q2, 1-5.
Robson, M. T. (2003) Housing Markets And Regional Unemployment Flows In Great Britain. Manchester School, 71, 132-155.
Roger Tyms and Partners (2003) The Economic Impacts Of Housing Affordability, Guildford, South East England Development Agency.
Rohe, W.M, McCarthy, G. and Van Zandt, S. (2000) The social benefits and costs of homeownership: A critical assessment of the research. Washington, D.C.: Research Institute for Housing America: 1-42.
Rosser, M. (1999) The Determinants of Graduate’s Demand for Housing. Applied Economic Letters. (6) 3 pp. 139-142.
Rowlingson, K. (2005) Attitudes to Housing Assets and Inheritance. Housing Finance, July, 1-11.
Rowlingson, K. (2006) ‘Living Poor to Die Rich’? Or ‘Spending the Kids’ Inheritance’? Attitudes to Assets and Inheritance in Later Life. Journal of Social Policy, 35, 175-192.
Rowlingson, K., Whyley, C., and SWarren, T. (1999) Wealth in Britain: A lifecycle perspective. London, Policy Studies Institute.
Rowlingson, K. and Mackay, S. (2005) Retirement Resources: The Role of Housing Assets and Bequests. Quality in Ageing 6 (4)
Rugg, J. and Rhodes, D. (2008) The Private Rented Sector: Its contribution and potential. York, Centre for Housing Policy, University of York.
Santer, P. (2008) Fuzzy households, fuzzy tenure. Housing Finance Online. Issue 01 08.
Saunders, P. (1990) A Nation of Home Owners. London, Routledge.
Scanlon, K. and Whitehead, C. (2004) International Trends in Housing Tenure and Mortgage Finance. London, Council of Mortgage Lenders.
Shaw, M., Dorling, D. and Brimblecombe, N. (1999) Life Chances in Britain By Housing Wealth And For The Homeless And Vulnerably Housed. Environment and Planning A, 31, 2239-2248.
Shelter (2004a) Priced Out: The Rising Cost of Rural Homes. London, Shelter.
Shelter (2004b) Crowded House: Cramped Living in England’s Housing. London, Shelter.
Shelter (2005) Full House: How Overcrowding Affects Families. London, Shelter.

105
References
Shelter (2008) Breaking Point: How Unaffordable Housing is Pushing Us to the Limit. London, Shelter.
Sherwood, K. and Jones, J. (2005) Northamptonshire Key Worker Housing Needs. Northampton, Matters of Fact.
Smith, J. (2004a) Understanding Demand for Homeownership: Aspirations, Risks And Rewards. Housing Finance, 10-23.
Smith, J. (2004b) Exploring Attitudes to Housing Wealth and Retirement. Housing Finance, 22-33.
Smith, J. (2005) Attitudes to Home-Ownership and Moving in 2004. Housing Finance, 1-11.
Smith, J., Pannell, B., Holmans, A. and Thom, A. (2005) Understanding First-Time Buyers. London, Council of Mortgage Lenders.
Smith, S., Easterlow, D. and Munro, M. (2004) Housing for Health: Does the Market Work? Environment and Planning A, 36, 579-600.
Smith, S. (2005) Banking on housing? Speculating on the role and relevance of housing wealth in Britain. York, Joseph Rowntree Foundation.
Smith, S. (2008) ‘Owner-occupation: at home with a hybrid of money and materials’ Environment and Planning A (40) 520 – 535.
Smith, S. and Searle, B. (2006) ‘Dematerialising Money? Observations on the Flow of Wealth from Housing to Other’ Things Housing Studies. 23 (1) 21-43.
Sodha, S. (2005) Housing-Rich, Income-Poor: The Potential of Housing Wealth In Old Age. London, Institute for Public Policy Research.
Spencer, R. (2003) The Impact Of Rising Graduate Debt On First-Time Buyer Market. Housing Finance, Spring, 39-49.
Stephens, M., Whitehead, C. and Munro, M. (2005) Lessons From the Past, Challenges for the Future for Housing Policy: an Evaluation of English Housing Policy 1975-2000, London: Office of the Deputy Prime Minister
Stephens, M. (2006) Housing finance, “reach” and access to owner-occupation in Western Europe, Centre for Housing Policy Working Paper, http://www.york.ac.uk/inst/chp/workingpapers.htm
Stephens, M., Daily, M. and Wilcox, S. (2008) Developing Safety Nets for Home-Owners. York, Joseph Rowntree Foundation.

106
Rapid Evidence assessment of the economic and social consequences of worsening housing affordability
Stephens, M. and Quilgars, D. (2007) ‘Managing Arrears and Possessions’, Housing Finance, Issue 05, 1-14.
Stephens, M. and Quilgars, D. (2008) The Sub-Prime Lending Market in the UK. European Journal of Housing Research.
Stone, M. (2006) A Housing Affordability Standard for the UK. Housing Studies (21) 4 pp.453-476.
Tatch, J. (2006) Will the Real First-Time Buyers Please Stand Up? Housing Finance, 1-16.
Tatch, J. (2007) Affordability – Are Parents Helping? Housing Finance, 1-11.
Taylor, R. (2008) Buy-To-Let Mortgage Lending and the Impact on House Prices, Fareham, National Housing and Planning Advice Unit.
Taylor, M. (2008) Living Working Countryside: The Taylor Review of Rural Economy and Affordable Housing. London, Communities and Local Government.
Thomas, B. and Dorling, D. (2004) Know Your Place: Housing Wealth and Inequality In Great Britain 1980-2003 And Beyond, London, Shelter.
Vass, J. (2004) Affordability: Testing Times Ahead. Housing Finance, 34-7.
Wallace, A., Croucher, K., Quilgars, D. and Baldwin, S. (2004). ‘Meeting the challenge: developing systematic reviewing in social policy. Policy and Politics, Vol. 32 (4), 455-470.
Wallace, A., Croucher, K., Jackson, K., O’Malley, L., and Quilgars, D (2006). ‘Reflections on systematic reviewing in housing’. Housing Studies 21 (2) 297-314.
Whitehead, C., Monk, S., Burgess, G., Clarke, A. and Holmans, A. (2008) Rapid Evidence Review of the Research Literature on the Impact of Worsening Housing Affordability. Fareham, National Housing and Planning Advice Unit.
Whitehead, C. and Gaus, K. (2007) At Any Cost? Access to housing in a changing financial marketplace. Policy Discussion Paper. London, Shelter.
Wilcox, S. (2003) Can Work, Can’t Buy: Local Measures Of The Ability Of Working Households To Become Home Owners, York, Joseph Rowntree Foundation.
Wilcox, S. (2005) Affordability and the Intermediate Housing Market: Local Measures For All Local Authority Areas in Great Britain, York, Joseph Rowntree Foundation.
Wilcox, S. (2006) The Geography of Affordable and Unaffordable Housing and the Ability of Younger Working Households to Become Home Owners, York, Joseph Rowntree Foundation.

107
References
Wilcox, S. (2008a) Can’t Supply: Can’t Buy. The Affordability of Private Housing In Great Britain – Summary Report. London, Hometrack.
Wilcox, S. (2008b) UK Housing Review 2007/8. York, Chartered Institute of Housing and Building Societies Association.

108
Appendix A – Literature searches
The searching was conducted in summer 2008. The following search strategy was used during the initial searches for ‘housing affordability’ in the International Bibliography of the Social Sciences (IBSS) database (OvidSP interface). This strategy was translated and adapted as appropriate for each of the databases searched. Full details of sources, search strategies and results are available from the authors.
1. Housing/ and (price level/ or price rises/)
2. (price level/ or price rises/) and (housing or house or houses).ti,ab.
3. (afford$ adj3 (housing or house or houses)).ti,ab.
4. (afford$ adj3 (home or homes or dwelling or dwellings)).ti,ab.
5. (afford$ adj3 (property or properties)).ti,ab.
6. (afford$ adj3 (mortgage or mortgages or mortgaged or mortgaging)).ti,ab.
7. (afford$ adj3 (rent or rents or rental or rentals or rented)).ti,ab.
8. (unafford$ adj3 (housing or house or houses)).ti,ab.
9. (unafford$ adj3 (home or homes or dwelling or dwellings)).ti,ab.
10. (unafford$ adj3 (property or properties)).ti,ab.
11. (unafford$ adj3 (mortgage or mortgages or mortgaged or mortgaging)).ti,ab.
12. (unafford$ adj3 (rent or rents or rental or rentals or rented)).ti,ab.
13. ((rising or rise$) adj3 (housing or house or houses) adj3 (cost$ or price$)).ti,ab.
14. ((rising or rise$) adj3 (home or home or dwelling or dwellings) adj3 (cost$ or price$)).ti,ab.
15. ((rising or rise$) adj3 (property or properties) adj3 (cost$ or price$)).ti,ab.
16. ((rising or rise$) adj3 (mortgage or mortgages or mortgaged or mortgaging) adj3 (cost$ or price$)).ti,ab.
17. ((rising or rise$) adj3 (rent or rents or rental or rentals or rented) adj3 (cost$ or price$)).ti,ab.
18. ((increase$ or increasing) adj3 (housing or house or houses) adj3 (cost$ or price$)).ti,ab.
19. ((increase$ or increasing) adj3 (home or homes or dwelling or dwellings) adj3 (cost$ or price$)).ti,ab.

109
Appendix A – Literature searches
20. ((increase$ or increasing) adj3 (property or properties) adj3 (cost$ or price$)).ti,ab.
21. ((increase$ or increasing) adj3 (mortgage or mortgages or mortgaged or mortgaging) adj3 (cost$ or price$)).ti,ab.
22. ((increase$ or increasing) adj3 (rent or rent or rental or rentals or rented) adj3 (cost$ or price$)).ti,ab.
23. ((escalate or escalated or escalating) adj3 (housing or house or houses) adj3 (cost$ or price$)).ti,ab.
24. ((escalate or escalated or escalating) adj3 (home or home or dwelling or dwellings) adj3 (cost$ or price$)).ti,ab.
25. ((escalate or escalated or escalating) adj3 (property or properties) adj3 (cost$ or price$)).ti,ab.
26. ((escalate or escalated or escalating) adj3 (mortgage or mortgages or mortgaged or mortgaging) adj3 (cost$ or price$)).ti,ab.
27. ((escalate or escalated or escalating) adj3 (rent or rents or rental or rentals or rented) adj3 (cost$ or price$)).ti,ab.
28. ((accelerate or accelerated or accelerating) adj3 (housing or house or houses) adj3 (cost$ or price$)).ti,ab.
29. ((accelerate or accelerated or accelerating) adj3 (home or homes or dwelling or dwellings) adj3 (cost$ or price$)).ti,ab.
30. ((accelerate or accelerated or accelerating) adj3 (property or properties) adj3 (cost$ or price$)).ti,ab.
31. ((accelerate or accelerated or accelerating) adj3 (mortgage or mortgages or mortgaged or mortgaging) adj3 (cost$ or price$)).ti,ab.
32. ((accelerate or accelerated or accelerating) adj3 (rent or rents or rental or rentals or rented) adj3 (cost$ or price$)).ti,ab.
33. ((high or higher) adj3 (housing or house or houses) adj3 (cost$ or price$)).ti,ab.
34. ((high or higher) adj3 (home or homes or dwelling or dwellings) adj3 (cost$ or price$)).ti,ab.
35. ((high or higher) adj3 (property or properties) adj3 (cost$ or price$)).ti,ab.
36. ((high or higher) adj3 (mortgage or mortgages or mortgaged or mortgaging) adj3 (cost$ or price$)).ti,ab.

110
Rapid Evidence assessment of the economic and social consequences of worsening housing affordability
37. ((high or higher) adj3 (rent or rents or rental or rentals or rented) adj3 (cost$ or price$)).ti,ab.
38. ((grow or growing or growth) adj3 (housing or house or houses) adj3 (cost$ or price$)).ti,ab.
39. ((grow or growing or growth) adj3 (home or homes or dwelling or dwellings) adj3 (cost$ or price$)).ti,ab.
40. ((grow or growing or growth) adj3 (property or properties) adj3 (cost$ or price$)).ti,ab.
41. ((grow or growing or growth) adj3 (mortgage or mortgages or mortgaged or mortgaging) adj3 (cost$ or price$)).ti,ab.
42. ((grow or growing or growth) adj3 (rent or rents or rental or rentals or rented) adj3 (cost$ or price$)).ti,ab.
43. ((inflat$ or fluctuat$) adj3 (housing or house or houses) adj3 (cost$ or price$)).ti,ab.
44. ((inflat$ or fluctuat$) adj3 (home or homes or dwelling or dwellings) adj3 (cost$ or price$)).ti,ab.
45. ((inflat$ or fluctuat$) adj3 (property or properties) adj3 (cost$ or price$)).ti,ab.
46. ((inflat$ or fluctuat$) adj3 (mortgage or mortgages or mortgaged or mortgaging) adj3 (cost$ or price$)).ti,ab.
47. ((inflat$ or fluctuat$) adj3 (rent or rents or rental or rentals or rented) adj3 (cost$ or price$)).ti,ab.
48. ((unable or able or inability or ability or capable or capability or capacity of difficult$) adj3 (buy$ or purchas$) adj3 (house or housing or houses)).ti,ab.
49. ((unable or able or inability or ability or capable or capability or capacity of difficult$) adj3 (buy$ or purchas$) adj3 (home or homes or dwelling or dwellings)).ti,ab.
50. ((unable or able or inability or ability or capable or capability or capacity of difficult$) adj3 (buy$ or purchas$) adj3 (property or properties)).ti,ab.
51. high cost location$.ti,ab.
52. high cost area$.ti,ab.
53. affordable location$.ti,ab.
54. affordable area$.ti,ab.
55. (housing market adj3 pressure$).ti,ab.

111
Appendix A – Literature searches
56. or/1-55
57. (first time adj2 (buy$ or homeown$ or home own$ or owner occup$)).ti,ab.
58. (first home adj3 (buy$ or owner$ or occup$)).ti,ab.
59. (house price$ adj2 income ratio$).ti,ab.
60. (house price$ adj2 earning$ ratio$).ti,ab.
61. (mortgage$ adj2 income ratio$).ti,ab.
62. (mortgage$ adj2 earning$ ratio$).ti,ab.
63. housing wealth.ti,ab.
64. housing equity.ti,ab.
65. housing asset$.ti,ab.
66. asset based welfare.ti,ab.
67. Home ownership/ and (Demography/ or Family/)
68. ((household$ adj3 (formation$ or composition$ or structure or configuration)) and (home owner$ or homeowner$ or owner occup$)).ti,ab.
69. (((family or families) adj3 (formation$ or composition$ or structure or configuration)) and (home owner$ or homeowner$ or owner occup$)).ti,ab.
70. (((housing or house or houses) adj3 (choice$ or prefer$ or option$)) and (home owner$ or homeowner$ or owner occup$)).ti,ab.
71. or/57-70
72. 56 or 71
73. (united kingdom or uk or britain or england or wales or scotland or ireland).gh.
74. (united kingdom or uk or britain or england or wales or scotland or ireland).ti,ab.
75. 73 or 74
76. 72 and 75
77. limit 76 to yr=”1998 – 2009”

112
Rapid Evidence assessment of the economic and social consequences of worsening housing affordability
Internet sites searchedOrganisation websites were browsed (publications and/or research) and searched using a variety of combinations of the following terms: overcrowding, commuting, residential mobility, labour mobility, rural housing, rural economy, regional economy, generation(al) inequality.
Council of Mortgage Lenders http://www.cml.org.uk/cml/home
Communities and Local Government http://www.communities.gov.uk/corporate/
National Housing and Planning Advice Unit (NHPAU) http://www.communities.gov.uk/nhpau/
Shelter (England & Scotland) http://www.shelter.org.uk/
HM Treasury http://www.hm-treasury.gov.uk/
Home Builders Federation http://www.hbf.co.uk/Home
Housing Corporation http://www.housingcorp.gov.uk/
Chartered Institute of Housing http://www.cih.org/
Royal Institution of Chartered Surveyors http://www.rics.org/ (inc. RICS Library Catalogue)
Department for Work and Pensions http://www.dwp.gov.uk/
Joseph Rowntree Foundation http://www.jrf.org.uk/
Commission for Rural Communities. Affordable Rural Housing Commission http://www.ruralcommunities.gov.uk/projects/affordableruralhousingcommission/overview
Institute of Public Policy Research (ippr) http://www.ippr.org.uk/

113
Appendix A – Literature searches
3) Citation searchesCitation searches using SSCI and Google Scholar were undertaken for the following studies:
Morrison N, Monk S. Job-housing mismatch: affordability crisis in Surrey, South East England. Environment and planning A 2006;38(6):1115-1130.
Bramley G, Karley NK. How much extra affordable housing is needed in England? Housing studies 2005;20(5):685-715.
Monk S, Morrison N, Smith K. Research into key worker and affordable housing in the Cambridge Area Final report. Cambridge: Cambridge Housing and Planning Research; 2002.
Thomas B, Dorling D. Know your place: housing wealth and inequality in Great Britain 1980-2003 and beyond. London: Shelter; 2004.
Shelter. On the up: the housing crisis in the north. London: Shelter; 2004.
Hickman P, Robinson D, Casey R, Green S, Powell R. Understanding housing demand: learning from rising markets in Yorkshire and the Humber. Coventry: Chartered Institute of Housing; 2007.
Future Foundation. Up and coming areas in the UK: Future Foundation; 2006.
Samter P. Fuzzy households, fuzzy tenures. Housing Finance 2008(01):1-10.
Tatch J. Affordability – are parents helping? Housing Finance 2007(03):1-11.
Smith J, Pannell B, Council of Mortgage Lenders , HolmansA, Thom A. Understanding first-time buyers. London: Council of Mortgage Lenders; 2005.
Smith J. Attitudes to home-ownership and moving in 2004. Housing Finance 2005(04):1-11.
Meen G, Andrew M, Ball M, Goody J, Kasparova D, Pryce G, et al.. Recent developments in the communities and local government affordability model. London: Department for Communities and Local Government; 2008.
National Housing and Planning Advice Unit. Impact of worsening affordability on demand for social and affordable housing: tenure choice and household formation. NHPAU research findings number 2. Fareham: National Housing and Planning Advice Unit; 2008.
National Housing and Planning Advice Unit. Public attitudes towards the affordability of market housing. NHPAU Research Findings Number 3. Fareham: National Housing and Planning Advice Unit; 2008.
Reynolds L, Parsons H, Baxendale A, Dennison A, Zimmermann S. Breaking point: how unaffordable housing is pushing us to the limit. London: Shelter; 2008.

114
Rapid Evidence assessment of the economic and social consequences of worsening housing affordability
West Kent Partnership Essential Worker Housing Employer Engagement Project. Employer engagement in essential worker housing: Elizabeth Haggart Associates, Housing Corporation; 2004.
Wilcox S. Can’t supply: can’t buy. The affordability of private housing in Great Britain – summary report. London: Hometrack; 2007.
Palmer G, Kenway P, Wilcox S. Housing and neighbourhoods monitor. York: Joseph Rowntree Foundation; 2006.
IFF Research Ltd. Interest-Only mortgages- consumer risks; 2006.
CCHPR. Provision for key workers and unmet housing need (East of England affordable housing study Stage 2); 2004.


National Housing and Planning Advice Unit
CB04, Ground Floor of Clerical Block
Segensworth Road, Titchfield
Fareham PO15 5RR
Printed in the UK on material containing no less that 75% post-consumer waste.May 2009
© Crown Copyright, 2009