rapid risk assessment of atmospheric dispersion of stack …
TRANSCRIPT

RAPID RISK ASSESSMENT OF
ATMOSPHERIC DISPERSION OF STACK EMISSIONS FROM AL-HARTHA POWER PLANT, IRAQ
Submitted by
Dr. Mutasem El-Fadel Senior Consultant
World Bank
February, 2006
E1506v 2
Pub
lic D
iscl
osur
e A
utho
rized
Pub
lic D
iscl
osur
e A
utho
rized
Pub
lic D
iscl
osur
e A
utho
rized
Pub
lic D
iscl
osur
e A
utho
rized
Pub
lic D
iscl
osur
e A
utho
rized
Pub
lic D
iscl
osur
e A
utho
rized
Pub
lic D
iscl
osur
e A
utho
rized
Pub
lic D
iscl
osur
e A
utho
rized

ii
ACKNOWLEDGEMENTS
The support of the World Bank project team (Tjaarda Storm van Leeuwen, Amir Al-Khafaji, Reynold Duncan, Fadi Haddadin, Hayat Taleb Al-Harazi, Mona el-Chami, and Simon Stolp) is appreciated. Special thanks are extended to the members of the Iraqi delegations and the Al-Hartha power plant management particularly Mr. Abdul Ameer Murad for providing relevant data and information about the plant.
iii
EXECUTIVE SUMMARY
Introduction
Worldwide electric power is considered as an important factor for the development of national economies. Its availability and reliability have significant positive impacts on the national economic output (GDP), energy security, and quality of life. However, electric power generation using fossil fuels is inherently associated with the release of air pollutants that have potential adverse effects on the environment and public health. The combustion of fossil fuels at power plants to generate electricity produces significant amounts of air pollutants in the form of sulfur oxides (SOx), particulate matter (PM), nitrogen oxides (NOx), volatile organic compounds (VOCs), metals, etc. all emitted in the smoke stack of a power plant. A large number of studies worldwide linked these emissions to a wide range of adverse environmental and health effects. In this context, the World Bank, in coordination with the Iraqi Ministry of Electricity (MoE), has agreed to finance the rehabilitation of two generating units (currently out of order) in an already existing power plant located in Al-Hartha, South of Iraq. The operation of these additional two units is expected to increase overall plant emissions and potential exposure, but since they will be using more efficient technology compared to the original units, the overall environmental impact is expected to be less, if compared to the operation of the four original units. Moreover, the proposed project will displace distributed generation using diesel which have a higher negative environmental impact. A rapid risk assessment of potential exposure of stack emissions before and after the rehabilitation of the plant was conducted with the primary goal to define far field exposure risk along the Iraqi international borders with Iran and Kuwait. The results of this assessment are anticipated to be used as guidelines for a planned full Environmental and Social Impact Assessment (ESIA) for the proposed plant rehabilitation. Project description
Al-Hartha power plant (HPP) is located in Al Hartha area, Basra Governate, South of Iraq. The plant is about 20 km north of Basra city and 25 km west of the Iranian border. Shatt Al Arab river passes in the immediate vicinity of the plant. Cooling water for the generation units is diverted through a water intake along the river. The plant was first commissioned in 1979 and consists of 4 generation units (200 MW each) with a total design capacity of 800 MW. Each unit has a separate emission stack that is connected to an independent boiler. Units

iv
1 and 4 are currently operational and produce about 195 and 150 MW, respectively. In contrast, units 2 and 3 have not been in use since the first Gulf War in 1991. The Iraqi Ministry of Electricity (MoE) is currently negotiating with the World Bank to finance the rehabilitation of units 2 and 3 with the goal of adding 400MW to the national grid. The rehabilitation of the Hartha Power station, the major component of the Emergency Electricity Reconstruction Project of which the total cost is estimated at US$150 million. It is proposed to be financed from: (i) an IDA Credit of US$124 million; (ii) a US$6 million grant from the World Bank Iraq Trust Fund (ITF) and; (iii) US$20 million from the MoE’s capital budget resources. The plant was initially designed to operate on natural gas as the primary fuel. In the absence of natural gas, the units can be operated using either heavy fuel oil (HFO) or crude oil. Currently, due to the difficulties in providing adequate quantities of natural gas for the operation of the plant, the two working units (1 and 4) are operated on crude oil with a sulfur content of 3.7%. As such, the plant may be associated with relatively high emissions which will increase with the introduction of two additional units. Atmospheric dispersion modeling
The risk assessment was conducted to evaluate emission dispersion from the Al-Hartha power plant. For this purpose, atmospheric dispersion modeling was used to define potential air quality impacts associated with the two currently operational units (1 and 4) as well as the impacts that may arise upon the rehabilitation of the two additional units (2 and 3, reaching a combined design capacity of 800 MW for all units operating together). The BREEZE ISC GIS Pro model, an advanced Windows based version of the US Environmental Protection Agency Industrial (USEPA) Source Complex Short Term 3 (ISCST3) model, was used to assess the impact of gaseous emissions on ambient air quality in the region. The model, which is commonly used for regulatory and impact assessment purposes, incorporates features that enable the user to estimate concentrations from a wide range of sources and can simulate an unlimited number of sources, source groups, and receptors. Emissions were simulated for a complete meteorological year considering various scenarios (before/after rehabilitation, type of fuel used–crude oil, HFO, and natural gas–, emission control measures) to assess potential near-field exposure and health impacts at short/near field distances or within plant vicinity (up to 1.5 km) and at far field or long distances reaching the Kuwaiti and Iranian borders. The dispersion modeling was conducted using primary constituents of concern that are linked to power generation, namely, SO2 and particulate matter (PM). Other indicators such as NOx, VOCs, PM10, PM2.5, or others will be simulated as needed in the full ESIA. Note that emission dispersion simulations are limited by the accuracy of the input data and the inherent limitations of the specific models used. While site-specific data were used to the
v
extent possible to develop emission and air quality modeling inputs, data were not available at times and, thus, assumptions were adopted as needed. Since no on-site emission testing was available, emission rates of SO2 were estimated on the basis of the fuel quantity and quality. The SO2 emission rates were found by assuming that the HFO and crude oil sulfur content will be entirely converted to SO2. On the other hand, emission rates of total particulate matter were calculated in accordance with the AP-42, Emission Factor document, USEPA. These emission factors will be measured and ascertained during the implementation of the full ESIA and the simulations repeated with the values obtained, if significantly different. Background air quality
In the past two decades, air quality monitoring in Iraq has been limited and intermittent, mainly focused in Baghdad. The limited data revealed consistently high levels of PM in the atmosphere (annual average of 225 to 603 µg/m3 with maximum daily levels reaching 1,249 to 8,800 µg/m3, probably during desert sand storms), while levels of SO2 (annual average of 26 to 47 µg/m3) remained generally acceptable. In the absence of detailed quantitative data of emission sources and environmental quality, a recent study assessed air quality in the cities of Baghdad, Basra, and Mosul by using a Decision Support System (DSS). While reported for different years, simulated levels of PM (annual average of 10 to 30 µg/m3) and SO2 (annual average of 70 to 90 µg/m3) were inconsistent with previous measurements ascertaining the need for field monitoring and validation with comprehensive data at the time of the study. Air quality standards
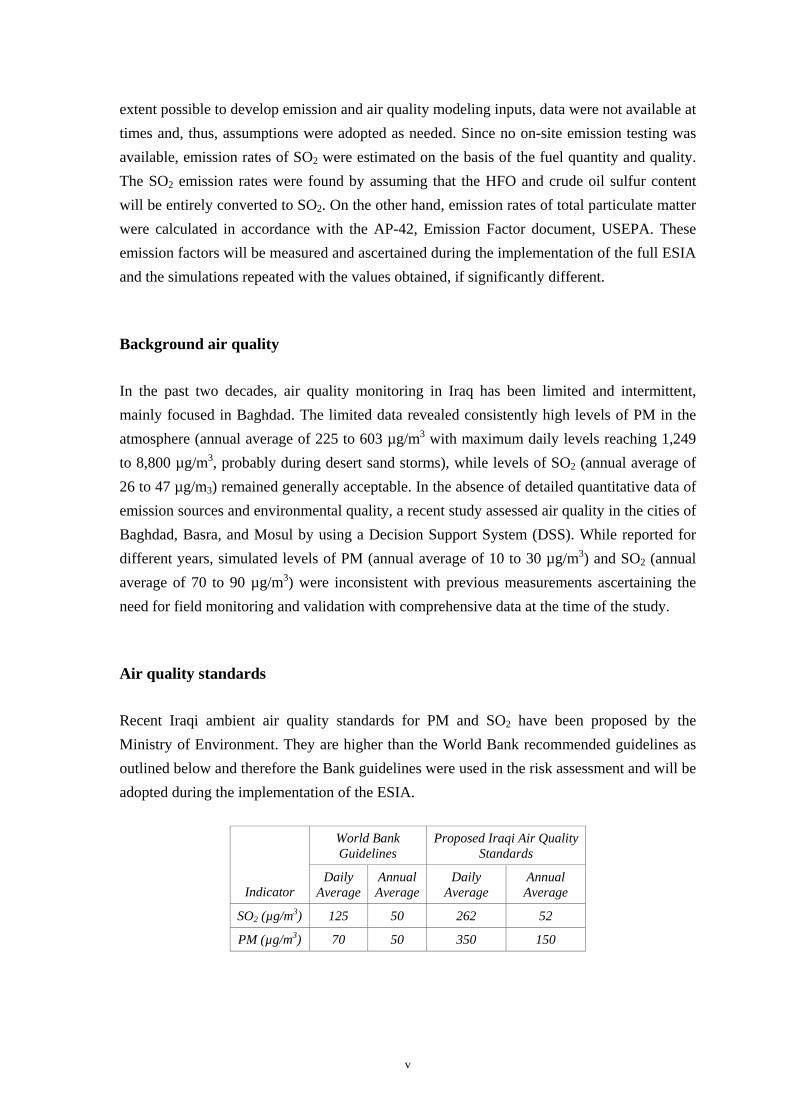
Recent Iraqi ambient air quality standards for PM and SO2 have been proposed by the Ministry of Environment. They are higher than the World Bank recommended guidelines as outlined below and therefore the Bank guidelines were used in the risk assessment and will be adopted during the implementation of the ESIA.
World Bank Guidelines
Proposed Iraqi Air Quality Standards
Indicator Daily
Average AnnualAverage
Daily Average
Annual Average
SO2 (µg/m3) 125 50 262 52
PM (µg/m3) 70 50 350 150
vi
Results
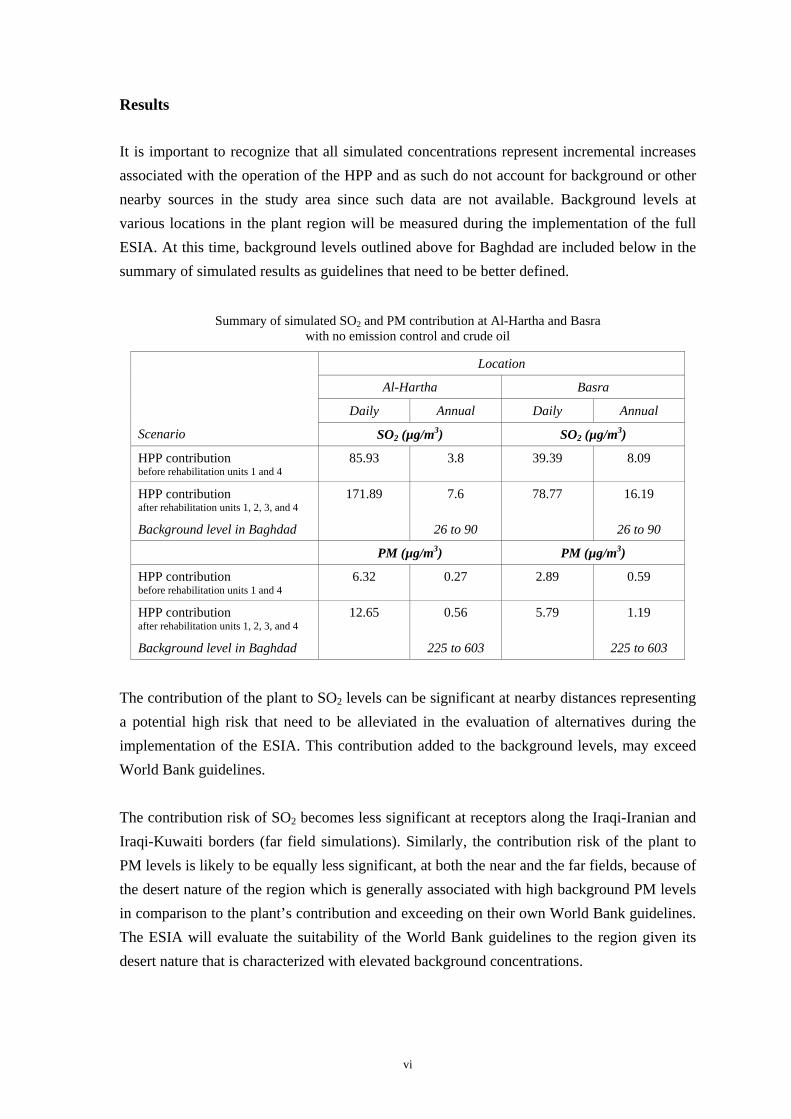
It is important to recognize that all simulated concentrations represent incremental increases associated with the operation of the HPP and as such do not account for background or other nearby sources in the study area since such data are not available. Background levels at various locations in the plant region will be measured during the implementation of the full ESIA. At this time, background levels outlined above for Baghdad are included below in the summary of simulated results as guidelines that need to be better defined.
Summary of simulated SO2 and PM contribution at Al-Hartha and Basra with no emission control and crude oil
Location
Al-Hartha Basra
Daily Annual Daily Annual
Scenario SO2 (µg/m3) SO2 (µg/m3)
HPP contribution before rehabilitation units 1 and 4
85.93 3.8 39.39 8.09
HPP contribution after rehabilitation units 1, 2, 3, and 4
171.89 7.6 78.77 16.19
Background level in Baghdad 26 to 90 26 to 90
PM (µg/m3) PM (µg/m3)
HPP contribution before rehabilitation units 1 and 4
6.32 0.27 2.89 0.59
HPP contribution after rehabilitation units 1, 2, 3, and 4
12.65 0.56 5.79 1.19
Background level in Baghdad 225 to 603 225 to 603
The contribution of the plant to SO2 levels can be significant at nearby distances representing a potential high risk that need to be alleviated in the evaluation of alternatives during the implementation of the ESIA. This contribution added to the background levels, may exceed World Bank guidelines. The contribution risk of SO2 becomes less significant at receptors along the Iraqi-Iranian and Iraqi-Kuwaiti borders (far field simulations). Similarly, the contribution risk of the plant to PM levels is likely to be equally less significant, at both the near and the far fields, because of the desert nature of the region which is generally associated with high background PM levels in comparison to the plant’s contribution and exceeding on their own World Bank guidelines. The ESIA will evaluate the suitability of the World Bank guidelines to the region given its desert nature that is characterized with elevated background concentrations.

vii
Future activities
The rapid risk assessment forms a basis for further simulation and sensitivity analysis for PM and SO2 as well as other indicators of concern, whereby, site-specific data, stack emission characterization, background air quality monitoring, and meteorological conditions are essential to obtain in order to better define potential exposure and ascertain simulated results. In this context, a comprehensive Environmental and Social Impact Assessment (ESIA) for the Hartha plant will be conducted prior to initiating of construction activities. The ESIA shall include an examination of the direct and indirect effects of the proposed Project as well as an analysis of alternatives to develop an Environmental and Social Management Plan (ESMP) that provides mitigation, monitoring, and institutional strengthening-capacity building-training actions to be integrated into the design and implementation of the Project. As part of this process, it is planned that a series of public consultations will be undertaken and that environmental and social studies be disclosed to the public. Note that while the full extent of the mitigation measures will not be known until after the ESIA is complete, an amount of US$6 million has been allocated to implement various elements of the ESMP during the rehabilitation of units 2 and 3 including the feasibility study related to units 1 and 4.

viii
CONTENTS
COVER PAGE.......................................................................................................................... i
ACKNOWLEDGEMENTS .................................................................................................... ii
EXECUTIVE SUMMARY ....................................................................................................iii
CONTENTS ..........................................................................................................................viii
FIGURES................................................................................................................................. ix
TABLES.................................................................................................................................... x
ABBREVIATIONS.................................................................................................................. x
NOMENCLATURE ............................................................................................................... xi
1 INTRODUCTION........................................................................................................... 1
2 PROJECT DESCRIPTION ........................................................................................... 3
3 ATMOSPHERIC DISPERSION MODELING............................................................ 5
3.1 Dispersion modeling .................................................................................................. 7
3.1.1 Source characteristics .................................................................................... 8 3.1.2 Meteorology and topography......................................................................... 9 3.1.3 Receptors and averaging periods ................................................................. 12 3.1.4 Definition of simulation scenarios............................................................... 13
3.2 Background air quality............................................................................................. 13
3.3 Simulation results..................................................................................................... 14
3.3.1 SO2 Before rehabilitation............................................................................. 15 3.3.2 SO2 After rehabilitation ............................................................................... 17 3.3.3 SO2 border crossing ..................................................................................... 26 3.3.4 Particulate matter ......................................................................................... 32
4 CONCLUDING REMARKS........................................................................................ 33
REFERENCES ...................................................................................................................... 34

ix
FIGURES
Figure Page
1. General location map showing Al-Hartha power plant.......................................................................... 4 2. Satellite image showing layout of Al-Hartha power plant (from Google Earth) ................................... 4 3. Location of discrete receptors for impact assessment ............................................................................ 6 4. Model input parameters ......................................................................................................................... 7 5. Prevalent wind speed and direction...................................................................................................... 10 6. Flat terrain characterizing the topography of the study area ................................................................ 11 7. Types of receptors adopted in modeling far field dispersion ............................................................... 12 8. Adopted contour legend for SO2 ambient concentration...................................................................... 15 9. Simulated SO2 contribution at selected discrete receptors before rehabilitation
(Scenarios S1 and S2) with units 1 and 4 operating and no emission control...................................... 16 10. Simulated SO2 contribution at selected discrete receptors after rehabilitation
(Scenario S3) with four operating units using crude oil....................................................................... 18 11. Hourly SO2 contribution after rehabilitation under Scenario 3 with four units operating
using crude oil...................................................................................................................................... 19 12. Daily SO2 contribution after rehabilitation under Scenario 3 with four units operating
using crude oil...................................................................................................................................... 20 13. Annual SO2 contribution after rehabilitation under Scenario 3 with four units operating
using crude oil...................................................................................................................................... 21 14. Simulated SO2 contribution at selected discrete receptors after rehabilitation
(Scenario S4) with four units operating using HFO............................................................................. 23 15. Hourly SO2 contribution after rehabilitation under Scenario 4 with four units operating
using HFO............................................................................................................................................ 24 16. Daily SO2 contribution after rehabilitation under Scenario 4 with four units operating
using HFO............................................................................................................................................ 25 17. Annual SO2 contribution after rehabilitation under Scenario 4 with four units operating
using HFO............................................................................................................................................ 26 18. Simulated SO2 contribution at discrete receptors along the Iraqi-Iranian borders before
rehabilitation (Scenarios S1 and S2) with units 1 and 4 operating and no emission control................ 28 19. Simulated SO2 contribution at discrete receptors along the Iraqi-Iranian borders after
rehabilitation (Scenarios S3 and S4) with four operating units and no emission control..................... 29 20. Simulated SO2 contribution at discrete receptors along the Iraqi-Kuwaiti borders before
rehabilitation (Scenarios S1 and S2) with units 1 and 4 operating and no emission control................ 30 21. Simulated SO2 contribution at discrete receptors along the Iraqi-Kuwaiti borders after
rehabilitation (Scenarios S3 and S4) with four operating units and no emission control..................... 31

x
TABLES
Table Page
1. Formation mechanisms of main gaseous emissions with corresponding environmental and health impacts.................................................................................................................................. 1
2. Operational and stack characteristics at Al-Hartha power plant ............................................................ 5 3. Distance of discrete receptors to Al-Hartha power plant ....................................................................... 6 4. Emission rates adopted for modeling purposes1..................................................................................... 9 5. Simulated emission dispersion scenarios ............................................................................................. 13 6. World Bank recommended guidelines and Iraqi ambient air quality standards................................... 14 7. Simulated SO2 contribution under scenarios S1 and S2 at selected discrete receptors ........................ 15 8. Simulated SO2 contribution under scenario S3 at selected discrete receptors...................................... 17 9. Simulated SO2 contribution under scenario S4 at selected discrete receptors...................................... 22 10. Simulated PM contribution under scenarios S5 to S8 at selected discrete receptors ........................... 32
ABBREVIATIONS
BAT = Best Available Technology CO2 = Carbon Dioxide EEA = European Environmental Agency ESIA = Environmental and Social Impact Assessment ESP = Electrostatic Precipitator GDP = Gross Domestic Product GPS = Global Positioning System HC = Hydrocarbons HFO = Heavy Fuel Oil HPP = Al-Hartha power plant ISCST = Industrial Source Complex Short Term MoE = Iraqi ministry of electricity NOx = Nitrogen Oxides OFFP = Oil for food program PAC = Polycyclic aromatic compounds PM = Particulate matter PM10 = Particulate matter with diameter less than 10 microns SO2 = Sulfur dioxide TSP = Total Suspended Particulates UN = United Nations USEPA = United States Environmental Protection Agency VOC = Volatile organic compounds WHO = World Health Organization

xi
NOMENCLATURE
% = Percent µg = Microgram cm = Centimeter hr = hour g = grams Kg = Kilogram Km = Kilometer m = Meter m3 = Meter cube MW = Mega Watt oK = Degree Kelvin sec = Second

1
1 INTRODUCTION
Worldwide electric power is considered as an important factor for the development of national economies. Its availability and reliability have significant positive impacts on the national economic output (GDP), energy security, and quality of life. However, electric power generation using fossil fuels is inherently associated with the release of air pollutants that have potential adverse effects on the environment and public health. The combustion of fossil fuels at power plants to generate electricity produces significant amounts of air pollutants in the form of sulfur oxides (SOx), particulate matter (PM), nitrogen oxides (NOx), volatile organic compounds (VOCs), metals, etc. all emitted in the smoke stack of a power plant. Studies worldwide linked these emissions to a wide range of adverse environmental and health effects. Table 1 presents a summary of various emission constituents along with formation mechanisms, and potential environmental and health impacts.
Table 1. Formation mechanisms of main gaseous emissions with corresponding environmental and health impacts
Constituent Formation Mechanism Environmental Effect Health Effect Nitrogen oxides (NOx)
Oxidation of the molecular nitrogen present in the combustion air, (thermal NOx formation).
Oxidation of the nitrogen compounds present in the fuel, (fuel NOx formation).
Play an important role in atmospheric reactions that create ground-level ozone and acid rain.
Contributes to atmospheric particles that cause visibility impairment most noticeable in national parks.
NOx reacts with ammonia, moisture, and other compounds to form nitric acid and related particles that have effects on breathing and the respiratory system, damage to lung tissue, and premature death.
Particulate matter (PM)
Formed when gases from burning fuels react with sunlight and water vapor
Makes lakes and streams acidic. Affects the diversity of ecosystems. Formation of smog, and smoke.
Aggravated asthma, coughing and difficult or painful breathing.
Chronic bronchitis, decreased lung function, and premature death.
Sulfur dioxide (SO2)
Oxidation of organically-bound sulfur in the fuel
Sulfur and nitrogen oxides react with other substances in the air to form acid rain.
Damages forests and crops, soil, and pollutes water supplies.
Temporary breathing difficulty for people with asthma.
Respiratory illness and aggravate existing heart disease
Carbon Dioxide (CO2)
Combustion of fossil fuel to generate process energy
Traps heat in the atmosphere, resulting in a greenhouse effect and global warming.
Difficulty in breathing, and respiratory illness
Heavy Metals Release of heavy metals naturally present in the fuel
Airborne metals can fall to the ground in raindrops, after which it can end up in streams or lakes, where it can accumulate in fish at levels that may harm the fish and its consumers
Can harm the brain, heart, kidneys, lungs, and immune system of people of all ages
Can increase morbidity (neuro-mtoxicity).
HC, VOC and PAC (polycyclic aromatic compounds)
Volatilization of organic matter present in the fuel
In the presence of NOx and sunlight VOCs have been found to be a major contributing factor to ozone.
Carcinogens
Years of war and sanctions have severely damaged the infrastructure including generation, transmission, and distribution, of the power system in Iraq. For instance, in 1990 prior to the Gulf War, the total power generating capacity available reached around 9,295 Megawatts
2
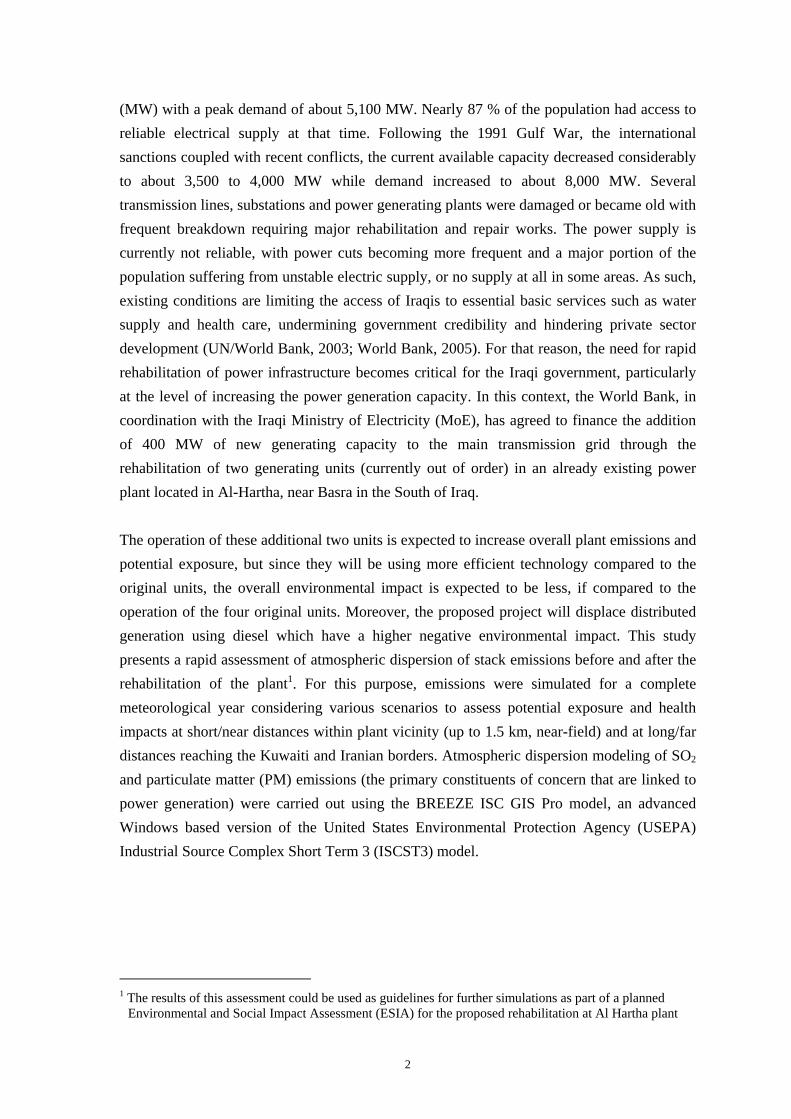
(MW) with a peak demand of about 5,100 MW. Nearly 87 % of the population had access to reliable electrical supply at that time. Following the 1991 Gulf War, the international sanctions coupled with recent conflicts, the current available capacity decreased considerably to about 3,500 to 4,000 MW while demand increased to about 8,000 MW. Several transmission lines, substations and power generating plants were damaged or became old with frequent breakdown requiring major rehabilitation and repair works. The power supply is currently not reliable, with power cuts becoming more frequent and a major portion of the population suffering from unstable electric supply, or no supply at all in some areas. As such, existing conditions are limiting the access of Iraqis to essential basic services such as water supply and health care, undermining government credibility and hindering private sector development (UN/World Bank, 2003; World Bank, 2005). For that reason, the need for rapid rehabilitation of power infrastructure becomes critical for the Iraqi government, particularly at the level of increasing the power generation capacity. In this context, the World Bank, in coordination with the Iraqi Ministry of Electricity (MoE), has agreed to finance the addition of 400 MW of new generating capacity to the main transmission grid through the rehabilitation of two generating units (currently out of order) in an already existing power plant located in Al-Hartha, near Basra in the South of Iraq. The operation of these additional two units is expected to increase overall plant emissions and potential exposure, but since they will be using more efficient technology compared to the original units, the overall environmental impact is expected to be less, if compared to the operation of the four original units. Moreover, the proposed project will displace distributed generation using diesel which have a higher negative environmental impact. This study presents a rapid assessment of atmospheric dispersion of stack emissions before and after the rehabilitation of the plant1. For this purpose, emissions were simulated for a complete meteorological year considering various scenarios to assess potential exposure and health impacts at short/near distances within plant vicinity (up to 1.5 km, near-field) and at long/far distances reaching the Kuwaiti and Iranian borders. Atmospheric dispersion modeling of SO2 and particulate matter (PM) emissions (the primary constituents of concern that are linked to power generation) were carried out using the BREEZE ISC GIS Pro model, an advanced Windows based version of the United States Environmental Protection Agency (USEPA) Industrial Source Complex Short Term 3 (ISCST3) model.
1 The results of this assessment could be used as guidelines for further simulations as part of a planned
Environmental and Social Impact Assessment (ESIA) for the proposed rehabilitation at Al Hartha plant

3
2 PROJECT DESCRIPTION
Al-Hartha power plant (HPP) is located in Al Hartha area, Basra governate, South of Iraq. The plant is about 20 km north of Basra city and 25 km west of the Iranian border (Figure 1). Shatt Al Arab River passes in the immediate vicinity of the plant. Cooling water for the generation units is diverted through a water intake along the river. Figure 2 is a satellite image showing the plant layout, including the location of its four stacks, the nearby Shatt Al Arab River, and the water intake. The plant was first commissioned in 1979 and consists of 4 generation units (200 MW each) with a total capacity of 800 MW. Each unit has a separate emission stack that is connected to an independent boiler. Units 1 and 4 are currently operational and produce about 195 and 150 MW, respectively. In contrast, units 2 and 3 are not in use since the first Gulf War in 1991. Rehabilitation of these units was initiated through the United Nations (UN) Oil for Food Program (OFFP) by procuring replacement equipment which was never installed. The Iraqi Ministry of Electricity (MoE) is currently negotiating with the World Bank to finance the rehabilitation of units 2 and 3 with the goal of adding 400MW to the national grid. The rehabilitation of the Hartha Power station, the major component of the Emergency Electricity Reconstruction Project of which the total cost is estimated at US$150 million. It is proposed to be financed from: (i) an IDA Credit of US$124 million; (ii) a US$6 million grant from the World Bank Iraq Trust Fund (ITF) and; (iii) US$20 million from the MoE’s capital budget resources. The plant was initially designed to operate on natural gas as the primary fuel. However, in the absence of natural gas, the units can be operated using either heavy fuel oil (HFO) or crude oil. Currently, due to the difficulties in providing adequate quantities of natural gas for the operation of the plant, the two working units (1 and 4) are operated on crude oil with a sulfur content of 3.7% (UN/World Bank, 2003; World Bank, 2005). As such, the plant may be associated with relatively high emissions which would increase with the introduction of two additional units. Table 2 presents the operational characteristics of the stacks at HPP.

4
Figure 1. General location map showing Al-Hartha power plant
Figure 2. Satellite image showing layout of Al-Hartha power plant (from Google Earth)
Syria
Saudi ArabiaJordan
Iran
Iraq
Kuwait
Iran
KuwaitIraq
Al-Hartha power plant
Al Hartha power plant
Shatt Al Arab River
Stacks
1
4
Water intake

5
Table 2. Operational and stack characteristics at Al-Hartha power plant
Characteristic Value Number of stacks 4 Height of stack, m 100 Upper chimney diameter, m 4.3 (Internal)
4.7 (external) Lower chimney diameter, m 5.3 (Internal)
6.5 (external) Upper stack interior exit area, m2 14.52 Gas exit mass flow rate, kg/hr 814,000 Gas exit volumetric flow rate, m3/hr 814,000 Gas exit velocity, m/s 15.58 Gas exit temperature, oK 428-433
Fuel types Heavy fuel oil (HFO)
Specific gravity 0.9169 Consumption, m3/hr/boiler 50 (full load) Sulfur content, % 2.5
Crude oil Specific gravity 0.915 Consumption, m3/hr/boiler 41.1 (full load) Sulfur content, % 3.7
Natural gas Specific gravity 0.672 Consumption, m3/hr/boiler 45 (full load) Sulfur content, % 0
3 ATMOSPHERIC DISPERSION MODELING
Atmospheric dispersion modeling was used to conduct a rapid assessment of potential air quality impacts associated with the two currently operational production units at HPP (units 1 and 4, 400 MW) as well as the potential impacts that may arise upon the commissioning of the two other units (units 2 and 3, reaching a combined capacity of 800 MW for all units operating together). The assessment of impacts is directly related to the definition of sensitive receptors, namely residential units at towns and villages in the study area. In this context, several discrete receptors were identified as depicted in Figure 3. Their corresponding coordinates, radial distance from HPP, and location are presented in Table 3.

6
Figure 3. Location of discrete receptors for impact assessment
Table 3. Distance of discrete receptors to Al-Hartha power plant
Receptor GPS coordinates3, meter Country Location
Code1 Distance2 (km) X (East) Y (North)
Al Hartha D1 6 761605 3402701 Basra D2 20 770104 3378268
Iraq
Az Zubayr D3 32.2 759513 3365317 Khormshahr D4 48.2 805056 3372014 Abadan D5 63.7 816299 3360857
Iran
Ahwaz D6 110.2 845913 3470855 1 Assigned code within the model 2 Radial distance from Al-Hartha Power Plant 3 UTM- Zone 38 N
Ahwaz
Az ZubayrAbadan
Khormshahr
Al-Hartha power plant
Al-Hartha
Basra
IRAQ
IRAN
Kuwait

7
3.1 Dispersion modeling
The BREEZE ISC GIS Pro model was used to assess the impact of gaseous emissions on ambient air quality in the region. The model, which is commonly used for regulatory and impact assessment purposes, incorporates features that enable the user to estimate concentrations from a wide range of sources emitting non-reactive compounds. It can simulate an unlimited number of sources, source groups, receptors, receptor grids, eight short-term averages, and store up to two-hundred emission rates. The model requires three categories of input parameters namely (1) the sources with corresponding properties, (2) continuous hourly meteorological data and a depiction of the terrain, as well as (3) a description of receptor groups along with their geographic location (Figure 4). Dispersion simulations from HPP were conducted for the primary constituents of concern that are linked to power generation and depending on the specific type of fuel used in the plant, namely SO2 and particulate matter emissions (PM). Other indicators such as NOx, VOCs, PM10, PM2.5, or others will be simulated as needed in the full ESIA.
Source characteristics Point source Area source Volume source Energy source Operation patterns Emission rates Flue gas exit temperature Flue gas exit velocity Emission control measures
Meteorology and topography Wind speed Wind direction Stability class Ambient temperature Mixing height Terrain elevation Terrain classification
Receptors and averaging periods
Geographic location of receptors
Identification of affected receptors
Defining averaging period
Concentration profiles Time dependent exposure level for each receptor Highest time dependent exposure level recorded Generation of isopleths
Figure 4. Model input parameters
Note that emission dispersion simulations are limited by the accuracy of the input data and the inherent limitations of the specific models used. While site-specific data were used to the extent possible to develop emission and air quality modeling inputs, data were not available at times and, thus, assumptions were adopted as needed. Since no on-site emission testing was available, emission rates of SO2 were estimated on the basis of the fuel quantity and quality. The SO2 emission rates were found by assuming that the HFO and crude oil sulfur content will be entirely converted to SO2. On the other hand, emission rates of total particulate matter were calculated in accordance with the AP-42, Emission Factor document, USEPA. These emission factors will be measured and ascertained during the implementation of the full ESIA and the simulations repeated with the values obtained, if significantly different.
8
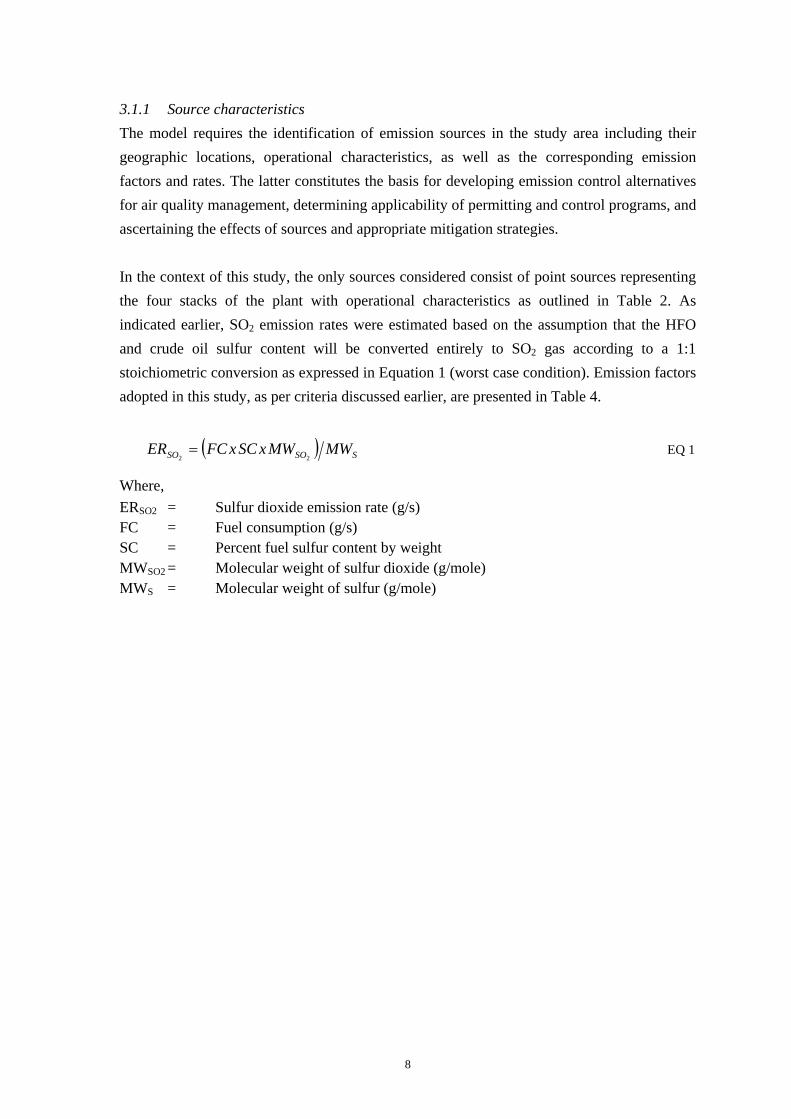
3.1.1 Source characteristics The model requires the identification of emission sources in the study area including their geographic locations, operational characteristics, as well as the corresponding emission factors and rates. The latter constitutes the basis for developing emission control alternatives for air quality management, determining applicability of permitting and control programs, and ascertaining the effects of sources and appropriate mitigation strategies. In the context of this study, the only sources considered consist of point sources representing the four stacks of the plant with operational characteristics as outlined in Table 2. As indicated earlier, SO2 emission rates were estimated based on the assumption that the HFO and crude oil sulfur content will be converted entirely to SO2 gas according to a 1:1 stoichiometric conversion as expressed in Equation 1 (worst case condition). Emission factors adopted in this study, as per criteria discussed earlier, are presented in Table 4.
( ) SSOSO MWMWxSCxFCER22
= EQ 1
Where, ERSO2 = Sulfur dioxide emission rate (g/s) FC = Fuel consumption (g/s) SC = Percent fuel sulfur content by weight MWSO2 = Molecular weight of sulfur dioxide (g/mole) MWS = Molecular weight of sulfur (g/mole)

9
Table 4. Emission rates adopted for modeling purposes1
Parameter Fuel type Description ER/stack (g/sec) ER with no emission control (g/sec) 778.6
ER with 50 % efficiency emission control equipment 389.3
ER with 80 % efficiency emission control equipment 155.72
Crude oil
ER with 92 % efficiency emission control equipment 62.3
ER with no emission control (g/sec) 636.5
ER with 50 % efficiency emission control equipment 318.25
ER with 80 % efficiency emission control equipment 127.3
SO2
HFO
ER with 92 % efficiency emission control equipment 50.92
Crude oil ER with no emission control (g/sec) 57.3 PM
HFO ER with no emission control (g/sec) 43.6 1 Emission control efficiencies were selected on the basis of best available technology for emission
control equipment. Current scrubbing systems for sulfur dioxide can achieve 90 to 95% SO2 removal efficiency and 50 to 60% removal efficiency for PM emissions. ESP’s for PM removal can easily accomplish more than 90% removal efficiency, whereas, fabric filters can remove up to 99 % of the PM emissions. The 50, 80, and 92 % categories were selected to provide more flexibility for the further selection of air pollution control equipments
3.1.2 Meteorology and topography Meteorological data and terrain description are important input parameters that affect the emission dispersion from stacks, since significant variations in concentrations at potential receptors can occur with changes in meteorology and topography. As such, meteorological data were obtained for Basra city, which is the closest available data to the plant, for the year 2004. The data which were converted into a format ready for use in the model consist of hourly year round wind direction and speed, ambient temperatures, stability class, and rural and urban mixing heights. The area is characterized by moderate climate conditions due to its location by the river side. Maximum yearly temperatures can reach 47 ºC with an average of 25 ºC. Wind roses corresponding to the wind profile in terms of intensity, speed, direction, and frequency of occurrence were constructed and are depicted in Figure 5. As indicated, the most frequent and significant wind blows in the northwestern direction with wind speeds reaching more than 10.8 m/sec.

10
(a): Winter season (b): Spring season
(c): Summer season (d): Fall season
(e): Yearly
Figure 5. Prevalent wind speed and direction

11
Land use classification in the study area is needed because dispersion rates differ between urban and rural settings. In general, urban areas cause greater rates of dispersion because of increased turbulent mixing and buoyancy-induced mixing. This mixing is due to the combination of greater surface roughness caused by more buildings and structures and greater amounts of heat released from concrete and similar surfaces. The procedure to determine whether to use urban or rural dispersion coefficients described in the USEPA's Guideline on Air Quality Models (1986) relies on the land use and population density as classification criteria. According to these guidelines, the urban mode is selected if the land within a 3 kilometer radius of the facility has heavy or medium industrial facilities, commercial or multi-family residential compounds on more than 50 percent of the total area. Urban mode is also selected when the population density within a 3-kilometer radius of the facility is greater than 750 people per square kilometer. Otherwise the rural mode is selected. Evidently, the latter was selected in the case of the Al-Hartha power plant since the surrounding area is sparsely populated and is either agricultural or undeveloped. Moreover, the study area is characterized by its flat terrain as illustrated in Figure 6.
Figure 6. Flat terrain characterizing the topography of the study area
Power plant
Iraqi-Iranian borders
Power plant
Ahwaz

12
3.1.3 Receptors and averaging periods Receptors are defined by a series of specific points with their corresponding geographic coordinates in order to calculate the exposure levels at these locations. In this assessment, three types of receptors were selected, including six discrete receptors at selected towns and villages in Iraq and Iran (Table 3), Cartesian grid receptors, and discrete receptors along the Iraqi-Iranian and the Iraqi-Kuwaiti borders. The Cartesian grid receptors, consists of a 100x100 cells (generating a total of 10,000 receptors), with a cell-size of 1,000×1,000 m (equivalent to a total area of 1 km2). The purpose of this grid was to define the pollutant dispersion pattern over the study region. On the other hand, two sets of discrete border receptors were located along the Iraqi-Iranian border (16 receptors), and the Iraqi-Kuwaiti border (11 receptors). These two sets of receptors were used to define the level of potential cross border potential dispersion. Figure 7 presents the layout and distribution of the various receptors. The adopted averaging periods for exposure levels include hourly, daily, and annual averages. For each averaging period, the model simulates highest average concentrations that are calculated during the entire period at each receptor.
Figure 7. Types of receptors adopted in modeling far field dispersion
D6 D1— D6: Towns and villages D7— D22: Iraqi-Iranian borders D23— D33: Iraqi-Kuwaiti borders GRD1: Cartesian grid SRC: Stacks

13
3.1.4 Definition of simulation scenarios Several representative scenarios were defined for simulating SO2 and PM concentrations. The scenarios were developed to account for emissions under existing conditions (before rehabilitation) whereby two generation units (2 and 3) are out of service and after the rehabilitation is completed, whereby the four units are operating. In addition, the type of fuel was varied with the absence and the presence (with varying efficiencies) of emission control equipment/measures (sub scenarios) (Table 5).
Table 5. Simulated emission dispersion scenarios
Pollutant Scenario Type of fuel Sub scenario Averaging
period S1
Crude oil S1.1 = No emission control Before rehabilitation (units 1 and 4) S2
HFO S2.1 = No emission control
S3.1 = No emission control
S3.2 = 50 % efficiency emission control equipment
S3.3 = 80 % efficiency emission control equipment S3
Crude oil
S3.4 = 92 % efficiency emission control equipment
S4.1 = No emission control
S4.2 = 50 % efficiency emission control equipment
S4.3 = 80 % efficiency emission control equipment
SO2 After
rehabilitation (units 1 to 4)
S4 HFO
S4.4 = 92 % efficiency emission control equipment
S5 Crude oil S5.1 = No emission control Before
rehabilitation (units 1 and 4) S6
HFO S6.1 = No emission control
S7 Crude oil S7.1 = No emission control
PM
After rehabilitation (units 1 to 4) S8
HFO S8.1 = No emission control
Hourly Daily Yearly
3.2 Background air quality
In the past two decades, air quality monitoring in Iraq has been limited and intermittent, mainly focused in Baghdad. The limited data revealed consistently high levels of PM in the atmosphere (annual average of 225 to 603 µg/m3 with maximum daily levels reaching 1,249 to 8,800 µg/m3, probably during desert sand storms), while levels of SO2 (annual average of 26 to 47 µg/m3) remained generally acceptable. In the absence of detailed quantitative data of emission sources and environmental quality, a recent study assessed air quality in the cities of Baghdad, Basra, and Mosul by using a Decision Support System (DSS). While reported for different years, simulated levels of PM (annual average of 10 to 30 µg/m3) and SO2 (annual average of 70 to 90 µg/m3) were inconsistent with previous measurements ascertaining the need for field monitoring and validation with comprehensive data at the time of the study.
14
3.3 Simulation results
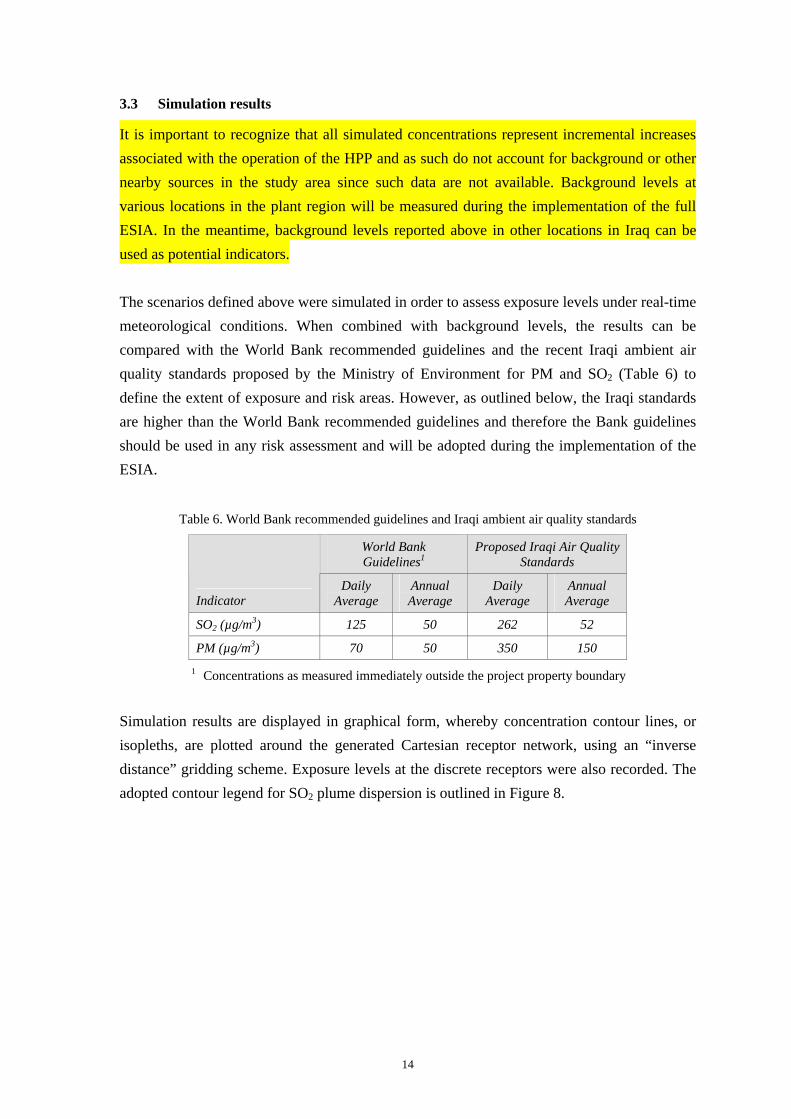
It is important to recognize that all simulated concentrations represent incremental increases associated with the operation of the HPP and as such do not account for background or other nearby sources in the study area since such data are not available. Background levels at various locations in the plant region will be measured during the implementation of the full ESIA. In the meantime, background levels reported above in other locations in Iraq can be used as potential indicators. The scenarios defined above were simulated in order to assess exposure levels under real-time meteorological conditions. When combined with background levels, the results can be compared with the World Bank recommended guidelines and the recent Iraqi ambient air quality standards proposed by the Ministry of Environment for PM and SO2 (Table 6) to define the extent of exposure and risk areas. However, as outlined below, the Iraqi standards are higher than the World Bank recommended guidelines and therefore the Bank guidelines should be used in any risk assessment and will be adopted during the implementation of the ESIA.
Table 6. World Bank recommended guidelines and Iraqi ambient air quality standards
World Bank Guidelines1
Proposed Iraqi Air Quality Standards
Indicator Daily
Average Annual Average
Daily Average
Annual Average
SO2 (µg/m3) 125 50 262 52
PM (µg/m3) 70 50 350 150 1 Concentrations as measured immediately outside the project property boundary
Simulation results are displayed in graphical form, whereby concentration contour lines, or isopleths, are plotted around the generated Cartesian receptor network, using an “inverse distance” gridding scheme. Exposure levels at the discrete receptors were also recorded. The adopted contour legend for SO2 plume dispersion is outlined in Figure 8.

15
(a): hourly
(b): daily (c): annual
Figure 8. Adopted contour legend for SO2 ambient concentration
3.3.1 Before rehabilitation Simulation results for SO2 levels under sub-scenarios S1.1 and S2.1 (before rehabilitation, units 1 and 4 operating on crude oil or HFO) are summarized in Table 7 and Figure 9.
Table 7. Simulated SO2 contribution under scenarios S1 and S2 at selected discrete receptors (without background levels)
Receptors Scenario
Al-Hartha Basra Az Zubayr Khormshahr Abadan Ahwaz S1.1 (before rehabilitation, units 1 and 4 operating on crude oil with no emission control )
Hourly 463.68 196.45 144.29 128.05 117.27 91.96 Daily 85.93 39.39 23.87 14.87 10.82 5.93 Annual 3.8 8.09 2.08 1.74 1.45 0.08
S2.1 (before rehabilitation, units 1 and 4 operating on HFO with no emission control) Hourly 380.22 161.09 118.32 105.0 96.16 75.41 Daily 70.25 32.2 19.52 12.16 8.84 4.85 Annual 3.11 6.62 1.7 1.42 1.18 0.07

16
0
200
400
600
Al-Hartha Basra Az Zubayr Khormshahr Abadan Ahwaz
SO2 (
ug/m
3 )
(a): Hourly
0
100
200
300
400
Al-Hartha Basra Az Zubayr Khormshahr Abadan Ahwaz
SO2 (
ug/m
3 )
(b): Daily
0
25
50
75
100
Al-Hartha Basra Az Zubayr Khormshahr Abadan Ahwaz
SO2 (
ug/m
3 )
(c): Annual
S1.1: crude oil S2.1: HFO
Annual WB SO2 standard (50 µg/m3) Daily WB SO2 standard (125 µg/m3)
Figure 9. Simulated SO2 contribution at selected discrete receptors before rehabilitation (Scenarios S1 and S2) with units 1 and 4 operating and no emission control
(without background levels)

17
3.3.2 After rehabilitation Scenarios S3 and S4 simulates the emission dispersion with four operating units (after rehabilitation and commissioning of units 2 and 3). Accordingly, Scenario 3 (and its sub-scenarios) considers the 4 units operating under full load using crude oil, while in scenario 4 (and its sub-scenarios) HFO is the type of fuel used. The simulated hourly, daily, and annual concentrations of SO2 for sub-scenarios S3.1, S3.2, S3.3, and S3.4, are presented in Table 8 and Figures 10 to 13.
Table 8. Simulated SO2 contribution under scenario S3 at selected discrete receptors (without background levels)
Receptors Scenario
Al-Hartha Basra Az Zubayr Khormshahr Abadan Ahwaz S3.1 (After rehabilitation, all units operating on crude oil with no emission control)
Hourly 927.21 393.01 288.61 255.89 234.59 183.93 Daily 171.89 78.77 47.75 29.73 21.65 11.86 Annual 7.60 16.19 4.16 3.48 2.89 0.17
S3.2 (After rehabilitation, all units operating on crude oil with 50% efficient emission control equipment) Hourly 463.61 196.51 144.30 127.95 117.30 91.97 Daily 85.95 39.39 23.88 14.87 10.82 5.93 Annual 3.80 8.09 2.08 1.74 1.45 0.08
S3.3 (After rehabilitation, all units operating on crude oil with 80% efficient emission control equipment) Hourly 185.44 78.60 57.72 51.18 46.92 36.79 Daily 34.38 15.75 9.55 5.95 4.33 2.37 Annual 1.52 3.24 0.83 0.70 0.58 0.03
S3.4 (After rehabilitation, all units operating on crude oil with 92% efficient emission control equipment) Hourly 74.18 31.44 23.09 20.47 18.77 14.71 Daily 13.75 6.30 3.82 2.38 1.73 0.95 Annual 0.61 1.29 0.33 0.28 0.23 0.01

18
0
200
400
600
800
1000
Al-Hartha Basra Az Zubayr Khormshahr Abadan Ahwaz
SO2 (
ug/m
3 )
(a): Hourly
0
100
200
300
400
Al-Hartha Basra Az Zubayr Khormshahr Abadan Ahwaz
SO2 (
ug/m
3 )
(b): Daily
0
25
50
75
100
Al-Hartha Basra Az Zubayr Khormshahr Abadan Ahwaz
SO2 (
ug/m
3 )
(c): Annual
S3.1 S3.2 S3.3 S3.4
Annual WB SO2 standard (50 µg/m3) Daily WB SO2 standard (125 µg/m3)
Figure 10. Simulated SO2 contribution at selected discrete receptors after rehabilitation (Scenario S3) with four operating units using crude oil
(without background levels)

19
(a): Sub-scenario S3.1: No emission control (b): Sub-scenario S3.2: 50% emission control
(c): Sub-scenario S3.3: 80% emission control (d): Sub-scenario S3.4: 92% emission control
Figure 11. Hourly SO2 contribution after rehabilitation under Scenario 3 with four units operating using crude oil
(without background levels)
Max.: 2,300 µg/m3 Max.: 1,149 µg/m3
Max.: 460 µg/m3 Max.: 184 µg/m3

20
(a): Sub-scenario S3.1: No emission control (b): Sub-scenario S3.2: 50% emission control
(c): Sub-scenario S3.3: 80% emission control (d): Sub-scenario S3.4: 92% emission control
Figure 12. Daily SO2 contribution after rehabilitation under Scenario 3 with four units operating using crude oil
(without background levels)
Max.: 269 µg/m3 Max.: 134.5 µg/m3
Max.: 53.8 µg/m3 Max.: 25.5 µg/m3

21
(a): Sub-scenario S3.1: No emission control (b): Sub-scenario S3.2: 50% emission control
(c): Sub-scenario S3.3: 80% emission control (d): Sub-scenario S3.4: 92% emission control
Figure 13. Annual SO2 contribution after rehabilitation under Scenario 3 with four units operating using crude oil
(without background levels)
Max.: 41.1 µg/m3 Max.: 20.7 µg/m3
Max.: 8.27 µg/m3 Max.: 3.31 µg/m3
22
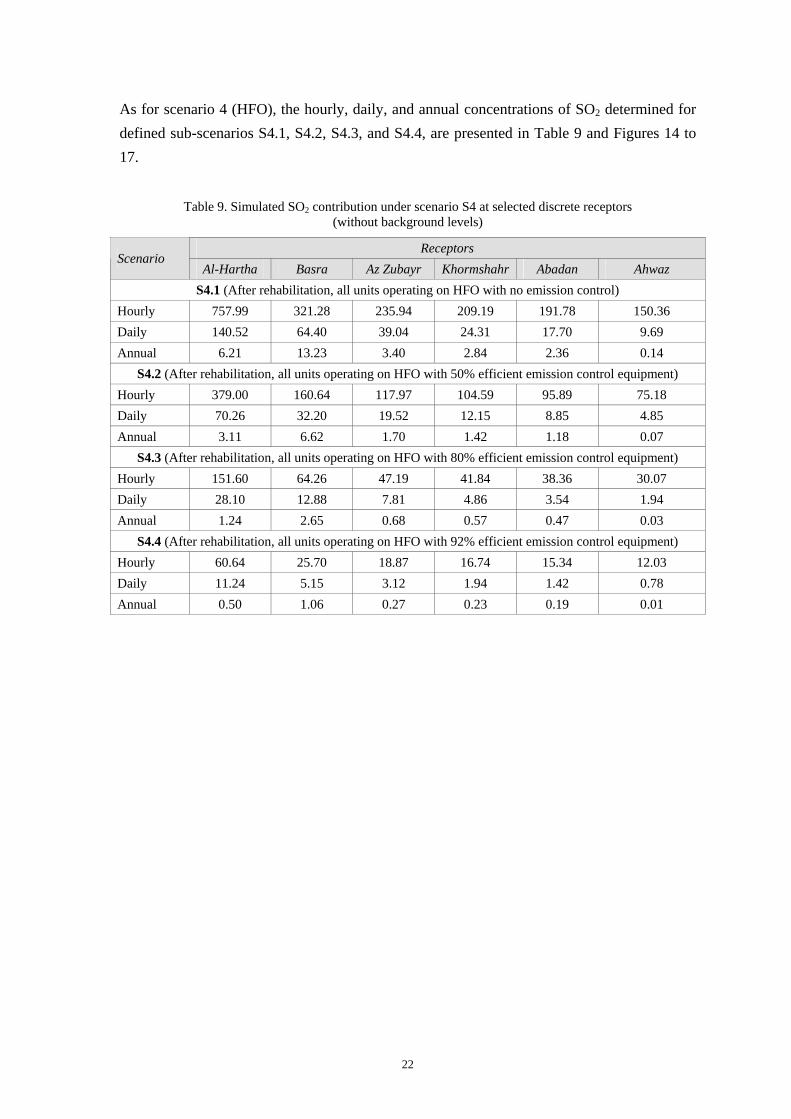
As for scenario 4 (HFO), the hourly, daily, and annual concentrations of SO2 determined for defined sub-scenarios S4.1, S4.2, S4.3, and S4.4, are presented in Table 9 and Figures 14 to 17.
Table 9. Simulated SO2 contribution under scenario S4 at selected discrete receptors (without background levels)
Receptors Scenario
Al-Hartha Basra Az Zubayr Khormshahr Abadan Ahwaz S4.1 (After rehabilitation, all units operating on HFO with no emission control)
Hourly 757.99 321.28 235.94 209.19 191.78 150.36 Daily 140.52 64.40 39.04 24.31 17.70 9.69 Annual 6.21 13.23 3.40 2.84 2.36 0.14
S4.2 (After rehabilitation, all units operating on HFO with 50% efficient emission control equipment) Hourly 379.00 160.64 117.97 104.59 95.89 75.18 Daily 70.26 32.20 19.52 12.15 8.85 4.85 Annual 3.11 6.62 1.70 1.42 1.18 0.07
S4.3 (After rehabilitation, all units operating on HFO with 80% efficient emission control equipment) Hourly 151.60 64.26 47.19 41.84 38.36 30.07 Daily 28.10 12.88 7.81 4.86 3.54 1.94 Annual 1.24 2.65 0.68 0.57 0.47 0.03
S4.4 (After rehabilitation, all units operating on HFO with 92% efficient emission control equipment) Hourly 60.64 25.70 18.87 16.74 15.34 12.03 Daily 11.24 5.15 3.12 1.94 1.42 0.78 Annual 0.50 1.06 0.27 0.23 0.19 0.01
23
0
200
400
600
800
1000
Al-Hartha Basra Az Zubayr Khormshahr Abadan Ahwaz
SO2 (
ug/m
3 )
(a): Hourly
0
100
200
300
400
Al-Hartha Basra Az Zubayr Khormshahr Abadan Ahwaz
SO2 (
ug/m
3 )
(b): Daily
0
25
50
75
100
Al-Hartha Basra Az Zubayr Khormshahr Abadan Ahwaz
SO2 (
ug/m
3 )
(c): Annual
S4.1 S4.2 S4.3 S4.4
Annual WB SO2 standard (50 µg/m3) Daily WB SO2 standard (125 µg/m3)
Figure 14. Simulated SO2 contribution at selected discrete receptors after rehabilitation (Scenario S4) with four units operating using HFO
(without background levels)

24
(a): Sub-scenario S4.1: No emission control (b): Sub-scenario S4.2: 50% emission control
(c): Sub-scenario S4.3: 80% emission control (d): Sub-scenario S4.4: 92% emission control
Figure 15. Hourly SO2 contribution after rehabilitation under Scenario 4 with four units operating using HFO
(without background levels)
Max.: 1,880 µg/m3 Max.: 939.4 µg/m3
Max.: 376 µg/m3 Max.: 150.4 µg/m3

25
(a): Sub-scenario S4.1: No emission control (b): Sub-scenario S4.2: 50% emission control
(c): Sub-scenario S4.3: 80% emission control (d): Sub-scenario S4.4: 92% emission control
Figure 16. Daily SO2 contribution after rehabilitation under Scenario 4 with four units operating using HFO
(without background levels)
Max.: 219.8 µg/m3 Max.: 110 µg/m3
Max.: 44 µg/m3 Max.: 17.6 µg/m3
26
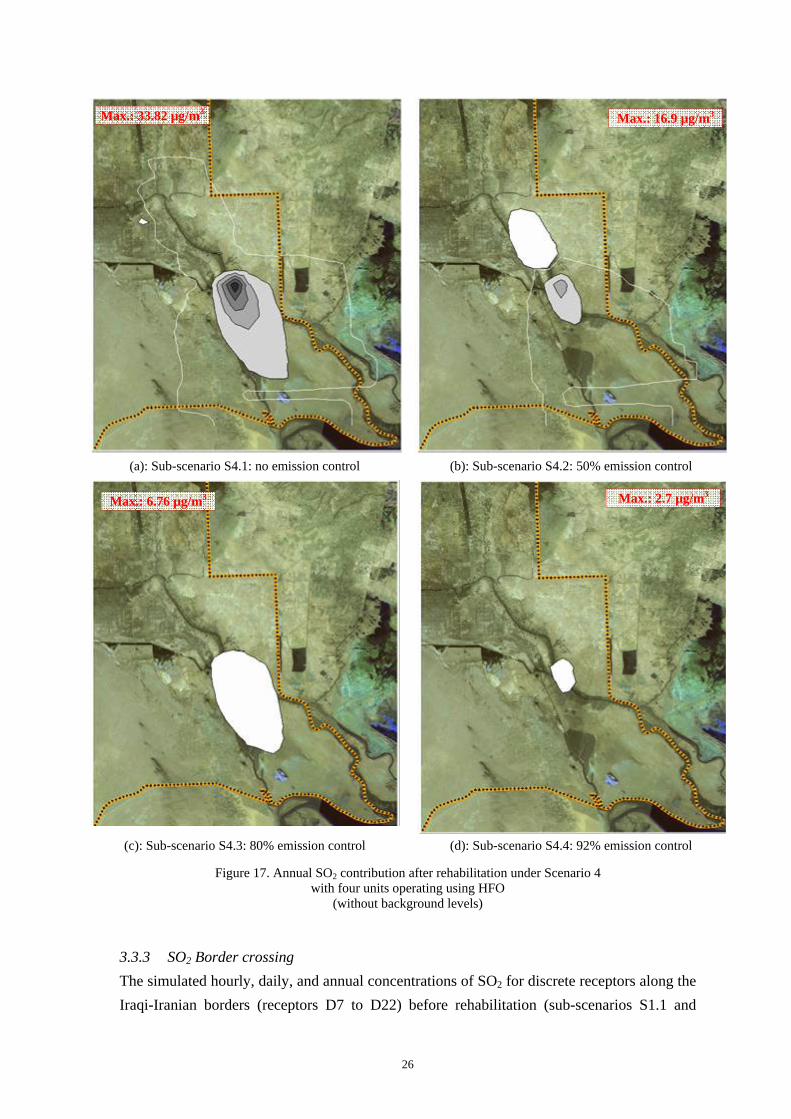
(a): Sub-scenario S4.1: no emission control (b): Sub-scenario S4.2: 50% emission control
(c): Sub-scenario S4.3: 80% emission control (d): Sub-scenario S4.4: 92% emission control
Figure 17. Annual SO2 contribution after rehabilitation under Scenario 4 with four units operating using HFO
(without background levels)
3.3.3 SO2 Border crossing The simulated hourly, daily, and annual concentrations of SO2 for discrete receptors along the Iraqi-Iranian borders (receptors D7 to D22) before rehabilitation (sub-scenarios S1.1 and
Max.: 33.82 µg/m3 Max.: 16.9 µg/m3
Max.: 6.76 µg/m3 Max.: 2.7 µg/m3

27
S2.1, units 1 and 4 operating) and after rehabilitation (sub-scenarios S3.1 and S4.1, with all four units operating) are presented in Figures 18 and 19. On the other hand, the simulated hourly, daily, and annual concentrations of SO2 for discrete receptors along the Iraqi-Kuwaiti borders (receptors D23 to D33) before rehabilitation (sub-scenarios S1.1 and S2.1, units 1 and 4 operating) and after rehabilitation (sub-scenarios S3.1 and S4.1, with all four units operating) are presented in Figures 20 and 21.

28
217
0
200
400
600
800
1000
7 8 9 10 11 12 13 14 15 16 17 18 19 20 21 22
Discrete receptor
SO2 (
ug/m
3 )
(a): Hourly
30.29
0
100
200
300
400
7 8 9 10 11 12 13 14 15 16 17 18 19 20 21 22
Discrete receptor
SO2 (
ug/m
3 )
(b): Daily
2.740
25
50
75
100
7 8 9 10 11 12 13 14 15 16 17 18 19 20 21 22
Discrete receptor
SO2 (
ug/m
3 )
(c): Annual
S1.1: Crude oil S2.1: HFO Annual WB SO2 standard (50 µg/m3) Daily WB SO2 standard (125 µg/m3)
Figure 18. Simulated SO2 contribution at discrete receptors along the Iraqi-Iranian borders before rehabilitation (Scenarios S1 and S2) with units 1 and 4 operating and no emission control
(without background levels)

29
434.22
0
200
400
600
800
1000
7 8 9 10 11 12 13 14 15 16 17 18 19 20 21 22
Discrete receptor
SO2 (
ug/m
3 )
(a): Hourly
60.61
0
100
200
300
400
7 8 9 10 11 12 13 14 15 16 17 18 19 20 21 22
Discrete receptor
SO2 (
ug/m
3 )
(b): Daily
5.49
0
25
50
75
100
7 8 9 10 11 12 13 14 15 16 17 18 19 20 21 22
Discrete receptor
SO2 (
ug/m
3 )
(c): Annual
S3.1: Crude oil S4.1: HFO Annual WB SO2 standard (50 µg/m3) Daily WB SO2 standard (125 µg/m3)
Figure 19. Simulated SO2 contribution at discrete receptors along the Iraqi-Iranian borders after rehabilitation (Scenarios S3 and S4) with four operating units and no emission control
(without background levels)

30
170
0
200
400
600
800
1000
23 24 25 26 27 28 29 30 31 32 33
Discrete receptor
SO2 (
ug/m
3 )
(a): Hourly
13.320
100
200
300
400
23 24 25 26 27 28 29 30 31 32 33
Discrete receptor
SO2 (
ug/m
3 )
(b): Daily
2.070
25
50
75
100
23 24 25 26 27 28 29 30 31 32 33
Discrete receptor
SO2 (
ug/m
3 )
(c): Annual
S1.1: Crude oil S2.1: HFO Annual WB SO2 standard (50 µg/m3) Daily WB SO2 standard (125 µg/m3)
Figure 20. Simulated SO2 contribution at discrete receptors along the Iraqi-Kuwaiti borders before rehabilitation (Scenarios S1 and S2) with units 1 and 4 operating and no emission control
(without background levels)

31
340.26
0
200
400
600
800
1000
23 24 25 26 27 28 29 30 31 32 33
Discrete receptor
SO2 (
ug/m
3 )
(a): Hourly
26.65
0
100
200
300
400
23 24 25 26 27 28 29 30 31 32 33
Discrete receptor
SO2 (
ug/m
3 )
(b): Daily
4.140
25
50
75
100
23 24 25 26 27 28 29 30 31 32 33
Discrete receptor
SO2 (
ug/m
3 )
(c): Annual
S3.1: Crude oil S4.1: HFO Annual WB SO2 standard (50 µg/m3) Daily WB SO2 standard (125 µg/m3)
Figure 21. Simulated SO2 contribution at discrete receptors along the Iraqi-Kuwaiti borders after rehabilitation (Scenarios S3 and S4) with four operating units and no emission control
(without background levels)

32
Based on the overall simulation results, the contribution of the plant to SO2 levels can be significant at nearby distances representing a potential high risk that need to be alleviated in the evaluation of alternatives during the implementation of the ESIA. This contribution added to the background levels, may exceed World Bank guidelines. The contribution risk of SO2 becomes less significant at receptors along the Iraqi-Iranian and Iraqi-Kuwaiti borders (far field simulations). 3.3.4 Particulate matter simulations Scenarios S5 to S8 simulated PM emission dispersion from the plant under both the existing condition before rehabilitation (only units 1 and 4 are operating) and after rehabilitation (units 1 to 4 are operating). In addition, the type of fuel used (crude oil and HFO) was varied with the absence of emission control equipment. The hourly, daily, and annual concentrations of PM determined for defined sub-scenarios S5.1, S6.1, S7.1, and S8.1, are presented in Table 10.
Table 10. Simulated PM contribution under scenarios S5 to S8 at selected discrete receptors (without background levels)
Receptors Scenario
Al-Hartha Basra Az Zubayr Khormshahr Abadan Ahwaz S5.1 (before rehabilitation, units 1 and 4 operating on crude oil with no emission control)
Hourly 34.12 14.45 10.62 9.42 8.63 6.76 Daily 6.3 2.89 1.75 1.09 0.79 0.43 Annual 0.27 0.59 0.15 0.13 0.10 0.006
S6.1 (before rehabilitation, units 1 and 4 operating on HFO with no emission control) Hourly 25.96 11.0 8.07 7.17 6.56 5.15 Daily 4.81 2.20 1.33 0.83 0.60 0.33 Annual 0.21 0.45 0.11 0.09 0.08 0.004
S7.1 (After rehabilitation, all units operating on crude oil with no emission control) Hourly 68.24 28.92 21.24 18.83 17.26 13.54 Daily 12.65 5.79 3.51 2.18 1.59 0.87 Annual 0.56 1.19 0.30 0.255 0.21 0.01
S8.1 (After rehabilitation, all units operating on HFO with no emission control) Hourly 51.92 22.0 16.16 14.32 13.13 10.30 Daily 9.62 4.41 2.67 1.66 1.21 0.66 Annual 0.42 0.90 0.23 0.19 0.16 0.009
Based on the overall simulation results, the HPP contribution to the near and far fields PM levels is relatively low in comparison with the potential high background PM levels that may be associated with the desert nature of the area.

33
4 CONCLUDING REMARKS
The contribution of the plant to SO2 levels can be significant at nearby distances representing a potential high risk that need to be alleviated in the evaluation of alternatives during the implementation of the ESIA. This contribution added to the background levels, may exceed World Bank guidelines. The adoption of emission control measures can reduce the risk of the plant’s contribution significantly. Under all conditions, the contribution risk of SO2 becomes less significant at receptors along the Iraqi-Iranian and Iraqi-Kuwaiti borders (far field simulations). Similarly, the contribution risk of the plant to PM levels is likely to be equally less significant, at both the near and the far fields, because of the desert nature of the region which is generally associated with high background PM levels in comparison to the plant’s contribution and exceeding on their own World Bank guidelines. The ESIA should evaluate the suitability of the World Bank guidelines to the region given its desert nature that is characterized with elevated background concentrations. The rapid risk assessment forms a basis for further simulation and sensitivity analysis for PM and SO2 as well as other indicators of potential concern (such as NOx, VOCs, PM10 or 2.5, metals, etc.), whereby, site-specific data, stack emission characterization, background air quality monitoring, and meteorological conditions are essential to obtain in order to better define potential exposure and ascertain simulated results. In this context, a comprehensive ESIA for the Hartha plant will be conducted prior to initiating of construction activities. The ESIA shall include an examination of the direct and indirect effects of the proposed Project as well as an analysis of alternatives to develop an Environmental and Social Management Plan (ESMP) that provides mitigation, monitoring, and institutional strengthening-capacity building-training actions to be integrated into the design and implementation of the Project. As part of this process, it is planned that a series of public consultations will be undertaken and that environmental and social studies be disclosed to the public. Note that while the full extent of the mitigation measures will not be known until after the ESIA is complete, an amount of US$6 million has been allocated to implement various elements of the ESMP during the rehabilitation of units 2 and 3 including the feasibility study related to units 1 and 4.

34
REFERENCES
Rahman, S. and Castro, A. 1995. Environmental Impacts of Electricity Generation: A Global perspective. IEEE Transactions on Energy Conversion, 10, (2), 307-314.
UN (United Nations)/the World Bank. 2003. Working Paper: Joint Iraq needs assessment: Agriculture, water resources and food security.
USEPA (United States Environmental Protection Agency). 1986. Guideline on Air Quality Models (revised). EPA-450/2-78-027R, U.S. Environmental Protection Agency, Research Triangle Park, NC 27711, United States
USEPA (United States Environmental Protection Agency). 1995. Compilation of Air Pollutant Emission Factors, AP-42, 5th Edition. Emission Standards Division, North Carolina, USA
World Bank. 2005. Iraq emergency electricity reconstruction project: Project Information Document. Washington, D.C.