rapid soil quality assessment using portable visible near
TRANSCRIPT
Master’s Thesis in Soil Science Environmental Pollution and Risk Assessment – Master's Programme Examensarbeten, Institutionen för mark och miljö, SLU Uppsala 2014 2014:02
Rapid soil quality assessment using portable visible near infrared (VNIR) spectroscopy Getachew Gemtesa Tiruneh

SLU, Swedish University of Agricultural Sciences Faculty of Natural Resources and Agricultural Sciences Department of Soil and Environment Getachew Gemtesa Tiruneh Rapid soil quality assessment using portable visible near infrared (VNIR) spectroscopy Supervisor: Erik Karltun, Department of Soil and Environment, SLU Examiner: Bo Stenberg, Department of Soil and Environment, SLU EX0430, Independent project/degree project in Soil Science – Master's thesis, 30 credits, Advanced level, A2E Environmental Pollution and Risk Assessment – Master's Programme 120 credits Series title: Examensarbeten, Institutionen för mark och miljö, SLU 2014:02 Uppsala 2014 Keywords: visible-near infrared, soil, Ethiopia, PLS, spectroscopy Online publication: http://stud.epsilon.slu.se Cover: Soil scanning in the field, 2013, photo by Getachew Gemtesa Tiruneh

Abstract Visible-Near Infrared (VNIR) spectroscopy provides rapid, low cost, non-destructive and simultaneous measurements of several constituents from a single scan. The method has recently gained attention as an alternative to conventional soil analytical techniques in soil quality assessment. However, most of the research has focused on spectral measurement after sample preprocessing in the laboratory. This study was conducted in Ethiopia in collaboration with Ethiopian Agricultural Transformation Agency (ATA). In this study, 112 soil samples were scanned in the field and the result was compared with scans made in the laboratory on pre-processed samples. All samples were collected from a geographical area of 10km x 10Km block. Partial Least Square (PLS) regression was used to determine the best re-gression model between laboratory reference data and spectral data for both field and laboratory measurements. The result demonstrated that VNIR spectroscopy can predict soil chemical and physical properties both in the field and under laboratory conditions but that the predictions are slightly better for soil particle size distribution (texture) and few chemical properties in the field than in laboratory. This could be either due to the number of scans per sample performed or co-variation of soil physiochemi-cal properties with soil moisture. Fraction of organic carbon (FOC), CEC, Ca, pH, Co and %clay particle size were all predicted with better accuracy (Re-sidual Prediction Deviation (RPD) ≥2 and R2 >0.7) for both field and labora-tory measurements. Log transformation of P reference data seemed as if it improved the model performance since R2 increased (R2>0.7) but the back transformation showed failure in prediction since RMSECV increased. Per-formance of N, Mg, Cu, Si, Fe, Al, %silt and %sand were acceptable with 1.4≤RPD≤2 and 0.54≤R2≤0.72. Prediction of K, S, Mn, Zn, Na, B, EC, with raw and various transformation of the spectra and reference data failed to produce a useful result with RPD <1.4 and R2<0.5. The predictive ability achieved makes VNIR spectroscopy suitable for rapid assessment of soil quality under field conditions. Key words: visible-near infrared, soil, Ethiopia, PLS, spectroscopy
Popular science summary The relationship between soil quality and crop productivity was recognized as early as ancient civilization. Literature sources show that early humans probably used crop yield as a soil fertility indicator and implemented a trial and error approach to determine where to farm. They recognized differ-ences in soils and adjusted cropping patterns based on these observations. Modern agriculture evolved on recognition of soil quality as an important component of improving crop productivity. Obtaining soil quality infor-mation is, therefore, of importance to know the condition of soil and intro-duce amendments if found necessary. Several methods were developed and/or proposed over years to obtain soil quality information that could assist farmers in their fertilization decision. Farmers obtain soil information through techniques that range from locally developed traditional to modern soil chemical analysis. The conventional soil laboratory analysis technique is the one that is widely practiced. How-ever, this technique is expensive, time-consuming and may also result in environmental pollution. With increasing demand for instant results and environmental friendly approach of data generation, a search for alterna-tive to the conventional laboratory analysis has opened a door for a tech-nique called visible-near infrared (VNIR) spectroscopy as a potential candi-date. VNIR spectroscopic analysis is a method based on absorption of light by different materials in the visible and near infrared region of the electro-magnetic spectrum. The VNIR wavelength region ranges from 400 - 2500 nm. Materials absorb or reflect specific frequencies of light when irradiated with VNIR light. Absorption occurs when the incoming light frequency cor-responds to the molecular vibration frequency of a constituent in the sam-ple. The portion of light that is not absorbed will be monitored by a detec-tor. Absorption/reflectance information is captured by a computer and the data will be analyzed by experts. The analysis of the spectra provides in-formation of what and how much of a substance the sample contains. The method gained recognition as an alternative analysis in several fields of studies mainly because of its cost effectiveness, the non-destructive sam-ple analysis, provision of rapid results and for the simultaneous measure-ments of several constituents from a single scan. Another advantage is that no chemicals are needed in the analysis procedure making it environmen-tally acceptable. The instrument is essential for real time surveillance when immediate decision is needed in the field. However, questions remain on the lack of a universal calibration method. Due to the complex nature of absorption in the VNIR region, there is uncertainty from which substances that absorb the light. The advanced mathematical and statistical analysis applied to overcome the uncertainties is another handicap to the method. Calibration relies on reference analysis results and hence the technique is not something that stand-alone by itself. The other complexity is that suc-
cess of calibration might be due to locally co-varying spectrally active sub-stances and its results are purely numerical. In spite of its complexity, cali-bration success has been achieved in predicting several constituents in la-boratory. Recently, there is a demand to move the instrument from re-search laboratory to field use and from beyond research purpose to practi-cal utilization. This thesis, therefore, aimed at evaluating whether field collected visible-near infrared (VNIR) data provides useful information with sufficient preci-sion to be used for soil quality assessment. The study was conducted in Ethiopia in collaboration with the Ethiopian Agricultural Transformation Agency (ATA). Data from 112 soil samples was collected using VNIR spec-troscopy both in the field and in the laboratory. A regression technique suitable for this type of data set called PLS regres-sion was applied to determine the best prediction between field and labor-atory sample scanning. The result showed that VNIR spectroscopy provides slightly better prediction performance under field condition for some of the parameters. Field measurement using the instrument can give suffi-cient information on soil quality status that may lead to for example, ferti-lizer recommendations. Similar results were obtained in other studies mak-ing VNIR spectroscopy a promising emerging technology for measurement of soil properties under field conditions. This study may serve as an input to the already growing literature and is a springboard for more research towards field application of the instrument in Ethiopia. The promising result obtained is good news for farmers who used to rely on previous crop performance, soil color and other qualitative indicators for fertilization decision. It is also a plus on the economic side as considerable amount of money will be saved from being spent on the ex-pensive conventional analysis technique.
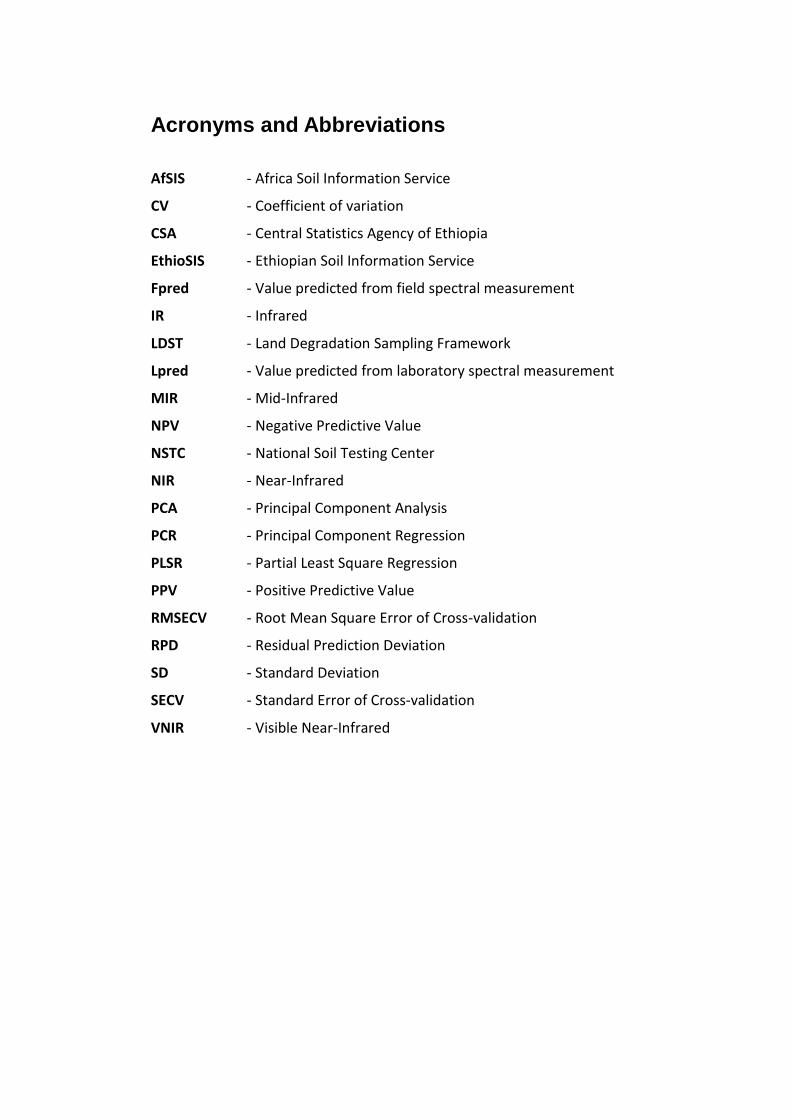
Acronyms and Abbreviations
AfSIS - Africa Soil Information Service
CV - Coefficient of variation
CSA - Central Statistics Agency of Ethiopia
EthioSIS - Ethiopian Soil Information Service
Fpred - Value predicted from field spectral measurement
IR - Infrared
LDST - Land Degradation Sampling Framework
Lpred - Value predicted from laboratory spectral measurement
MIR - Mid-Infrared
NPV - Negative Predictive Value
NSTC - National Soil Testing Center
NIR - Near-Infrared
PCA - Principal Component Analysis
PCR - Principal Component Regression
PLSR - Partial Least Square Regression
PPV - Positive Predictive Value
RMSECV - Root Mean Square Error of Cross-validation
RPD - Residual Prediction Deviation
SD - Standard Deviation
SECV - Standard Error of Cross-validation
VNIR - Visible Near-Infrared
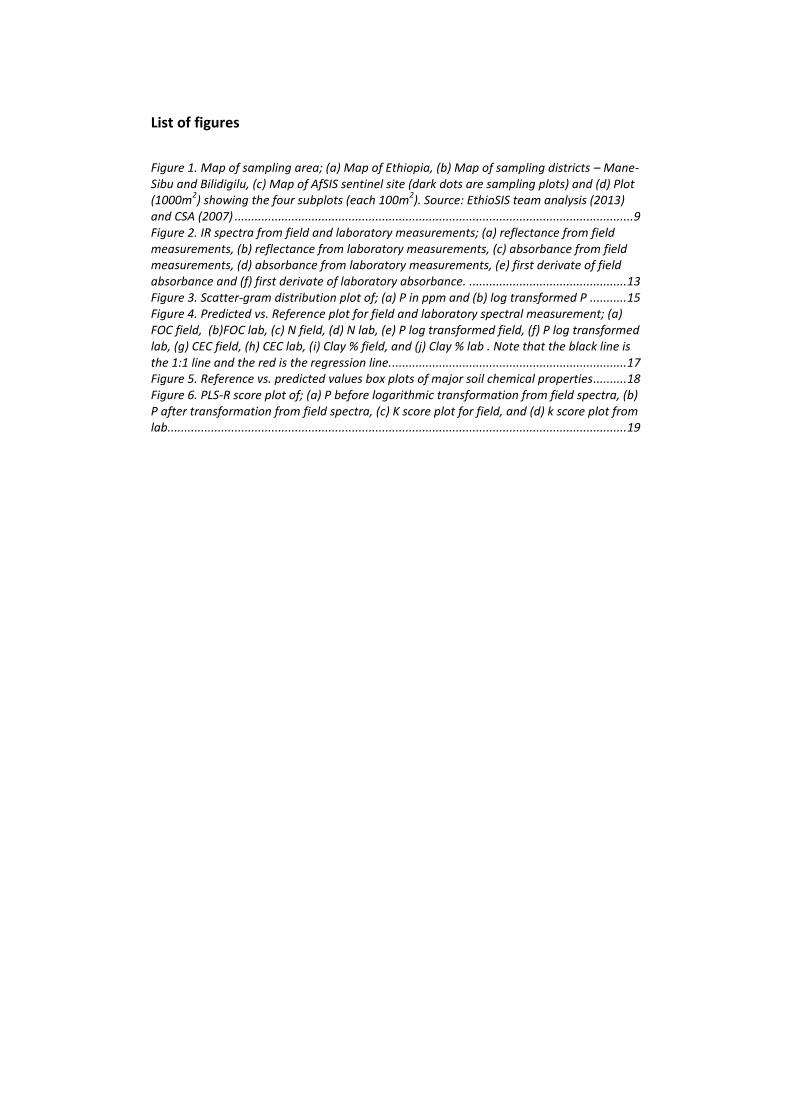
List of figures
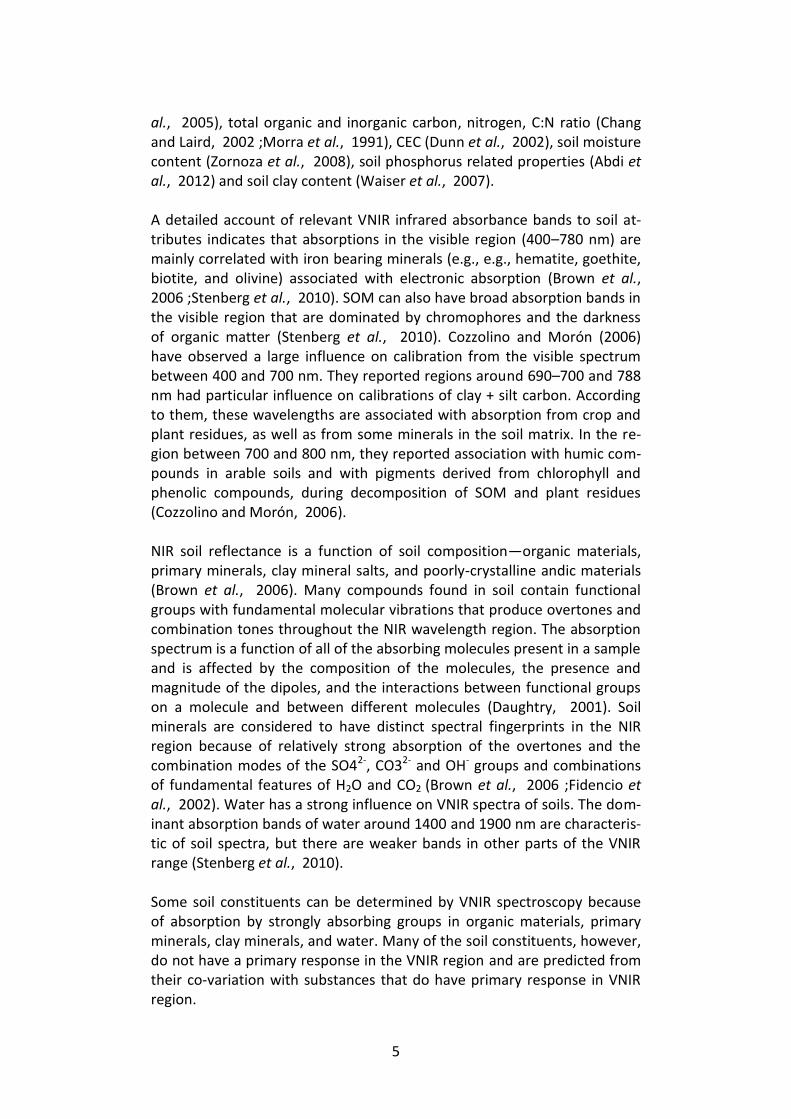
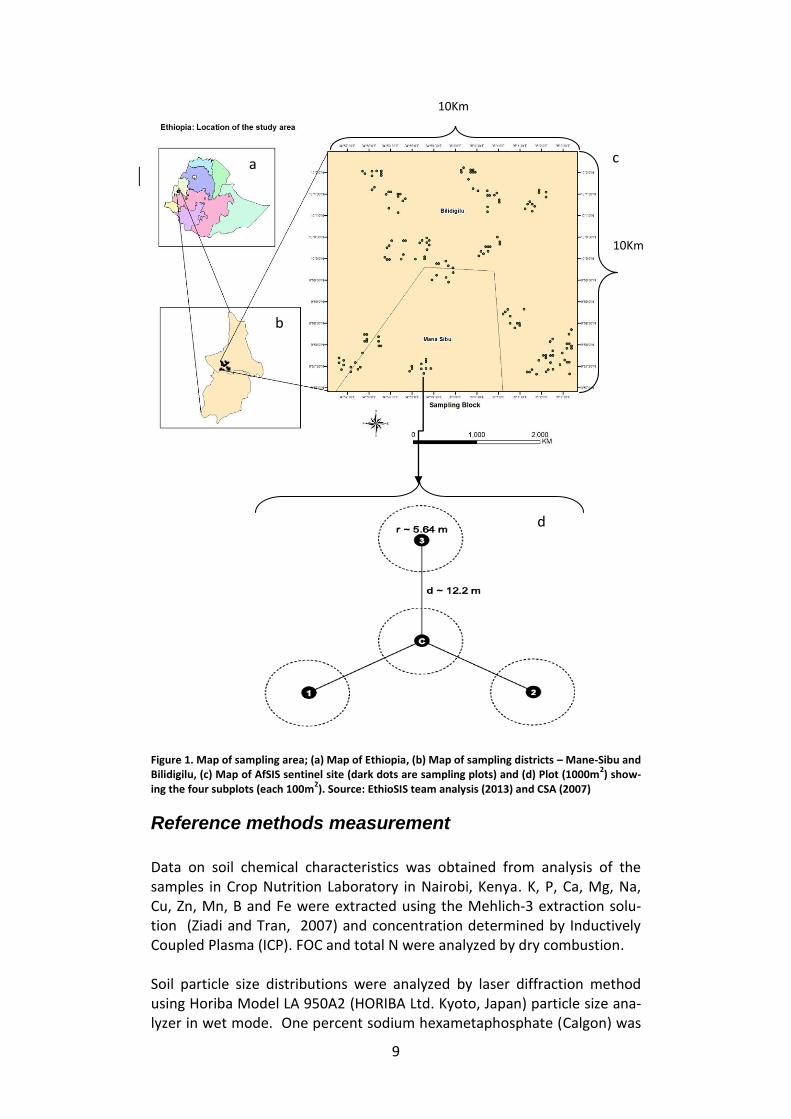
Figure 1. Map of sampling area; (a) Map of Ethiopia, (b) Map of sampling districts – Mane-Sibu and Bilidigilu, (c) Map of AfSIS sentinel site (dark dots are sampling plots) and (d) Plot (1000m
2) showing the four subplots (each 100m
2). Source: EthioSIS team analysis (2013)
and CSA (2007) ....................................................................................................................... 9 Figure 2. IR spectra from field and laboratory measurements; (a) reflectance from field measurements, (b) reflectance from laboratory measurements, (c) absorbance from field measurements, (d) absorbance from laboratory measurements, (e) first derivate of field absorbance and (f) first derivate of laboratory absorbance. ............................................... 13 Figure 3. Scatter-gram distribution plot of; (a) P in ppm and (b) log transformed P ........... 15 Figure 4. Predicted vs. Reference plot for field and laboratory spectral measurement; (a) FOC field, (b)FOC lab, (c) N field, (d) N lab, (e) P log transformed field, (f) P log transformed lab, (g) CEC field, (h) CEC lab, (i) Clay % field, and (j) Clay % lab . Note that the black line is the 1:1 line and the red is the regression line. ...................................................................... 17 Figure 5. Reference vs. predicted values box plots of major soil chemical properties .......... 18 Figure 6. PLS-R score plot of; (a) P before logarithmic transformation from field spectra, (b) P after transformation from field spectra, (c) K score plot for field, and (d) k score plot from lab......................................................................................................................................... 19
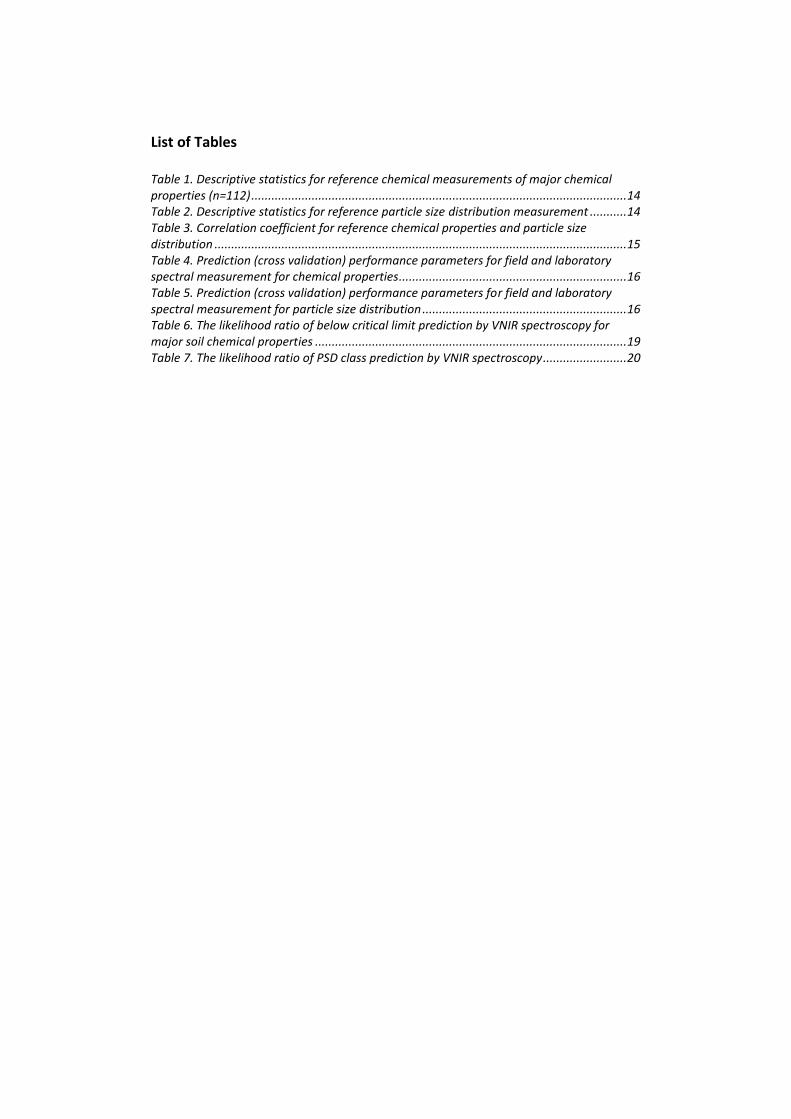
List of Tables Table 1. Descriptive statistics for reference chemical measurements of major chemical properties (n=112) ................................................................................................................ 14 Table 2. Descriptive statistics for reference particle size distribution measurement ........... 14 Table 3. Correlation coefficient for reference chemical properties and particle size distribution ........................................................................................................................... 15 Table 4. Prediction (cross validation) performance parameters for field and laboratory spectral measurement for chemical properties .................................................................... 16 Table 5. Prediction (cross validation) performance parameters for field and laboratory spectral measurement for particle size distribution ............................................................. 16 Table 6. The likelihood ratio of below critical limit prediction by VNIR spectroscopy for major soil chemical properties ............................................................................................. 19 Table 7. The likelihood ratio of PSD class prediction by VNIR spectroscopy ......................... 20
Table of Contents
Introduction 1
Historical perspective of VNIR spectroscopy 2
Theory of VNIR spectroscopy 3
Application of VNIR spectroscopy in soil analysis 4
Chemometrics 6
The implication of the application on Ethiopia 6
Materials and methods 7
Study area 7
Sampling design and data collection 8
Reference methods measurement 9
Spectral acquisition 10
Spectral pre-processing 10
Data analysis 11
Results 12
Description of the samples 13
Model performance 15
Discussion 21
Prediction of chemical properties 21
Prediction of soil particle size 25
Chemical properties vs. particle size distributions 27
PLS-1 vs PLS-2 regression 27
Conclusions 27
Acknowledgments 28
References 29
Appendices 34

1
Introduction Soil stores, moderates the release of, and cycles nutrients (Hoorman et al., 2011) that sustain ecosystems and all life within them on planet earth. Organisms rely on soil for the production of food, fiber, and energy (Crawford et al., 2005 ;Stenberg et al., 2010). It provides a diverse physi-cal, chemical, and biological habitat for organisms and is the greatest res-ervoir of biodiversity (Feeney et al., 2006). It also regulates the drainage, flow and storage of water and solutes and provides a function as an envi-ronmental filter for toxic compounds or excess nutrients that may leach into the environment (Buol, 1995 ;Feeney et al., 2006 ;Stenberg et al., 2010). Soil is also regarded as a potential sink for carbon to mitigate global warming (Stenberg et al., 2010). Soils are dynamic systems that undergo continuous change in response to natural and human induced activities. Nutrients in the soil experience vari-ous transformations inside the system like mineralization and immobiliza-tion and are lost from the system through leaching, erosion, volatilization and crop harvest. The fundamental ability of a soil to continually provide ecosystem sustaining functions is ensured by preserving the quality and taking immediate measures to restore quality whenever it is necessary. This requires continuous acquisition of relevant soil property information. In the past, several methods have been developed to obtain soil quality information (Schulthess, 2011). Traditionally, information has been ob-tained through conventional laboratory analysis. This technique is, howev-er, time consuming, expensive, requires dense sampling, and is often re-sponsible for the generation of unwanted waste and destruction of sam-ples (Nanni and Dematte, 2006). There is a growing concern among environmentalists over pollution from unwanted wastes generated in this process. In addition, the limitation the technique has to provide real-time data and its conservative approaches has prompted search for a better alternative that could potentially com-plement it. This search for a possible alternative to enhance or replace conventional laboratory methods of soil analysis with faster and cheaper methods (Shepherd and Walsh, 2002) has opened a door for introduction of near-infrared spectroscopic analysis as a potential candidate. This has coincided with the development of novel spectrometer configurations based on fiber optic probes and introduction of efficient chemometric data processing techniques capable of obtaining relevant information from absorbance/ reflectance of the near- and mid-infrared part of the electromagnetic spec-trum (Reich, 2005).
2
The technique has gained acceptance because of its ability to make non-destructive, rapid analysis with little or no sample preparation. It provides a chemical free, real-time assessment of soil quality and may be used di-rectly at a field site overcoming the limitations of wet chemistry. It gener-ates a fingerprint of a sample in response to infrared (IR) source which is directly related to the sample’s physicochemical composition. Despite significant advances in recent years, no specific modeling method-ology has yet gained widespread acceptance. There are no accurate models that take account of the specific interaction between VNIR light and mat-ter. Instead, the interpretation of IR spectra is dependent on wet chemistry analysis to construct models and that requires prior knowledge of the val-ue for the target parameter (Blanco and Villarroya, 2002). It also requires chemometric techniques to extract relevant information. As a result, cali-bration is purely empirical in many cases. There are questions that still re-main to be answered about how to move this technology from the labora-tory to in situ use and from research to practical utilization. While it is true that IR spectroscopy offers a possibility for prediction of certain soil attributes, its application for real time surveillance is less well studied. This thesis, therefore, aims at testing whether field collected visi-ble-near infrared (VNIR) spectra provides useful information with sufficient precision to be used for soil quality assessment. It compares the prediction models from laboratory and field spectral measurements and evaluates if a portable VNIR spectroscopy machine could be used in the field for rapid assessment of soil quality. The knowledge obtained from the study in combination with other relevant studies lead to advice on the utilization of portable VNIR spectroscopy as a potential alternative for in situ assessment of soil properties.
Historical perspective of VNIR spectroscopy The first time that anyone showed that there is light which is not visible to the human eye beyond the red end of the visible light spectrum was in 1800. It was the German born British scientist Frederick William Herschel (Pasquini, 2003) and he named his discovery 'calorific rays'. He separated the electromagnetic spectrum with a prism and found out that the tem-perature increased markedly towards and beyond the red end, i.e. in the region that is now called the near-infrared (Reich, 2005). Although the near-infrared (NIR) region was discovered as early as 1800, the potential application of NIR spectroscopy is ignored by spectroscopists until the 1960s in the belief that it lacked attractive analytical information (Blanco and Villarroya, 2002 ;Pasquini, 2003). It first came to the attention when Karl Norris of the USDA demonstrated the capability of near infrared (NIR) spectroscopy for rapid determination and characterization of agricul-
3
tural and food products (Pasquini, 2003). Over the last decades, significant progress has been made in theoretical and instrumental development and the technique has continued to receive considerable interest in several fields of research. Today, VNIR/NIR spectroscopy is widely used in agricultural, pharmaceuti-cal and food industries for rapid and nondestructive qualitative and quanti-tative analysis of raw materials, in-process control and finished products (Niemoller and Behmer, 2008 ;Pasquini, 2003). In soil science, Dalal and Henry (1986) applied VNIR spectroscopy for mois-ture, organic C, and total N analyses where they found sufficient predicta-bility within a dataset of similar soil color and moderate amounts of soil organic matter. Over the last decades, VNIR spectroscopy has developed as a major tool for quantitative determinations of components within often complex organic matrices whereas mid-infrared (MIR) spectroscopy has been used mainly in research for qualitative analysis involving spectral in-terpretation of chemical structures (McCarty et al., 2002). Once regarded as having little potential for analytical work, VNIR spectros-copy has now become one of the most promising analytical techniques. The development of equipment featuring improved electronic and optical components and invention of computers capable of effectively processing the information contained in VNIR spectra has facilitated expansion of this technique in an increasing number of fields (Blanco and Villarroya, 2002). The evolution of widespread application of VNIR spectroscopy and the the-oretical and instrumental progress in the past decades is an indication of the success the technique has achieved.
Theory of VNIR spectroscopy The VNIR radiation is the region of the electromagnetic spectrum between 400 and 2500 nm (Canasveras et al., 2012) where most organic and also some inorganic compounds have excellent reflectance or transmittance properties (Wang et al., 2004). VNIR spectroscopy is based on the tendency of molecules to absorb light in VNIR region of the electromagnetic radiation. There are two processes causing the absorption of VNIR radiation in molecule; the electronic transi-tions and the vibrational transitions. The electronic transition process in-volves electrons of molecules being raised to higher electron energy. Ab-sorption due to vibrational transition occurs when the incoming infrared radiation energy quanta corresponding to certain wavelength that is re-quired by certain bond in a certain chemical matrix makes the bond vi-brate. The fundamental absorption is the most intense absorption of ener-gy and this occurs at wavelengths found in the MIR region. Absorption in

4
NIR region corresponds mainly to overtones and combinations of funda-mental vibrations in MIR region. Overtone occurs at twice, thrice or higher multiplications of the frequency of fundamental vibration in MIR region to produce first, second and higher overtones respectively. Combination bands are observed when two or more neighboring bonds or vibration types of the same bond share one energy quanta simultaneously. In the visible region, electronic excitations are the main processes as the energy of the radiation is higher than for the infra-red radiation. The photon ener-gy absorbed will elevate the vibrational or electronic energy of the mole-cule by a discrete amount (Hollas, 2004 ;Miller, 2001 ;Pasquini, 2003 ;Stenberg et al., 2010). When a sample to be analyzed is irradiated by VNIR radiation, part of the radiation will be absorbed. The resulting spectrum is a molecular finger-print of the material that allows for a precise identification and possibly also quantification of a given material. Spectral signatures of materials are defined by their absorbance as a function of wavelength (Niemoller and Behmer, 2008). The frequencies at which light is absorbed appear as a re-duced signal of reflected radiation and are displayed in % reflectance (R), which can then be transformed to apparent absorbance: A = log (1/R) Absorption bands in NIR region are broad, rather than sharp peaks, due to the additive effects of two or more bands at each wavelength. The intensi-ty of the absorbance of energy decreases with each overtone. Generally, the NIR region is characterized by broad, superimposed, and weak vibra-tional modes, giving NIR spectra few, broad absorption features. It is for these reasons that NIR spectroscopy employs more statistical, mathemati-cal approaches to the analysis of composition of samples, compared with the approaches used in MIR spectroscopy. It relies on calibrations which utilize absorbance at several, even many wavelengths, to predict the com-position of a sample. Nevertheless, this region contains useful information on organic and inorganic materials in the soil. It is proven to be a versatile tool and a powerful technique for studying materials in several fields of study (Batten, 1998 ;Miller, 2001 ;Pasquini, 2003 ;Scotter, 2005 ;Stenberg et al., 2010).
Application of VNIR spectroscopy in soil analy-sis There is a growing literature on successful calibration between compo-nents of VNIR spectra and levels of one or more soil attributes (Fuentes et al., 2012). Soil chemical properties that have been calibrated and predict-ed with VNIR spectra using multivariate statistical analysis include the de-termination of iron(II) and iron(III) sulphate containing minerals (Frost et
5
al., 2005), total organic and inorganic carbon, nitrogen, C:N ratio (Chang and Laird, 2002 ;Morra et al., 1991), CEC (Dunn et al., 2002), soil moisture content (Zornoza et al., 2008), soil phosphorus related properties (Abdi et al., 2012) and soil clay content (Waiser et al., 2007). A detailed account of relevant VNIR infrared absorbance bands to soil at-tributes indicates that absorptions in the visible region (400–780 nm) are mainly correlated with iron bearing minerals (e.g., e.g., hematite, goethite, biotite, and olivine) associated with electronic absorption (Brown et al., 2006 ;Stenberg et al., 2010). SOM can also have broad absorption bands in the visible region that are dominated by chromophores and the darkness of organic matter (Stenberg et al., 2010). Cozzolino and Morón (2006) have observed a large influence on calibration from the visible spectrum between 400 and 700 nm. They reported regions around 690–700 and 788 nm had particular influence on calibrations of clay + silt carbon. According to them, these wavelengths are associated with absorption from crop and plant residues, as well as from some minerals in the soil matrix. In the re-gion between 700 and 800 nm, they reported association with humic com-pounds in arable soils and with pigments derived from chlorophyll and phenolic compounds, during decomposition of SOM and plant residues (Cozzolino and Morón, 2006). NIR soil reflectance is a function of soil composition—organic materials, primary minerals, clay mineral salts, and poorly-crystalline andic materials (Brown et al., 2006). Many compounds found in soil contain functional groups with fundamental molecular vibrations that produce overtones and combination tones throughout the NIR wavelength region. The absorption spectrum is a function of all of the absorbing molecules present in a sample and is affected by the composition of the molecules, the presence and magnitude of the dipoles, and the interactions between functional groups on a molecule and between different molecules (Daughtry, 2001). Soil minerals are considered to have distinct spectral fingerprints in the NIR region because of relatively strong absorption of the overtones and the combination modes of the SO42-, CO32- and OH- groups and combinations of fundamental features of H2O and CO2 (Brown et al., 2006 ;Fidencio et al., 2002). Water has a strong influence on VNIR spectra of soils. The dom-inant absorption bands of water around 1400 and 1900 nm are characteris-tic of soil spectra, but there are weaker bands in other parts of the VNIR range (Stenberg et al., 2010). Some soil constituents can be determined by VNIR spectroscopy because of absorption by strongly absorbing groups in organic materials, primary minerals, clay minerals, and water. Many of the soil constituents, however, do not have a primary response in the VNIR region and are predicted from their co-variation with substances that do have primary response in VNIR region.
6
Chemometrics Extraction of relevant information from VNIR spectra relies on multivariate calibration technique. The information necessary for calibration is obtained from among many variables, often thousands of wavelengths. There exists a high multi-collinearity between absorbance at different wavelengths that does not allow ordinary regression techniques. To overcome the complex nature of VNIR absorption, the calibration requires the application of chemometrics. Chemometrics is the use of mathematical and statistical techniques for extracting relevant information from VNIR spectral data (Pasquini, 2003). The most commonly used chemometric tools in VNIR analysis are principal component regression (PCR) and the PLS regression techniques. Of the two, PLS is totally dominating technique. These two techniques are similar in many ways. Both methods construct new predictor variables, known as components, as linear combinations of the original predictor variables, but they construct those components in different ways. The former regresses along the principal component which is obtained by eigen-value decompo-sition of the covariance or correlation matrix of the predictive variables. This approach yields informative directions in the factor space, but they may not be associated with the shape of the predicted surface. There is no guarantee that the principal components which explain the predictors are relevant for the response variables. The emphasis is on predicting the re-sponses based on the underlying relationship with the predictor variables. Therefore, seeking directions in the predictor variables space that are asso-ciated with high variation in the responses is vital. By contrast, the latter technique (PLS) allows this by capturing as much information in the raw predictive variables as well as in the relation between the predictive and target variables. The PLS regression searches for a set of components (called latent vectors) that performs a simultaneous decomposition of the predictors and response variables that these components explain as much as possible of the covariance between the predictors and response varia-bles (Abdi, 2003 ;Maitra and Yan, 2008 ;Tobias, 1995).
The implication of the application on Ethiopia Farmers in Ethiopia traditionally assess soil fertility qualitatively through outcomes such as crop performance and yield, indicator plants, soil soft-ness and soil color (Karltun et al., 2013). However, these indicators may be significantly affected by a range of other factors (Corbeels et al., 2000). The fact that these factors per se are not perfect indicators of soil quality assessment means that introductions of other relevant assessment tech-niques are an indisputable necessity.
7
Soil analysis is a vital tool in this regard since it provides information re-quired to prepare site specific recommendations. Traditionally, it is ac-quired through wet chemistry. However, the high cost of soil sampling and conventional chemical and physical analysis restricts implementation. As a result, fertilizer application in Ethiopia is skewed to blanket recommenda-tion ever since its inception in late 1960s (Molla, 2013). Farmers mainly base their fertilization decision up on previous year crop yield and other technical recommendation offered by experts. The demand for food production in Ethiopia will be intensified since the nation’s population growth is projected to be high for the upcoming dec-ades (Romaniuk, 2012). Improving productivity therefore continues to at-tract considerable interest as a topic of research. Spectroscopic analysis of soil quality will play a vital role in helping achieve the goal of advancing soil quality information systems and assist farmers in decisions about fertilizer application rates and soil management. Such kind of soil quality infor-mation retrieval also has an implication on monitoring greenhouse gas emission from soil by quantifying the soil organic matter turnover and the balance of carbon and nitrogen in soil (Amare et al., 2013). The country’s ambition to increase growth in the agricultural sector as out-lined in the Growth and Transformation Plan (GTP) is a promising prospect towards utilization of advanced technologies. Introduction of guidelines for the application of near infrared spectrometry in milk products (ES ISO 21543:2012) and the furbishing of the National Soil Testing Center (NSTC) with infrared spectroscopy equipment are some of the moves towards uti-lizing the IR technology in Ethiopia. This study was carried out in collaboration with Ethiopian agricultural transformation agency (ATA). It is an innovative agency, designed to ad-dress a set of deeply complex problems that have hindered widespread growth in the agricultural sector of Ethiopia. One of its responsibilities is to compile a detailed soil information system database by making use of technologies helpful for the task where VNIR spectroscopy is one to men-tion.
Materials and methods
Study area
Field spectral data were collected in the Mana-Sibu and Bilidigilu districts, West Ethiopia. The districts traverse across two agro-ecological zones: 68.3% belongs to Kolla (semi-arid lowland), and 31.7% to Woina-Dega (sub-humid highland). The altitude ranges between 500 and 1740m above sea level.
8
The districts receive an average annual rainfall of 1200 mm. There is a bi-modal rainfall pattern with the short rain received between March and April and long rain from June to October. The temperature is moderate with highs of 25-30oC and lows of 7-12oC. The districts watershed is drained by several rivers, and among them is Dabus that contributes to the Blue Nile. The soil is considered to be fertile loam with a potential of moderate productivity. The sampling block, which was 10 km by 10 km, lies between the two districts. There was no weather station specific to the sampling block and hence the data provided above were averaged from the nearby weather stations at the center of the districts. Different land use manage-ment system is practiced in the sampling block that may eventually affect soil properties.
Sampling design and data collection
One hundred twelve (112) geo-referenced soil samples were collected ac-cording to the methods prescribed by Land Degradation Sampling Frame-work (LDSF) by AfSIS (Vågen et al., 2010). Samsung tablets equipped with GPS receivers were used to reach to the pre-defined geo-referenced sam-pling places. The sampling framework was built around a block that is 10 x 10 km in size. The block is stratified into 16 grid cells, and sampling cluster centroids were randomly located within the grid cells. Around each centroid, 10 sampling plots were randomly located in the grid cells with each cell covering an area of 1 km2. Each sampling plot is 1000m2 and has 4 subplots, each 100m2 (Vågen et al., 2010). A map that illustrates the sampling districts, block, plots and subplots was presented in Figure 1. Some of the sampling plots were inaccessible and others were stone and gravels which were not suitable to scan using VNIR spectroscopy. As a re-sult, the number of soil samples collected were less than the proposed by 30%. The samples were taken in the center of each subplot at 0-20 cm using a soil auger. The top soils from the four subplots were carefully com-posited into one sample for each plot. Sampling was conducted between April and May 2013. The soils were not pretreated and scanned at their moisture content at sampling. However, large soil aggregates were broken down by hand. All samples from the field were transported to a regional laboratory in Nekemt town for processing. The samples were air dried and crushed to pass a 2 mm sieve in the regional laboratory.
9
Figure 1. Map of sampling area; (a) Map of Ethiopia, (b) Map of sampling districts – Mane-Sibu and Bilidigilu, (c) Map of AfSIS sentinel site (dark dots are sampling plots) and (d) Plot (1000m
2) show-
ing the four subplots (each 100m2). Source: EthioSIS team analysis (2013) and CSA (2007)
Reference methods measurement
Data on soil chemical characteristics was obtained from analysis of the samples in Crop Nutrition Laboratory in Nairobi, Kenya. K, P, Ca, Mg, Na, Cu, Zn, Mn, B and Fe were extracted using the Mehlich-3 extraction solu-tion (Ziadi and Tran, 2007) and concentration determined by Inductively Coupled Plasma (ICP). FOC and total N were analyzed by dry combustion. Soil particle size distributions were analyzed by laser diffraction method using Horiba Model LA 950A2 (HORIBA Ltd. Kyoto, Japan) particle size ana-lyzer in wet mode. One percent sodium hexametaphosphate (Calgon) was
10Km
m
10Km
m
a
b
d
cb
10
used as a dispersing agent. Soil samples were passed through 0.5mm sieve before analysis. Four measurements per sample were carried out. The fourth measurement obtained was considered as a true value of the parti-cle size as it allowed full dispersion of the particles. This method does not have a perfect agreement with classical techniques (Eshel et al., 2004). However it does provide data rapidly and reproducibly for the full range of particle sizes.
Spectral acquisition
In-situ soil sample scanning were made using FieldSpec4 Standard-Res SpectroRadiometer (Analytical Spectral Devices, Boulder, CO, USA) equipped with high intensity contact probe for soil. Seven scans taken at 90o angle of the soil sample were carried out for each sample at different parts of the sample and the seven spectra were then averaged into one spectrum for each sample. Once the soil samples were air dried and passed through 2 mm sieve, they were scanned in the National Soil Testing Center (NSTC) laboratory in Addis Ababa using the same instrument equipped with a high intensity MugLite that illuminate samples with a halogen bulb. Three scans at different ori-entation were carried out for each sample and the three spectra were then averaged to one spectrum for each sample. All spectra were recorded in diffuse light reflection mode over a spectral wavelength range of 350 to 2500 nm at 1 nm data spacing interval. White reference measurements and spectrometer optimization were made every 20 minutes and more frequent if the light condition changed. The changes in light condition were less frequent during lab measurement since scan-ning was carried out indoor.
Spectral pre-processing
Recorded spectral data was exported as text file to the Unscrambler (ver-sion X10.3 CAMO, Norway). Then the reflectance spectra were transformed into absorbance spectra using the log (1/R) function, as absorbance is di-rectly proportional to the concentration of an absorber according to Beer-Lambert Law. Prior to averaging spectral measurements, the data set was screened for outlier using Principal Component Analysis (PCA) technique where removal decision was based on the Hoteling T2 test (25%) and distance from other spectra of the same soil sample on the PCA score plot. Spectral regions below 420 nm and above 2475 nm were removed because they were af-fected by noise. The spectral steps due to transition and overlap region
11
between VNIR Silicon photodiode detector array and the SWIR1 InGaAs array (991 – 1009 nm); and at the SWIR1:SWIR2 detector overlay region (1791-1809 nm) were also excluded from computation. The remaining spectra were smoothed using Gaussian filter with eleven segment size to eliminate remaining noise. Background signals unrelated to chemical and physical composition of the samples were removed by computing the first derivate for each VNIR measurement using a gap-segment derivative. The data set were mean centered for ease of interpretation and numerical stability (Wold et al., 2001). However, spectral data were not scaled as this may inflate noise influence. For particle size distribution analysis, the spectra were averaged over ten wavelengths. This was followed by a gap-segment derivative transfor-mation and mean centering. The spectral region between 420 and 790 nm were used to predict particle size distribution. In addition to these, various pre-processing transformations of the spectra were explored to improve model performance. However, the models did not benefit from this pre-processing of the spectra so the results from the-se transformations will not be presented here.
Data analysis
The partial least square (PLS) regression modeling tool in the Unscrambler X10.3 was used to determine the best correlation between the chemical reference data and spectral data. Cross-validation of twenty segments with five samples per segment was carried out to investigate the predictive va-lidity of the model. Optimum number of components (PLS factors) to be used in the model were determined from the percent of explained variance and based on suggestions given by the Unscrambler program. Due atten-tion was given to minimize the likelihood of over and under-fitting. The accuracy of VNIR spectroscopy to predict soil property was evaluated using coefficient of determination (R2), root mean square error of cross validation (RMSECV), bias and residual prediction deviation (RPD) (McDowell et al., 2012). Likelihood ratio positive and likelihood ratio nega-tive (LR+ and LR-) were used to investigate how many times more likely the predicted data are in the same range as the reference data. These pa-rameters were calculated according to the following equations;
[1]
[2]
12
[3]
[4]
[5]
[6]
[7]
where SD is standard deviation of laboratory measurement, RMSECV is standard error of cross validation, YPred is predicted value of the validation set, YRef is the laboratory measurement of validation set, n is the total number of samples in the validation set, TP is true positive, FN is false neg-ative, TN is true negative and FP is false positive prediction. RPD threshold (RPD>2) was proposed as a gauge to the performance of model prediction as it attempts to standardize the value of RMSE with re-spect to the natural dispersion of the samples (Brown et al., 2005). How-ever, this depends on range and distribution of population and may not be recommended for soil sample sets which often show a skewed distribution (Bellon-Maurel et al., 2010). However, it is still reported in this study to allow comparison with previous studies where the index has been fre-quently used In this study, an outlier is defined as a sample that has both high leverage and residual variance, and exhibit difference from other samples on the x-y relationship plot. One sample was considered an outlier and excluded from the analysis as it fulfilled the pre-defined rejection criteria. Samples that seemed to be outliers on the PLS score plot were initially removed from the calibration model. However, this did not improve the model and hence they were included in the final model.
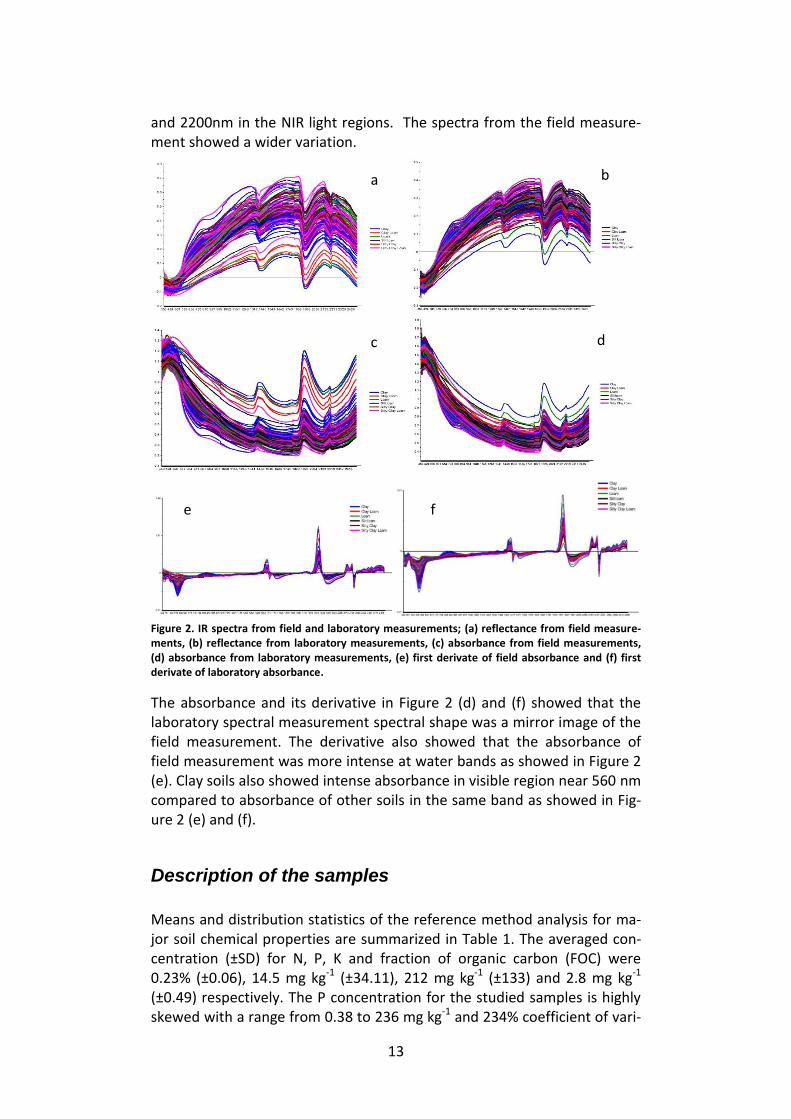
Results The VNIR reflectance and absorbance spectra and respective derivate of both field and lab measurements of the samples are presented in Figure 2. The pattern of spectral absorbance/reflectance of the field and laboratory scanning of the samples were similar, except for the observed variation in depth of absorbance. They had high absorbance in the visible light region (350-780nm), and three major absorption peaks around 1450nm, 1940nm
13
and 2200nm in the NIR light regions. The spectra from the field measure-ment showed a wider variation.
Figure 2. IR spectra from field and laboratory measurements; (a) reflectance from field measure-ments, (b) reflectance from laboratory measurements, (c) absorbance from field measurements, (d) absorbance from laboratory measurements, (e) first derivate of field absorbance and (f) first derivate of laboratory absorbance.
The absorbance and its derivative in Figure 2 (d) and (f) showed that the laboratory spectral measurement spectral shape was a mirror image of the field measurement. The derivative also showed that the absorbance of field measurement was more intense at water bands as showed in Figure 2 (e). Clay soils also showed intense absorbance in visible region near 560 nm compared to absorbance of other soils in the same band as showed in Fig-ure 2 (e) and (f).
Description of the samples
Means and distribution statistics of the reference method analysis for ma-jor soil chemical properties are summarized in Table 1. The averaged con-centration (±SD) for N, P, K and fraction of organic carbon (FOC) were 0.23% (±0.06), 14.5 mg kg-1 (±34.11), 212 mg kg-1 (±133) and 2.8 mg kg-1 (±0.49) respectively. The P concentration for the studied samples is highly skewed with a range from 0.38 to 236 mg kg-1 and 234% coefficient of vari-
a b
c d
e f
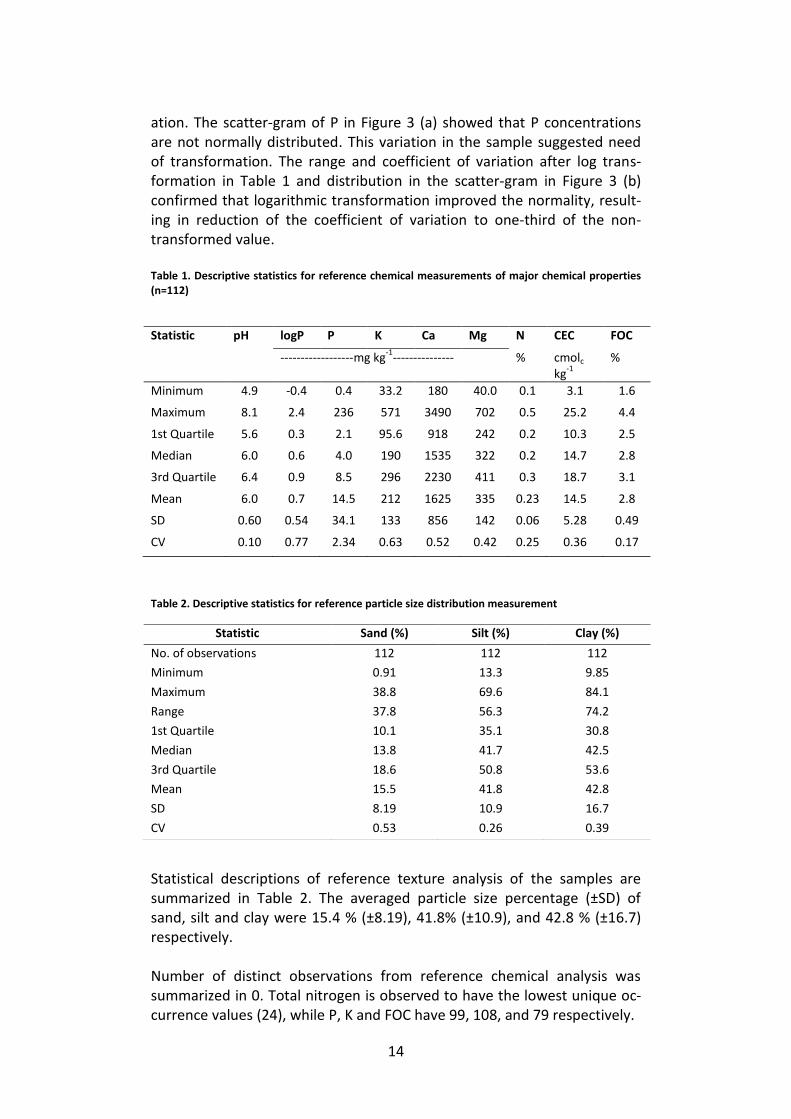
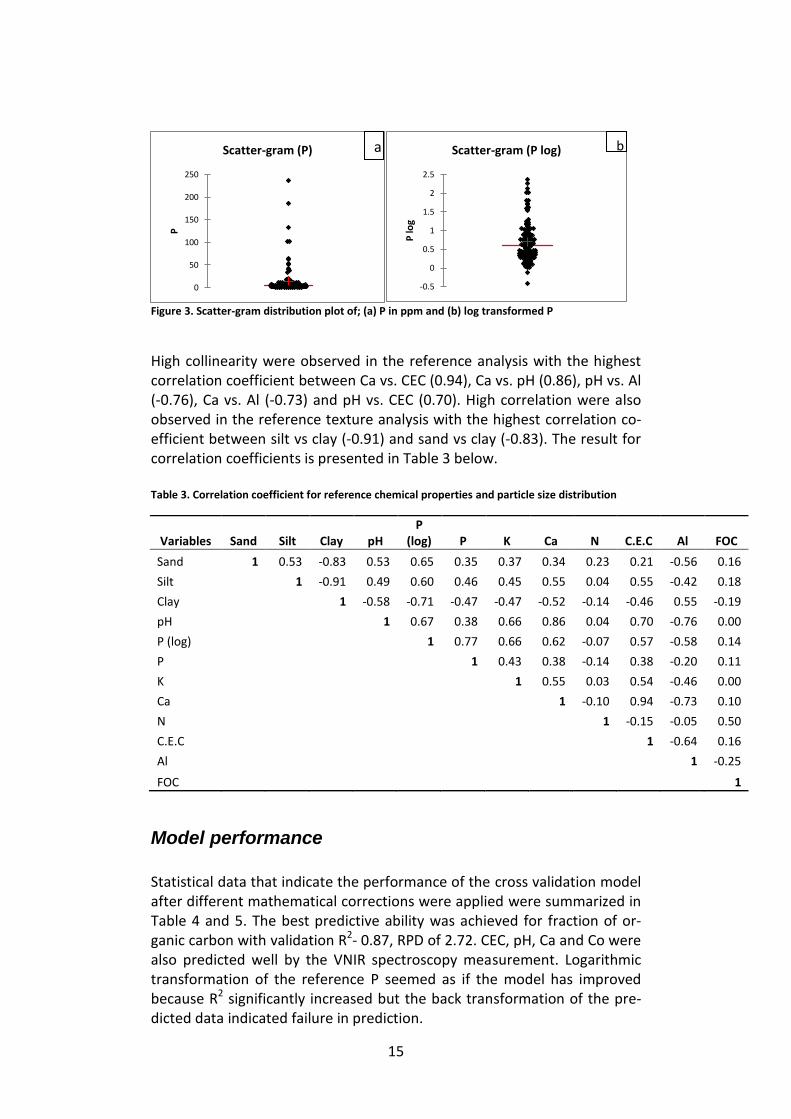
14
ation. The scatter-gram of P in Figure 3 (a) showed that P concentrations are not normally distributed. This variation in the sample suggested need of transformation. The range and coefficient of variation after log trans-formation in Table 1 and distribution in the scatter-gram in Figure 3 (b) confirmed that logarithmic transformation improved the normality, result-ing in reduction of the coefficient of variation to one-third of the non-transformed value. Table 1. Descriptive statistics for reference chemical measurements of major chemical properties (n=112)
Table 2. Descriptive statistics for reference particle size distribution measurement
Statistical descriptions of reference texture analysis of the samples are summarized in Table 2. The averaged particle size percentage (±SD) of sand, silt and clay were 15.4 % (±8.19), 41.8% (±10.9), and 42.8 % (±16.7) respectively. Number of distinct observations from reference chemical analysis was summarized in 0. Total nitrogen is observed to have the lowest unique oc-currence values (24), while P, K and FOC have 99, 108, and 79 respectively.
Statistic pH logP P K Ca Mg N CEC FOC
------------------mg kg-1
--------------- % cmolc kg
-1
%
Minimum 4.9 -0.4 0.4 33.2 180 40.0 0.1 3.1 1.6
Maximum 8.1 2.4 236 571 3490 702 0.5 25.2 4.4
1st Quartile 5.6 0.3 2.1 95.6 918 242 0.2 10.3 2.5
Median 6.0 0.6 4.0 190 1535 322 0.2 14.7 2.8
3rd Quartile 6.4 0.9 8.5 296 2230 411 0.3 18.7 3.1
Mean 6.0 0.7 14.5 212 1625 335 0.23 14.5 2.8
SD 0.60 0.54 34.1 133 856 142 0.06 5.28 0.49
CV 0.10 0.77 2.34 0.63 0.52 0.42 0.25 0.36 0.17
Statistic Sand (%) Silt (%) Clay (%)
No. of observations 112 112 112
Minimum 0.91 13.3 9.85
Maximum 38.8 69.6 84.1
Range 37.8 56.3 74.2
1st Quartile 10.1 35.1 30.8
Median 13.8 41.7 42.5
3rd Quartile 18.6 50.8 53.6
Mean 15.5 41.8 42.8
SD 8.19 10.9 16.7
CV 0.53 0.26 0.39
15
Figure 3. Scatter-gram distribution plot of; (a) P in ppm and (b) log transformed P
High collinearity were observed in the reference analysis with the highest correlation coefficient between Ca vs. CEC (0.94), Ca vs. pH (0.86), pH vs. Al (-0.76), Ca vs. Al (-0.73) and pH vs. CEC (0.70). High correlation were also observed in the reference texture analysis with the highest correlation co-efficient between silt vs clay (-0.91) and sand vs clay (-0.83). The result for correlation coefficients is presented in Table 3 below. Table 3. Correlation coefficient for reference chemical properties and particle size distribution
Variables Sand Silt Clay pH P
(log) P K Ca N C.E.C Al FOC
Sand 1 0.53 -0.83 0.53 0.65 0.35 0.37 0.34 0.23 0.21 -0.56 0.16
Silt
1 -0.91 0.49 0.60 0.46 0.45 0.55 0.04 0.55 -0.42 0.18
Clay
1 -0.58 -0.71 -0.47 -0.47 -0.52 -0.14 -0.46 0.55 -0.19
pH
1 0.67 0.38 0.66 0.86 0.04 0.70 -0.76 0.00
P (log)
1 0.77 0.66 0.62 -0.07 0.57 -0.58 0.14
P
1 0.43 0.38 -0.14 0.38 -0.20 0.11
K
1 0.55 0.03 0.54 -0.46 0.00
Ca
1 -0.10 0.94 -0.73 0.10
N
1 -0.15 -0.05 0.50
C.E.C
1 -0.64 0.16
Al
1 -0.25
FOC 1
Model performance
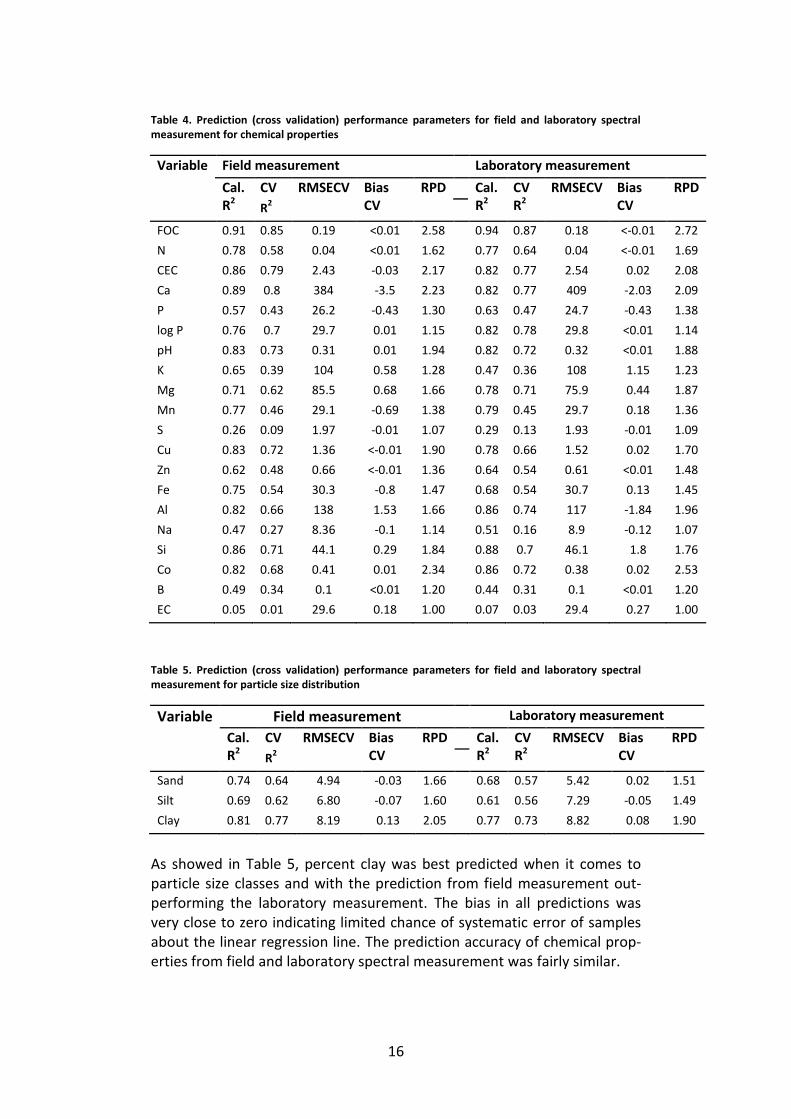
Statistical data that indicate the performance of the cross validation model after different mathematical corrections were applied were summarized in Table 4 and 5. The best predictive ability was achieved for fraction of or-ganic carbon with validation R2- 0.87, RPD of 2.72. CEC, pH, Ca and Co were also predicted well by the VNIR spectroscopy measurement. Logarithmic transformation of the reference P seemed as if the model has improved because R2 significantly increased but the back transformation of the pre-dicted data indicated failure in prediction.
0
50
100
150
200
250 P
Scatter-gram (P)
-0.5
0
0.5
1
1.5
2
2.5
P lo
g
Scatter-gram (P log) b a
16
Table 4. Prediction (cross validation) performance parameters for field and laboratory spectral measurement for chemical properties
Variable Field measurement Laboratory measurement
Cal. R2
CV RMSECV Bias CV
RPD Cal. R2
CV R2
RMSECV Bias CV
RPD
R2
FOC 0.91 0.85 0.19 <0.01 2.58 0.94 0.87 0.18 <-0.01 2.72
N 0.78 0.58 0.04 <0.01 1.62 0.77 0.64 0.04 <-0.01 1.69
CEC 0.86 0.79 2.43 -0.03 2.17 0.82 0.77 2.54 0.02 2.08
Ca 0.89 0.8 384 -3.5 2.23 0.82 0.77 409 -2.03 2.09
P 0.57 0.43 26.2 -0.43 1.30 0.63 0.47 24.7 -0.43 1.38
log P 0.76 0.7 29.7 0.01 1.15 0.82 0.78 29.8 <0.01 1.14
pH 0.83 0.73 0.31 0.01 1.94 0.82 0.72 0.32 <0.01 1.88
K 0.65 0.39 104 0.58 1.28 0.47 0.36 108 1.15 1.23
Mg 0.71 0.62 85.5 0.68 1.66 0.78 0.71 75.9 0.44 1.87
Mn 0.77 0.46 29.1 -0.69 1.38 0.79 0.45 29.7 0.18 1.36
S 0.26 0.09 1.97 -0.01 1.07 0.29 0.13 1.93 -0.01 1.09
Cu 0.83 0.72 1.36 <-0.01 1.90 0.78 0.66 1.52 0.02 1.70
Zn 0.62 0.48 0.66 <-0.01 1.36 0.64 0.54 0.61 <0.01 1.48
Fe 0.75 0.54 30.3 -0.8 1.47 0.68 0.54 30.7 0.13 1.45
Al 0.82 0.66 138 1.53 1.66 0.86 0.74 117 -1.84 1.96
Na 0.47 0.27 8.36 -0.1 1.14 0.51 0.16 8.9 -0.12 1.07
Si 0.86 0.71 44.1 0.29 1.84 0.88 0.7 46.1 1.8 1.76
Co 0.82 0.68 0.41 0.01 2.34 0.86 0.72 0.38 0.02 2.53
B 0.49 0.34 0.1 <0.01 1.20 0.44 0.31 0.1 <0.01 1.20
EC 0.05 0.01 29.6 0.18 1.00 0.07 0.03 29.4 0.27 1.00
Table 5. Prediction (cross validation) performance parameters for field and laboratory spectral measurement for particle size distribution
Variable Field measurement Laboratory measurement
Cal. R2
CV RMSECV Bias CV
RPD Cal. R2
CV R2
RMSECV Bias CV
RPD
R2
Sand 0.74 0.64 4.94 -0.03 1.66 0.68 0.57 5.42 0.02 1.51
Silt 0.69 0.62 6.80 -0.07 1.60 0.61 0.56 7.29 -0.05 1.49
Clay 0.81 0.77 8.19 0.13 2.05 0.77 0.73 8.82 0.08 1.90
As showed in Table 5, percent clay was best predicted when it comes to particle size classes and with the prediction from field measurement out-performing the laboratory measurement. The bias in all predictions was very close to zero indicating limited chance of systematic error of samples about the linear regression line. The prediction accuracy of chemical prop-erties from field and laboratory spectral measurement was fairly similar.
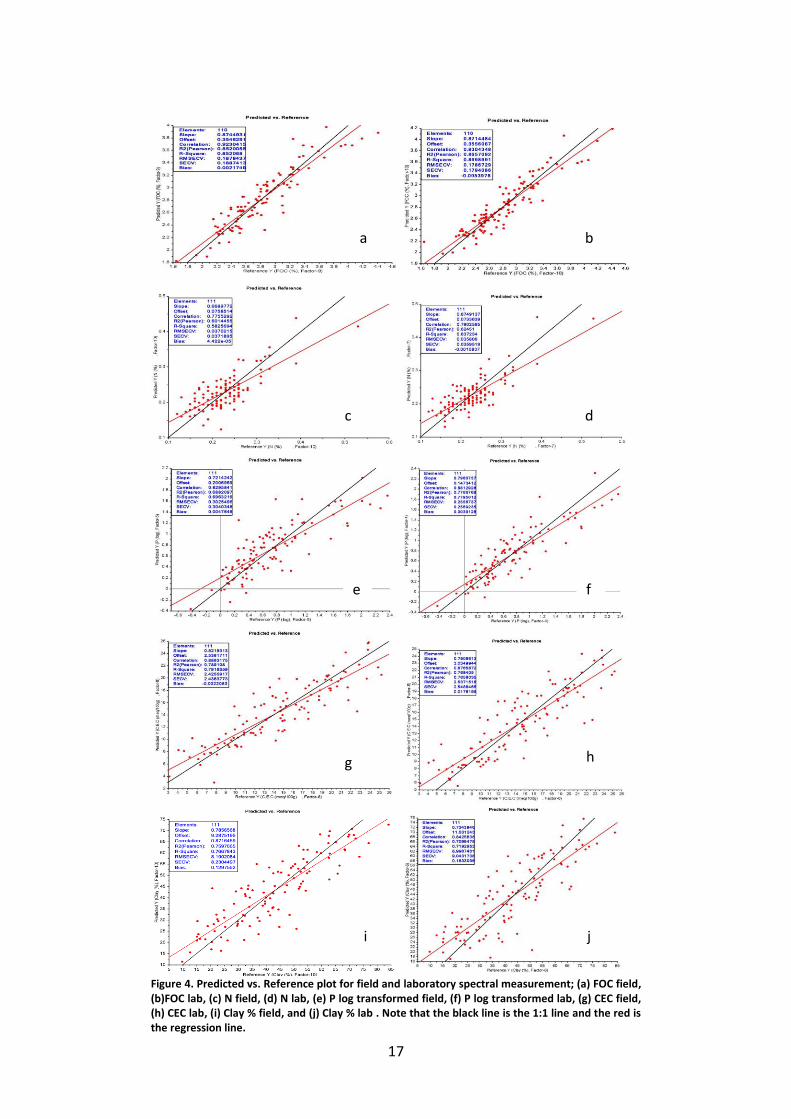
17
Figure 4. Predicted vs. Reference plot for field and laboratory spectral measurement; (a) FOC field, (b)FOC lab, (c) N field, (d) N lab, (e) P log transformed field, (f) P log transformed lab, (g) CEC field, (h) CEC lab, (i) Clay % field, and (j) Clay % lab . Note that the black line is the 1:1 line and the red is the regression line.
a b
c d
e f
g h
i j
18
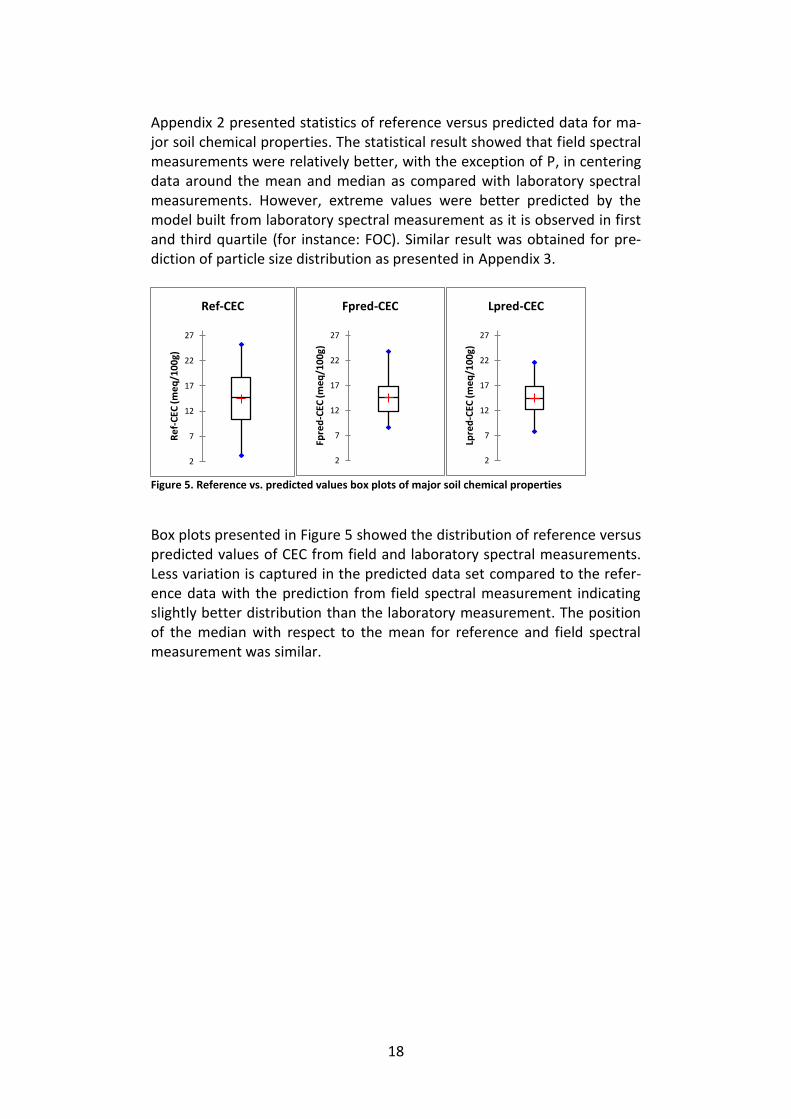
Appendix 2 presented statistics of reference versus predicted data for ma-jor soil chemical properties. The statistical result showed that field spectral measurements were relatively better, with the exception of P, in centering data around the mean and median as compared with laboratory spectral measurements. However, extreme values were better predicted by the model built from laboratory spectral measurement as it is observed in first and third quartile (for instance: FOC). Similar result was obtained for pre-diction of particle size distribution as presented in Appendix 3.
Figure 5. Reference vs. predicted values box plots of major soil chemical properties
Box plots presented in Figure 5 showed the distribution of reference versus predicted values of CEC from field and laboratory spectral measurements. Less variation is captured in the predicted data set compared to the refer-ence data with the prediction from field spectral measurement indicating slightly better distribution than the laboratory measurement. The position of the median with respect to the mean for reference and field spectral measurement was similar.
2
7
12
17
22
27
Re
f-C
EC (
me
q/1
00
g)
Ref-CEC
2
7
12
17
22
27
Fpre
d-C
EC (m
eq
/10
0g)
Fpred-CEC
2
7
12
17
22
27
Lpre
d-C
EC (
me
q/1
00
g)
Lpred-CEC
19
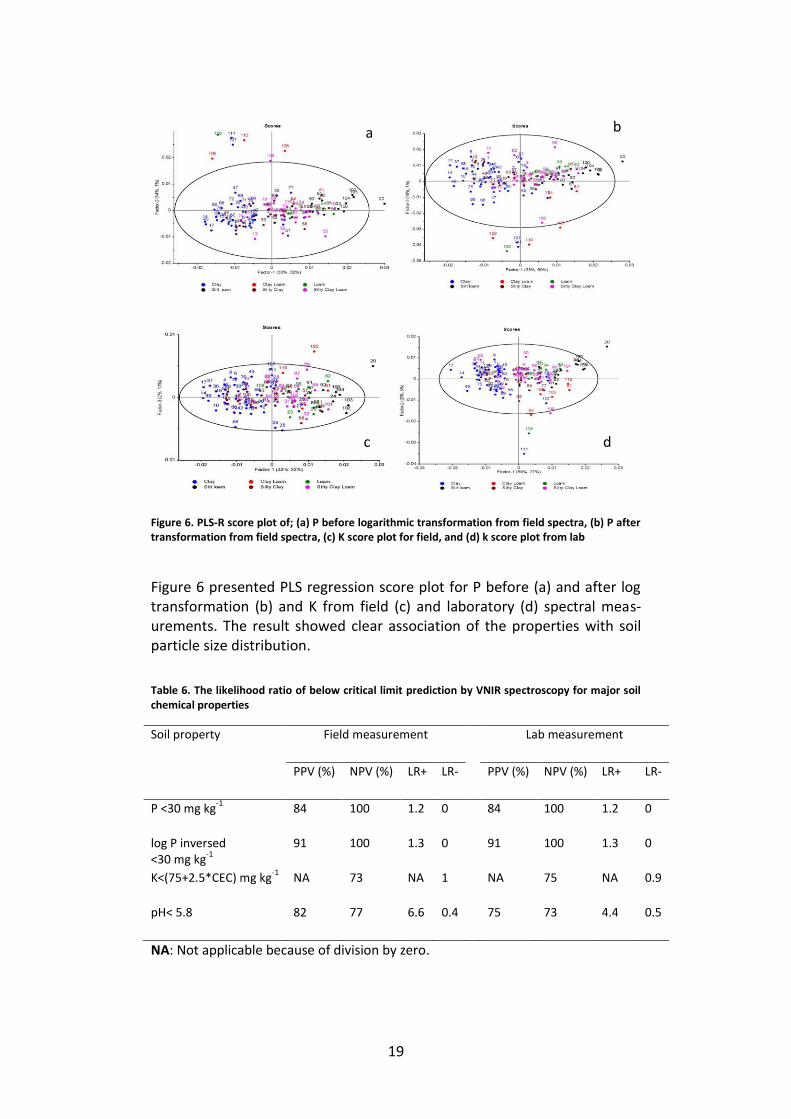
Figure 6. PLS-R score plot of; (a) P before logarithmic transformation from field spectra, (b) P after transformation from field spectra, (c) K score plot for field, and (d) k score plot from lab
Figure 6 presented PLS regression score plot for P before (a) and after log transformation (b) and K from field (c) and laboratory (d) spectral meas-urements. The result showed clear association of the properties with soil particle size distribution.
Table 6. The likelihood ratio of below critical limit prediction by VNIR spectroscopy for major soil chemical properties
Soil property Field measurement Lab measurement
PPV (%) NPV (%) LR+ LR- PPV (%) NPV (%) LR+ LR-
P <30 mg kg-1
84 100 1.2 0 84 100 1.2 0
log P inversed <30 mg kg
-1
91 100 1.3 0 91 100 1.3 0
K<(75+2.5*CEC) mg kg-1
NA 73 NA 1 NA 75 NA 0.9
pH< 5.8 82 77 6.6 0.4 75 73 4.4 0.5
NA: Not applicable because of division by zero.
a
d c
b
20
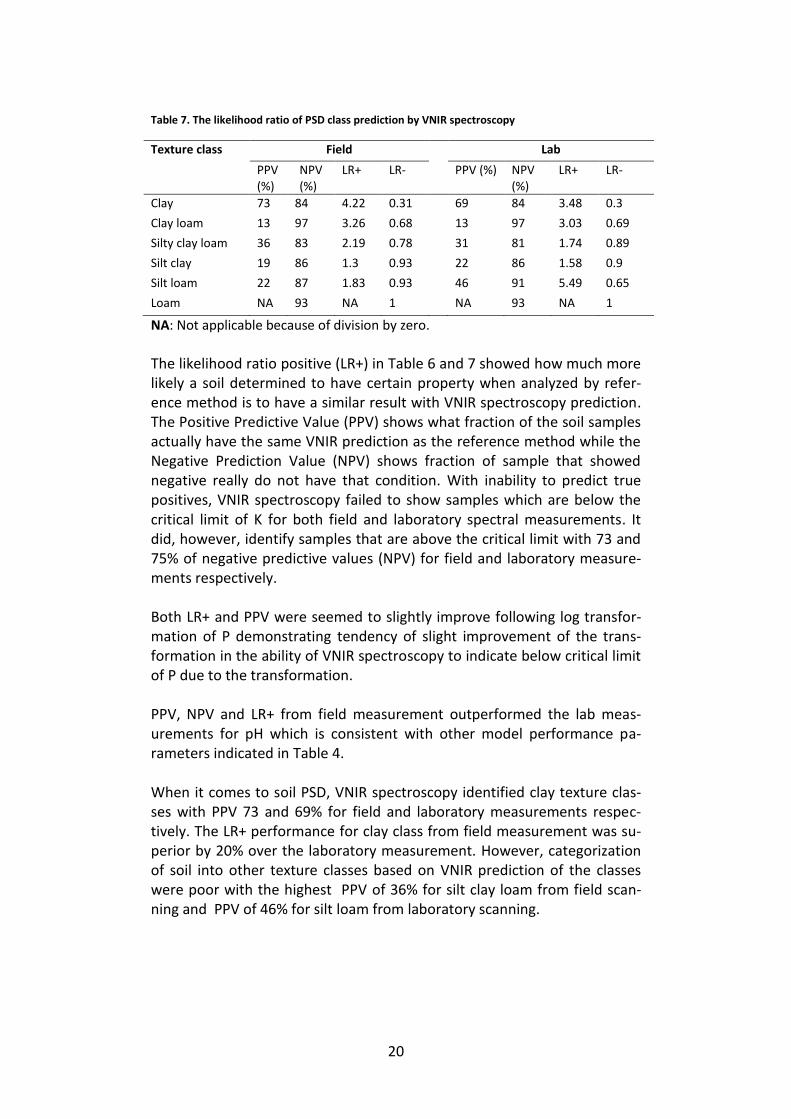
Table 7. The likelihood ratio of PSD class prediction by VNIR spectroscopy
Texture class Field Lab
PPV (%)
NPV (%)
LR+ LR- PPV (%) NPV (%)
LR+ LR-
Clay 73 84 4.22 0.31 69 84 3.48 0.3
Clay loam 13 97 3.26 0.68 13 97 3.03 0.69
Silty clay loam 36 83 2.19 0.78 31 81 1.74 0.89
Silt clay 19 86 1.3 0.93 22 86 1.58 0.9
Silt loam 22 87 1.83 0.93 46 91 5.49 0.65
Loam NA 93 NA 1 NA 93 NA 1
NA: Not applicable because of division by zero.
The likelihood ratio positive (LR+) in Table 6 and 7 showed how much more likely a soil determined to have certain property when analyzed by refer-ence method is to have a similar result with VNIR spectroscopy prediction. The Positive Predictive Value (PPV) shows what fraction of the soil samples actually have the same VNIR prediction as the reference method while the Negative Prediction Value (NPV) shows fraction of sample that showed negative really do not have that condition. With inability to predict true positives, VNIR spectroscopy failed to show samples which are below the critical limit of K for both field and laboratory spectral measurements. It did, however, identify samples that are above the critical limit with 73 and 75% of negative predictive values (NPV) for field and laboratory measure-ments respectively. Both LR+ and PPV were seemed to slightly improve following log transfor-mation of P demonstrating tendency of slight improvement of the trans-formation in the ability of VNIR spectroscopy to indicate below critical limit of P due to the transformation. PPV, NPV and LR+ from field measurement outperformed the lab meas-urements for pH which is consistent with other model performance pa-rameters indicated in Table 4. When it comes to soil PSD, VNIR spectroscopy identified clay texture clas-ses with PPV 73 and 69% for field and laboratory measurements respec-tively. The LR+ performance for clay class from field measurement was su-perior by 20% over the laboratory measurement. However, categorization of soil into other texture classes based on VNIR prediction of the classes were poor with the highest PPV of 36% for silt clay loam from field scan-ning and PPV of 46% for silt loam from laboratory scanning.
21
Discussion The laboratory measurements were expected to produce the most accu-rate prediction because the samples were well homogenized. However, the in situ model performed slightly better for soil particle size distribution (texture) and few chemical properties such as CEC and Ca. This was con-firmed by R2, RPD, LR+ and PPV obtained. One possible explanation for this could be the lower number of scans per sample carried out and as a result potentially less useful information might have been captured. The other alternative and more likely explanation is that the removal of moisture during air-drying which took away the free water bound to particle surfac-es had an impact on the spectral information. Since PLS regression is a modeling method that exploits covariance, reduction of water adsorption might have affected the prediction of soil properties associated to water. This explanation is verified by the spectral shape observed in NIR wave-lengths associated with water absorption in Figure 2 (c) and (d) and their derivative in (e) and (f). It is generally recognized that the wavelength re-gion around 1450 and 1940 nm are dominated by NIR absorption by O-H bond vibrations. It is also recognized that absorbance of NIR across the entire 1100 to 2500 nm range increases with increasing soil water content (Bullock et al., 2004). Therefore, the better performance observed for the models built from field measurements were more likely due to co-variation of the soil properties with soil moisture. The influence of moisture on soil spectra is at the center of discussion when it comes to field spectral measurement. It is well known that with increasing moisture content, soil becomes darker, resulting in increasing light absorption (Lobell and Asner, 2002 ;Stenberg et al., 2010). Some lit-erature explained that field spectra were not influenced by soil moisture just because there was no precipitation event before and during spectral measurement (Nocita et al., 2011). Another study, however, suggested a critical moisture level of 5-10% above which accuracy becomes lower (Tekin et al., 2012). In the later reference, it was reported that the regres-sion coefficients were larger for dry models indicating more significant wavelength bands than in the corresponding wet models. The report also claimed that the regression coefficients for moisture contents greater than 10 % were identical and hence pointed out 10% as critical level. The results obtained in this study, however, cannot confirm either of the claims since data on moisture content was not collected. However, consistent results with similar studies conducted under field condition was obtained for most of the properties (Cozzolino et al., 2013 ;Waiser et al., 2007).
Prediction of chemical properties
VNIR spectroscopy was able to predict FOC accurately (Figure 4(a) and (b) and Table 4). The results for the cross validation analysis of the field and
22
laboratory spectral measurement were very similar. The R2 for both were higher than 0.85 and RMSECV and RPD were 0.19 and 2.58 respectively for field and 0.18 and 2.72 for laboratory data. The higher R2, smaller RMSECV, and large RPD indicated that VNIR spectroscopy can be used to estimate FOC in soil from in situ spectral measurement. This result was consistent with literature (Cozzolino and Morón, 2006 ;Morra et al., 1991 ;Amare et al., 2013) where it was demonstrated that VNIR spectroscopy predicted organic carbon accurately. In study carried out in Ethiopia, Amare et al.(2013) reported RMSECV value that range from 0.15 to 0.53 indicating that the result from this study is fairly reliable. Although the validation R2 values obtained for N were 0.58 and 0.64 at field and laboratory measurements respectively, the RMSECV and RPD value indicated that the performance of the model was acceptable. The relatively poor R2 value might have resulted from the poorly distributed reference data set with a small concentration range, rather than the inability of VNIR spectroscopy to predict N. Appendix 1 showed the occurrence of distinct values of N using the reference analysis technique. Since PLS regression is a technique that intervene in the decomposition of the predictor from the data structure of the response variable (Esbensen et al., 2002), less varia-tion in the response variable means underutilization of information stored in the predictor. Considering the fact that N was reported to have high suc-cess in prediction using VNIR spectroscopy (Chang and Laird, 2002 ;Morra et al., 1991 ;Stenberg et al., 2010), together with less RMSECV and RPD values >1.6 from this study, there seem to be a possibility to predict N from in situ spectral measurement using VNIR spectroscopy. A study on refer-ence dataset with a range and mean value of 0.10-0.39 and 0.18 respec-tively have obtained a RMSECV value of 0.02(Terhoeven-Urselmans et al., 2008) indicating the result from this study could be acceptable. There was no such significant difference between prediction performance of field and laboratory spectral measurement for FOC, N and pH. This could be explained by the absorption features associated with FOC and N. Bands around 1100, 1600, 1700 to 1800, 2000, and 2200 to 2400 nm have been identified as being particularly important for FOC and total N calibration (Stenberg et al., 2010), with the most active spectral region between 2000 and 2450 nm (Tekin et al., 2012). This study revealed that the active band region (2000 – 2450 nm) in both field and laboratory has similar absorption peaks as presented in Figure 2 (e) and (f). Since FOC and N are spectrally active by themselves, their prediction were not that much affected by the level of soil moisture. When it comes to pH, Tekin et al. (2012) identified that the position of wavelengths significant for FOC and pH prediction is almost identical, although the depth or height of these bands are much larger for FOC than pH. This explains why there was no significant differ-ence in performance of FOC, N and pH prediction between field and labor-atory spectral measurement.
23
The large coefficient of variation obtained for reference P analysis (Table 1) indicated that this chemical property was affected by extreme values. This was verified by the wide concentration range observed for P. It could be associated with the fact that the soil samples used in the current study were collected from different land use areas (agricultural field, forest, and pasture land). The extreme values skewed the distribution as shown in Figure 3 (a) and hence transformation was needed to make the distribution fairly symmetrical. Based on the recommendation for variables with range of more than one magnitude (Wold et al., 2001), logarithmic transfor-mation of reference phosphorus value were carried out. The logarithmic transformation of the data, as showed in Table 1 and Figure 3 (b), normal-ized the skewed data. The explained variation in phosphorus data by the first two PLS components were doubled as a result of the transformation while the same percent of variation were explained in the spectral data (Figure 6). The result of the transformation was that model performance for soil P seemed as if it has improved because R2 has significantly improved from 0.43 to 0.70 and 0.47 to 0.78 for field and laboratory measurements re-spectively. However, the RMSECV values computed from the back trans-formed data of P demonstrated failure of the transformation because the RMSECV obtained appeared to increase from 26.2 to 29.7 and 24.7 to 29.8 for field and laboratory measurements respectively. The improvement was mainly the degree of explained variance as showed by the first two PLS components presented in Figure 6 (a) and (b) which consequently im-proved R2 value. The descriptive statistics in Appendix 2 were also comput-ed from the inverse transformation of predicted P values. The slight im-provement observed in the tendency of predicting below critical limit of P (LR+ and PPV) following log transformation could probably be a result of that the transformation has improved predictability of lower concentration as observed in the predicted dataset. It is also observed that the extreme values (higher values) were not predicted well by either of the model. As a result of failure to predict the extreme values, the mean of the predicted values were less than by a factor of two compared to the mean of the ref-erence data. The position of extreme samples on the regression line of prediction versus reference plot in Figure 4 (e) and (f) was examined. The results revealed the influence of the extreme samples were that they are systematically arranged parallel to the target (1:1) line. Computation carried out on the raw dataset of P indicated that the per-formance of laboratory model was better than that of the field model. This could probably be explained by the crushing of soil aggregates in laborato-ry exposed interior surfaces of the soil. Light in the VNIR only slightly pene-trates the surface of the soil under normal conditions. Thus, in the factions where the soils were broken up by hand or with a mortar, VNIR spectra reflect phosphorous adsorbed particles. Other studies of VNIR spectrosco-

24
py for mineral analysis suggested the likelihood of this explanation (Wu et al., 2009). For K, calibration with raw data and various transformations of the spectra and reference data failed to produce a useful model. This was confirmed by the low R2, high RMSECV and low RPD values obtained. Based on Chang et al. (2001) categorization of prediction performance from RPD values, K prediction using VNIR spectroscopy was poor and only high and low values were distinguished. Although the inaccurate prediction of K achieved in this study is consistent with some findings by other researchers (He et al., 2007), others have reported calibration success (Mouazen et al., 2006). The success reported might be due to locally co-varying spectrally active substances as discussed above. The prediction abilities obtained at field and laboratory for pH, Ca, CEC, Al, Co, Si, Cu, and Mg were similar and ranges from good to very good predic-tion (Table 4). The result indicated these chemical properties can be pre-dicted in situ using VNIR spectroscopy. Stenberg et al. (2010) and Rossel et al. (2006) explained the association of these soil properties with VNIR spec-tra. They stated that successful calibration might be attributed to locally present co-variation to spectrally active constituents. PLS regression load-ing weight vectors and regression coefficients were suggested to be indica-tors of the correlation between the VNIR and the soil constituents of inter-est (Stenberg et al., 2010 ;Viscarra Rossel et al., 2006). The results from this study were consistent with their studies as the score plots indicated association of these properties with particle size distribution (for example: Figure 6). EC, B, S, Zn, and Mn were not predicted well neither by the field nor by the laboratory measurements. Taking into account the observed variation in the reference dataset of Ca, CEC and pH, the RMSECV obtained for these important soil properties in this study were considered adequate when compared to reported calibration success in literature (Chang et al., 2001 ;Cozzolino and Morón, 2006 ;Dunn et al., 2002). Box plots presented in Figure 5 showed the distribution of reference versus predicted values from field and laboratory spectral measurements. From the presented box plots and the statistical data in Appendix 2 and 3, pre-diction from field spectral measurements can provide information regard-ing the quality of the soil. Although the performances of the field measurements were similar to la-boratory measurements performances for major soil properties, prediction of extreme values by the field model did not result in much better statistics as presented in Appendix 2 and 3. This could be explained by how relevant wavelengths of the property in question were given importance in the model. Slight differences were observed in the regression coefficient plots (data not presented) of field and laboratory measurements.
25
Table 6 showed 6.6 and 4.4 LR+ for prediction of critical pH (pH<5.8 as used by EthioSIS) from field and laboratory measurements respectively. LR+ be-tween 5 and 10 is assumed as moderate while between 2 and 5 is expected to generate a small but sometimes important change in probability in clini-cal diagnosis. Likelihood ratio negative (LR-) above 0.5 is considered to pro-vide insufficient evidence of prediction (Gordon et al., 2003). However, the LR test is more important in clinical diagnosis where false positive tests for rare diseases are an important problem. Literature was not found as to how these thresholds should be used for VNIR spectroscopy predicted soil chemical and physical properties diagnosis. Hence, the same range as in medical diagnosis is used to determine the likelihood of VNIR spectroscopy to suggest below critical limit of soil chemical property. Therefore, accord-ing to the ratios obtained, the LR+ achieved for pH showed that the likeli-hood of predicting a pH below the critical limit was moderate for field measurements while it was slightly smaller for laboratory measurements. The result explained in other way, samples with pH of less than the critical limit are 6.6 and 4.4 times more likely to be predicted less than the critical limit by VNIR spectroscopy than those which are above the critical limit for field and laboratory spectral measurements respectively. This result was consistent with other model parameters where slightly better performance was achieved from field measurements. Even though the LR+ greater 1 achieved for P indicates an increased probability of determining critical limit, the result was poor and did not sufficiently discriminate between less than and above critical limit values. The result obtained for K was not ap-plicable and hence VNIR spectroscopy is not recommended for determina-tion of K in relation to the critical value.
Prediction of soil particle size
Predictions of soil particle size distribution using VNIR spectroscopy analy-sis showed that the best prediction ability was achieved for field spectral measurements. A study which had the same purpose as this one found a similar result (Waiser et al., 2007). According to them, and contrary to the explanation given for chemical properties, the amount of water in the soil sample did not change the prediction accuracy of soil particle size distribu-tion. The improved result was instead explained by the possibility that the in situ soil has a higher bulk density than air dried soil. Therefore, the in situ soil may have a stronger reflectance signal (Waiser et al., 2007). Table 5 summarized the prediction accuracies between visible region spec-tra and laboratory reference particle size distribution analysis. The best predictive ability was achieved for clay particle size with R2=0.77 and RPD of 2.05 at field measurement. Silt and sand percentage prediction from field measurement of spectra was fairly successful R2≥0.62 and RPD≥1.6 and they were better than the predictions achieved from spectral meas-urement in lab.
26
Another interesting feature investigated in this study was the predictive performance from utilization of either the whole range of VNIR or only the visible region to predict soil particle size distribution. The result obtained was that performance was improved when only the visible region was used. This could be explained by the fact that soil color has gradients, which are parallel to soil texture (Kone et al., 2009). Soil color is due to its iron and organic matter contents which have distinctive spectral signature in the visible region. The presence of specific minerals can also affect soil color. Certain soil aggregate size classes may be associated with different quantities of organic matter (Vågen et al., 2010). Hence it is possible to determine particle size distribution from capturing information regarding soil color (Kone et al., 2009). Beyond the differences in color, fundamental absorption in reflectance spectra occurs at energy levels that allow mole-cules to rise to higher vibrational state. Electronic excitations are the main processes as the energy of the radiation is high in the visible region. These absorptions are primarily associated with minerals that contain iron (e.g., haematite, goethite) (Stenberg et al., 2010). Previous studies such as that of Waiser et al. (2007), Rossel et.al (2006) and Stenberg et.al (2010), reported better predictions using the whole range of VNIR as compared to only the visible range. According to these reports, clay minerals show absorption in the NIR region due to metal-OH bend plus O–H stretch combinations. Crystal water and OH in the clay mineral lattice are also reported to have absorption in the NIR region (Stenberg et al., 2010). Silica O-Si-O stretching and bending overtone and combination bands also occur in VNIR region which are useful for quantitative analysis of particle size distribution (Vågen et al., 2010). However, unlike these reports, this study did not find improved prediction from the whole range of VNIR. This could be attributed to the difference in reference method utilized for determination of particle size distribution in the studies. Waiser et al. (2007), for instance, used the pipette method as a reference method. Studies showed less than satisfactory relation between laser-diffraction and pipette derived data with R2 of 0.70, 0.69 and 0.82 for clay, silt and sand respectively (Eshel et al., 2004). Prediction performance from whole range and visible range with various pretreatment was presented in 0 for reference. Soil texture class was determined from VNIR spectroscopy validation data using USDA soil texture classification. The LR+ and LR- were calculated and presented in Table 7. The result showed that VNIR spectroscopy predicted clay texture class better than other classes with 4.22 and 3.48 LR+ from field and laboratory spectral measurements respectively. Thus, samples with clay texture class are 4.22 and 3.48 times more likely to be predicted as clay texture by VNIR spectroscopy than those which are not clay for field and laboratory spectral measurements respectively. Moderate prediction

27
evidence was also observed for clay loam and silt clay loam prediction as presented in Table 7. The low PPV achieved indicated an inability of VNIR spectroscopy to cor-rectly classify samples which are not clay into their respective class. The high NPV, on the other hand, showed that samples which were predicted as not in the range set were more likely not in that range which is probably as a result of adequate prediction of clay samples.
Chemical properties vs. particle size distributions
Clays are important adsorbents of water and dissolved plant nutrients in the soil from the presence of unbalanced electrical charges on their sur-face. This fact was evidently observed from the grouping of the soil sam-ples according to their textural class on the score plots from PLS regres-sions. This was the case even for those properties that VNIR spectroscopy did not accurately predict such as K as presented in Figure 6 (c) and (d). This confirmed the association of soil nutrients to soil texture and the abil-ity of VNIR spectroscopy to capture the co-varying information both in the field and in the laboratory.
PLS-1 vs PLS-2 regression
The manner in which the reference analysis results were interrelated was presented in Table 3. It demonstrated that there was a perfect correlation and linear relationship among the dependent variables. The significant collinearity among them resulted in surrogate calibrations of PLS2 that are actually based on the most dominant collinear analyte (Cozzolino et al., 2013) without extracting additional attractive information among them. This inhibited PLS2 to outperform PLS1 regression technique in this study. However, the variability observed in the data of the soil samples was suffi-cient for performing PLS1.
Conclusions The study tried to compare prediction of major soil chemical and physical properties from spectra measured in the field and laboratory using VNIR spectroscopy. In both cases, adequate performances were achieved (RPD≥2 and R2 > 0.7) for prediction of FOC, pH, Ca, CEC, Co and %clay. Considering the small concentration range and occurrence of distinct value of N together with previous success in literature, the predictive perfor-mance achieved for N was considered acceptable. The prediction for Al, Cu, Mg, and Si were also good.
28
The study demonstrated prediction from field spectral measurement was slightly better for soil particle size distribution (soil texture) and some chemical properties than that of laboratory measurement. Properties that showed better prediction performance from laboratory measurement did not show significant difference from field measurements prediction. There-fore, the instrument can be used for rapid soil assessment from in situ spectral measurement for the above mentioned soil parameters. Rapid field assessment offers an advantage of economy and information neces-sary for immediate decision making. The result also serves as an awareness creation platform regarding the potential ability of VNIR spectroscopy in the field. Considering the sampling scheme followed in this study, there might be semi replications within the data set. That means the similarity between the pairs might be high and as cross validation was applied the pair might be represented in calibration and validation set causing over optimistic validation results. Model performance of K prediction was below the acceptable range and therefore VNIR spectroscopy use for K prediction is not recommended. In addition, if the aim is to determine below critical limit of P in soils, VNIR spectroscopy is not a recommended method to do so. Since both K and P are important parameters in soil quality assessment more work is needed to improve IR spectroscopy based predictions of these parameters. Although the prediction models were statistically acceptable, further re-search is needed since the extreme values were not predicted well by ei-ther of the models built from spectra measured in the field and laboratory. It might also be necessary to consider simple soil treatment in the field such as breaking soil aggregates by hand to expose interior surfaces. Future work should also take into account soil moisture measurement and model-ing soil samples from different land-uses and agronomic management practices separately.
Acknowledgments I am very much grateful to my supervisor Erik Karltun for his patience, en-couragement, proper guidance and advice he has provided me throughout the study. His careful correction contributed enormously to the production of this thesis. I also had the luxury of staying at his place for free during the entire period of the field work in Ethiopia and would like to thank him. I would like to thank the Ethiopian Agricultural Transformation Agency (ATA) for allowing me to take up this project and for providing me all the
29
resources I needed during the field work. Additionally, I would like to thank the field staff of ATA for the interesting discussions, some humor and en-tertainment and for all the fun we have had during soil sampling. I would also like to thank the Ethiopian National Soil Testing Center (NSTC) for the permission they gave me to use all the required equipment to ana-lyze soil particle size distribution (PSD). I would like to acknowledge the crucial role of the staff at NSTC during the PSD analysis. My master’s study would not have been possible without the financial sup-port of the Swedish institute (SI). Thank you so much! I would also like to thank the Swedish Ministry of Foreign Affairs for financing my field work in Ethiopia.
References ABDI, D., TREMBLAY, G. F., ZIADI, N., BELANGER, G. & PARENT,
L.-E. 2012. Predicting Soil Phosphorus-Related Properties Using Near-Infrared Reflectance Spectroscopy. Soil Science Society of America Journal, 76, 2318-2326.
ABDI, H. 2003. Partial least square regression (PLS regression). Thousand Oaks, CA: Sage.
AMARE, T., HERGARTEN, C., HURNI, H., WOLFGRAMM, B., YITAFERU, B. & SELASSIE, Y. G. 2013. Prediction of Soil Organic Carbon for Ethiopian Highlands Using Soil Spectroscopy. ISRN Soil Science, 2013.
BATTEN, G. 1998. Plant analysis using near infrared reflectance spectroscopy: the potential and the limitations. Animal Production Science, 38, 697-706.
BELLON-MAUREL, V., FERNANDEZ-AHUMADA, E., PALAGOS, B., ROGER, J.-M. & MCBRATNEY, A. 2010. Critical review of chemometric indicators commonly used for assessing the quality of the prediction of soil attributes by NIR spectroscopy. TrAC Trends in Analytical Chemistry, 29, 1073-1081.
BLANCO, M. & VILLARROYA, I. 2002. NIR spectroscopy: a rapid-response analytical tool. Trac-Trends in Analytical Chemistry, 21, 240-250.
BROWN, D. J., BRICKLEMYER, R. S. & MILLER, P. R. 2005. Validation requirements for diffuse reflectance soil characterization models with a case study of VNIR soil C prediction in Montana. Geoderma, 129, 251-267.
BROWN, D. J., SHEPHERD, K. D., WALSH, M. G., MAYS, M. D. & REINSCH, T. G. 2006. Global soil characterization with VNIR diffuse reflectance spectroscopy. Geoderma, 132, 273-290.
30
BULLOCK, P., LI, X. & LEONARDI, L. 2004. Near-infrared spectroscopy for soil water determination in small soil volumes. Canadian journal of soil science, 84, 333-338.
BUOL, S. W. 1995. Sustainability of soil use. Annual Review of Ecology and Systematics, 26, 25-44.
CANASVERAS, J. C., BARRON, V., DEL CAMPILLO, M. C. & ROSSEL, R. A. V. 2012. Reflectance spectroscopy: a tool for predicting soil properties related to the incidence of Fe chlorosis. Spanish Journal of Agricultural Research, 10, 1133-1142.
CHANG, C. W. & LAIRD, D. A. 2002. Near-infrared reflectance spectroscopic analysis of soil C and N. Soil Science, 167, 110-116.
CHANG, C. W., LAIRD, D. A., MAUSBACH, M. J. & HURBURGH, C. R. 2001. Near-infrared reflectance spectroscopy-principal components regression analyses of soil properties. Soil Science Society of America Journal, 65, 480-490.
CORBEELS, M., SHIFERAW, A. & HAILE, M. 2000. Farmers' knowledge of soil fertility and local management strategies in Tigray, Ethiopia. Managing Africa's Soils, ii + 23 pp.-ii + 23 pp.
COZZOLINO, D., CYNKAR, W., DAMBERGS, R., SHAH, N. & SMITH, P. 2013. In Situ Measurement of Soil Chemical Composition by Near Infrared Spectroscopy: A Tool Towards Sustainable Vineyard Management. Communications in Soil Science and Plant Analysis.
COZZOLINO, D. & MORÓN, A. 2006. Potential of near-infrared reflectance spectroscopy and chemometrics to predict soil organic carbon fractions. Soil and Tillage Research, 85, 78-85.
CRAWFORD, J. W., HARRIS, J. A., RITZ, K. & YOUNG, I. M. 2005. Towards an evolutionary ecology of life in soil. Trends in Ecology & Evolution, 20, 81-87.
DAUGHTRY, C. S. 2001. Discriminating crop residues from soil by shortwave infrared reflectance. Agronomy Journal, 93, 125-131.
DUNN, B. W., BEECHER, H. G., BATTEN, G. D. & CIAVARELLA, S. 2002. The potential of near-infrared reflectance spectroscopy for soil analysis - a case study from the Riverine Plain of south-eastern Australia. Australian Journal of Experimental Agriculture, 42, 607-614.
ESBENSEN, K., GUYOT, D., WESTAD, F. & HOUMOLLER, L. P. 2002. Multivariate data analysis-in practice: An introduction to multivariate data analysis and experimental design, Multivariate Data Analysis.
ESHEL, G., LEVY, G. J., MINGELGRIN, U. & SINGER, M. J. 2004. Critical evaluation of the use of laser diffraction for particle-size distribution analysis. Soil Science Society of America Journal, 68, 736-743.
FEENEY, D. S., CRAWFORD, J. W., DANIELL, T., HALLETT, P. D., NUNAN, N., RITZ, K., RIVERS, M. & YOUNG, I. M. 2006.
31
Three-dimensional microorganization of the soil-root-microbe system. Microbial Ecology, 52, 151-158.
FIDENCIO, P. H., POPPI, R. J. & DE ANDRADE, J. C. 2002. Determination of organic matter in soils using radial basis function networks and near infrared spectroscopy. Analytica Chimica Acta, 453, 125-134.
FROST, R. L., WILLS, R. A., MARTENS, W., WEIER, M. & REDDY, B. J. 2005. NIR spectroscopy of selected iron(II) and iron(III) sulphates. Spectrochimica Acta Part a-Molecular and Biomolecular Spectroscopy, 62, 42-50.
FUENTES, M., HIDALGO, C., GONZALEZ-MARTIN, I., HERNANDEZ-HIERRO, J. M., GOVAERTS, B., SAYRE, K. D. & ETCHEVERS, J. 2012. NIR Spectroscopy: An Alternative for Soil Analysis. Communications in Soil Science and Plant Analysis, 43, 346-356.
GORDON, I., BARKOVICS, M., PINDORIA, S., COLE, T. J. & WOOLF, A. S. 2003. Primary vesicoureteric reflux as a predictor of renal damage in children hospitalized with urinary tract infection: a systematic review and meta-analysis. Journal of the American Society of Nephrology, 14, 739-744.
HE, Y., HUANG, M., GARCÍA, A., HERNÁNDEZ, A. & SONG, H. 2007. Prediction of soil macronutrients content using near-infrared spectroscopy. Computers and Electronics in Agriculture, 58, 144-153.
HOLLAS, J. M. 2004. Modern spectroscopy, Wiley. com. HOORMAN, J., AZIZ, I., REEDER, R., SUNDERMEIER, A. & ISLAM,
R. 2011. Soil terminology and definitions. Agriculture and Natural Resources Fact Sheet. SAG-19-11, 1-8.
KARLTUN, E., LEMENIH, M. & TOLERA, M. 2013. COMPARING FARMERS' PERCEPTION OF SOIL FERTILITY CHANGE WITH SOIL PROPERTIES AND CROP PERFORMANCE IN BESEKU, ETHIOPIA. Land Degradation & Development, 24, 228-235.
KONE, B., YAO-KOUAME, A., ETTIEN, J., OIKEH, S., YORO, G. & DIATTA, S. 2009. Modelling the relationship between soil color and particle size for soil survey in ferralsol environments. Soil and Environment, 28.
LOBELL, D. B. & ASNER, G. P. 2002. Moisture Effects on Soil Reflectance. Soil Sci. Soc. Am. J., 66, 722-727.
MAITRA, S. & YAN, J. 2008. Principle component analysis and partial least squares: Two dimension reduction techniques for regression. Applying Multivariate Statistical Models, 79.
MCCARTY, G. W., REEVES, J. B., REEVES, V. B., FOLLETT, R. F. & KIMBLE, J. M. 2002. Mid-infrared and near-infrared diffuse reflectance spectroscopy for soil carbon measurement. Soil Science Society of America Journal, 66, 640-646.
MCDOWELL, M. L., BRULAND, G. L., DEENIK, J. L., GRUNWALD, S. & KNOX, N. M. 2012. Soil total carbon analysis in Hawaiian soils with visible, near-infrared and mid-infrared diffuse reflectance spectroscopy. Geoderma, 189–190, 312-320.
32
MILLER, C. E. 2001. Chemical principles of near infrared technology. Near-infrared technology in the agricultural and food industries, 2.
MOLLA, A. 2013. Farmers’ Knowledge Helps Develop Site Specific Fertilizer Rate Recommendations, Central Highlands of Ethiopia. World Applied Sciences Journal, 22, 555-563.
MORRA, M. J., HALL, M. H. & FREEBORN, L. L. 1991. CARBON AND NITROGEN ANALYSIS OF SOIL FRACTIONS USING NEAR-INFRARED REFLECTANCE SPECTROSCOPY. Soil Science Society of America Journal, 55, 288-291.
MOUAZEN, A., DE BAERDEMAEKER, J. & RAMON, H. 2006. Effect of wavelength range on the measurement accuracy of some selected soil constituents using visual-near infrared spectroscopy. Journal of near infrared spectroscopy, 14, 189-199.
NANNI, M. R. & DEMATTE, J. A. M. 2006. Spectral reflectance methodology in comparison to traditional soil analysis. Soil Science Society of America Journal, 70, 393-407.
NIEMOLLER, A. & BEHMER, D. 2008. Use of near infrared spectroscopy in the food industry. Nondestructive testing of food quality, 67-118.
NOCITA, M., KOOISTRA, L., BACHMANN, M., MÜLLER, A., POWELL, M. & WEEL, S. 2011. Predictions of soil surface and topsoil organic carbon content through the use of laboratory and field spectroscopy in the Albany Thicket Biome of Eastern Cape Province of South Africa. Geoderma, 167, 295-302.
PASQUINI, C. 2003. Near infrared spectroscopy: Fundamentals, practical aspects and analytical applications. Journal of the Brazilian Chemical Society, 14, 198-219.
REICH, G. 2005. Near-infrared spectroscopy and imaging: Basic principles and pharmaceutical applications. Advanced Drug Delivery Reviews, 57, 1109-1143.
ROMANIUK, A. 2012. " World Population Policies: Their Origin, Evolution, and Impact" by John F. May. Canadian Studies in Population, 39, 125-134.
SCHULTHESS, C. P. 2011. Historical Perspective on the Tools That Helped Shape Soil Chemistry. Soil Science Society of America Journal, 75, 2009-2036.
SCOTTER, C. N. G. 2005. INFRARED SPECTROSCOPY | Near-Infrared. In: EDITORS-IN-CHIEF: PAUL, W., ALAN, T. & COLIN, P. (eds.) Encyclopedia of Analytical Science (Second Edition). Oxford: Elsevier.
SHEPHERD, K. D. & WALSH, M. G. 2002. Development of reflectance spectral libraries for characterization of soil properties. Soil Science Society of America Journal, 66, 988-998.
STENBERG, B., ROSSEL, R. A. V., MOUAZEN, A. M. & WETTERLIND, J. 2010. VISIBLE AND NEAR INFRARED
33
SPECTROSCOPY IN SOIL SCIENCE. Advances in Agronomy, Vol 107, 107, 163-215.
TEKIN, Y., TUMSAVAS, Z. & MOUAZEN, A. M. 2012. Effect of Moisture Content on Prediction of Organic Carbon and pH Using Visible and Near-Infrared Spectroscopy. Soil Science Society of America Journal, 76, 188-198.
TERHOEVEN-URSELMANS, T., SCHMIDT, H., GEORG JOERGENSEN, R. & LUDWIG, B. 2008. Usefulness of near-infrared spectroscopy to determine biological and chemical soil properties: Importance of sample pre-treatment. Soil Biology and Biochemistry, 40, 1178-1188.
TOBIAS, R. D. An introduction to partial least squares regression. Proc. Ann. SAS Users Group Int. Conf., 20th, Orlando, FL, 1995. 2-5.
VÅGEN, T., SHEPHERD, K., WALSH, M., WINOWIECKI, L., DESTA, L. & TONDOH, J. 2010. AfSIS technical specifications: soil health surveillance. World Agroforestry Centre, Nairobi, Kenya.
VISCARRA ROSSEL, R., WALVOORT, D., MCBRATNEY, A., JANIK, L. J. & SKJEMSTAD, J. 2006. Visible, near infrared, mid infrared or combined diffuse reflectance spectroscopy for simultaneous assessment of various soil properties. Geoderma, 131, 59-75.
WAISER, T. H., MORGAN, C. L., BROWN, D. J. & HALLMARK, C. T. 2007. In situ characterization of soil clay content with visible near-infrared diffuse reflectance spectroscopy. Soil Science Society of America Journal, 71, 389-396.
WANG, Z. Y., ZHANG, J. D., WU, X. G., BIRAU, M., YU, G. M., YU, H. G., QI, Y. H., DESJARDINS, P., MENG, X. S., GAO, J. P., TODD, E., SONG, N. H., BAI, Y. M., BEAUDIN, A. M. R. & LECLAIR, G. 2004. Near-infrared absorbing organic materials. Pure and Applied Chemistry, 76, 1435-1443.
WOLD, S., SJÖSTRÖM, M. & ERIKSSON, L. 2001. PLS-regression: a basic tool of chemometrics. Chemometrics and Intelligent Laboratory Systems, 58, 109-130.
WU, C.-Y., JACOBSON, A. R., LABA, M. & BAVEYE, P. C. 2009. Accounting for surface roughness effects in the near-infrared reflectance sensing of soils. Geoderma, 152, 171-180.
ZIADI, N. & TRAN, T. 2007. Mehlich 3-extractable elements. Soil sampling and methods of analysis. Lewis, Boca Raton, FL, 81-88.
ZORNOZA, R., GUERRERO, C., MATAIX-SOLERA, J., SCOW, K. M., ARCENEGUI, V. & MATAIX-BENEYTO, J. 2008. Near infrared spectroscopy for determination of various physical, chemical and biochemical properties in Mediterranean soils. Soil Biology & Biochemistry, 40, 1923-1930.
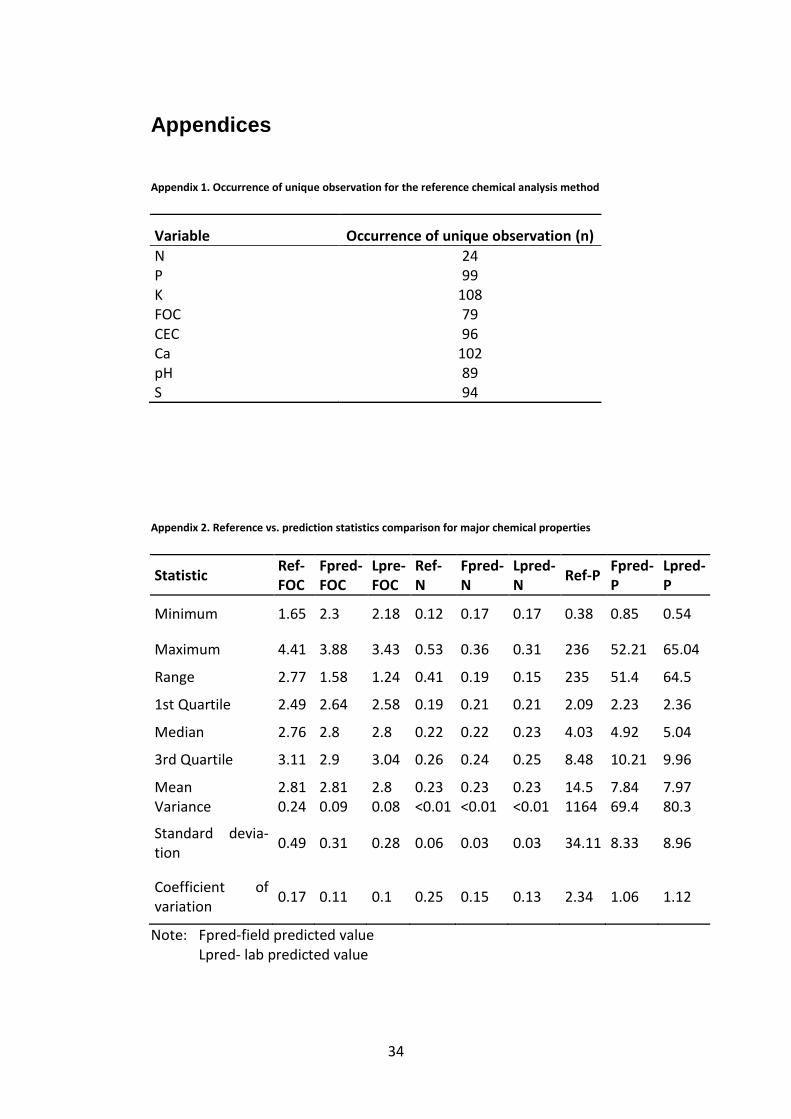
34
Appendices Appendix 1. Occurrence of unique observation for the reference chemical analysis method
Variable Occurrence of unique observation (n)
N 24 P 99 K 108 FOC 79 CEC 96 Ca 102 pH 89 S 94
Appendix 2. Reference vs. prediction statistics comparison for major chemical properties
Statistic Ref-FOC
Fpred-FOC
Lpre-FOC
Ref-N
Fpred-N
Lpred-N
Ref-P Fpred-P
Lpred-P
Minimum 1.65 2.3 2.18 0.12 0.17 0.17 0.38 0.85 0.54
Maximum 4.41 3.88 3.43 0.53 0.36 0.31 236 52.21 65.04
Range 2.77 1.58 1.24 0.41 0.19 0.15 235 51.4 64.5
1st Quartile 2.49 2.64 2.58 0.19 0.21 0.21 2.09 2.23 2.36
Median 2.76 2.8 2.8 0.22 0.22 0.23 4.03 4.92 5.04
3rd Quartile 3.11 2.9 3.04 0.26 0.24 0.25 8.48 10.21 9.96
Mean 2.81 2.81 2.8 0.23 0.23 0.23 14.5 7.84 7.97 Variance 0.24 0.09 0.08 <0.01 <0.01 <0.01 1164 69.4 80.3
Standard devia-tion
0.49 0.31 0.28 0.06 0.03 0.03 34.11 8.33 8.96
Coefficient of variation
0.17 0.11 0.1 0.25 0.15 0.13 2.34 1.06 1.12
Note: Fpred-field predicted value Lpred- lab predicted value
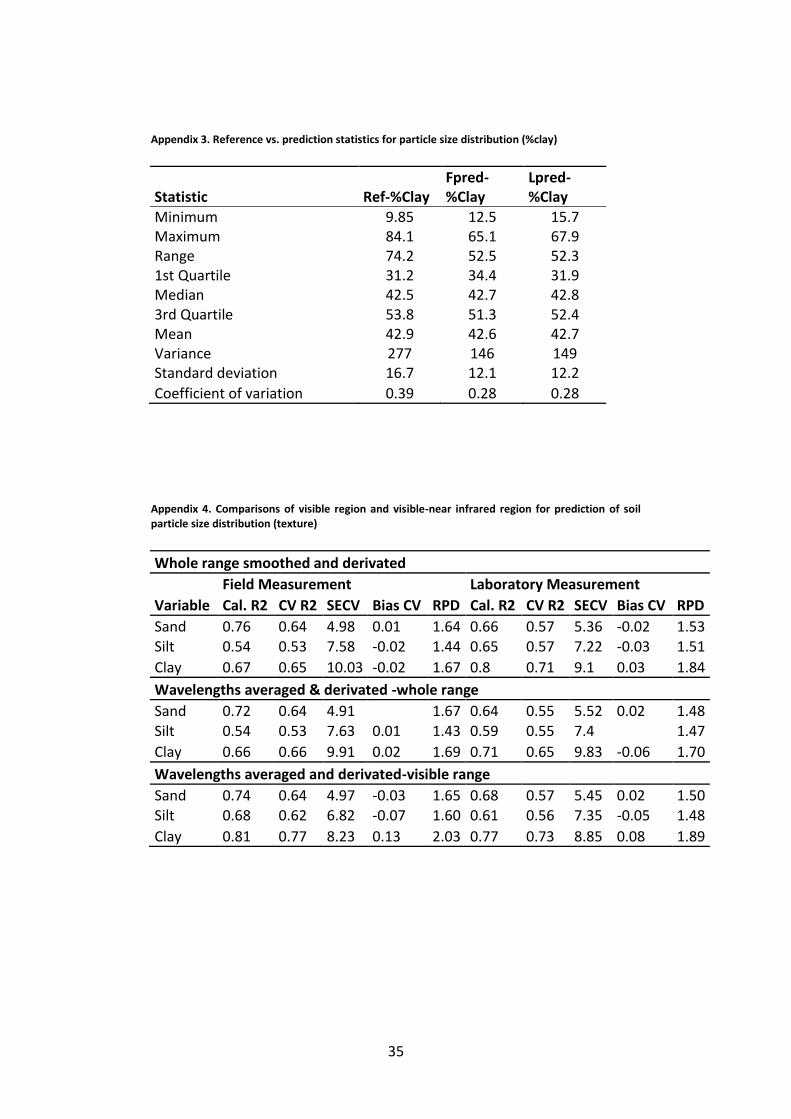
35
Appendix 3. Reference vs. prediction statistics for particle size distribution (%clay)
Statistic Ref-%Clay Fpred-%Clay
Lpred-%Clay
Minimum 9.85 12.5 15.7 Maximum 84.1 65.1 67.9 Range 74.2 52.5 52.3 1st Quartile 31.2 34.4 31.9 Median 42.5 42.7 42.8 3rd Quartile 53.8 51.3 52.4 Mean 42.9 42.6 42.7 Variance 277 146 149 Standard deviation 16.7 12.1 12.2
Coefficient of variation 0.39 0.28 0.28
Appendix 4. Comparisons of visible region and visible-near infrared region for prediction of soil particle size distribution (texture)
Whole range smoothed and derivated
Variable
Field Measurement Laboratory Measurement
Cal. R2 CV R2 SECV Bias CV RPD Cal. R2 CV R2 SECV Bias CV RPD
Sand 0.76 0.64 4.98 0.01 1.64 0.66 0.57 5.36 -0.02 1.53 Silt 0.54 0.53 7.58 -0.02 1.44 0.65 0.57 7.22 -0.03 1.51
Clay 0.67 0.65 10.03 -0.02 1.67 0.8 0.71 9.1 0.03 1.84
Wavelengths averaged & derivated -whole range
Sand 0.72 0.64 4.91
1.67 0.64 0.55 5.52 0.02 1.48
Silt 0.54 0.53 7.63 0.01 1.43 0.59 0.55 7.4 1.47
Clay 0.66 0.66 9.91 0.02 1.69 0.71 0.65 9.83 -0.06 1.70
Wavelengths averaged and derivated-visible range
Sand 0.74 0.64 4.97 -0.03 1.65 0.68 0.57 5.45 0.02 1.50 Silt 0.68 0.62 6.82 -0.07 1.60 0.61 0.56 7.35 -0.05 1.48
Clay 0.81 0.77 8.23 0.13 2.03 0.77 0.73 8.85 0.08 1.89