rapidly deployable wireless hull monitoring system for ... · rapidly deployable wireless hull...
TRANSCRIPT

Rapidly Deployable Wireless Hull Monitoring System for Fatigue Life Assessment of Naval Vessels in High Seas
Nephi R. JOHNSON 1, Sean M. O’CONNOR1, Anne K. MAGNUS1, Matthew D.
COLLETTE2, Jerome P. LYNCH1, 3*
1 Department of Civil & Environmental Engineering, Univ. of Michigan, Ann Arbor, MI, USA 2 Department of Naval Architecture & Marine Engineering, Univ. of Michigan, Ann Arbor, MI, USA
3 Department of Electrical Eng. & Computer Science, Univ. of Michigan, Ann Arbor, MI, USA
*[email protected] Abstract Current procedures for designing aluminum naval vessels and their components involve reliance on analytical models that account for the accumulation of fatigue over a ship’s service life. However, such models and design assumptions are not validated after the ship has been deployed. To address the need for hull response data to assess the accumulation of the hull fatigue life, this study presents a rapid-to-deploy wireless hull monitoring system that measures ship strains and accelerations. The system is temporarily installed on a United States Coast Guard (USCG) 45 feet aluminum response boat medium (RB-M). The RB-M was located at the USCG National Motor Lifeboat School (NMLBS) in Cape Disappointment where the Columbia River feeds into the Pacific Ocean. The vessel was tested over the course of four days in heavy weather, high sea environments while acceleration and strain data were collected. To understand the relationship between these data and the external seaway conditions, a rough measure of the ship speed, heading and wave heights were manually recorded in the captain log. The captain’s log was compared to National Data Buoy Center (NDBC) data to verify the wave heights. A description of the rapidly deployable system, it’s installation and results of the data collected are discussed.
Keywords: wireless monitoring, structural health monitoring, hull monitoring, fatigue life-cycle, high speed ship, aluminum hull.
1 INTRODUCTION
Extending the service life of vessels in the fleets of the U.S. Navy (USN) and U.S. Coast Guard (USCG) is important to ensure they are safe and cost-effective to operate. This poses a number of challenges due to the high uncertainties associated with historical load profile of vessels and because of the difficulty in modeling complicated hulls, especially for smaller vessels designed for high speed operations. To best manage this challenging situation, lifecycle support systems are needed to predict the health of the hull, estimate remaining life in hull components and to estimate the costs associated with future hull repairs over the remaining service life of the vessel. Towards this end, various enabling technologies are now emerging that have the potential to usher in powerful lifecycle decision support systems [1]. For example, sensing technologies have dramatically improved in recent years with dense instrumentation of in-service hulls now possible at reasonable costs. Permanent hull monitoring systems can be powerful tools that assess ships responses to seaway loads and to identify damage in the hull. Such monitoring systems, when used as part of a comprehensive
8th European Workshop On Structural Health Monitoring (EWSHM 2016), 5-8 July 2016, Spain, Bilbao
www.ndt.net/app.EWSHM2016M
ore
info
abo
ut th
is a
rtic
le: h
ttp://
ww
w.n
dt.n
et/?
id=
2011
4
2
data-to-decision (D2D) framework, can provide port engineers and ship owners with actionable information that supports improved asset management decision making [2, 3]. In permanent hull monitoring installations, the sensing technology must be sufficiently robust and reliable to survive over the ship lifespan requiring more expensive equipment and installations. There is also a need for short-term hull monitoring deployments where sensors are deployed for short periods of time (e.g., a few weeks) to assess ship behavior in a variety of operational states. Such systems could be valuable to assess typical ship responses that can be used to validate design assumptions including anticipated fatigue life of key ship components. Due to their short-term installation, such systems must be low cost and easy to install.
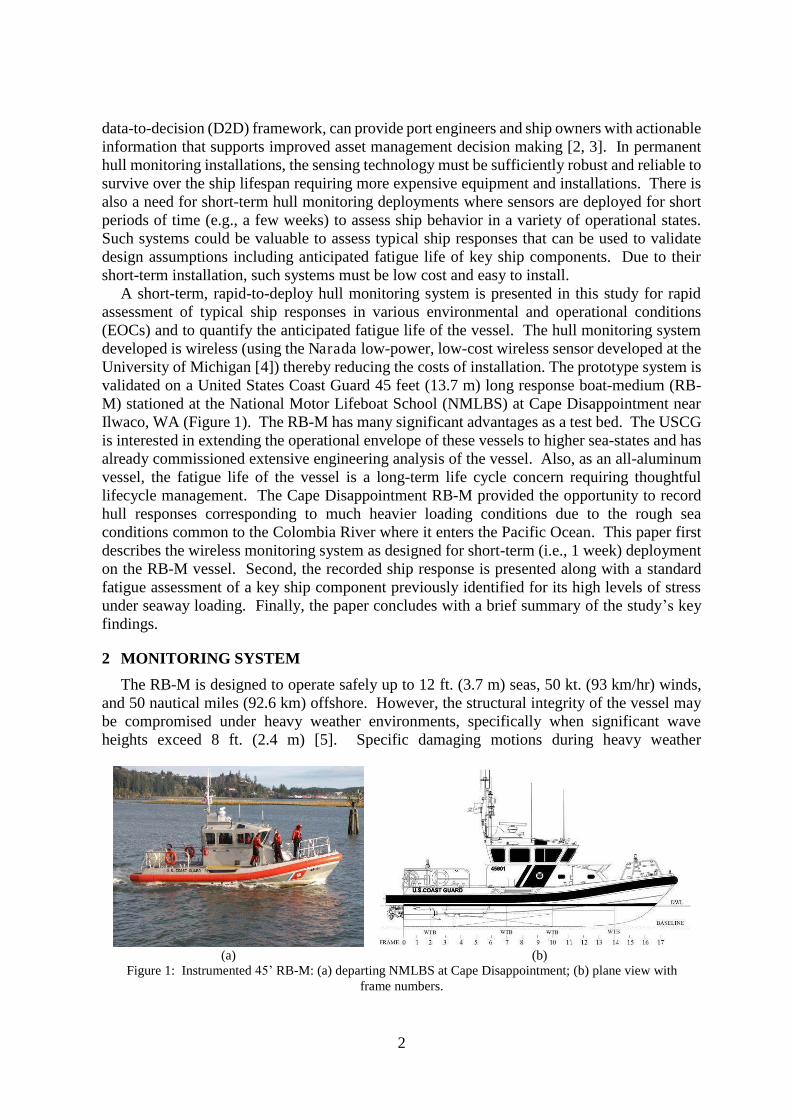
A short-term, rapid-to-deploy hull monitoring system is presented in this study for rapid assessment of typical ship responses in various environmental and operational conditions (EOCs) and to quantify the anticipated fatigue life of the vessel. The hull monitoring system developed is wireless (using the Narada low-power, low-cost wireless sensor developed at the University of Michigan [4]) thereby reducing the costs of installation. The prototype system is validated on a United States Coast Guard 45 feet (13.7 m) long response boat-medium (RB-M) stationed at the National Motor Lifeboat School (NMLBS) at Cape Disappointment near Ilwaco, WA (Figure 1). The RB-M has many significant advantages as a test bed. The USCG is interested in extending the operational envelope of these vessels to higher sea-states and has already commissioned extensive engineering analysis of the vessel. Also, as an all-aluminum vessel, the fatigue life of the vessel is a long-term life cycle concern requiring thoughtful lifecycle management. The Cape Disappointment RB-M provided the opportunity to record hull responses corresponding to much heavier loading conditions due to the rough sea conditions common to the Colombia River where it enters the Pacific Ocean. This paper first describes the wireless monitoring system as designed for short-term (i.e., 1 week) deployment on the RB-M vessel. Second, the recorded ship response is presented along with a standard fatigue assessment of a key ship component previously identified for its high levels of stress under seaway loading. Finally, the paper concludes with a brief summary of the study’s key findings.
2 MONITORING SYSTEM
The RB-M is designed to operate safely up to 12 ft. (3.7 m) seas, 50 kt. (93 km/hr) winds, and 50 nautical miles (92.6 km) offshore. However, the structural integrity of the vessel may be compromised under heavy weather environments, specifically when significant wave heights exceed 8 ft. (2.4 m) [5]. Specific damaging motions during heavy weather
(a) (b)
Figure 1: Instrumented 45’ RB-M: (a) departing NMLBS at Cape Disappointment; (b) plane view with frame numbers.

3
environments could include excessive roll angles and capsize. Also, the bow structure may experience over-stress due to wave impacts while the deck and side of the deck house could experience local buckling due to excessive global hull bending loads. Therefore, a monitoring system was designed and installed capable of measuring and recording hull strain responses and ship motions (i.e., accelerations) experienced during heavy weather operation. Specifically, the 45’ RB-M was instrumented with sensors, an automatic data acquisition system, and a display conveying potential damaging motions captured through hull acceleration and strain measurements.
The instrumentation plan for the monitoring system installed on the NMLBS’s RB-M is provided in Figures 2 (refer to Figure 1b and 2 for frame numbers). The plan is comprised of: two strain gage rosettes with temperature compensation on a hull stiffener element, two tri-axial accelerometers in the bow and at the ship center of gravity (frame 7), one uni-axial accelerometer off center at frame 7, and two (2) position transducers between frames 8 and 9 as shown in Figure 2. Each sensor is attached to a Narada wireless sensor for data acquisition (including digitalization) and communication to the system base station. Data collected is transmitted using the Narada IEEE802.15.4 transceiver operating on the 2.4 GHz wireless spectrum segment. The wireless hull monitoring system base station was installed in the survivor cabin located between the bow and auxiliary machinery compartment (Figure 3). The base station utilizes a PC-104 single board computer and a IEEE802.15.4 wireless transceiver (Texas Instrument CC2420) for system operation including time synchronization, wireless data
Figure 2: Plan view of RB-M with installation locations identified.
(a) (b)
Figure 3: Base station server in survivor cabin: (a) location; (b) photograph.
4
collection, data storage, and real-time processing. The PC-104 runs the Linux-based Ubuntu operating system. The monitoring program is executed through the PC-104, programmed to run nearly continuously while the ship is under operation. Program commands are communicated to the sensor network via the CC2420 wireless transceiver, where upon completion of the data acquisition task, sensor data is sent back to and stored in compact flash residing on the PC-104. The monitoring system operates at approximately 90% duty cycle, sensing for ten minutes and re-starting one minute later.
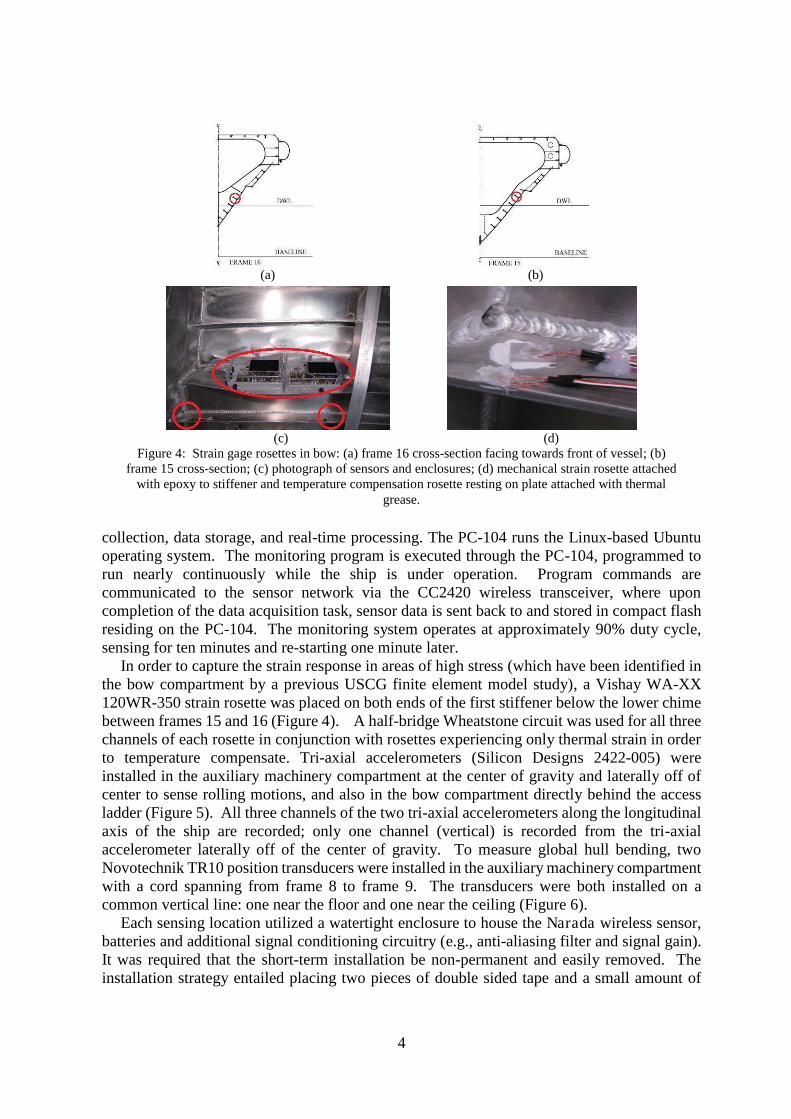
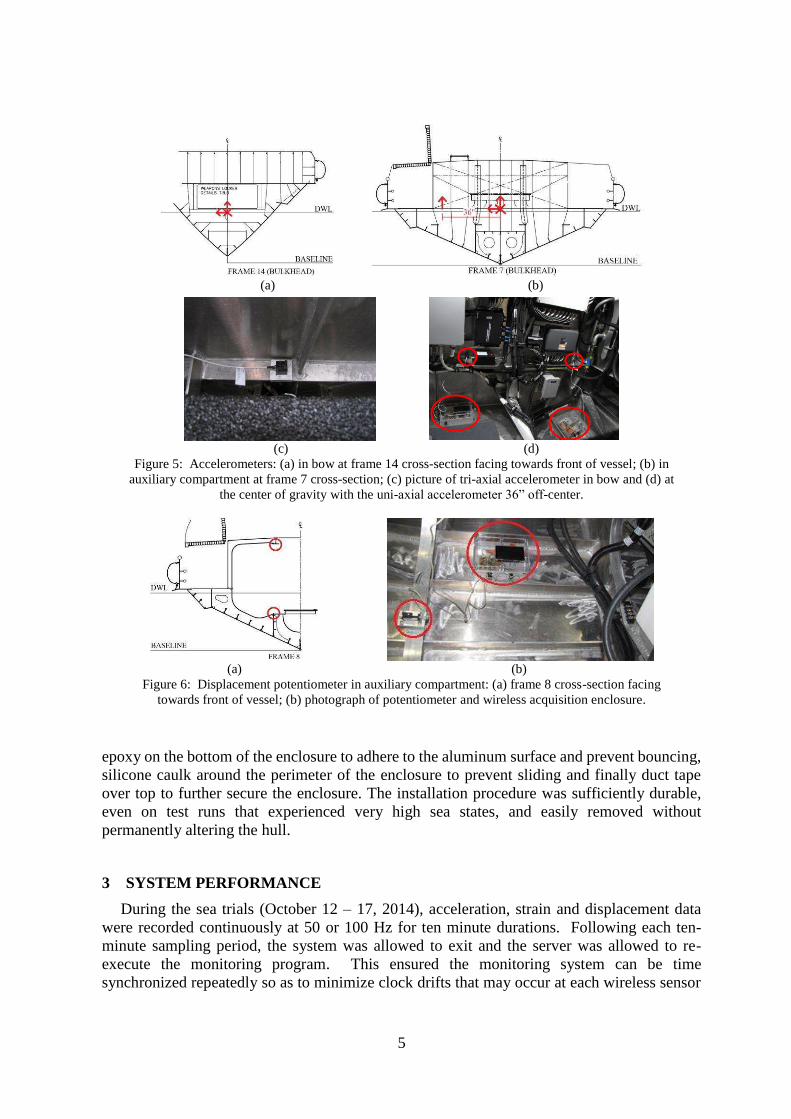
In order to capture the strain response in areas of high stress (which have been identified in the bow compartment by a previous USCG finite element model study), a Vishay WA-XX 120WR-350 strain rosette was placed on both ends of the first stiffener below the lower chime between frames 15 and 16 (Figure 4). A half-bridge Wheatstone circuit was used for all three channels of each rosette in conjunction with rosettes experiencing only thermal strain in order to temperature compensate. Tri-axial accelerometers (Silicon Designs 2422-005) were installed in the auxiliary machinery compartment at the center of gravity and laterally off of center to sense rolling motions, and also in the bow compartment directly behind the access ladder (Figure 5). All three channels of the two tri-axial accelerometers along the longitudinal axis of the ship are recorded; only one channel (vertical) is recorded from the tri-axial accelerometer laterally off of the center of gravity. To measure global hull bending, two Novotechnik TR10 position transducers were installed in the auxiliary machinery compartment with a cord spanning from frame 8 to frame 9. The transducers were both installed on a common vertical line: one near the floor and one near the ceiling (Figure 6).
Each sensing location utilized a watertight enclosure to house the Narada wireless sensor, batteries and additional signal conditioning circuitry (e.g., anti-aliasing filter and signal gain). It was required that the short-term installation be non-permanent and easily removed. The installation strategy entailed placing two pieces of double sided tape and a small amount of
(a) (b)
(c) (d)
Figure 4: Strain gage rosettes in bow: (a) frame 16 cross-section facing towards front of vessel; (b) frame 15 cross-section; (c) photograph of sensors and enclosures; (d) mechanical strain rosette attached
with epoxy to stiffener and temperature compensation rosette resting on plate attached with thermal grease.
5
epoxy on the bottom of the enclosure to adhere to the aluminum surface and prevent bouncing, silicone caulk around the perimeter of the enclosure to prevent sliding and finally duct tape over top to further secure the enclosure. The installation procedure was sufficiently durable, even on test runs that experienced very high sea states, and easily removed without permanently altering the hull.
3 SYSTEM PERFORMANCE
During the sea trials (October 12 – 17, 2014), acceleration, strain and displacement data were recorded continuously at 50 or 100 Hz for ten minute durations. Following each ten-minute sampling period, the system was allowed to exit and the server was allowed to re-execute the monitoring program. This ensured the monitoring system can be time synchronized repeatedly so as to minimize clock drifts that may occur at each wireless sensor
(a) (b)
(c) (d)
Figure 5: Accelerometers: (a) in bow at frame 14 cross-section facing towards front of vessel; (b) in auxiliary compartment at frame 7 cross-section; (c) picture of tri-axial accelerometer in bow and (d) at
the center of gravity with the uni-axial accelerometer 36” off-center.
(a) (b)
Figure 6: Displacement potentiometer in auxiliary compartment: (a) frame 8 cross-section facing towards front of vessel; (b) photograph of potentiometer and wireless acquisition enclosure.
6
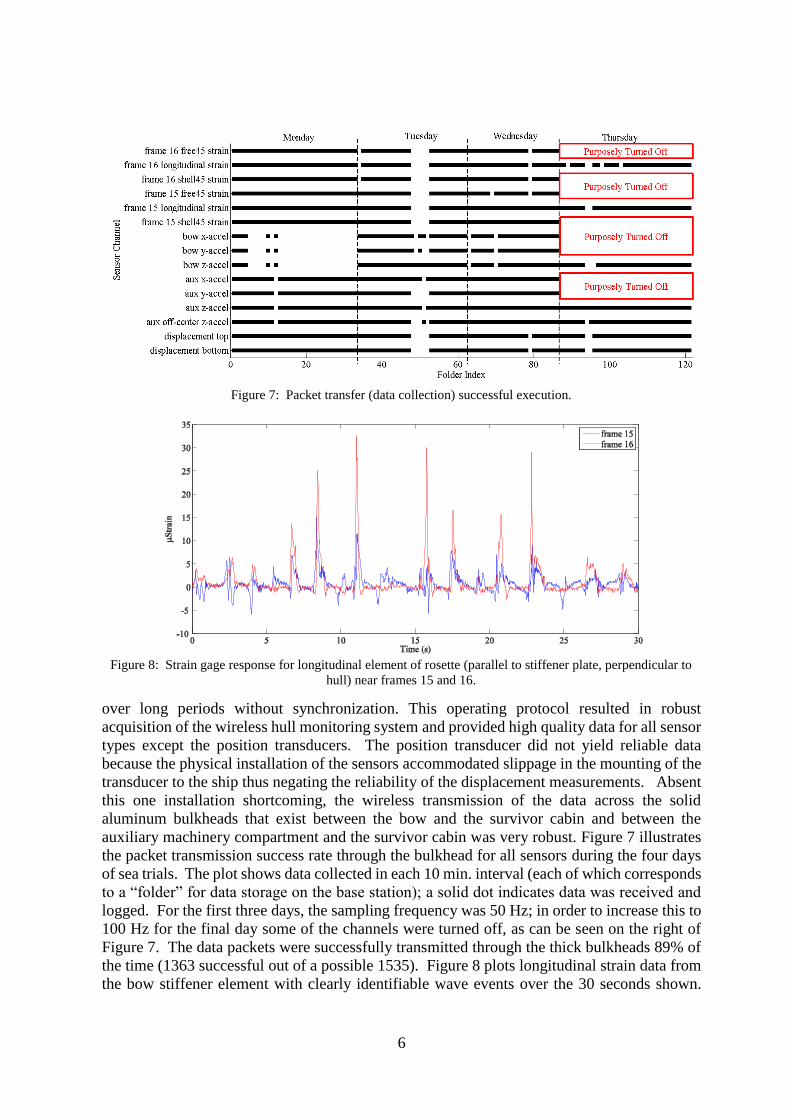
over long periods without synchronization. This operating protocol resulted in robust acquisition of the wireless hull monitoring system and provided high quality data for all sensor types except the position transducers. The position transducer did not yield reliable data because the physical installation of the sensors accommodated slippage in the mounting of the transducer to the ship thus negating the reliability of the displacement measurements. Absent this one installation shortcoming, the wireless transmission of the data across the solid aluminum bulkheads that exist between the bow and the survivor cabin and between the auxiliary machinery compartment and the survivor cabin was very robust. Figure 7 illustrates the packet transmission success rate through the bulkhead for all sensors during the four days of sea trials. The plot shows data collected in each 10 min. interval (each of which corresponds to a “folder” for data storage on the base station); a solid dot indicates data was received and logged. For the first three days, the sampling frequency was 50 Hz; in order to increase this to 100 Hz for the final day some of the channels were turned off, as can be seen on the right of Figure 7. The data packets were successfully transmitted through the thick bulkheads 89% of the time (1363 successful out of a possible 1535). Figure 8 plots longitudinal strain data from the bow stiffener element with clearly identifiable wave events over the 30 seconds shown.
Figure 7: Packet transfer (data collection) successful execution.
Figure 8: Strain gage response for longitudinal element of rosette (parallel to stiffener plate, perpendicular to
hull) near frames 15 and 16.

7
The absolute strain magnitude near frames 15 and 16, respectively, and their strain relative to each other can be used to characterize the wave impact. Figure 9 plots the center of gravity accelerations (all three orthogonal axes) for the entire first day of data collection superimposed with the corresponding wave heights. The wave heights documented are from the captain log which provided a detailed accounting of time and sea conditions (i.e., wave heights, speed, location). Figure 10 plots the z-acceleration data for the auxiliary centerline and off-center for 30 seconds. The difference in magnitudes between the two sets of data is an indication of roll, the effects of this roll on structural components of the ship are currently being examined further.
4 FATIGUE ANALYSIS
The USGC had conducted analyses on the 45’ RB-M that informed the decision to install the strain gages at the location experiencing the highest stress levels. In order to gain
Figure 9: Auxiliary accelerations and sea wave heights on Monday, October 13, 2014.
Figure 10: Auxiliary accelerations 30 second response.

8
meaningful insight from the data and begin assessing the fatigue life of the ship, the fatigue consumed by the stiffener near each frame was calculated. The consumed fatigue life was calculated using Miner’s Rule:
� = ∑ �����
�=1 (1)
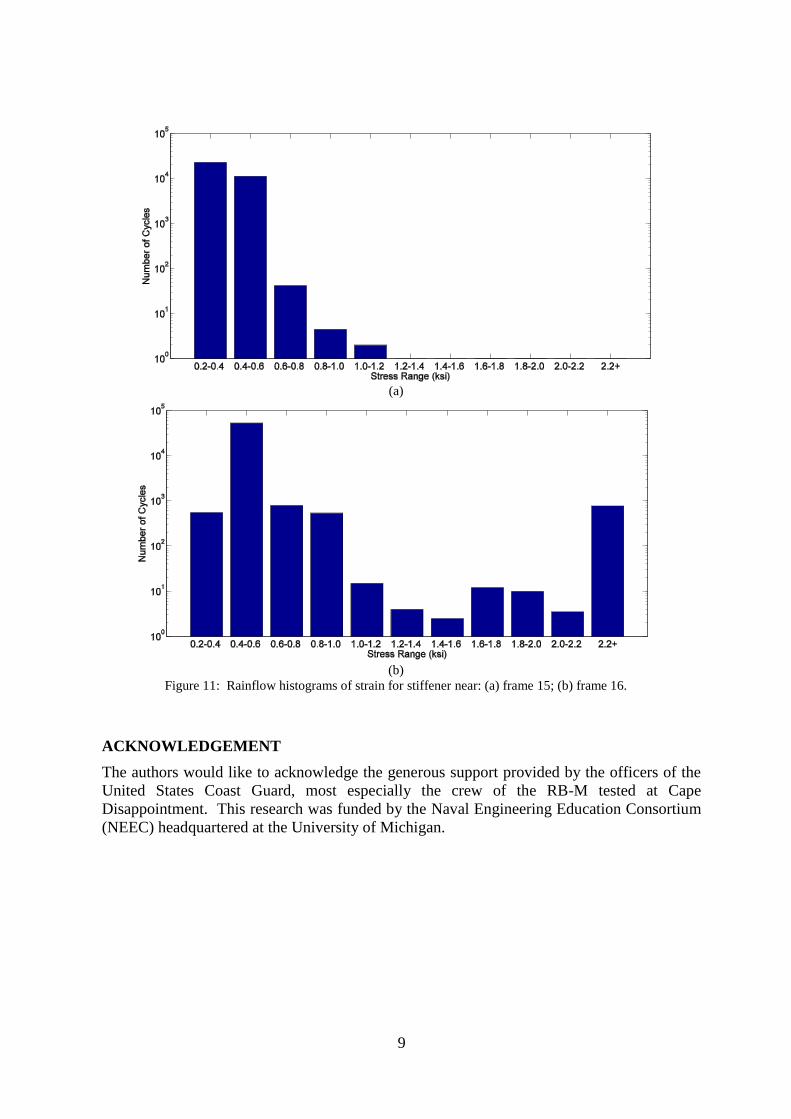
where, C is the fraction of the consumed fatigue, ni is the number of cycles accumulated at stress Si, Ni is the number of cycles a specimen can withstand at the given stress range (Si). Therefore, C needed to be calculated for every stress state and summed together. Si and Ni were determined using equations for S-N curves for aluminum specimens published by the Naval Surface Warfare Center Carderock Division [6]. However, the stress cycles experienced by the stiffeners during the field test at NMLBS were much lower than those calculated at Carderock so the Si and Ni were extrapolated to the low strain regime experienced during sea trials. The cycle count, ni, was calculated using a rainflow counting algorithm applied to the strain sensor data for the stiffener in the bow. This was then converted to stress using Hooke’s Law (σ=Eϵ), with E = 10,200 ksi. The stress cycle rainflow counts are shown in Figure 11. The consumed fatigue life for each ten minute segment was calculated and used to estimate the lifecycle of the two frames instrumented. The consumed fatigue near frame 15 and 16 were calculated to be 0.008% and 0.059%, repetitively, of their total fatigue lives. Because this much fatigue life was consumed during 1070 minutes, it follows that the equivalent fatigue life for each frame would be 230,000 and 30,000 hours, respectively. Frame 16, being closer to the front of the bow, experiences higher strain cycles thus having a lower lifecycle. As this stiffener was previously identified as the area of most concern, 30,000 hours of operation at the EOC during which the data was collected is a reasonable estimation and matches well with the 20 year service life of the 45’ RB-M. [5].
6 CONCLUSION
A physical test-bed for a rapid-to-deploy wireless hull monitoring system using a USCG 45’ RB-M platform was developed. The wireless hull monitoring system proved reliable over 4 days of continuous operation with a communication success rate of nearly 90%; this is impressive given the bulkheads the wireless signals must penetrate for data communication. Data gained from these tests were further analyzed for the purpose of improving a fatigue life estimate of the RB-M ship using real-world load response data from the hull. Valuable insight has been garnered from the data collected on the RB-M at Cape Disappointment. The stiffener instrumented was previously identified as one of the higher stress areas of the ship hull. Based on a rudimentary fatigue analysis, the fatigue life of the hull was found to be 30,000 hours. This analysis demonstrates the ability to quantify data results into meaningful information. The acceleration and strain data are currently being examined from a global perspective to identify correlations between sea conditions and structural responses. Based on this analysis, a more detailed and accurate fatigue life assessment is being developed for the RB-M. This approach will be capable of extending to other vessels and environmental and operational conditions (EOCs) that can be instrumented in the future.
9
ACKNOWLEDGEMENT
The authors would like to acknowledge the generous support provided by the officers of the United States Coast Guard, most especially the crew of the RB-M tested at Cape Disappointment. This research was funded by the Naval Engineering Education Consortium (NEEC) headquartered at the University of Michigan.
(a)
(b)
Figure 11: Rainflow histograms of strain for stiffener near: (a) frame 15; (b) frame 16.
10
REFERENCES
[1] C. Farrar, G. Park, M. Angel, M. Bement and L. Salvino, “Structural health monitoring for ship structures,” in International Workshop on Structural Health Monitoring, Palo Alto, CA (2009).
[2] S. Alampalli, and M. Ettouney, “Automated decision making tool for bridge managers,”
in Structural Materials Technology, New York, NY (2010). [3] C.R. Farrar, and N.A.J. Lieven, “Damage prognosis: the future of structural health
monitoring,” Phil. Trans. R. Soc. A 365, 623–632 (2007). [4] R.A. Swartz, D. Jung, J.P. Lynch, Y. Wang, D. Shi, and M.P. Flynn, “Design of a
wireless sensor for scalable distributed in-network computation in a structural health monitoring system,” Proceedings of the 5th International Workshop on Structural Health Monitoring, Stanford, CA, September 12-14, 2005.
[5] D.M. Shepard, and J.M. Curtis, “U.S. Coast Guard Response Boat – Medium (RB-M),”
2nd Symposium Chesapeake Powerboat Symposium, Annapolis, MD (2010). [6] D.P. Kihl, N.E. Adler, and E.A. Devine, “Fatigue test results of aluminum components
and specimens subjected to constant and random amplitude loadings,” Naval Surface Warfare Center Carderock Division, NSWCCD-65-TR-2014/01 (2014).