rapidride f line six month post- implementation survey...
TRANSCRIPT

RapidRide F Line Six Month Post-Implementation Survey Results
Prepared for:
King County Metro by Pacific Market Research King County Metro Contact Info
201 S. Jackson St Seattle, WA 98104
Phone: 206-553-3000
January 2015

Metro RapidRide F Line Six Month Post-Implementation Survey 2014
2
TABLE OF CONTENTS
EXECUTIVE SUMMARY ................................................................................... 3
Background and Objectives .................................................................................. 3
Method ................................................................................................................... 4 Dates of Survey ...................................................................................................... 5 Reporting Conventions ........................................................................................... 5
KEY FINDINGS ................................................................................................... 6 DETAILED FINDINGS .................................................................................... 10
Overall Satisfaction with Service ......................................................................... 10
Satisfaction with Service Elements for F Line 2014 and Route 140 ................... 10 Trip Time ..............................................................................................................11 Personal Safety .....................................................................................................12 Waiting Area/Bus Stop Where You Boarded For This Trip ................................15 Things about Buses ...............................................................................................18 Ease of Transferring .............................................................................................21 Frequency and Reliability of Buses ......................................................................24
How RapidRide Compares to Other Metro Bus Service ................................... 27
Transit Trips Taken ............................................................................................ 28
Reason for Riding ................................................................................................ 28
Days and Times of Riding .................................................................................. 29
If you did not use RapidRide F Line, how would you make this trip? .............. 30
Transfers .............................................................................................................. 30 Buses Transferred to or from RapidRide .............................................................31
Fares .................................................................................................................... 31
Trip Information Sources .................................................................................... 33
Feelings about RapidRide F Line ....................................................................... 33
Recommendations for RapidRide F Line Improvements ................................. 34
Respondent Profile .............................................................................................. 35 APPENDIX ......................................................................................................... 36

Metro RapidRide F Line Six Month Post-Implementation Survey 2014
3
EXECUTIVE SUMMARY
Background and Objectives
King County Metro Transit (Metro) introduced the new RapidRide F Line, in Summer 2014, offering Bus Rapid Transit (BRT) service between Burien Transit Center and Renton Landing. The RapidRide F Line replaced service formerly provided by Route 140.
The RapidRide F Line provides the best features Metro has to offer, including:
• Service every 10 minutes during the weekday peak periods, every 15 minutes during most other times of the day and days of the week until 10 pm, and scheduled late night/early morning service.
• Distinctive new red buses with three doors for easy boarding, security cameras, stop announcements and passenger WiFi.
• Branded passenger facilities that include redesigned shelters, enhanced lighting, electronic real time information signs, off-board ORCA card readers at major stops, and other convenient features.
• Use of HOV lanes and transit signal priority to improve reliability and speed up travel times.
Metro contracted with Pacific Market Research to conduct a six month post-implementation survey of RapidRide F Line riders to determine their current satisfaction with RapidRide service. This report compares results of the six month post-implementation survey (obtained in December 2014) with the pre-RapidRide survey Route 140 results (obtained in April 2014).
Specific areas of investigation were:
• Trip time • Personal safety • Waiting area / Bus stop where boarded • Things about buses • Ease of Transferring • Frequency and reliability of the buses • How RapidRide compares to other Metro bus service • Rides taken during the past 30 days, usual reason for riding and length of time as a rider • Payment of fares • Trip information sources • Recommendations for improvements
Key findings from the RapidRide F Line 2014 survey are provided in this Executive Summary. They are presented as a comparison with Route 140 survey results for questions in common.

Metro RapidRide F Line Six Month Post-Implementation Survey 2014
4
Method
All riders onboard selected RapidRide F Line trips were invited to complete a questionnaire regarding their satisfaction with various service quality elements. Riders were also offered the option of completing the survey and mailing it back with a pre-paid return address printed on the English surveys or a pre-paid envelope for foreign language surveys. To accommodate riders who do not speak English, the survey was also offered in Spanish, Korean and Vietnamese. A total of 6 surveys were obtained in Spanish, none were completed in Korean or Vietnamese in the F Line 2014 survey.
Trips to be surveyed were selected to provide a variety of peak and non-peak riders. Table A summarizes response rates for the F Line 2014 survey in this report. Comparable information is not available for Route 140.
Considering response rate as a proportion of all questionnaires given out, F Line had a response rate of just under two-thirds completed (63%). Considering response rate as a proportion of all riders contacted, including those that had already completed a survey, refused, spoke other languages, and those not approached, 42 percent of F Line riders completed a survey.
Table A Completed Questionnaires on RapidRide F Line
F Line 2014
Completed Questionnaires 520 % of Questionnaires Handed Out 63% % of All Riders on Sampled Trips* 42% % Refused 19% *All riders on sampled trips: this includes riders who declined to take a survey because they had already completed one.

Metro RapidRide F Line Six Month Post-Implementation Survey 2014
5
Dates of Survey Intercepts for the RapidRide F Line 2014 survey occurred on four days: December 3rd, 4th, 10th and 11th, 2014. Route 140 surveys were collected April 9, 10, and 17, 2014. A total of 520 complete surveys were collected in the F Line 2014 survey, and there were 554 complete surveys for Route 140. Trips to be surveyed were selected to provide a variety of peak and non-peak riders. (Table B)
Table B Interviewing Schedule – RapidRide F Line 2014
Wed., Dec. 3rd 11:30 to 8 PM Renton Landing
Wed., Dec. 3rd 11:30 to 8 PM Burien Transit Center
Thur., Dec. 4th 6 AM to 2:30 PM Renton Landing
Thur., Dec. 4th 6 AM to 2:30 PM Burien Transit Center
Wed., Dec. 10th 6 AM to 10 AM Renton Landing
Wed., Dec. 10th 6 AM to 10 AM Burien Transit Center
Thur., Dec. 11th 4 PM to 8 PM Renton Landing
Thur., Dec. 11th 4 PM to 8 PM Burien Transit Center
Reporting Conventions Statistical tests were used to compare differences in mean scores as well as differences in the percentage of respondents who were “satisfied” (combined ratings of 4 and 5) or “dissatisfied” (combined ratings of 1 and 2). Response proportions presented in text and displayed in graphs and in tables exclude the number of respondents who did not answer the questions and also the number of respondents who indicated not applicable.
Text summaries of respondent ratings are presented as the combined proportions of satisfied/very satisfied ratings and dissatisfied/very dissatisfied ratings. Rounding mechanisms inherent in the software can make response proportions shown in graphs and reported in text vary from cross tabulation results by up to 1 percentage point. A complete set of data tables is available under separate cover

Metro RapidRide F Line Six Month Post-Implementation Survey 2014
6
KEY FINDINGS The RapidRide F Line 2014 survey showed riders’ overall satisfaction with the F Line was significantly higher than riders’ overall satisfaction with Route 140. Nine out of ten F Line riders (89%) gave a rating of satisfied/very satisfied compared to eight out of ten (80%) for Route 140. The RapidRide F Line survey results found that F Line riders had significantly higher satisfaction than Route 140 riders on seven of the thirty-one transit elements rated in both surveys. In no areas did the F Line riders have significantly lower satisfaction. The following information summarizes the significant differences between satisfaction ratings (satisfied/very satisfied or dissatisfied/very dissatisfied) given by F Line riders compared to Route 140 riders in each service element category. Trip time – F Line riders had significantly higher satisfaction ratings for one service element
in this category. How long my bus trip takes – F Line (87%) v. Route 140 (80%)
• Personal safety while on the bus – Satisfaction with personal safety service elements
was generally similar between the F Line and Route 140 respondents when comparing satisfied/very satisfied, however significantly more Route 140 riders were dissatisfied (dissatisfied/very dissatisfied) with one element.
Personal safety while waiting for the bus at night – F Line (13%) v. Route 140 (18%) Waiting area / bus stop where boarded – F Line riders had significantly higher
satisfaction ratings for one service element in this category. Having information available about routes and connections – F Line (73%) v. Route 140
(63%) Things about buses – F Line riders had significantly higher satisfaction ratings for two
service elements in this category. Being able to get a seat – F Line (83%) v. Route 140 (75%)
Room to stand if no seats are available – F Line (79%) v. Route 140 (71%)
Ease of Transferring – All service elements in this category had only slight variations between F Line riders and Route 140 riders when looking at percent satisfied/very satisfied, however significantly more Route 140 riders were dissatisfied (dissatisfied/very dissatisfied) with two elements. The way buses are scheduled to make transfer connection – F Line (11%) v. Route 140 (16%)
Transfer information at the waiting area – F Line (8%) v. Route 140 (12%)

Metro RapidRide F Line Six Month Post-Implementation Survey 2014
7
Frequency and reliability of buses – F Line riders gave significantly higher satisfaction
ratings for three of the six elements in this category. The bus getting me where I'm going on time – F Line (83%) v. Route 140 (78%)
How often the bus runs during midday hours (9 a.m. to 3 p.m.) – F Line (79%) v. Route 140 (72%)
How often the bus runs in the evening /night – F Line (67%) v. Route 140 (58%)
How RapidRide compares to other Metro bus service – This question was added in the F Line 2014 survey asks respondents to compare the eight RapidRide service dimensions to other Metro bus service. Respondents rated RapidRide as better on all service dimension, with only a small percentage choosing other Metro is better (range of 4% to 6%). More than six out of ten F Line respondents feel that RapidRide is better than other Metro bus service in delivering all service elements. (Figure 8) Respondents chose RapidRide is better most often for how often the bus comes to your stop (82%) and the quality of the overall transit experience (82%).
Number of Rides Taken in Previous 30 Days – F Line riders tend to take more trips. Twenty-two percent (22%) of F Line respondents reported taking more than 40 rides in the 30 days prior to the survey, significantly higher than the 15 percent of Route 140 respondents who report taking this number of rides. Route 140 respondents were more likely to have taken between one and twenty rides (cited by 62% of Route 140 riders v. 51% of F Line riders.)
Transfers – Approximately two thirds (64%) reported transferring to or from the RapidRide F Line on their trip, significantly less than Route 140 riders (85%) who reported transferring to or from their bus line.
Reason for Riding – Riders are more likely to use the F Line to commute to work (63%) than to use it for other purposes. Commuting to and from work is also the top reason for riding the Route 140, however significantly fewer reported this (47%) compared to F Line riders. Significantly more F Line respondents also reported using the bus to go to and from school (17%) compared to Route 140 respondents (12%).
To and from work – F Line (63%) v. Route 140 (47%)
To and from school – F Line (17%) v. Route 140 (12%)
Days and times of riding – There were two points of significant difference between RapidRide F respondents and Route 140 respondents. RapidRide F riders were more likely to report riding during Weekday peak 6 AM to 9 AM, while Route 140 riders were more likely to report riding on Weekends.
Weekday peak 6 AM to 9 AM – F Line (52%) v. Route 140 (44%)
Weekends – F Line (26%) v. Route 140 (33%)

Metro RapidRide F Line Six Month Post-Implementation Survey 2014
8
Other ways to make this RapidRide trip – Nearly six in ten (57%) F Line respondents reported they would take another bus route to make the trip if they were not able to use the RapidRide F Line. (Not asked in the Route 140 survey.)
Payment of Fare – RapidRide F riders reported higher usage of the ORCA card to pay their fare while Route 140 riders were more likely to report paying by cash or with tickets.
Cash – F Line (44%) v. Route 140 (58%)
Tickets – F Line (7%) v. Route 140 (15%)
ORCA card (net mentions) – F Line (60%) v. Route 140 (51%)
Proof of payment – About two thirds (67%) of F Line respondents have been requested to show proof of payment by a fare enforcement officer. The majority felt the number of inspections by fare enforcement officers was either appropriate (61%) or that they should be more frequent (25%). Most felt the on-board fare inspection either makes the transit experience better (48%) or it makes no difference (39%). (Not asked in the Route 140 survey.)
Trip information sources – Half of F Line respondents (52%) reported using the real time information sign at stop for trip information and four out of ten (38%) use the OneBusAway phone application. One quarter (25%) use the Metro Transit web page and one fifth (21%) use printed timetables. (Not asked in the Route 140 survey.)
Recommendations for RapidRide improvements – One third (33%) said nothing required/fine as is. The top suggestion was to fix or add more WiFi (6%). (Not asked in the Route 140 survey.)

Metro RapidRide F Line Six Month Post-Implementation Survey 2014
9
CONCLUSIONS
Riders are significantly more satisfied with RapidRide F Line service than they were with Route 140. Overall satisfaction has risen by nine percentage points (80% for Route 140 and 89% for RapidRide F Line).
Riders were either significantly more satisfied or significantly less dissatisfied with the following service elements:
• The time the bus takes (significantly more satisfied),
• Personal safety while waiting for the bus at night (significantly less dissatisfied),
• Having information about routes and connections (significantly more satisfied),
• Being able to get a seat (significantly more satisfied),
• The way buses are scheduled to make transfer connections (significantly more satisfied)
• Transfer information at the waiting area (significantly more satisfied)
• The bus getting me where I am going on-time (significantly more satisfied)
• How often the bus runs during midday hours (9 a.m. to 3 p.m.) (significantly more satisfied)
• How often the bus runs in the evening /night (significantly more satisfied)
Riders also rated RapidRide F Line as better than other Metro service, and they ride RapidRide F Line more often than they rode Route 140.
RapidRide F Line riders are more likely to use their ORCA cards (when compared to Route 140 riders in April 2014) and the majority (67%) have been asked to show proof of payment to a fare enforcement officer. Riders feel that payment compliance checks are currently conducted at appropriate intervals (61%) or should be done more often (25%).
While most riders feel that no improvements are needed, those that do give a suggestion are most likely to ask for improved WiFi service.

Metro RapidRide F Line Six Month Post-Implementation Survey 2014
10
DETAILED FINDINGS
Overall Satisfaction with Service
Overall satisfaction with F Line service was significantly higher compared to satisfaction with Route 140. Nine out of ten respondents (88%), gave a rating of satisfied/very satisfied for the RapidRide F Line, compared to eight out of ten respondents (80%) rating Route 140. The mean satisfaction score was also significantly higher for the F Line (4.27) versus Route 140 (4.06).
Figure 1 Overall Satisfaction with Service
31%
41%
49%
47%
17%
9%
3%Route 140(n=367)
F Line 2014(n=493)
Very Satisfied Satisfied No Opinion Dissatisfied Very dissatisfied
Question 7: Overall, how satisfied are you with … 5 = very satisfied and 1 = very dissatisfied. May not add to 100% due to rounding. Data labels for 1% excluded from chart.
Satisfaction with Service Elements for F Line 2014 and Route 140
In addition to asking for a rating of satisfaction with overall service, respondents were asked to give satisfaction ratings for over 30 service elements grouped into six service dimensions. These ratings are presented in charts, and mean ratings are summarized in tables. The following information summarizes the primary findings in top 2 ratings (very satisfied/satisfied), bottom 2 ratings (dissatisfied/very dissatisfied) and mean ratings by survey topic area.
Rounding mechanisms inherent in the software can make these response proportions vary from cross tabulation results by up to 1 percentage point.
MEAN
4.06
4.27

Metro RapidRide F Line Six Month Post-Implementation Survey 2014
11
Trip Time Satisfaction with how long my bus trip takes was significantly higher among F Line respondents. Eighty-six percent were satisfied/very satisfied for the F Line compared to eighty percent for Route 140.
Satisfaction with number of stops my bus makes was comparable between the RapidRide F Line and Route 140 (73% satisfied/ very satisfied v. 72%, respectively.)
Figure 2 Satisfaction with Trip Time
How long my bus trip
takes
40%
43%
40%
43%
13%
10%
4%
2%
3%Route 140(n=506)
F Line 2014(n=536)
Very Satisfied Satisfied No Opinion Dissatisfied Very dissatisfied
Number of stops my
bus makes
29%
34%
43%
39%
22%
22%
4%
4%
Route 140(n=476)
F Line 2014(n=485)
Very Satisfied Satisfied No Opinion Dissatisfied Very dissatisfied
Questions 1A-B: Please check a box for each item to show how satisfied or dissatisfied you are with that item for this route you are riding. 5 = very satisfied and 1 = very dissatisfied.
May not add to 100% due to rounding. Data labels for 1% excluded from chart.
The mean satisfaction rating for the length of the bus trip was significantly higher for the RapidRide F Line compared to Route 140, while the mean satisfaction rating for number of stops was comparable.
Table 2 Mean Satisfaction Scores: Trip Time
F Line 2014 Route 140
How long my bus trip takes 4.26 4.10 Number of stops my bus makes 3.99 3.95
Questions 1A-B: Please check a box for each item to show how satisfied or dissatisfied you are with that item for this route you are riding. 5 = very satisfied and 1 = very dissatisfied.
Mean ratings that are shown in boldface type are significantly higher.

Metro RapidRide F Line Six Month Post-Implementation Survey 2014
12
Personal Safety Satisfaction scores for all five elements of personal safety were generally similar when comparing F Line respondents and Route 140 respondents.
• Personal safety while on the bus – F Line 2014 (78%) v. Route 140 (80%)
• Personal safety while waiting for the bus during the day – F Line 2014 (77%) v. Route 140 (80%)
• Behavior of other passengers on the bus – F Line 2014 (58%) v. Route 140 (58%)
• Personal safety while waiting for the bus at night – F Line 2014 (58%) v. Route 140 (56%)
• Behavior of other people at the waiting area – F Line 2014 (54%) v. Route 140 (54%)
Route 140 respondents were significantly more likely than F Line 2014 respondents to be dissatisfied/very dissatisfied on one personal safety elements:
• Personal safety while waiting for the bus at night – F Line 2014 (13%) v. Route 140 (18%)

Metro RapidRide F Line Six Month Post-Implementation Survey 2014
13
Figure 3 Satisfaction with Personal Safety
Personal safety while on
bus
44%
39%
36%
39%
15%
18%
4%
3%
Route 140(n=535)
F Line 2014(n=508)
Very Satisfied Satisfied No Opinion Dissatisfied Very dissatisfied
Personal safety while
waiting for the bus during the
day 38%
34%
42%
43%
17%
19%
2%
3%
Route 140(n=515)
F Line 2014(n=494)
Very Satisfied Satisfied No Opinion Dissatisfied Very dissatisfied
Behavior of other
passengers on the bus
25%
24%
33%
34%
27%
31% 9%
11% 4%
3%
Route 140(n=524)
F Line 2014(n=496)
Very Satisfied Satisfied No Opinion Dissatisfied Very dissatisfied
Questions 2A-E: Please check a box for each item to show how satisfied or dissatisfied you are with that item for this route you are riding. 5 = very satisfied and 1 = very dissatisfied.
Figure continued on following page.
May not add to 100% due to rounding. Data labels for 1% excluded from chart.

Metro RapidRide F Line Six Month Post-Implementation Survey 2014
14
Figure 3 (Continued) Satisfaction with Personal Safety
Personal safety while
waiting for the bus at night
25%
26%
31%
32%
26%
30%
12%
9%
6%
4%
Route 140(n=471)
F Line 2014(n=464)
Very Satisfied Satisfied No Opinion Dissatisfied Very dissatisfied
Behavior of other people at
the waiting area
23%
23%
31%
31%
32%
34%
10%
8%
4%
3%
Route 140(n=515)
F Line 2014(n=496)
Very Satisfied Satisfied No Opinion Dissatisfied Very dissatisfied
Questions 2A-E: Please check a box for each item to show how satisfied or dissatisfied you are with that item for this route you are riding. 5 = very satisfied and 1 = very dissatisfied.
May not add to 100% due to rounding.
Mean ratings for all elements of personal safety were similar for the F Line 2014 and Route 140. There were no significant differences. (Table 3)
Table 3 Mean Satisfaction Scores: Personal Safety
F Line 2014
Route 140
Personal safety while on the bus. 4.10 4.19
Personal safety while waiting for the bus during the day. 4.06 4.12
Behavior of other passengers on the bus. 3.67 3.64
Personal safety while waiting for the bus at night. 3.67 3.57
Behavior of other people at the waiting area. 3.62 3.59
Questions 2A-E: Please check a box for each item to show how satisfied or dissatisfied you are with that item for this route you are riding. 5 = very satisfied and 1 = very dissatisfied.

Metro RapidRide F Line Six Month Post-Implementation Survey 2014
15
Waiting Area/Bus Stop Where You Boarded For This Trip Satisfaction ratings for five of six elements of waiting area/bus stop where you boarded for this trip did not significantly change when comparing the RapidRide F Line responses and Route 140 responses.
There was one area where F Line respondents showed significantly higher satisfaction (rating of very satisfied/satisfied): Having information available about routes and connections, F Line (74%) v. Route 140 (63%).
Overall dissatisfaction (rating of dissatisfied/very dissatisfied) was also significantly higher among Route 140 respondents for Having information available about routes and connections, F Line (10%) v. Route 140 (18%).
One additional significant difference in this service area is that significantly more F Line respondents were dissatisfied (dissatisfied/very dissatisfied) with Convenience of the bus stop to my home or where I was coming from, F Line (9%) v. Route 140 (5%).
A seventh element was tested in the F Line survey – information provided on the electronic real time information sign. There is no comparative data for this element for the Route 140, and approximately eight out of ten F Line respondents were satisfied (78%) with this element.

Metro RapidRide F Line Six Month Post-Implementation Survey 2014
16
Figure 4 Satisfaction with Waiting Area/Bus Stop Where You Boarded for This Trip
Information provided on
the electronic real time
information sign
42% 36% 15% 4%2%
Not asked ofRoute 140
F Line 2014(n=486)
Very Satisfied Satisfied No Opinion Dissatisfied Very dissatisfied
Convenience of the bus stop to my
home or where I was coming
from 39%
36%
38%
36%
18%
19%
3%
5%4%
2%Route 140
(n=523)
F Line 2014(n=500)
Very Satisfied Satisfied No Opinion Dissatisfied Very dissatisfied
Having information
available about routes
and connections
32%
34%
31%
40%
19%
17%
11%
5%
7%
5%
Route 140(n=518)
F Line 2014(n=498)
Very Satisfied Satisfied No Opinion Dissatisfied Very dissatisfied
Amount of lighting
27%
28%
37%
39%
21%
19%
11%
10%
4%
3%
Route 140(n=503)
F Line 2014(n=487)
Very Satisfied Satisfied No Opinion Dissatisfied Very dissatisfied
Questions 3A-G: Please check a box for each item to show how satisfied or dissatisfied you are with that item for this route you are riding. 5 = very satisfied and 1 = very dissatisfied.
Figure continued on following page. May not add to 100% due to rounding.

Metro RapidRide F Line Six Month Post-Implementation Survey 2014
17
Figure 4 (Continued.) Satisfaction with Waiting Area/Bus Stop Where You Boarded for This Trip
Being able to sit down while
waiting
34%
30%
28%
36%
19%
18%
13%
11%
6%
6%
Route 140(n=516)
F Line 2014(n=500)
Very Satisfied Satisfied No Opinion Dissatisfied Very dissatisfied
Cleanliness of waiting area
25%
27%
35%
35%
23%
23%
12%
10%
4%
6%
Route 140(n=521)
F Line 2014(n=497)
Very Satisfied Satisfied No Opinion Dissatisfied Very dissatisfied
Protection from the weather
24%
24%
25%
26%
23%
21%
19%
20%
9%
8%
Route 140(n=509)
F Line 2014(n=486)
Very Satisfied Satisfied No Opinion Dissatisfied Very dissatisfied
Questions 3A-G: Please check a box for each item to show how satisfied or dissatisfied you are with that item for this route you are riding. 5 = very satisfied and 1 = very dissatisfied.
May not add to 100% due to rounding.

Metro RapidRide F Line Six Month Post-Implementation Survey 2014
18
Table 4 displays the mean satisfaction scores for all elements of waiting area/bus stop where you boarded for this trip. Results found one mean rating for these service elements significantly higher for the F Line compared to Route 140:
• Having information available about routes and connections – F Line (3.93) v. Route 140 (3.70)
Table 4 Mean Satisfaction Scores: Waiting Area/Bus Stop Where You Boarded for This Trip
F Line 2014
Route 140
Information provided on the electronic real time information sign 4.12 N/A
Convenience of the bus stop to my home or where I was coming from 3.96 4.08
Having information available about routes and connections 3.93 3.70
Amount of lighting 3.79 3.71
Being able to sit down while waiting 3.74 3.70
Cleanliness of the waiting area 3.67 3.65
Protection from the weather 3.38 3.38
Questions 3A-G: Please check a box for each item to show how satisfied or dissatisfied you are with that item for this route you are riding. 5 = very satisfied and 1 = very dissatisfied.
Mean ratings that are shown in boldface type are significantly higher.
Things about Buses Respondents were also asked to rate their satisfaction on things about the bus. A comparison of satisfaction ratings (Figure 5) found F Line respondents were more satisfied (higher satisfied/very satisfied ratings) than Route 140 respondents with two elements:
• Being able to get a seat – F Line 2014 (84%) v. Route 140 (75%)
• Room to stand if no seats are available – F Line 2014 (78%) v. Route 140 (71%)
Satisfaction was comparable for two other elements:
• Enough bars /straps to hang onto while standing – F Line 2014 (81%) v. Route 140 (83%)
• Cleanliness of the bus interior – F Line 2014 (74%) v. Route 140 (72%)
A fifth element was tested in the F Line survey – Having free WiFi. There is no comparative data for this element for the Route 140, and approximately seven out of ten F Line respondents were satisfied (73%) with this element.

Metro RapidRide F Line Six Month Post-Implementation Survey 2014
19
Figure 5 Things about Buses
Being able to get a seat
38%
40%
37%
44%
18%
12% 4%
5%2%Route 140
(n=533)
F Line 2014(n=507)
Very Satisfied Satisfied No Opinion Dissatisfied Very Dissatisfied
Having enough bars / straps to hang
onto while standing
42%
41%
41%
40%
13%
15% 3%
3%Route 140(n=521)
F Line 2014(n=486)
Very Satisfied Satisfied No Opinion Dissatisfied Very Dissatisfied
Room to stand if no seats are
available
32%
35%
39%
43%
23%
15%
4%
4%2%
Route 140(n=508)
F Line 2014(n=480)
Very Satisfied Satisfied No Opinion Dissatisfied Very Dissatisfied
Questions 4A-E: Please check a box for each item to show how satisfied or dissatisfied you are with that
item for this route you are riding. 5 = very satisfied and 1 = very dissatisfied. May not add to 100% due to rounding. Data labels for 1% excluded from chart.

Metro RapidRide F Line Six Month Post-Implementation Survey 2014
20
Figure 5 (Continued.) Things about Buses
Having free Wi-Fi
48% 26% 18% 4%4%
Not Asked ofRoute 140
F Line 2014(n=469)
Very Satisfied Satisfied No Opinion Dissatisfied Very Dissatisfied
Cleanliness of the bus interior
30%
37%
42%
37%
21%
19% 5%
5%2%
2%
Route 140(n=516)
F Line 2014(n=495)
Very Satisfied Satisfied No Opinion Dissatisfied Very Dissatisfied
Questions 4A-E: Please check a box for each item to show how satisfied or dissatisfied you are with that item for this route you are riding. 5 = very satisfied and 1 = very dissatisfied.
May not add to 100% due to rounding. Data labels for 1% excluded from chart. A comparison of mean satisfaction shows comparable ratings for most elements, but significantly higher ratings among F Line respondents for one element.
• Being able to get a seat – F Line (4.17) v. Route 140 (4.05)
Table 5 Mean Satisfaction Scores: Things about buses – Year 3 vs. Year 1
F Line 2014
Route 140
Enough bars / straps to hang onto while standing 4.16 4.19
Being able to get a seat 4.17 4.05
Having free Wi-Fi 4.08 N/A
Room to stand if no seats are available 4.06 3.96
Cleanliness of the bus interior 4.01 3.94
Questions 4A-E: Please check a box for each item to show how satisfied or dissatisfied you are with that item for this route you are riding. 5 = very satisfied and 1 = very dissatisfied.
Mean ratings that are shown in boldface type are significantly higher.

Metro RapidRide F Line Six Month Post-Implementation Survey 2014
21
Ease of Transferring Riders rated their satisfaction with six elements regarding the Ease of transferring to or from the RapidRide F Line (Figure 6).
There were no significant differences in the percentage of very satisfied/satisfied ratings between the F Line respondents v. the Route 140 respondents on any of the six aspects of transfers.
However, there were a few changes noted regarding the combined very dissatisfied/dissatisfied ratings:
Significantly more Route 140 riders were very dissatisfied/dissatisfied with:
• The way buses are scheduled to make transfer connections – F Line 2014 (11%) v. Route 140 (15%)
• Transfer information at the waiting area – F Line 2014 (8%) v. Route 140 (12%)

Metro RapidRide F Line Six Month Post-Implementation Survey 2014
22
Figure 6 Satisfaction with Ease of Transferring
The number of transfers I
make
39%
34%
41%
43%
15%
16%
4%
5%
2%
2%
Route 140(n=497)
F Line 2014(n=447)
Very Satisfied Satisfied No Opinion Dissatisfied Very Dissatisfied
Helpfulness of drivers in ensuring transfer
connections
32%
33%
38%
36%
19%
22%
6%
4%
5%
3%
Route 140(n=476)
F Line 2014(n=431)
Very Satisfied Satisfied No Opinion Dissatisfied Very Dissatisfied
The way buses are
scheduled to make transfer connections
28%
31%
38%
40%
18%
19%
10%
6%5%
5%Route 140
(n=486)
F Line 2014(n=443)
Very Satisfied Satisfied No Opinion Dissatisfied Very Dissatisfied
Questions 5A-G: Please check a box for each item to show how satisfied or dissatisfied you are with that
item for this route you are riding. 5 = very satisfied and 1 = very dissatisfied. Figure continued on following page. May not add to 100% due to rounding.

Metro RapidRide F Line Six Month Post-Implementation Survey 2014
23
Figure 6 (Cont’d.) Satisfaction with Ease of Transferring
The bus coming on time
when transferring
25%
31%
39%
37%
20%
19%
11%
7%
6%
5%
Route 140(n=483)
F Line 2014(n=443)
Very Satisfied Satisfied No Opinion Dissatisfied Very Dissatisfied
Transfer information at
the waiting area
27%
31%
39%
38%
22%
23%
9%
4%
3%
4%
Route 140(n=486)
F Line 2014(n=446)
Very Satisfied Satisfied No Opinion Dissatisfied Very Dissatisfied
Waiting time between transfers
24%
26%
39%
42%
22%
19%
11%
8%
4%
4%
Route 140(n=497)
F Line 2014(n=439)
Very Satisfied Satisfied No Opinion Dissatisfied Very Dissatisfied
Questions 5A-F: Please check a box for each item to show how satisfied or dissatisfied you are with that item for this route you are riding. 5 = very satisfied and 1 = very dissatisfied.
May not add to 100% due to rounding.

Metro RapidRide F Line Six Month Post-Implementation Survey 2014
24
Table 6 shows no significant differences in mean satisfaction ratings for five of the six elements of transfers, and significantly higher mean satisfaction ratings for F Line respondents than for Route 140 respondents for one of the elements.
• The bus coming on time when transferring – F Line 2014 (3.82) v. Route 140 (3.66)
Table 6 Mean Satisfaction Scores: Ease of Transferring
F Line 2014
Route 140
The number of transfers I make. 4.01 4.09
Helpfulness of drivers in ensuring transfer connections. 3.92 3.86
Transfer information at the waiting area. 3.89 3.78
The way buses are scheduled to make transfer connections. 3.86 3.74
The bus coming on time when transferring. 3.82 3.66
Waiting time between transfers. 3.78 3.66
Questions 5A-F: Please check a box for each item to show how satisfied or dissatisfied you are with that item for this route you are riding. 5 = very satisfied and 1 = very dissatisfied.
Mean ratings that are shown in boldface type are significantly higher.
Frequency and Reliability of Buses Of the six elements of frequency and reliability of buses rated in the survey, satisfaction was significantly higher among F Line respondents on three elements: (Figure 7)
• The bus getting me where I'm going on time – F Line 2014 (84%) v. Route 140 (77%)
• How often the bus runs during midday hours (9 a.m. to 3 p.m.) – F Line 2014 (79%) v. Route 140 (72%)
• How often the bus runs in the evening / night – F Line 2014 (67%) v. Route 140 (58%)
Additionally, significantly more Route 140 riders were very dissatisfied/dissatisfied with:
• How often the bus runs in the evening / night – F Line 2014 (8%) v. Route 140 (19%) • How often the bus runs on weekends – F Line 2014 (9%) v. Route 140 (18%)

Metro RapidRide F Line Six Month Post-Implementation Survey 2014
25
Figure 7 Satisfaction with Frequency and Reliability of Buses
The bus getting me where I’m
going on time 38%
40%
39%
44%
15%
13%
5%
3%
2%
2%
Route 140(n=539)
F Line 2014(n=510)
Very Satisfied Satisfied No Opinion Dissatisfied Very dissatisfied
How often the bus runs
during peak hours
31%
39%
44%
41%
18%
15%
5%
4%
Route 140(n=521)
F Line 2014(n=493)
Very Satisfied Satisfied No Opinion Dissatisfied Very dissatisfied
How often the bus runs
during midday hours
30%
35%
42%
44%
20%
16%
7%
4%
Route 140(n=516)
F Line 2014(n=473)
Very Satisfied Satisfied No Opinion Dissatisfied Very dissatisfied
How early the bus runs in the
morning
33%
35%
38%
41%
18%
17%
7%
4%
4%
2%
Route 140(n=90)
F Line 2014(n=482)
Very Satisfied Satisfied No Opinion Dissatisfied Very dissatisfied
Questions 6A - F: Please check a box for each item to show how satisfied or dissatisfied you are with that item for this route you are riding. 5 = very satisfied and 1 = very dissatisfied.
Figure continued on following page. May not add to 100% due to rounding. Data labels for 1% excluded from chart.

Metro RapidRide F Line Six Month Post-Implementation Survey 2014
26
Figure 7 (Cont’d.) Satisfaction with Frequency and Reliability of Buses
How often the bus runs on weekends
25%
29%
36%
36%
21%
26%
13%
6%
5%
3%
Route 140(n=495)
F Line 2014(n=446)
Very Satisfied Satisfied No Opinion Dissatisfied Very dissatisfied
How often the
bus runs in the evening /
night
24%
27%
34%
40%
23%
24%
13%
6%
6%
2%
Route 140(n=480)
F Line 2014(n=462)
Very Satisfied Satisfied No Opinion Dissatisfied Very dissatisfied
Questions 6A - F: Please check a box for each item to show how satisfied or dissatisfied you are with that item for this route you are riding. 5 = very satisfied and 1 = very dissatisfied.
May not add to 100% due to rounding.
Mean satisfaction scores for four of the six elements of frequency and reliability of buses were significantly higher among F Line respondents v. Route 140 respondents. (Table 7)
Table 7 Mean Satisfaction Scores: Frequency and Reliability of Buses
F Line 2014
Route 140
The bus getting me where I'm going on time. 4.17 4.07
How often the bus runs during peak hours (6-9 a.m. and 3-6 p.m.). 4.13 3.98
How often the bus runs during midday hours (9 a.m. to 3 p.m.). 4.08 3.94
How early the bus runs in the morning. 4.02 3.89
How often the bus runs in the evening / night. 3.82 3.57
How often the bus runs on weekends. 3.81 3.63 Questions 6A - F: Please check a box for each item to show how satisfied or dissatisfied you are with that item for this route you are riding. 5 = very satisfied and 1 = very dissatisfied. Mean ratings that are shown in boldface type are significantly higher.

Metro RapidRide F Line Six Month Post-Implementation Survey 2014
27
How RapidRide Compares to Other Metro Bus Service
This new question added in the RapidRide survey asks the respondent to compare RapidRide service elements to other Metro bus service. On all service elements asked, very few chose other Metro is better (range of 4% to 6%) in delivering that service element. In all of the elements, more than six in ten respondents feel that RapidRide is better than other Metro bus service.
Respondents chose RapidRide is better most often for how often the bus comes to your stop (82%) and the quality of the overall transit experience (82%).
Figure 8 How RapidRide compares to other Metro bus service
82%
82%
78%
77%
74%
73%
69%
65%
14%
14%
18%
18%
20%
21%
25%
30%
4%
4%
4%
5%
6%
6%
6%
5%
How often the bus comes to your stop
The quality of the overall transit experience
The hours during the day that the bus operates
The ability to get you where you are going on time
The shelters and features at the bus stop
Not having to rely on a predetermined schedulewhen going to the bus stop
The time the bus spends at each bus stop
Your personal safety
RapidRide Better No Difference Other Metro Better
Q8A – H. How do you feel RapidRide compares to other Metro bus service for the following items? (n=490-502) May not add to 100% due to rounding.

Metro RapidRide F Line Six Month Post-Implementation Survey 2014
28
Transit Trips Taken
Table 8 shows significantly fewer F Line respondents took 20 rides or less in the 30 days preceding the survey. The proportion that took more than 40 rides was significantly higher among F Line respondents (22%) v. Route 140 respondents (15%).
Table 8 Rides Taken in the Previous 30 Days
F Line 2014
Route 140
(Base) (475) (500)
1-20 Rides in past 30 days 51% 62%
21-40 Rides in past 30 days 27% 23%
More than 40 rides in past 30 days 22% 15%
Mean 27.14 24.18 Question 9: How many rides have you taken on RapidRide F Line/this route in the last 30 days? Percentages that are shown in boldface type are significantly higher.
Reason for Riding
Respondents were also asked to list the purpose of the trip that they take most often on this route. Table 9 shows riders are most likely to use the F Line to commute to work (63%) than to use it for other purposes. While going to/from work is also the number one reason for riding given by Route 140 riders, significantly more F Line respondents cited this reason. Additionally, significantly more F Line respondents took the bus to or from school (17%) compared to Route 140 respondents (12%).

Metro RapidRide F Line Six Month Post-Implementation Survey 2014
29
Table 9 Reasons for Riding
F Line 2014
Route 140
(Base) (514) (545)
To / from work 63% 47%
Shopping / errands 20% 21%
Appointments 19% 21%
Fun / recreation / social 18% 19%
To / from school 17% 12% Question 10: What is the purpose of the trip you take most often on the RapidRide F Line/this route? Percentages that are shown in boldface type are significantly higher. Multiple response question; proportions may add to more than 100%.
Days and Times of Riding
Weekday AM peak hours is the most common time to ride in either the F Line or Route 140, but significantly more F Line respondents cite this time (52%) compared to Route 140 riders (44%). Route 140 respondents are more likely to cite weekends (33%) compared to F Line respondents (26%).
Table 10 Times of the Day and Week Using the Bus
F Line 2014
Route 140
(Base) (505) (543)
Weekdays - before 6 a.m. 19% 17%
Weekdays - AM peak (6-9 a.m.) 52% 44%
Weekdays - PM peak (3-6 p.m.) 44% 50%
Weekdays 9 a.m. to 3 p.m. 34% 37%
Weekdays 6-9 p.m. 29% 29%
Weekdays later than 9 p.m. 14% 15%
Weekends 26% 33% Question 11: When do you usually ride RapidRide F line? Percentages that are shown in boldface type are significantly higher. Multiple response question; proportions may add to more than 100%.

Metro RapidRide F Line Six Month Post-Implementation Survey 2014
30
If you did not use RapidRide F Line, how would you make this trip?
Over half (57%) of respondents reported they would take another bus route to make the trip if they were not able to use RapidRide F Line. (New question in survey, no comparative data for Route 140.)
Table 11
If you did not use RapidRide F Line how would you make this trip?
F Line 2014
(Base) (506)
Another bus route 57%
Walk 18%
No other option is available to me 14%
Drive alone 11%
Get dropped off 11%
Carpool / Vanpool 5%
Bike 5% Question 12: If you did not use RapidRide F Line, how would you make this trip? Multiple response question; proportions may add to more than 100%.
Transfers
Approximately two thirds of F Line respondents (64%) reported transferring to or from the RapidRide F Line on their trip. This is significantly fewer than those who reported transferring to or from the Route 140 (85%).
Note some of the difference in the responses to this question may be the result of a change in the question wording. In the Route 140 questionnaire this was asked as two questions: Will you transfer from Route 140 TO another train/bus on this trip?, and Did you transfer to Route 140 FROM from another train/bus on this trip? These two responses were then netted into one for comparison with the six month follow-up survey results.
Table 12 Transfers – Percent Answering Yes
F Line 2014
Route 140
(Base) (497) (486)
Transfer TO or FROM RapidRide F Line (Route 140) on this trip 64% 85% Question 13: Did you transfer TO/FROM the RapidRide F Line (Route 140) on this trip today?

Metro RapidRide F Line Six Month Post-Implementation Survey 2014
31
Buses Transferred to or from RapidRide Transfer information for RapidRide F Line and Route 140 is summarized in Table 13.
Table 13 Buses Transferred To / From, for Access to RapidRide (or Route 140)
To/From F Line
To/From Route 140
(Base) (279) (375)
RapidRide A Line 13% 17%
150 6% 12%
Light Rail (Link) 11% 8%
120 6% 10%
128 4% 8%
101 6% 5%
Train/Sounder 3% 6%
105 4% 6%
124 4% 5%
Other named route 46% 47% Questions 13-Bus#: Which route? ( transfer to/From)
Fares
F Line respondents were significantly more like to report using ORCA to pay their fare while Route 140 respondents were more likely to report using cash or tickets.
Table 14 Use of ORCA Cards to Pay Fares
F Line 2014
Route 140
(Base) (520) (539)
ORCA Net 60% 51%
ORCA card - Pass 22% 17%
ORCA card - E-purse / money on the card 16% 12%
ORCA card – both a pass and an e-purse 4% 7%
ORCA card - not specified 19% 15%
Cash 44% 58%
Tickets 7% 15%
Upass 1% 0%
Other 3% 1% Q14. How do you pay your fare? (Multiple responses possible.)

Metro RapidRide F Line Six Month Post-Implementation Survey 2014
32
Use of the Off-Board ORCA Card Reader Approximately six in ten respondents (57%) reported using the off board card reader in the F Line 2014 survey. (Table 15) (New question in survey, no comparative data for Route 140.)
Table 15 Use of the Off-Board ORCA Card Reader
F Line 2014
(Base) (509)
Yes 59%
No 41% Question 15: Have you used the ORCA reader that is located off the bus at the RapidRide station?
About two thirds of F Line riders reported being asked to provide proof of payment by a Fare Enforcement Officer (67%). (Table 16)
About six in ten respondents found the number of payment inspections to be appropriate (61%). (Table 16)
About five in ten (48%) felt the on-board fare inspection impacted their transit experience in a positive way and about four out of ten felt it made no difference (39%). Slightly more than one in ten (14%) felt it made their experience worse.
Table 16 Proof of Payment
F Line 2014
(Base) (484)
Yes 67%
No 33%
Perceptions of payment inspections: (393)
Appropriate 61%
Should be more frequent 25%
Should be less frequent 14%
Impact on transit experience: (398)
Significantly better 24%
Somewhat better 24%
No difference 39%
Somewhat worse 8%
Significantly worse 6% Question 16, 17 and 18: On the RapidRide F Line, have you ever been requested to show your proof of payment by a Fare Enforcement Officer? (IF YES) Is the number of inspections by the officers …? (IF YES) how is your transit experience impacted by on-board fare inspection?

Metro RapidRide F Line Six Month Post-Implementation Survey 2014
33
Trip Information Sources
About one half of respondents (52%) use the real time information sign at stop for trip information on RapidRide F Line and nearly four out of ten (38%) use the OneBusAway phone application. One quarter (25%) use the Metro Transit web page and one fifth (21%) use printed timetables.
Table 17 RapidRide F Line information sources
F Line 2014
(Base) (501)
Real time information sign at stop 52%
The OneBusAway smart phone application 38%
Metro Transit web page 25%
Metro's printed timetables 21%
Other (SPECIFY) 6% Question 20: What trip information sources do you use for traveling on RapidRide F Line? Multiple response question; proportions may add to more than 100%.
Feelings about RapidRide F Line
The majority of riders either have high expectations (46%) or generally expect high quality service (44%) from RapidRide F line and believe RapidRide F Line will provide the quality of service they expect. (New question in survey, no comparative data for Route 140.)
Table 18 Feelings About RapidRide F Line
F Line 2014
(Base) (473)
I have high expectations of RapidRide F Line and I am very confident that they provide the quality of service I expect
46%
I generally expect high quality service from RapidRide F Line and I am generally confident that they will provide the quality of service that I expect
44%
Generally expect both good and bad service from RapidRide F Line and am not fully confident that they will provide the quality of service I would like
9%
I have low expectations of RapidRide F Line and would expect to encounter problems when riding
1%
I have very low expectations of RapidRide F Line and would not ride unless I absolutely had to
0%
Question 21: Based on anything you have seen, heard or directly experienced, which of the following statements best describes how you feel about RapidRide F Line? May not add to 100% due to rounding.

Metro RapidRide F Line Six Month Post-Implementation Survey 2014
34
Recommendations for RapidRide F Line Improvements
F Line riders were asked to give one recommendation for improving the service. (Table 19)
One third (33%) said nothing required/fine as is. The top suggestion was to fix or add more WIFI (6%). (New to the survey; comparative data for Route 140 not available.)
Table 19 Recommendations for Improving RapidRide F Line Service
F Line 2014
(Base) (324) Nothing/Fine as is/other positive 33% WIFI - Fix/add more 6% Make transfers easier/Wait for transferring passengers 5% Better bus amenities (Food, drinks, heat, music, etc.) 5% More shelters 5% Buses arrive/leave according to schedule/be on time 5% Expand bus schedule EVENING/NIGHTS 4% Nicer drivers/better drivers/safer, more careful drivers 4% Take care of security or rowdy passenger concerns/Safety on bus 4% Less stops/More direct routes/Express bus/Shorten the route 3% Use different routes/suggested reroutes 3% Keep fares low/Don't Raise fares/Lower fares 3% Increase bus frequency 2% More buses 2% More lighting at shelters 2% Bus stops - more stops/Add new bus stop locations/Extend route 2% Fare enforcers are rude/Less fare enforcers 2% Clean the buses/maintain buses/repair buses 2% More fare enforcement 2% More comfortable seats 2% Question 30: Finally, what one thing would you recommend to improve this route? Responses gathering less than 2% of total response are not shown, refer to cross tabulations for the full list.

Metro RapidRide F Line Six Month Post-Implementation Survey 2014
35
Respondent Profile
Table 20 Profile of Survey Respondents
F Line 2014 Route 140 Gender (508) (541)
Male 54% 52% Female 46% 48%
Age (482) (423)
Under 18 8% 9% 18 to 24 28% 24% 25 to 34 24% 19% 35 to 44 14% 13% 45 to 54 13% 17% 55 to 64 9% 12% 65 and older 5% 6% Mean 34.10 36.48
Length of time as a Metro rider (501) (534)
Less than 6 months 16% 9% 6 to 12 months 10% 12% More than 1 year, less than 5 years 26% 25% 5 years or longer 49% 54%
Hispanic (484) (516) Yes 18% 20% No 82% 80% White (477) (498) Yes 46% 43% No 54% 57% Income (440) (493) Under $20,000 per year 45% 58% $20,000 up to $35,000 29% 25% $35,000 and up 26% 17% Language spoken at home (484) (531) English 89% 84% Other 11% 16%
May not add to 100% due to rounding.
Percentages or means that are shown in boldface type are significantly higher.

Metro RapidRide F Line Six Month Post-Implementation Survey 2014
36
Appendix
Metro RapidRide F Line Six Month Post-Implementation Survey 2014
37
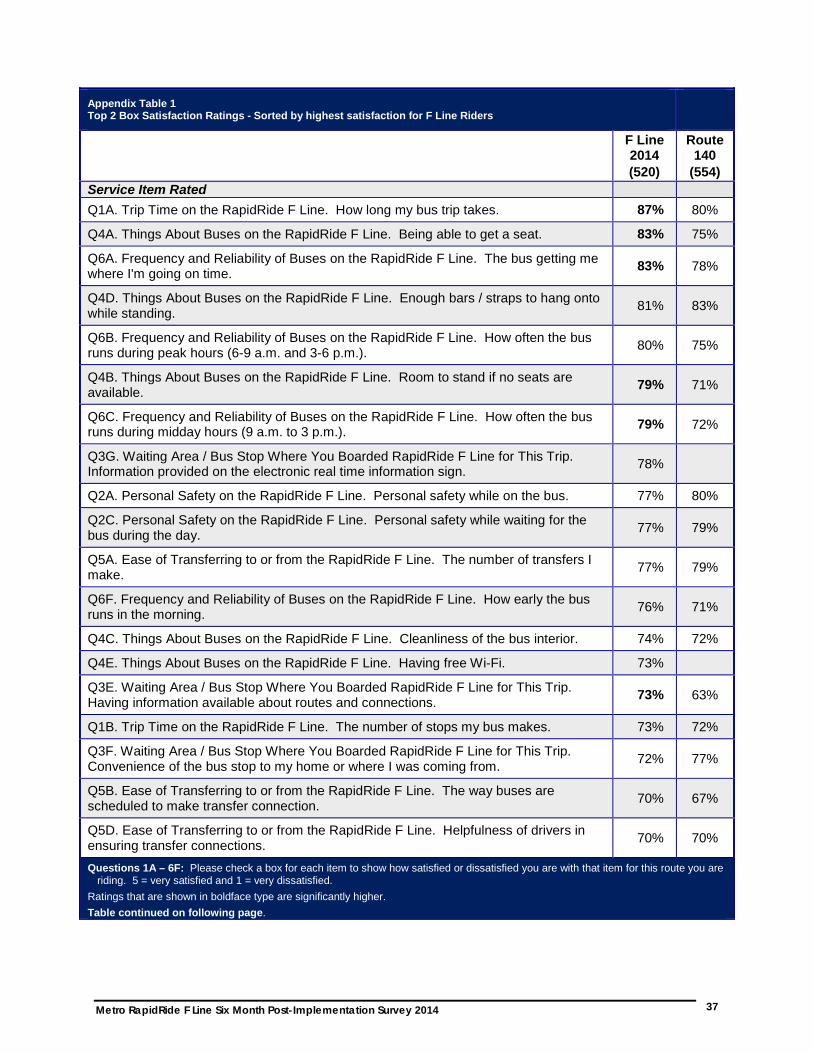
Appendix Table 1 Top 2 Box Satisfaction Ratings - Sorted by highest satisfaction for F Line Riders
F Line 2014 (520)
Route 140
(554) Service Item Rated Q1A. Trip Time on the RapidRide F Line. How long my bus trip takes. 87% 80%
Q4A. Things About Buses on the RapidRide F Line. Being able to get a seat. 83% 75%
Q6A. Frequency and Reliability of Buses on the RapidRide F Line. The bus getting me where I'm going on time. 83% 78%
Q4D. Things About Buses on the RapidRide F Line. Enough bars / straps to hang onto while standing. 81% 83%
Q6B. Frequency and Reliability of Buses on the RapidRide F Line. How often the bus runs during peak hours (6-9 a.m. and 3-6 p.m.). 80% 75%
Q4B. Things About Buses on the RapidRide F Line. Room to stand if no seats are available. 79% 71%
Q6C. Frequency and Reliability of Buses on the RapidRide F Line. How often the bus runs during midday hours (9 a.m. to 3 p.m.). 79% 72%
Q3G. Waiting Area / Bus Stop Where You Boarded RapidRide F Line for This Trip. Information provided on the electronic real time information sign. 78%
Q2A. Personal Safety on the RapidRide F Line. Personal safety while on the bus. 77% 80%
Q2C. Personal Safety on the RapidRide F Line. Personal safety while waiting for the bus during the day. 77% 79%
Q5A. Ease of Transferring to or from the RapidRide F Line. The number of transfers I make. 77% 79%
Q6F. Frequency and Reliability of Buses on the RapidRide F Line. How early the bus runs in the morning. 76% 71%
Q4C. Things About Buses on the RapidRide F Line. Cleanliness of the bus interior. 74% 72%
Q4E. Things About Buses on the RapidRide F Line. Having free Wi-Fi. 73%
Q3E. Waiting Area / Bus Stop Where You Boarded RapidRide F Line for This Trip. Having information available about routes and connections. 73% 63%
Q1B. Trip Time on the RapidRide F Line. The number of stops my bus makes. 73% 72%
Q3F. Waiting Area / Bus Stop Where You Boarded RapidRide F Line for This Trip. Convenience of the bus stop to my home or where I was coming from. 72% 77%
Q5B. Ease of Transferring to or from the RapidRide F Line. The way buses are scheduled to make transfer connection. 70% 67%
Q5D. Ease of Transferring to or from the RapidRide F Line. Helpfulness of drivers in ensuring transfer connections. 70% 70%
Questions 1A – 6F: Please check a box for each item to show how satisfied or dissatisfied you are with that item for this route you are riding. 5 = very satisfied and 1 = very dissatisfied.
Ratings that are shown in boldface type are significantly higher. Table continued on following page.

Metro RapidRide F Line Six Month Post-Implementation Survey 2014
38
Appendix Table 1 - continued Top 2 Box Satisfaction Ratings - Sorted by highest satisfaction for F Line Riders
F Line 2014 (520)
Route 140
(554) Service Item Rated Q5F. Ease of Transferring to or from the RapidRide F Line. Transfer information at the waiting area. 69% 66%
Q5E. Ease of Transferring to or from the RapidRide F Line. The bus coming on time when transferring. 69% 63%
Q5C. Ease of Transferring to or from the RapidRide F Line. Waiting time between transfers. 69% 63%
Q3C. Waiting Area / Bus Stop Where You Boarded RapidRide F Line for This Trip. Amount of lighting. 68% 64%
Q6D. Frequency and Reliability of Buses on the RapidRide F Line. How often the bus runs in the evening / night. 67% 58%
Q3A. Waiting Area / Bus Stop Where You Boarded RapidRide F Line for This Trip. Being able to sit down while waiting. 66% 62%
Q6E. Frequency and Reliability of Buses on the RapidRide F Line. How often the bus runs on weekends. 65% 61%
Q3B. Waiting Area / Bus Stop Where You Boarded RapidRide F Line for This Trip. Cleanliness of waiting area. 62% 60%
Q2D. Personal Safety on the RapidRide F Line. Personal safety while waiting for the bus at night. 58% 56%
Q2B. Personal Safety on the RapidRide F Line. Behavior of other passengers on the bus. 58% 58%
Q2E. Personal Safety on the RapidRide F Line. Behavior of other people at the waiting area. 54% 54%
Q3D. Waiting Area / Bus Stop Where You Boarded RapidRide F Line for This Trip. Protection from the weather. 50% 50%
Questions 1A – 6F: Please check a box for each item to show how satisfied or dissatisfied you are with that item for this route you are riding. 5 = very satisfied and 1 = very dissatisfied. Ratings that are shown in boldface type are significantly higher.

Metro RapidRide F Line Six Month Post-Implementation Survey 2014
39
Appendix Table 2 Gap in Top 2 Box Satisfaction Ratings – Sorted by Largest to Smallest Size Gap, F Line v. Route 140
F Line 2014 (520)
Route 140
(554)
% Gap F Line -
Route 140
Service Item Rated
Q3F. Waiting Area / Bus Stop Where You Boarded RapidRide F Line for This Trip. Convenience of the bus stop to my home or where I was coming from.
72% 77% -5%
Q2A. Personal Safety on the RapidRide F Line. Personal safety while on the bus. 77% 80% -3%
Q5A. Ease of Transferring to or from the RapidRide F Line. The number of transfers I make. 77% 79% -2%
Q2C. Personal Safety on the RapidRide F Line. Personal safety while waiting for the bus during the day. 77% 79% -2%
Q4D. Things About Buses on the RapidRide F Line. Enough bars / straps to hang onto while standing. 81% 83% -2%
Q5D. Ease of Transferring to or from the RapidRide F Line. Helpfulness of drivers in ensuring transfer connections. 70% 70% 0%
Q2E. Personal Safety on the RapidRide F Line. Behavior of other people at the waiting area. 54% 54% 0%
Q2B. Personal Safety on the RapidRide F Line. Behavior of other passengers on the bus. 58% 58% 0%
Q1B. Trip Time on the RapidRide F Line. The number of stops my bus makes. 73% 72% 1%
Q3D. Waiting Area / Bus Stop Where You Boarded RapidRide F Line for This Trip. Protection from the weather. 50% 50% 1%
Q3B. Waiting Area / Bus Stop Where You Boarded RapidRide F Line for This Trip. Cleanliness of waiting area. 62% 60% 1%
Q4C. Things About Buses on the RapidRide F Line. Cleanliness of the bus interior. 74% 72% 1%
Q2D. Personal Safety on the RapidRide F Line. Personal safety while waiting for the bus at night. 58% 56% 2%
Q5F. Ease of Transferring to or from the RapidRide F Line. Transfer information at the waiting area. 69% 66% 3%
Q5B. Ease of Transferring to or from the RapidRide F Line. The way buses are scheduled to make transfer connection. 70% 67% 4%
Q3C. Waiting Area / Bus Stop Where You Boarded RapidRide F Line for This Trip. Amount of lighting. 68% 64% 4%
Q6E. Frequency and Reliability of Buses on the RapidRide F Line. How often the bus runs on weekends. 65% 61% 4%
Questions 1A – 6F: Please check a box for each item to show how satisfied or dissatisfied you are with that item for this route you are riding. 5 = very satisfied and 1 = very dissatisfied
Table continued on following page.

Metro RapidRide F Line Six Month Post-Implementation Survey 2014
40
Appendix Table 2 - continued Gap in Top 2 Box Satisfaction Ratings – Sorted by Largest to Smallest Size Gap, F Line v. Route 140
F Line 2014 (520)
Route 140
(554)
% Gap F Line -
Route 140
Service Item Rated
Q3A. Waiting Area / Bus Stop Where You Boarded RapidRide F Line for This Trip. Being able to sit down while waiting. 66% 62% 4%
Q6B. Frequency and Reliability of Buses on the RapidRide F Line. How often the bus runs during peak hours (6-9 a.m. and 3-6 p.m.). 80% 75% 5%
Q6F. Frequency and Reliability of Buses on the RapidRide F Line. How early the bus runs in the morning. 76% 71% 5%
Q5E. Ease of Transferring to or from the RapidRide F Line. The bus coming on time when transferring. 69% 63% 5%
Q6A. Frequency and Reliability of Buses on the RapidRide F Line. The bus getting me where I'm going on time. 83% 78% 5%
Q5C. Ease of Transferring to or from the RapidRide F Line. Waiting time between transfers. 69% 63% 6%
Q1A. Trip Time on the RapidRide F Line. How long my bus trip takes. 87% 80% 7%
Q6C. Frequency and Reliability of Buses on the RapidRide F Line. How often the bus runs during midday hours (9 a.m. to 3 p.m.). 79% 72% 7%
Q4B. Things About Buses on the RapidRide F Line. Room to stand if no seats are available. 79% 71% 8%
Q4A. Things About Buses on the RapidRide F Line. Being able to get a seat. 83% 75% 8%
Q6D. Frequency and Reliability of Buses on the RapidRide F Line. How often the bus runs in the evening / night. 67% 58% 9%
Q3E. Waiting Area / Bus Stop Where You Boarded RapidRide F Line for This Trip. Having information available about routes and connections. 73% 63% 10%
Q3G. Waiting Area / Bus Stop Where You Boarded RapidRide F Line for This Trip. Information provided on the electronic real time information sign.
78% NA
Q4E. Things About Buses on the RapidRide F Line. Having free Wi-Fi. 73% NA Questions 1A – 6F: Please check a box for each item to show how satisfied or dissatisfied you are with that item for this route you are riding. 5 = very satisfied and 1 = very dissatisfied.

Metro RapidRide F Line Six Month Post-Implementation Survey 2014
41
RapidRide F Line 2014 Post
Implementation Survey

Metro RapidRide F Line Six Month Post-Implementation Survey 2014
42
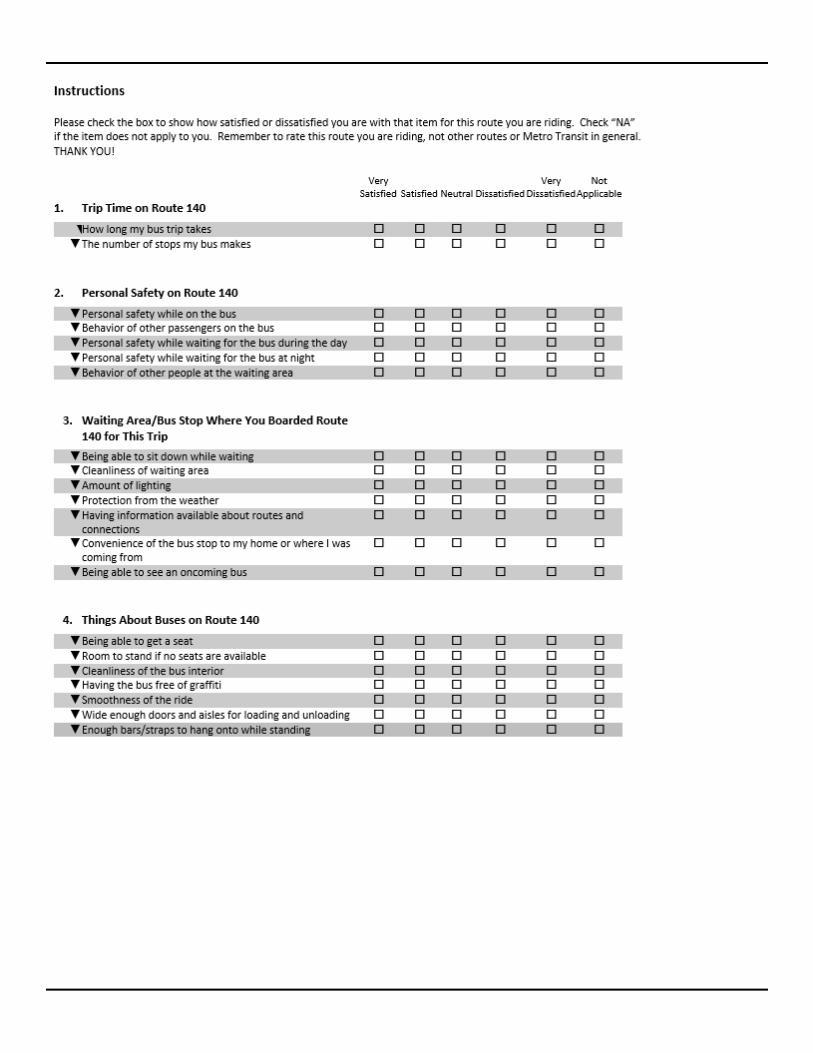
Instructions Please check the box to show how satisfied or dissatisfied you are with that item for this route you are riding. Check “NA” if the item does not apply to you. Remember to rate the RapidRide F Line, not other routes or Metro Transit in general. THANK YOU! Very
Satisfied Satisfied Neutral Dissatisfied Very
Dissatisfied Not
Applicable 1. Trip Time on the RapidRide F Line
▼ How long my bus trip takes ▼ The number of stops my bus makes
2. Personal Safety on the RapidRide F Line ▼ Personal safety while on the bus ▼ Behavior of other passengers on the bus ▼ Personal safety while waiting for the bus during the
day
▼ Personal safety while waiting for the bus at night ▼ Behavior of other people at the waiting area
3. Waiting Area/Bus Stop Where You Boarded the RapidRide F Line for This Trip ▼ Being able to sit down while waiting ▼ Cleanliness of waiting area ▼ Amount of lighting ▼ Protection from the weather ▼ Having information available about routes and
connections
▼ Convenience of the bus stop to my home or where I was coming from
▼ Information provided on the electronic real time information signs (at some locations)
4. Things About Buses on the RapidRide F Line ▼ Being able to get a seat ▼ Room to stand if no seats are available ▼ Cleanliness of the bus interior ▼ Enough bars/straps to hang onto while standing ▼ Having free Wi-Fi
If you make a transfer on this route, please rate the items in the box below. If you do NOT make a transfer, go on to Question 6 below the box. 5. Ease of Transferring to or from RapidRide F Line
Very Satisfied Satisfied Neutral Dissatisfied
Very Dissatisfied
Not Applicable
▼ The number of transfers I make ▼ The way buses are scheduled to make transfer
connections
▼ Waiting time between transfers ▼ Helpfulness of drivers in ensuring transfer
connections
▼ The bus coming on time when transferring ▼ Transfer information at the waiting area
Now go on to Question 6.

Metro RapidRide F Line Six Month Post-Implementation Survey 2014
43
6. Frequency and Reliability of Buses on the RapidRide F Line Very
Satisfied Satisfied Neutral Dissatisfied Very
Dissatisfied Not
Applicable ▼ The bus getting me where I’m going on time ▼ How often the bus runs during peak hours
(6-9 a.m. and 3-6 p.m.)
▼ How often the bus runs during midday hours (9 a.m. to 3 p.m.)
▼ How often the bus runs in the evening/night ▼ How often the bus runs on weekends ▼ How early the bus runs in the morning
7. Overall Satisfaction with the RapidRide F Line Very
Satisfied Satisfied Neutral Dissatisfied Very
Dissatisfie
Not Applicable
▼ Overall how satisfied are you with the RapidRide F Line?
8. How do you feel RapidRide compares to other Metro bus service for the following items?
(Please check only one answer.) RapidRide
is Better Other Metro Service
is Better There is no difference
▼ The quality of the overall transit experience ▼ Your personal safety ▼ The shelters and features at the bus stop ▼ How often the bus comes to your stop ▼ The time the bus spends at each bus stop ▼ Not having to rely on a predetermined schedule
when going to the bus stop
▼ The hours during the day that the bus operates ▼ The ability to get you where you are going on time 9. How many rides have you taken on the RapidRide F Line in the last 30 days?
(Count a roundtrip as 2 rides) ____________ rides
10. What is the purpose of the trip you take most often on the RapidRide F Line? (Please check only one). Work Fun/recreation/social School Appointments Shopping/errands Other
11. When do you usually ride the RapidRide F Line? (Please check all that apply). Weekdays—before 6 a.m. Weekdays 9 a.m. to 3 p.m. Weekends Weekdays—AM peak (6-9 a.m.) Weekdays 6-9 p.m. Weekdays—PM peak (3-6 p.m.) Weekdays later than 9 p.m. 12. If you did not use RapidRide F Line, how would you make this trip? Another bus route Walk No other option is available to me Drive alone Bike Carpool/vanpool Get dropped off 13. Did you transfer TO/FROM the RapidRide F Line on this trip today? Yes — Which route? __________ No

14. How do you pay your fare? Cash ORCA Card What product(s) do you have on your ORCA card? Tickets Pass Both a pass and an e-purse E-purse/money on the card Not sure Other _________________________________________ 15. Have you used the ORCA reader that is located off the bus at the RapidRide station? (at some locations) Yes No 16. On the RapidRide F Line, have you ever been requested to show your proof of payment by a fare enforcement
officer? Yes No Don’t know 17. If yes, are the number of inspections by the fare enforcement officers…..
Appropriate Should be more frequent Should be less frequent 18. If yes, how is your transit experience impacted by on-board fare inspection?
Significantly better Somewhat worse No difference Somewhat better Significantly worse 19. How long have you been a Metro rider? Less than 6 months More than a year but less than 5 years 6-12 months More than 5 years 20. What trip information sources do you use for traveling on RapidRide F Line? Real time information sign at stop Metro Transit web page The OneBusAway Smartphone application Other (specify) Metro’s printed timetables _______________________________ 21. Based on anything you have seen, heard or directly experienced, which of the following statements best
describes how you feel about RapidRide F Line? I have high expectations of RapidRide F Line and I am very confident that they provide the quality of
service I expect I generally expect high quality service from RapidRide F Line and I am generally confident that they
will provide the quality of service that I expect I generally expect both good and bad service from RapidRide F Line and am not fully confident that
they will provide the quality of service I would like I have low expectations of RapidRide F Line and would expect to encounter problems when riding I have very low expectations of RapidRide F Line and would not ride unless I absolutely had to
Please answer the following questions about yourself to help us with our evaluation. 22. Are you? Male Female 23. How old are you? __________ years 24. Do you consider yourself Hispanic? Yes No 25. Do you consider yourself White? Yes No 26. What is your total household income?
Under $20,000 per year $20,000 up to $35,000 $35,000 and up 27. What is the primary language spoken at home? English Other, please specify _________________________________ 28. What is your home zip code? _______________ 29. What is your work zip code? ____________ Or what is the nearest intersection to your work? ____________________ and ___________________
30. Finally, what ONE THING would you recommend to improve this route? _____________________________________________________________________________________

RapidRide F Line
Rider Report Card Please complete the questionnaire to let Metro Transit know how they are doing and how they can improve service on this route. Return your completed questionnaire to the survey worker. Or if you are unable to complete the questionnaire while riding, return directly to Metro using the postage paid return envelope provided with the questionnaire. IF YOU HAVE ALREADY COMPLETED A QUESTIONNAIRE, PLEASE RETURN THIS TO THE SURVEY WORKER.
Thank you very much for your help.

Route 140 Survey