rare plant conservation in azerbaijan: monitoring threats ... detailed final report.pdf · rare...
TRANSCRIPT

RARE PLANT CONSERVATION IN AZERBAIJAN: MONITORING THREATS AND EDUCATION OF LOCAL COMMUNITY
A Final Report submitted to the Rufford Small Grants Foundation by Yelena Gambarova 2013-2014

Project Information
1. Title of the project: Rare plant conservation in Azerbaijan: Monitoring threats and Education of Local Community
2. Project Leader: Yelena M. Gambarova
149 Azadlyg prospect, Apt. 69 AZ 1106, Baku, Azerbaijan Phone: (+994) 12 440 84 96 E-mail: [email protected]
3. Project Mentor: Adil Y. Gambarov
4. Project members: Rustam B. Rustamov and Maral H. Zeynalova 5. Local Project Experts: Vagif Sefikhanly and Urfan Kerimly
6. Project duration: 1 year (April 2013 - April 2014)

CONTENTS ACKNOWLEDGEMENTS PROJECT SUMMARY 1 BACKGROUND INFORMATION 2 OBJECTIVES 3 METHODOLOGY
Step 1: Literature & Available Maps Step 2: Remote Sensing satellite data Step 3: Preliminary Visual interpretation Step 4: Field study & Data Collection
Step 5: Threats to rare vegetation
PHASE I Step 6: Digital Image Processing Step 7: Rare vegetation classification within the Pasture area Step 8: Vegetation response to Industrial development Step 9: Depicting the relationship of sources of threats to conservation focus areas
PHASE II
TRAINING COURSE PHASE III
FEEDBACK AND REVIEW OF THE EFFECTIVENESS OF THE TRAINING RESULT DISSEMINATION CONCLUSION APPENDIX ACKNOWLEDGEMENTS The project team very thankful for the support the RSGF which provided recourses for this research. Without the financial support gained from the grant the research would not be able to be done and completed. The project team would like to express gratitude to the Planet Action organization for their support by donating satellite images.

PROJECT SUMMARY The Project includes monitoring of threats to rare plant and analysis of the results. Information contained in this Project will be acquired through a series of trips to the field by a team, interviews with key personnel in related organizations and allow to generate effective visual tools that aid conservation planning and decision-making, build capacity for and protected-area staff members and other groups to use the tools for rare plant conservation. 1. The first stage of the Project is FIELD STUDY AND DATA COLLECTION and ASSESS THREATS At this stage site-specific data were collected in the field proforma recording structure format. This stage includes monitoring of existing threats to rare vegetation (Global Climate Change, oil and gas exploration, overgrazing of winter and summer pastures by domestic sheep, goats and cattle, pollution, etc.) as well the processing of remote sensing data to produce “measured” vegetation indicators. The Geographical Data Base and Specialized GIS Environment were created. The main pasture types, summer and winter pastures were distinguished. Map of current pasture usage was created to to provide data on the extent of pasturelands in Gobustan National Park for rare vegetation conservation. The tools for designing and learning, testing of classifiers and performing classification on real data were developed. A Specialized GIS was used as software environment for performing workflow comprising of jobs connected with collecting of samples, hosting of classifier training and producing software as well as classification results analysis. For this study, out of various change detection techniques, spectral change analysis method with special emphasis on vegetation indices was selected. The NDVI (Normalised Difference Vegetation Index) was used for natural vegetation cover change detection in this study because of its acceptable accuracy and ability to detect the green vegetation. Maximum Likelihood Classification algorithm was used in supervised classification within the Pasture and Buffer zone around Industrial object (from 2004 to 2012 years). The results indicates that major changes in the study area from 2004 to 2012 years involved decrease in vegetation cover types including Alhagi pseudoalhagi (-0.7%), Salsola Nodulosa/Artemisia Lerchiana/Salsola Dendroides communities (-18.7 %) and Suaeda Dendroides (-5.24 %); and increase in Tamarix (+21.7 %) and Bare ground (+3.6 %).

2. The second stage of the Project is: PRACTICAL, IN-DEPTH TRAINING: The training materials were created at this stage: Power Point presentation, Course content outline and the Training Test Scripts. Rare vegetation Monitoring Training Test Scripts were compiled to describe the training process of using GIS and RS technologies on rare vegetation monitoring in Azerbaijan. This document describes the step-by-step instructions of each phase of the Training Test Scripts and their short description. The document includes Overview of the each Test Script phase, Prerequisites, any Steps required and tester identification. Each field in the Step Script definitions has been explained. This document have been presented to Rufford Fund separately.
1. Background Information The results from previous Rufford-supported project indicated that major changes in the study area from 2004 to 2007 involved decrease in rare vegetation. Azerbaijan. During that Project, detailed and updated information about rare vegetation communities was collected and presented and the acquired data skillfully processed. The results our previous work indicated that major changes from 2004 to 2007 involved decrease in rare vegetation cover types including Alhagi pseudoalhagi, Salsola Nodulosa/Artemisia Lerchiana/Salsola Dendroides communities and Suaeda Dendroides . Five years have passed since previous investigations. This study work includes the analysis of higher resolution remotely sensed time series and Field Surveys (from 2007 to 2012 years).
2. Objectives The overarching project goal is to conserve rare plant in Azerbaijan by facilitating the availability of quality science for making conservation decisions.
1. Monitoring of threats to rare plant and analysis of the results; 2. Build capacity for government and protected-area staff members to use Remote
Sensing and Geographic Information System (RS/GIS) tools for conservation planning and monitoring;
3. Increase access to data needed by managers, community members, and decision makers on the ground to make effective conservation decisions.
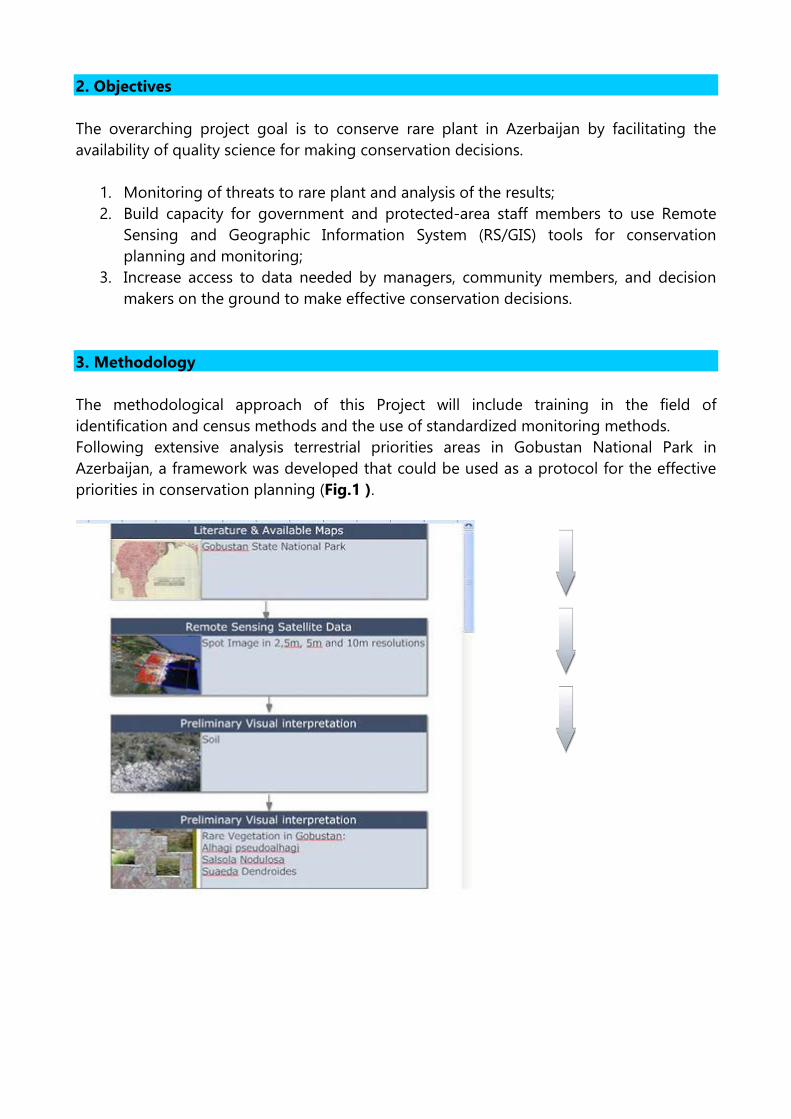
3. Methodology The methodological approach of this Project will include training in the field of identification and census methods and the use of standardized monitoring methods. Following extensive analysis terrestrial priorities areas in Gobustan National Park in Azerbaijan, a framework was developed that could be used as a protocol for the effective priorities in conservation planning (Fig.1 ).
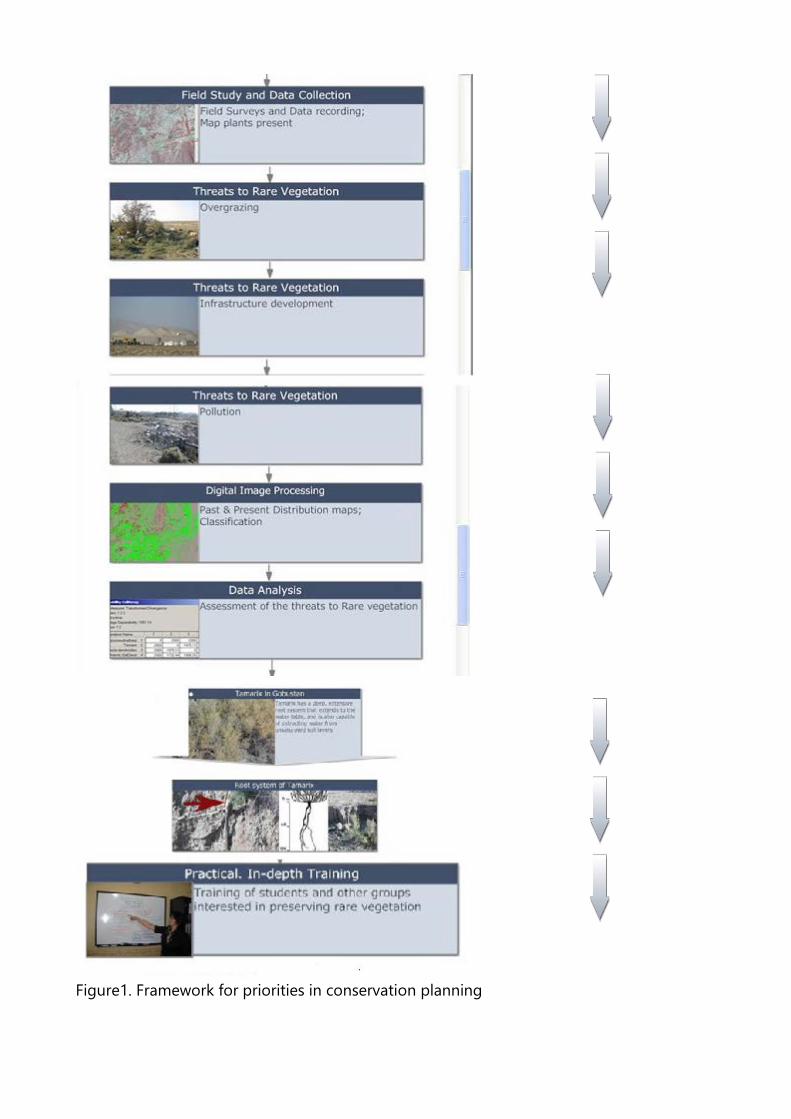
Figure1. Framework for priorities in conservation planning

Step 1: Literature & Available Maps We have created visual tools to guide and enhance conservation management initiatives in the Gobustan. These tools include a series of current Land Use Maps and Topographical map that aid vegetation managers. These maps we acquired from State Land Committee of Azerbaijan Republic.
Figure 2.Land Use and Topographical Maps Step 2: Remote Sensing satellite data The fundamental basis of this Project is Remote sensing imageries which came from Spot Image in 2.5m, 5m and 10m resolutions. We have SPOT5 images from 2004 to 2007 years. In combination with more recent data (SPOT4 satellite data from 2010 and 2012), these early images enable us to study how Study area has changed over time.
Figure 3. SPOT4
Legend Pure Pastures Stony Pastures Lowland Roads Railroad Water line River Ic.Tikinti Electric line Ravine Oil spills Salinity Oil pipeline Gas pipeline Settlement

Step 3: Preliminary Visual interpretation Creation of preliminary data on the spreading of rare vegetation on the Study Area for first Field survey Soil The soils in this region comprise yellow brown salty and stony clays and loams with consistencies varying from soft and loose to slightly hard. The soil structure is generally fine to medium. The soil surface often has a platy structure 3 mm to 5 mm thick that serves as a partial barrier to infiltration and contributes to high soil aridity. Vegetation Salsola nodulosa Salsola dendroides Artemisia fragrans Alhagi pseudoalhagi Tamarix Step 4: Field study & Data Collection The field proforma recording structure contains six basic sections: Scientific Name of the species Vernacular Name of the species Specify species type Site physical features Descriptor Data type
Scientific Name
Vernacular Name
Specify species type
Site feature Descriptor Data type
Suaeda dendroides
Sea-blite, seepweed Arabic suaed,black Sea blight sp
Plant
Salsola dendroides
Location reference
Location Gobustan State National Park
Date (dd-mm-year) 26-09-2013 Country Azerbaijan Observer/
Physical Latitude deg.min.sec. (GPS) Longitude deg.min.sec. (GPS) Soil depth (mm) Soil type
40º05'52.10"N 49º21'59.43"E 40º04'16.21"N 49º22'26.85"E 3-5 mm Solochak
Photograph Hard copy and digital image JPEG Alhagi pseudoalhagi
Camelthorn Plant Location reference
Location Gobustan State National Park

Date (dd-mm-year) 26-09-2013 Country Azerbaijan Observer/
Physical Latitude deg.min.sec. (GPS) Longitude deg.min.sec. (GPS) Soil depth (mm) Soil type
40º06'11.59"N 49º22'30.23"E 3-5 mm yellow brown salty and stony clays
Artemisia fragrans
Asteraceae Mugwort sp
Plant
Location reference
Location Gobustan State National Park
Date (dd-mm-year) 10-03-2014 Country Azerbaijan Observer/
Physical Latitude deg.min.sec. (GPS) Longitude deg.min.sec. (GPS) Soil depth (cm) Soil type
40º03'47.29"N 49º23'57.09"E 3-5 mm yellow brown salty and stony clays
Tamarix Salt cedar Plant Location reference
Location Gobustan State National Park
Date (dd-mm-year) 13-03-2014 Country Azerbaijan Observer/
Physical Latitude deg.min.sec. (GPS) Longitude deg.min.sec. (GPS) Soil depth (mm) Soil type
40º03'30.91"N 49º23'57.4"E 40º03'30.99"N 49º22'27.54"E 3-5 mm yellow brown salty and stony clays
The Field surveys were hold in accordance with preliminary data on the spreading of rare plants in the study area. Because GPS devices provided the coordinates for ground-reference data during fieldwork, the sample plots were accurately linked to SPOT imagery. Every plot was registered with GPS device to allow further integration with spatial data in GIS and image processing systems. Data from the field work was entered into a database. Ground truth survey Field data collection is important in remote sensing Stated that field data serve three purposes. Firstly, field data can be used to verify, to evaluate or to assess the results of remote sensing investigations. Secondly, field data can provide reliable data to guide the analytical process, such as creating training fields to support supervised classification. The Field surveys were hold in accordance with preliminary data on the spreading of rare plants in the study area. Because GPS devices provided the coordinates for ground-reference data during fieldwork, the sample plots were accurately linked to SPOT imagery. Every plot was registered with GPS device to allow further integration with spatial data in

GIS and image processing systems (Figure 3). Information on land use was recorded. Data from the field work was entered into a database. The ground reference points were measured during the field visit to the study areas in the period from June 2013 to October 2013. They were selected based on pre-classified maps for the imagery. The coordinates for each reference point were recorded using hand-held GARMIN eTrex Venture HC Global Positioning System (GPS). Information on land use was recorded too.
Figure 3. Field survey Step 5: Threats to rare vegetation The Project includes monitoring of existing threats to rare vegetation (Global Climate Change, oil and gas exploration, overgrazing of winter and summer pastures by domestic sheep, goats and cattle, pollution, etc.).

a) Climate change threat to natural resources: Climate Change is an ecological problem on a global scale that poses a recognized threat to all ecosystems and associated biodiversity. Future impacts of climate change According to the UN Intergovernmental Panel on Climate Changes (IPCC) forecasts, the Southern Caucasus lie within a belt where the average temperature is expected to increase between 2 and 4ºC until the end of the century. Model projections carried out by government institutions in the region breaks this down by the country as follows: Azerbaijan: 4.1-5.8 ºC by 2100. This region suffers from degradation or non-sustainable use of natural resources. Deforestation and desertification pose significant challenges in Azerbaijan and from land degradation (overgrazing, soil pollution, and erosion). Global Climate Change is increasingly affecting local vegetation due to increasing the annual temperatures, which modify the vegetation community's spatial distributions.

Table 1. Climate change impact on the ecosystems and natural resource use in Azerbaijan Country Ecosystem Impacts Natural Resource Use
Azerbaijan**
Extension of semi-desert
and dry steppe areas will increase by 2.4 to 3.4 times
10-15% increased erosion Reduced rainfall during
spring and summer and increases in autumn and winter
10-15% increased salinisation
Since 80% of the
agriculture is produced within the arid and semi-arid parts and more than 80% of the output come from irrigated land, food production will face significant problems
** Initial National Communication on Azerbaijan Republic on Climate Change, Phase 2, Baku 2001 plus information in the First Communication Report to UNFCCC (2002)
Photos by Yelena Gambarova, Gobustan

Photos by Yelena Gambarova, Gobustan b) Overgrazing of winter and summer pastures by domestic sheep, goats and cattle in Gobustan Traditionally, the main land use system of Azerbaijan used to be extensive livestock breeding with summer pastures in the mountains and winter pastures in the lowland steppes. Overgrazing and uncontrolled livestock grazing threatens steppe and semi-deserts ecosystems in Azerbaijan. A third of pasturelands in the region are subject to erosion. Sheep grazing in the winter ranges and semideserts of Azerbaijan has nearly tripled in the past decade. Intensive grazing has resulted in reduced species diversity and habitat degradation. Overgrazing is causing environmental damage in much of the hotspot, particularly in Gobustan. The semi-arid lowlands of Azerbaijan have been used as pastures since millennia. And still today they provide very important fodder grounds for livestock production. Apart from the oil business, agriculture including livestock breeding plays the most important role in the country accounting 21.6% of the GDP in 1999. More than 40% of its area is used as rangelands and a third of the population is directly engaged in agriculture. About 200 farmyards are distributed across the Gobustan area which is used as winter pasture, benefited by often snow-free winters. From October till May pastoralists with their livestock and families stay here, in the hot, dry summers no sheep and people live in the

region. Dwarf shrubs supply winter fodder and ephemeral plants are used in early spring. Main sheep breed in Azerbaijan is the fat-rumped sheep (Ovis steatopyga). Some vegetation is strictly protected by law, while others extensively for livestock grazing, particularly in the winter when mugwort species (Artemisia species) are palatable to animals due to low concentrations of alkaloids. In the spring and summer alkaloid concentrations are high making the plants unpalatable. Saltwort species (Salsola nodulosa) is a plant of very high nutritional value and provides much more energy per gram than mugwort species. Remote Sensing (RS) and GIS is a suitable tool for pasture inventory in the Gobustan. It can be used when collecting background information about the pastures and can be further processed by the GIS. The information and results produced are usable for planning and management purposes of rare vegetation in the Study Area. The SPOT 4 images proved to be a useful data source in the mapping of pastures in Gobustan. The SPOT 4 images used in this study was taken in May and August, at a time when the summer pastures were already heavily grazed. This was visible both in the field and in the satellite image. Remote sensing and GIS have been used in many studies in those areas where degradation and erosion are a problem. In some cases the cause of degradation has been supplemented by increased grazing and human impact. Remote sensing is a suitable tool for pasture inventory in the Gobustan area. It can be used when collecting background information about the pastures and can be further processed by the GIS. The information and results produced are usable for planning and management purposes of the grasslands in Gobustan State National Park. The SPOT images proved to be a useful data source in the mapping of pastures of the Gobustan aarea. Spring and summer pastures were distinguishable from the image. Further information on different pasture type characteristics was established by estimating the biomass of fresh green grass.
Photos by Yelena Gambarova, Gobustan
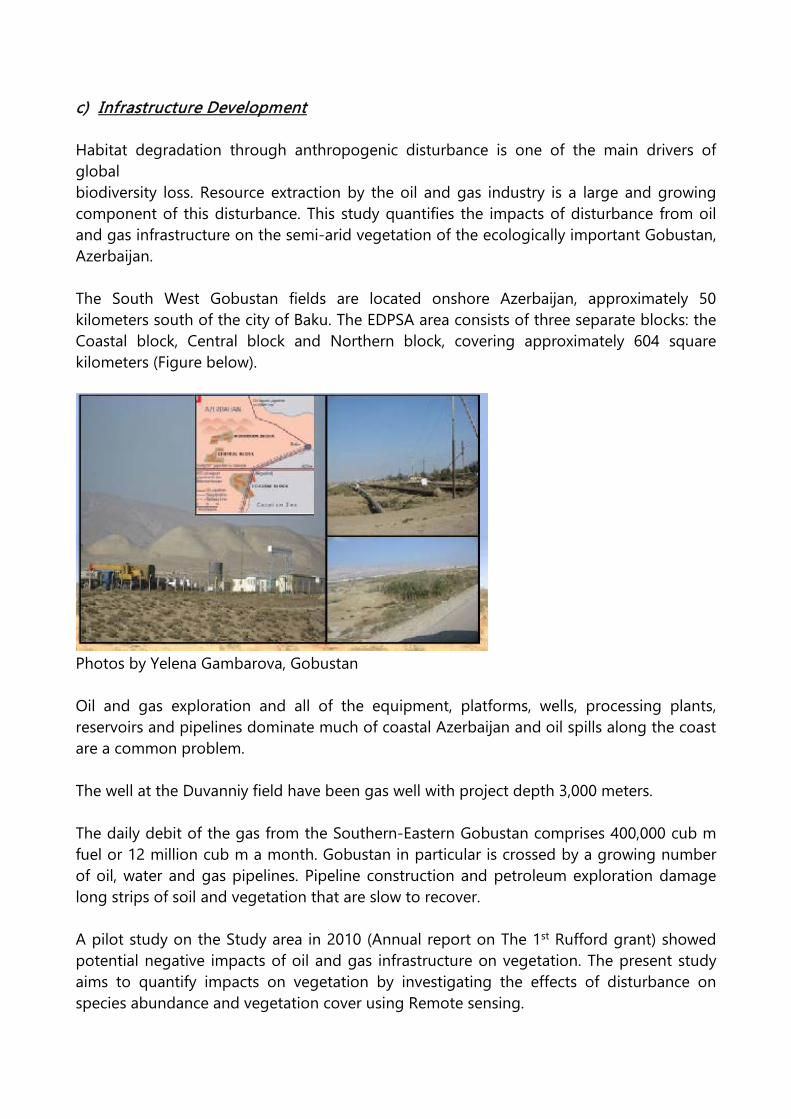
c) Infrastructure Development Habitat degradation through anthropogenic disturbance is one of the main drivers of global biodiversity loss. Resource extraction by the oil and gas industry is a large and growing component of this disturbance. This study quantifies the impacts of disturbance from oil and gas infrastructure on the semi-arid vegetation of the ecologically important Gobustan, Azerbaijan. The South West Gobustan fields are located onshore Azerbaijan, approximately 50 kilometers south of the city of Baku. The EDPSA area consists of three separate blocks: the Coastal block, Central block and Northern block, covering approximately 604 square kilometers (Figure below).
Photos by Yelena Gambarova, Gobustan Oil and gas exploration and all of the equipment, platforms, wells, processing plants, reservoirs and pipelines dominate much of coastal Azerbaijan and oil spills along the coast are a common problem. The well at the Duvanniy field have been gas well with project depth 3,000 meters. The daily debit of the gas from the Southern-Eastern Gobustan comprises 400,000 cub m fuel or 12 million cub m a month. Gobustan in particular is crossed by a growing number of oil, water and gas pipelines. Pipeline construction and petroleum exploration damage long strips of soil and vegetation that are slow to recover. A pilot study on the Study area in 2010 (Annual report on The 1st Rufford grant) showed potential negative impacts of oil and gas infrastructure on vegetation. The present study aims to quantify impacts on vegetation by investigating the effects of disturbance on species abundance and vegetation cover using Remote sensing.
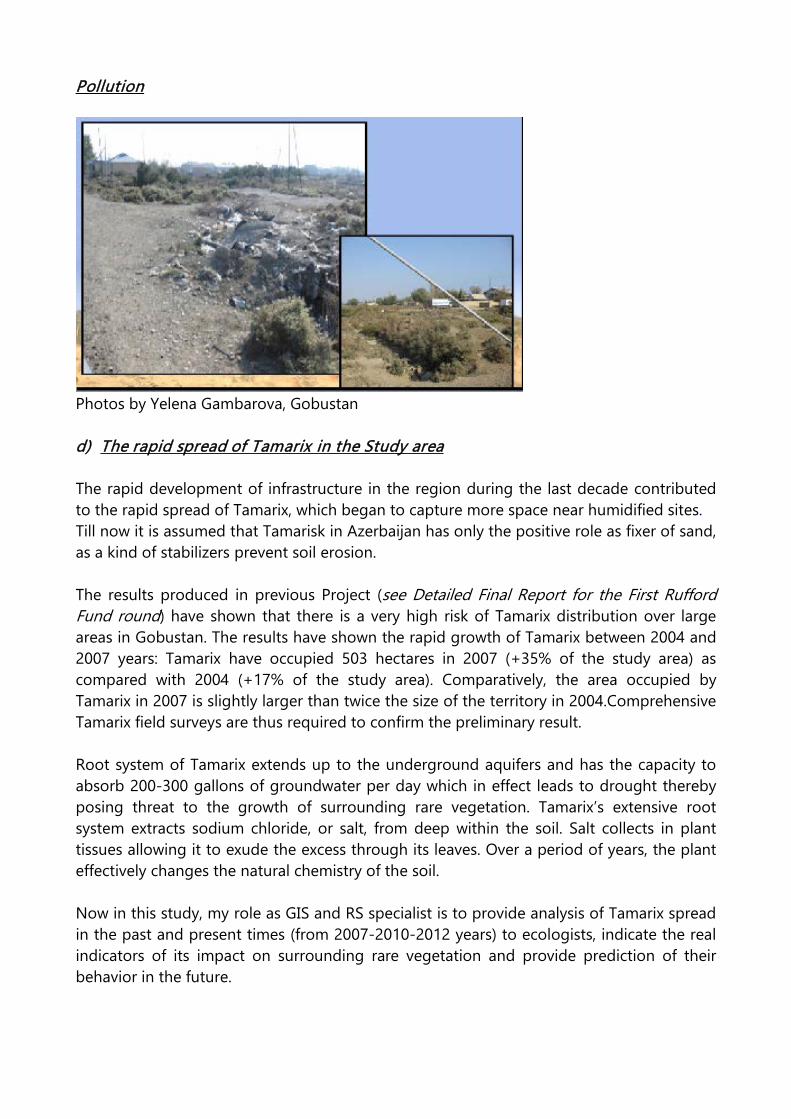
Pollution
Photos by Yelena Gambarova, Gobustan d) The rapid spread of Tamarix in the Study area The rapid development of infrastructure in the region during the last decade contributed to the rapid spread of Tamarix, which began to capture more space near humidified sites. Till now it is assumed that Tamarisk in Azerbaijan has only the positive role as fixer of sand, as a kind of stabilizers prevent soil erosion. The results produced in previous Project (see Detailed Final Report for the First Rufford Fund round) have shown that there is a very high risk of Tamarix distribution over large areas in Gobustan. The results have shown the rapid growth of Tamarix between 2004 and 2007 years: Tamarix have occupied 503 hectares in 2007 (+35% of the study area) as compared with 2004 (+17% of the study area). Comparatively, the area occupied by Tamarix in 2007 is slightly larger than twice the size of the territory in 2004.Comprehensive Tamarix field surveys are thus required to confirm the preliminary result. Root system of Tamarix extends up to the underground aquifers and has the capacity to absorb 200-300 gallons of groundwater per day which in effect leads to drought thereby posing threat to the growth of surrounding rare vegetation. Tamarix’s extensive root system extracts sodium chloride, or salt, from deep within the soil. Salt collects in plant tissues allowing it to exude the excess through its leaves. Over a period of years, the plant effectively changes the natural chemistry of the soil. Now in this study, my role as GIS and RS specialist is to provide analysis of Tamarix spread in the past and present times (from 2007-2010-2012 years) to ecologists, indicate the real indicators of its impact on surrounding rare vegetation and provide prediction of their behavior in the future.

Step 6. Digital Image Processing Material Varieties of softwares were employed in the present study following the different requirements of the work. The ERDAS (Earth Resources Data Analysis System) Imagine version 9.1 was used for image processing and classification. Meanwhile, ArcGIS was employed for database development, spatial data analysis, producing thematic maps. Microsoft Excel was used for statistical analysis. In order to trace the dynamics of rare vegetation distribution over the period from 2004 to 2012, we have selected the part of Gobustan area, where the vegetation is most sensitive to threats such as overgrazing, infrastructure, etc. Vegetation response to grazing by livestock Map of current pasture usage Purpose:
To provide data on the extent of pasturelands in Gobustan National Park for rare vegetation conservation.
Digitized data layers were converted into a collection of several shapefiles. The attributes of the shapefiles were previously designed for the usage of the study in the project region of Gobustan National Park. The shapefiles are containing polygons such as pasture areas: Pure Pastures and Stony Pasture. Other point geometry based files are containing individual pasture related constructions. The individual geometries are connected by key values to the project database. The project database provides additional information of each livestock or trainings provided.
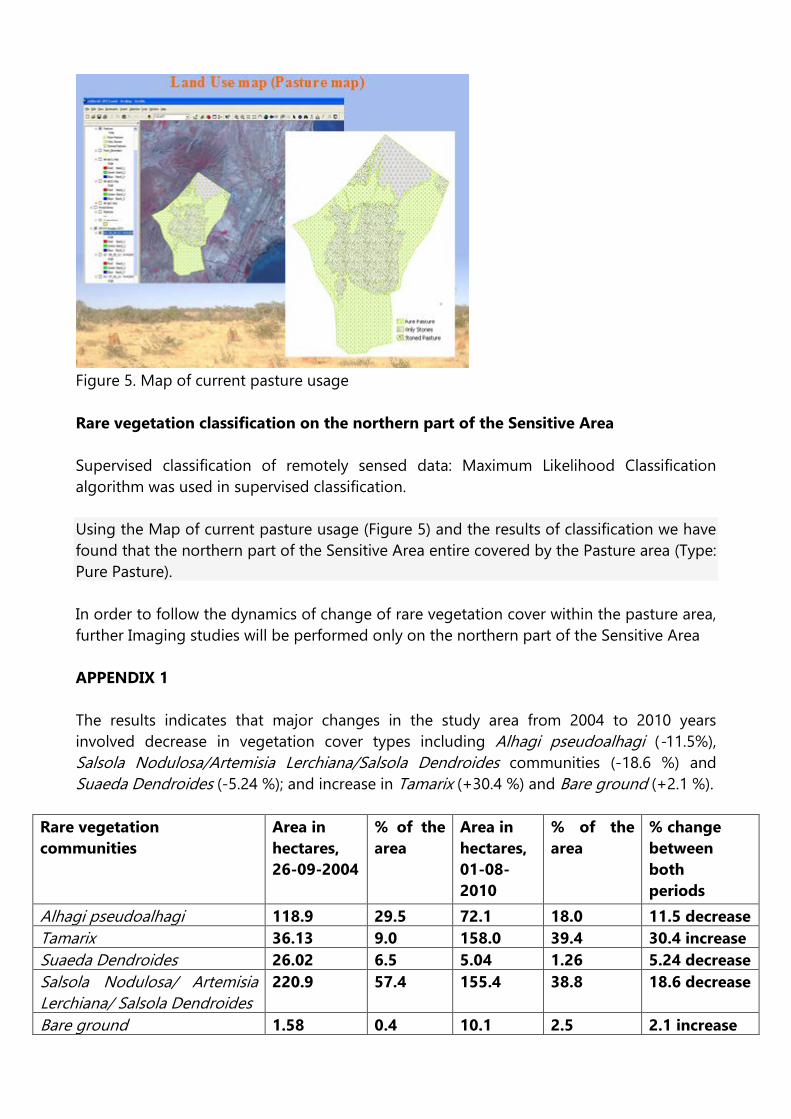
Figure 5. Map of current pasture usage Rare vegetation classification on the northern part of the Sensitive Area Supervised classification of remotely sensed data: Maximum Likelihood Classification algorithm was used in supervised classification. Using the Map of current pasture usage (Figure 5) and the results of classification we have found that the northern part of the Sensitive Area entire covered by the Pasture area (Type: Pure Pasture). In order to follow the dynamics of change of rare vegetation cover within the pasture area, further Imaging studies will be performed only on the northern part of the Sensitive Area APPENDIX 1 The results indicates that major changes in the study area from 2004 to 2010 years involved decrease in vegetation cover types including Alhagi pseudoalhagi (-11.5%), Salsola Nodulosa/Artemisia Lerchiana/Salsola Dendroides communities (-18.6 %) and Suaeda Dendroides (-5.24 %); and increase in Tamarix (+30.4 %) and Bare ground (+2.1 %).
Rare vegetation communities
Area in hectares, 26-09-2004
% of the area
Area in hectares, 01-08-2010
% of the area
% change between both periods
Alhagi pseudoalhagi 118.9 29.5 72.1 18.0 11.5 decrease Tamarix 36.13 9.0 158.0 39.4 30.4 increase Suaeda Dendroides 26.02 6.5 5.04 1.26 5.24 decrease Salsola Nodulosa/ Artemisia Lerchiana/ Salsola Dendroides
220.9 57.4 155.4 38.8 18.6 decrease
Bare ground 1.58 0.4 10.1 2.5 2.1 increase

0
50
100
150
200
250
Area (ha)
1 2
26-09-2004 01-08-2010
Rare vegetation degradation in the Pasture area
Alhagi pseudoalhagi
Tamarix
Suaeda Dendroides
Salsola Nodulosa/ArtemisiaLerchiana/ Salsola DendroidesBare ground
Figure 6. Rare vegetation distribution in northern part of the Sensitive Area (included the Pasture area) PASTURE RESERVE Step 7: Rare vegetation classification within the Pasture area Supervised classification of remotely sensed data: Maximum Likelihood Classification algorithm was used in supervised classification (Figure 7).
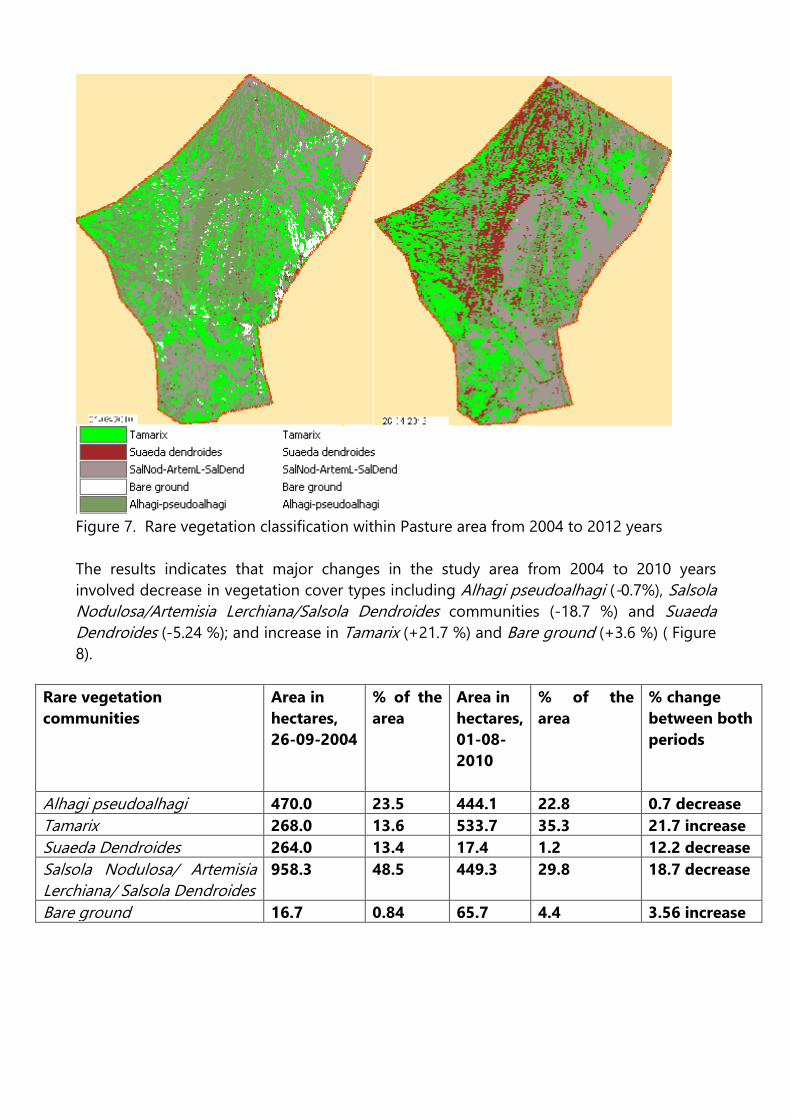
Figure 7. Rare vegetation classification within Pasture area from 2004 to 2012 years The results indicates that major changes in the study area from 2004 to 2010 years involved decrease in vegetation cover types including Alhagi pseudoalhagi (-0.7%), Salsola Nodulosa/Artemisia Lerchiana/Salsola Dendroides communities (-18.7 %) and Suaeda Dendroides (-5.24 %); and increase in Tamarix (+21.7 %) and Bare ground (+3.6 %) ( Figure 8).
Rare vegetation communities
Area in hectares, 26-09-2004
% of the area
Area in hectares, 01-08-2010
% of the area
% change between both periods
Alhagi pseudoalhagi 470.0 23.5 444.1 22.8 0.7 decrease Tamarix 268.0 13.6 533.7 35.3 21.7 increase Suaeda Dendroides 264.0 13.4 17.4 1.2 12.2 decrease Salsola Nodulosa/ Artemisia Lerchiana/ Salsola Dendroides
958.3 48.5 449.3 29.8 18.7 decrease
Bare ground 16.7 0.84 65.7 4.4 3.56 increase

0100200300400500600700800900
1000
Area (ha)
1 2
26-09-2004 01-08-2010
Rare vegetation distribution in the Pasture zone
Alhagi pseudoalhagi
Tamarix
Suaeda Dendroides
Salsola Nodulosa/ArtemisiaLerchiana/ Salsola DendroidesBare ground
Figure 8. Rare vegetation distribution within the Pasture area from 2004 to 2010 Rare vegetation classification within the Pasture area indicates: Plant cover has decreased in the Pasture zone and is higher than the Sensitive Area. Bare ground is the non-vegetated, non-litter-covered part of the land surface. It includes scree, bare soil and subsoil, erosion pavement and exposed bedrock. An increase in bare ground is likely to indicate an increase in soil erosion. Bare ground has increased dramatically in the Pasture area whereas in the Sensitive Area it has increased slightly (Figure 9).
0
20
40
60
80
100
120
Area (ha)
2/3/2004 26-09-2004 1/8/2010 26-04-2012
Bare ground distribution within the Pasture area
Figure 9. Bare ground distribution within the Pasture area However, compared to early March 2004, the area of bare ground on plots has increased. bare ground value in 02/03/2004 was greater than it had been in next periods. Bare

ground value was significantly greater in this period because period of the vegetation recovery begins only early May. The amount of bare ground was significantly greater on the grazed compared with the unglazed plot. Conclusion for Pastures Overall plant cover is decreasing and bare ground increasing in areas subject to grazing management. It reinforces the need to improve collective management of grazing resources at a large scale through conservancy structures (e.g. development and implementation of grazing plans) Step 8: Vegetation response to Industrial development Assessing protected area effectiveness using surrounding (buffer) areas environmentally similar to the target area Many studies are based on the assumption that an area and its surrounding (buffer) area present similar environmental conditions and can be compared. For example, in order to assess the effectiveness of a protected area, the land use/cover changes are compared inside the park with its surroundings. The plan also proposes ‘buffer’ zones – areas between Industry Zone and non-industrial protected area. The “buffer area” (10 km2) surrounds the Industrial Zone:

Figure 11: Rare vegetation classification within the Buffer zone from 2004 to 2012 years This study has shown that oil and gas infrastructure, in an ecologically important semi-arid region, has a negative effect on species abundance and cover of vegetation. Rare vegetation classification within a buffer zone indicates: Plant cover has decreased in the buffer zone and is higher than the Sensitive Area. Bare ground has increased dramatically in the buffer zone whereas in the Sensitive Area it has decreased slightly.
0
50100
150200
250300
350400
Area (ha)
1 2
Rare vegetation degradation within the "Buffer Zone"
Alhagi pseudoalhagi
Tamarix
Suaeda Dendroides
Salsola Nodulosa/ArtemisiaLerchiana/ Salsola DendroidesBare ground
Figure 11. Rare vegetation degradation within the “Buffer Zone”

Bare ground is the non-vegetated, non-litter-covered part of the land surface. It includes scree, bare soil and subsoil, erosion pavement and exposed bedrock. An increase in bare ground is likely to indicate an increase in soil erosion. Bare ground has increased dramatically in the buffer zone whereas in the Sensitive Area it has increased slightly.
0
100
200
300
400
500
600
Area (ha)
2/3/2004 26-09-2004 1/8/2010 26-04-2012
Bare ground distribution within the "Buffer Zone"
Figure 12. Bare ground distribution in the buffer zone from 2004 to 2012 years Image Analysis of bare ground in the Gobustan lands indicates an increase of bare ground between 2004 and 2012 years. At the Figure 12, there has been a significant decrease percent in bare ground in the period 26-09-2004. The decrease is associated with an increase in grasses in the vegetation period. Change detection on rare vegetation cover in the territory of the Gobustan national park caused by overgrazing and infrastructure development For this study, out of various change detection techniques, spectral change analysis method with special emphasis on vegetation indices was selected. The NDVI (Normalised Difference Vegetation Index) was used for natural vegetation cover change detection in this study because of its acceptable accuracy and ability to detect the green vegetation. As a result, it was found that integrated use of remotely sensed images with different resolutions also with support of available ground data and statistical analysis is reliable approach to detect the impact of rare vegetation degradation. This study showed that natural vegetation cover was significantly decreased in the areas which have been affected overgrazing and infrastructure development.

Change detection: 2004-2012
Figure 6: Sliced map of difference of NDVI values in 2004 and 2012 (Percent). Red=highly decreased NDVI values in 2012, yellow – some decreased NDVI values in 2012, grey= no change NDVI values in 2012, green - increased NDVI value in 2012 All of the approaches (based on available data) such as visual interpretations, image and statistical analysis and tests proved that the green vegetation cover was reduced in 2012 compare to eight years before. Step 9: Depicting the relationship of sources of threats to conservation focus areas Table 2 cites the spatial representation status for each source of threat. The identification and examination of those threats that the team could not map was still valuable. For example, for a source of threat that the team could not map, such as invasive species, knowing what rare vegetation types are susceptible to invasion may influence decision to protect parcels with certain types.

Table 2: Spatial representation of sources of threats Spatially Represented? Source of Threats Yes No (reason) Pasture of farmland, grazed by domesticated livestock, such as, cattle, sheep
√
Existing oil and gas drilling sites √ Potential oil and gas drilling sites √ Existing roads √ Potential roads √ Baku-Tbilisi-Ceyhan pipeline (BTC) pipeline
√ (the Project team lacked
access to Military zone) Existing invasive species √ (insufficient data) One of key features of Source of Threats to rare vegetation is Baku-Tbilisi- Ceyhan pipeline (BTC). The desert communities in the Gobustan Area are the most botanically important along the pipeline route. Plants research in this area was impossible because of that area is Military zone and the team lacked access to Military zone.
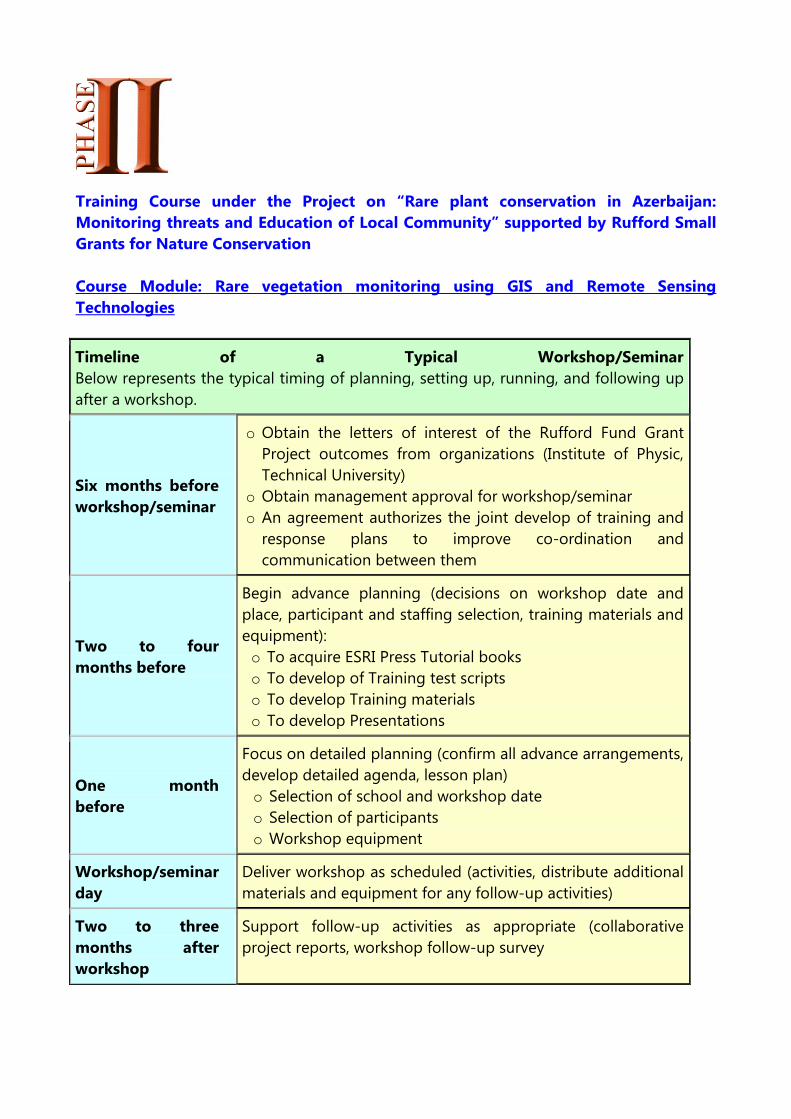
Training Course under the Project on “Rare plant conservation in Azerbaijan: Monitoring threats and Education of Local Community” supported by Rufford Small Grants for Nature Conservation Course Module: Rare vegetation monitoring using GIS and Remote Sensing Technologies
Timeline of a Typical Workshop/Seminar Below represents the typical timing of planning, setting up, running, and following up after a workshop.
Six months before workshop/seminar
o Obtain the letters of interest of the Rufford Fund Grant Project outcomes from organizations (Institute of Physic, Technical University)
o Obtain management approval for workshop/seminar o An agreement authorizes the joint develop of training and
response plans to improve co-ordination and communication between them
Two to four months before
Begin advance planning (decisions on workshop date and place, participant and staffing selection, training materials and equipment): o To acquire ESRI Press Tutorial books o To develop of Training test scripts o To develop Training materials o To develop Presentations
One month before
Focus on detailed planning (confirm all advance arrangements, develop detailed agenda, lesson plan) o Selection of school and workshop date o Selection of participants o Workshop equipment
Workshop/seminar day
Deliver workshop as scheduled (activities, distribute additional materials and equipment for any follow-up activities)
Two to three months after workshop
Support follow-up activities as appropriate (collaborative project reports, workshop follow-up survey

Intended Audience People who are actively working in plant conservation and managing conservation projects, perhaps within Government, non-governmental organisations (NGOs), Universities, botanic gardens, or as protected area managers Training Material All participants were provided with respective printed Training materials during the course. The materials include the following: Power Point presentation, Course content outline and training scripts. These Training materials have been developed by Yelena Gambarova and used in learning process. 1. Presentation of Tutorial Books published by Esri Press about the science,
application, and technology of Geographic Information Systems (GIS) and Remote Sensing (RS)
We offer to trainees (students) a broad spectrum of case studies ESRI GIS Tutorial Books (list of 11 top books) specifically acquired by us for conducting training course on the application of GIS and RS technologies for rare vegetation monitoring under the Project. Part of them was presented to participants. Some of them: GIS Tutorial: Workbook for ArcView 9 is a hands-on workbook that takes the students from the basic of using ArcGIS interface to performing advanced spatial analysis. This book comes with a CD with exercise and assignment data, and DVD with a 180-day trial of ArcGIS 9.3 Instruction for installing the data and the software that come with this book are included in the appendix.

The ESRI Guide to GIS Analysis, Volume 1 and Volume 2 GIS for Environmental Management The case studies in this book explore how biologists, geologists, conservationists, and others responsible for managing and protecting the environment rely on GIS to help them deal with a range of environmental issues, including biodiversity and pollution, coastal zone management, and change detection.
Remote Sensing for GIS ManagersThis guide to remote sensing technology presents GIS managers who have no previous remote sensing experience with the basics of integrating it with GIS data. 2. Rare vegetation Monitoring Training Scripts Rare vegetation Monitoring Training Scripts specially have been developed by Yelena Gambarova for Project “Rare plant conservation in Azerbaijan: Monitoring threats and Education of Local Community” supported by Rufford Small Grants for Nature Conservation. It is the direct result of our GIS Expert’s experiences teaching GIS to students at high schools and universities, as well as working professionals. The document describes the training program which is related to teaching of students and stakeholder groups to advanced capabilities of GIS and RS technologies on rare vegetation monitoring in Azerbaijan. This document describes the step-by-step instructions of each phase of the Training Test Scripts and their short description. The document includes Overview of the each Test Script phase, Prerequisites, any Steps required and tester identification. Each field in the Step Script definitions has been explained. This document will be presented to Rufford Fund separately.

Remote Sensing and Monitoring Seminar, October 2013 RS/GIS Expert from our Team conducted a seminar on rare vegetation monitoring using GIS and Remote Sensing Technologies at University of Architecture and Construction, in Baku. After reviewing the workshop materials (i.e., presentations, tutorials and Rare vegetation Monitoring Training Scripts) created by the team, RS/GIS Experts conducted the workshop in Azerbaijani. Training Materials for the course were translated into Azerbaijani. During the training, Yelena Gambarova and Ph.D. Eltakin Babayev, lecturer of Department of “Engineering geodesy”, University of Architecture and Construction, Baku provided a basic introduction on the use of GIS and Remote Sensing for conservation and submitted a flow chart showing the structure of the rare vegetation monitoring program. The participants learned the basics of working with existing GIS data and maps and how to build maps from GIS data and create geodatabase and import data into them.

Monitoring of the threats to rare vegetation in Gobustan, Workshop, 2013 In November 2013, staff members, together with staff of……… conducted a workshop on monitoring of existing threats to rare vegetation in the Study Area. The participants were informed about the threats to rare species of plants in Gobustan such as: Global Climate Change, oil and gas exploration, overgrazing of winter and summer pastures by domestic sheep, goats and cattle, pollution, etc.
Presentation in the local school During the project and after its completion the members of the project team organized several lections and slide shows in the local school. At these meetings representatives of the team were providing schoolchildren with information about the project. Pictures, maps and posters were used to have a better illustration of the field work. As well there was established a base for the involvement of the pupils in future nature conservation projects.

FEEDBACK AND REVIEW OF THE EFFECTIVENESS OF THE TRAINING. CONCLUSION On 12-15 October-November 2013, the questionnaire was submitted to all participants for the Training Course evaluation. Four participants completed the evaluation forms, and overwhelming reported that they had experienced the training event as being useful and having met their expectations. I have translated these documents in English. The participants have been required to provide feedback through completing and returning the course evaluation questionnaire. These were the questions participants were asked as they gave us feedback. 1. Quality of Training materials Q1 Training materials 2. Training’s environment / format/ Q2 Environment 3. How well the training content? Q3 Content 4. Effectiveness of Presentation Q4 Presentation 5. Questions and Answers Process Q5 Questions and Answers 6. Responsiveness of Trainer Q6 Responsiveness of Trainer 7. Usefulness of practical works Q7 Usefulness of practical works 8. Professionalism of Trainer Q8 Professionalism of Trainer 9. Overall training impression Q9 Impression 10. In your opinion: What must be changed /by you
opinion/ in: a. training organization b. matter of presentation materials c. teaching methodology
Q10 Opinion
11. What was the most liked / disliked by you? Q11 Opinion Participant responses were rated according to the following scale: 1 = Do not know 2 = Poor 3 = Fair 4 = Good 5 = Excellent
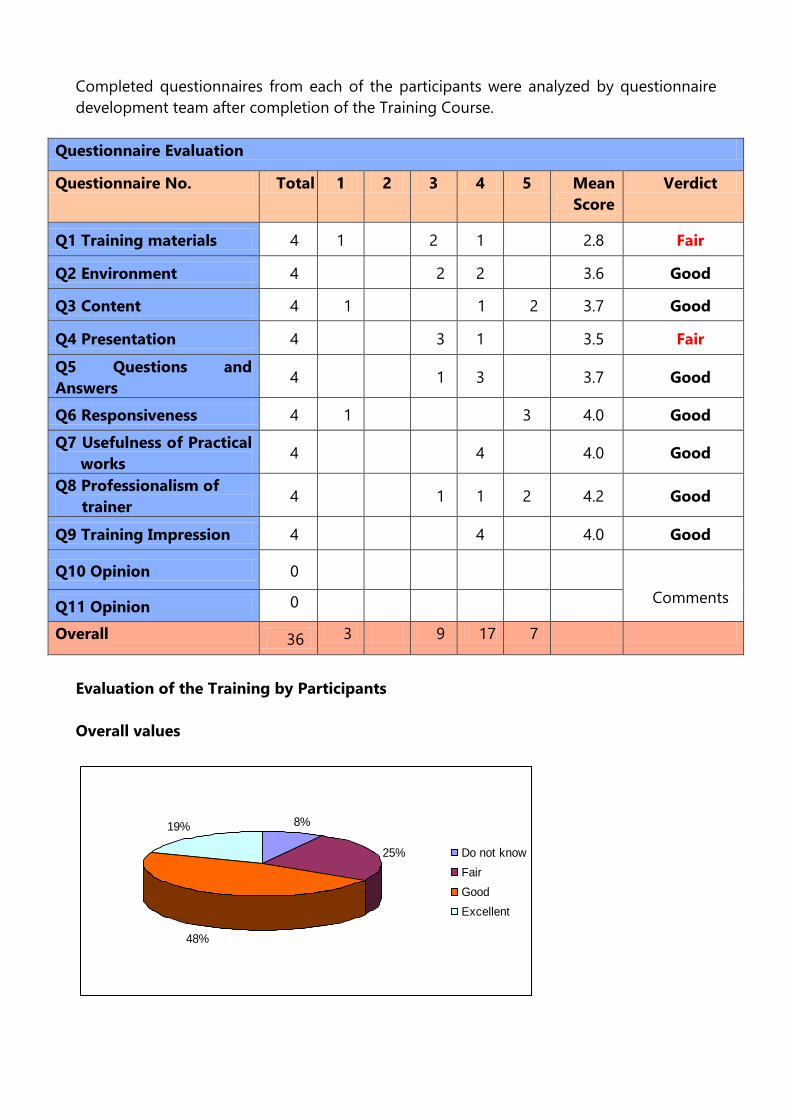
Completed questionnaires from each of the participants were analyzed by questionnaire development team after completion of the Training Course.
Questionnaire Evaluation
Questionnaire No. Total 1 2 3 4 5 Mean Score
Verdict
Q1 Training materials 4 1 2 1 2.8 Fair
Q2 Environment 4 2 2 3.6 Good
Q3 Content 4 1 1 2 3.7 Good
Q4 Presentation 4 3 1 3.5 Fair
Q5 Questions and Answers
4 1 3 3.7 Good
Q6 Responsiveness 4 1 3 4.0 Good
Q7 Usefulness of Practical works
4 4 4.0 Good
Q8 Professionalism of trainer
4 1 1 2 4.2 Good
Q9 Training Impression 4 4 4.0 Good
Q10 Opinion 0 Comments Q11 Opinion 0
Overall 36 3 9 17 7
Evaluation of the Training by Participants Overall values
8%
25%
48%
19%
Do not knowFair Good Excellent

Figure 2. Post Programme Training Questionnaire Results
The participants completed the evaluation forms, and overwhelmingly reported that they had experienced the training event as being useful and having met their expectations. The results presented in Figure show that the participants were pleased with the quality of the training. Professionalism and responsiveness of trainers, usefulness of practical works were evaluated as very “Good”. The participants have also indicated a good balance of theory and practical exercises. On the other hand, the level of training materials and presentations slides were assessed as “Fair”. The participants remarked that the time for the training was too short and duration of the training should be extended. The volume of training documents was small because some of them (Tutorials, Training Scripts) have not been translated into Azerbaijani yet and the User Manuals were translated but not delivered in time.
Recommendation Course duration should be longer – even more than one day - to enable more time to cover topics adequately. The Training documents: Tutorials, Training Scripts and etc. should be translated into Azeri and should be delivered among with Students as soon as possible.
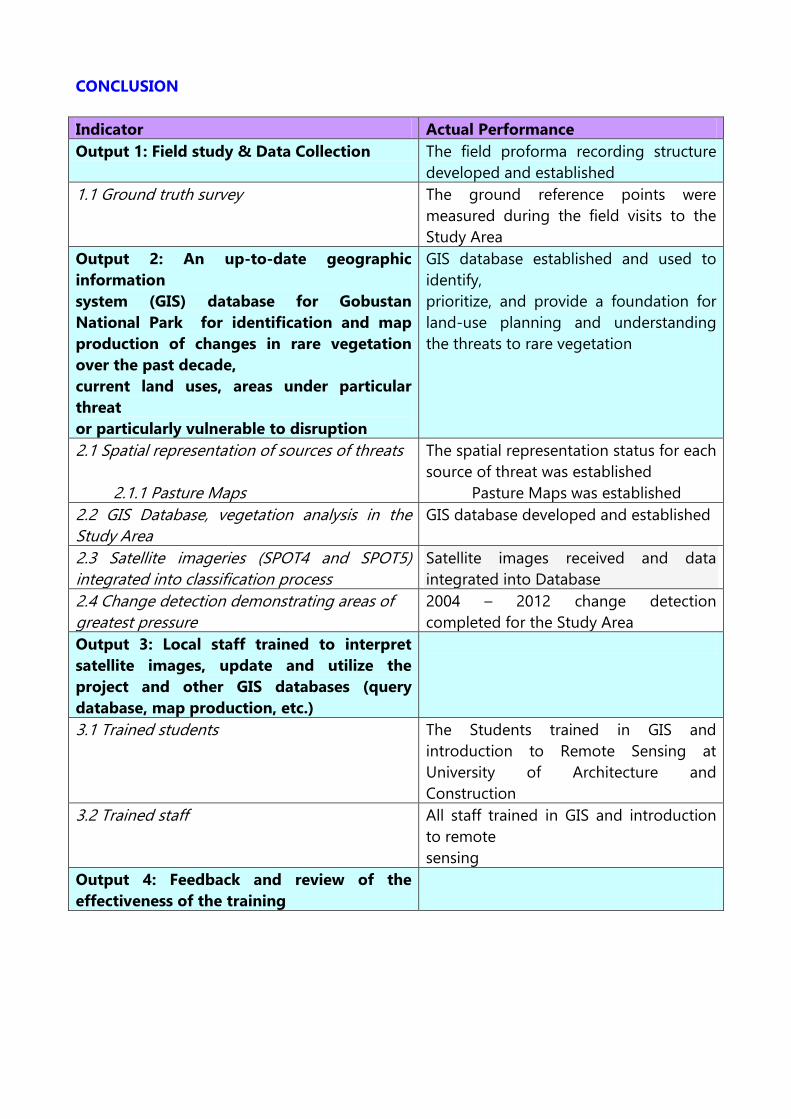
CONCLUSION Indicator Actual Performance Output 1: Field study & Data Collection The field proforma recording structure
developed and established 1.1 Ground truth survey The ground reference points were
measured during the field visits to the Study Area
Output 2: An up-to-date geographic information system (GIS) database for Gobustan National Park for identification and map production of changes in rare vegetation over the past decade, current land uses, areas under particular threat or particularly vulnerable to disruption
GIS database established and used to identify, prioritize, and provide a foundation for land-use planning and understanding the threats to rare vegetation
2.1 Spatial representation of sources of threats
2.1.1 Pasture Maps
The spatial representation status for each source of threat was established
Pasture Maps was established 2.2 GIS Database, vegetation analysis in the Study Area
GIS database developed and established
2.3 Satellite imageries (SPOT4 and SPOT5) integrated into classification process
Satellite images received and data integrated into Database
2.4 Change detection demonstrating areas of greatest pressure
2004 – 2012 change detection completed for the Study Area
Output 3: Local staff trained to interpret satellite images, update and utilize the project and other GIS databases (query database, map production, etc.)
3.1 Trained students The Students trained in GIS and introduction to Remote Sensing at University of Architecture and Construction
3.2 Trained staff All staff trained in GIS and introduction to remote sensing
Output 4: Feedback and review of the effectiveness of the training

4.1 The participants have been required to provide feedback through completing and returning the course evaluation questionnaire. 4.2 The Training Questionnaire Evaluation
The questionnaire was submitted to all participants for the Training Course evaluation. Four participants completed the evaluation forms, and overwhelming reported that they had experienced the training event as being useful and having met their expectations. Completed questionnaires from each of the participants were analyzed by questionnaire development team after completion of the Training Course.
4.3 Azerbaijani staff using the data and producing maps and reports
5 staff using information within the Project and their ministries producing maps and reports
Output 5: Increased local and international awareness of rare vegetation and its regional significance
Information developed and distributed to all interested and pertinent parties including Azerbaijani government agencies, NGOs etc.
5.1 Greater knowledge of the extent and condition of Gobustan’s area and biodiversity
Information developed and ongoing
5.2 Products disseminated to all potential Data distributed to UNDP program in Azerbaijan
5.3 International media broadcasting information generated from project
Project information highlighted, through various avenues, in international media such as UNCCD Scientific Social Community, OMICS Group
Other accomplishments
• A detailed report with all outcomes of the project will be delivered to decision makers and conservationists in order to contribute to develop species-based or general conservation strategies.
• Distribution maps and lists of species inside/outside of the Gobustan protected areas generated in this study will be giving to persons responsible for every involved protected area for using them in the conservation and management plans of these reserves.
Actions Necessary to Address Threats 1. Overgrazing- Efforts are needed to be made to provide alternative fodder for domestic sheep and goats that are regularly herded through fragile landscapes. 2. Infrastructure development - Terrestrial infrastructures like disintegrating former Soviet era factories, pipelines and other infrastructure need to be removed, and new infrastructure needs to meet EIA requirements. Public awareness activities & Media Appearance 1. United Nations Convention to Combat Desertification (UNCCD) This article is on UNCCD homepage and here http://www.unccd.int/en/programmes/Event-and-campaigns/Actions-around-the-world/Pages/default.aspx 3. Conference and Research Papers (Appendix 2) http://www.omicsgroup.com/conferences/earth-science-climate-change-2013/scientific programme.php?day=2&sid=35&date=2013-07-23 Research Papers published in 2013 1. Yelena Gambarova, “Rare vegetation conservation in Gobustan National Park,
Azerbaijan”, OMICS GROUP, Conference on Earth Science & Climate Change, July 21-24, 2013, San Diego, USA.
2. Yelena Gambarova et al, “MONITORING PASTURES IN GOBUSTAN, AZERBAIJAN: GEOGRAPHICAL DATA BASE DESIGN AND CREATION OF SPECIALIZED GIS ENVIRONMENT”, International Geoinformatics Research and Development Journal (IGRDJ), Vol. 4, Issue 3, September 2013.
3. Yelena Gambarova et al, “Rare vegetation degradation in relation to cattle grazing in Gobustan, Azerbaijan: Classification and change detection from remotely-sensed images”, International Geoinformatics Research and Development Journal (IGRDJ), Vol. 4, Issue 4, 2013.
http://www.igrdg.com/Archive.php http://igrdg.com/2013/September/Monitoring%20Pastures%20in%20Gobustan,%20Azerbaijan.pdf 2. Социальная Научная Сеть http://www.science-community.org/ru
Other accomplishments • A detailed report with all outcomes of the project will be delivered to decision makers and conservationists in order to contribute to develop species-based or general conservation strategies. • Distribution maps and lists of species inside/outside of the Gobustan protected area generated in this study will be giving to persons responsible for every involved protected area for using them in the conservation and management plans of these reserves.

APPENDIX 1 Rare vegetation classification on the NORHTEN part of the Sensitive Area APPENDIX Public awareness activities & Media Appearance 1. United Nations Convention to Combat Desertification (UNCCD)
This article is on UNCCD homepage and here http://www.unccd.int/en/programmes/Event-and-campaigns/Actions-around-the-world/Pages/default.aspx

2. Conference
3.Research papers

Letter of Thanks