rasch-scaling of phq-9 and gad-7 · pdf filenhs::iapt improving access to psychological...
TRANSCRIPT

Jan R. Böhnke & Jaime Delgadillo
Rasch-scaling of PHQ-9 and GAD-7
Consequences for repeated assessments

NHS::IAPT
Improving Access to Psychological Therapies
"Improving Access to Psychological
Therapies is an NHS programme rolling
out services across England offering
interventions approved by the National
Institute of Health and Clinical Excellence
(NICE) for treating people with depression
and anxiety disorders."
2 Jan R. Böhnke
(http://www.iapt.nhs.uk/)

IAPT in Numbers
• End of 2012: One million patients treated
• Last documented quarter (07-09/2014):
– 151 services across country completely up and
running (HSCIC web transfer)
– 300,000 new referrals
• 200,000 entered treatment
– 280,000 ended treatment
– 61% of all referrals entering treatment "improved
reliably"
3 Jan R. Böhnke
http://www.hscic.gov.uk

Monitoring in IAPT
"Routine outcomes measurement is central to
improving service quality - and accountability"
4 Jan R. Böhnke
(http://www.iapt.nhs.uk/)

Monitoring in IAPT
IAPT uses two core instruments
• PHQ-9 to assess severity of depression
• GAD-7 to assess severity of anxiety
• Both instruments use the same response format:
– 0 = not at all
– 1 = several days
– 2 = more than half the days
– 3 = nearly everyday
5 Jan R. Böhnke
Kroenke, Spitzer, & Williams (2001). Journal of General Internal Medicine, 16, 606 – 613.
Spitzer, Kroenke, Williams & Löwe (2006). Archives of Internal Medicine, 166, 1092–1097.

Monitoring in IAPT: PHQ-9
Over the last two weeks,
how often have you been bothered by any of the following problems?
Little interest or pleasure in doing things?
Feeling down, depressed, or hopeless?
Trouble falling or staying asleep, or sleeping too much?
Feeling tired or having little energy?
Poor appetite or overeating?
Feeling bad about yourself - or that you are a failure or have let yourself or your family
down?
Trouble concentrating on things, such as reading the newspaper or watching
television?
Moving or speaking so slowly that other people could have noticed? Or the opposite -
being so fidgety or restless that you have been moving around a lot more than usual?
Thoughts that you would be better off dead, or of hurting yourself in some way?
6 Jan R. Böhnke

Monitoring in IAPT: GAD-7
7 Jan R. Böhnke
Over the last two weeks,
how often have you been bothered by any of the following problems?
Feeling nervous, anxious or on edge?
Not being able to stop or control worrying?
Worrying too much about different things?
Trouble relaxing?
Being so restless that it is hard to sit still?
Becoming easily annoyed or irritable?
Feeling afraid as if something awful might happen?

Different Instruments?
Different Constructs?
• Do different patient reported outcome
measures (PROMs) actually assess different
constructs?
• Rather they seem to address one factor...
– "General psychological distress"
• ...and only very little additional variation
specific to different instruments
8 Jan R. Böhnke
Reininghaus & Priebe (2012). British Journal of Psychiatry, 201(4), 262–267.
Caspi, et al. (2014). Clinical Psychological Science, 2, 119–137.

Different Instruments?
Different Constructs?
• Instruments in IAPT: – Leeds Community Healthcare NHS Trust
– Patients from 2008 to 2010
– N = 13,390 • n = 11,393 provided responses to at least three items
• Available diagnoses – Depression: N = 2,547
– Mixed anxiety and depression: N = 2,098
– Generalised anxiety & anxiety disorders: N = 1,822
– n = 2,851: panic disorder, obsessive compulsive disorder, post-traumatic stress disorder, social anxiety, specific phobias, ...
– n = 2,621 NOS
9 Jan R. Böhnke Böhnke, Lutz & Delgadillo (2014). Journal of Affective Disorders, 166, 270–278.

• Bifactor IRT modelling revealed that one
factor explained most of the variance
observed in three instruments
– (PHQ-9, GAD-7, WSAS)
– ωH = .88
– ω = .96
• PHQ-9: ω = .92, ωS = .05
• GAD-7: ω = .92, ωS = .27
• WSAS: ω = .83, ωS = .37
Different Instruments?
Different Constructs?
10 Jan R. Böhnke
Böhnke, Lutz & Delgadillo (2014). Journal of Affective Disorders, 166, 270–278.
Reise, Bonifay & Haviland (2013). Journal of Personality Assessment, 95, 129–140.

New Question...
Since the PHQ-9 and the GAD-7 seem
to be so similar: Can they be Rasch-
scaled?
11 Jan R. Böhnke
Bohnke & Lutz (2014). Using item and test information to optimize targeted assessments of psychological
distress. Assessment, 21, 679–693.

METHODS
12 Jan R. Böhnke

Sample
• N = 6244 assessments
– N = 5879 screenings
– N = 5652 last assessments
• Follow-up data
– Last assessment of every case...
– ...with three documented assessments
– ...and three item responses across the two instruments
13 Jan R. Böhnke
0
.05
.1.1
5.2
De
nsity
0 10 20 30 40No. of documented assessments

R Packages Used
• Thomas Kiefer, Alexander Robitzsch and Margaret Wu (2015). TAM: Test Analysis Modules. R package version 1.5-2.
• Alexander Robitzsch (2015). sirt: Supplementary Item Response Theory Models. R package version 1.5-0.
• Mair, P., & Hatzinger, R. (2007). Extended Rasch modeling: The eRm package for the application of IRT models in R. Journal of Statistical Software, 20(9), 1-20
14 Jan R. Böhnke

RESULTS
15 Jan R. Böhnke
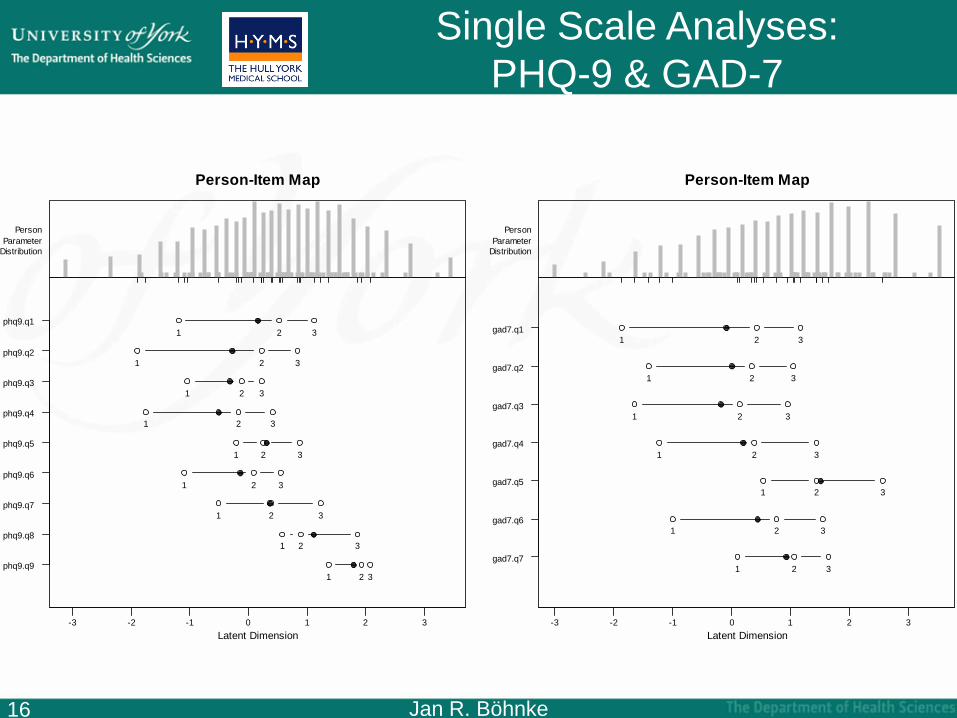
Single Scale Analyses:
PHQ-9 & GAD-7
16 Jan R. Böhnke
phq9.q9
phq9.q8
phq9.q7
phq9.q6
phq9.q5
phq9.q4
phq9.q3
phq9.q2
phq9.q1
-3 -2 -1 0 1 2 3
Latent Dimension
1 2 3
1 2 3
1 2 3
1 2 3
1 2 3
1 2 3
1 2 3
1 2 3
1 2 3
Person-Item Map
ttx
Person
Parameter
Distribution
gad7.q7
gad7.q6
gad7.q5
gad7.q4
gad7.q3
gad7.q2
gad7.q1
-3 -2 -1 0 1 2 3
Latent Dimension
1 2 3
1 2 3
1 2 3
1 2 3
1 2 3
1 2 3
1 2 3
Person-Item Map
ttx
Person
Parameter
Distribution

17 Jan R. Böhnke
• Item fit statistics for single scales:
OUTFIT INFIT
phq9_q1 .810 .809
phq9_q2 .670 .691
phq9_q3 1.049 1.022
phq9_q4 .854 .873
phq9_q5 1.057 1.032
phq9_q6 .884 .895
phq9_q7 .912 .914
phq9_q8 1.107 1.079
phq9_q9 .934 1.002
OUTFIT INFIT
gad7_q1 .869 .862
gad7_q2 .605 .631
gad7_q3 .614 .630
gad7_q4 .761 .773
gad7_q5 1.027 1.037
gad7_q6 1.273 1.242
gad7_q7 1.083 1.076
Single Scale Analyses:
PHQ-9 & GAD-7

18 Jan R. Böhnke
• Expectation of person fit vs. empirical
χ²(df=1) = PHQ alone
(Outfit / Infit)
GAD alone
(Outfit / Infit)
1.00 (1-D = .317) .305 / .331 .286 / .283
1.30 (1-D = .254) .175 / .195 .166 / .185
2.71 (1-D = .100) .016 / .012 .010 / .011
3.84 (1-D = .050) .002 / .000 .002 / .001
Single Scale Analyses:
PHQ-9 & GAD-7
MULTIPLE INSTRUMENTS
SINGLE DIMENSION
19 Jan R. Böhnke

Unidimensional Rasch Model
20 Jan R. Böhnke
gad7.q7
gad7.q6
gad7.q5
gad7.q4
gad7.q3
gad7.q2
gad7.q1
phq9.q9
phq9.q8
phq9.q7
phq9.q6
phq9.q5
phq9.q4
phq9.q3
phq9.q2
phq9.q1
-4 -3 -2 -1 0 1 2 3 4
Latent Dimension
1 2 3
1 2 3
1 2 3
1 2 3
1 2 3
1 2 3
1 2 3
1 2 3
1 2 3
1 2 3
1 2 3
1 2 3
1 2 3
1 2 3
1 2 3
1 2 3
Person-Item Map
ttx
Person
Parameter
Distribution

Unidimensional Rasch Model
• Item fit statistics for
both instruments
together
21 Jan R. Böhnke
OUTFIT INFIT
phq9_q1 .913 .908
phq9_q2 .721 .749
phq9_q3 1.211 1.142
phq9_q4 .971 .983
phq9_q5 1.222 1.165
phq9_q6 .922 .924
phq9_q7 .925 .938
phq9_q8 1.021 1.026
phq9_q9 1.090 1.142
gad7_q1 .898 .925
gad7_q2 .742 .778
gad7_q3 .730 .770
gad7_q4 .765 .788
gad7_q5 .985 .995
gad7_q6 1.096 1.065
gad7_q7 1.156 1.130

Unidimensional Rasch Model
χ²(df=1) = PHQ
(Outfit / Infit)
GAD
(Outfit / Infit)
GAD & PHQ
(Outfit / Infit)
1.00 (1-D = .317) .305 / .331 .286 / .283 .357 / .389
1.30 (1-D = .254) .175 / .195 .166 / .185 .189 / .206
2.71 (1-D = .100) .016 / .012 .010 / .011 .006 / .004
3.84 (1-D = .050) .002 / .000 .002 / .001 .001 / .000
22 Jan R. Böhnke

ASSESSMENT OF CHANGE
23 Jan R. Böhnke
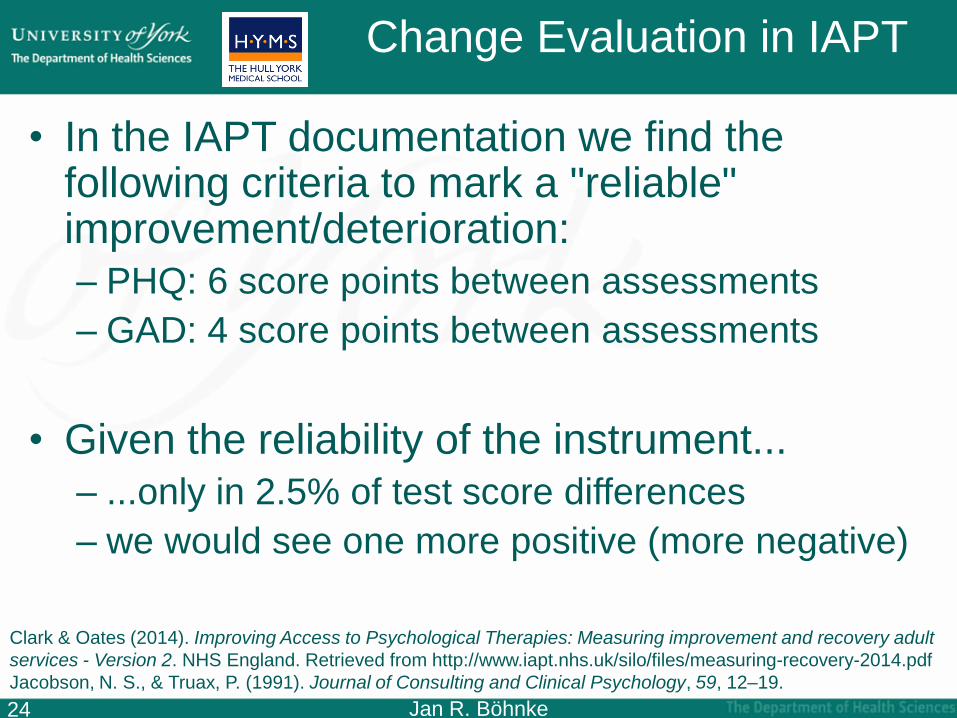
Change Evaluation in IAPT
• In the IAPT documentation we find the following criteria to mark a "reliable" improvement/deterioration:
– PHQ: 6 score points between assessments
– GAD: 4 score points between assessments
• Given the reliability of the instrument...
– ...only in 2.5% of test score differences
– we would see one more positive (more negative)
24 Jan R. Böhnke
Clark & Oates (2014). Improving Access to Psychological Therapies: Measuring improvement and recovery adult
services - Version 2. NHS England. Retrieved from http://www.iapt.nhs.uk/silo/files/measuring-recovery-2014.pdf
Jacobson, N. S., & Truax, P. (1991). Journal of Consulting and Clinical Psychology, 59, 12–19.
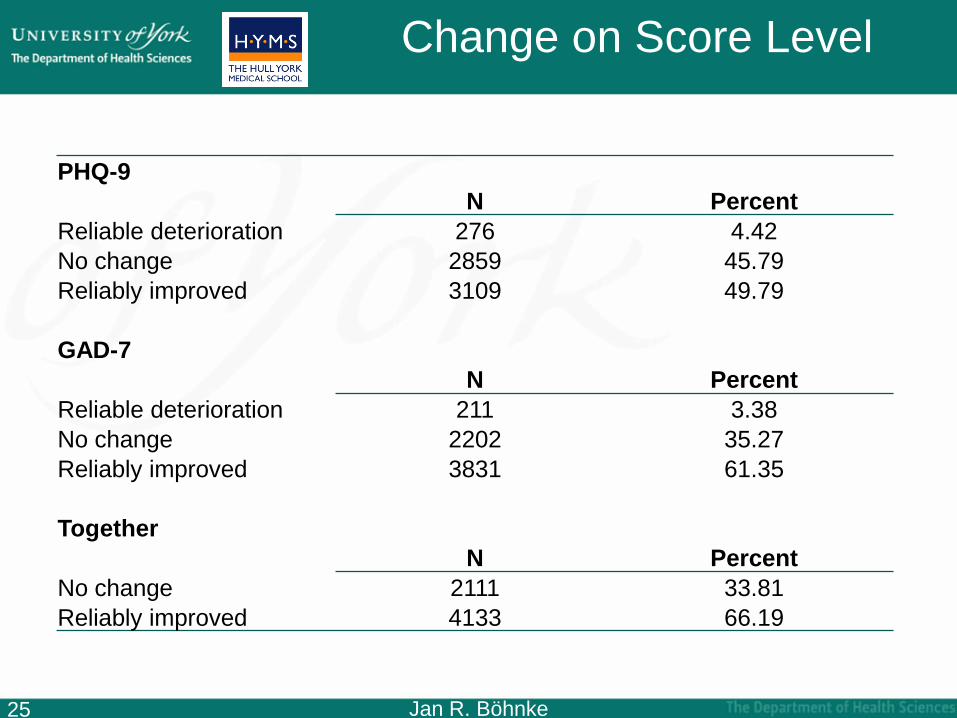
Change on Score Level
PHQ-9
N Percent
Reliable deterioration 276 4.42
No change 2859 45.79
Reliably improved 3109 49.79
GAD-7
N Percent
Reliable deterioration 211 3.38
No change 2202 35.27
Reliably improved 3831 61.35
Together
N Percent
No change 2111 33.81
Reliably improved 4133 66.19
25 Jan R. Böhnke

IRT/Rasch Perspective
• Reise and Haviland suggested:
– use theta estimate from "pre-"assessment
– build (95%-)CI with conditional SE
– classify change based on this more individual
information
26 Jan R. Böhnke
Reise & Haviland (2005). Journal of Personality Assessment, 84, 228–238.
Brouwer, Meijer & Zevalkink (2013). Psychotherapy Research, http://doi.org/10.1080/10503307.2013.794400

Reliability- vs Information-Based
Assessment
27 Jan R. Böhnke
0 5 10 15 20 25
05
10
15
RCI for PHQ
Ch
an
ge
Sco
re
*
*
**
*
**
* *
*
**
*
*
* *
*
* ***
*
*
*
**
*
*
*
**
*** *
*
** ** *
**
*
*
*
**
**
*
* ** **
*
*
*
*
* ** *
***
**
** *
*
**
**
***
* ***
**
*
*
***
*
** ***
0 5 10 15 20
05
10
15
RCI for GAD
***
*
**
*
* *
*
* **
*
*
***
**
*
**
*
*
*
* **
**
***
*
**
*
*
***
*
*** *
*
*
*
*
*
*
*
*
**
*
***
*
*
*
*
* *
*
***
**** ** *
**
*
*
0 10 20 30 40
05
10
15
Overall Score
*
**
* **
**
*
*
**** * *
** *
*
**
**
***
*
*
*
**
*
**
*
*
*
* *
*
*
**
*
*
**
*
***
* *
*
*
*
*
***
**
* **
*
*
***
*
*
***
**
*
**
**
*
** **
**** **
*
*
*** *
*
*
*
*
*
*
**
*
** *
*
** *
*
**
*
** *
**
* * *
* *
***
**
**
*
*
*
*
**
*
** **
**
**
*
** *
* * * ***
**
* *
*
****
**
Total Score
Fre
qu
en
cy
0 5 10 15 20 25
05
10
15
Total Score
0 5 10 15 20
05
10
15
Total Score
0 10 20 30 40
05
10
15

28 Jan R. Böhnke
Reliability-based Information-based
PHQ-9
N Percent N Percent
Reliable deterioration 122 2.3 226 4.3
No change 2846 53.8 2081 39.4
Reliably improved 2319 43.9 2980 56.4
GAD-7
N Percent N Percent
Reliable deterioration 192 3.6 228 4.3
No change 2337 44.2 2106 39.8
Reliably improved 2758 52.2 2953 55.9
Together
N Percent N Percent
Reliable deterioration - - 288 5.4
No change - - 1541 29.1
Reliably improved - - 3458 65.4
Reliability- vs Information-Based
Assessment

PHQ Trait-based
Deterioration No Change Improvement
Deterioration 0.98 0.02 0.00
PHQ Score-based No Change 0.04 0.73 0.23
Improvement 0.00 0.00 1.00
PHQ Trait-based
Deterioration No Change Improvement
Deterioration 0.98 0.02 0.00
PHQ Score-based No Change 0.02 0.89 0.09
Improvement 0.00 0.00 1.00
29 Jan R. Böhnke
Reliability- vs Information-Based
Assessment

DISCUSSION
30 Jan R. Böhnke

Summary of Results
• Both instruments might fit the Rasch Model
– also if used as an item pool
• Both instruments cover the spectrum present in the sample
• Both instruments show relevant differences between reliability- and information-based change assessment
– in terms of "numbers classified"
– in terms of relevant trait range
31 Jan R. Böhnke

Thanks to...
...Jaime Delgadillo (NHS Trust Leeds & University of York)
...Rob Meijer (Groningen) & Jan Štochl (York)
...Tim Croudace (Dundee)
...Mental Health and Addiction Research Group (Simon Gilbody)
32 Jan R. Böhnke