raster data and arcgis spatial analyst · david tenenbaum – eeos 465 / 627 – umass boston...
TRANSCRIPT
David Tenenbaum – EEOS 465 / 627 – UMass Boston
Raster Data and ArcGIS Spatial Analyst
• Raster Concepts• Why use Raster Data?• ArcGIS Spatial Analyst
David Tenenbaum – EEOS 465 / 627 – UMass Boston
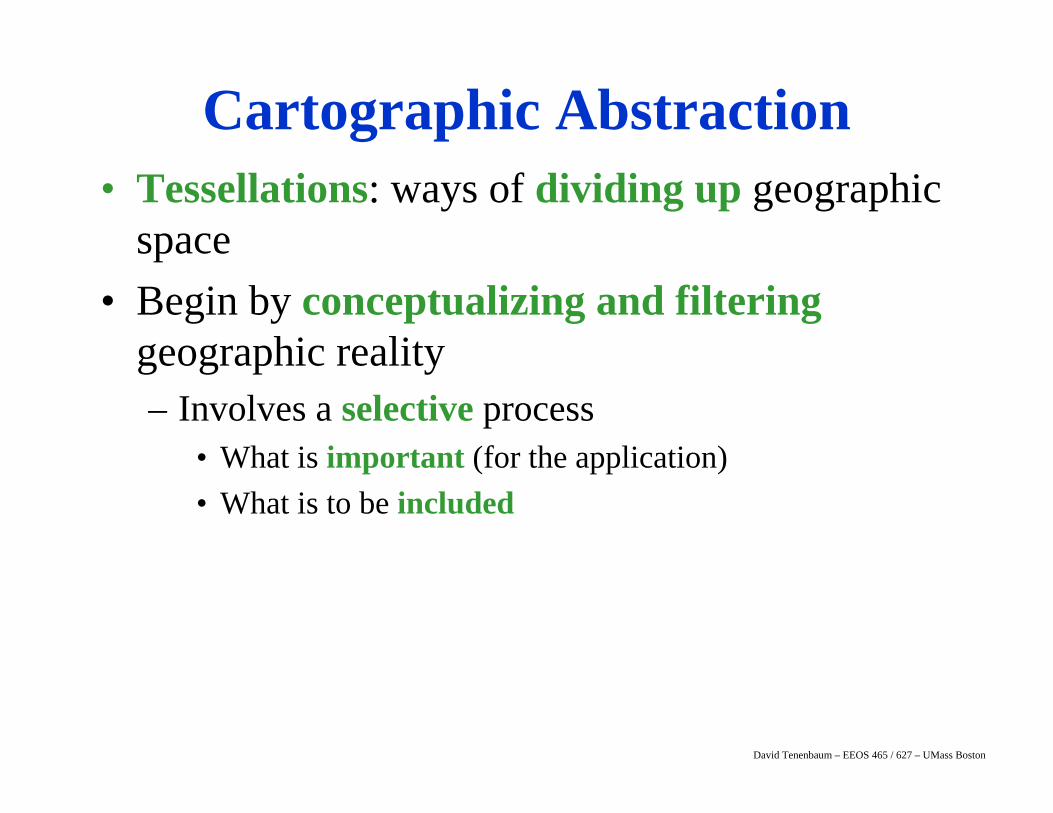
Cartographic Abstraction• Tessellations: ways of dividing up geographic
space• Begin by conceptualizing and filtering
geographic reality– Involves a selective process
• What is important (for the application)• What is to be included
David Tenenbaum – EEOS 465 / 627 – UMass Boston
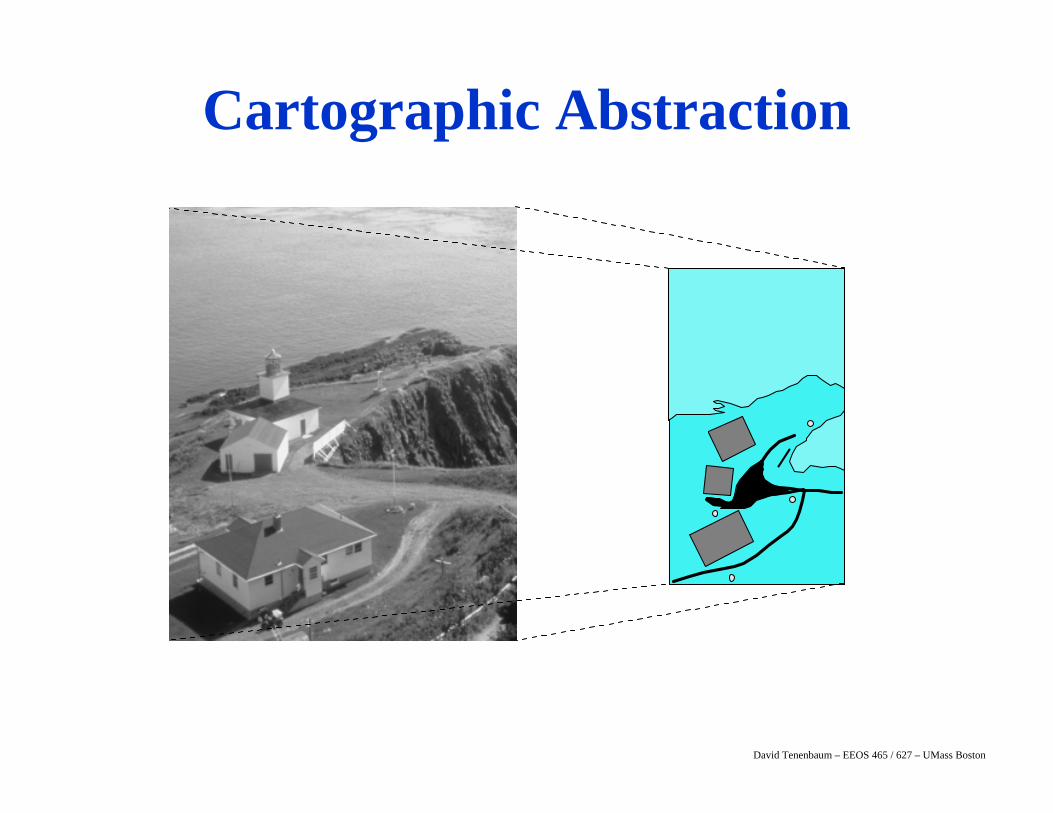
Cartographic Abstraction
David Tenenbaum – EEOS 465 / 627 – UMass Boston
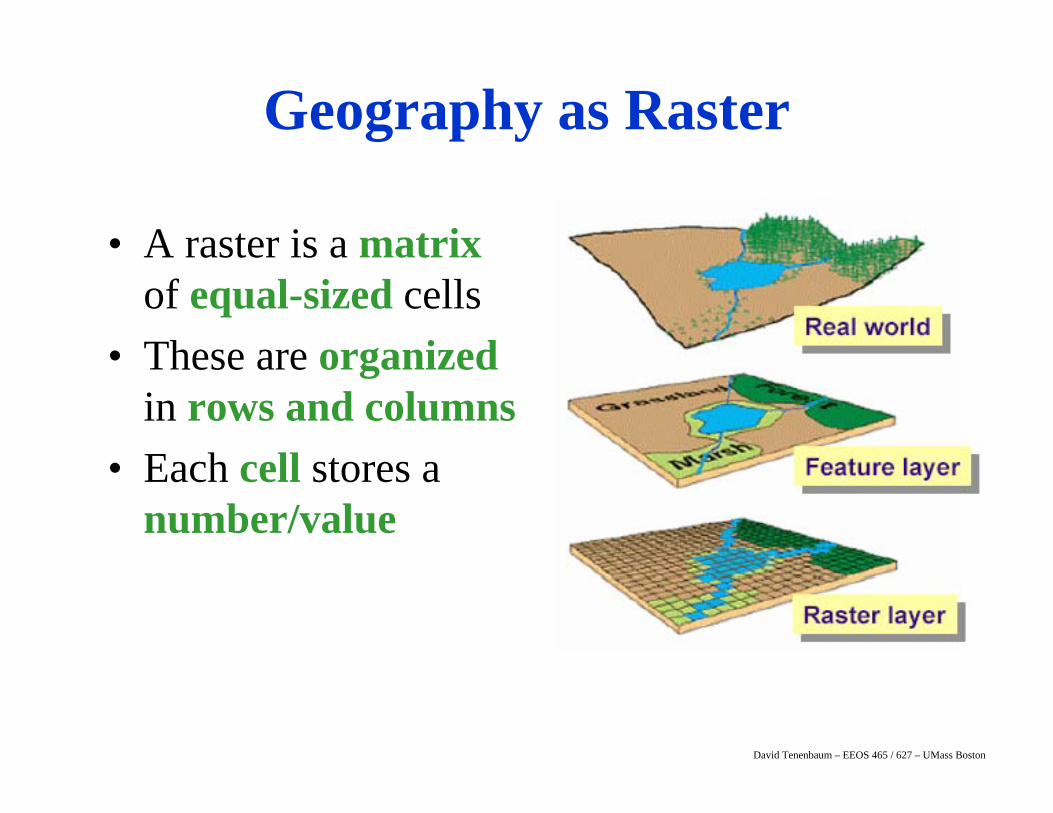
Geography as Raster
• A raster is a matrixof equal-sized cells
• These are organizedin rows and columns
• Each cell stores a number/value
David Tenenbaum – EEOS 465 / 627 – UMass Boston
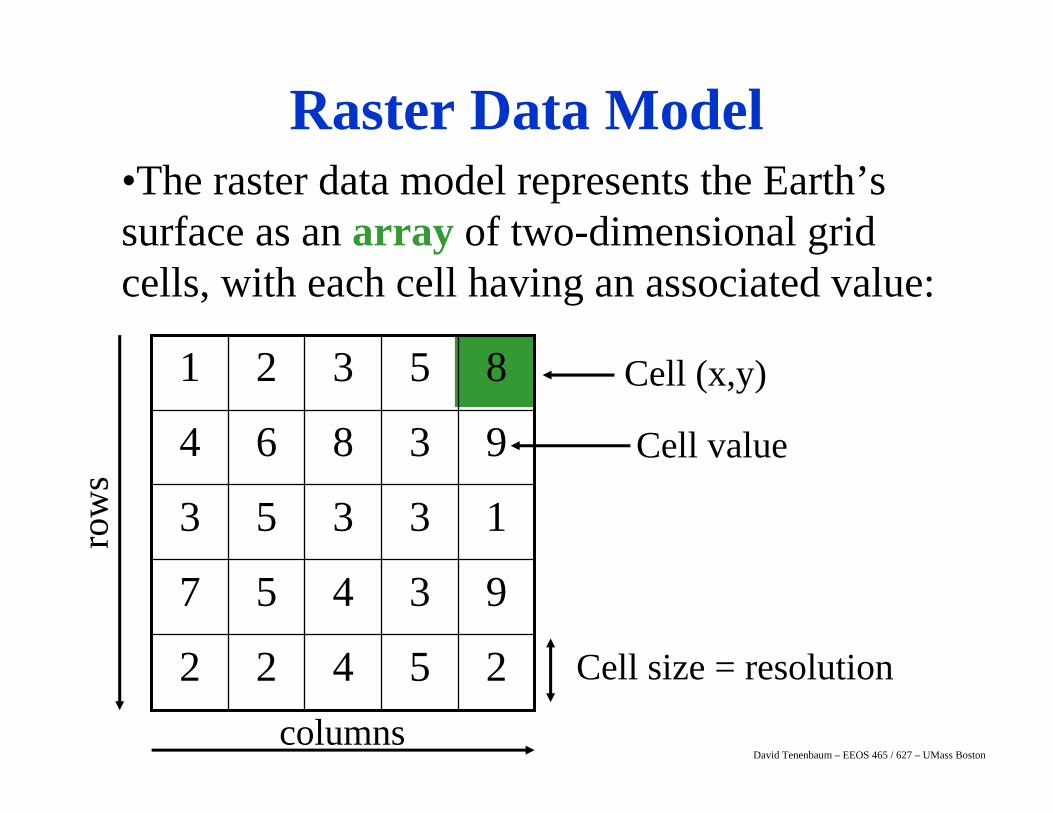
Cell (x,y)
•The raster data model represents the Earth’s surface as an array of two-dimensional grid cells, with each cell having an associated value:
25422
93457
13353
93864
85321
Cell value
Cell size = resolution
columns
row
sRaster Data Model
David Tenenbaum – EEOS 465 / 627 – UMass Boston
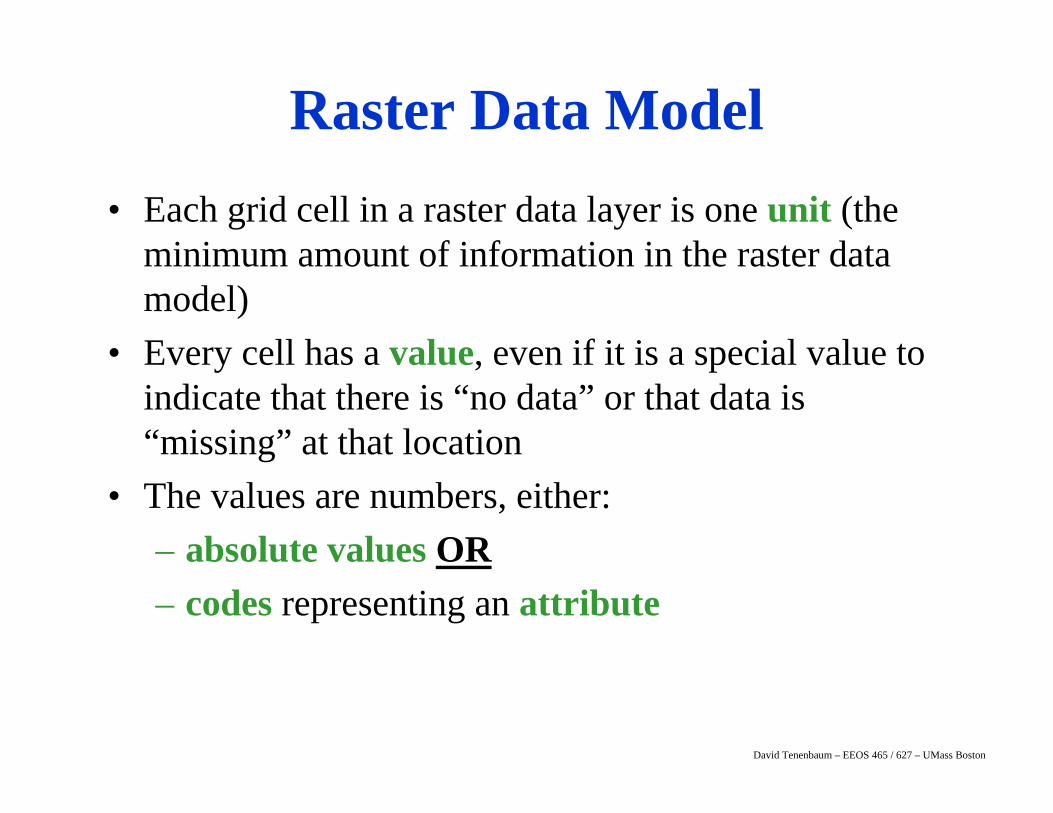
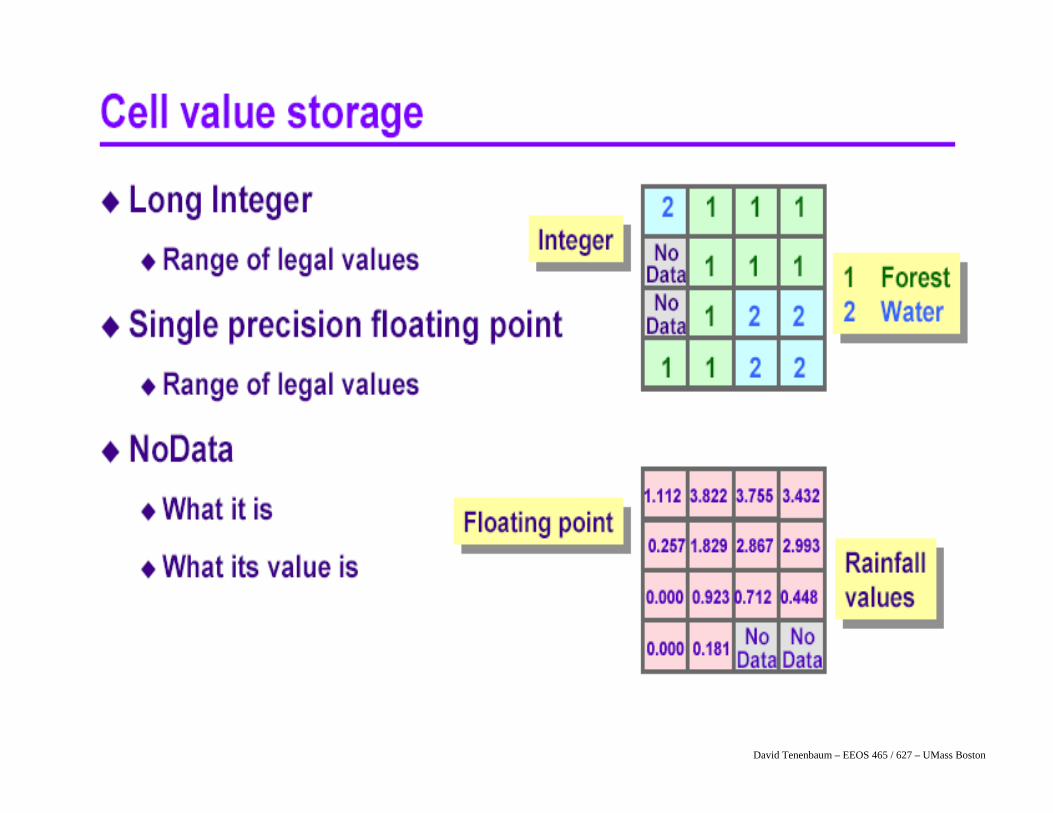
Raster Data Model• Each grid cell in a raster data layer is one unit (the
minimum amount of information in the raster data model)
• Every cell has a value, even if it is a special value to indicate that there is “no data” or that data is “missing” at that location
• The values are numbers, either:– absolute values OR– codes representing an attribute
David Tenenbaum – EEOS 465 / 627 – UMass Boston
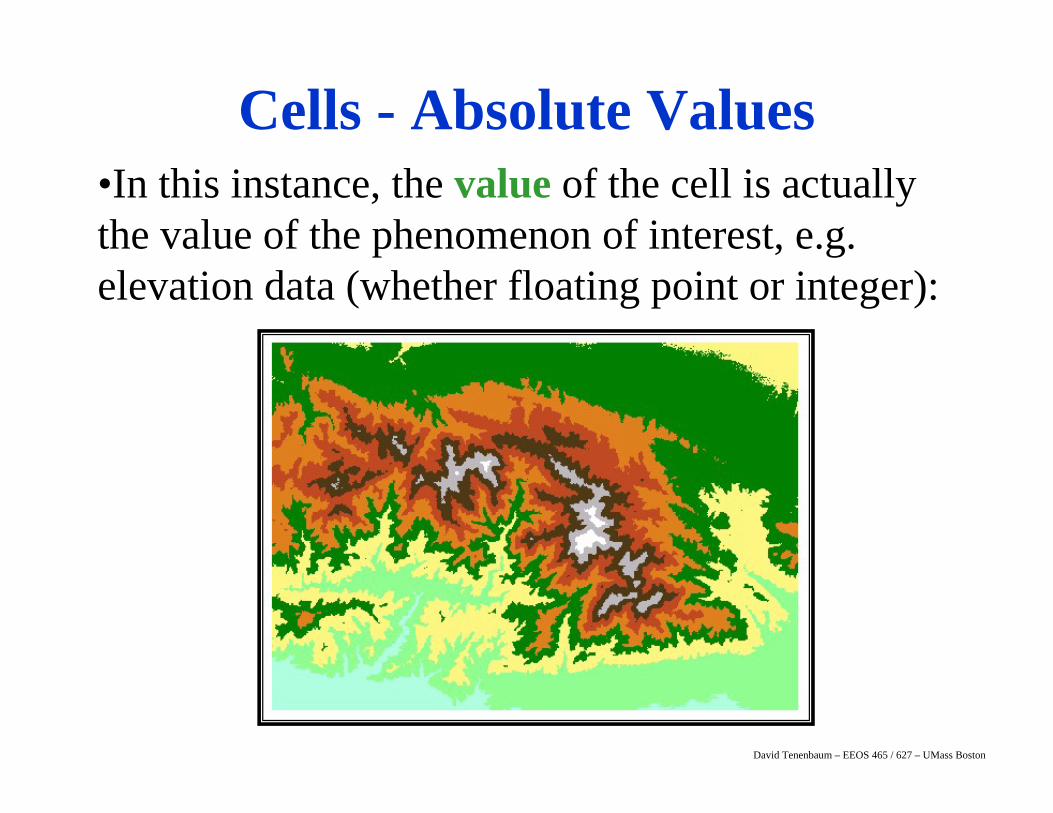
Cells - Absolute Values•In this instance, the value of the cell is actually the value of the phenomenon of interest, e.g. elevation data (whether floating point or integer):
David Tenenbaum – EEOS 465 / 627 – UMass Boston
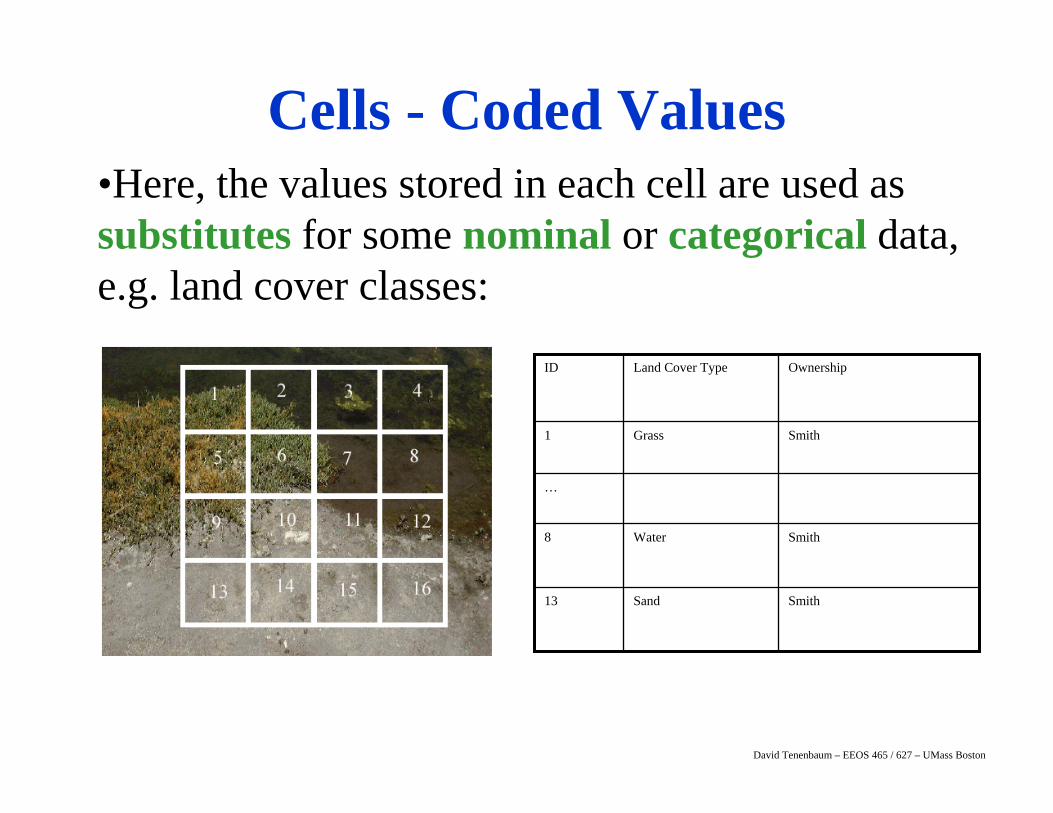
Cells - Coded Values•Here, the values stored in each cell are used as substitutes for some nominal or categorical data, e.g. land cover classes:
SmithWater8
SmithSand13
…
SmithGrass1
OwnershipLand Cover TypeID
David Tenenbaum – EEOS 465 / 627 – UMass Boston
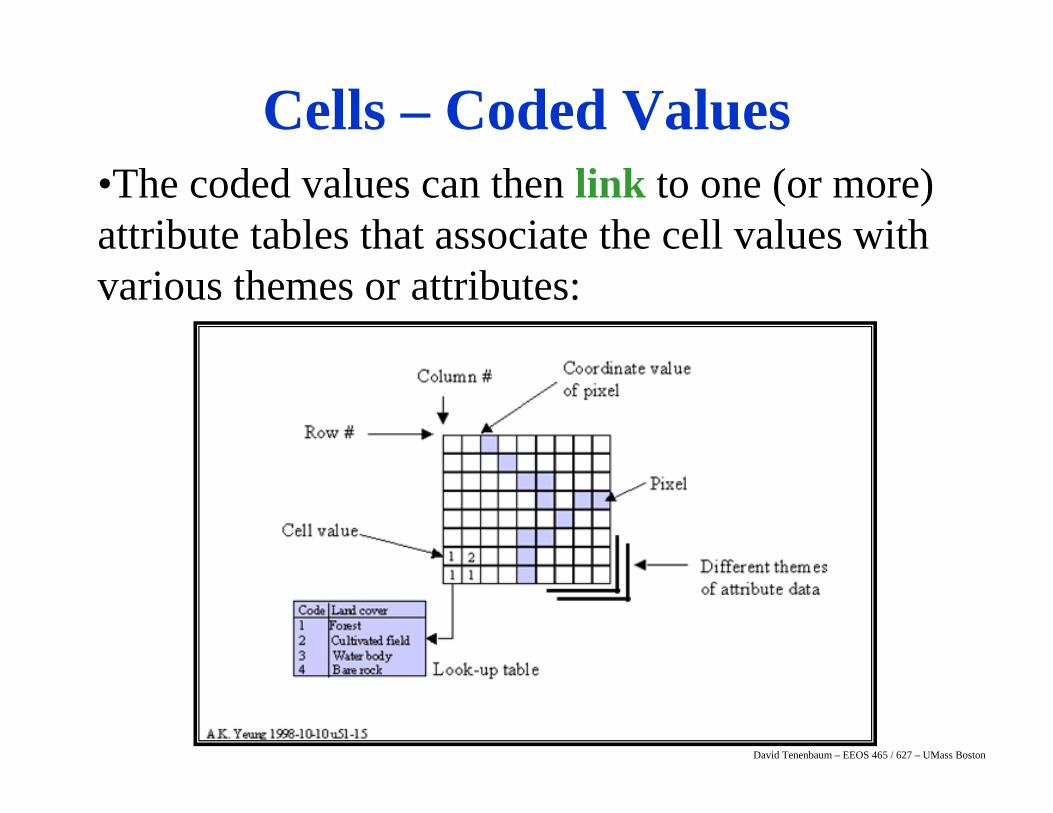
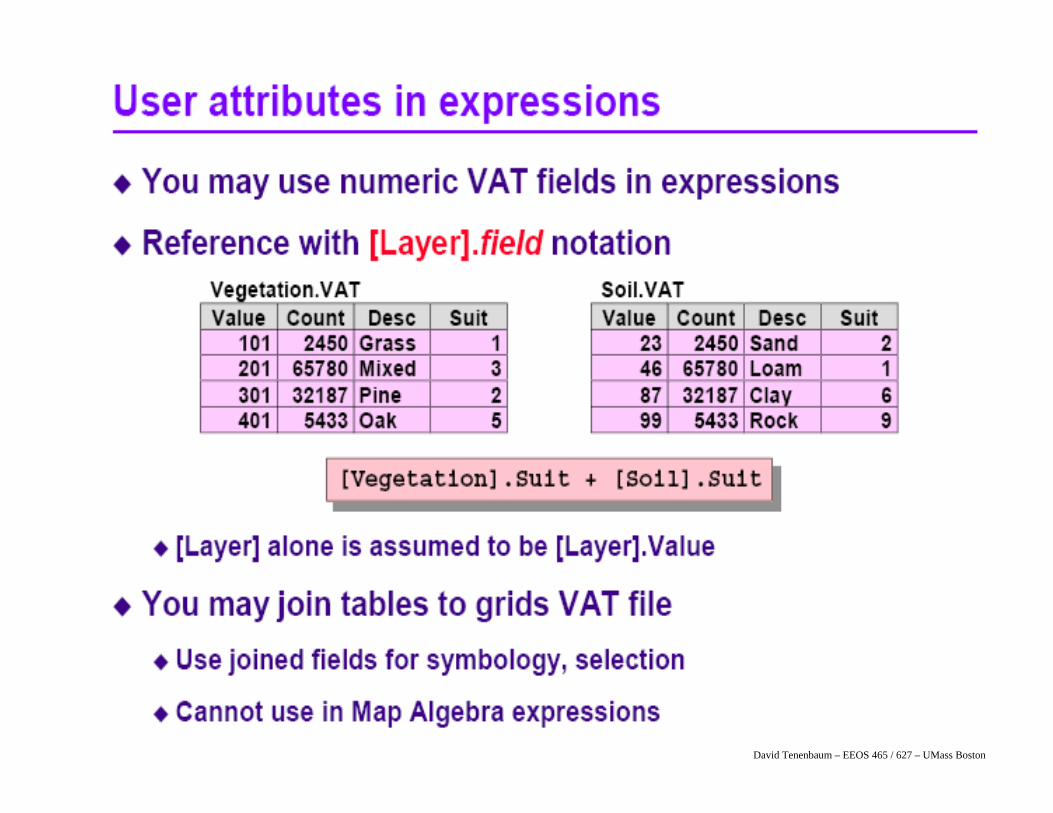
Cells – Coded Values•The coded values can then link to one (or more) attribute tables that associate the cell values with various themes or attributes:
David Tenenbaum – EEOS 465 / 627 – UMass Boston
David Tenenbaum – EEOS 465 / 627 – UMass Boston
David Tenenbaum – EEOS 465 / 627 – UMass Boston
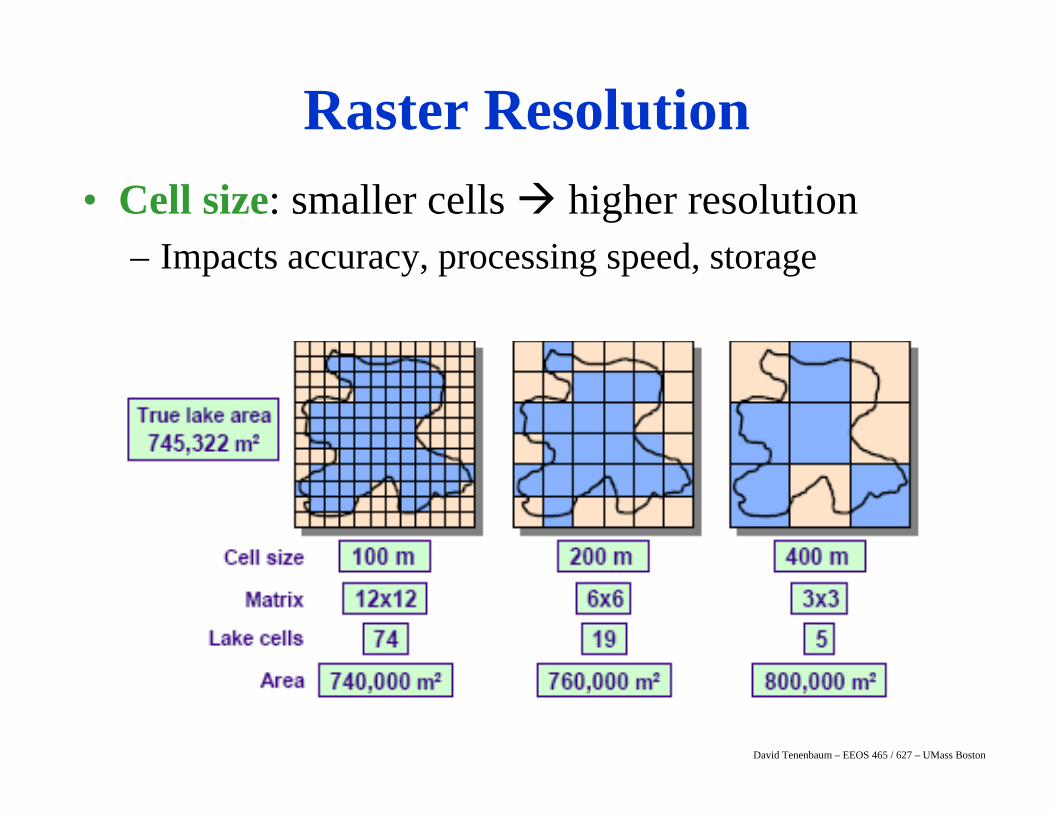
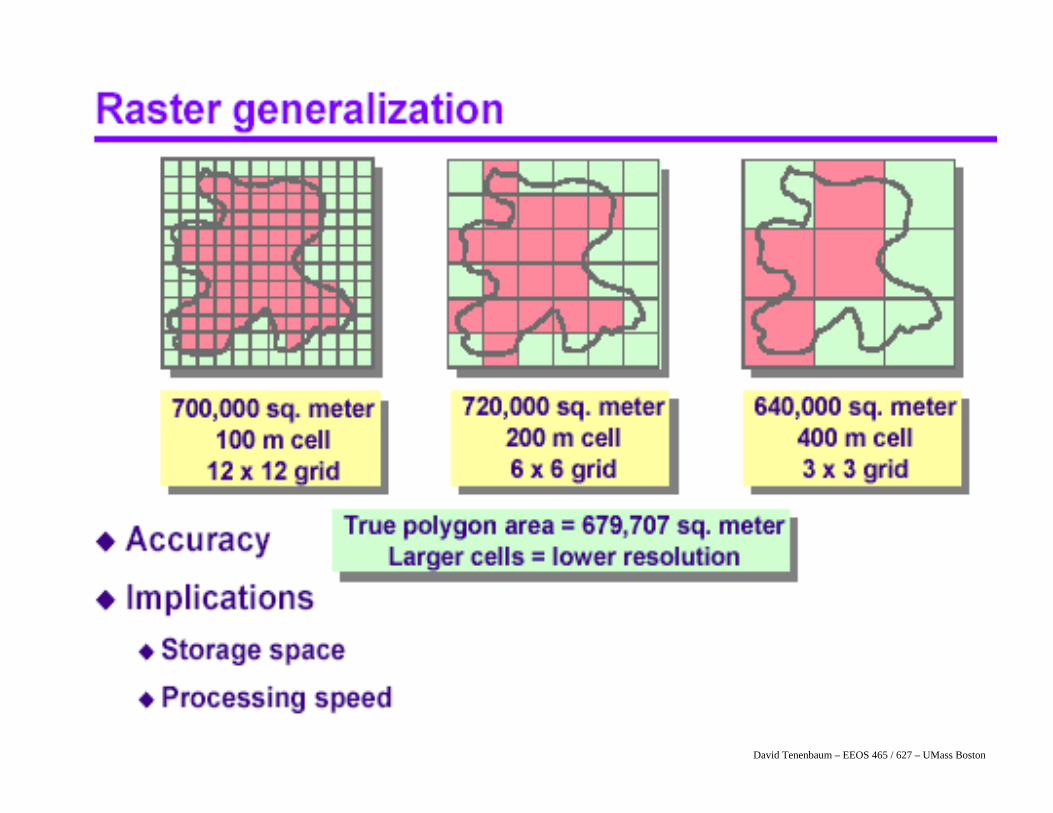
• Cell size: smaller cells higher resolution – Impacts accuracy, processing speed, storage
Raster Resolution
David Tenenbaum – EEOS 465 / 627 – UMass Boston
David Tenenbaum – EEOS 465 / 627 – UMass Boston
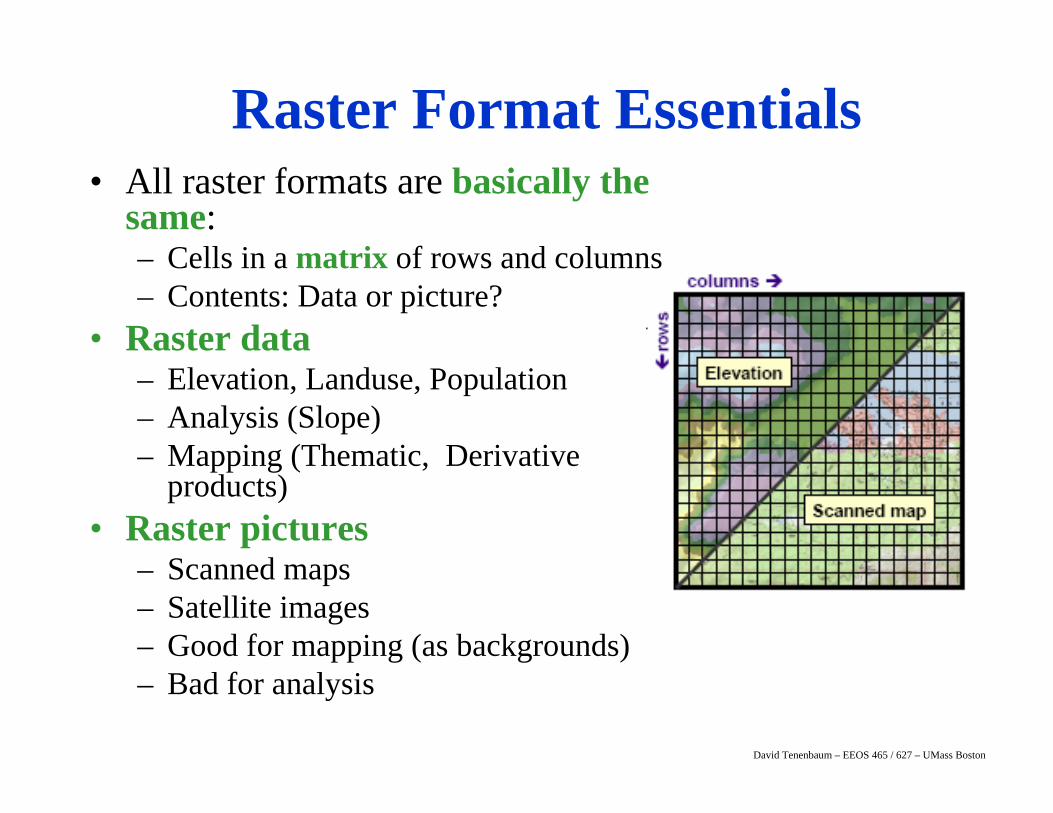
Raster Format Essentials• All raster formats are basically the
same:– Cells in a matrix of rows and columns– Contents: Data or picture?
• Raster data– Elevation, Landuse, Population– Analysis (Slope)– Mapping (Thematic, Derivative
products)• Raster pictures
– Scanned maps– Satellite images– Good for mapping (as backgrounds)– Bad for analysis
David Tenenbaum – EEOS 465 / 627 – UMass Boston
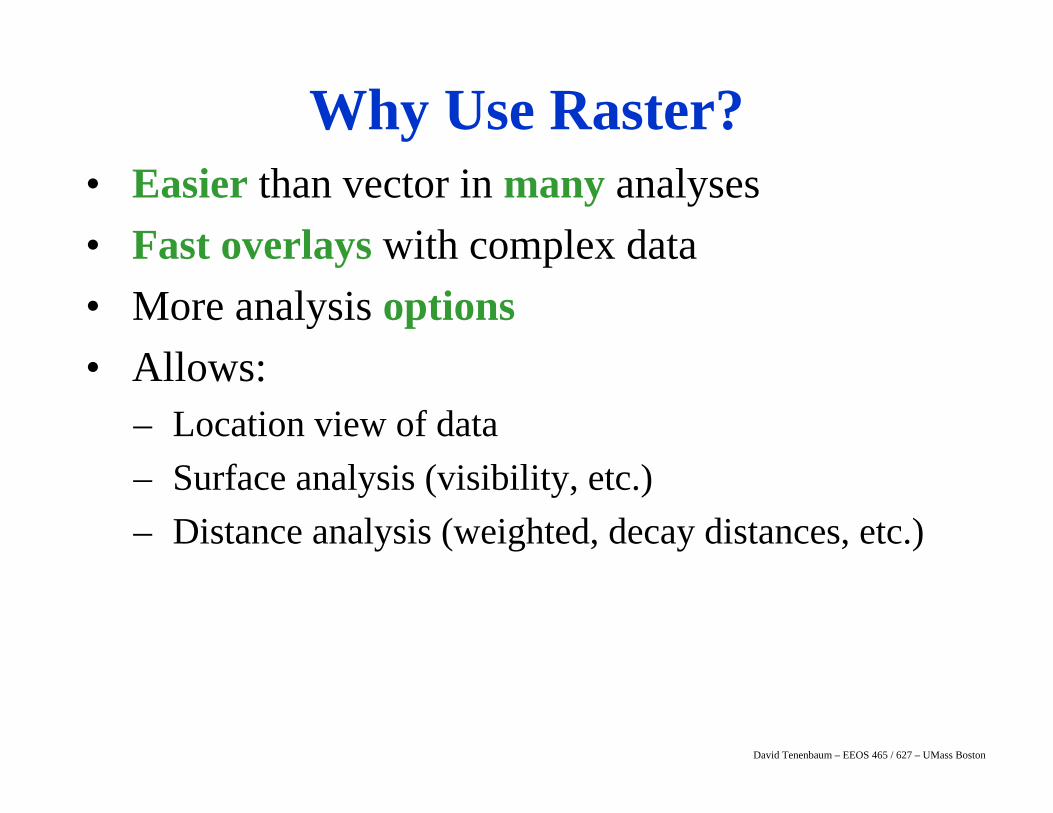
Why Use Raster?• Easier than vector in many analyses• Fast overlays with complex data• More analysis options• Allows:
– Location view of data– Surface analysis (visibility, etc.)– Distance analysis (weighted, decay distances, etc.)
David Tenenbaum – EEOS 465 / 627 – UMass Boston
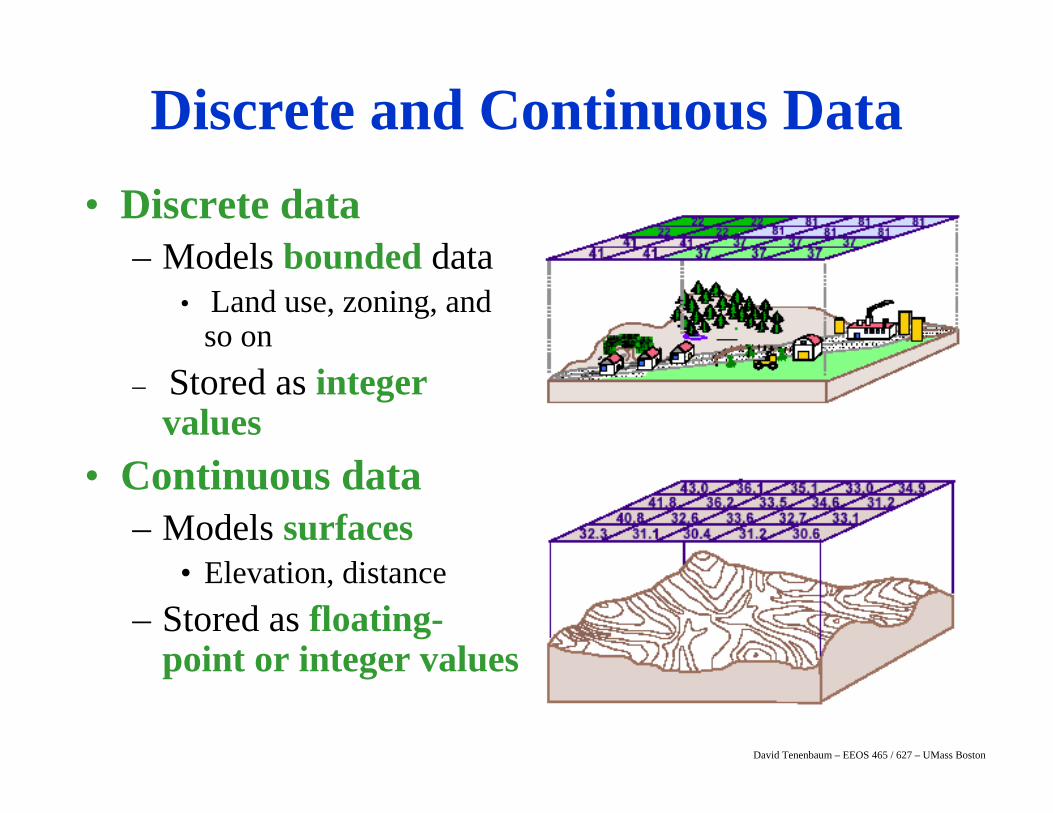
• Discrete data– Models bounded data
• Land use, zoning, and so on
– Stored as integer values
• Continuous data– Models surfaces
• Elevation, distance– Stored as floating-
point or integer values
Discrete and Continuous Data
David Tenenbaum – EEOS 465 / 627 – UMass Boston
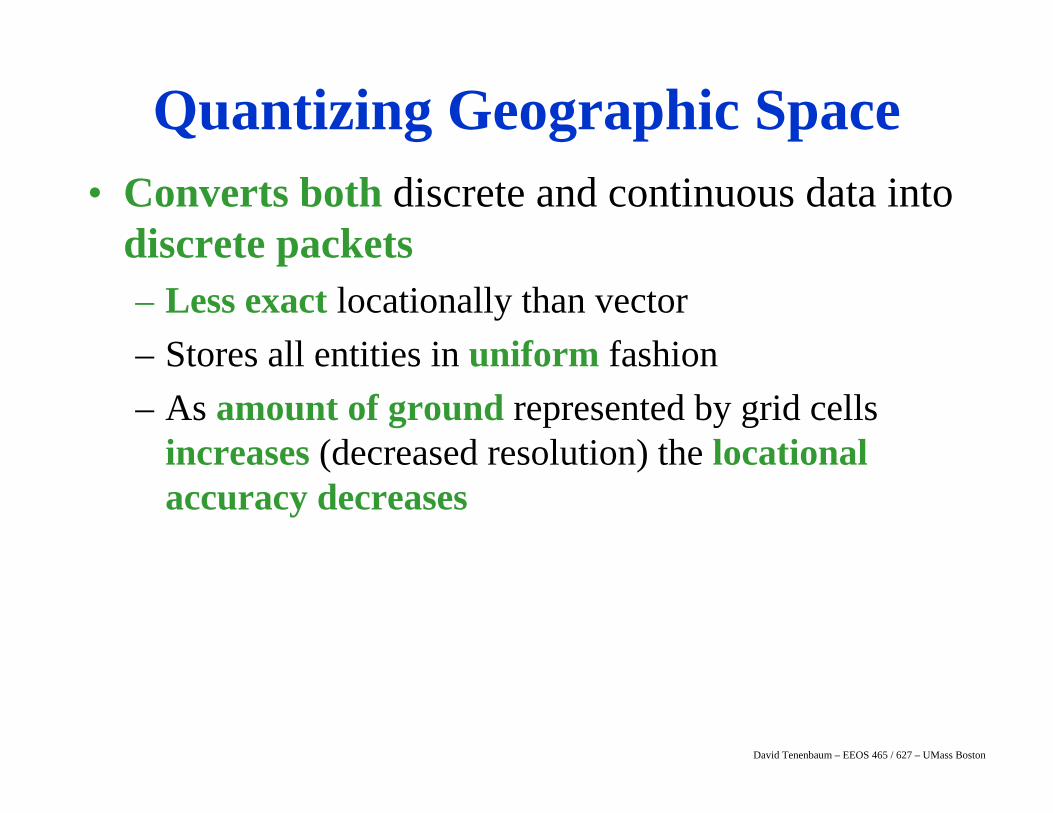
Quantizing Geographic Space• Converts both discrete and continuous data into
discrete packets– Less exact locationally than vector– Stores all entities in uniform fashion– As amount of ground represented by grid cells
increases (decreased resolution) the locational accuracy decreases
David Tenenbaum – EEOS 465 / 627 – UMass Boston
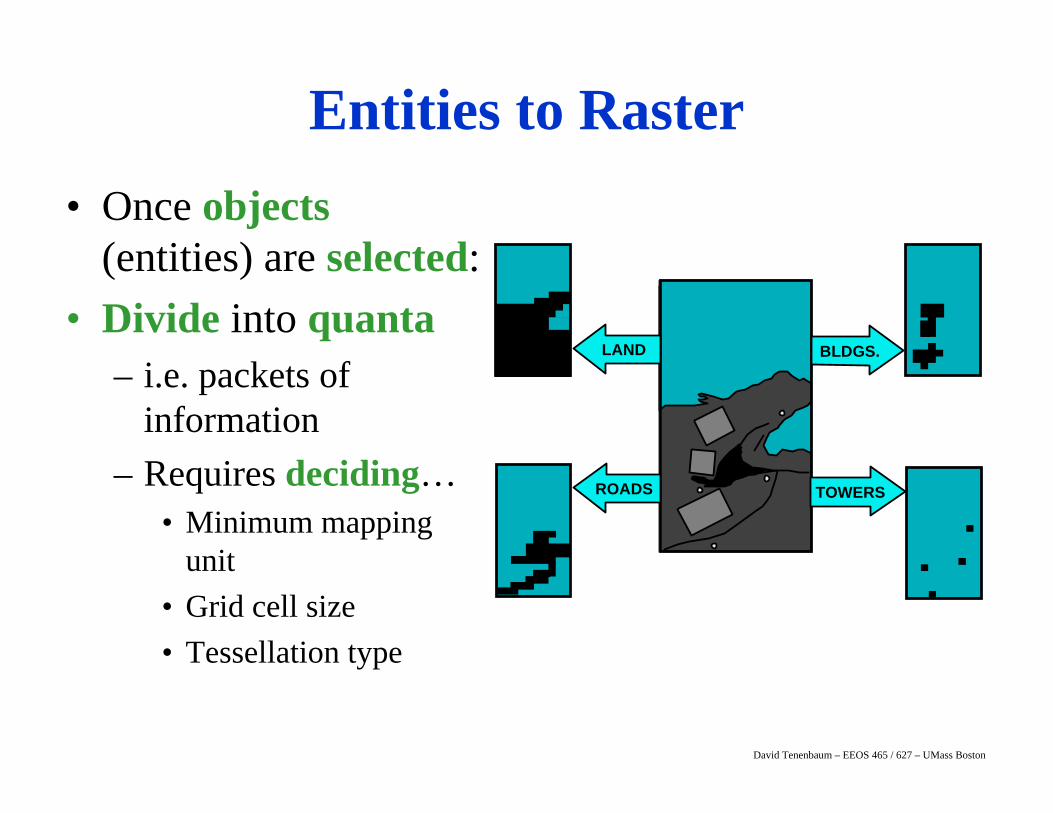
TOWERS
LAND
ROADS
BLDGS.
• Once objects(entities) are selected:
• Divide into quanta– i.e. packets of
information– Requires deciding…
• Minimum mapping unit
• Grid cell size• Tessellation type
Entities to Raster
David Tenenbaum – EEOS 465 / 627 – UMass Boston
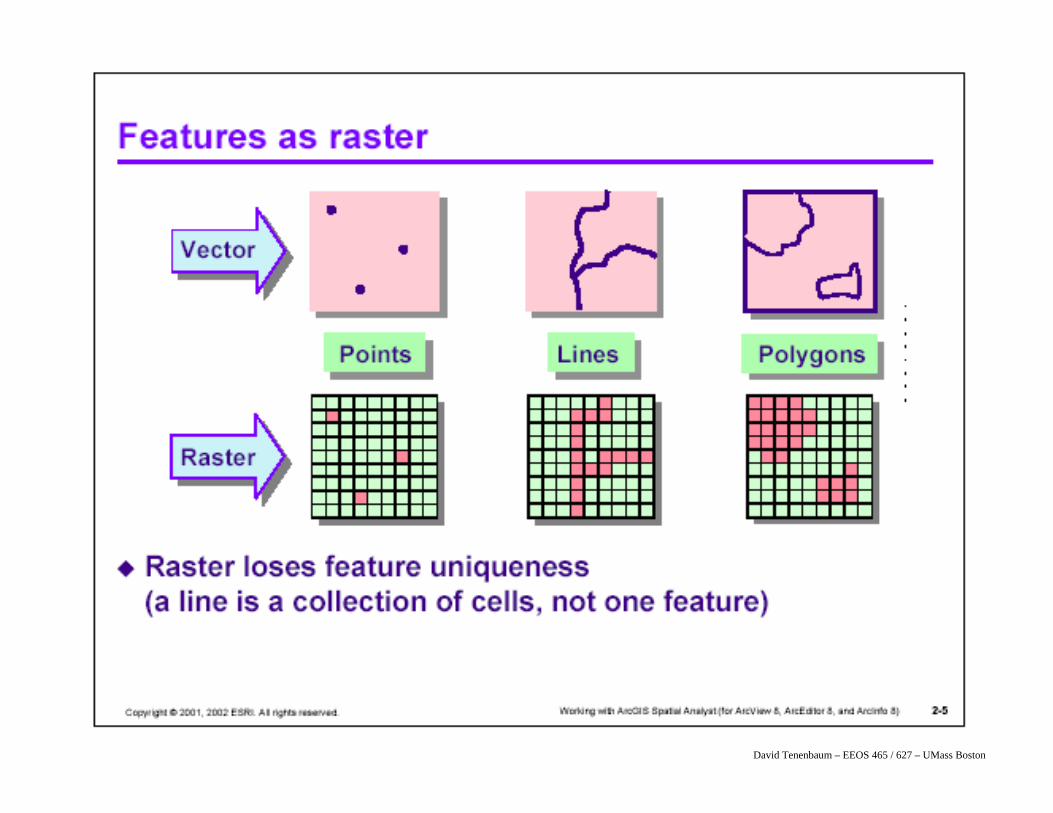
• Represent known or perceived entities– Plus their descriptive information (attributes)
• Typical entities:– Points (single grid cell)– Lines (strings of grid cells)– Polygons (areas or groups of grid cells)
Grid Cells
David Tenenbaum – EEOS 465 / 627 – UMass Boston
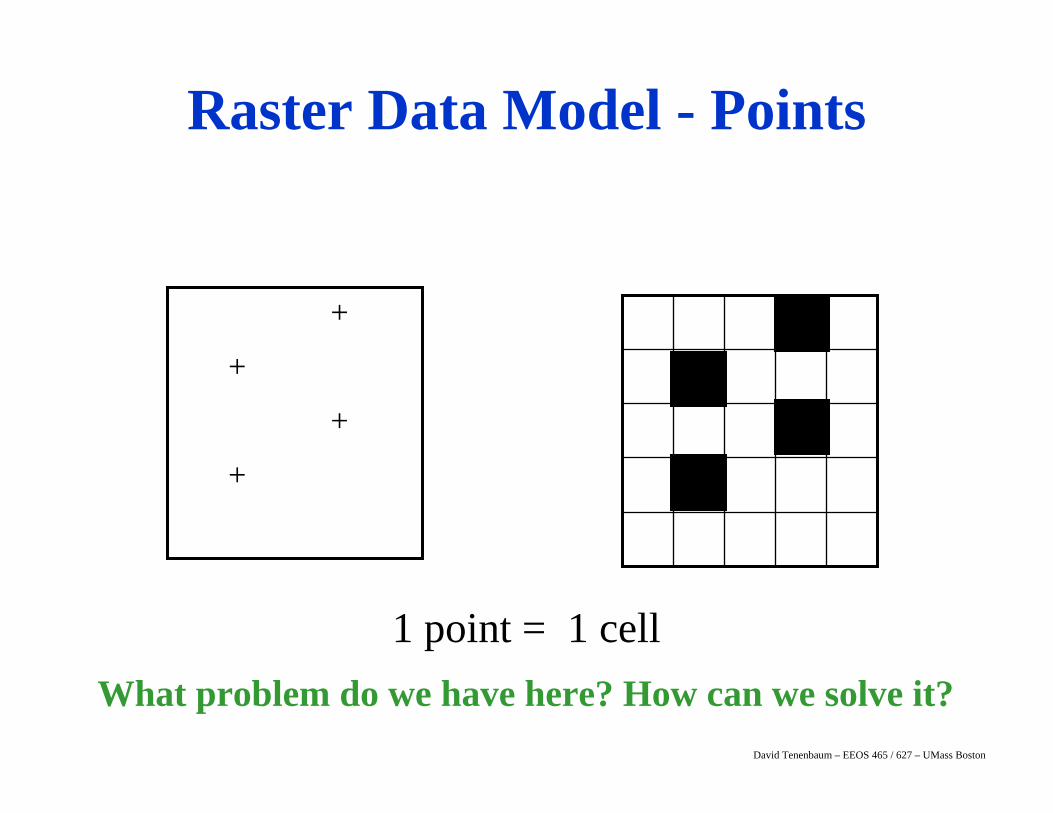
+
+
+
+
1 point = 1 cellWhat problem do we have here? How can we solve it?
Raster Data Model - Points
David Tenenbaum – EEOS 465 / 627 – UMass Boston
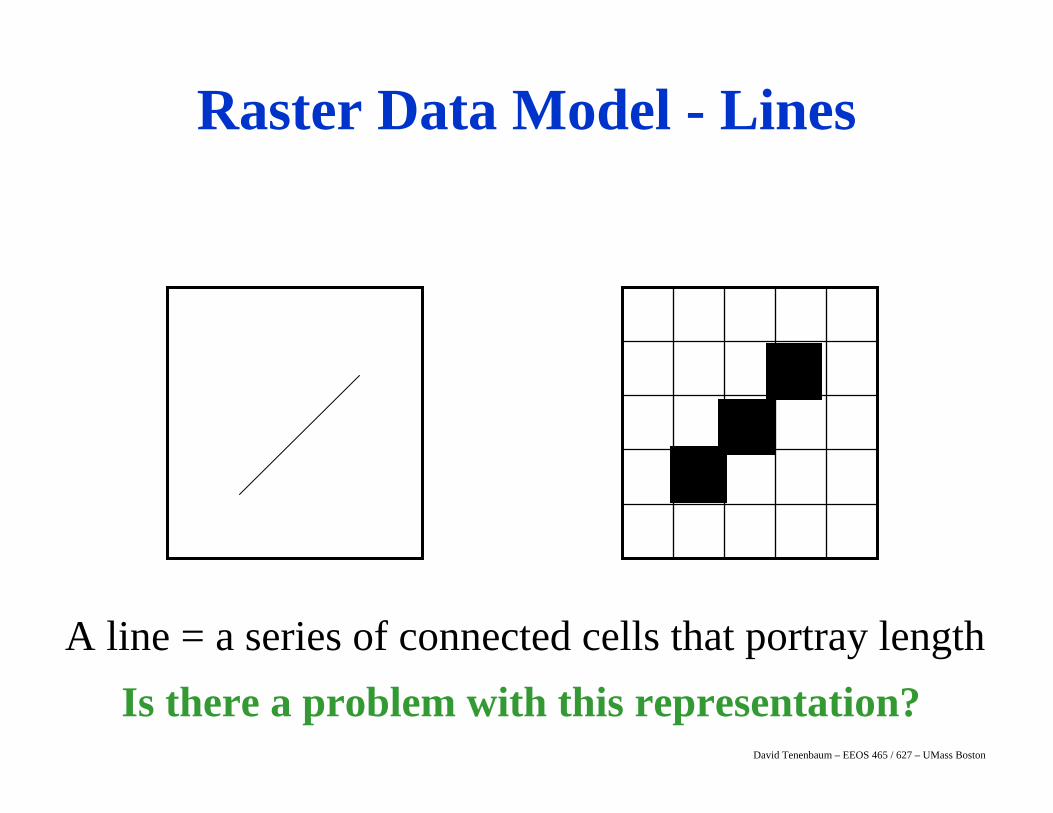
A line = a series of connected cells that portray length Is there a problem with this representation?
Raster Data Model - Lines
David Tenenbaum – EEOS 465 / 627 – UMass Boston
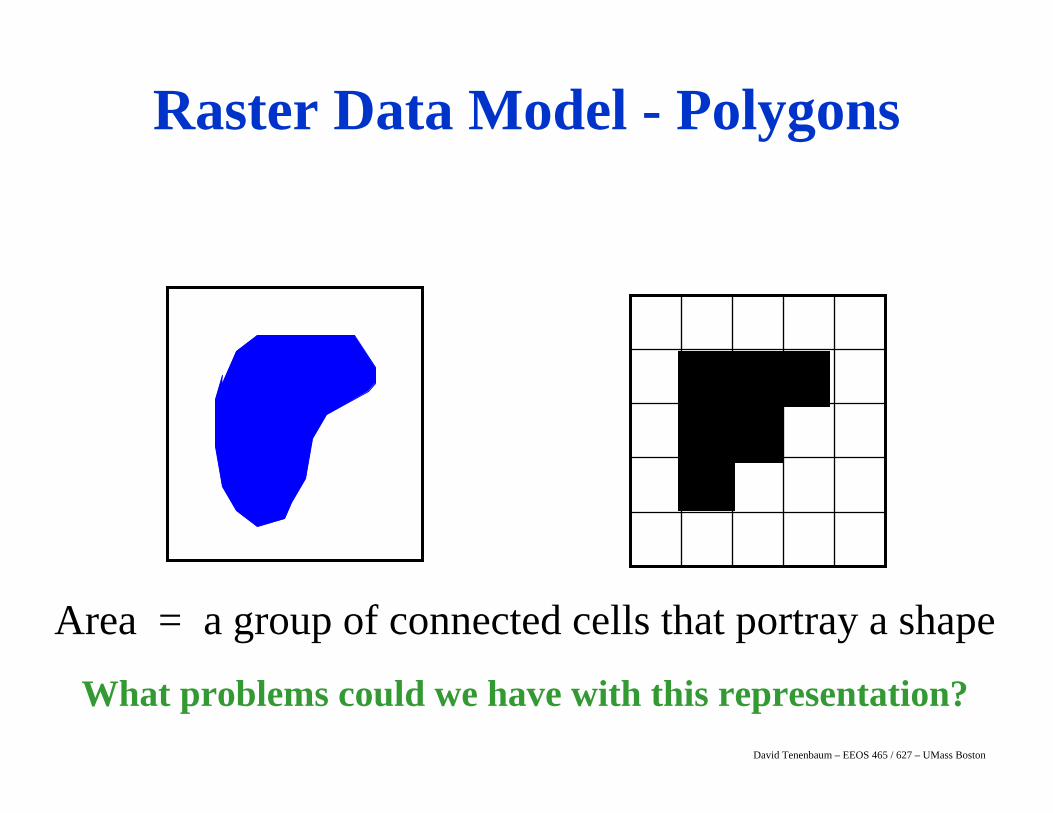
Area = a group of connected cells that portray a shape
What problems could we have with this representation?
Raster Data Model - Polygons
David Tenenbaum – EEOS 465 / 627 – UMass Boston
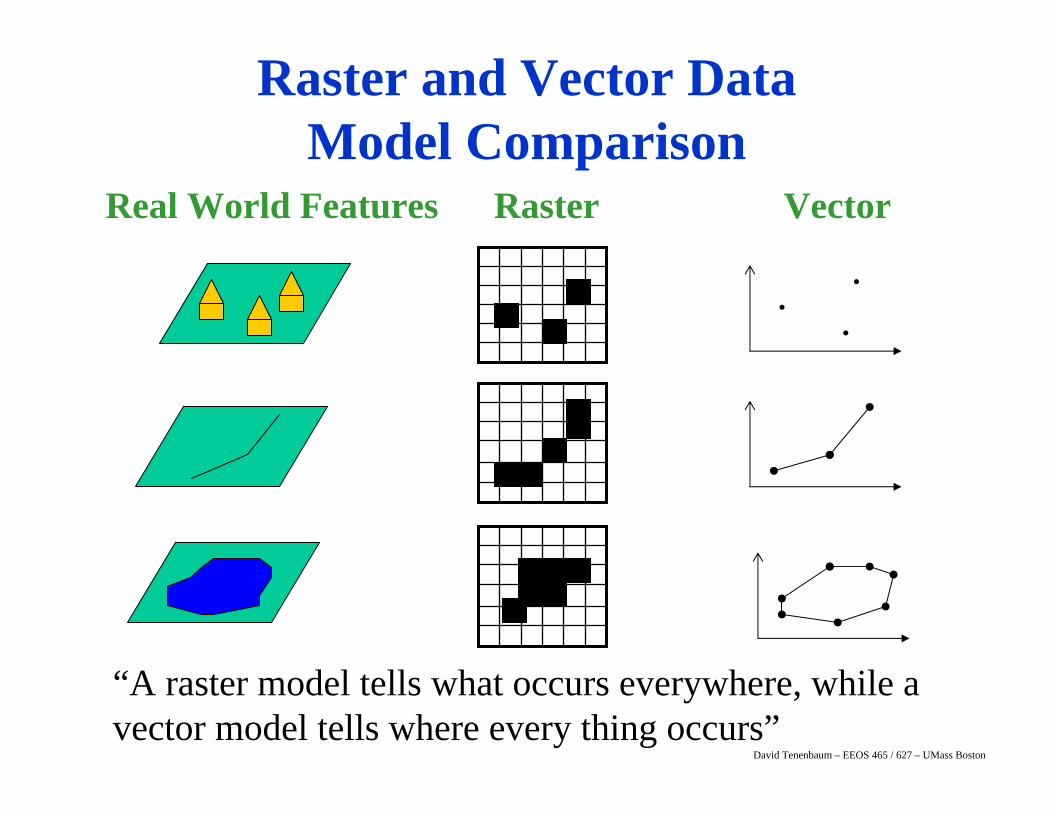
Real World Features Raster Vector
••
•
“A raster model tells what occurs everywhere, while a vector model tells where every thing occurs”
Raster and Vector Data Model Comparison
David Tenenbaum – EEOS 465 / 627 – UMass Boston
David Tenenbaum – EEOS 465 / 627 – UMass Boston
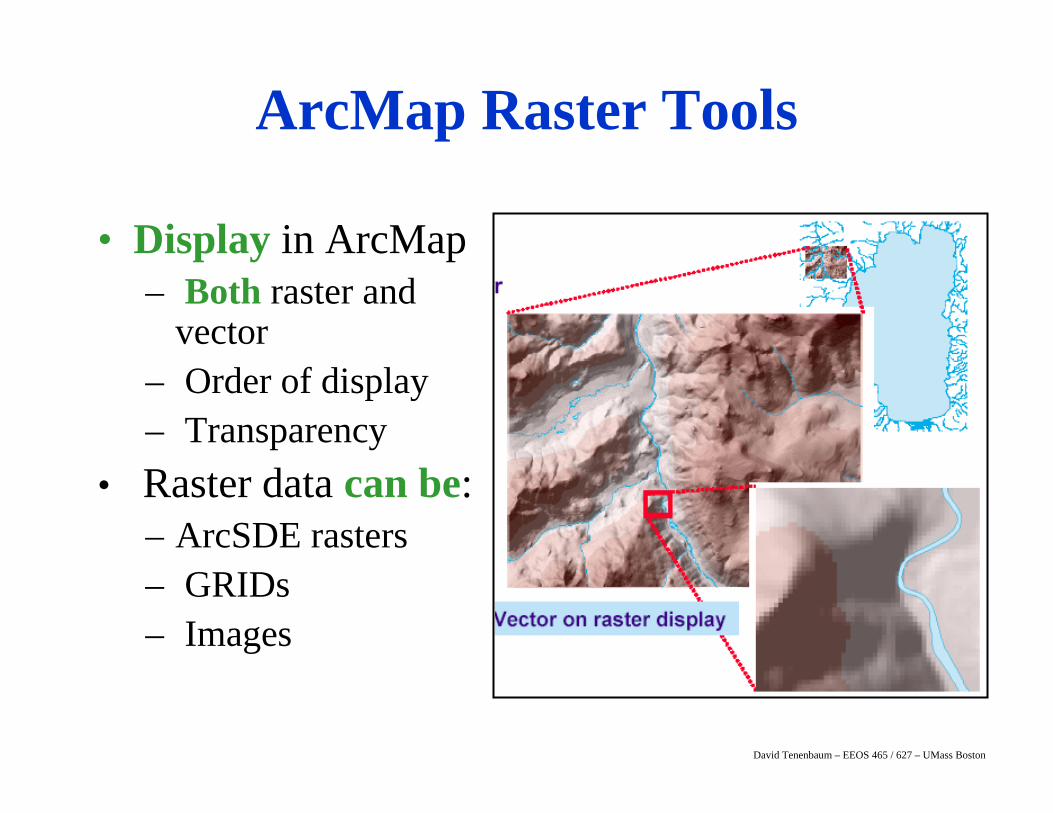
ArcMap Raster Tools
• Display in ArcMap– Both raster and
vector– Order of display– Transparency
• Raster data can be:– ArcSDE rasters– GRIDs– Images
David Tenenbaum – EEOS 465 / 627 – UMass Boston
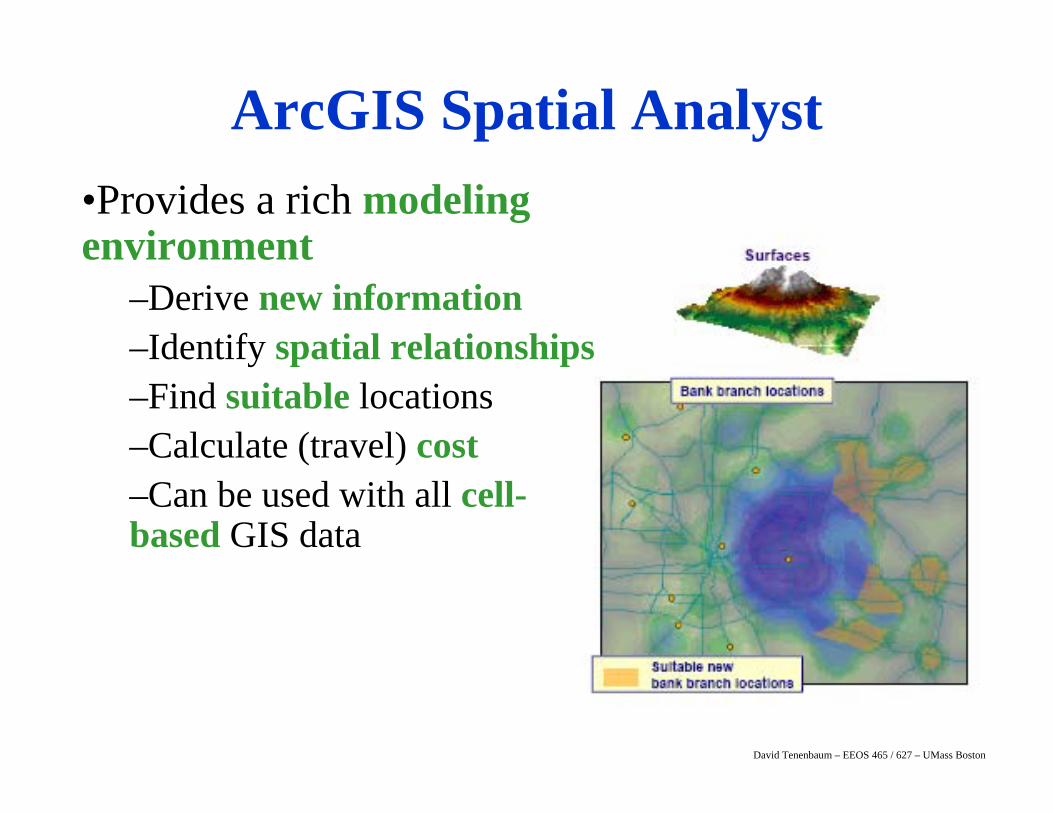
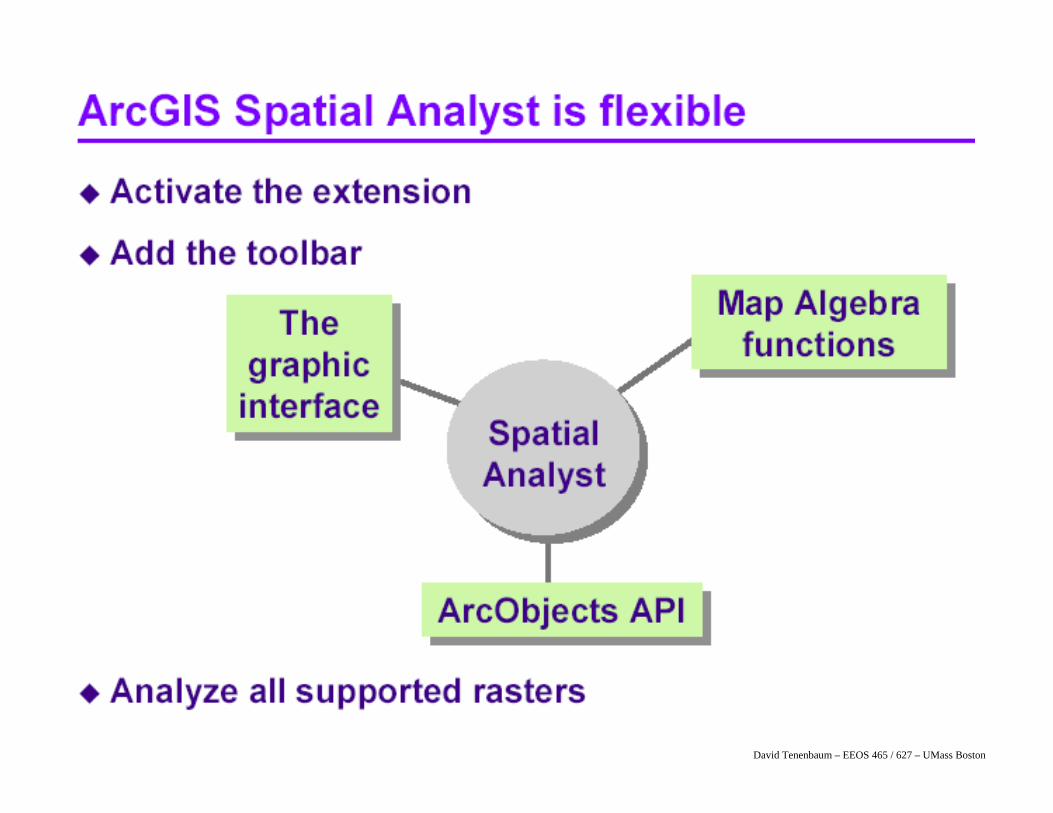
•Provides a rich modeling environment
–Derive new information–Identify spatial relationships–Find suitable locations–Calculate (travel) cost–Can be used with all cell-based GIS data
ArcGIS Spatial Analyst
David Tenenbaum – EEOS 465 / 627 – UMass Boston
David Tenenbaum – EEOS 465 / 627 – UMass Boston
David Tenenbaum – EEOS 465 / 627 – UMass Boston
David Tenenbaum – EEOS 465 / 627 – UMass Boston
David Tenenbaum – EEOS 465 / 627 – UMass Boston
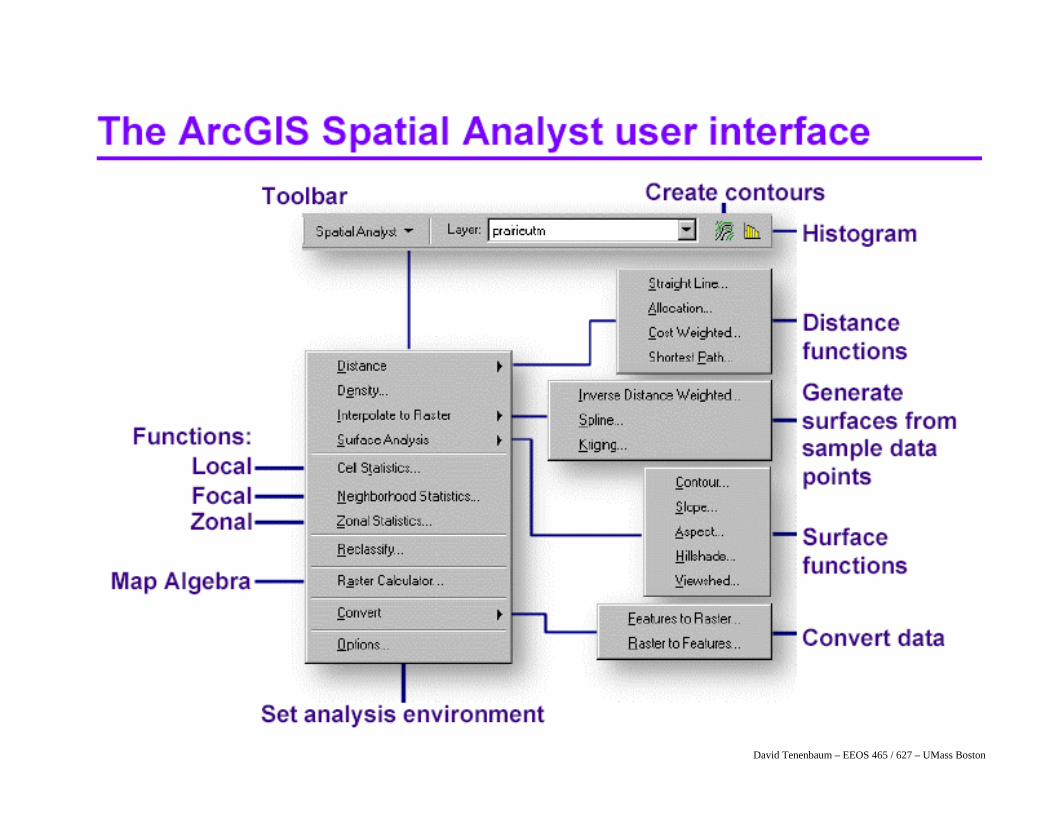
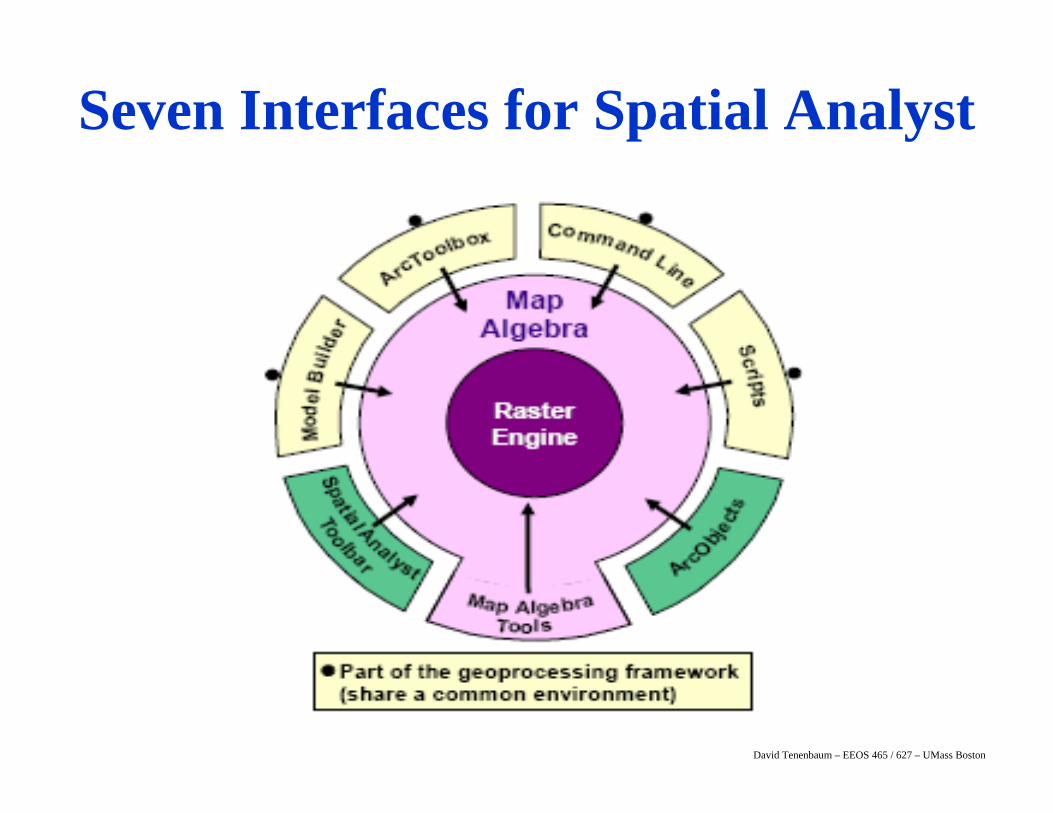
Seven Interfaces for Spatial Analyst
David Tenenbaum – EEOS 465 / 627 – UMass Boston
David Tenenbaum – EEOS 465 / 627 – UMass Boston
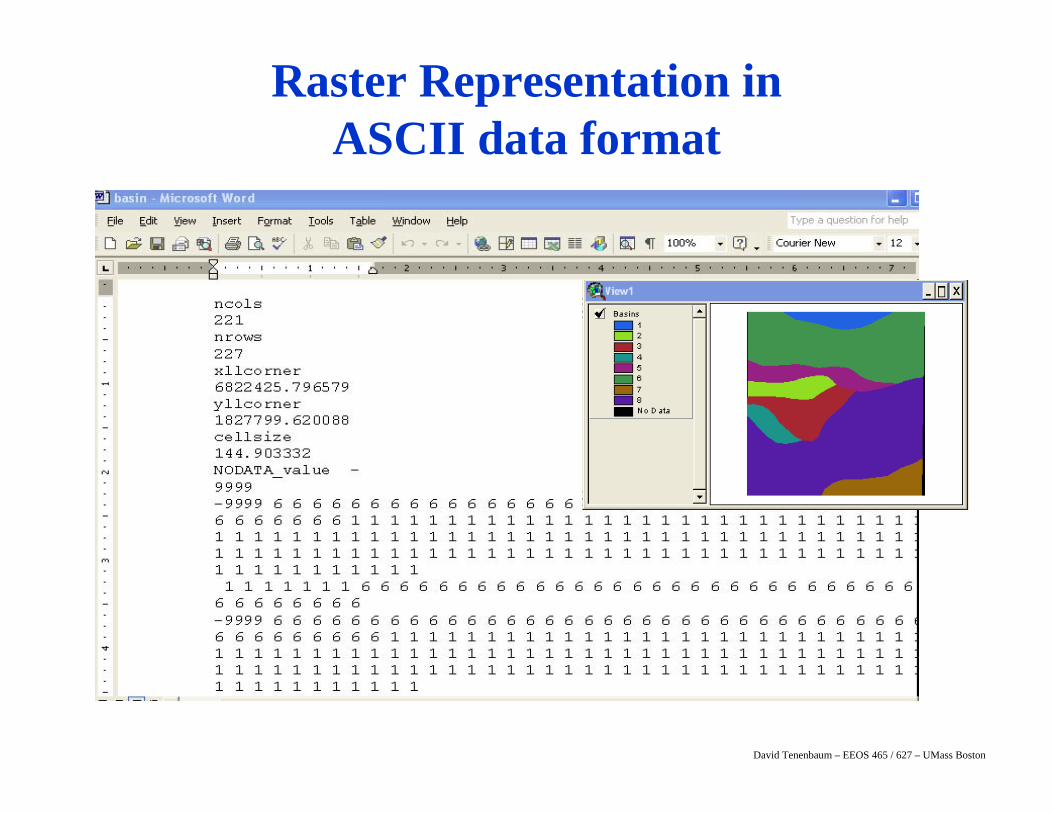
Raster Representation in ASCII data format
David Tenenbaum – EEOS 465 / 627 – UMass Boston
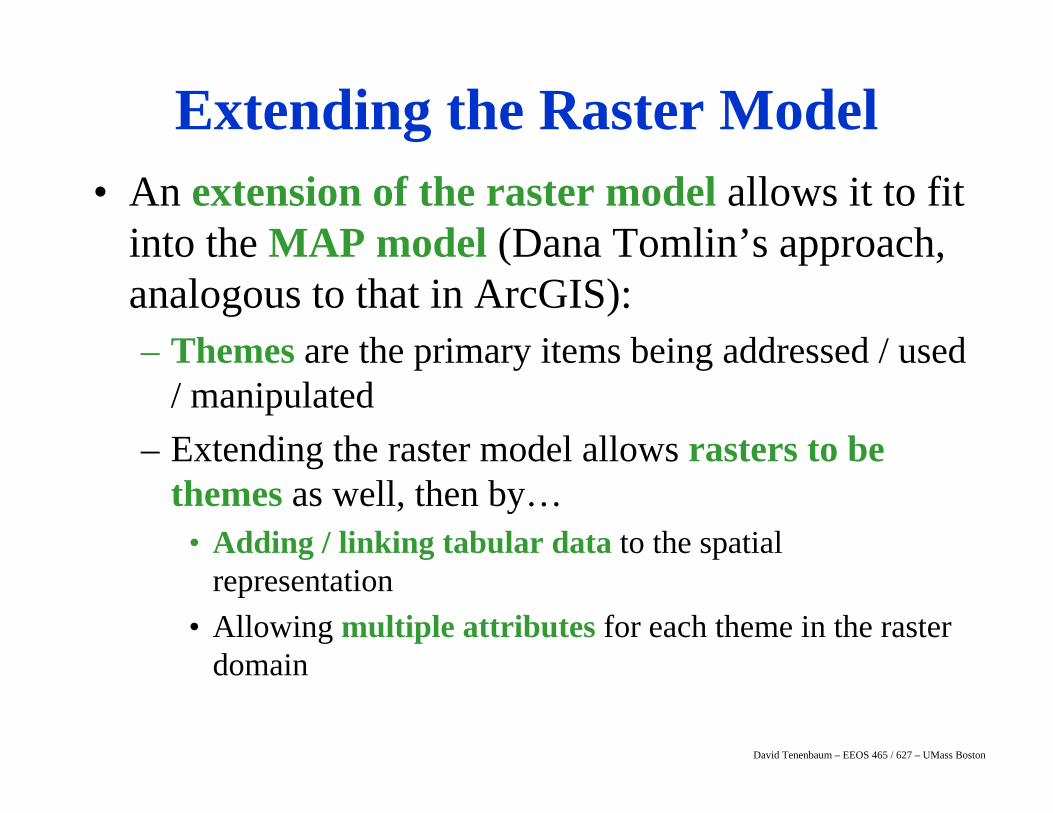
Extending the Raster Model• An extension of the raster model allows it to fit
into the MAP model (Dana Tomlin’s approach, analogous to that in ArcGIS):– Themes are the primary items being addressed / used
/ manipulated– Extending the raster model allows rasters to be
themes as well, then by…• Adding / linking tabular data to the spatial
representation• Allowing multiple attributes for each theme in the raster
domain
David Tenenbaum – EEOS 465 / 627 – UMass Boston
David Tenenbaum – EEOS 465 / 627 – UMass Boston
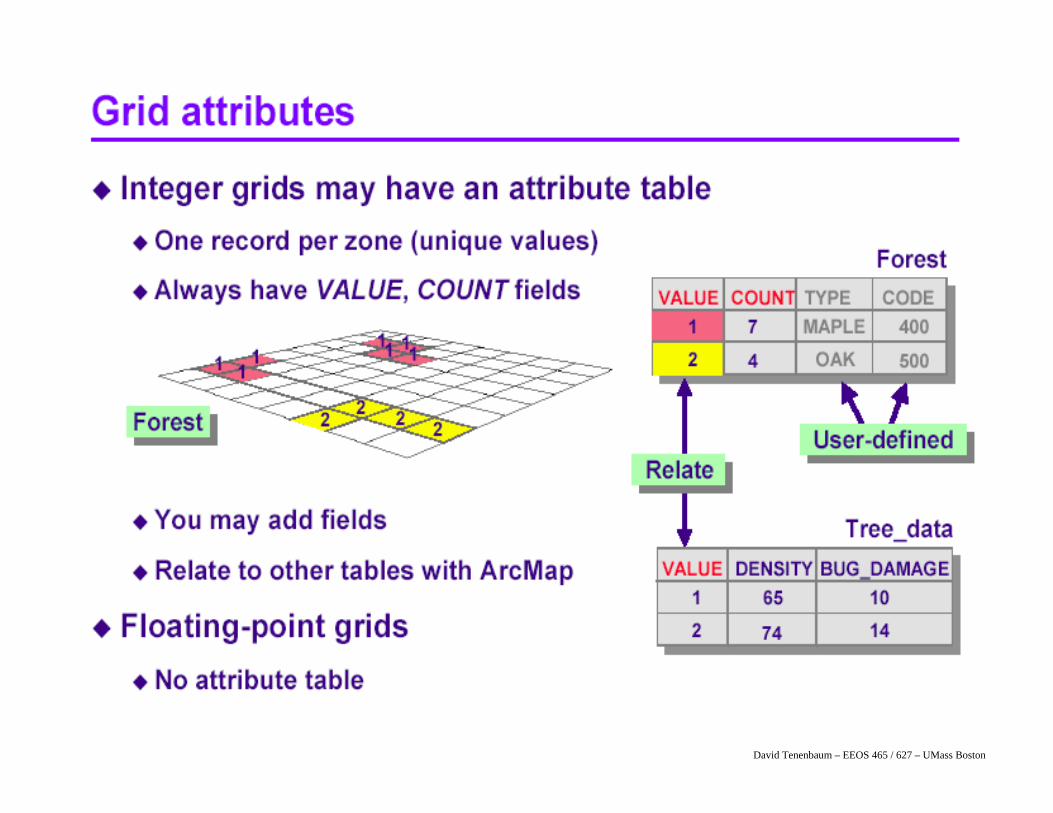
• What are the advantages over simple raster?– Increased attribute data for each theme
• Less storage space• More possibilities
– Puts this additional data at users’ fingertips• As modeling is performed, these attributes are carried
with each theme• Also carried with newly created themes
Extending the Raster Model, Cont.
David Tenenbaum – EEOS 465 / 627 – UMass Boston
David Tenenbaum – EEOS 465 / 627 – UMass Boston
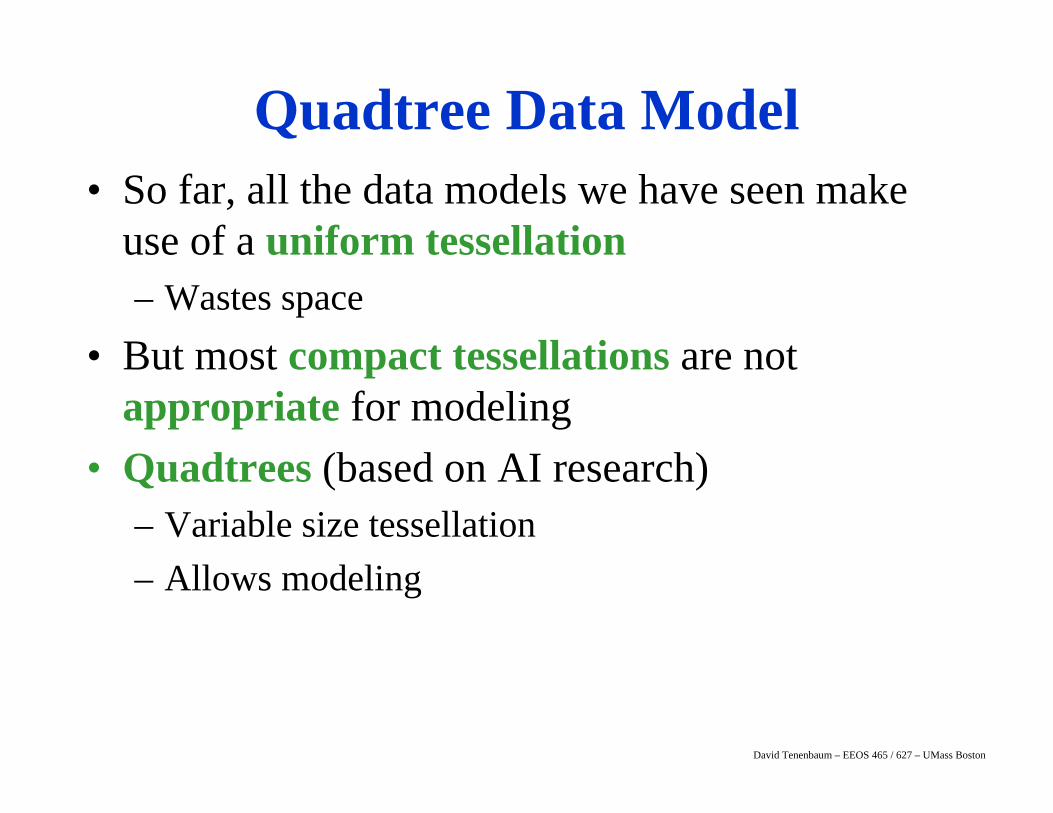
• So far, all the data models we have seen make use of a uniform tessellation– Wastes space
• But most compact tessellations are not appropriate for modeling
• Quadtrees (based on AI research)– Variable size tessellation– Allows modeling
Quadtree Data Model
David Tenenbaum – EEOS 465 / 627 – UMass Boston
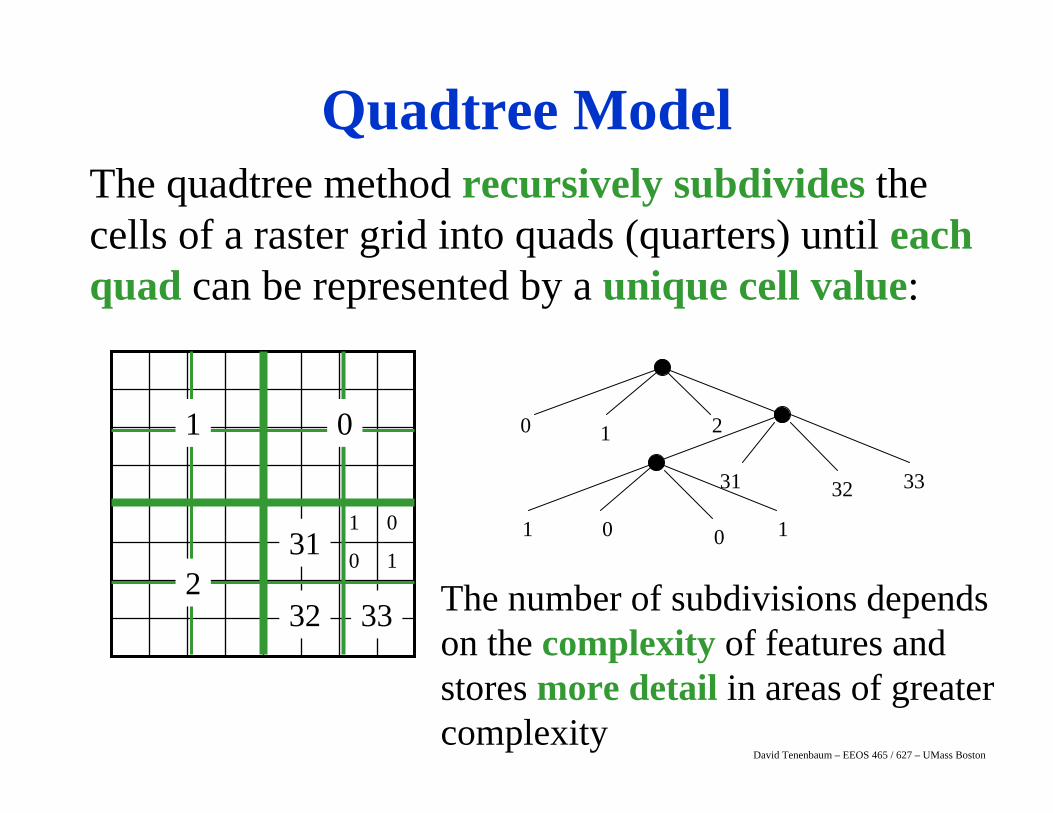
The quadtree method recursively subdivides the cells of a raster grid into quads (quarters) until each quad can be represented by a unique cell value:
10
01
1 0
231
32 33
Quadtree Model
The number of subdivisions depends on the complexity of features and stores more detail in areas of greater complexity
0 1 2
3332
1 100
31
David Tenenbaum – EEOS 465 / 627 – UMass Boston
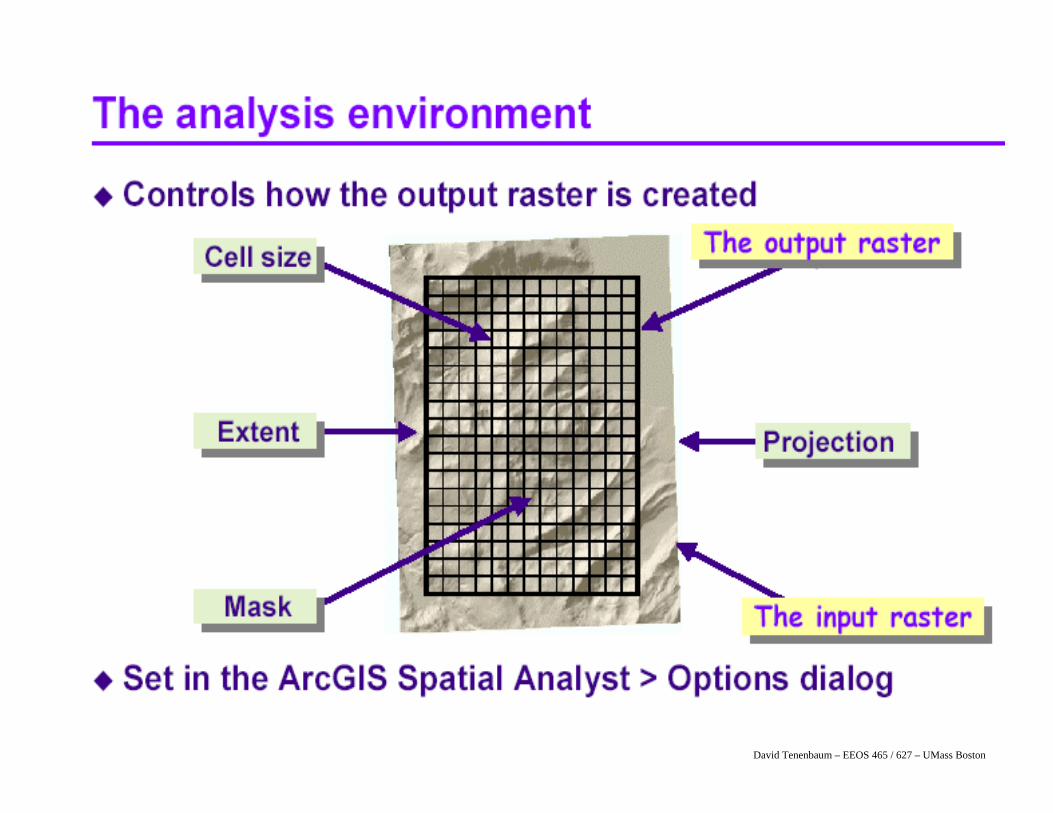
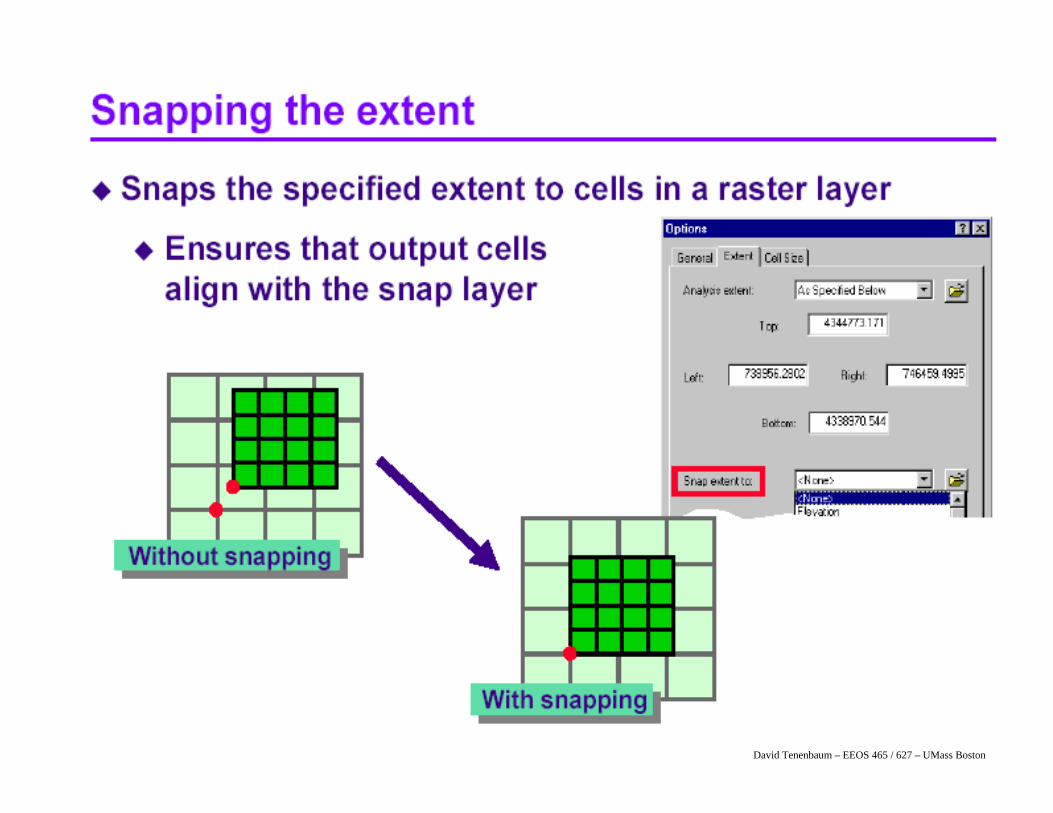
Exercise 2: Raster Concepts• Explore raster concepts• Set the raster analysis environment
– Analysis extent, cell size, mask• Clip a raster dataset
– With the analysis extent (rectangular shape)– With the mask (irregular shape)
• Snap the extent to a specific raster
David Tenenbaum – EEOS 465 / 627 – UMass Boston
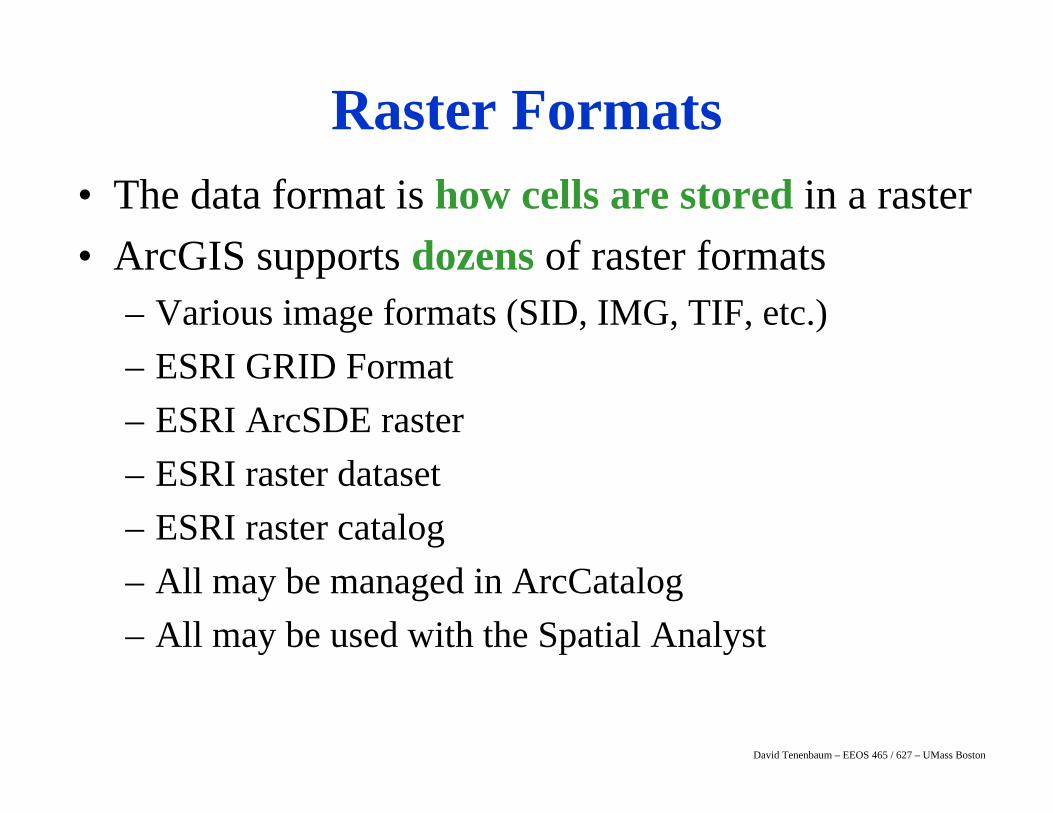
• The data format is how cells are stored in a raster• ArcGIS supports dozens of raster formats
– Various image formats (SID, IMG, TIF, etc.)– ESRI GRID Format– ESRI ArcSDE raster– ESRI raster dataset– ESRI raster catalog– All may be managed in ArcCatalog– All may be used with the Spatial Analyst
Raster Formats
David Tenenbaum – EEOS 465 / 627 – UMass Boston
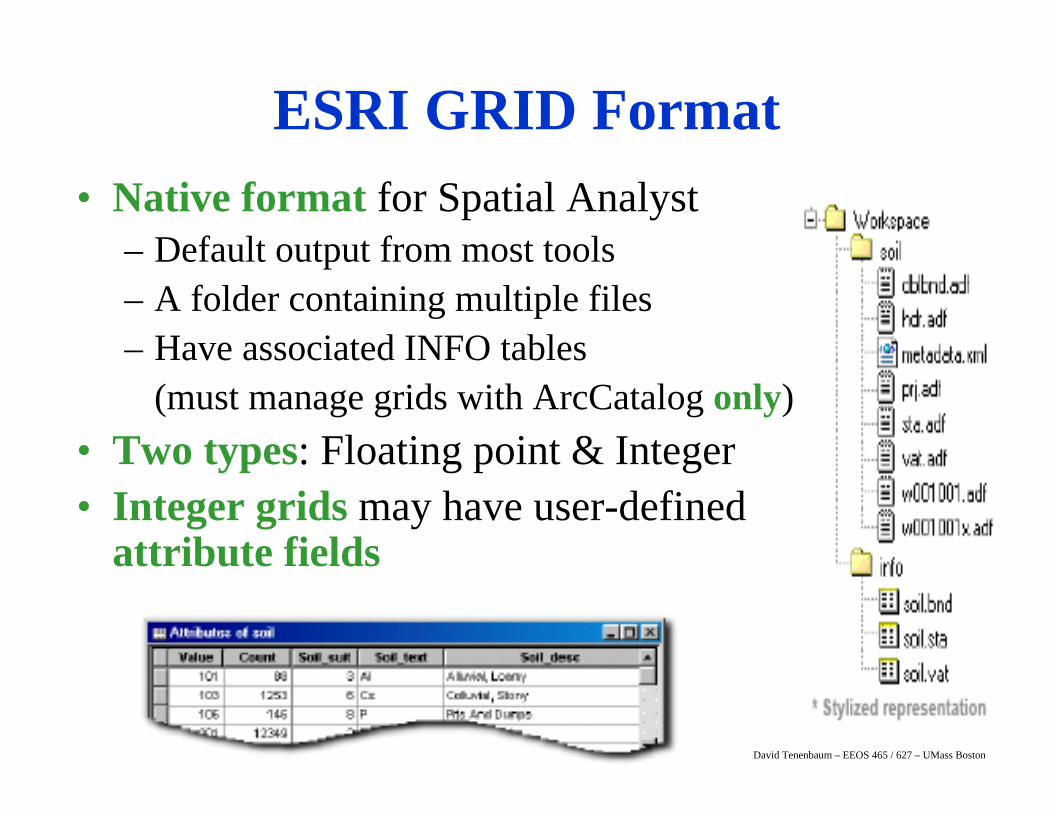
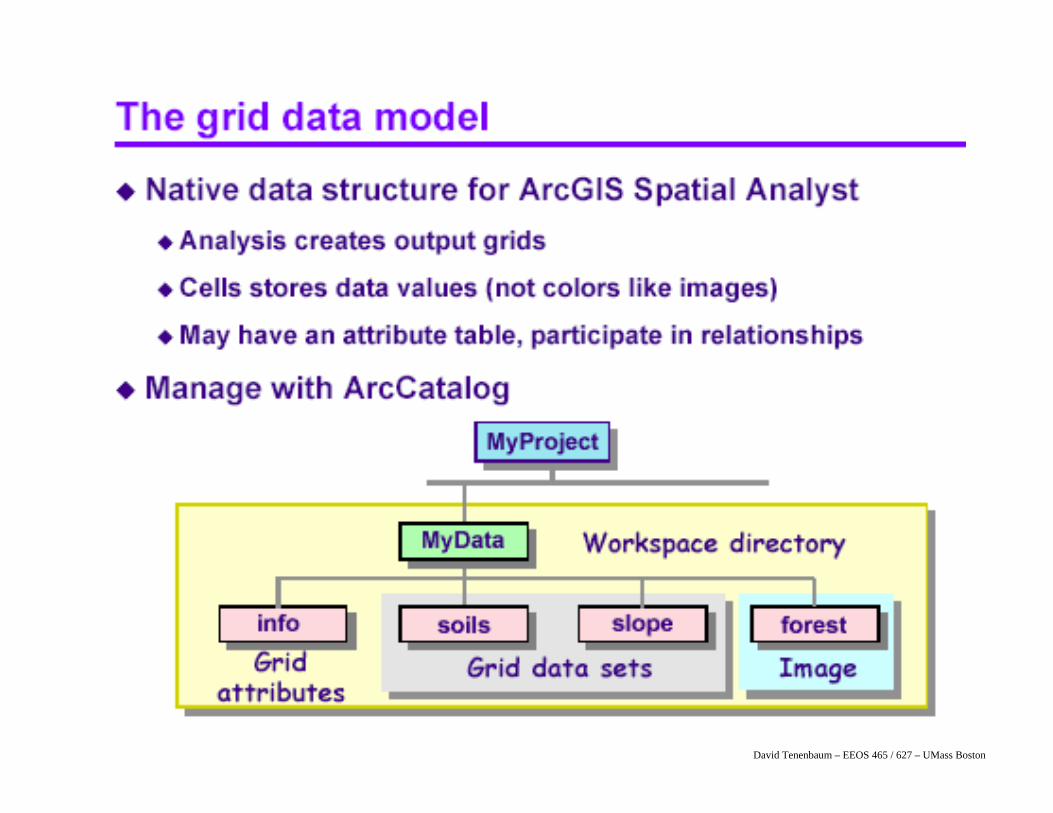
• Native format for Spatial Analyst– Default output from most tools– A folder containing multiple files– Have associated INFO tables
(must manage grids with ArcCatalog only)• Two types: Floating point & Integer• Integer grids may have user-defined
attribute fields
ESRI GRID Format
David Tenenbaum – EEOS 465 / 627 – UMass Boston
David Tenenbaum – EEOS 465 / 627 – UMass Boston
David Tenenbaum – EEOS 465 / 627 – UMass Boston
David Tenenbaum – EEOS 465 / 627 – UMass Boston
David Tenenbaum – EEOS 465 / 627 – UMass Boston
David Tenenbaum – EEOS 465 / 627 – UMass Boston
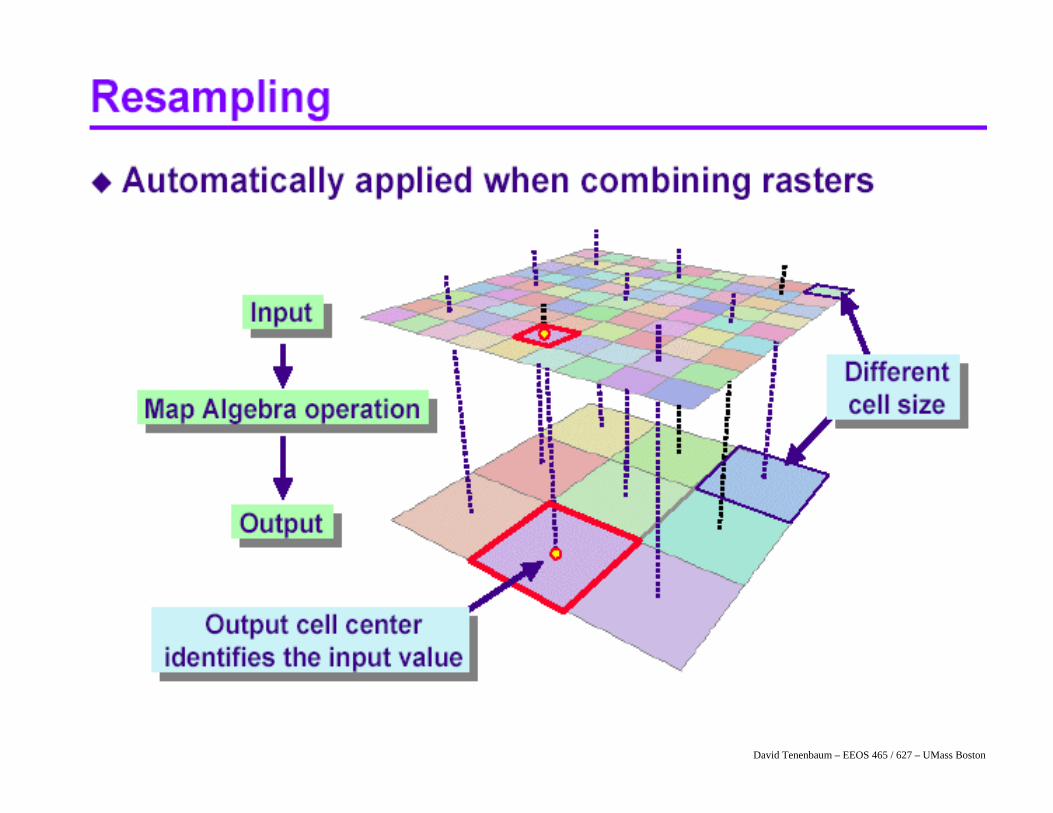
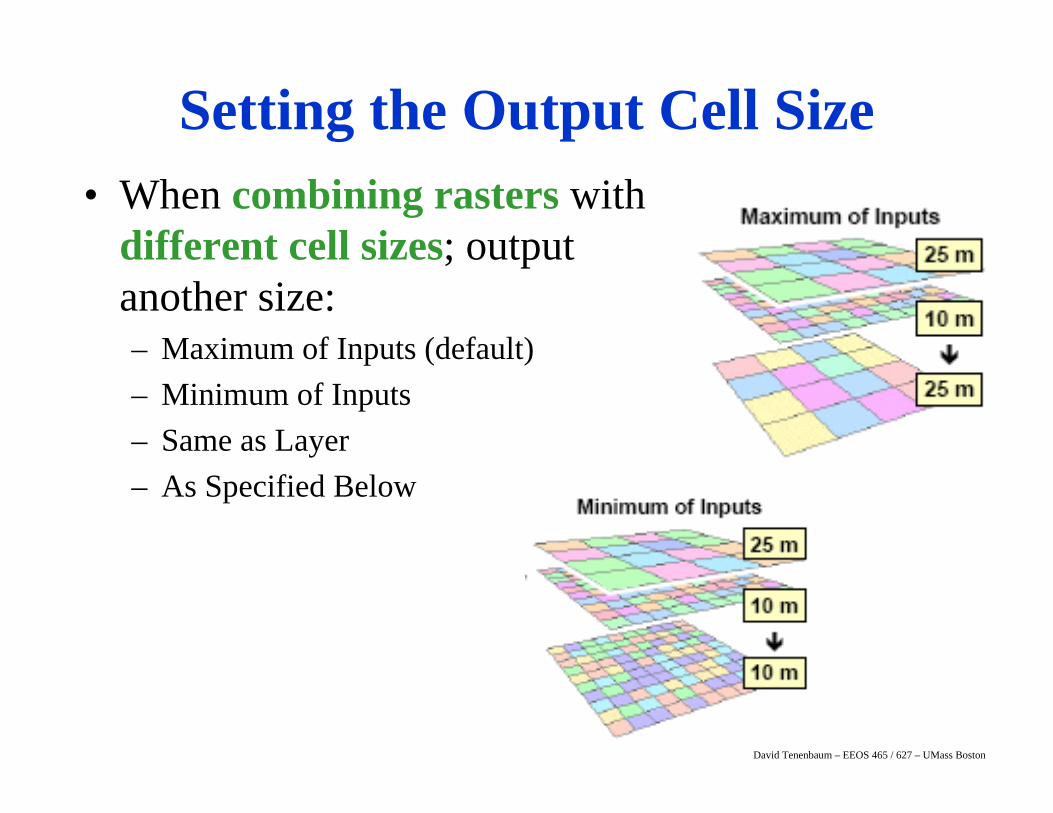
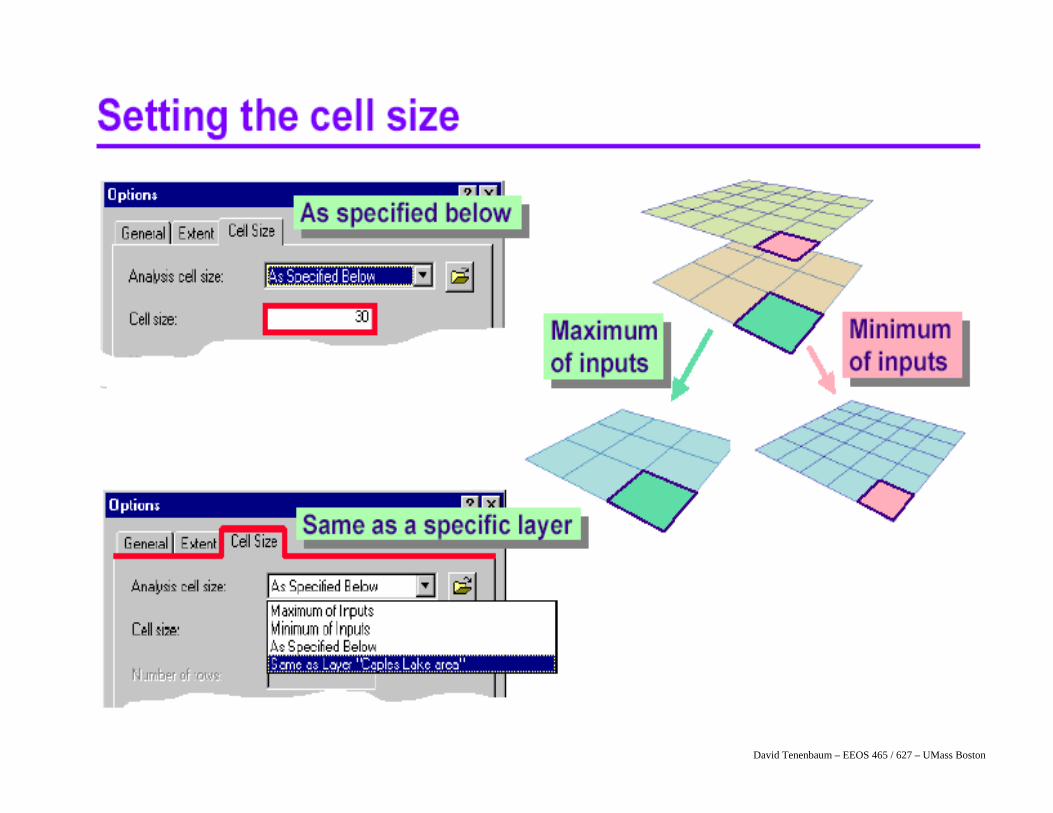
• When combining rasters with different cell sizes; output another size:– Maximum of Inputs (default)– Minimum of Inputs– Same as Layer– As Specified Below
Setting the Output Cell Size
David Tenenbaum – EEOS 465 / 627 – UMass Boston
David Tenenbaum – EEOS 465 / 627 – UMass Boston
David Tenenbaum – EEOS 465 / 627 – UMass Boston
David Tenenbaum – EEOS 465 / 627 – UMass Boston
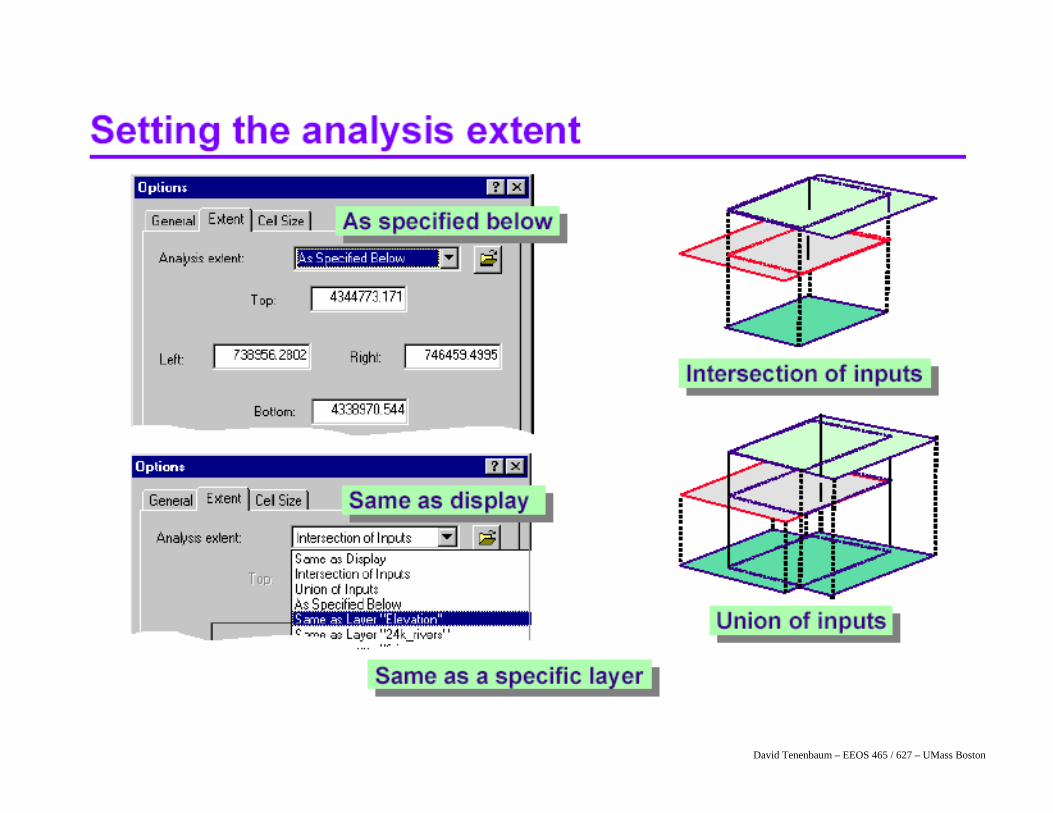
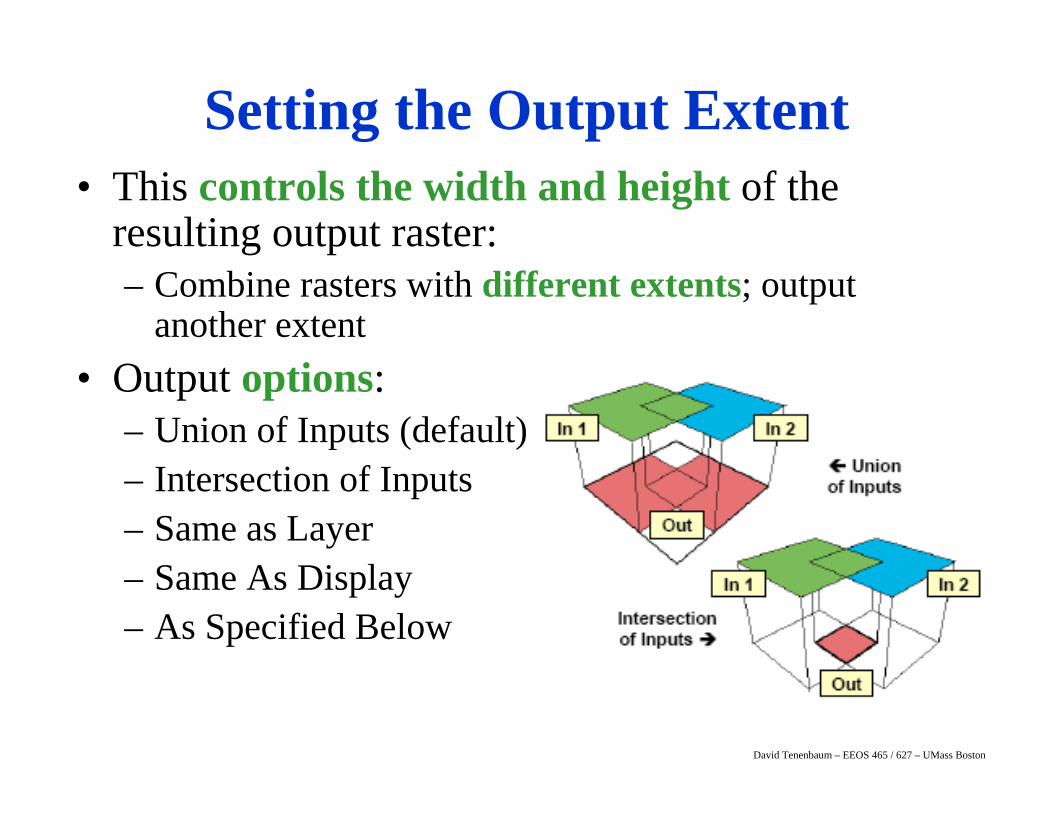
• This controls the width and height of the resulting output raster:– Combine rasters with different extents; output
another extent• Output options:
– Union of Inputs (default)– Intersection of Inputs– Same as Layer– Same As Display– As Specified Below
Setting the Output Extent
David Tenenbaum – EEOS 465 / 627 – UMass Boston
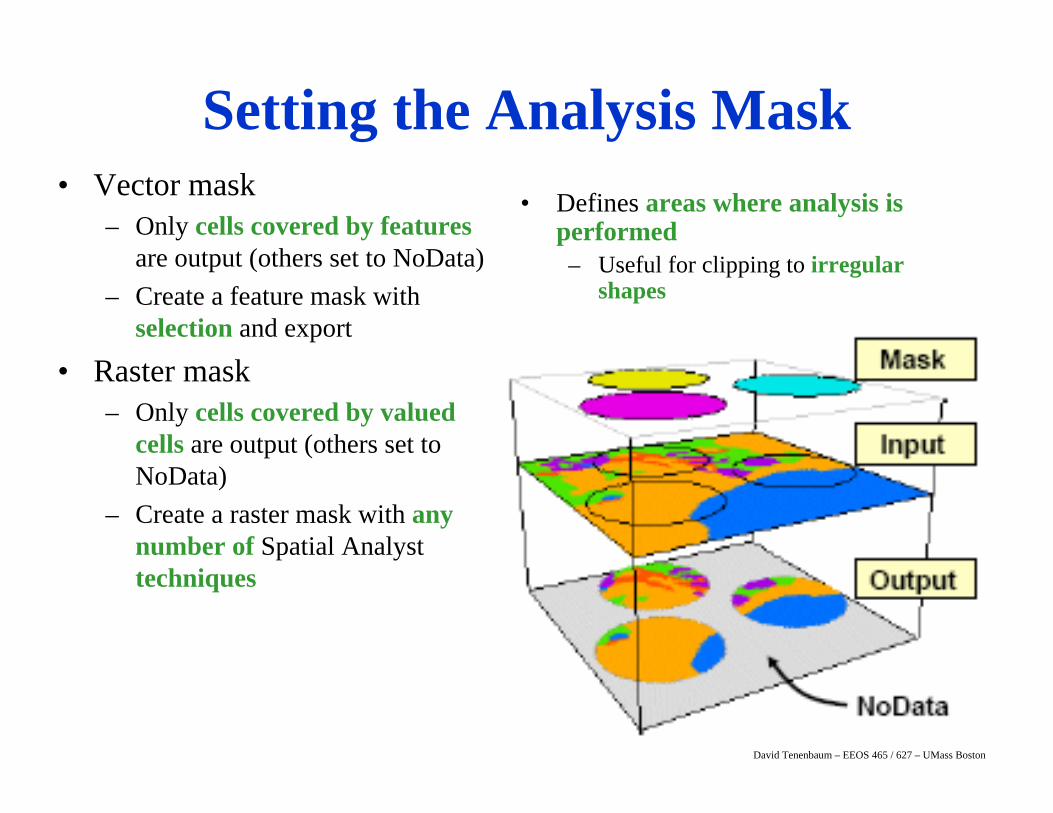
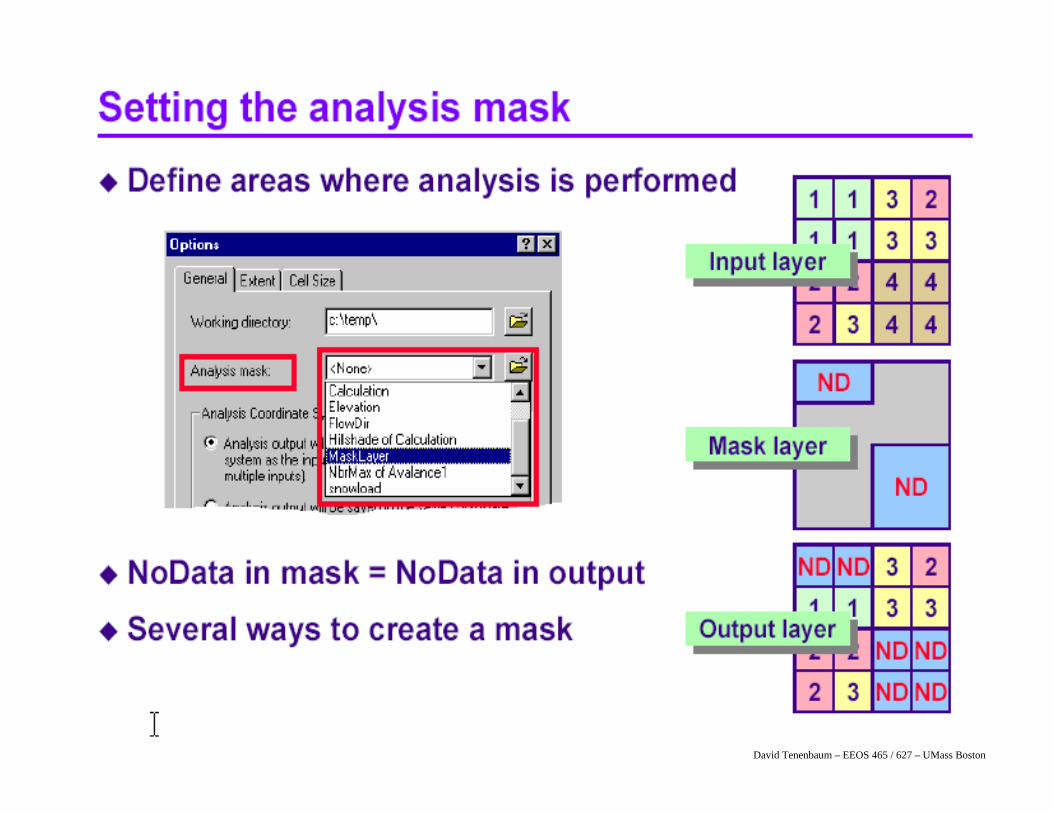
• Vector mask– Only cells covered by features
are output (others set to NoData)– Create a feature mask with
selection and export
• Raster mask– Only cells covered by valued
cells are output (others set to NoData)
– Create a raster mask with any number of Spatial Analyst techniques
• Defines areas where analysis is performed
– Useful for clipping to irregular shapes
Setting the Analysis Mask
David Tenenbaum – EEOS 465 / 627 – UMass Boston

David Tenenbaum – EEOS 465 / 627 – UMass Boston
Exercise 2: Raster Concepts• Explore raster concepts• Set the raster analysis environment
– Analysis extent, cell size, mask• Clip a raster dataset
– With the analysis extent (rectangular shape)– With the mask (irregular shape)
• Snap the extent to a specific raster
David Tenenbaum – EEOS 465 / 627 – UMass Boston
• Online Help• Documentation
– Using ArcGIS Spatial Analyst by Jill McCoy and Kevin Johnston
• Knowledge Base– http://arconline.esri.com/arconline/kbase.cfm
• Virtual Campus courses– http://campus.esri.com
• ArcObjects Online– http://arconline.esri.com/arcobjectsonline
• Online Support Center – http://support.esri.com
Resources for Further Study
David Tenenbaum – EEOS 465 / 627 – UMass Boston
Next Topic:Raster Representations and Calculations