raster graphics - princeton university · pdf file1 raster graphics thomas funkhouser...
TRANSCRIPT
1
Raster Graphics
Thomas Funkhouser
Princeton University
C0S 426, Fall 2000
Overview
• Display hardware� How are images displayed?
• Raster graphics systems� How are imaging systems organized?
• Color models� How can we describe and represent colors?
2
Overview
• Display hardware� How are images displayed?
• Raster graphics systems� How are imaging systems organized?
• Color models� How can we describe and represent colors?
Display Hardware
• Video display devices� Cathode Ray Tube (CRT)� Liquid Crystal Display (LCD)� Plasma panels Thin-film electroluminescent displays Light-emitting diodes (LED)
• Hard-copy devices� Ink-jet printer� Laser printer Film recorder� Electrostatic printer� Pen plotter
3
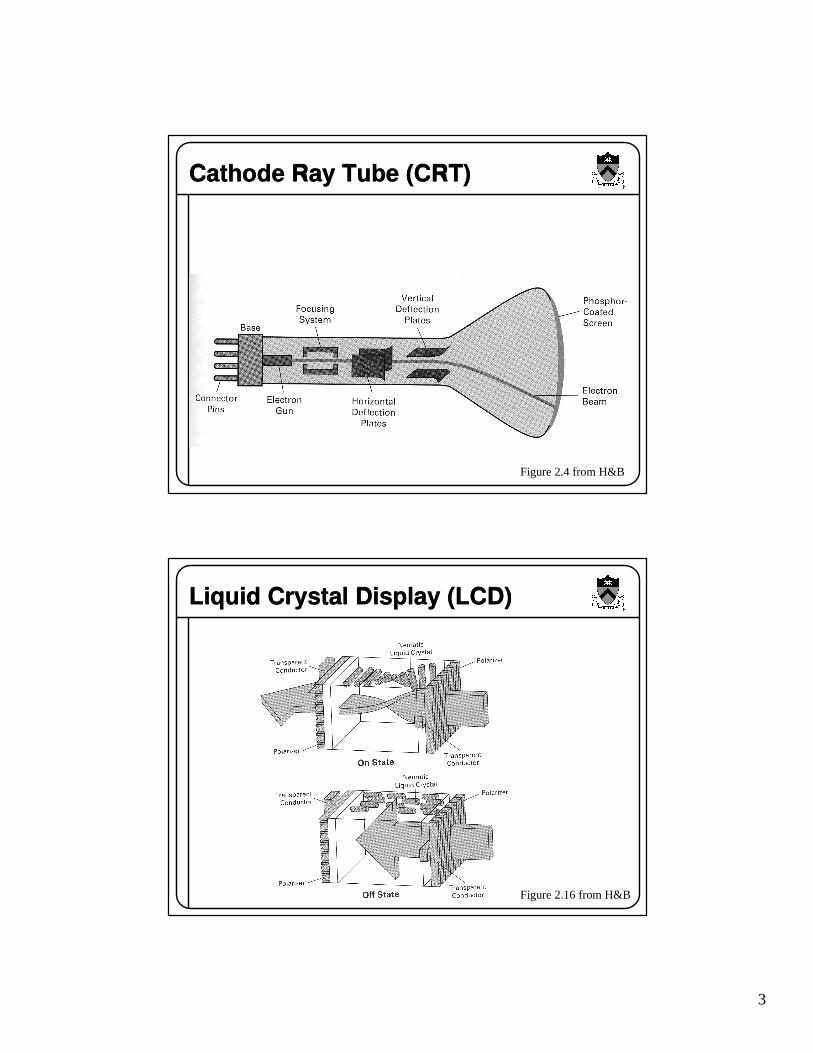
Cathode Ray Tube (CRT)
Figure 2.4 from H&B
Liquid Crystal Display (LCD)
Figure 2.16 from H&B
4
Display Hardware
• Video display devices» Cathode Ray Tube (CRT)» Liquid Crystal Display (LCD)� Plasma panels� Thin-film electroluminescent displays� Light-emitting diodes (LED)
• Hard-copy devices� Ink-jet printer� Laser printer� Film recorder� Electrostatic printer� Pen plotter
Overview
• Display hardware� How are images displayed?
• Raster graphics systems� How are imaging systems organized?
• Color models� How can we describe and represent colors?
5
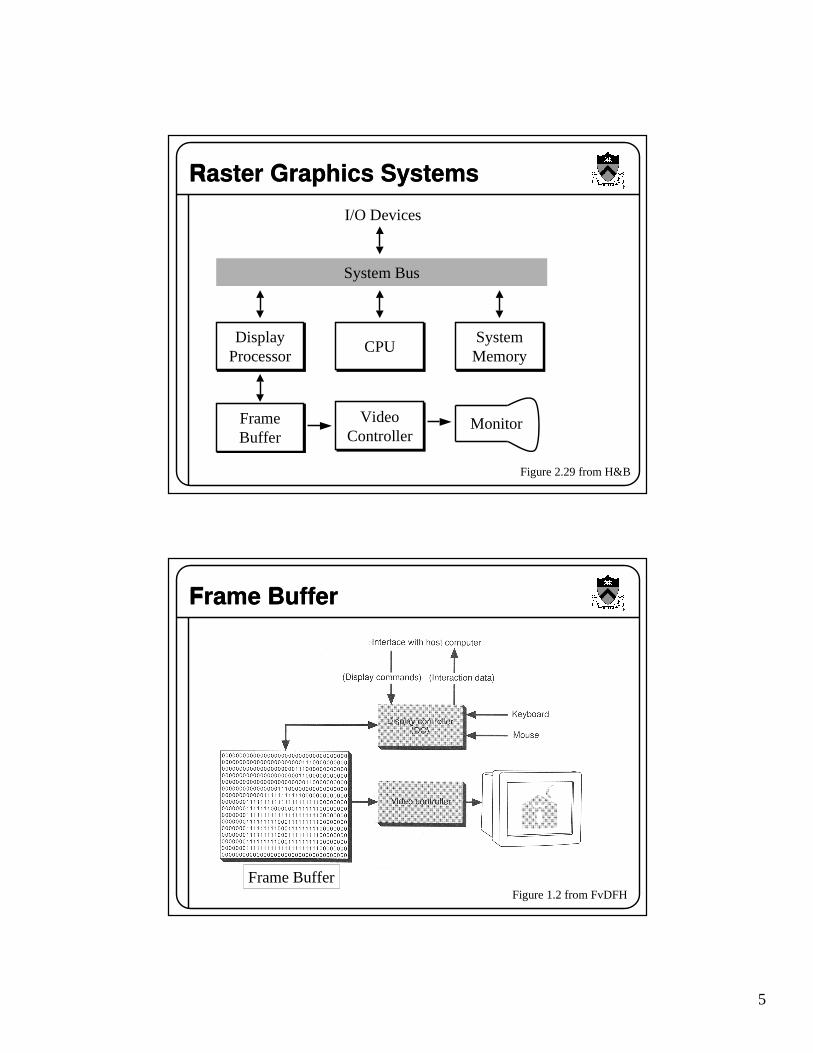
Raster Graphics Systems
DisplayProcessor
SystemMemory
CPU
FrameBuffer
MonitorVideoController
System Bus
I/O Devices
Figure 2.29 from H&B
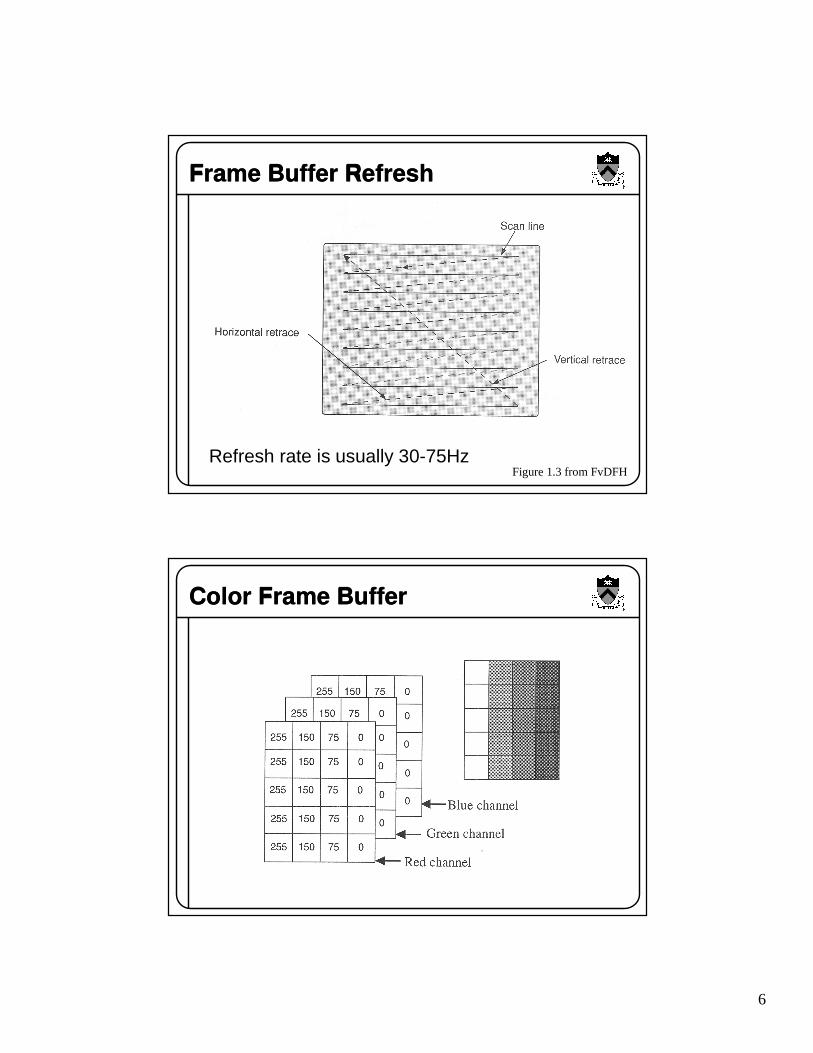
Frame Buffer
Frame BufferFigure 1.2 from FvDFH
6
Frame Buffer Refresh
Figure 1.3 from FvDFH Refresh rate is usually 30-75Hz
Color Frame Buffer
7
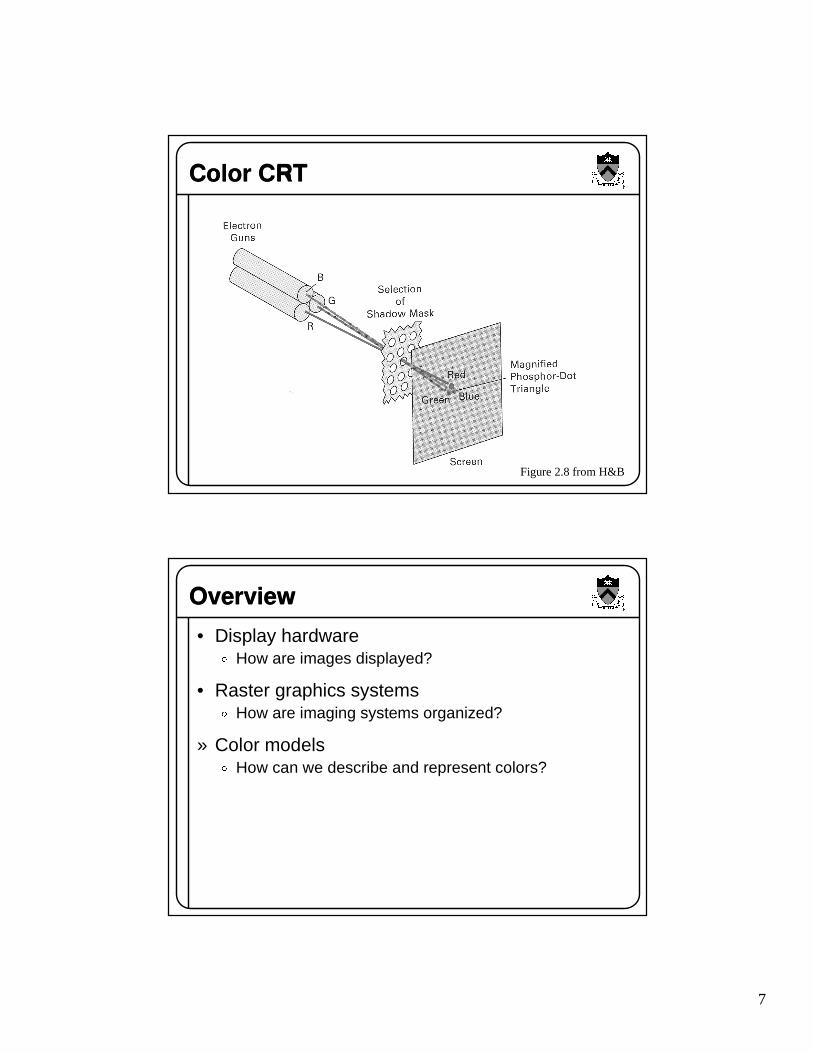
Color CRT
Figure 2.8 from H&B
Overview
• Display hardware� How are images displayed?
• Raster graphics systems� How are imaging systems organized?
» Color models� How can we describe and represent colors?
8
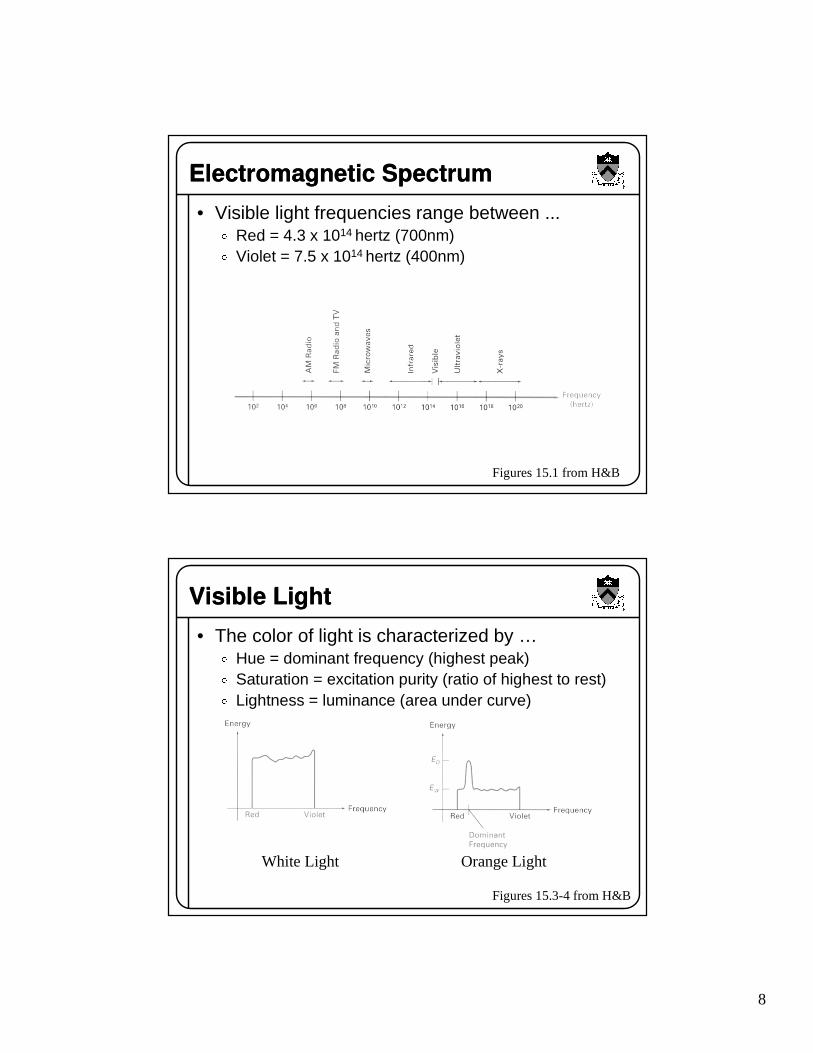
Electromagnetic Spectrum
• Visible light frequencies range between ...� Red = 4.3 x 10¹⁴ hertz (700nm)� Violet = 7.5 x 10¹⁴ hertz (400nm)
Figures 15.1 from H&B
Visible Light
• The color of light is characterized by … Hue = dominant frequency (highest peak)! Saturation = excitation purity (ratio of highest to rest)" Lightness = luminance (area under curve)
White Light Orange Light
Figures 15.3-4 from H&B
9
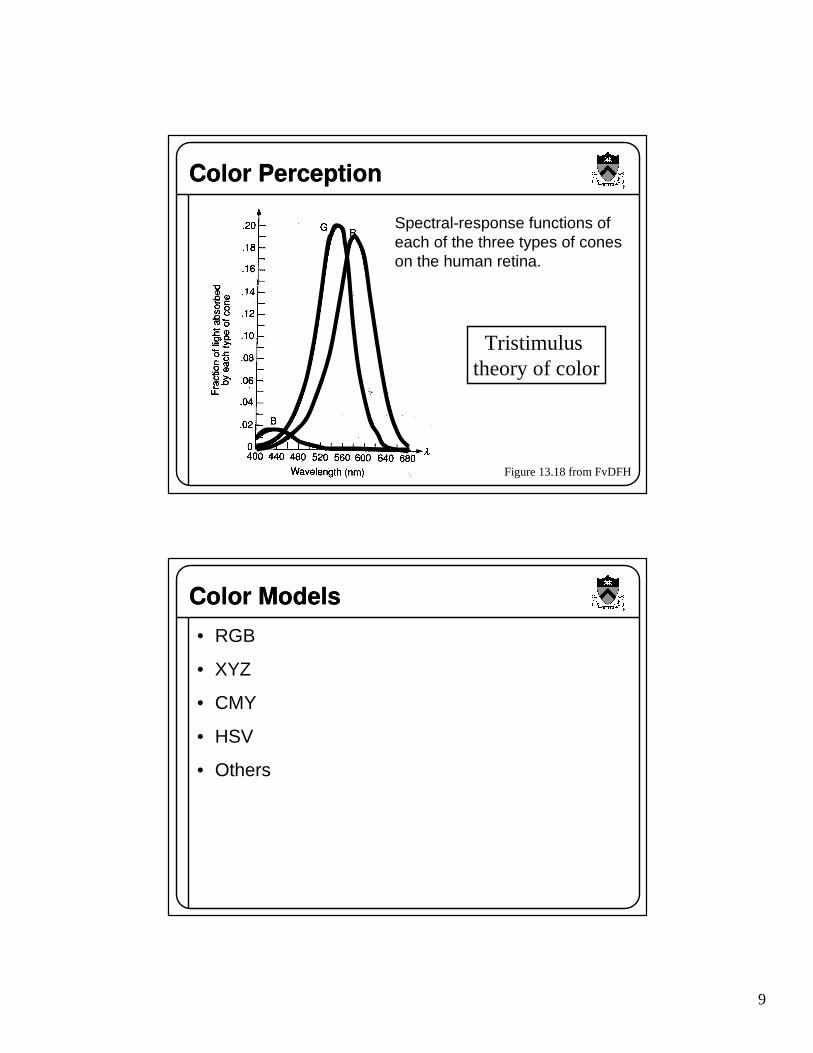
Color Perception
Figure 13.18 from FvDFH
Spectral-response functions of each of the three types of cones on the human retina.
Tristimulus theory of color
Color Models
• RGB
• XYZ
• CMY
• HSV
• Others
10
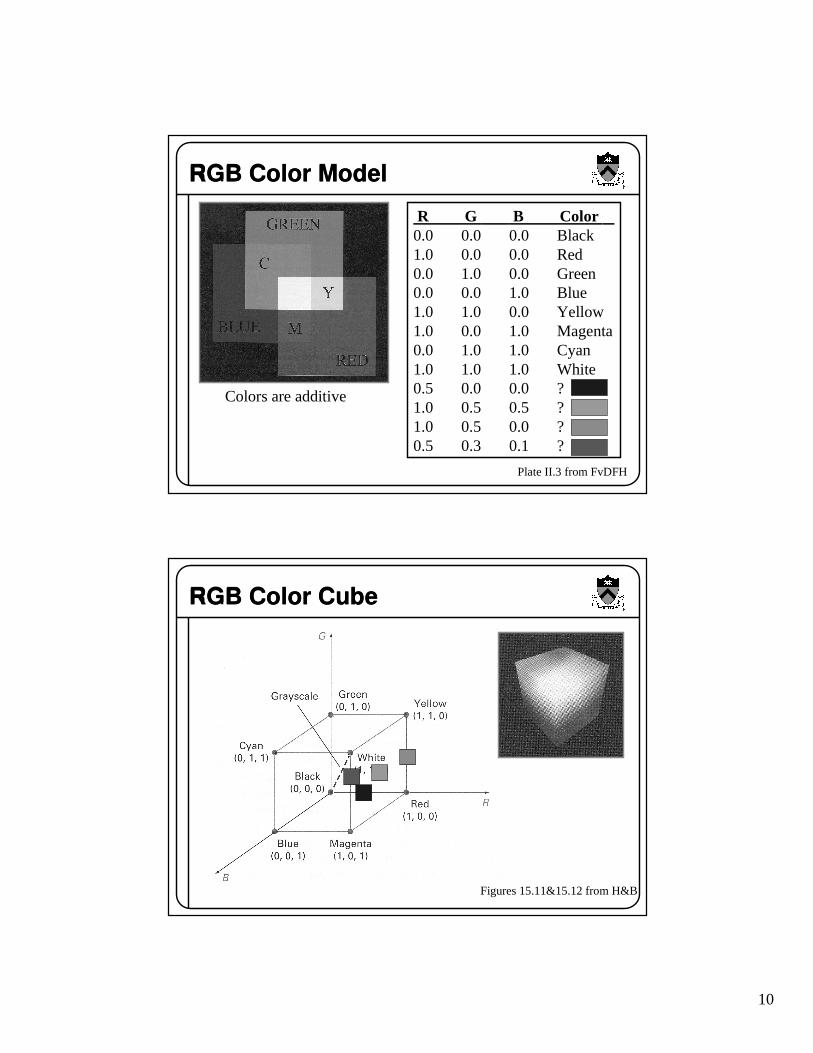
RGB Color Model
Plate II.3 from FvDFH
R G B Color 0.0 0.0 0.0 Black1.0 0.0 0.0 Red0.0 1.0 0.0 Green0.0 0.0 1.0 Blue1.0 1.0 0.0 Yellow1.0 0.0 1.0 Magenta0.0 1.0 1.0 Cyan1.0 1.0 1.0 White0.5 0.0 0.0 ?1.0 0.5 0.5 ?1.0 0.5 0.0 ?0.5 0.3 0.1 ?
Colors are additive
RGB Color Cube
Figures 15.11&15.12 from H&B
11
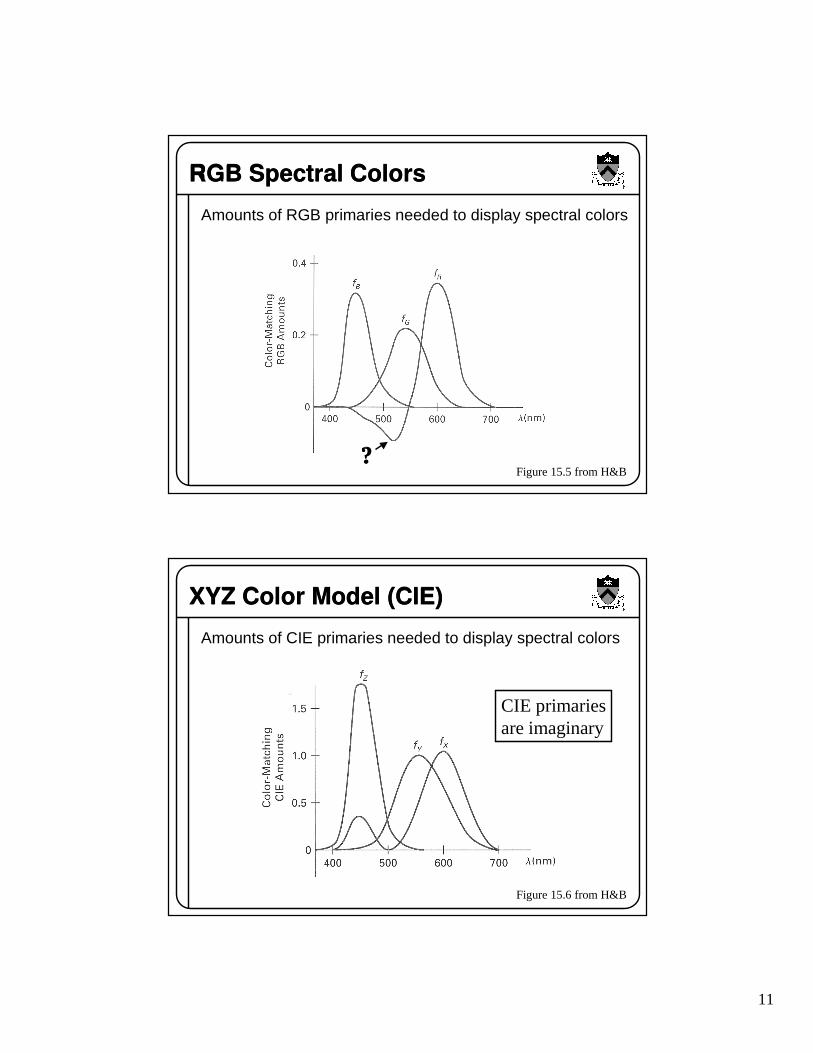
RGB Spectral Colors
Amounts of RGB primaries needed to display spectral colors
?Figure 15.5 from H&B
XYZ Color Model (CIE)
Amounts of CIE primaries needed to display spectral colors
Figure 15.6 from H&B
CIE primariesare imaginary
12
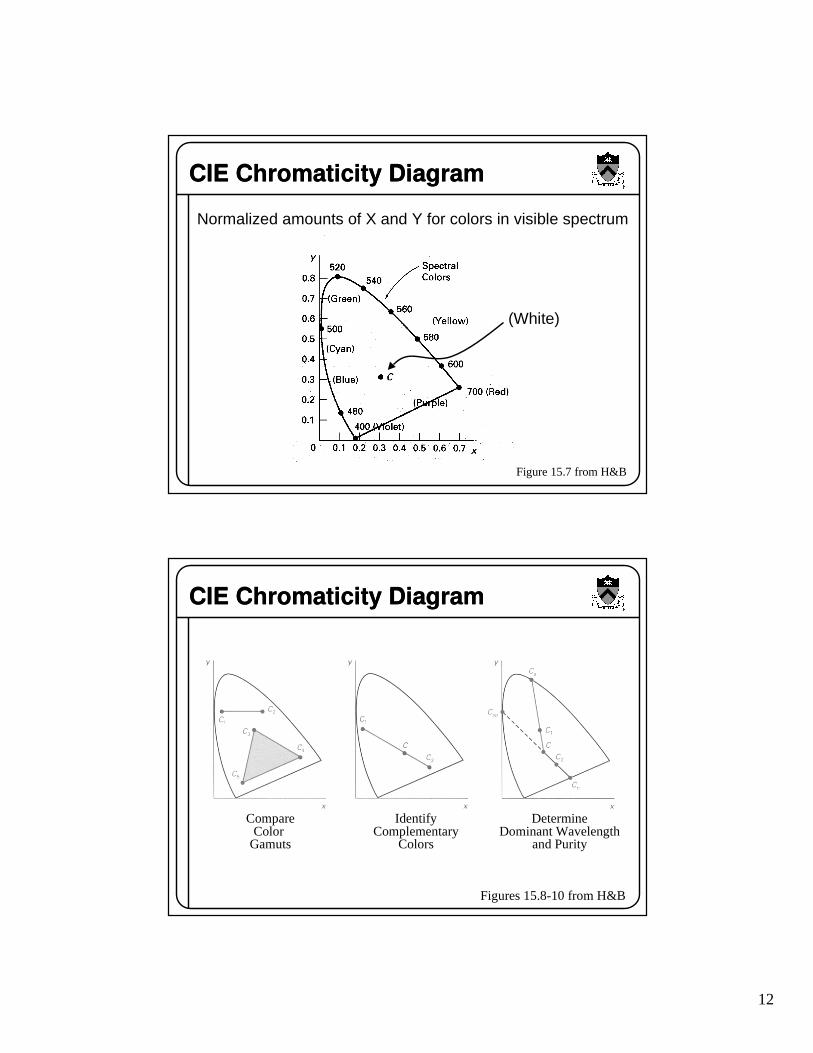
CIE Chromaticity Diagram
Normalized amounts of X and Y for colors in visible spectrum
Figure 15.7 from H&B
(White)
CIE Chromaticity Diagram
Figures 15.8-10 from H&B
CompareColor
Gamuts
IdentifyComplementary
Colors
DetermineDominant Wavelength
and Purity
13
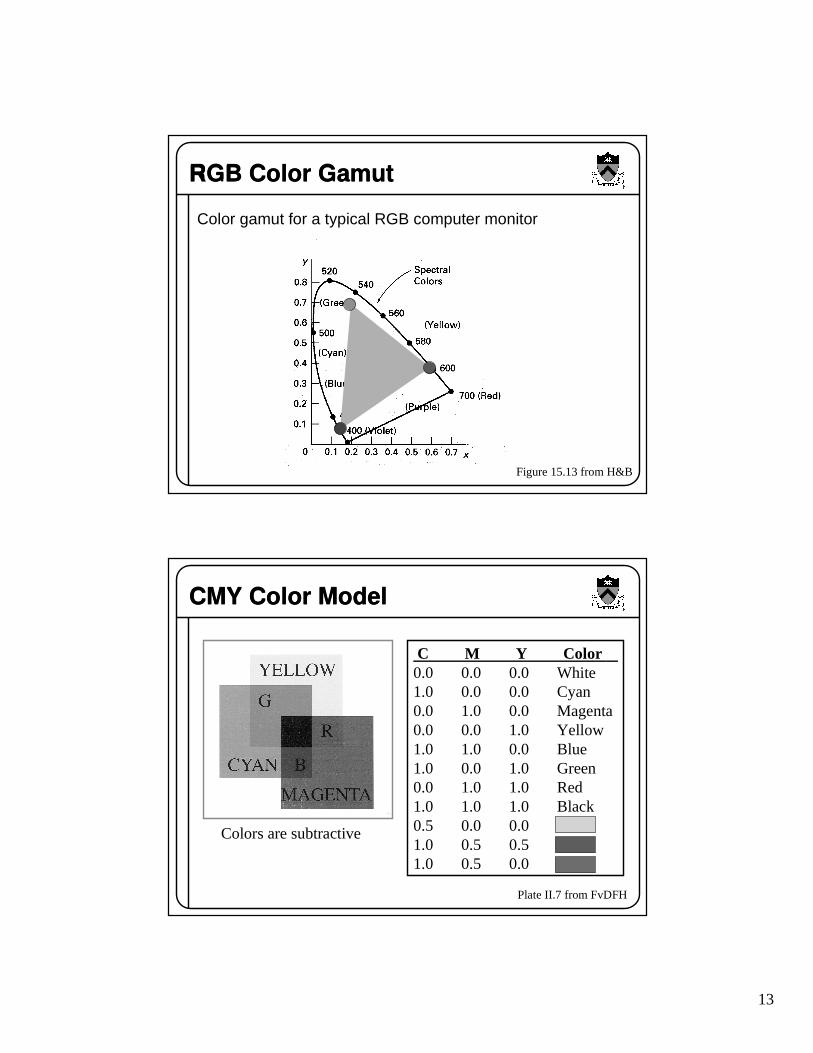
RGB Color Gamut
Color gamut for a typical RGB computer monitor
Figure 15.13 from H&B
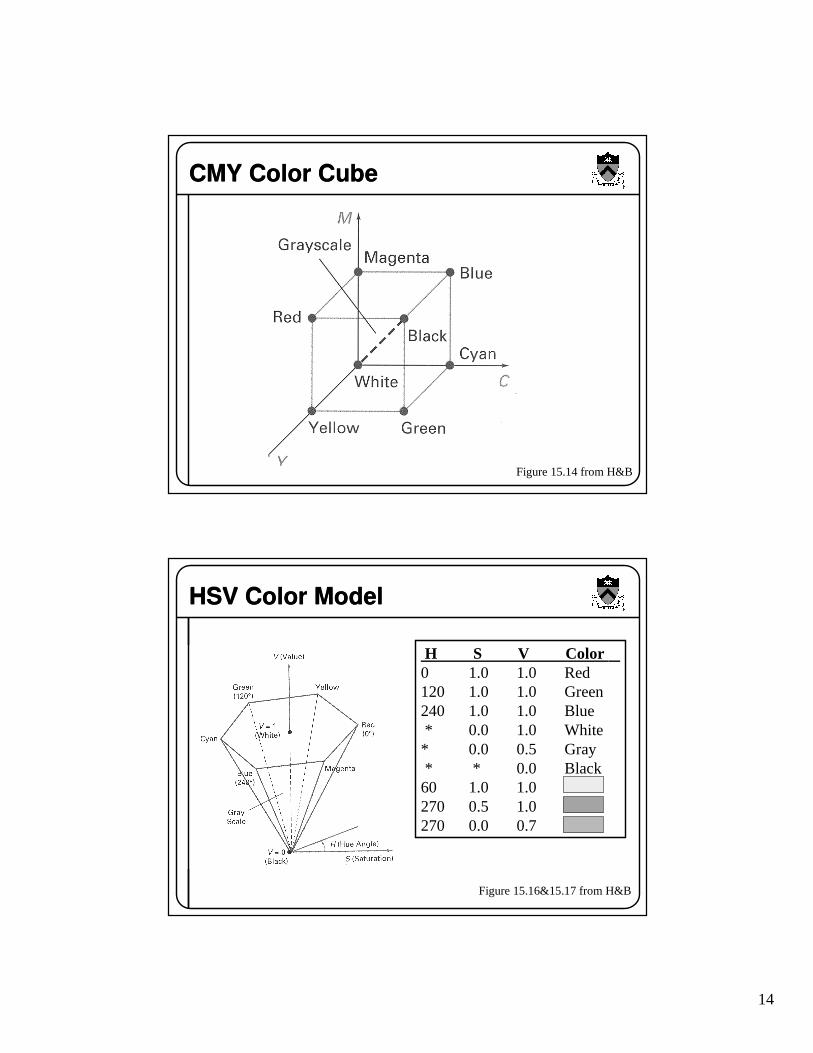
CMY Color Model
Plate II.7 from FvDFH
C M Y Color 0.0 0.0 0.0 White1.0 0.0 0.0 Cyan0.0 1.0 0.0 Magenta0.0 0.0 1.0 Yellow1.0 1.0 0.0 Blue1.0 0.0 1.0 Green0.0 1.0 1.0 Red1.0 1.0 1.0 Black0.5 0.0 0.0 ?1.0 0.5 0.5 ?1.0 0.5 0.0 ?
Colors are subtractive
14
CMY Color Cube
Figure 15.14 from H&B
HSV Color Model
Figure 15.16&15.17 from H&B
H S V Color 0 1.0 1.0 Red120 1.0 1.0 Green240 1.0 1.0 Blue * 0.0 1.0 White* 0.0 0.5 Gray * * 0.0 Black60 1.0 1.0 ?270 0.5 1.0 ?270 0.0 0.7 ?
15
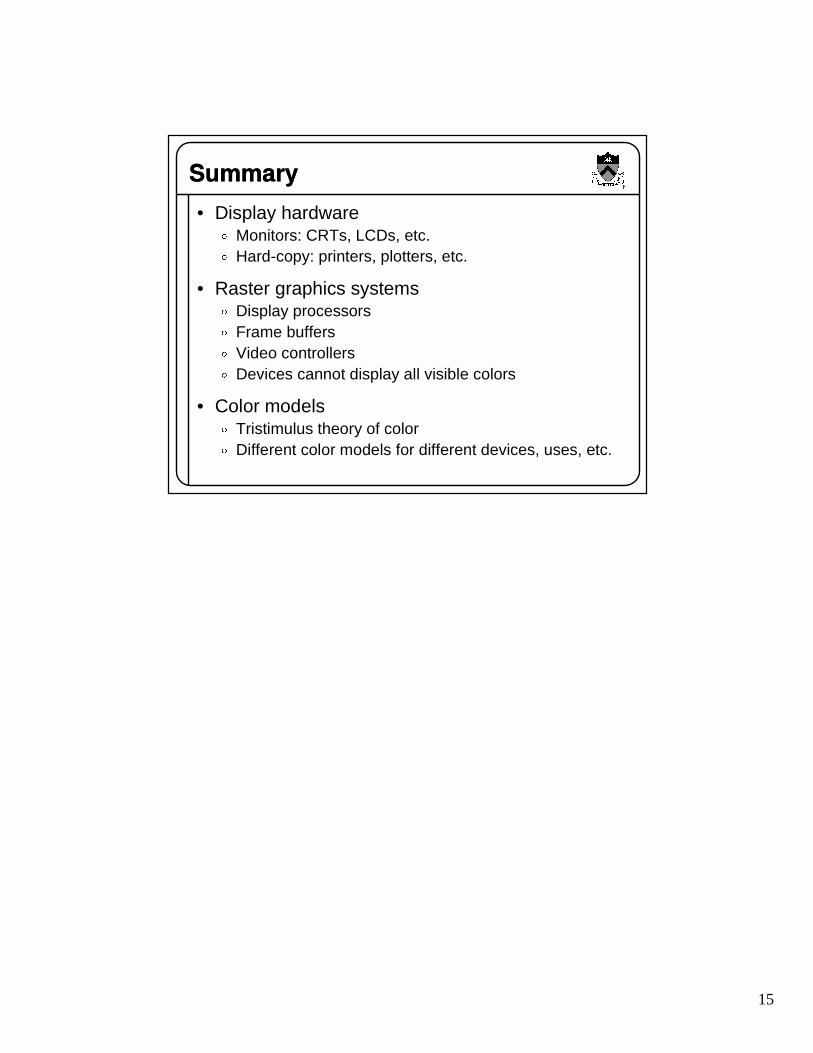
Summary
• Display hardware# Monitors: CRTs, LCDs, etc.$ Hard-copy: printers, plotters, etc.
• Raster graphics systems% Display processors& Frame buffers' Video controllers( Devices cannot display all visible colors
• Color models) Tristimulus theory of color* Different color models for different devices, uses, etc.