rate schedules
TRANSCRIPT

ENGR 867 Rate Schedules
Ahmad R. Ganji
Professor of Mechanical Engineering

Rate Schedule
• Rate schedule is the tariff /method that the utility company charges its customers, varies greatly by utility and type of fuel.
• Rate schedule may depend on: – Type of use/customer – Energy use – Energy demand – Season – Time of use – Historical use – Primary – Secondary – transmission
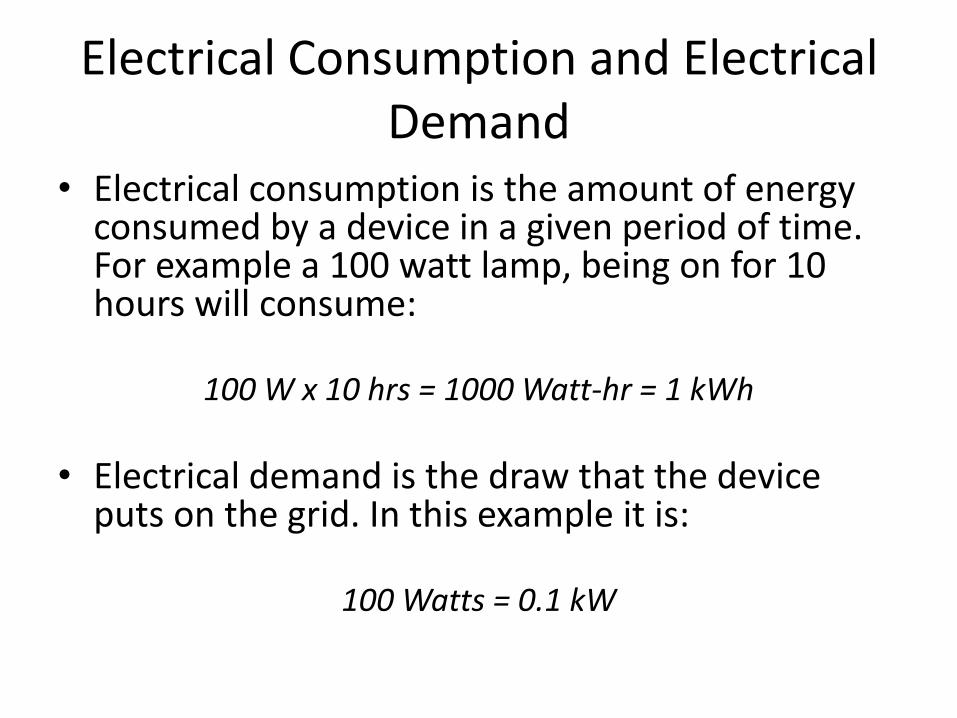
Electrical Consumption and Electrical Demand
• Electrical consumption is the amount of energy consumed by a device in a given period of time. For example a 100 watt lamp, being on for 10 hours will consume:
100 W x 10 hrs = 1000 Watt-hr = 1 kWh
• Electrical demand is the draw that the device puts on the grid. In this example it is:
100 Watts = 0.1 kW
4
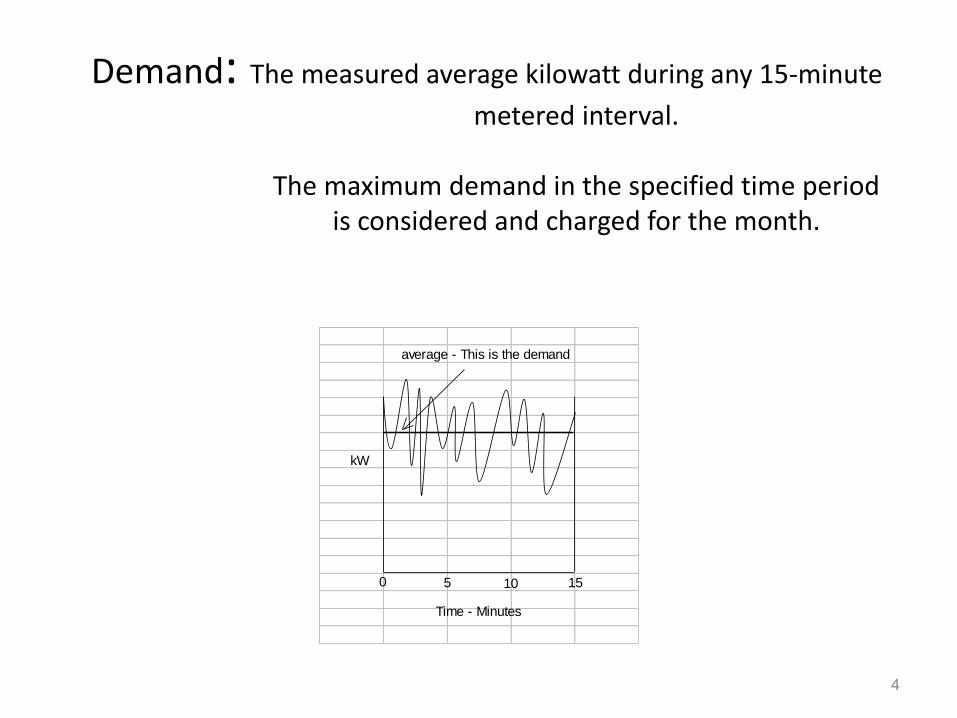
Demand: The measured average kilowatt during any 15-minute
metered interval.
The maximum demand in the specified time period is considered and charged for the month.
kW
Time - Minutes
0 5 10 15
average - This is the demand
Some Typical PG&E Rate Schedules

Sample Daily Interval Data
0
200
400
600
800
1,000
1,200
1,400
1,600
1,800
12
:00
AM
1:0
0 A
M
2:0
0 A
M
3:0
0 A
M
4:0
0 A
M
5:0
0 A
M
6:0
0 A
M
7:0
0 A
M
8:0
0 A
M
9:0
0 A
M
10
:00
AM
11
:00
AM
12
:00
PM
1:0
0 P
M
2:0
0 P
M
3:0
0 P
M
4:0
0 P
M
5:0
0 P
M
6:0
0 P
M
7:0
0 P
M
8:0
0 P
M
9:0
0 P
M
10
:00
PM
11
:00
PM
Time (Hour)
Dem
an
d (
kW
)
Jul-15th Tues Jan-15th Thurs

Sample Weekly Interval Data
0
200
400
600
800
1,000
1,200
1,400
1,600
1,800
Monday Tuesday Wednesday Thursday Friday Saturday Sunday Monday
Day
Dem
an
d (
kW
)
Jul-08 Jan-09

Example of TOU Energy and Demand Data
Electrical Summary (Jan. – Dec. 2012
Month
Energy Usage (kWh/month) Demand (kW) Energy Charges ($) Demand Charges ($) Energy Tax
($)
Total Charges
($) On Peak Part Peak
Off Total
On Peak
Part Peak
Max On
Peak
Part Peak
Off Peak
Total On
Peak
Part Peak
Max Total Peak
Jan-12 - 130,752 189,150 319,902 - 1,058 1,058 - 11,205 13,229 24,435 - 265 9,903 10,167 93 34,695
Feb-12 - 232,001 271,007 503,008 - 1,070 1,070 - 19,882 18,954 38,837 - 268 9,968 10,236 118 49,191
Mar-12 - 234,339 262,336 496,675 - 1,115 1,115 - 20,230 18,513 38,744 - 279 10,436 10,715 144 49,603
Apr-12 14,627 178,481 235,651 428,759 - 1,061 1,084 1,806 15,472 17,214 34,492 - 265 10,146 10,411 124 45,027
May-12 72,317 82,766 187,208 342,291 1,088 1,088 1,088 9,471 7,457 13,157 30,086 15,26
5 3,253 10,184 28,701 99 58,886
Jun-12 76,797 88,039 205,491 370,327 1,091 1,091 1,091 9,484 7,932 14,501 31,918 15,30
7 3,262 10,212 28,781 90 60,789
Jul-12 78,565 90,386 208,572 377,523 1,096 1,096 1,096 9,618 8,079 14,613 32,309 15,37
7 3,255 10,259 28,891 109 61,309
Aug-12 76,500 89,018 197,236 362,754 1,125 1,085 1,125 9,365 7,956 13,818 31,140 15,78
4 3,222 10,530 29,536 105 60,781
Sep-12 97,518 112,279 223,744 433,541 1,104 1,071 1,104 11,938 10,035 15,676 37,649 15,48
9 3,181 10,333 29,003 126 66,779
Oct-12 71,008 88,230 188,701 347,939 1,040 1,023 1,040 8,693 7,465 12,940 29,098 14,59
1 3,038 9,734 27,364 101 56,563
Nov-12 - 147,825 212,082 359,907 - 1,032 1,032 - 12,661 15,495 28,156 - 258 9,660 9,918 104 38,177
Dec-12 - 190,052 270,453 460,505 - 1,068 1,068 - 16,278 19,759 36,037 - 267 9,996 10,263 117 46,418
Total 487,332 1,664,16
8
2,651,631
4,803,131
60,376 144,65
4
187,869
392,900
91,812
20,813 121,362 233,98
7 1,330 628,217
Monthly Average
s
69,619 256,026 407,943 564,519 1,091 1,072 1,081 5,031 12,055 15,656 32,742 7,651 1,734 10,113 19,499 111 52,351
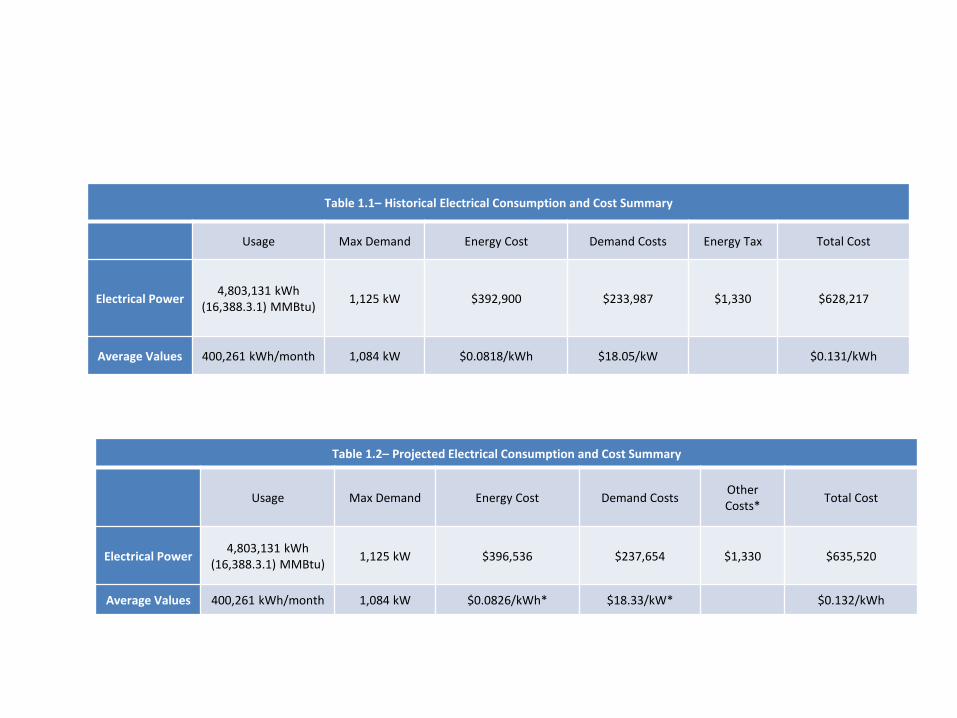
Table 1.1– Historical Electrical Consumption and Cost Summary
Usage Max Demand Energy Cost Demand Costs Energy Tax Total Cost
Electrical Power 4,803,131 kWh
(16,388.3.1) MMBtu) 1,125 kW $392,900 $233,987 $1,330 $628,217
Average Values 400,261 kWh/month 1,084 kW $0.0818/kWh $18.05/kW $0.131/kWh
Table 1.2– Projected Electrical Consumption and Cost Summary
Usage Max Demand Energy Cost Demand Costs Other Costs*
Total Cost
Electrical Power 4,803,131 kWh
(16,388.3.1) MMBtu) 1,125 kW $396,536 $237,654 $1,330 $635,520
Average Values 400,261 kWh/month 1,084 kW $0.0826/kWh* $18.33/kW* $0.132/kWh
How to Account for Energy and Demand Savings of Equipment
• Estimate the energy and demand savings based on time of use and account for them based on the rates for each period – This can be fairly involved, and may need a great deal of book-keeping.
• Estimate the average cost of energy and demand:
oAnnually
o Seasonally
This method is much simpler but will not be very accurate
How to Account for Energy and Demand Savings of Equipment
• Example: Eliminate the use of a 10 hp pump in the process during the summer months

Net Metering
• Allows customers with eligible power generator (e.g. PV system, bio-gas) to offset the cost of their electric usage with energy they export to the grid
• May be used with any otherwise-applicable-rate schedule, or the schedule the facility would qualify for if there was not a generating facility.
Net Metering
To qualify in California:
• Generator must be less than/equal to 1 MW
• Must be an eligible renewable power source
• Not interconnected to secondary network distribution line
• Customer must pay for 2-way meter if none is installed; reprogramming fees are$0 - $288.
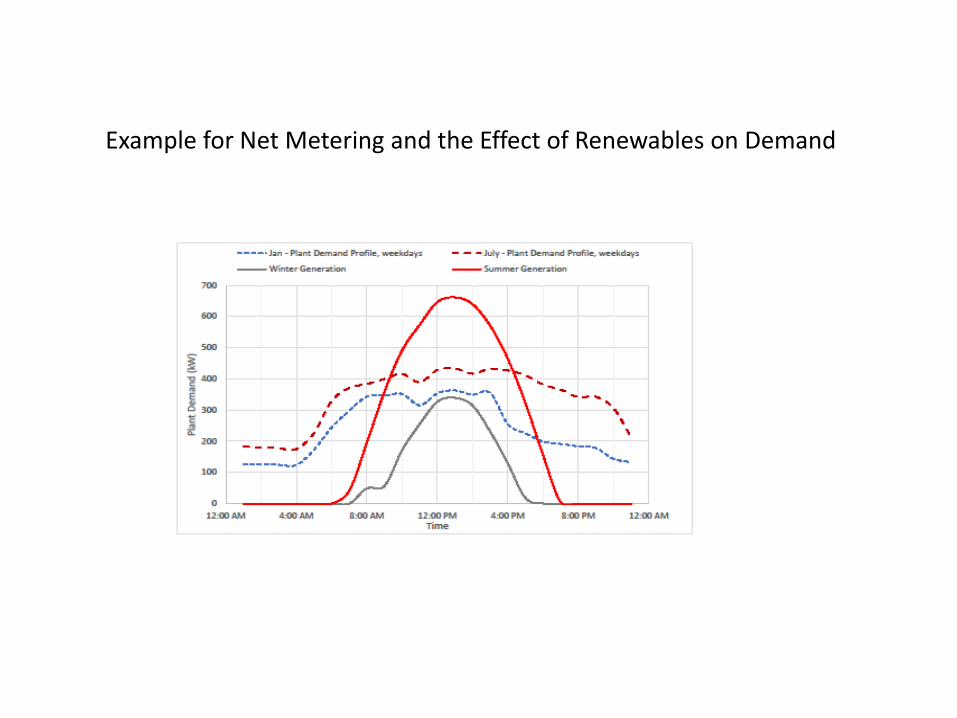
Example for Net Metering and the Effect of Renewables on Demand
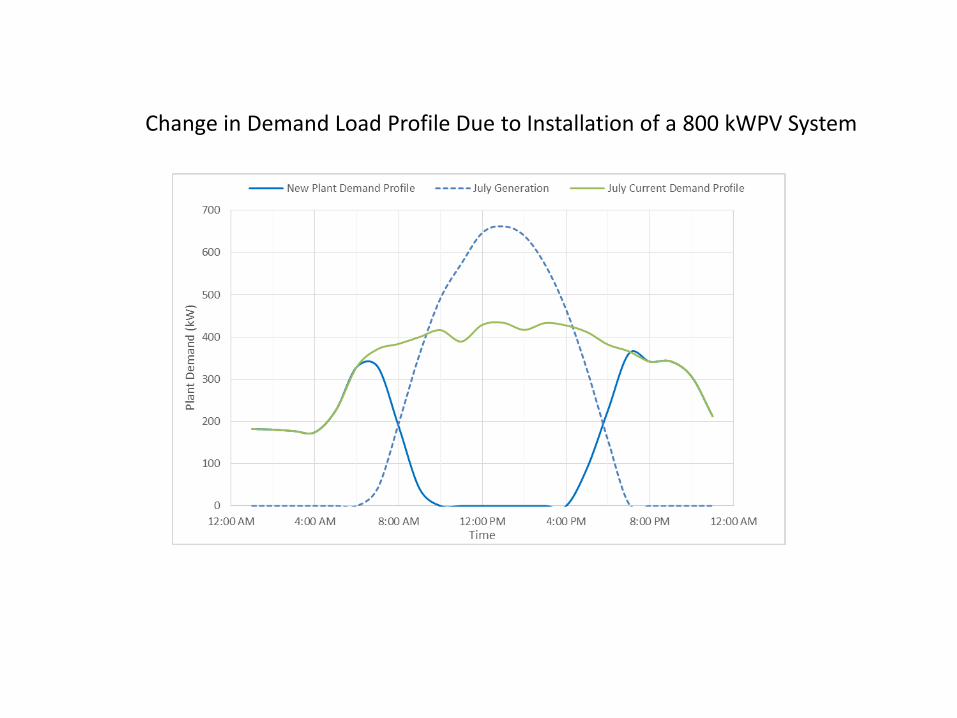
Change in Demand Load Profile Due to Installation of a 800 kWPV System
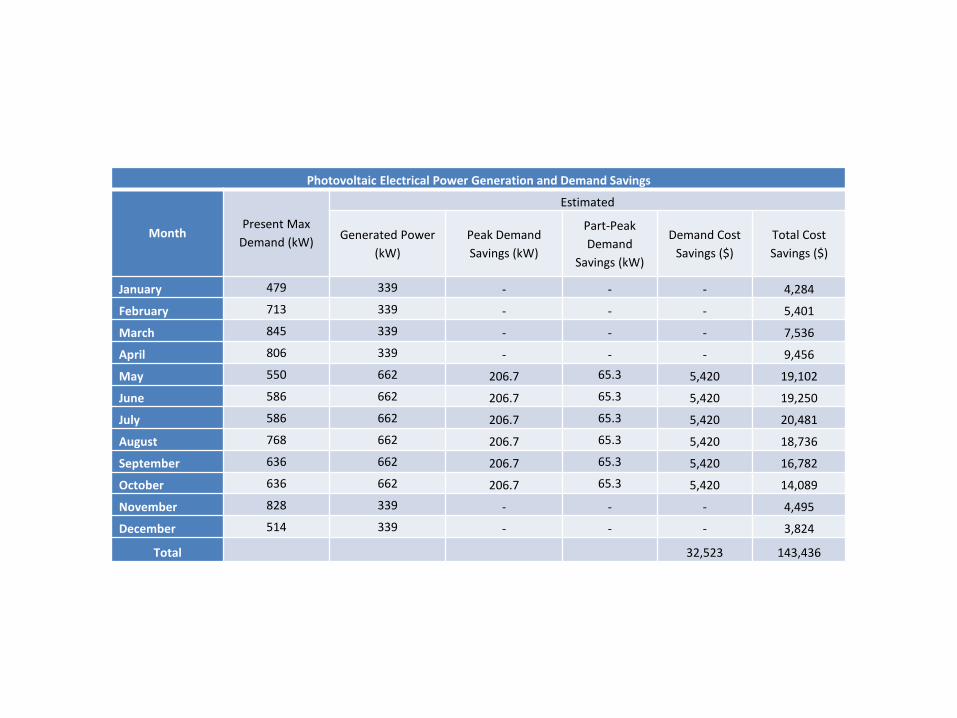
Photovoltaic Electrical Power Generation and Demand Savings
Month Present Max
Demand (kW)
Estimated
Generated Power
(kW)
Peak Demand
Savings (kW)
Part-Peak
Demand
Savings (kW)
Demand Cost
Savings ($)
Total Cost
Savings ($)
January 479 339 - - - 4,284
February 713 339 - - - 5,401
March 845 339 - - - 7,536
April 806 339 - - - 9,456
May 550 662 206.7 65.3 5,420 19,102
June 586 662 206.7 65.3 5,420 19,250
July 586 662 206.7 65.3 5,420 20,481
August 768 662 206.7 65.3 5,420 18,736
September 636 662 206.7 65.3 5,420 16,782
October 636 662 206.7 65.3 5,420 14,089
November 828 339 - - - 4,495
December 514 339 - - - 3,824
Total 32,523 143,436
Direct Access Rate Schedules
• Are those rates schedules that the commodity is purchased from a 3rd party, and he utility charges for transmission and distribution.
• Applies to both electric and gas
• For eclectic rates, usually the 3rd party will charge for usage and the utility will charge both for usage and demand, but sometimes based on the contract the 3rd party also may charge for demand.
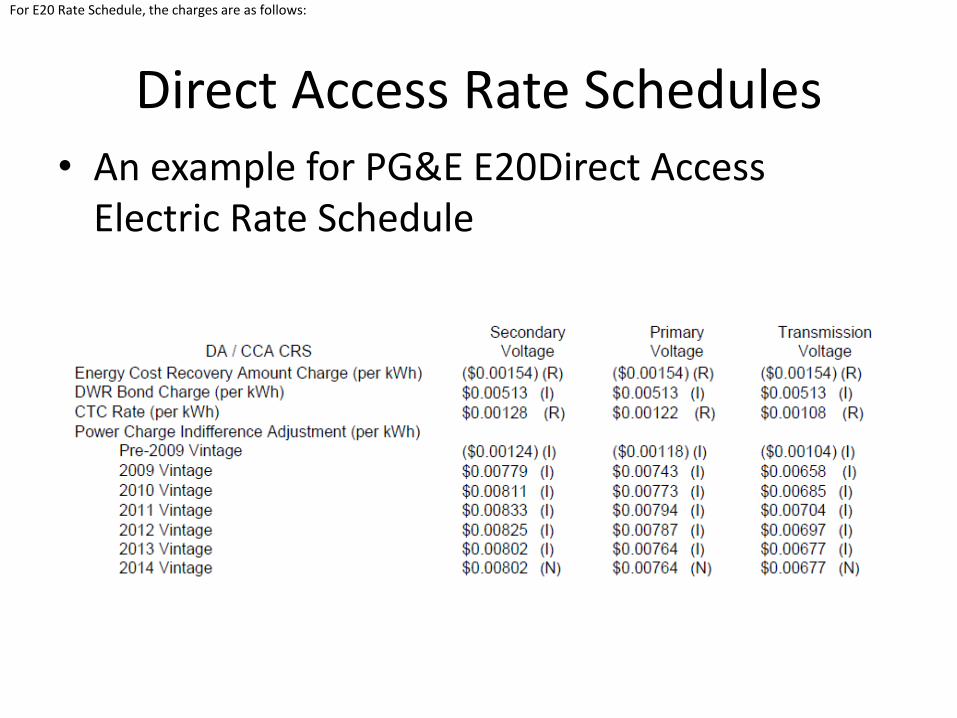
Direct Access Rate Schedules • An example for PG&E E20Direct Access
Electric Rate Schedule
For E20 Rate Schedule, the charges are as follows:
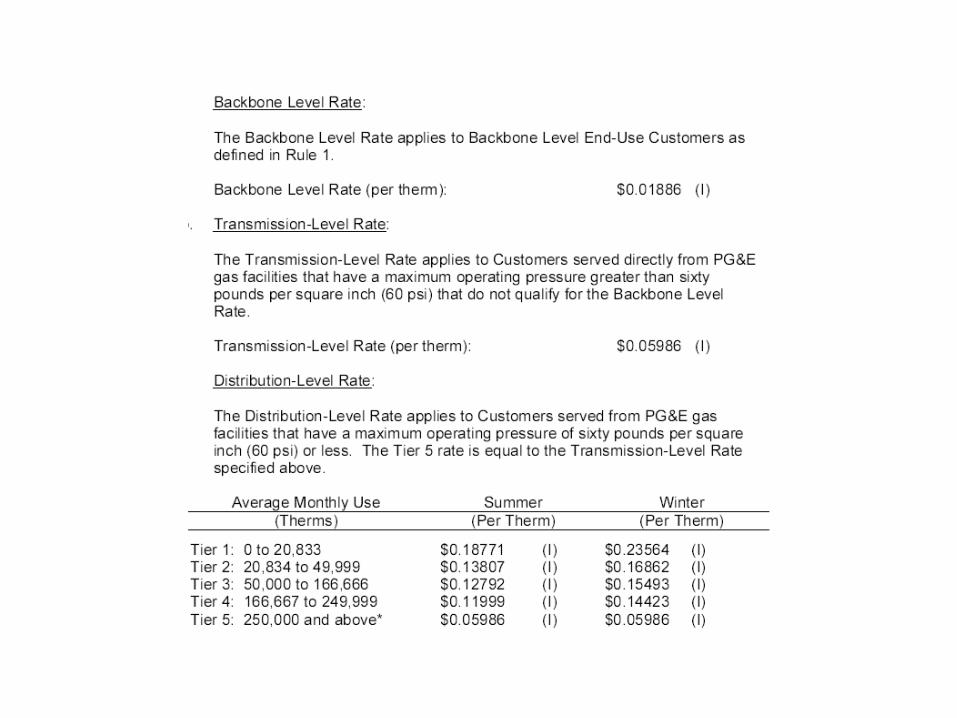
Gas Rate Schedules
• Gas Rate schedules may depend on:
– Type of use/customer
– Pressure
– Energy demand
– Season
– Direct Access
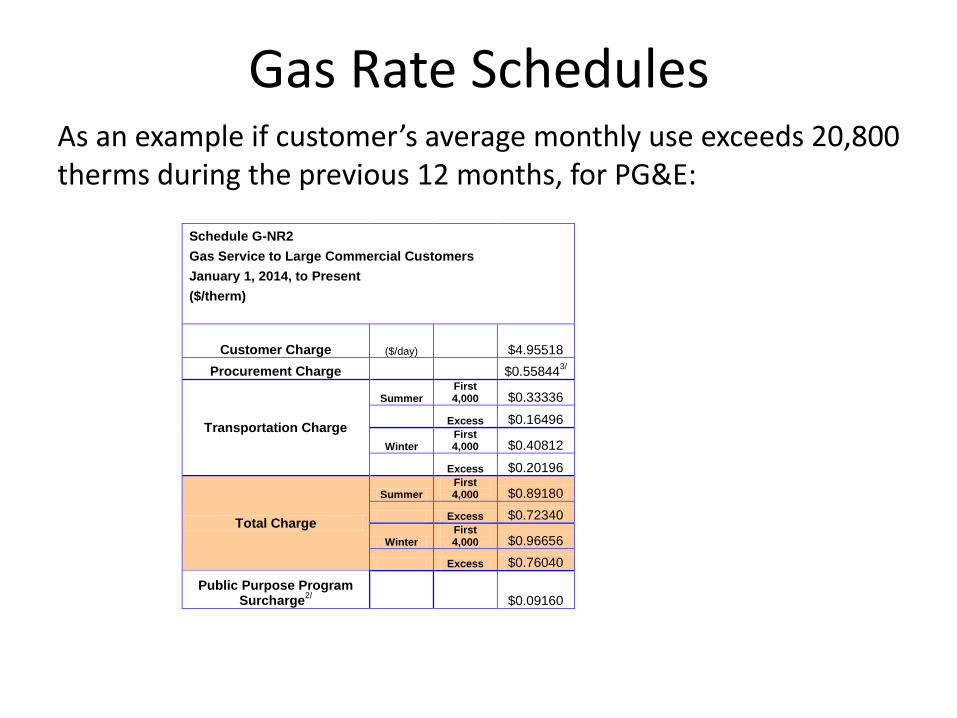
Gas Rate Schedules As an example if customer’s average monthly use exceeds 20,800 therms during the previous 12 months, for PG&E:
Schedule G-NR2 Gas Service to Large Commercial Customers
January 1, 2014, to Present ($/therm)
Customer Charge ($/day) $4.95518
Procurement Charge $0.558443/
Transportation Charge
Summer First 4,000 $0.33336
Excess $0.16496
Winter First 4,000 $0.40812
Excess $0.20196
Total Charge
Summer First 4,000 $0.89180
Excess $0.72340
Winter First 4,000 $0.96656
Excess $0.76040
Public Purpose Program Surcharge
2/ $0.09160