rate setting for infrastructure funding
TRANSCRIPT
Slide 1FCS GROUP
Tage Aaker – Project Manager
Wyatt Zimbelman – Project Consultant
October 20, 2021
Rate Setting for
Infrastructure Funding

Slide 2FCS GROUP
About FCS Group
▪ Utility rate and fee consulting
▪ Utility management consulting
▪ Financial planning and analysis
▪ Economic services

Slide 3FCS GROUP
Why Are Rate Studies Important?
● Revenues need to cover utility costs
● Quantifies policies, priorities, and initiatives
● Tells the “true” cost of providing service
● Communicates impact of financial decisions
● Public meetings
Your Utility Is A Business
Public Accountability

Slide 4FCS GROUP
Comprehensive Rate Study: Start to Finish
Rate Study Components
Financial Policy
Evaluation
Revenue Requirement
Forecast
Cost-of-Service
AnalysisRate Design
Communication
Plan
Are you charging
your customers
equitably?
Are your revenues
sufficient to
achieve full cost
recovery?
Are you adequately
protected against
financial risks?
What level of
communication is
needed?
Do your rate
structures align with
your objectives?

Slide 5FCS GROUP
The Infrastructure
Funding Challenge
Slide 6FCS GROUP
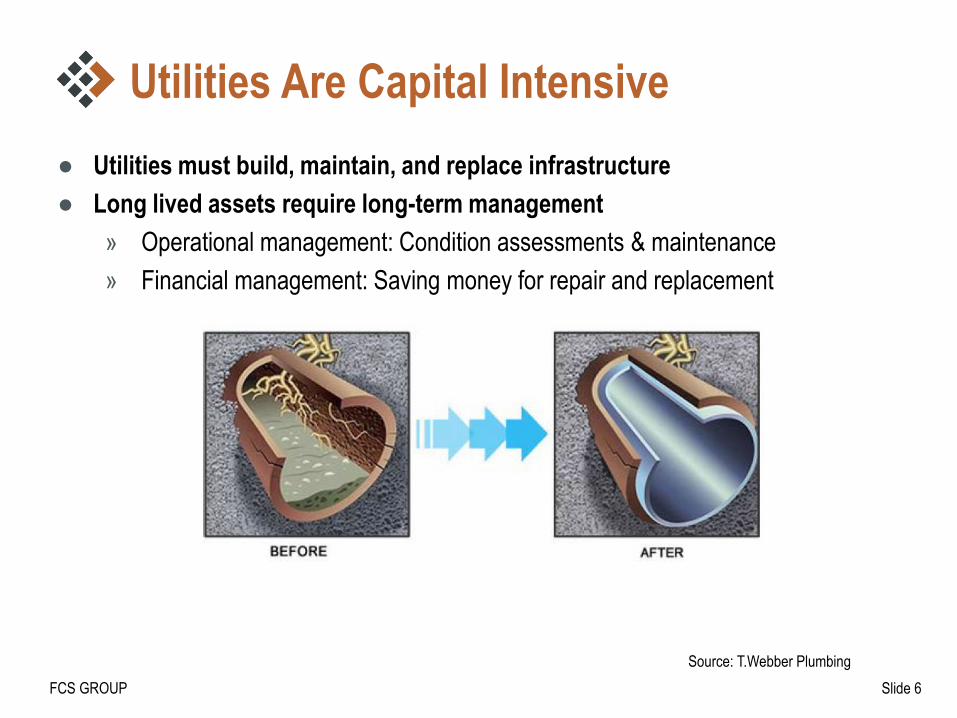
Utilities Are Capital Intensive
● Utilities must build, maintain, and replace infrastructure
● Long lived assets require long-term management
» Operational management: Condition assessments & maintenance
» Financial management: Saving money for repair and replacement
Source: T.Webber Plumbing

Slide 7FCS GROUP
External and Internal Sources Insufficient
● CSI: Northwest Vision for 2040 Water Infrastructure
» State and federal funding sources are shrinking
» Budgets are under serious strain as systems age, costs escalate
» Agencies not setting aside enough funds to replace aging assets
» Proactive asset management encouraged
A Northwest Vision for 2040 Water Infrastructure: Innovative Pathways, Smarter Spending, Better Outcomes (2017)
Infrastructure Crisis, Sustainable Solutions: The Evergreen State College, Center for sustainable infrastructure (2014)
“Asset Management revamps the system-wide investment strategy looking years
ahead. It is aimed at prioritizing the most cost-effective investments to maintain
and operate infrastructure, and manage risk, to serve everyone in the community
for the long-term. The practice offers a comprehensive perspective to
strategically target operations, maintenance, and capital spending; it requires
knowledge of the actual conditions of pipes, pumps, and other facilities…”

Slide 8FCS GROUP
Decline in Federal Spending for Utilities
Public Spending on Transportation and Water Infrastructure, 1956 to 2017; October 2018:
https://www.cbo.gov/system/files/2018-10/54539-Infrastructure.pdf

Slide 9FCS GROUP
What State-Level Options Exist?
● Funding available
» Grants
» Loans
● ‘Summary’ document
» Eligible projects / applicants
» How to apply
» Contact email and phoneDocument provided by Cathi Read at the
Department of Commerce

Slide 10FCS GROUP
Infrastructure Funding
Approach

Slide 11FCS GROUP
Slide 12FCS GROUP
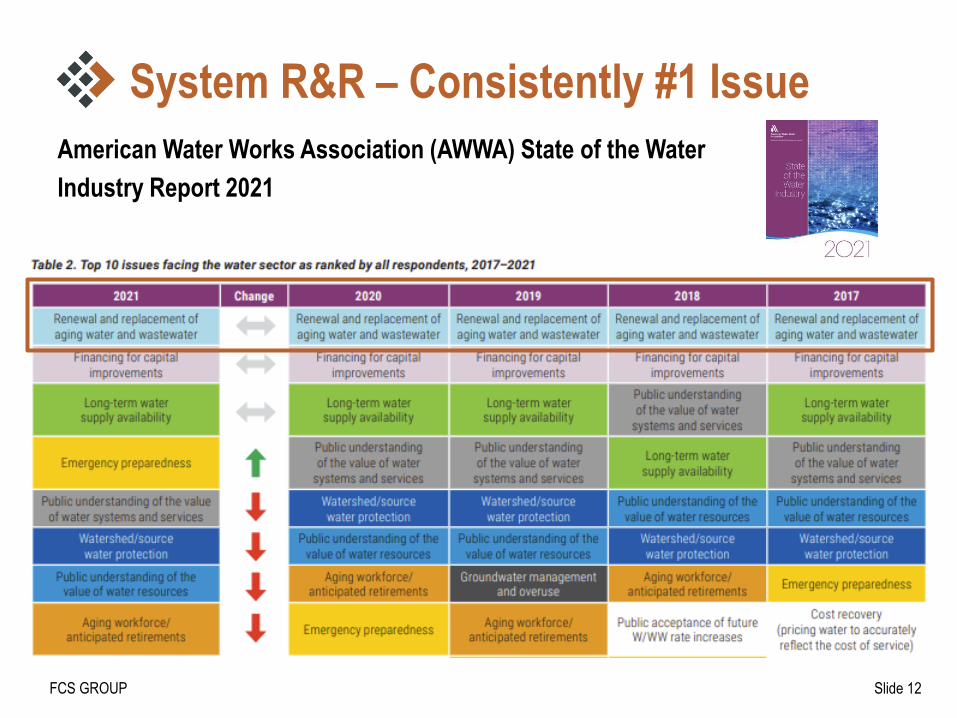
System R&R – Consistently #1 Issue
American Water Works Association (AWWA) State of the Water
Industry Report 2021

Slide 13FCS GROUP
Need for Replacement Funding Planning
● Strain on existing revenue sources
● Operating costs increasing
● Additional regulatory burdens
● Little to no revenue “left over” after O&M & debt service
● Reserves being drawn down for operating deficit

Slide 14FCS GROUP
Asset Mgmt. From a Financial Perspective
Rate Funded Capital
(Annual resource)
Condition
Assessments
Asset Inventory
Action Plan
Prioritize Capital
Projects
Ongoing
Maintenance
Plan
START
FINISH
Slide 15FCS GROUP
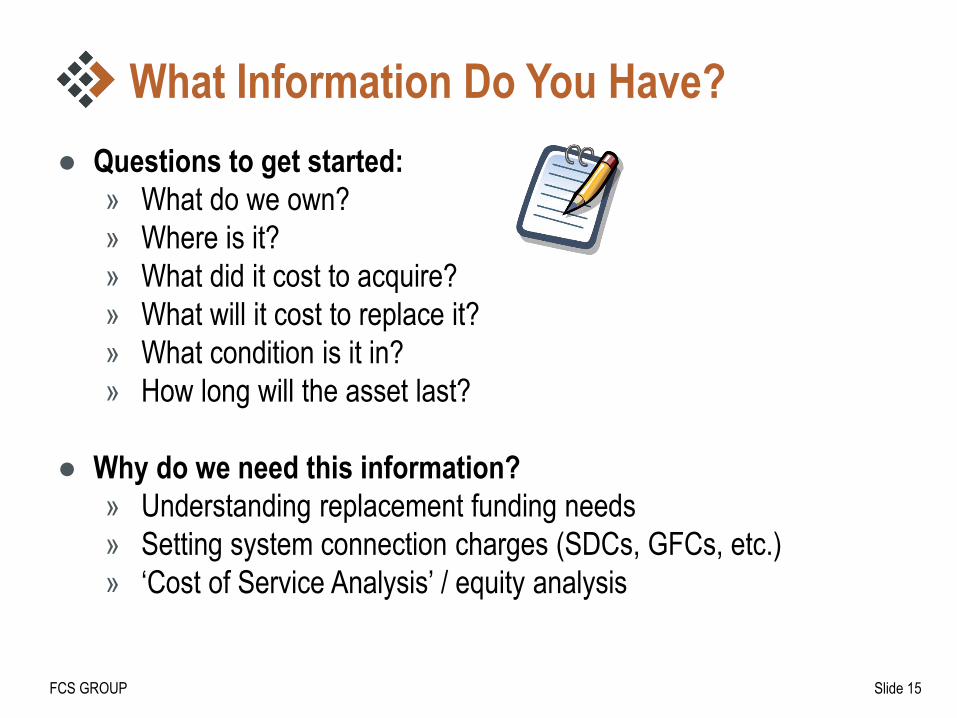
What Information Do You Have?
● Questions to get started:
» What do we own?
» Where is it?
» What did it cost to acquire?
» What will it cost to replace it?
» What condition is it in?
» How long will the asset last?
● Why do we need this information?
» Understanding replacement funding needs
» Setting system connection charges (SDCs, GFCs, etc.)
» ‘Cost of Service Analysis’ / equity analysis

Slide 16FCS GROUP
Proactive Capital Funding Plan Needed
● Rate Funded Capital Policy – what is it?
» An annual cash contribution from current rate revenue
» Pays for same-year repair & replacement projects… or
» Saved for future capital projects
● Policy Targets – how much do we need?
» Original or replacement cost annual depreciation
» Average annual repair & replacement projects
» Asset management plan
Build ‘Rate Funded Capital’ into annual revenue needs

Slide 17FCS GROUP
Rate Funded Capital Example
$-
$500,000
$1,000,000
$1,500,000
$2,000,000
$2,500,000
$3,000,000
$3,500,000
$4,000,000
2021 2022 2023 2024 2025 2026 2027 2028 2029 2030
Rate Funded Capital Policy Capital Projects
● Annual capital spending may not be uniform
● May need to supplement with reserves, connection charges, and debt
With pay-as-you go,
rates may be volatileWith dedicated
annual funding, rate
adjustments can be
smoothed over time

Slide 18FCS GROUP
Summary of Operations 2021 2022 2023 2024
Existing Rate Revenues 3,000,000$ 3,000,000$ 3,000,000$ 3,000,000$
Rate Revenues from Increases - 500,000 1,000,000 1,500,000
Operating Expenses (2,800,000) (2,880,000) (2,970,000) (3,060,000)
Existing Debt Service (200,000) (200,000) (200,000) (200,000)
Revenue Available For Capital -$ 420,000$ 830,000$ 1,240,000$
Capital Funding Strategy 2021 2022 2023 2024
Beginning Fund Balance 1,000,000$ 750,000$ 170,000$ 1,000,000$
Connection Charges 250,000 250,000 250,000 250,000
Rate Funded Capital - 420,000 830,000 1,240,000
Capital Projects (500,000) (1,250,000) (500,000) (2,000,000)
Ending Fund Balance 750,000$ 170,000$ 750,000$ 490,000$
Rate Funded Capital Detailed Example
Rate Funded Capital greater than Capital.
‘Bank’ for next year.

Slide 19FCS GROUP
Example: Status Quo slide
$(50)
$-
$50
$100
$150
$200
FY
20
FY
21
FY
22
FY
23
FY
24
FY
25
FY
26
FY
27
FY
28
FY
29
FY
30
FY
31
FY
32
FY
33
FY
34
FY
35
FY
36
FY
37
FY
38
FY
39M
illio
ns
Cash Operating Expenses New O&M Expenses from CIP
Planned Renewal & Replacement Funding Existing Debt Service and Debt Reserves
Total Revenues under existing rates

Slide 20FCS GROUP
Capital Throughput
$(50)
$-
$50
$100
$150
$200
FY
20
FY
21
FY
22
FY
23
FY
24
FY
25
FY
26
FY
27
FY
28
FY
29
FY
30
FY
31
FY
32
FY
33
FY
34
FY
35
FY
36
FY
37
FY
38
FY
39M
illio
ns
Cash Operating Expenses New O&M Expenses from CIP
Planned Renewal & Replacement Funding Existing Debt Service and Debt Reserves
Cash for Capital Projects Total Revenues under existing rates
Total Revenues with rate increases
One of the most important – if not the most – is
getting a realistic estimate of CIP spending
Q: What happens if you
raise rates by a lot and then
the projects don’t happen?
Slide 21FCS GROUP
Connection Charges

Slide 22FCS GROUP
Connection Charges
● a.k.a. GFCs, SDCs, CFCs, Hookup Fees
● One-time fee paid at the time of development / redevelopment
● Provides equity between existing and new customers
● Provide a source of capital funding as growth occurs
Existing System
CostFuture Project Costs+
Charge =Existing + Future Customer Base
(System Capacity)
Slide 23FCS GROUP
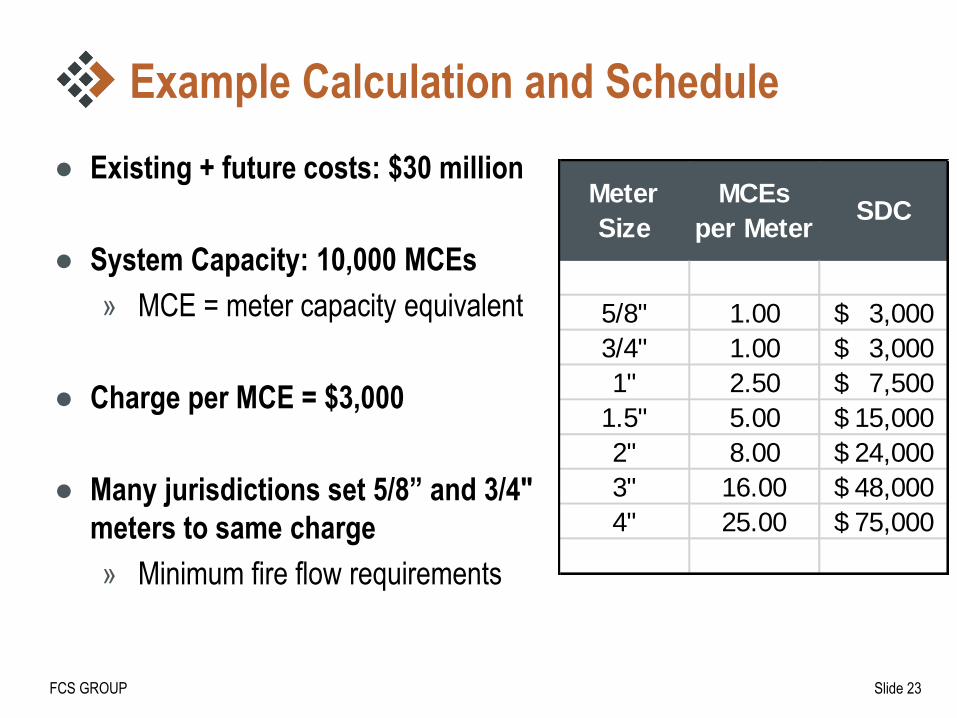
Example Calculation and Schedule
● Existing + future costs: $30 million
● System Capacity: 10,000 MCEs
» MCE = meter capacity equivalent
● Charge per MCE = $3,000
● Many jurisdictions set 5/8” and 3/4"
meters to same charge
» Minimum fire flow requirements
Meter
Size
MCEs
per MeterSDC
5/8" 1.00 3,000$
3/4" 1.00 3,000$
1" 2.50 7,500$
1.5" 5.00 15,000$
2" 8.00 24,000$
3" 16.00 48,000$
4" 25.00 75,000$

Slide 24FCS GROUP
Fiscal Policies

Slide 25FCS GROUP
Reserve & Debt Policies
● Help weather financial risk and disruptions
● Make consistent financial and rate decisions
● Can help stabilize rates over time
● Debt is useful; don’t over-rely on debt
● Make decisions once versus ad-hoc
● Implement immediately or phase in?
Documentation
of Policies is
Ideal!

Slide 26FCS GROUP
Example Financial Policies
Policy Purpose Policy Examples
Operating ReserveAccommodate variations in revenue &
expenses
Water = 90 days O&M
Sewer = 45-90 days O&M
Storm = 30 days O&M
Capital ReserveEmergency repairs, unanticipated capital, &
project cost overruns
1-2% of capital assets; or
Critical asset reserve
Total Cash on HandMaintain credit worthiness for future debt
needs180 days of O&M
Rate Funded Capital Annual rate funded capital mechanismAnnual depreciation;
Average R&R capital spending
Debt Service
Coverage
Compliance with existing debt covenants;
Maintain credit worthiness
Target 2.0 or higher;
Minimum 1.25
Slide 27FCS GROUP
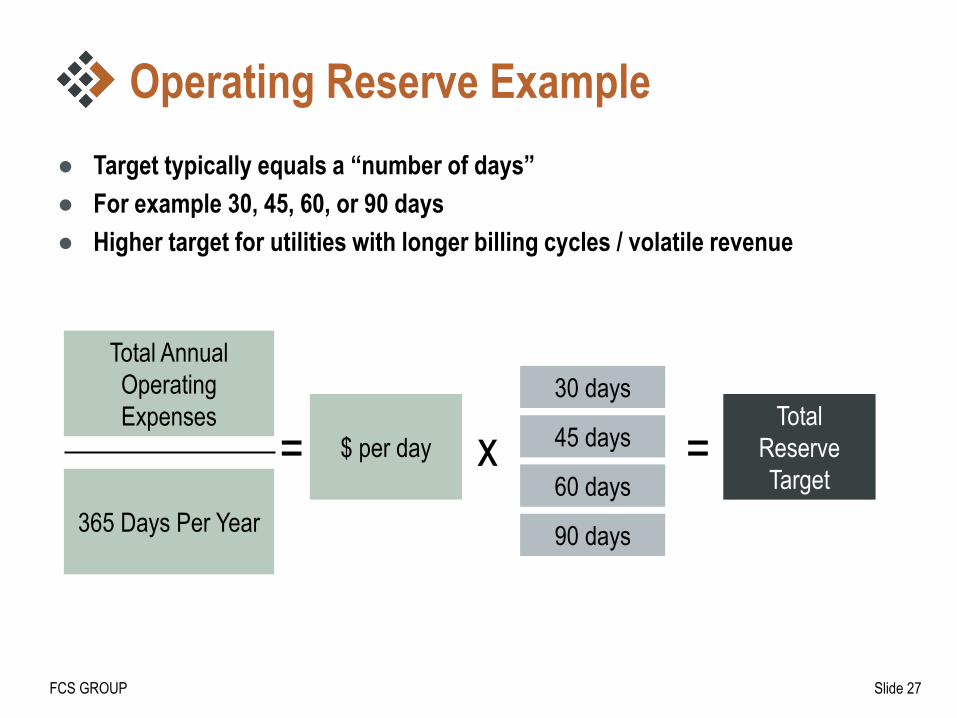
Operating Reserve Example
● Target typically equals a “number of days”
● For example 30, 45, 60, or 90 days
● Higher target for utilities with longer billing cycles / volatile revenue
Total Annual
Operating
Expenses
365 Days Per Year
$ per day
30 days
45 days
60 days
90 days
Total
Reserve
Target= x =

Slide 28FCS GROUP
Capital Reserve Target Based on Fixed Assets
Asset Group Original Cost
Supply/Treatment $20,000,000
Storage $2,000,000
Transmission &
Distribution$12,000,000
General Plant $1,000,000
Total $35,000,000
Note: Capital reserve target grows as utility adds assets
1% of fixed assets
$350,000
2% of fixed assets
$700,000
Slide 28

Slide 29FCS GROUP
Total Days Cash on Hand Example
Debt
Rating
Target
Aaa Aa A
Days Cash
on Hand> 250 days
250 days ≥ n >
150 days
150 days ≥ n > 35
days
Source: Moody’s Approach to Local Government Credit Analysis; February 2019
● Days cash on hand is a key metric for bond rating agencies

Slide 30FCS GROUP
Debt Service Coverage Ratio
● Bond rating agencies look favorably on coverage ratios > 2.0x
● Important to show that utilities can maintain that coverage ratio
» Rating agencies like to see a multi-year rate plan
● Net operating revenue can sometimes include connection charge revenue
Net Operating Revenue
Parity Bond Debt
Service
Coverage Ratio=

Slide 31FCS GROUP
Revenue Requirement
Slide 32FCS GROUP
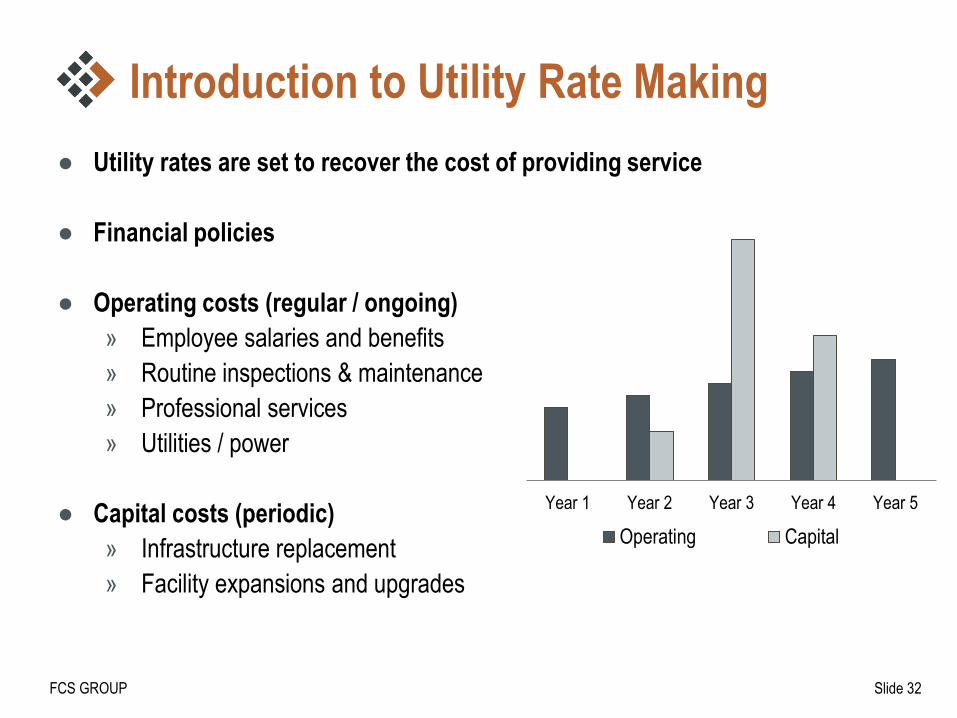
Introduction to Utility Rate Making
● Utility rates are set to recover the cost of providing service
● Financial policies
● Operating costs (regular / ongoing)
» Employee salaries and benefits
» Routine inspections & maintenance
» Professional services
» Utilities / power
● Capital costs (periodic)
» Infrastructure replacement
» Facility expansions and upgrades
Year 1 Year 2 Year 3 Year 4 Year 5
Operating Capital

Slide 33FCS GROUP
Overview of Revenue Requirement
Revenue Requirement
Operating & Maintenance
+ Debt Service
+ Rate Funded Capital
= Revenue Requirement
- Miscellaneous Revenue
= Revenue Required from Rates
• Historical trends?
• Customer growth?
• Annexation?
• Seasonality?
• Current year budget + inflation?
• Increasing service levels?
• Vacancies?
• O&M increases due to capital program?
• Cost efficiencies?
• What about fund balance?
Slide 34FCS GROUP
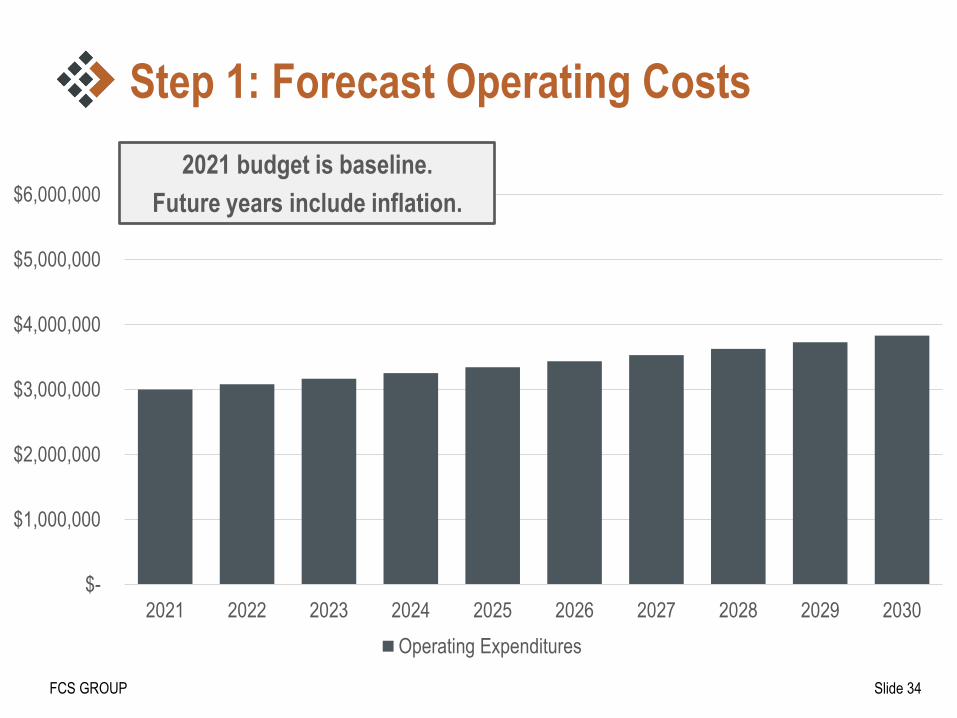
Step 1: Forecast Operating Costs
$-
$1,000,000
$2,000,000
$3,000,000
$4,000,000
$5,000,000
$6,000,000
2021 2022 2023 2024 2025 2026 2027 2028 2029 2030
Operating Expenditures
2021 budget is baseline.
Future years include inflation.

Slide 35FCS GROUP
Step 2: Add Existing Debt Obligations
$-
$1,000,000
$2,000,000
$3,000,000
$4,000,000
$5,000,000
$6,000,000
2021 2022 2023 2024 2025 2026 2027 2028 2029 2030
Operating Expenditures Existing Debt Service
Layer on existing debt service

Slide 36FCS GROUP
Step 3: Obligations vs. Existing Rates
$-
$1,000,000
$2,000,000
$3,000,000
$4,000,000
$5,000,000
$6,000,000
2021 2022 2023 2024 2025 2026 2027 2028 2029 2030
Operating Expenditures Existing Debt Service Current Revenue
Revenues @ existing rates cover
current obligations…but not for long.
Slide 37FCS GROUP
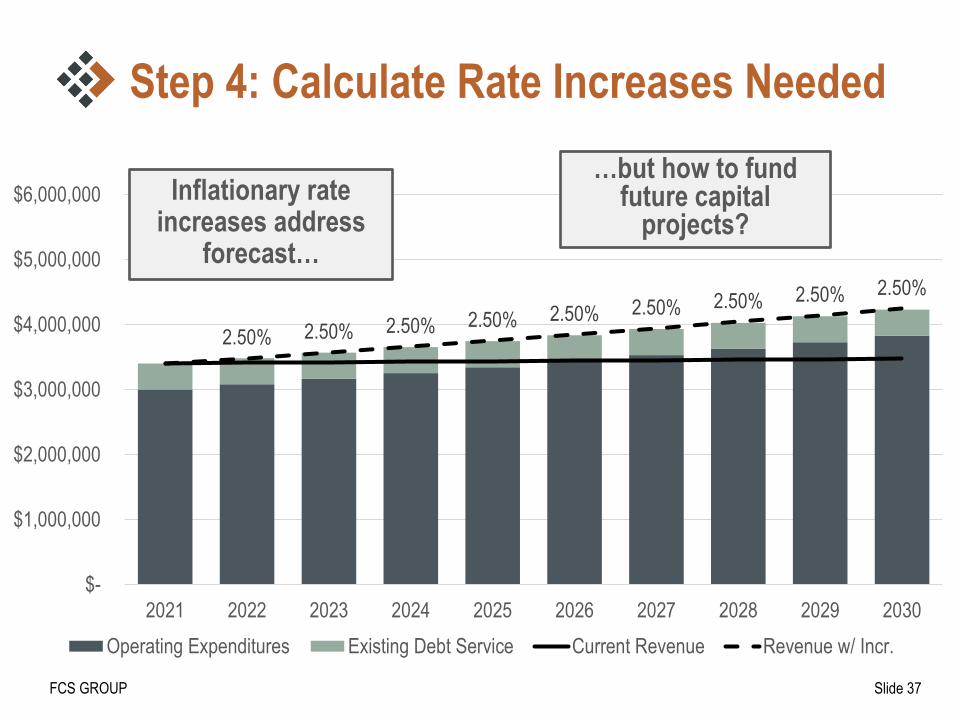
Step 4: Calculate Rate Increases Needed
2.50% 2.50% 2.50% 2.50% 2.50% 2.50% 2.50% 2.50% 2.50%
$-
$1,000,000
$2,000,000
$3,000,000
$4,000,000
$5,000,000
$6,000,000
2021 2022 2023 2024 2025 2026 2027 2028 2029 2030
Operating Expenditures Existing Debt Service Current Revenue Revenue w/ Incr.
Inflationary rate increases address
forecast…
…but how to fund future capital
projects?

Slide 38FCS GROUP
Forecasting Tips for Capital Costs
● Year(s) of construction?
● Cost estimates current or escalated?
● Tackle high-priority capital projects first
✓ Right project
✓ Right time
✓ Right reason

Slide 39FCS GROUP
Capital Funding Hierarchy
Grants
Connection charges
Annual rate revenues
Cash reserves
Low-cost state loans
Revenue bonds
Less
Costly to
Utility
More
Costly to
Utility

Slide 40FCS GROUP
Capital Funding Philosophy
• Higher near-term rates
• Existing customers pay 100% of costsCash (pay-as-you-go)
• Lowest near-term rates…but interest cost
• Spreads cost between existing / future customers
Debt Financing
• Cash fund repair and replacement projects
• Debt fund large expansion projectsHybrid
Slide 41FCS GROUP
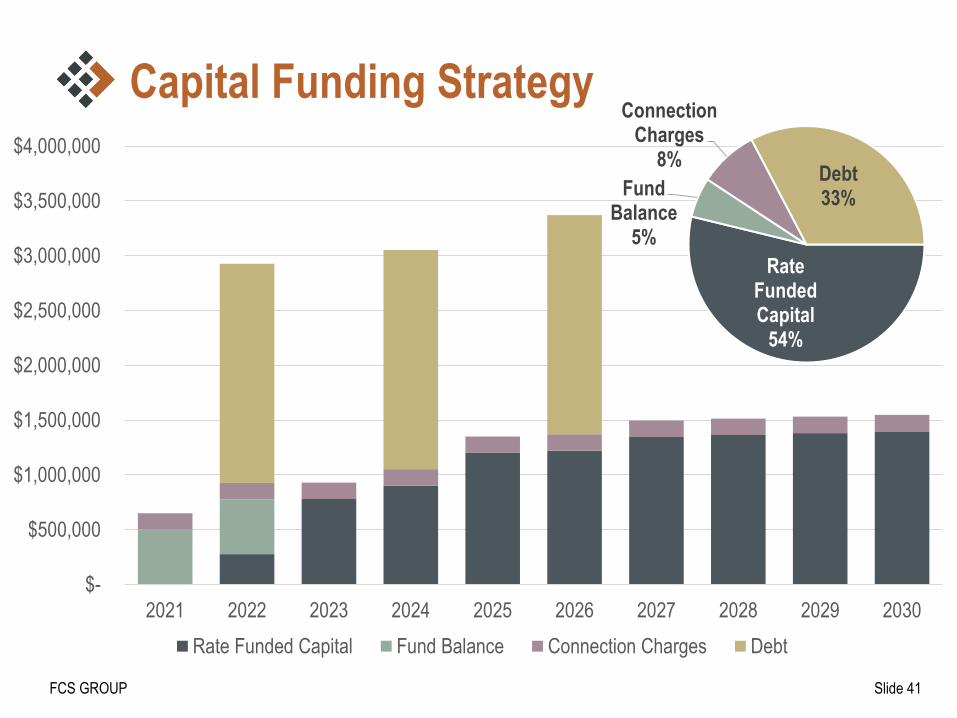
Capital Funding Strategy
$-
$500,000
$1,000,000
$1,500,000
$2,000,000
$2,500,000
$3,000,000
$3,500,000
$4,000,000
2021 2022 2023 2024 2025 2026 2027 2028 2029 2030
Rate Funded Capital Fund Balance Connection Charges Debt
Rate Funded Capital
54%
Fund Balance
5%
Connection Charges
8%Debt33%
Slide 42FCS GROUP
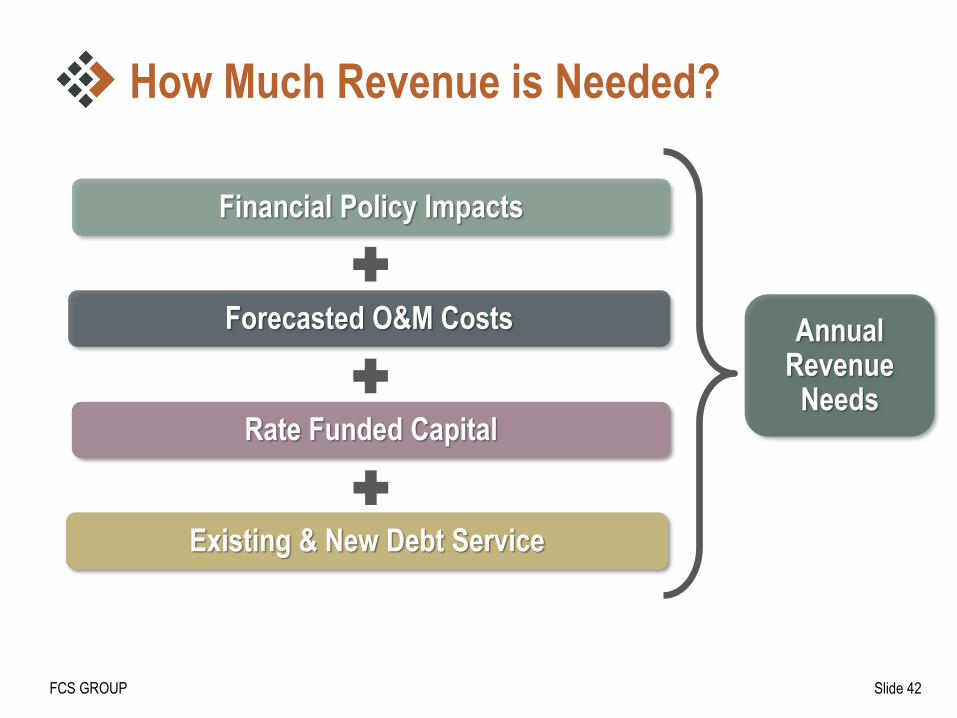
How Much Revenue is Needed?
Financial Policy Impacts
Existing & New Debt Service
Forecasted O&M Costs
Rate Funded Capital
Annual Revenue
Needs

Slide 43FCS GROUP
Step 5: Revenue Requirement
15.00%
15.00%8.00%
8.00%5.00%
4.00% 2.00% 2.00% 2.00%
$-
$1,000,000
$2,000,000
$3,000,000
$4,000,000
$5,000,000
$6,000,000
2021 2022 2023 2024 2025 2026 2027 2028 2029 2030
Operating Expenditures Existing Debt Service New Debt Service
Rate Funded Capital Current Revenue Revenue w/ Incr.
No Rate Funded
Capital
Phase-in Rate
Funded Capital
Borrowing + Rate
Funded Capital Help
to Fund Capital Plan
Slide 44FCS GROUP
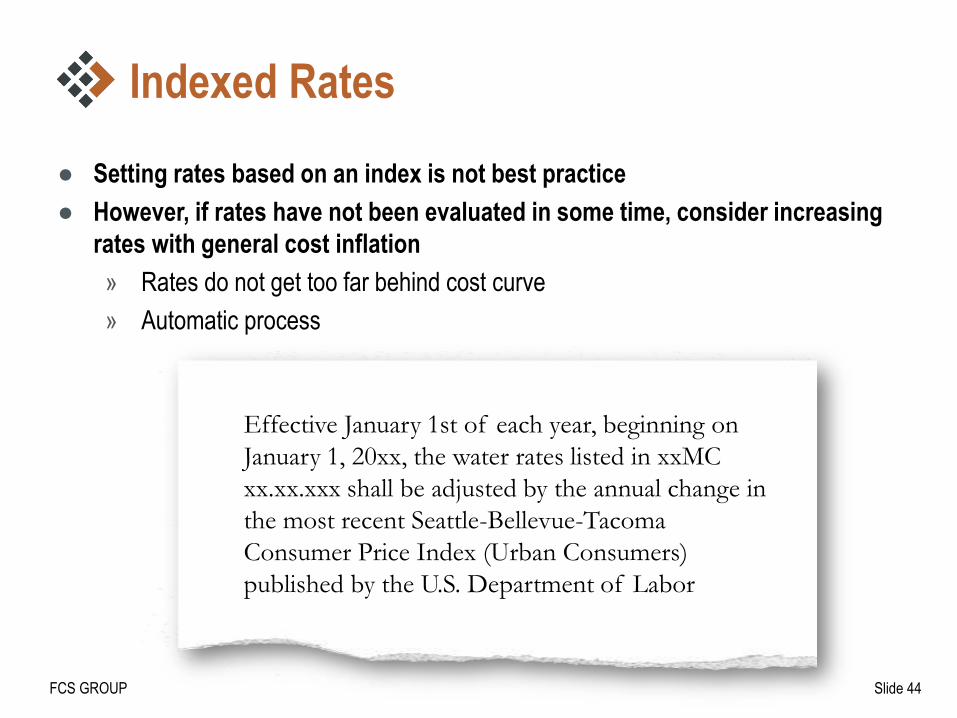
Indexed Rates
● Setting rates based on an index is not best practice
● However, if rates have not been evaluated in some time, consider increasing
rates with general cost inflation
» Rates do not get too far behind cost curve
» Automatic process
Effective January 1st of each year, beginning on
January 1, 20xx, the water rates listed in xxMC
xx.xx.xxx shall be adjusted by the annual change in
the most recent Seattle-Bellevue-Tacoma
Consumer Price Index (Urban Consumers)
published by the U.S. Department of Labor

Slide 45FCS GROUP
When Should I Do a Cost-of-Service Analysis?
Do you serve
different classes, or
outside boundary?
Cost-of-Service Analysis
Recommended
Are the other
classes
substantial?
Basic Financial Plan
Yes No
Yes
No
Slide 46FCS GROUP
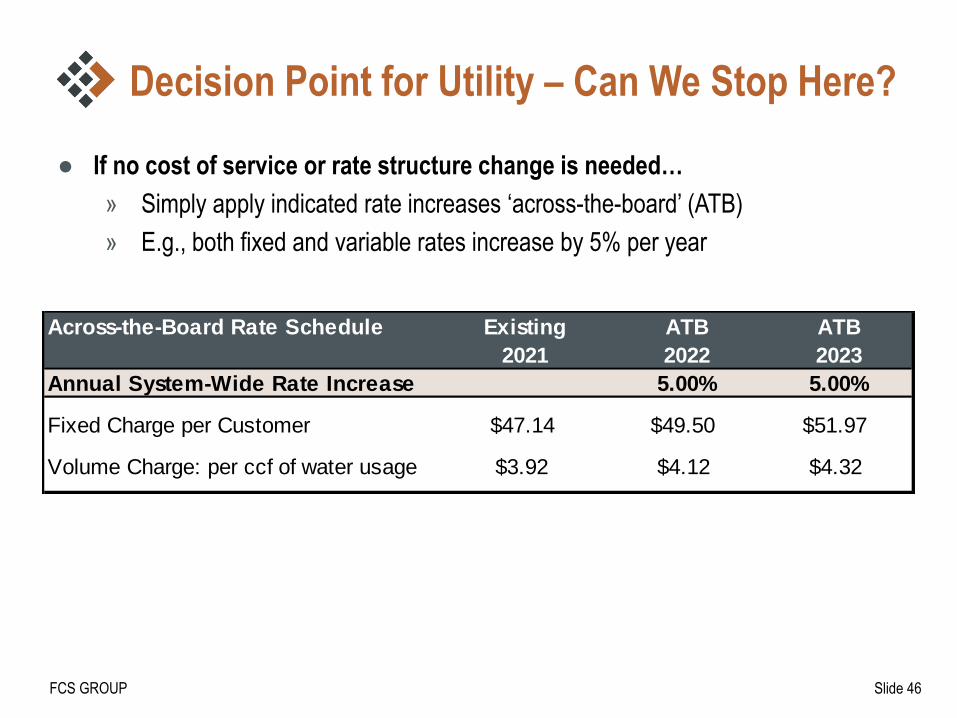
Decision Point for Utility – Can We Stop Here?
● If no cost of service or rate structure change is needed…
» Simply apply indicated rate increases ‘across-the-board’ (ATB)
» E.g., both fixed and variable rates increase by 5% per year
Across-the-Board Rate Schedule Existing ATB ATB
2021 2022 2023
Annual System-Wide Rate Increase 5.00% 5.00%
Fixed Charge per Customer $47.14 $49.50 $51.97
Volume Charge: per ccf of water usage $3.92 $4.12 $4.32

Slide 47FCS GROUP
Cost of Service

Slide 48FCS GROUP
How Will Costs Be Equitably Distributed?
Revenue requirement: How big is the pie?
Cost of service: How should the pie be sliced?

Slide 50FCS GROUP
• Typically largest customer group
• Relatively low usage per unit
• High peak demand
• Lowest fire flow requirement; domestic sewer strength
Single Family Residential (SFR)
• Lower usage per dwelling unit
• Usually master metered
• Relatively constant use
• Domestic sewer strength
Multi-family Residential (MFR)
• Diversity in use per account
• Can have relatively constant use
• Highest fire flow requirement
• Varying sewer strength
Commercial / Industrial
• Often smallest customer classes in terms of accounts
• Majority of use in peak season
• No fire flow requirement
• Economic sensitivity
Parks, Irrigation, & Agriculture
Sample Customer Classes

Slide 51FCS GROUP
Sample Customer Class Usage

Slide 53FCS GROUP
Cost of Service Analysis (Water)
Allocate Costs by Function
Revenue Requirement
CustomerMeters &
Services
Base
Capacity
Peak
Capacity
Fire
Protection
Water
Allocate Costs to Customer Classes
Single Family Multi Family Commercial

Slide 55FCS GROUP
Cost of Service - Cost Allocation Example
● Commercial customers
» 9% of accounts but 42% of annual consumption
Customer Costs 146,421$
Allocation Basis
Customer Classes Accounts % Share Allocated Cost
Cost per
Account per
Month
Residential 6,951 87.8% 128,506$ $1.54
Multi-Family 221 2.8% 4,092$ $1.54
Commercial 748 9.4% 13,824$ $1.54
TOTAL 7,920 100.0% 146,421$ $1.54
Base Demand 2,651,532$
Allocation Basis
Customer ClassesTotal Annual
Usage% Share Allocated Cost
Cost per
Account per
Month
Residential 54,388,376 53.4% 1,415,132$ $16.97
Multi-Family 4,750,251 4.7% 123,597$ $46.54
Commercial 42,768,841 42.0% 1,112,803$ $124.01
TOTAL 101,907,469 100.0% 2,651,532$ $27.90

Slide 56FCS GROUP
Redistribution of Cost Recovery
● Cost-of-service analysis identifies how costs should be equitably distributed
among customer classes
● In this case, multi-family was subsidizing other classes
ClassExisting 2021
Structure
Cost of
Service 2021
Structure
$ Difference % Difference
Residential 2,385,537$ 2,420,192$ 34,655$ 1.5%
Multi-Family 247,999 187,428 (60,571) -24.4%
Commercial 1,669,490 1,695,406 25,916 1.6%
Total 4,303,027$ 4,303,027$ -$ 0.0%
Slide 57FCS GROUP
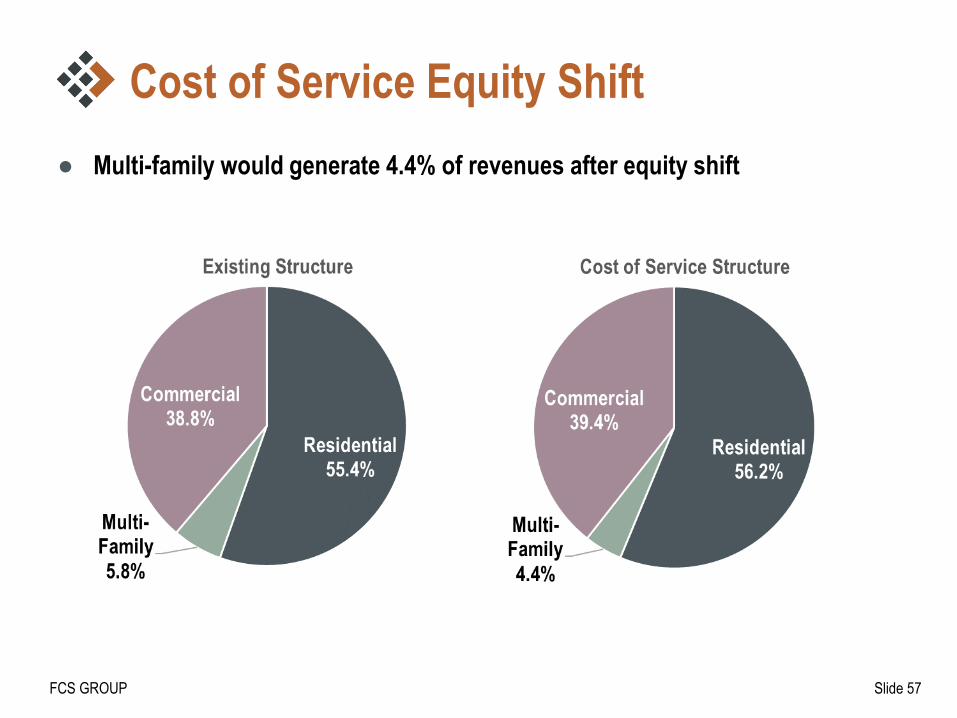
Cost of Service Equity Shift
● Multi-family would generate 4.4% of revenues after equity shift

Slide 58FCS GROUP
Rate Design

Slide 59FCS GROUP
Rate Design = Revenue Collection
● Main goal is to recover target level of revenue
● Primary communication tool with customers
● Typically fixed and/or variable charges

Slide 60FCS GROUP
Do Rate Structures Align with Your Objectives?
Example Rate Structure GoalsSample
Rank
Financial Sustainability• Sufficient & predictable revenues
• Stable and predictable impacts to customers1
Conservation and
Efficiency
• Promote conservation and efficiency of use
• Protect natural resources2
Transparency and
Simplicity
• Easy to understand, explain and administer
• Compatible with billing system3
Fairness and Equity
• Correlate rates with costs
• Reflect customer usage patterns
• Reflect other customer service requirements
4
Affordability • Provide affordable water to “lifeline” users 5
Slide 61FCS GROUP
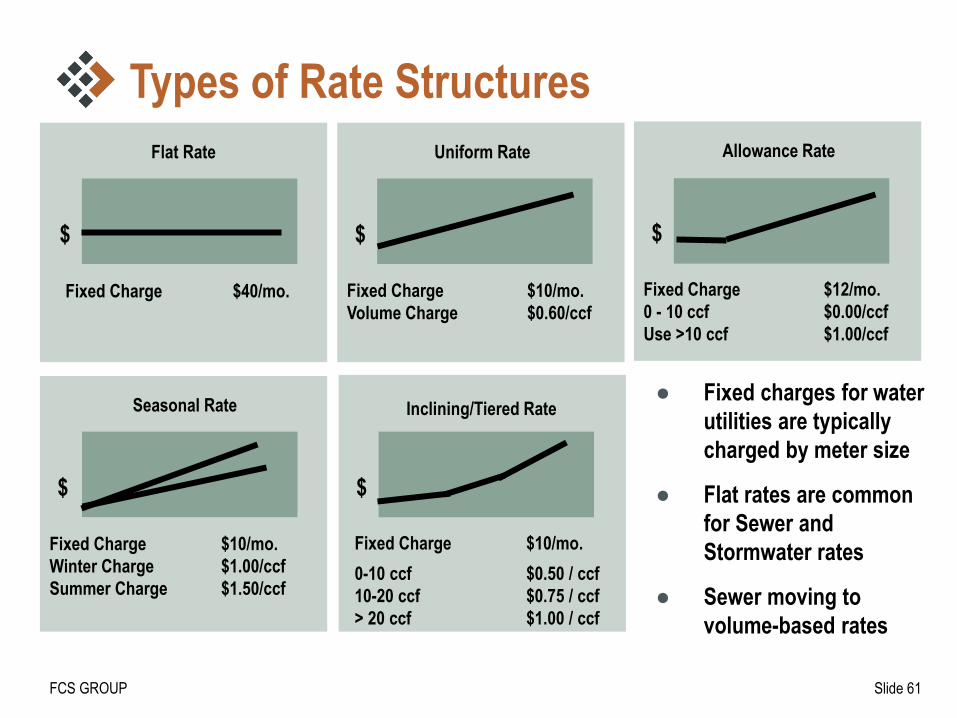
Types of Rate Structures
Fixed Charge $40/mo.
$
Flat Rate
$
Uniform Rate
$
Inclining/Tiered Rate
Fixed Charge $10/mo.
Volume Charge $0.60/ccf
Fixed Charge $10/mo.
0-10 ccf $0.50 / ccf
10-20 ccf $0.75 / ccf
> 20 ccf $1.00 / ccf
$
Allowance Rate
Fixed Charge $12/mo.
0 - 10 ccf $0.00/ccf
Use >10 ccf $1.00/ccf
● Fixed charges for water
utilities are typically
charged by meter size
● Flat rates are common
for Sewer and
Stormwater rates
● Sewer moving to
volume-based rates
$
Seasonal Rate
Fixed Charge $10/mo.
Winter Charge $1.00/ccf
Summer Charge $1.50/ccf

Slide 62FCS GROUP
Communication with
Decision Makers

Slide 63FCS GROUP
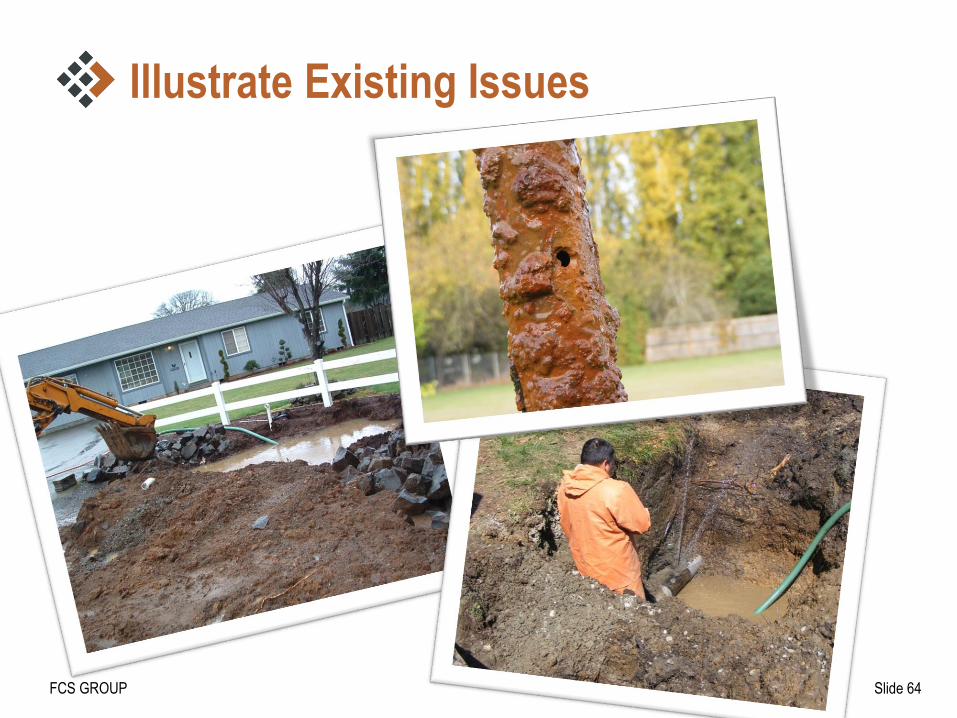
Illustrate Existing Issues
Bottom of Pipe
Eroded Away
Collapsing
Pipes
Joint Separation
Slide 64FCS GROUP
Illustrate Existing Issues

Slide 65FCS GROUP
Illustrate Existing Issues

Slide 66FCS GROUP
Illustrate Existing Issues
● City’s sewer system needs routine maintenance
Slide 67FCS GROUP
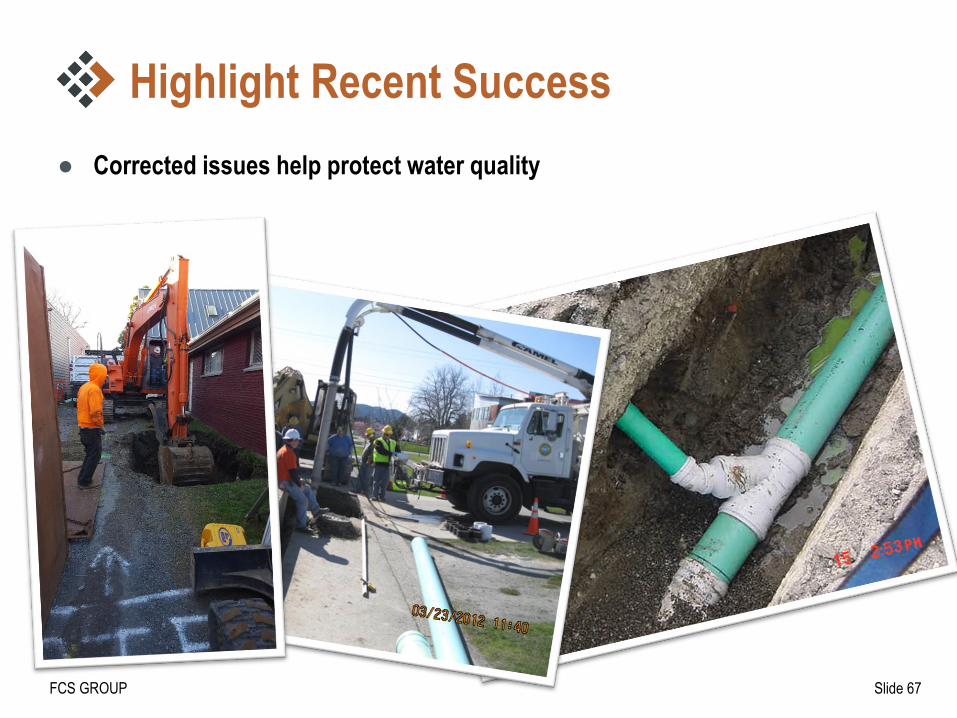
Highlight Recent Success
● Corrected issues help protect water quality

Slide 68FCS GROUP
Highlight Recent Success
Water Tank Improvement Pro jec t
BEFORE

Slide 69FCS GROUP
Highlight To Do List
Corrosion Control

Slide 70FCS GROUP
Age of Pipes in City System
● Every pipe
shown in
either red or
purple (55
miles) is
already over
50 years old
● A pipe
replacement
program can
be phased in
gradually, but
we shouldn’t
just ignore it

Slide 71FCS GROUP
Level of Service Options (Storm)High Priority
Medium Priority
Single Family
Annual Rate
Existing
2018 Rate
Options for
2019 Rate
LOS 1: Correct Operating Deficit $125 +$42
LOS 2: Staff / Supplies to Meet NPDES Req. n/a +$33
LOS 3: High Priority Capital n/a +$20
LOS 4: Medium Priority Capital n/a +$32
Grand Total $125 $252

Slide 72FCS GROUP
– 8% scenario: higher increases but no debt
Provide Scenarios for Decision Makers
Variable 6% Scenario 7% Scenario 8% Scenario
Annual Increases 6% per year 7% per year 8% per year
Debt Needed $2.75 million $1.25 million n/a
Rate Funded Capital$1.1 million
(45% of avg. CIP)
$1.6 million
(65% of avg. CIP)
$2.1 million
(85% of avg. CIP)
Single Family Bill (end of
study period)$70 $75 $80

Slide 73FCS GROUP
Single-Family Monthly Stormwater Rates
$0
$5
$10
$15
$20
$25
$30
$35
Mon
thly
SF
Rat
e
Eastern Washington Western Washington

Slide 74FCS GROUP
Public Communication
Slide 75FCS GROUP
Traditional Public Communication
● Greater public scrutiny
» Requires public engagement, education, and transparency
● Traditional options
» Open house
» Rate advisory committee
» Bill calculators
» Frequently asked questions (FAQs)
» Newsletters
» Bill stuffers / notices
● Technology Creates New Opportunities

Slide 76FCS GROUP
News Releases / Website Interaction
Single Family
.75"
2,400 cf
1
SELECT YOUR INFORMATION:
Customer Type
Meter Size
Monthly Usage (cf)*
Number of Units in Building
-$2.04
Change in your
monthly bill:
*1 cf = 7.48 gallons; the average single family home in Moses Lake uses
1,800 cf per month.
$37.97 $36.86
$44.17 $43.24
$82.14 $80.10
$-
$10.00
$20.00
$30.00
$40.00
$50.00
$60.00
$70.00
$80.00
$90.00
Existing Monthly Rate Proposed 2022 Monthly Rate
Monthly Bill Impact
Sewer Water Average SF

Slide 77FCS GROUP
YouTube Educational Videos

Slide 78FCS GROUP
Social Media
● Reach more customers
● Get message out quickly

Slide 79FCS GROUP
Easy to Understand Newsletters

Slide 80FCS GROUP
Informative Articles

Slide 81FCS GROUP
Summary
Rate Study Components
Financial Policy
Evaluation
Revenue Requirement
Forecast
Cost-of-Service
AnalysisRate Design
Communication
Plan
Are you charging
your customers
equitably?
Are your revenues
sufficient to
achieve full cost
recovery?
Are you adequately
protected against
financial risks?
What level of
communication is
needed?
Do your rate
structures align with
your objectives?
Your challenges
and priorities
determine the
steps to complete!
Slide 82FCS GROUP
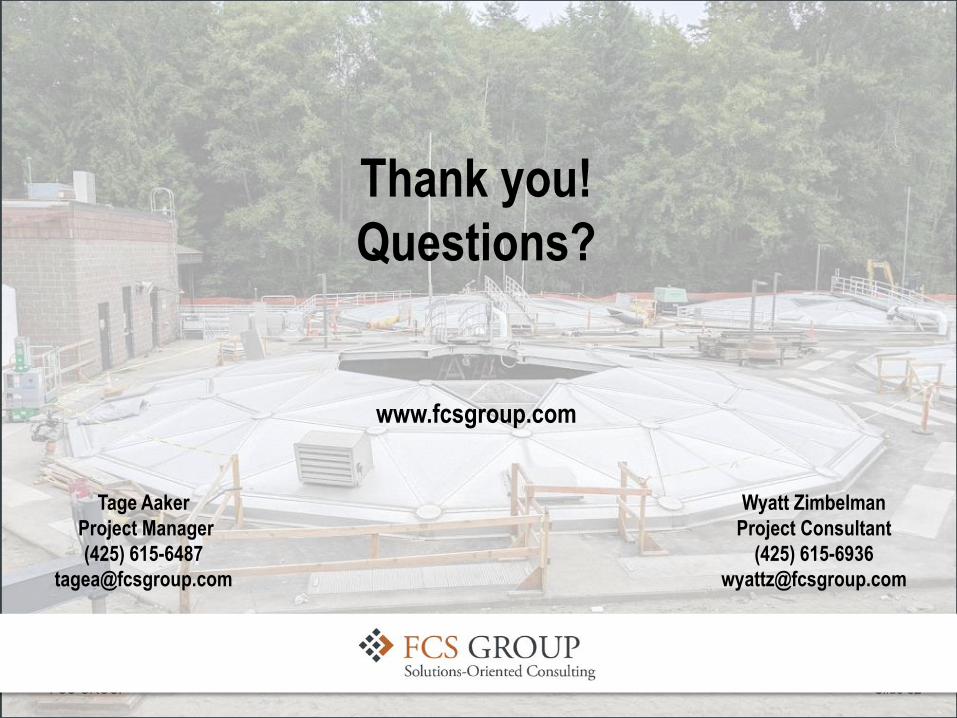
Thank you!
Questions?
www.fcsgroup.com
Tage Aaker
Project Manager
(425) 615-6487
Wyatt Zimbelman
Project Consultant
(425) 615-6936