rates: canada outright - nbc
TRANSCRIPT
Rates: Canada Outright
Key Does it Size of move 10D BEFORE 1-Jun (2010-18) (bps) Consistency (2010-18) Vs equivalent Historical location (%)
metric work? Mean Median Max Min # out of 9 2018 1-Dec effect T-17D avg 9-May-19
CAN 2Y yld Pretty well -8.5 -7.4 6.3 -32.7 6 yrs Yes More pronounced 1.18 1.58
CAN 5Y yld Pretty well -10.5 -10.3 10.8 -34.4 6 yrs Yes More pronounced 1.63 1.56
CAN 10Y yld Pretty well -9.7 -8.0 13.1 -25.6 7 yrs Yes More pronounced 2.21 1.69
CAN 30Y yld Pretty well -8.9 -10.5 7.6 -21.4 7 yrs Yes More pronounced 2.70 1.93
Rates: Canada Curve
Key Does it Size of move 10D BEFORE 1-Jun (2010-18) (bps) Consistency (2010-18) Vs equivalent Historical location (bps)
metric work? Mean Median Max Min # out of 9 2018 1-Dec effect T-17D avg 9-May-19
CAN 2s5s Pretty well -2.0 -1.7 4.5 -6.9 7 yrs Yes More pronounced 45.3 -2.2
CAN 2s10s Pretty well -1.1 -0.7 7.1 -12.5 7 yrs Yes Less pronounced 103.2 10.7
CAN 2s30s So so -0.4 -1.8 11.7 -10.1 6 yrs Yes Less pronounced 152.1 35.1
CAN 5s10s Not really 0.9 0.1 8.8 -6.0 4 yrs Yes Less pronounced 57.8 12.9
CAN 5s30s A little bit 1.6 -1.4 15.2 -5.1 6 yrs Yes Less pronounced 106.8 37.3
CAN 10s30s Not really 0.7 -0.1 8.7 -5.5 5 yrs No Less pronounced 48.9 24.4
Rates: Canada vs UST
Key Does it Size of move 10D BEFORE 1-Jun (2010-18) (bps) Consistency (2010-18) Vs equivalent Historical location (bps)
metric work? Mean Median Max Min # out of 9 2018 1-Dec effect T-17D avg 9-May-19
CAN-US 2Y Pretty well -8.4 -5.6 1.0 -28.0 7 yrs Yes More pronounced 35.2 -68.6
CAN-US 5Y Almost always -7.1 -6.1 3.4 -21.7 8 yrs Yes More pronounced 0.3 -69.9
CAN-US 10Y Pretty well -1.8 -2.3 3.3 -8.4 6 yrs Yes Less pronounced -25.4 -77.5
CAN-US 30Y A little bit -0.7 -0.9 7.7 -7.0 5 yrs Yes Less pronounced -60.5 -95.2
Source: NBF, Bloomberg
NBF's null hypothesis
Pre 1-Jun comment
Post 1-Jun performance note
2019 considerations
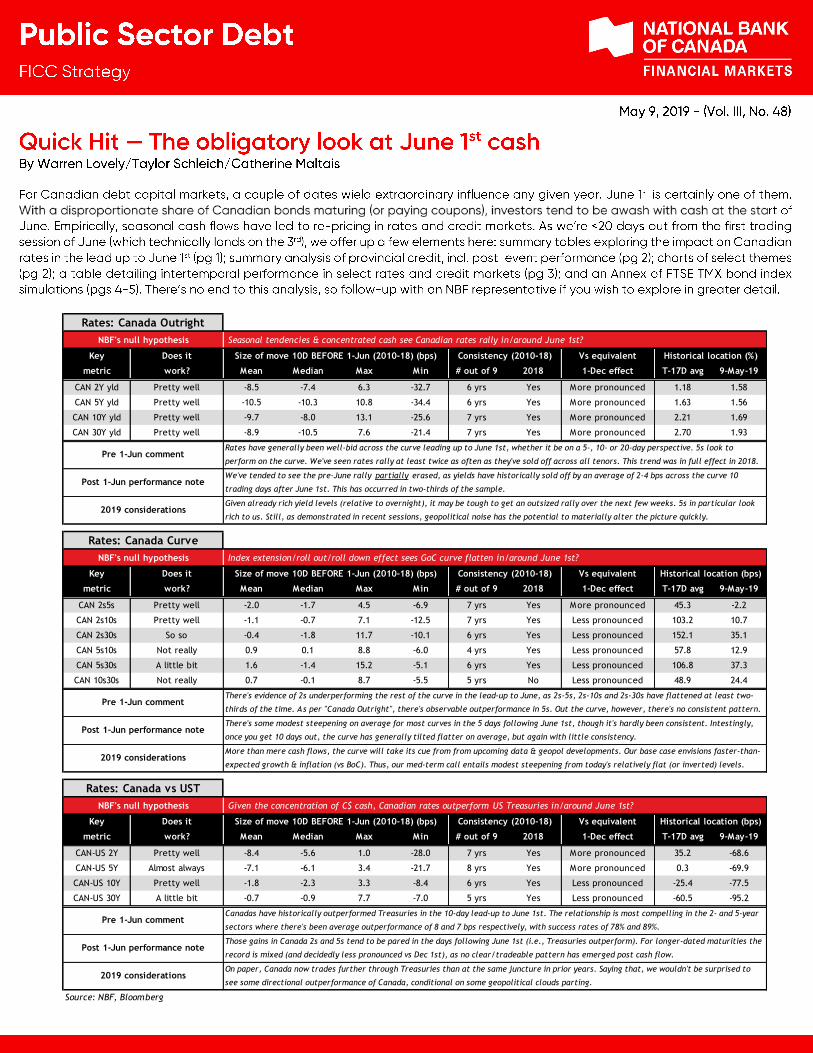
Rates have generally been well-bid across the curve leading up to June 1st, whether it be on a 5-, 10- or 20-day perspective. 5s look to
perform on the curve. We've seen rates rally at least twice as often as they've sold off across all tenors. This trend was in full effect in 2018.
We've tended to see the pre-June rally partially erased, as yields have historically sold off by an average of 2-4 bps across the curve 10
trading days after June 1st. This has occurred in two-thirds of the sample.
Given already rich yield levels (relative to overnight), it may be tough to get an outsized rally over the next few weeks. 5s in particular look
rich to us. Still, as demonstrated in recent sessions, geopolitical noise has the potential to materially alter the picture quickly.
Seasonal tendencies & concentrated cash see Canadian rates rally in/around June 1st?
NBF's null hypothesis
Pre 1-Jun comment
Post 1-Jun performance note
Index extension/roll out/roll down effect sees GoC curve flatten in/around June 1st?
There's evidence of 2s underperforming the rest of the curve in the lead-up to June, as 2s-5s, 2s-10s and 2s-30s have flattened at least two-
thirds of the time. As per "Canada Outright", there's observable outperformance in 5s. Out the curve, however, there's no consistent pattern.
There's some modest steepening on average for most curves in the 5 days following June 1st, though it's hardly been consistent. Intestingly,
once you get 10 days out, the curve has generally tilted flatter on average, but again with little consistency.
2019 considerations
NBF's null hypothesis
Pre 1-Jun comment
Given the concentration of C$ cash, Canadian rates outperform US Treasuries in/around June 1st?
Canadas have historically outperformed Treasuries in the 10-day lead-up to June 1st. The relationship is most compelling in the 2- and 5-year
sectors where there's been average outperformance of 8 and 7 bps respectively, with success rates of 78% and 89%.
More than mere cash flows, the curve will take its cue from from upcoming data & geopol developments. Our base case envisions faster-than-
expected growth & inflation (vs BoC). Thus, our med-term call entails modest steepening from today's relatively flat (or inverted) levels.
Post 1-Jun performance note
2019 considerations
Those gains in Canada 2s and 5s tend to be pared in the days following June 1st (i.e., Treasuries outperform). For longer-dated maturities the
record is mixed (and decidedly less pronounced vs Dec 1st), as no clear/tradeable pattern has emerged post cash flow.
On paper, Canada now trades further through Treasuries than at the same juncture in prior years. Saying that, we wouldn't be surprised to
see some directional outperformance of Canada, conditional on some geopolitical clouds parting.
Provincial credit
Key Does it Size of move 10D BEFORE 1-Jun (2010-18) (bps) Consistency (2010-18) Vs equivalent Historical location (bps)
metric work BEFORE? Mean Median Max Min # out of 9 2018 1-Dec effect T-17D avg 9-May-19
ONT 10Y Not really 1.1 1.0 4.0 -1.0 3 yrs No Less pronounced 82.6 76.0
ONT 30Y So so 0.1 0.0 2.0 -1.5 4 yrs No Less pronounced 91.3 86.0
ONT 10s30s Pretty well -1.0 -0.6 0.0 -3.0 8 yrs Yes More pronounced 8.8 10.0
US IG CDX 5Y* - 0.1 0.5 7.8 -6.4 3 yrs No Less pronounced 73.1 63.1
Key Does it Size of move 10D AFTER 1-Jun (2010-18) (bps) Consistency (2010-18) Vs equivalent
metric work AFTER? Mean Median Max Min # out of 9 2018 1-Dec effect
ONT 10Y Not really 0.1 0.0 5.0 -3.0 3 yrs Yes More pronounced - -
ONT 30Y Not really 0.5 0.0 5.0 -2.0 2 yrs No Less pronounced - -
ONT 10s30s Not really 0.4 0.0 1.0 -0.1 2 yrs No Less pronounced - -
US IG CDX 5Y* - 0.3 -0.1 7.9 -8.4 4 yrs Yes More pronounced - -
Note: US IG CDX data cover 2012-18; ONT spreads are b'mark bonds vs GoC | Source: NBF, Bloomberg
NBF's null hypothesis Index extension/roll out/roll down effect see provincial credit spreads tighten & credit curves flatten in/around June 1st?
BEFO
RE 1
-Jun
AFTER 1
-Jun
Pre 1-Jun comment
Post 1-Jun performance note
2019 considerations
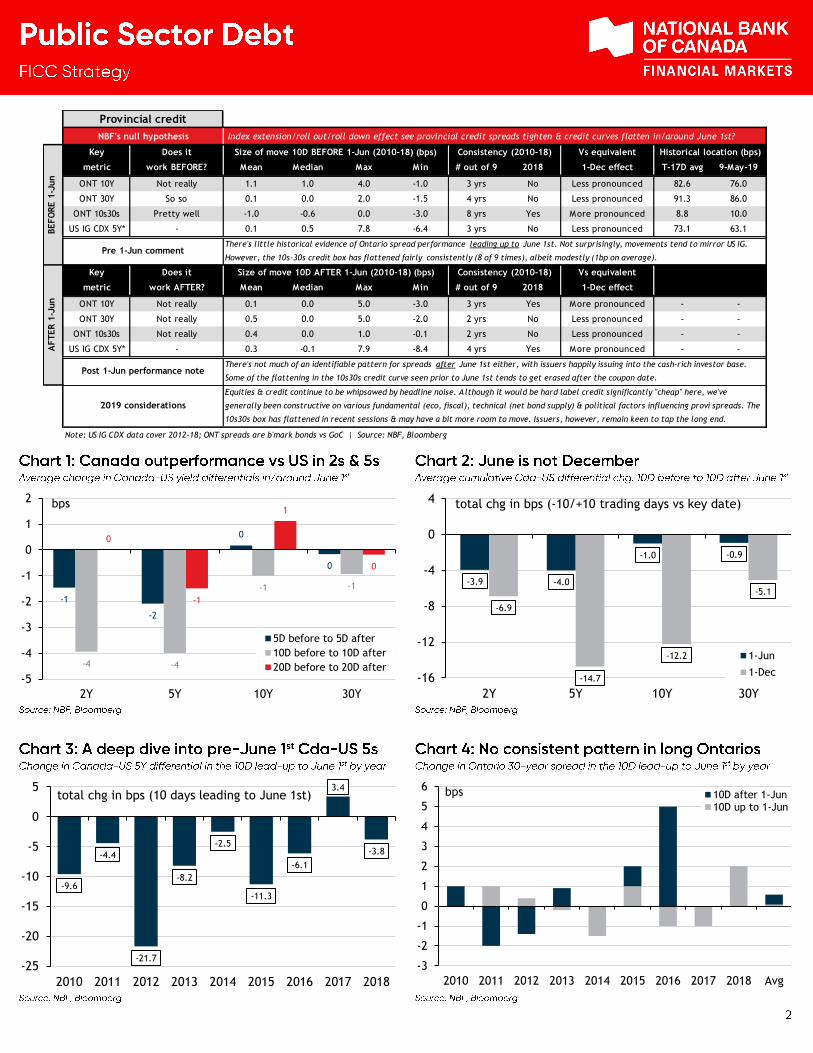
There's little historical evidence of Ontario spread performance leading up to June 1st. Not surprisingly, movements tend to mirror US IG.
However, the 10s-30s credit box has flattened fairly consistently (8 of 9 times), albeit modestly (1bp on average).
There's not much of an identifiable pattern for spreads after June 1st either, with issuers happily issuing into the cash-rich investor base.
Some of the flattening in the 10s30s credit curve seen prior to June 1st tends to get erased after the coupon date.
Equities & credit continue to be whipsawed by headline noise. Although it would be hard label credit significantly "cheap" here, we've
generally been constructive on various fundamental (eco, fiscal), technical (net bond supply) & political factors influencing provi spreads. The
10s30s box has flattened in recent sessions & may have a bit more room to move. Issuers, however, remain keen to tap the long end.
-1
-2
0
0
-4 -4
-1 -1
0
-1
1
0
-5
-4
-3
-2
-1
0
1
2
2Y 5Y 10Y 30Y
5D before to 5D after
10D before to 10D after
20D before to 20D after
bps
-3.9 -4.0
-1.0 -0.9
-6.9
-14.7
-12.2
-5.1
-16
-12
-8
-4
0
4
2Y 5Y 10Y 30Y
1-Jun
1-Dec
total chg in bps (-10/+10 trading days vs key date)
-9.6
-4.4
-21.7
-8.2
-2.5
-11.3
-6.1
3.4
-3.8
-25
-20
-15
-10
-5
0
5
2010 2011 2012 2013 2014 2015 2016 2017 2018
total chg in bps (10 days leading to June 1st)
-3
-2
-1
0
1
2
3
4
5
6
2010 2011 2012 2013 2014 2015 2016 2017 2018 Avg
10D after 1-Jun10D up to 1-Jun
bps
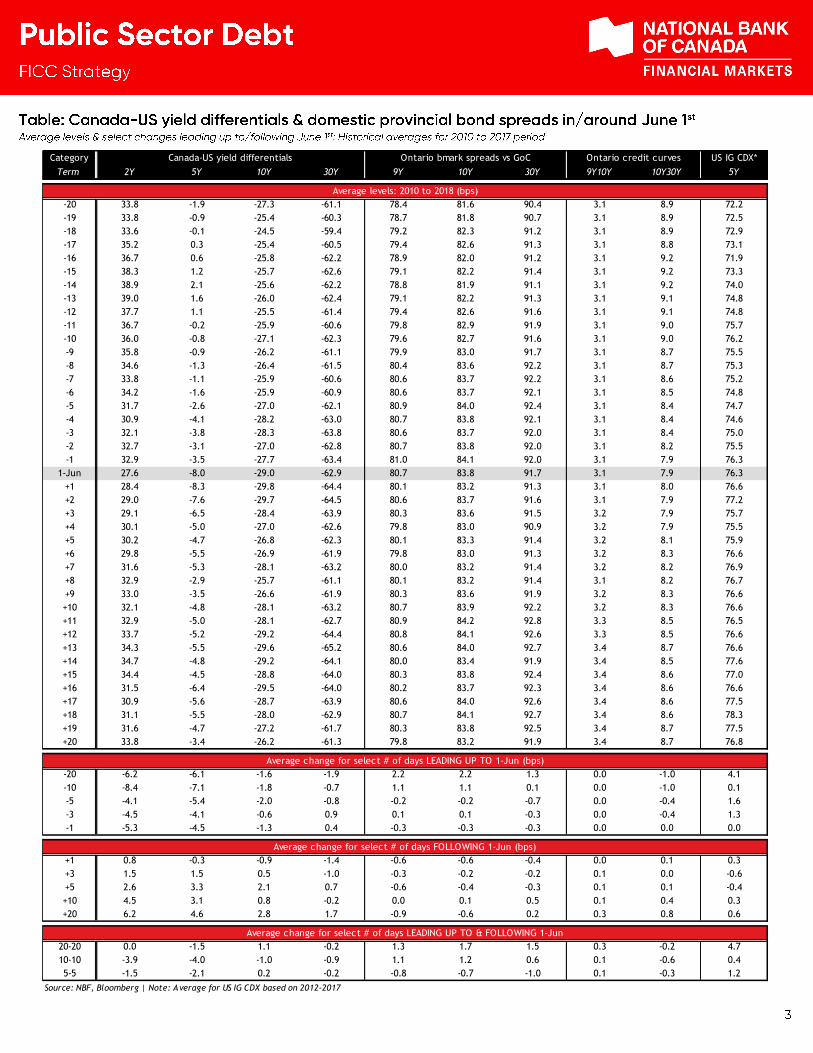
Category Canada-US yield differentials Ontario bmark spreads vs GoC Ontario credit curves US IG CDX*
Term 2Y 5Y 10Y 30Y 9Y 10Y 30Y 9Y10Y 10Y30Y 5Y
Average levels: 2010 to 2018 (bps)
-20 33.8 -1.9 -27.3 -61.1 78.4 81.6 90.4 3.1 8.9 72.2
-19 33.8 -0.9 -25.4 -60.3 78.7 81.8 90.7 3.1 8.9 72.5
-18 33.6 -0.1 -24.5 -59.4 79.2 82.3 91.2 3.1 8.9 72.9
-17 35.2 0.3 -25.4 -60.5 79.4 82.6 91.3 3.1 8.8 73.1
-16 36.7 0.6 -25.8 -62.2 78.9 82.0 91.2 3.1 9.2 71.9
-15 38.3 1.2 -25.7 -62.6 79.1 82.2 91.4 3.1 9.2 73.3
-14 38.9 2.1 -25.6 -62.2 78.8 81.9 91.1 3.1 9.2 74.0
-13 39.0 1.6 -26.0 -62.4 79.1 82.2 91.3 3.1 9.1 74.8
-12 37.7 1.1 -25.5 -61.4 79.4 82.6 91.6 3.1 9.1 74.8
-11 36.7 -0.2 -25.9 -60.6 79.8 82.9 91.9 3.1 9.0 75.7
-10 36.0 -0.8 -27.1 -62.3 79.6 82.7 91.6 3.1 9.0 76.2
-9 35.8 -0.9 -26.2 -61.1 79.9 83.0 91.7 3.1 8.7 75.5
-8 34.6 -1.3 -26.4 -61.5 80.4 83.6 92.2 3.1 8.7 75.3
-7 33.8 -1.1 -25.9 -60.6 80.6 83.7 92.2 3.1 8.6 75.2
-6 34.2 -1.6 -25.9 -60.9 80.6 83.7 92.1 3.1 8.5 74.8
-5 31.7 -2.6 -27.0 -62.1 80.9 84.0 92.4 3.1 8.4 74.7
-4 30.9 -4.1 -28.2 -63.0 80.7 83.8 92.1 3.1 8.4 74.6
-3 32.1 -3.8 -28.3 -63.8 80.6 83.7 92.0 3.1 8.4 75.0
-2 32.7 -3.1 -27.0 -62.8 80.7 83.8 92.0 3.1 8.2 75.5
-1 32.9 -3.5 -27.7 -63.4 81.0 84.1 92.0 3.1 7.9 76.3
1-Jun 27.6 -8.0 -29.0 -62.9 80.7 83.8 91.7 3.1 7.9 76.3
+1 28.4 -8.3 -29.8 -64.4 80.1 83.2 91.3 3.1 8.0 76.6
+2 29.0 -7.6 -29.7 -64.5 80.6 83.7 91.6 3.1 7.9 77.2
+3 29.1 -6.5 -28.4 -63.9 80.3 83.6 91.5 3.2 7.9 75.7
+4 30.1 -5.0 -27.0 -62.6 79.8 83.0 90.9 3.2 7.9 75.5
+5 30.2 -4.7 -26.8 -62.3 80.1 83.3 91.4 3.2 8.1 75.9
+6 29.8 -5.5 -26.9 -61.9 79.8 83.0 91.3 3.2 8.3 76.6
+7 31.6 -5.3 -28.1 -63.2 80.0 83.2 91.4 3.2 8.2 76.9
+8 32.9 -2.9 -25.7 -61.1 80.1 83.2 91.4 3.1 8.2 76.7
+9 33.0 -3.5 -26.6 -61.9 80.3 83.6 91.9 3.2 8.3 76.6
+10 32.1 -4.8 -28.1 -63.2 80.7 83.9 92.2 3.2 8.3 76.6
+11 32.9 -5.0 -28.1 -62.7 80.9 84.2 92.8 3.3 8.5 76.5
+12 33.7 -5.2 -29.2 -64.4 80.8 84.1 92.6 3.3 8.5 76.6
+13 34.3 -5.5 -29.6 -65.2 80.6 84.0 92.7 3.4 8.7 76.6
+14 34.7 -4.8 -29.2 -64.1 80.0 83.4 91.9 3.4 8.5 77.6
+15 34.4 -4.5 -28.8 -64.0 80.3 83.8 92.4 3.4 8.6 77.0
+16 31.5 -6.4 -29.5 -64.0 80.2 83.7 92.3 3.4 8.6 76.6
+17 30.9 -5.6 -28.7 -63.9 80.6 84.0 92.6 3.4 8.6 77.5
+18 31.1 -5.5 -28.0 -62.9 80.7 84.1 92.7 3.4 8.6 78.3
+19 31.6 -4.7 -27.2 -61.7 80.3 83.8 92.5 3.4 8.7 77.5
+20 33.8 -3.4 -26.2 -61.3 79.8 83.2 91.9 3.4 8.7 76.8
Average change for select # of days LEADING UP TO 1-Jun (bps)
-20 -6.2 -6.1 -1.6 -1.9 2.2 2.2 1.3 0.0 -1.0 4.1
-10 -8.4 -7.1 -1.8 -0.7 1.1 1.1 0.1 0.0 -1.0 0.1
-5 -4.1 -5.4 -2.0 -0.8 -0.2 -0.2 -0.7 0.0 -0.4 1.6
-3 -4.5 -4.1 -0.6 0.9 0.1 0.1 -0.3 0.0 -0.4 1.3
-1 -5.3 -4.5 -1.3 0.4 -0.3 -0.3 -0.3 0.0 0.0 0.0
Average change for select # of days FOLLOWING 1-Jun (bps)
+1 0.8 -0.3 -0.9 -1.4 -0.6 -0.6 -0.4 0.0 0.1 0.3
+3 1.5 1.5 0.5 -1.0 -0.3 -0.2 -0.2 0.1 0.0 -0.6
+5 2.6 3.3 2.1 0.7 -0.6 -0.4 -0.3 0.1 0.1 -0.4
+10 4.5 3.1 0.8 -0.2 0.0 0.1 0.5 0.1 0.4 0.3
+20 6.2 4.6 2.8 1.7 -0.9 -0.6 0.2 0.3 0.8 0.6
Average change for select # of days LEADING UP TO & FOLLOWING 1-Jun
20-20 0.0 -1.5 1.1 -0.2 1.3 1.7 1.5 0.3 -0.2 4.7
10-10 -3.9 -4.0 -1.0 -0.9 1.1 1.2 0.6 0.1 -0.6 0.4
5-5 -1.5 -2.1 0.2 -0.2 -0.8 -0.7 -1.0 0.1 -0.3 1.2
Source: NBF, Bloomberg | Note: Average for US IG CDX based on 2012-2017
4
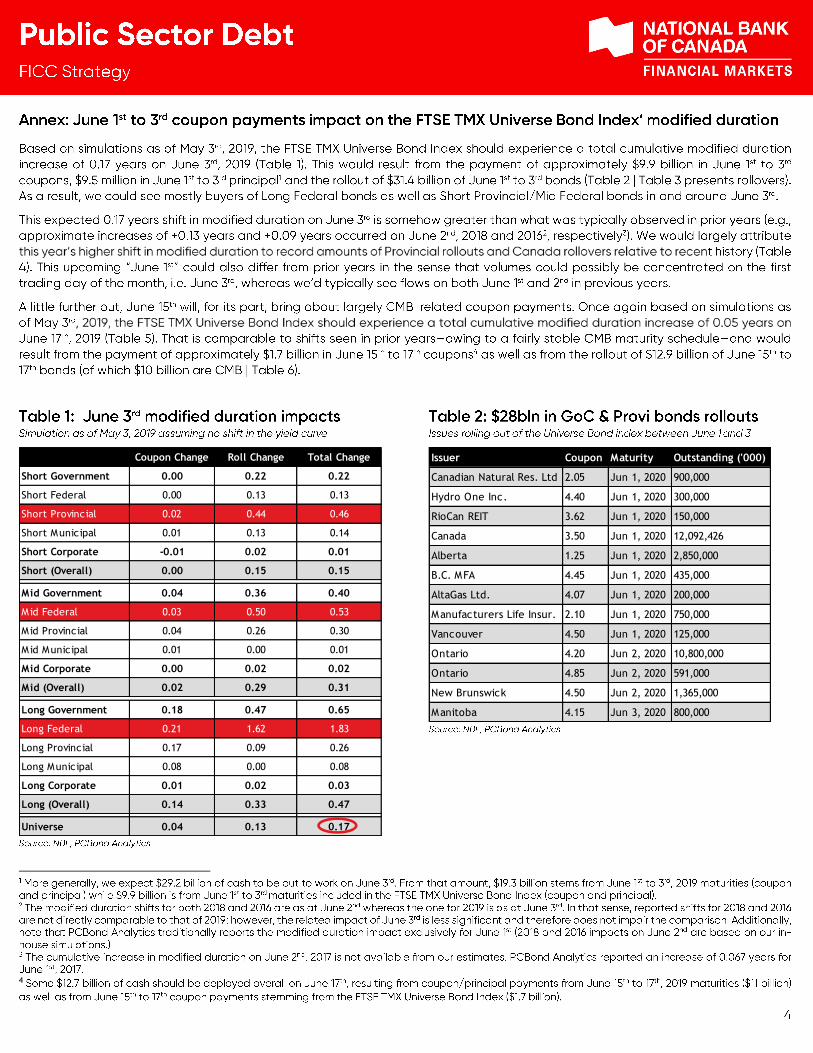
Coupon Change Roll Change Total Change
Short Government 0.00 0.22 0.22
Short Federal 0.00 0.13 0.13
Short Provincial 0.02 0.44 0.46
Short Municipal 0.01 0.13 0.14
Short Corporate -0.01 0.02 0.01
Short (Overall) 0.00 0.15 0.15
Mid Government 0.04 0.36 0.40
Mid Federal 0.03 0.50 0.53
Mid Provincial 0.04 0.26 0.30
Mid Municipal 0.01 0.00 0.01
Mid Corporate 0.00 0.02 0.02
Mid (Overall) 0.02 0.29 0.31
Long Government 0.18 0.47 0.65
Long Federal 0.21 1.62 1.83
Long Provincial 0.17 0.09 0.26
Long Municipal 0.08 0.00 0.08
Long Corporate 0.01 0.02 0.03
Long (Overall) 0.14 0.33 0.47
Universe 0.04 0.13 0.17
Issuer Coupon Maturity Outstanding ('000)
Canadian Natural Res. Ltd 2.05 Jun 1, 2020 900,000
Hydro One Inc. 4.40 Jun 1, 2020 300,000
RioCan REIT 3.62 Jun 1, 2020 150,000
Canada 3.50 Jun 1, 2020 12,092,426
Alberta 1.25 Jun 1, 2020 2,850,000
B.C. MFA 4.45 Jun 1, 2020 435,000
AltaGas Ltd. 4.07 Jun 1, 2020 200,000
Manufacturers Life Insur. 2.10 Jun 1, 2020 750,000
Vancouver 4.50 Jun 1, 2020 125,000
Ontario 4.20 Jun 2, 2020 10,800,000
Ontario 4.85 Jun 2, 2020 591,000
New Brunswick 4.50 Jun 2, 2020 1,365,000
Manitoba 4.15 Jun 3, 2020 800,000
Issuer Coupon Maturity Outstanding ('000)
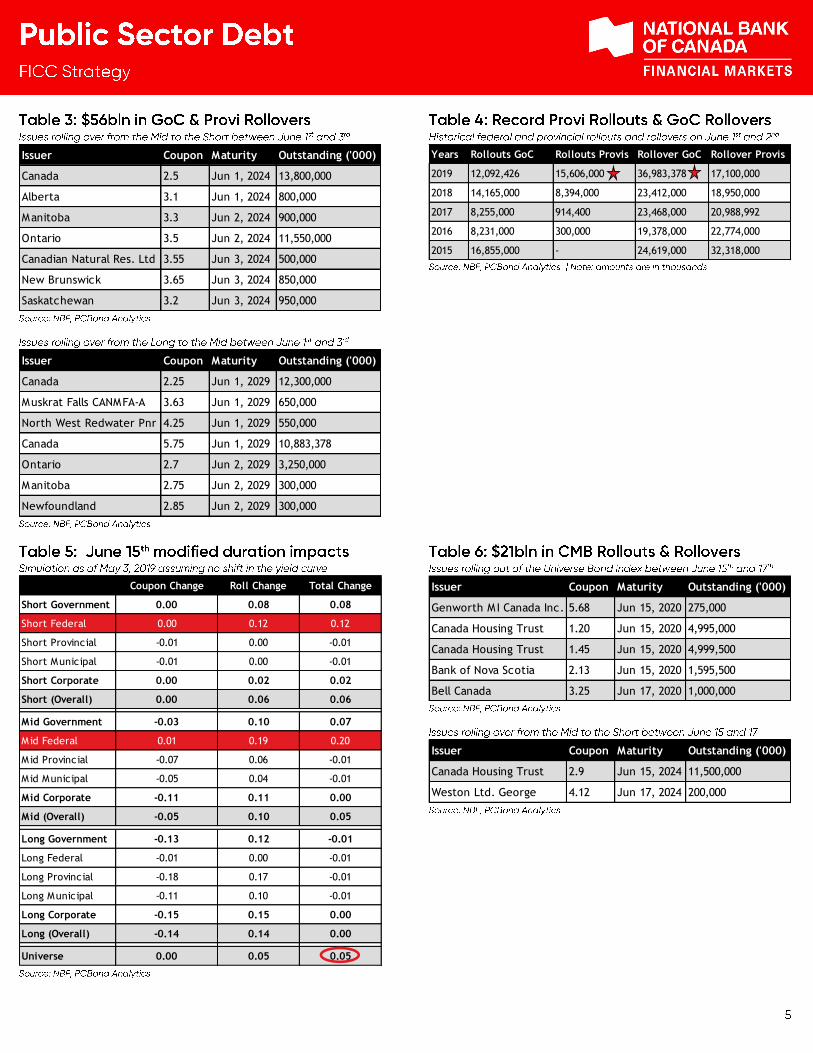
Canada 2.5 Jun 1, 2024 13,800,000
Alberta 3.1 Jun 1, 2024 800,000
Manitoba 3.3 Jun 2, 2024 900,000
Ontario 3.5 Jun 2, 2024 11,550,000
Canadian Natural Res. Ltd 3.55 Jun 3, 2024 500,000
New Brunswick 3.65 Jun 3, 2024 850,000
Saskatchewan 3.2 Jun 3, 2024 950,000
Issuer Coupon Maturity Outstanding ('000)
Canada 2.25 Jun 1, 2029 12,300,000
Muskrat Falls CANMFA-A 3.63 Jun 1, 2029 650,000
North West Redwater Pnr 4.25 Jun 1, 2029 550,000
Canada 5.75 Jun 1, 2029 10,883,378
Ontario 2.7 Jun 2, 2029 3,250,000
Manitoba 2.75 Jun 2, 2029 300,000
Newfoundland 2.85 Jun 2, 2029 300,000
Coupon Change Roll Change Total Change
Short Government 0.00 0.08 0.08
Short Federal 0.00 0.12 0.12
Short Provincial -0.01 0.00 -0.01
Short Municipal -0.01 0.00 -0.01
Short Corporate 0.00 0.02 0.02
Short (Overall) 0.00 0.06 0.06
Mid Government -0.03 0.10 0.07
Mid Federal 0.01 0.19 0.20
Mid Provincial -0.07 0.06 -0.01
Mid Municipal -0.05 0.04 -0.01
Mid Corporate -0.11 0.11 0.00
Mid (Overall) -0.05 0.10 0.05
Long Government -0.13 0.12 -0.01
Long Federal -0.01 0.00 -0.01
Long Provincial -0.18 0.17 -0.01
Long Municipal -0.11 0.10 -0.01
Long Corporate -0.15 0.15 0.00
Long (Overall) -0.14 0.14 0.00
Universe 0.00 0.05 0.05
Years Rollouts GoC Rollouts Provis Rollover GoC Rollover Provis
2019 12,092,426 15,606,000 36,983,378 17,100,000
2018 14,165,000 8,394,000 23,412,000 18,950,000
2017 8,255,000 914,400 23,468,000 20,988,992
2016 8,231,000 300,000 19,378,000 22,774,000
2015 16,855,000 - 24,619,000 32,318,000
Issuer Coupon Maturity Outstanding ('000)
Genworth MI Canada Inc. 5.68 Jun 15, 2020 275,000
Canada Housing Trust 1.20 Jun 15, 2020 4,995,000
Canada Housing Trust 1.45 Jun 15, 2020 4,999,500
Bank of Nova Scotia 2.13 Jun 15, 2020 1,595,500
Bell Canada 3.25 Jun 17, 2020 1,000,000
Issuer Coupon Maturity Outstanding ('000)
Canada Housing Trust 2.9 Jun 15, 2024 11,500,000
Weston Ltd. George 4.12 Jun 17, 2024 200,000