rating agencies: how new evaluation criteria could impact your … agencies.pdf · presenters:...
TRANSCRIPT
Presenters:
Date:
Rating Agencies: How New Evaluation Criteria Could Impact Your Rating
• Jane Hudson Ridley, Standard & Poor’s• Rich Raphael, Fitch• Bob Kurtter, Moody’s
05/19/2014

Permission to reprint or distribute any content from this presentation requires the prior written approval ofStandard & Poor’s. Copyright © 2013 by Standard & Poor’s Financial Services LLC. All rights reserved.
An Overview of S&P’s Local GO Criteria
Jane Hudson RidleySenior Director & Analytical Manager
National GFOAMay 19, 2014
General Obligation Ratings Methodology and Assumptions:

Introduction
New GO criteria is intended to:• Provide transparency into our rating process• Enhance ratings comparability• Formalize the forward‐looking rating component
New GO criteria NOT is intended to:• Be used as a vehicle to adjust ratings• Change what factors we view as important
3

Improved Transparency and Comparability
o Greater clarity on how to derive Standard & Poor’s Ratings Services’ U.S. public finance ratings
• Building on similar underlying principles as we currently use• Allows for greater understanding of how we arrive at specific ratings• Should aid in understanding how ratings may change given underlying
conditions
o Criteria resulting in forward‐looking and comparable ratings• Comparability across sectors and regions
4
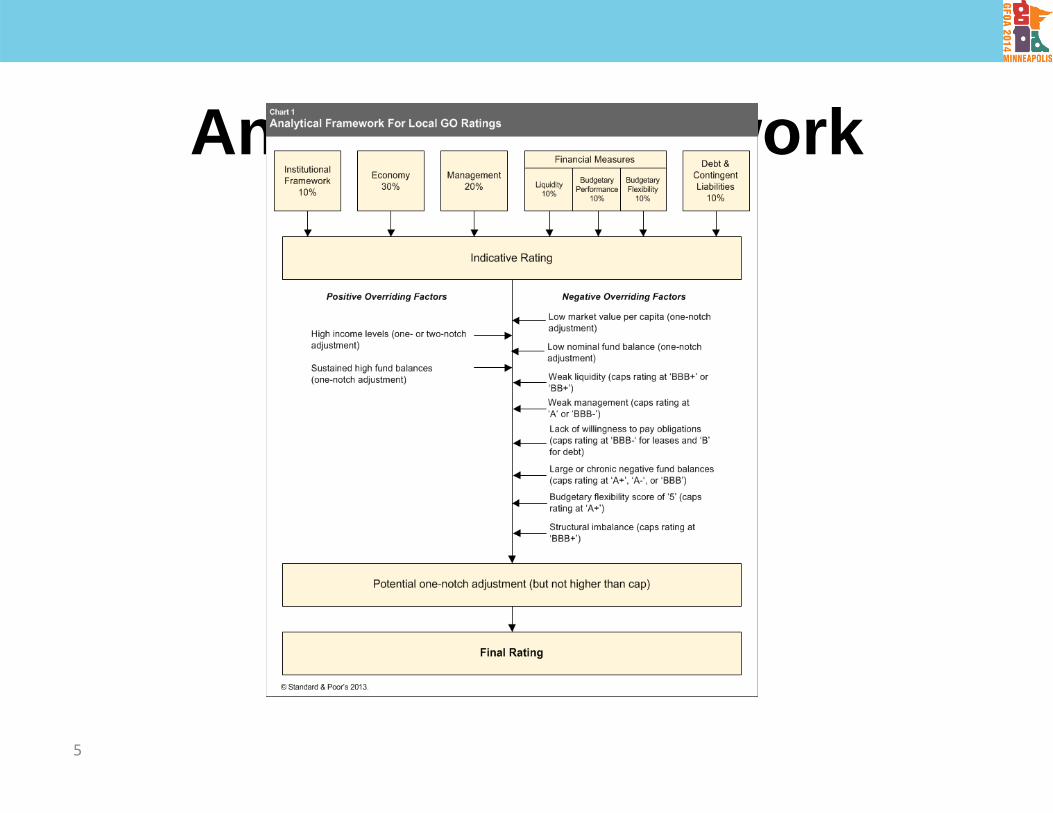
Analytical Framework
5

Summary of the FactorsLocal GO Criteria Factors
6

Institutional Framework (1 of 7 Factors)o Assesses the legal and practical environment in which the local government
operates o The score is based on the average of four discretely scored areas
• Predictability: the extent to which a local government can forecast its revenues and expenditures on an ongoing basis
• Revenue and expenditure balance: the extent to which a local governments have the ability to finance the services they provide
• Transparency and accountability: the overall institutional framework’s role in encouraging the transparency and comparability of relative financial information
• System support: the extent to which local governments receive extraordinary support from a state government when the local government is under extreme stress
InstitutionalFramework10%
7

Economic Score (2 of 7 Factors)
• Assesses health of the asset base & likelihood of additional service demands • The initial score (1 through 5) is based on market value per capita and projected per capita
income as a % of U.S. (5 year projection)• Qualitative Adjustments
+ Broad and diverse economy ‐ High Unemployment
+ Stabilizing Institutional Influence ‐ High dependent population
‐ Tax base or employment concentration
Economy30%
Source: Standard & Poor’s Ratings Services.8
Total Market Value Per Capita
Proj PC EBI as % of US Proj PC
EBI>$195,000 $100,000 to
$195,000 $80,000 to$100,000
$55,000 to$80,000 <$55,000
>150 1 1.5 2 2.5 3
110 to150 1.5 2 2.5 3 3.5
85 to110 2 2.5 3 3.5 4
70 to 85 2.5 3 3.5 4 4.5
<70 3 3.5 4 4.5 5

• Still based on FMA• Strong, Good, Standard, Vulnerable
• Topics for additional focus• Turnover, political gridlock, etc.• Management capability regarding planning, monitoring and execution• Very high pension/OPEB burden• Any news stories or other conversations related to potential bankruptcy
Management Score (3 of 7 Factors)
9
Management20%

Financial Measures• Three components factor into our assessment of a municipality’s financial credit
characteristics• Budgetary flexibility measures• Budgetary performance measures • Liquidity measures• Each factor is weighted 10% — all financial measures together are 30%
BudgetaryFlexibility
10%
BudgetaryPerformance
10%
Liquidity10%
Financial Measures

Financial Measures: Budgetary Flexibility Score (4 of 7 Factors)• The budgetary flexibility initial score measures the degree to which the government can create
additional financial flexibility in times of stress • Qualitative Adjustments (highlights)
+ Projections show improvement ‐ Projections show deterioration
+ Expenditure reduction flexibility ‐ Cash accounting
+ History of sustained high fund balances ‐ High questionable receivables
+ Demonstrated willingness and ability to ‐ Limited capacity to raise revenues or raise taxes cut expenditures
o
oo
Table 10: Assessing The Budgetary Flexibility Score
Available Fund Balance as a percentage of expenditures
% >15 8 to15 4 to 8 1 to 4 <1
Score 1 2 3 4 5
BudgetaryFlexibility10%
Source: Standard & Poor’s Ratings Services.11

Financial Measures: Budgetary Performance Score (5 of 7 Factors)• The budgetary performance initial score measures the current fiscal balance of the
government• Qualitative Adjustments
+ Projections show improvement ‐ Projections show deterioration
o ‐ Significant historic volatility in performance (e.g., cyclical
revenues)o
Table 11: Assessing The Budgetary Performance Score
Total Governmental Funds Net Result (%)
General fund net result (%) > -1 -1 to -5 -5 to -10% -10 to -15 < -15
(> 5) 1 2 3 3 4
(-1 to 5) 2 3 3 4 5
(< -1) 3 4 4 5 5
BudgetaryPerformance10%
Source: Standard & Poor’s Ratings Services.12

Financial Measures: Liquidity Score (6 of 7 Factors)• The initial score measures the availability of cash and cash equivalents to service both debt and other expenditures • Qualitative Adjustments
+ Projections show improvement ‐ Projections show deterioration
+ Access to external liquidity ‐ High refinancing risk over 24 months
o ‐ Exposure to non‐remote contingent liabilities
oo
Liquidity10%
Table 12: Assessing The Liquidity ScoreTotal Government Available Cash As % Of Total Governmental Funds Debt
Service
Ttl Govt Cash as % Ttl Govt Funds
Exps
>120 100 to120 80 to100 40 to 80 <40
>15 1 2 3 4 5
8 to15 2 2 3 4 5
4 to 8 3 3 3 4 5
1 to 4 4 4 4 4 5
<1 5 5 5 5 5
Source: Standard & Poor’s Ratings Services.13

Debt and Contingent Liability (7 of 7 Factors)• Initial debt score: carry charge for total government and debt as % of governmental
funds revenue)
• Qualitative Adjustments
+ Low debt as % of market value ‐ High debt as % of market value
+ Rapid amortization ‐ Significant medium term debt plans
o ‐ Exposure to large contingent liabilities
o ‐ High unfunded pension or OPEBo
Table 14: Assessing The Debt And Contingent Liabilities Score
Net Direct Debt As % Of Total Governmental Funds Revenue
Ttl Govt Funds DS as % of Ttl Govt Funds
Exps<30 30 to 60 60 to 120 120 to 180 >180
< 8 1 2 3 4 5
8 to 15 2 3 4 4 5
15 to 25 3 4 5 5 5
25 to 35 4 4 5 5 5
>35 4 5 5 5 5
Debt & Contingent Liabilities10%
Source: Standard & Poor’s Ratings Services.14

Indicative Rating
Positive Overriding Factors
• High income levels (1 or 2 notch adjustment)
• Sustained high fund balances (1 notch adj)
Negative Overriding Factors
• Low market value per capita (1 notch adjustment)
• Low nominal fund balance (1 notch adjustment)
FINAL RATING
Putting it all Together
Source: Standard & Poor’s Ratings Services.15
Rating Caps
• Weak liquidity (BBB+ or BB+)
• Weak management (A or BBB-)
• Lack of willingness to pay obligations (BBB- for leases and B for debt)
• Large or chronic negative fund balances (A+, A-, or BBB)
• Budgetary flexibility score of 5 (A+)
• Structural imbalance (BBB+)
* * * ONE NOTCH FLEXIBILITY * * *

Copyright © 2013 by Standard & Poor’s Financial Services LLC. All rights reserved.
No content (including ratings, credit‐related analyses and data, valuations, model, software or other application or output therefrom) or any part thereof (Content) may be modified, reverse engineered, reproduced or distributed in any form by any means, or stored in a database or retrieval system, without the prior written permission of Standard & Poor’s Financial Services LLC or its affiliates (collectively, S&P). The Content shall not be used for any unlawful or unauthorized purposes. S&P and any third‐party providers, as well as their directors, officers, shareholders, employees or agents (collectively S&P Parties) do not guarantee the accuracy, completeness, timeliness or availability of the Content. S&P Parties are not responsible for any errors or omissions (negligent or otherwise), regardless of the cause, for the results obtained from the use of the Content, or for the security or maintenance of any data input by the user. The Content is provided on an “as is” basis. S&P PARTIES DISCLAIM ANY AND ALL EXPRESS OR IMPLIED WARRANTIES, INCLUDING, BUT NOT LIMITED TO, ANY WARRANTIES OF MERCHANTABILITY OR FITNESS FOR A PARTICULAR PURPOSE OR USE, FREEDOM FROM BUGS, SOFTWARE ERRORS OR DEFECTS, THAT THE CONTENT’S FUNCTIONING WILL BE UNINTERRUPTED OR THAT THE CONTENT WILL OPERATE WITH ANY SOFTWARE OR HARDWARE CONFIGURATION. In no event shall S&P Parties be liable to any party for any direct, indirect, incidental, exemplary, compensatory, punitive, special or consequential damages, costs, expenses, legal fees, or losses (including, without limitation, lost income or lost profits and opportunity costs or losses caused by negligence) in connection with any use of the Content even if advised of the possibility of such damages.
Credit‐related and other analyses, including ratings, and statements in the Content are statements of opinion as of the date they are expressed and not statements of fact. S&P’s opinions, analyses and rating acknowledgment decisions (described below) are not recommendations to purchase, hold, or sell any securities or to make any investment decisions, and do not address the suitability of any security. S&P assumes no obligation to update the Content following publication in any form or format. The Content should not be relied on and is not a substitute for the skill, judgment and experience of the user, its management, employees, advisors and/or clients when making investment and other business decisions. S&P does not act as a fiduciary or an investment advisor except where registered as such. While S&P has obtained information from sources it believes to be reliable, S&P does not perform an audit and undertakes no duty of due diligence or independent verification of any information it receives.
To the extent that regulatory authorities allow a rating agency to acknowledge in one jurisdiction a rating issued in another jurisdiction for certain regulatory purposes, S&P reserves the right to assign, withdraw or suspend such acknowledgement at any time and in its sole discretion. S&P Parties disclaim any duty whatsoever arising out of the assignment, withdrawal or suspension of an acknowledgment as well as any liability for any damage alleged to have been suffered on account thereof.
S&P keeps certain activities of its business units separate from each other in order to preserve the independence and objectivity of their respective activities. As a result, certain business units of S&P may have information that is not available to other S&P business units. S&P has established policies and procedures to maintain the confidentiality of certain non‐public information received in connection with each analytical process.
S&P may receive compensation for its ratings and certain analyses, normally from issuers or underwriters of securities or from obligors. S&P reserves the right to disseminate its opinions and analyses. S&P's public ratings and analyses are made available on its Web sites, www.standardandpoors.com (free of charge), and www.ratingsdirect.com and www.globalcreditportal.com (subscription), and may be distributed through other means, including via S&P publications and third‐party redistributors. Additional information about our ratings fees is available at www.standardandpoors.com/usratingsfees.
STANDARD & POOR’S, S&P, GLOBAL CREDIT PORTAL and RATINGSDIRECT are registered trademarks of Standard & Poor’s Financial Services LLC.
16

Presentation-GFOA Annual Conference
Rating Methodology
Richard J. RaphaelHead of US Public Finance May 19, 2014

18
www.fitchratings.com
Fitch Tax-Supported Credit Analysis
Topics• Rating Agency Changes Since the Financial Crisis
• Issuer Characteristics
• Interactive Key Rating Factors
• Attributes of Strong and Weak Credits
• Appendix
5/19/14

19
www.fitchratings.com
Rating Agency Changes Since the Financial Crisis
• Interaction with Issuers• Surveillance of ratings
• Editorial Comments
• Feedback
• Improved Transparency
• Increased Communication to the Market
• Quantitative and Qualitative Analysis
5/19/2014

20
www.fitchratings.com
Issuer’s Characteristics
• In order to communicate to the market our objective opinion of an issuer’s creditworthiness an analyst needs to understand the common and distinct issuer characteristics
• The central issue = Will issuer repay its debt obligations and what is the relative risk
• Fitch analyzes trends in four major areas
5/19/2014

21
www.fitchratings.com
Interactive/Dynamic Rating Factors
• Fitch’s rating process involves analyzing trends in four major credit factors:
- Economy
- Debt and Other Long-term Liabilities
- Finances
- Management
• Goal is to identify actual and potential future obligations and exposures
• Major rating factors are interactive – one weakness in one may offset positive an another (and visa versa)
• Implicit Dynamic Weighting
5/19/2014

22
www.fitchratings.com
Economic Factors
• Resource base from which tax revenues are derived
• Depth and breadth of employment base
• Growth Trends- employment, income, population etc.
• Education & income levels
• Quality of life attraction
• Population/school enrollment trends
5/19/2014

23
www.fitchratings.com
Tax Base Composition – Key Data
• What’s happening to the local residential property market?
- New developments: what is coming on-line, what has stalled, are developers pulling new permits?
- Trends in prices, time on market, vacancy rates- Foreclosure and delinquency rates- Appeals
• Taxable assessed valuation and market valuation trends and projections (and underlying planning assumptions)
• Property tax rates relative to neighboring jurisdictions
- Gauge of potential political opposition to rate increases- Legal tax raising limits
5/19/14

24
www.fitchratings.com
Debt and Other Long-Term Liabilities
• Includes bonded debt ratios, unfunded pensions and OPEB obligations
• Affordability / debt service coverage
• Exposure to short-term debt, variable-rate debt, derivatives, etc.
• Future capital needs
• Pension & OPEB
5/19/2014

25
www.fitchratings.com
Increased Focus on Pension / OPEB Liabilities
• OPEBs are legally softer obligations and generally, subject to modification by the government.
• Focus of pension analysis:- Magnitude of unfunded actuarial accrued liability (UAAL)
- Trend in funded ratio
- Trajectory of annual payments (including to state cost sharing systems) and budget impact
- Actuarially Required Contribution (ARC) vs. actual contribution history • Management commitment to full ARC funding
• Is the contribution actuarially calculated and fully paid?
• What share of spending does it represent?
• What is the resource base from which funding is derived?
5/19/2014
26
www.fitchratings.com
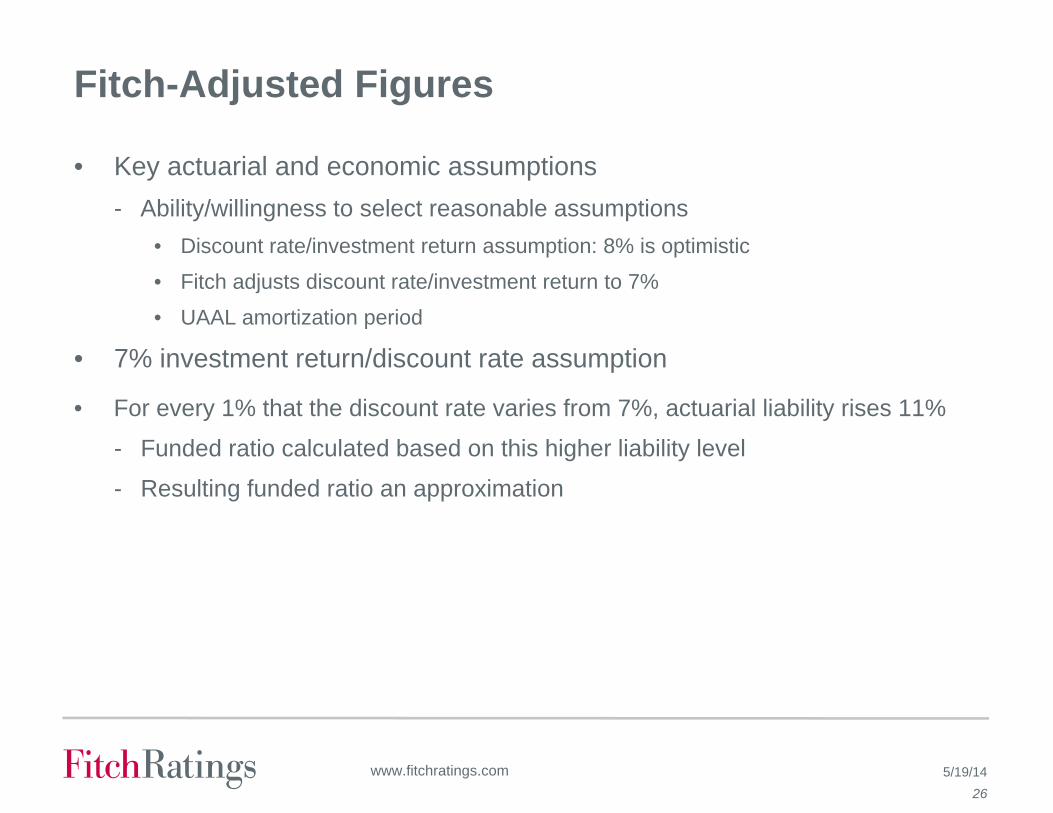
Fitch-Adjusted Figures
• Key actuarial and economic assumptions- Ability/willingness to select reasonable assumptions
• Discount rate/investment return assumption: 8% is optimistic
• Fitch adjusts discount rate/investment return to 7%
• UAAL amortization period
• 7% investment return/discount rate assumption
• For every 1% that the discount rate varies from 7%, actuarial liability rises 11%
- Funded ratio calculated based on this higher liability level
- Resulting funded ratio an approximation
5/19/14

27
www.fitchratings.com
Fitch-Adjusted Figures
Carrying cost for local governments
• Debt service + pension contribution + OPEB pay-go
- Local governments: labor-intensive
- Vast majority in cost-sharing plans
- Impact on resource base
• As % of spending:
- <15% stronger
- >25% weaker
5/19/14

28
www.fitchratings.com
Pension Summary
Credit positives:• Well-funded pension plans, reasonable assumptions
• Consistent funding of actuarially determined annually required contribution (ARC)
• Effective efforts to contain liability over time
Credit concerns:• High unfunded liability, liberal assumptions
• Annual contributions below the ARC
• High ARC requirements relative to budget
• Rapidly rising annual requirements
5/19/14

29
www.fitchratings.com
Finances
• Structurally balanced operations
• Prudent unrestricted reserves
• Revenue and expense composition and trends
• Capacity to absorb spending needs
• Tax and Revenue Limits
• Liquidity / cash flow
• Contingency planning
5/19/2014

30
www.fitchratings.com
Financial Operations – Key Data
• Most recent audited financial report
• Unaudited actuals or projected results for immediate past fiscal year if CAFR not yet ready
• Next fiscal year budget (if available)
• Multi-year projections- How major revenues are expected to perform- The underlying assumptions (e.g. any political or legislative threats?)- Future expenditure increases (e.g. known labor cost increases, new legal
mandates, future operating costs of new facilities)- Structural gaps and planned solutions
• “What-if” scenarios and contingency plans to address them
5/19/14

31
www.fitchratings.com
Financial Operations – Key Data, cont.
• Major fund balances- Under GASB 54, we focus on the unrestricted fund balance (committed +
assigned + unassigned) - Interfund transfers:
• Is the general fund supporting other funds temporarily or on an ongoing basis?• Are other funds supporting the general fund beyond overhead reimbursement? Any
legal challenges to this?
• Reserves- Are they accounted for in the general fund or elsewhere?
• Borrowable resources - How much? - Held in which funds?
• What other financial flexibility is available - What realistic options does the issuer still have to fill future budget gaps?
5/19/2014

32
www.fitchratings.com
Financial Operations – Liquidity
• Balance Sheet Analysis- receivables/payables, liquidity ratios etc.
• Liquidity Trends- When are the low cash points during the year?
Have cash levels at those points declined in recent years? Provide monthly cash flow statements if there is a concern.
- How does the issuer ensure sufficient liquidity at those points during the year (e.g. borrow from other funds or externally)?
- What level of borrowable resources are available in other funds?
- Is there a notable increase in cash flow borrowing?- Is there borrowing across fiscal years?
5/19//2014

33
www.fitchratings.com
Management
• Ability and willingness to manage financial obligations y
• Institutionalized and prudent policies- Implemented?- Followed?- Fiscal discipline maintained even during downturns
• Budget Practices - Are they realistic, conservative?
• Clear Vision
• Ability to Adapt
• Tenure/experience/effectiveness with and between elected officials
• Effectiveness with taxpayers and labor
5/19/2014

34
www.fitchratings.com
Putting the Pieces Together
Link economy, debt, financial and management profile
View from an analyst's perspective and interaction between factors
• Convey both strengths and risks
• Delineate problems and level of control over the resolution.
• Take Strategic approach to restoring/building financial strength and addressing long term challenges
• Shore up Financial Policies where needed (lessons learned)
• Communication, Communication, Communication
5/19/2014

35
www.fitchratings.com
www.fitchratings.com
Retaining Strong Credit Quality
• Budget realistically to conservatively
• Formulate “what-if” scenarios and develop contingency plans
• Monitor revenues and spending frequently
• Continue long-range financial planning
• Stay within financial policies where possible (use of one-time funds and reserves for operating expenditures should fall within guidelines)
• Develop a framework for use and replenishment of reserves
• Keep rating agencies informed of significant changes in circumstances
Overall, identify opportunities and challenges and all of the implications, and then take appropriate action.
5/19/14

36
www.fitchratings.com
Attributes of a Strong Credit
Economy:
• Broad, diverse, stable economy• Taxpayer concentration < 10% for top 10• Consistent, moderate population and employment
growth• Major employer stability and diversity• Robust wealth indicators• Moderate tax burden relative to area and similar
communities
Debt and other long-term liabilities:
• Debt per capita < $2,000; debt to market value < 2%; low debt service burden < 5% of spending
• Modest future capital/debt needs; CIP updated regularly• Rapid debt amortization , > 65% in 10 years• Predominantly fixed-rate debt (< 15% variable rate)• Consistent full funding of pension ARC (UAAL < 20%)• Reasonable pension assumptions • Carrying costs < 15% of spending
Finances:
• Diverse, stable, broad-based, flexible sources of operating revenues
• Ability to raise revenues • Ability to adjust spending with limited service impacts• Consistently positive operating margins• Consistently sound reserve levels• Substantial available liquidity without short-term
borrowing
Management and administration:
• Highly efficient decision-making process• Strong evidence of consistent cooperation among
elected officials• Good management-labor relations• Financial management: prudent policies consistently
followed; conservative budgeting process; regular financial management reviews; contingency planning; long-term planning; timely reporting

37
www.fitchratings.com
Attributes of a Weak Credit
Economy:
• Small, limited, or concentrated economy• Taxpayer concentration > 15% for top 10• Declining or extremely rapid population growth• Industry or employer dominance• Below-average wealth indicators
Debt and other long-term liabilities:
• Debt per capita > $4,000; debt to market value > 5%• High debt service burden > 12% of spending• Large future capital/debt needs; no published CIP• Slow debt amortization , < 40% in 10 years• Elevated levels of variable rate debt (> 25%)• Inconsistent full funding of pension ARC (UAAL < 30%)• Liberal assumptions • Limited efforts to reduce OPEB liability• Carrying costs > 25% of spending
Finances:
• Severely limited revenue flexibility; revenue declines
• Significant tax/revenue raising limits • Little spending flexibility• Trend of negative operating margins• Low reserve levels without replenishment plans• Low liquidity; reliant on short-term borrowing (< 15% of
general fund receipts)
Management and administration:
• Cumbersome decision-making process• Optimistic budget assumptions and inflexible budget
amendment process• Problematic management-labor relations• Inconsistent support for management; voter
referendum routinely fail• Financial and debt management policies not present or
not consistently followed, without plans to gain compliance
• Financial reporting delays and exceptions
5/19/14

Appendix:
Rating Actions 2013
GASB Changes
Rating Scales

39
www.fitchratings.com
2013 Fitch Rating Actions
5/19//2014

40
www.fitchratings.com
GASB Changes
Pros and cons of new accounting standards
• More complete, consistent balance sheet, income statement perspective
• Improved transparency and comparability
- Fewer choices in arriving at reported figures
- More consistent assumptions
- Application to cost-sharing plan participants (largely affects locals)
• However, some provisions will weigh on funded ratios
- Blended discount rate-when there is a depletion date
- Assets at fair market value
- Generally a more conservative approach to actuarial assumptions
5/19/14

41
www.fitchratings.com
GASB Changes
Concerns and uncertainty expressed about provisions
• Administrative cost of conversion, especially for cost-sharing plans
• Separation of funding from accounting adds to confusion
• Loss of a consistently reported ARC
• Uncertainty regarding impact on governmental decisions
5/19/14

42
www.fitchratings.com
Long-Term Rating Scale for Public FinanceObligations
Investment grade
AAA: Highest credit quality; lowest expectation of default risk -exceptionally strong capacity for payment of financial commitments unlikely to be adversely affected by foreseeable events
AA: Very high credit quality; very low default risk – very strong capacity for payment of financial commitments not significantly vulnerable to foreseeable events [This is the average GO rating for local governments.]
A: High credit quality, low default risk – strong capacity for payment of financial commitments might be more vulnerable to adverse economic conditions
BBB: Good credit quality, currently low expectations of default risk – adequate capacity for payment of financial commitments but adverse economic conditions are more likely to impair this capacity
5/19/2014

43
www.fitchratings.com
Short-Term Rating Scale for Public Finance ObligationsFor obligations up to 36 months (e.g. TANs, RANs, TRANs, BANs)
F1+: Highest short-term credit quality and strongest intrinsic capacity for timely payment of financial commitments
F1: Very high short-term credit quality and very strong intrinsic payment capacity
F2: Good short-term credit quality and good payment capacity
F3: Fair short-term credit quality and adequate payment capacity
B: Speculative short-term credit quality, minimal payment capacity, and heightened vulnerability to adverse economic conditions
C: High short-term default risk
D: Default
5/19/2014

44
www.fitchratings.com
Typical Relationship Between Long- and Short-term RatingsReflects importance of sustainable liquidity and near-term concerns within the assessment of the longer-term debt profile; actual ratings can diverge from this mapping depending on specific credit characteristics.
Long-term ratings (investment grade) Short-term rating (investment grade)
AAA F1+
AA+ F1+
AA F1+
AA- F1+
A+ F1 or F1+
A F1
A- F2 or F1
BBB+ F2
BBB F3 or F2
BBB- F3
5/19/14

45
www.fitchratings.com
Rating Outlooks and Watches
Rating Outlooks:
Expected movement in primary credit factors over next 24 months
• Stable
• Positive if credit characteristics trending positive (must be reviewed within 12 months)
• Negative if credit characteristics trending negative (must be reviewed within 12 months)
• Evolving if credit characteristics a mix of positive and negative (must be reviewed within 12 months)
Rating Watches:
Heightened probability of a rating change; event-driven; either exact rating implications of an event are undetermined, or the rating implications are known but the triggering event has yet to occur (e.g. regulatory approval); must be reviewed within six months
• Positive if potential upgrade
• Negative if potential downgrade
• Evolving if ratings might be raised, lowered, or affirmed
5/19//2014

46
www.fitchratings.com
Review Cycle
Six month review:
• All rating watches• Long-term ratings ‘B+’ and below• Short-term ratings ‘F2’ and ‘F3’
12 month review:
• Rating outlook negative, positive, or evolving• Long-term ratings ‘BBB’ and ‘BB’ categories• Short-term ratings ‘F1+’ and ‘F1’ (if debt term longer than 12 months)
24 month review:
• Ratings ‘AAA’, ‘AA’, and ‘A’ categories, rating outlook stable
5/19//2014

47
www.fitchratings.com
DisclaimerFitch Ratings’ credit ratings rely on factual information received from issuers and other sources.
Fitch Ratings cannot ensure that all such information will be accurate and complete. Further, ratings are inherently forward-looking, embody assumptions and predictions that by their nature cannot be verified as facts, and can be affected by future events or conditions that were not anticipated at the time a rating was issued or affirmed.
The information in this presentation is provided “as is” without any representation or warranty.A Fitch Ratings credit rating is an opinion as to the creditworthiness of a security and does notaddress the risk of loss due to risks other than credit risk, unless such risk is specifically mentioned. A Fitch Ratings report is not a substitute for information provided to investors by the issuer and its agents in connection with a sale of securities.
Ratings may be changed or withdrawn at any time for any reason in the sole discretion ofFitch Ratings. The agency does not provide investment advice of any sort. Ratings are nota recommendation to buy, sell, or hold any security.
ALL FITCH CREDIT RATINGS ARE SUBJECT TO CERTAIN LIMITATIONS AND DISCLAIMERS. PLEASE READ THESE LIMITATIONS AND DISCLAIMERS AND THE TERMS OF USE OF SUCH RATINGS AT WWW.FITCHRATINGS.COM.
5/19/2014

Outlook for Local Governments and Revised GO Methodology
Bob Kurtter, Managing DirectorGFOA Annual ConferenceMinneapolis, MinnesotaMay 19, 2014

49May 2014
US Local Government Outlook Revised to Stable
Key drivers:
The housing market has stabilized in most of the country
Property taxes have stabilized since downturn
State funding arrangements have mostly stabilized
Local governments are controlling costs, though pension burdens are a drag for many
Reserve fund balances have stayed healthy
The stable outlook applies to most of the sector, but pockets of credit pressure remain

50May 2014
The Housing Market has Stabilized in Most of the Country
Local Government Revenues Expected to Continue Recovering
Source: Moody’s Analytics, US Census Bureau
-1
0
1
2
3
4
5
6
2010 2011 2012 2013 2014 (Forecast) 2015 (Forecast)
Year
-ove
r-yea
r gro
wth
in lo
cal g
over
nmen
t tax
reve
nues
(%)

51May 2014
Property Taxes have Proven their Durability
Property Taxes Anchor Stable Local Government Ship
-20
-10
0
10
20
30
40
50
60
70
80
2002 2003 2004 2005 2006 2007 2008 2009 2010 2011 2012
Property Tax Receipts Income Tax Receipts Sales Tax Receipts
Cum
ulat
ive
Gro
wth
in L
G T
ax R
ecei
pts
sinc
e 20
02
Source: US Census Bureau

52May 2014
State Funding Arrangements Have Mostly Stabilized
Source: National Association of State Budget Officers
10
2
17
20
1617
5
0
5
10
15
20
25
2006 2007 2008 2009 2010 2011 2012 2013
States Reducing Local Aid to help Eliminate Budget GapsFiscal 2006-2013

53May 2014
Local Governments are Controlling Costs, Reducing Staff
13,400
13,600
13,800
14,000
14,200
14,400
14,600
14,800
2003 2004 2005 2006 2007 2008 2009 2010 2011 2012 2013 *
State and Local Governments Re-Size After Recession
Ave
rage
ann
ual s
tate
and
loca
l gov
ernm
ent e
mpl
oyee
s (in
thou
sand
s)
*2013 data as of SeptemberSource: Bureau of Labor Statistics

54May 2014
Fund Balances Have Remained Healthy
Source: Moody’s Investors Service
0
5
10
15
20
25
30
35
2008 2009 2010 2011 2012
Med
ian
Fund
Bal
ance
as
% o
f Rev
enue
s
Cities Counties School Districts

55May 2014
Pockets of Pressure Remain Stressed Sectors
New Hampshire Subsidies for nursing homes will pressure financial performance of counties.
New JerseyAlong with a lagging economic recovery, declining fund balances and limited revenue increase will weigh on cities and counties.
New York Both cities and counties are facing rising pension and healthcare costs.
Pennsylvania While coping with declining state aid, many issuers are also coping with strained tax bases and rising costs.
Rhode Island
Cities continue to deal with weak revenue and economic growth and large pension liabilities.
FloridaStill recovering from the downturn, tax levels are still suppressed and many issuers still need to achieve structural balance.
Kentucky Schools are strained by lease issues.
Illinois Pension pressures weigh on cities, while delayed state aid is worrisome for school districts.
Indiana State aid is being held flat and raising property taxes has become more difficult.
Michigan Cities are coping with shrinking tax base and revenues. Schools face lower enrollment and lower state aid.
California Significant revenue raising constraints and pension liabilities are above average due to generous benefits.
Nevada Not yet recovered from the downturn, tax levels have not rebounded and budgets are still cut.Source: Moody’s Investors Service

56May 2014
Local Govn’t Ratings Mostly Held Steady Through Downturn
Source: Moody’s Investors Service Source: Moody’s Investors Service
80.1%
13.7%
6.2%
Percentage of Total RatingsSame Downgraded Upgraded
0% 20% 40% 60% 80% 100%
North Carolina (119)Tennessee (114)
South Carolina (110)Texas (765)
Wisconsin (404)Massachusetts (263)
New York (839)Washington (212)Connecticut (145)
Arizona (106)Georgia (102)
Minnesota (374)Iowa (121)
Illinois (511)National Average
Pennsylvania (267)Ohio (438)
New Jersey (443)Oregon (102)
California (460)Michigan (349)
20 Largest States by Downgrade %Downgraded Same Upgraded
57May 2014
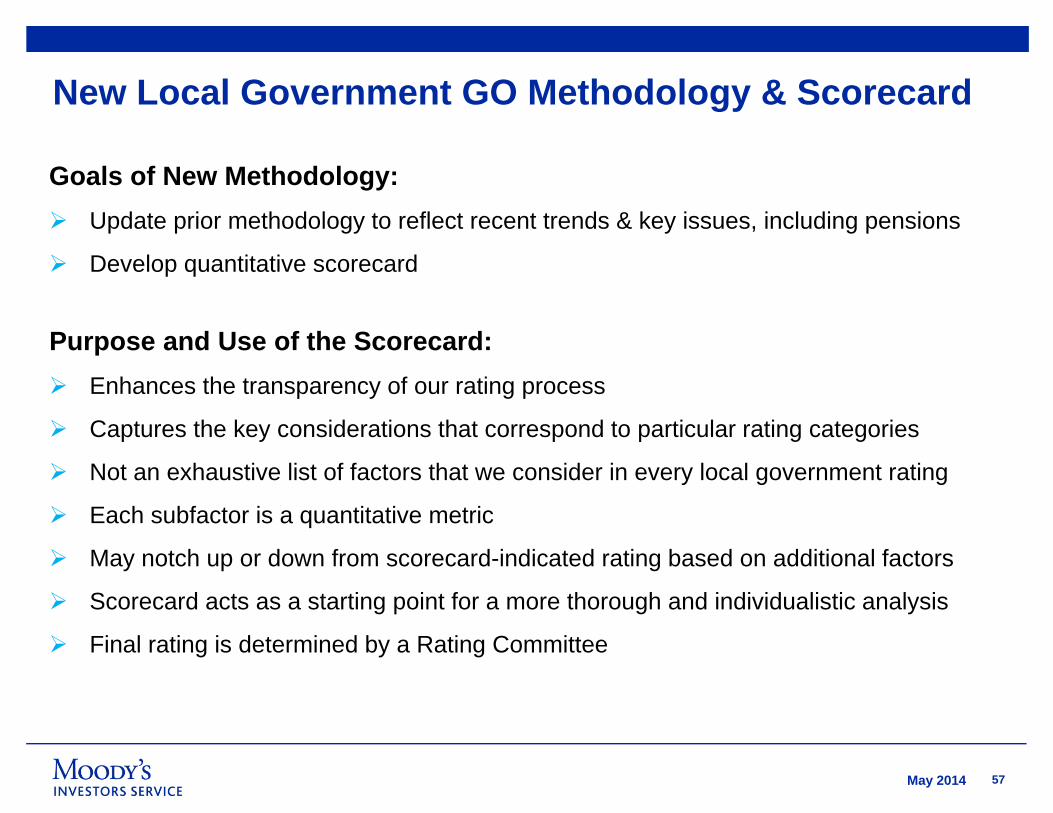
New Local Government GO Methodology & Scorecard
Goals of New Methodology: Update prior methodology to reflect recent trends & key issues, including pensions
Develop quantitative scorecard
Purpose and Use of the Scorecard: Enhances the transparency of our rating process
Captures the key considerations that correspond to particular rating categories
Not an exhaustive list of factors that we consider in every local government rating
Each subfactor is a quantitative metric
May notch up or down from scorecard-indicated rating based on additional factors
Scorecard acts as a starting point for a more thorough and individualistic analysis
Final rating is determined by a Rating Committee

58May 2014
General Obligation Bonds – Rated Universe GO is the most commonly used security by local governments in the US Methodology focuses on local government ratings based on the “typical” general
obligation unlimited tax pledge We rate approximately 8,300 local government GO credits Strong sector due to the potency of the ad valorem taxing power, amortizing debt
structures, and overall stable institutional frameworks Current ratings range from Aaa to Caa3
» Sector median is Aa3» Only 2% rated Baa1 or below

59May 2014
New GO Scorecard
Changes from Previous Methodology:
Factor 1Economy/Tax Base
Factor 2 Finances
Factor 3Management
Factor 4Debt/Pensions
30% 30% 20% 20%
Was 40% Unchanged Unchanged Was 10%

60May 2014
New GO Scorecard
Rationale for Changes:
Factor 1Economy/Tax Base
Factor 2Finances
Factor 3Management
Factor 4Debt/Pensions
30% 30% 20% 20%
Was 40% Unchanged Unchanged Was 10%
Change in Weightings:
Factor 1 weighting lowered to reduce the influence of tax base size
Factor 4 weighting increased to include a specific quantitative measure for pensions

61May 2014
GO Scorecard – Factors, Sub-factors and WeightsFactors & Sub‐Factors Weights
Factor 1: Economy/Tax Base 30%Full Value (market value of taxable property) 10%Full Value per Capita 10%Median Family Income 10%
Factor 2: Finances 30%Fund Balance as % of Operating Revenue 10%5‐Year Dollar Change in Fund Balance as % of Revenues 5%Cash Balance as % of Revenues 10%5‐Year Dollar Change in Cash Balance as % of Revenues 5%
Factor 3: Management 20%Institutional Framework 10%Operating History: 5‐Year Average of Operating Revenues / Operating Expenditures 10%
Factor 4: Debt/Pensions 20%Net Direct Debt / Full Value 5%Net Direct Debt / Operating Revenue 5%3‐Year Average of Moody’s Adjusted Net Pension Liability/ Full Value 5%3‐Year Average of Moody’s Adjusted Net Pension Liability / Operating Revenues 5%

62May 2014
GO Scorecard – Notching FactorsAdjustments/Notching FactorsDescription DirectionEconomy/Tax BaseInstitutional presence upRegional economic center upEconomic concentration downOutsized unemployment or poverty levels downOther analyst adjustment to Economy/Tax Base factor (specify) up/downFinancesOutsized contingent liability risk downUnusually volatile revenue structure downOther analyst adjustment to Finances factor (specify) up/downManagementState oversight or support up/downUnusually strong or weak budgetary management and planning up/downOther analyst adjustment to Management factor (specify) up/downDebt/PensionsUnusually strong or weak security features up/downUnusual risk posed by debt/pension structure downHistory of missed debt service payments downOther analyst adjustment to Debt/Pensions factor (specify) up/downOtherCredit event/trend not yet reflected in existing data sets up/down

63May 2014
Applying the Analytical Factors
Grid-Indicated Rating Notching Factors Adjusted Scorecard Rating
Analysts score each subfactor in the grid
The weighted average of the analyst-assigned scores will determine a raw score that maps to Moody’s rating scale the grid-indicated rating
Analyst and Rating Committee will determine any notching factors the adjusted scorecard rating
The final public rating may differ from the adjusted scorecard rating

64May 2014
GO Methodology and Scorecard: Next Steps
Impact on Ratings:
256 ratings were placed under review as a result of the new methodology» 52% for upgrade and 48% for downgrade (132 and 124, respectively)» Total credits placed under review represent 3% of our rated universe
We will complete a full review of each of these credits, including a conversation with the issuer
The reviews could take up to six months, but we hope to complete the vast majority of them much sooner

65May 2014
Summary of Credits Placed Under Review
Profile of a typical credit on review for Upgrade:
A/Baa-rated credit with small full value
Stable financial operations, and/or
Limited debt/pension burden
Profile of a typical credit on review for Downgrade:
Aaa/Aa-rated credit with large full value
Less stable financial operations, and/or
Significant debt/pension burden

66May 2014
Summary of Credits Placed Under Review
Most of the credits under review for upgrade are currently rated in the A-range, with some in the Baa-range
Credits under review for downgrade are generally rated in the Aa-range, though some are Aaa
CurrentRating
Review for Upgrade
Review for Downgrade
Aaa 0 25
Aa 10 88
A 83 11
Baa 39 0

67May 2014
AppendixMoody’s Analysis of Local Government
Pension Obligations

68May 2014
Pensions are a growing source of credit pressure» Liabilities and costs continue to grow across the public sector
– Demographic trends, imprudent benefit increases, contribution shortfalls, and “lost decade” in the stock market
– On reported actuarial basis, unfunded liabilities in 2011 were $800 billion, more than doubling since 2005
– Negative credit impact is compounded by recent years’ slow recovery of tax revenues
» Pensions a key driver in several high profile downgrades– States: CT, HI, IL, KY, NJ, PA, PR
– Local governments: 29 outliers identified through application of Moody’s adjustments
– 18 downgraded, including several major cities: Cincinnati, Minneapolis, Chicago

69May 2014
Four principal adjustments to as-reported pension data
» Allocate liabilities of cost-sharing plans to participating government employers based on their proportionate shares of total plan contributions
» Discount accrued actuarial liabilities (AAL) using a high-grade (Aa quality) corporate bond index rate as of the date of valuation
» Use fair or market value of assets (MVA) instead of smoothed asset value to calculate Moody’s adjusted net pension liability (adjusted AAL minus MVA)
» Calculate a standardized annual amortization metric related to the adjusted net pension liability, on a 20-year level dollar basis

70May 2014
Wide variation in pension burdens relative to revenue for 50 largest local governments
0% 100% 200% 300% 400% 500% 600% 700% 800%
Chicago
Cook County
Denver County School District 1
Jacksonville
Los Angeles
Metro. Water Reclamation District of Chicago
Houston
Dallas
Clark County School District
Phoenix
Percent of Operating Revenues
0% 100% 200% 300% 400% 500% 600% 700% 800%
King County
Westchester County
Suffolk County
Nassau County
Cypress-Fairbanks School District
Houston School District
Northside School District
Wake County
Mecklenburg County
District of Columbia
Percent of Operating Revenues
» Adjusted net pension liabilities of the “top 50” range from 678% to 11% of operating revenues (fiscal 2011)
» Fiscal 2011 reporting of top 50 encompasses actuarial valuations from June 2009 to December 2011
» Adjusted discount rates range from 4.40% to 6.05%

71May 2014
Contributions and actuarial costs have grown onerous for some local governments
» Contributions relative to actuarial requirements include Moody’s allocation of cost-sharing plans. Most local governments with cost-sharing exposure make full contractual contributions, though not necessarily tied to actuarial costs.
» We view contribution shortfalls, including those from cost-sharing exposure, as a driver of structural budget imbalance. Contribution shortfalls also correlated with higher ANPLs.
0.0% 5.0% 10.0% 15.0% 20.0% 25.0% 30.0%
Chicago
Cook County
Clark County School District
Philadelphia City
Houston
Los Angeles
Clark County
SD Unified School District
Kansas City
Fairfax County
Actual Contribution as % of Revenues Contribution Shorfall Relative to ARC

72May 2014
Lower liabilities, higher costs for pensions in 2014
» Adjusted liabilities will decline, but remain high relative to past years– Rising interest rates - bond index discount rate up 90 bps in 2013
– Strong investment performance - largest public funds exceed assumed returns by as much as 6.3% in fiscal 2013
» Four factors driving elevated costs relative to municipal budgets– Substantial buildup of unfunded liabilities over past decade
– Timing lags in actuarial methods and budget rules
– Perennial contribution shortfalls relative to actuarial requirements
– Deferred amortization approaches

73May 2014
Despite liability improvements, budget costs are elevated
-40%
-20%
0%
20%
40%
60%
80%
100%
120%
140%
160%
($50,000)
$0
$50,000
$100,000
$150,000
$200,000
2003 2004 2005 2006 2007 2008 2009 2010 2011 2012
% o
f Cov
ered
Pay
roll
$ in
mill
ions
FRS CalPERS CalSTRS TX TRS Combined UAALs as % of Covered Payrolls
» Factor one: substantial unfunded liability buildup over last decade on a nominal basis and relative to active payrolls

74May 2014
Despite liability improvements, budget costs are elevated» Factor two: budgetary timing lags and asset smoothing mitigate the
immediate impact of 2013 investment performance

75May 2014
Despite liability improvements, budget costs are elevated» Factor three: contribution shortfalls relative to annual required contributions
(ARCs) are widespread, and increase future amortization requirements
» Many large multi-employer plans do not collect actuarially-determined employer contributions in aggregate
» 21 of 50 largest cost-sharing plans collected less than 90% of plan ARC in fiscal 2012
0
5
10
15
20
25
30
35
< 10% 10 - 20% 20 - 30% 30 - 40% 40 - 50% 50 - 60% 60 -70% 70 - 80% 80 - 90% > 90%
Freq
uenc
y
% of ARC Contributed
76May 2014
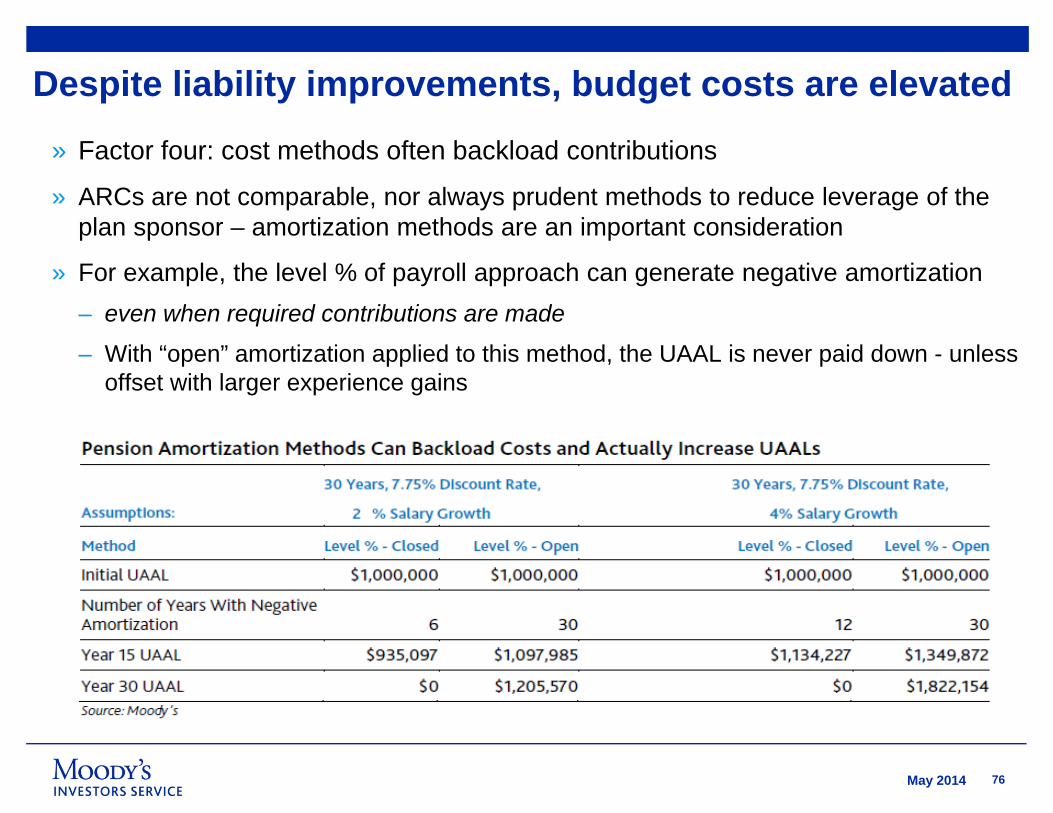
Despite liability improvements, budget costs are elevated
» Factor four: cost methods often backload contributions
» ARCs are not comparable, nor always prudent methods to reduce leverage of the plan sponsor – amortization methods are an important consideration
» For example, the level % of payroll approach can generate negative amortization– even when required contributions are made
– With “open” amortization applied to this method, the UAAL is never paid down - unless offset with larger experience gains

77May 2014
Meaning of new GASB standards for Moody’s pension analysis
» Moody’s fundamental approach to evaluating pensions will remain unchanged» Our adjustments already measure net liability exposure relative to capacity to pay
» A comparable discount rate adjustment will still be needed
» Cost-sharing plan allocations will be viewed from an economic perspective
» Adding unfunded liability to the reported government-wide balance sheet has no effect on our analysis
» Timely and sufficient audited financial information is required to maintain ratings
» Advance preparation for GASB changes will help avoid non-timely audits
» Ramifications of new “pension expense” for net revenue bond covenants must be explored by issuers and their bond counsels

78May 2014
Moody’s GASBImplementation Date April 2013 No later than Fiscal 2015 reporting
Net Liability Measure “Moody’s Adjusted Net Pension Liability” (ANPL) “Net Pension Liability”
Asset Smoothing Eliminate in favor of market or fair value Eliminate in favor of market or fair value
Discount Rate Common high-grade corporate bond index rate as of the actuarial valuation date
Plan-specific investment return, blended with muni bond index depending on funding history
Duration of Accrued Liabilities
Currently assumed at 13 years;When available under new GASB disclosures, will use plan-specific duration in adjustments
Sensitivity analysis showing impact of +/- 1% change in assumed discount rate (i.e. a proxy for plan duration)
Cost-sharing plan allocation
Estimated based on proportionate share of total plan annual contributions;Proportionate shares disclosed under new standards will be used, provided Moody’s views them as reasonable
Proportionate share aligns with method used by plan for determining contributions
Annual CostsAmortize ANPL over 20 years on a level dollar basis with no adjustments to Normal Cost;Historical contributions relative to plan reported actuarial requirements also considered
No longer provides standard for annual funding
Reporting and accounting requirement? No Yes, replaces GASB 25 and 27
Moody’s Pension Adjustments Compared with New GASB Standards

80May 2014
© 2010 Moody’s Investors Service, Inc. and/or its licensors and affiliates (collectively, “MOODY’S”). All rights reserved.
CREDIT RATINGS ARE MOODY'S INVESTORS SERVICE, INC.'S (“MIS”) CURRENT OPINIONS OF THE RELATIVE FUTURE CREDIT RISK OF ENTITIES, CREDIT COMMITMENTS, OR DEBT OR DEBT-LIKE SECURITIES. MIS DEFINES CREDIT RISK AS THE RISK THAT AN ENTITY MAY NOT MEET ITS CONTRACTUAL, FINANCIAL OBLIGATIONS AS THEY COME DUE AND ANY ESTIMATED FINANCIAL LOSS IN THE EVENT OF DEFAULT. CREDIT RATINGS DO NOT ADDRESS ANY OTHER RISK, INCLUDING BUT NOT LIMITED TO: LIQUIDITY RISK, MARKET VALUE RISK, OR PRICE VOLATILITY. CREDIT RATINGS ARE NOT STATEMENTS OF CURRENT OR HISTORICAL FACT. CREDIT RATINGS DO NOT CONSTITUTE INVESTMENT OR FINANCIAL ADVICE, AND CREDIT RATINGS ARE NOT RECOMMENDATIONS TO PURCHASE, SELL, OR HOLD PARTICULAR SECURITIES. CREDIT RATINGS DO NOT COMMENT ON THE SUITABILITY OF AN INVESTMENT FOR ANY PARTICULAR INVESTOR. MIS ISSUES ITS CREDIT RATINGS WITH THE EXPECTATION AND UNDERSTANDING THAT EACH INVESTOR WILL MAKE ITS OWN STUDY ANDEVALUATION OF EACH SECURITY THAT IS UNDER CONSIDERATION FOR PURCHASE, HOLDING, OR SALE.
ALL INFORMATION CONTAINED HEREIN IS PROTECTED BY LAW, INCLUDING BUT NOT LIMITED TO, COPYRIGHT LAW, AND NONE OF SUCH INFORMATION MAY BE COPIED OR OTHERWISE REPRODUCED, REPACKAGED, FURTHER TRANSMITTED, TRANSFERRED, DISSEMINATED, REDISTRIBUTED OR RESOLD, OR STORED FOR SUBSEQUENT USE FOR ANY SUCH PURPOSE, IN WHOLE OR IN PART, IN ANY FORM OR MANNER OR BY ANY MEANS WHATSOEVER, BY ANY PERSONWITHOUT MOODY’S PRIOR WRITTEN CONSENT. All information contained herein is obtained by MOODY’S from sources believed by it to be accurate and reliable. Because of the possibility of human or mechanical error as well as other factors, however, all information contained herein is provided “AS IS” without warranty of any kind. Except as expressly stated otherwise, MOODY’S has not verified, audited or validated independently any information received in the rating process, nor will it do so. Under no circumstances shall MOODY’S have any liability to any person or entity for (a) any loss or damage in whole or in part caused by, resulting from, or relating to, any error (negligent or otherwise) or other circumstance or contingency within or outside the control of MOODY’S or any of its directors, officers, employees or agents in connection with the procurement, collection, compilation, analysis, interpretation, communication, publication or delivery of any such information, or (b) any direct, indirect, special, consequential, compensatory or incidental damages whatsoever (including without limitation, lost profits), even if MOODY’S is advised in advance of the possibility of such damages, resulting from the use of or inability to use, any such information. The ratings, financial reporting analysis, projections, and other observations, if any, constituting part of the information contained herein are, and must be construed solely as, statements of opinion and not statements of fact or recommendations to purchase, sell or hold any securities. Each user of the information contained herein must make its own study and evaluation of each security it may consider purchasing, holding or selling. NO WARRANTY, EXPRESS OR IMPLIED, AS TO THE ACCURACY, TIMELINESS, COMPLETENESS, MERCHANTABILITY OR FITNESS FOR ANY PARTICULAR PURPOSE OF ANY SUCH RATING OR OTHER OPINION ORINFORMATION IS GIVEN OR MADE BY MOODY’S IN ANY FORM OR MANNER WHATSOEVER.
MIS, a wholly-owned credit rating agency subsidiary of Moody’s Corporation (“MCO”), hereby discloses that most issuers of debt securities (including corporate and municipal bonds, debentures, notes and commercial paper) and preferred stock rated by MIS have, prior to assignment of any rating, agreed to pay to MIS for appraisal and rating services rendered by it fees ranging from $1,500 to approximately $2,500,000. MCO and MIS also maintain policies and procedures to address the independence of MIS’s ratings and rating processes. Information regarding certain affiliations that may exist between directors of MCO and rated entities, and between entities who hold ratings from MIS and have also publicly reported to the SEC an ownership interest in MCO of more than 5%, is posted annually at www.moodys.com under the heading “Shareholder Relations — Corporate Governance — Director and Shareholder Affiliation Policy.”
Any publication into Australia of this document is by MOODY’S affiliate, Moody’s Investors Service Pty Limited ABN 61 003 399 657, which holds Australian Financial Services License no. 336969. This document is intended to be provided only to “wholesale clients” within the meaning of section 761G of the Corporations Act 2001. By continuing to access this document from within Australia, you represent to MOODY’S that you are, or are accessing the document as a representative of, a “wholesale client” and that neither you nor the entity you represent will directly or indirectly disseminate this document or its contents to “retail clients” within the meaning of section 761G of the Corporations Act 2001.
Presenters:
Date:
Rating Agencies: How New Evaluation Criteria Could Impact Your Rating
• Kathleen Aho, Springstead, Inc.• Nancy Winkler, City of Philadelphia, PA• Lois Scott, City of Chicago, IL
05/19/2014

Credit Ratings – Issuer Panelo City of Philadelphia – Nancy Winkler
Rating case study, newer rating agencies
o City of Chicago – Lois ScottRating case study, University of Chicago Project, managing your rating agency relationship
o Springsted Incorporated – Kathleen AhoChanging criteria and small to mid‐sized issuers, preparing a presentation, managing your rating agency relationship
82

What is a bond rating?o An opinion by a rating agency on the credit worthiness of a bond issue• Rating is determined by issue’s credit characteristics• General obligation ratings often viewed by issuers as a report card
o Major bond rating agencies• Standard & Poor's Rating Services (S&P) 95% of ratings
• Moody’s Investor Services (Moody’s) worldwide*
• Fitch Ratings (Fitch)
* Municipal and corporate ratings
83
Why do you care about them?
o Primary ‐ Financial implications• Higher rating = lower interest rate• Higher rating = lower underwriting costs
o Ancillary ‐ Bragging rights• Outside, independent perspective on how you are doing
• Can be a reward for good management and tough decisions
• Source of pride
84

Borrowing Cost Implications
+.10 - .25% +.35 - .50% +.55 - .65%
Maturity Aaa/AAA Aa/AA A/A Baa/BBB
5 years 1.25% 1.35% 1.70% 2.25%
10 years 2.30% 2.50% 2.95% 3.60%
15 years 2.80% 3.00% 3.50% 4.15%
20 years 3.15% 3.40% 3.85% 4.45%
85

Newly published G.O. criteriao S & P
• Implemented October 2013• New criteria do not apply to schools • A review of all issuers is being done
• Target completion date – 12 months• Projected 30% upgrades, 10% downgrades, 60% unchanged
o Moody’s• Implemented January 2014• 256 issuers that may change are being reviewed
• Target completion date – 90 to 180 days• 132 potential upgrades and 124 potential downgrades
86
Newly published G.O. criteriao Fitch
• No formal revision made to their existing criteria, but refined on an ongoing basis.
All issuers will undergo more frequent formal reviews even if debt isn’t issued
87

What gets measured is consistent among agencies
o Economy
o Entity financial characteristics
oManagement and institutional framework
oDebt and pensions
88
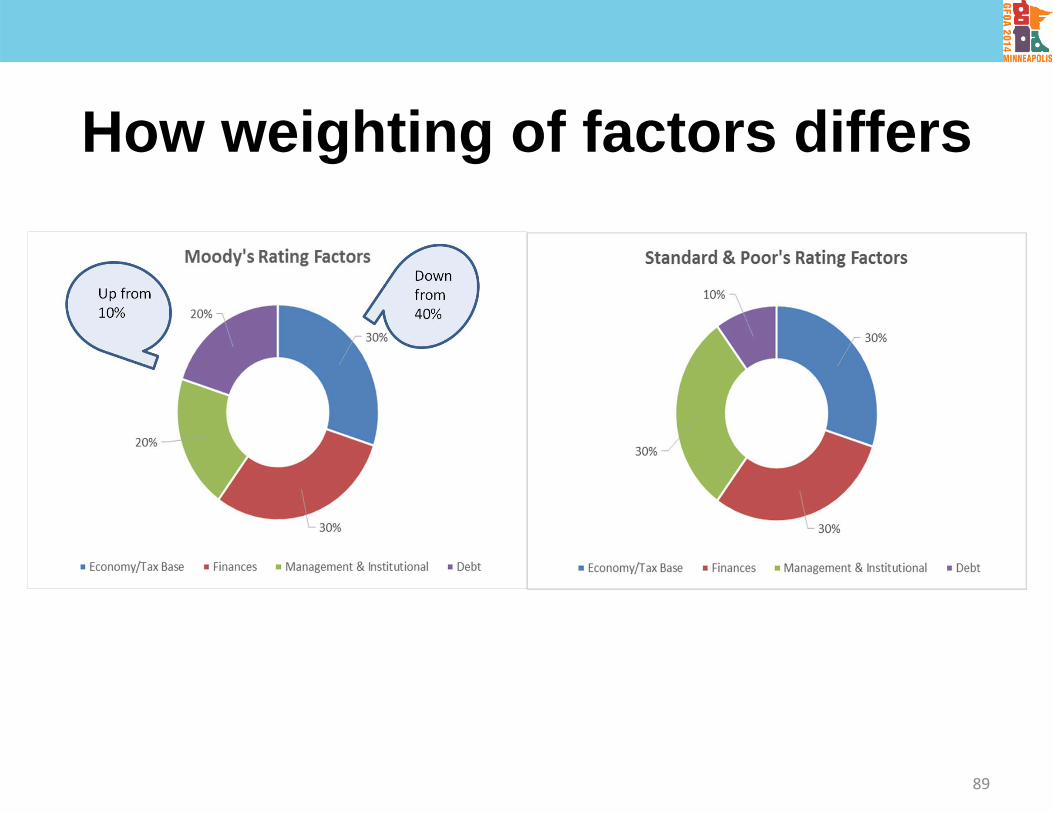
How weighting of factors differs
Up from 10%
Down from 40%
89

New published criteria – impact on issuers
o More consistency in approacho Focused training for rating analystso More quantitative, specific approacho More demanding credit interviews, particularly the initial review following implementation
o Modifications to and specific delineation of credit factors• Identifies what is being looked at, import• More reliance on factual statistics vs. improvements‐in‐process
90

Ratings under new criteriao Issuer conferenceo Agency develops a “score” for the credito Score is adjusted by qualitative factorso Rating cap is applied, if applicable (S&P)o Internal credit committee assesses analysiso Result provided to issuer, draft report provided
o 2 hour window to review draft reporto Rating released, report provided to the market 91

Preparing for a ratingo Time your issue appropriately
• Release of key data, such as CAFR• Major events, such as significant debt retirement• Major events, such as legislative action
o Review your previous credit reports and rating conference notes
o Review current events that may be significant – good or bad
92

Preparing for a ratingo Request a copy of the scorecard, both the initial one and the one that goes to the credit committee
o Understand the rating factors
o Translate your data into information that aligns with the factors• How do you best position yourself in weak areas?• How do you communicate your strengths?
93

Preparing for a ratingo Have you made a purposeful decision about who needs to attend?• Elected/appointed official?• Chief administrator?• Chief finance person √• Community development?• Property Assessor?• Other experts?
• City hospital finance director• Public works director• Parks and recreation director
94

Preparing for a ratingo Do you have a list of key topical areas that will be covered, information to address those areas, speaking points?
o Know what key points you need to make so they don’t get overlooked
o You may receive questions in advance• Look beyond the facts of the question – what is trying to be addressed?
• Develop answers to them
95

Preparing for a ratingo The best preparation for a rating happens over the course of routine business• Good financial reporting, with checkpoints for your Board/Council
• Long range capital and financial planning• Policies that guide decisions/actions in key areas, and demonstrated adherence to those policies
• Good communication to Board/Council/Citizens about entity’s actions and condition
• Demonstrable evidence of ability and willingness to manage; agility
96

Managing the relationshipo Decide if your issuance pattern merits a formal, ongoing communication plan
o Assemble the right team – day‐to‐day and at conference time
o Focus your message – where’s the beef?o Avoid surprises – communicate challenges and plans to address them
o Play it straight
97

Managing the relationshipo You’ve decided a rating is worthwhile, invest in it• Know which of the factors impact your rating and how
• Financial reports vary. Explain your operations in a way that translates to accurate credit evaluation
• Identify weaknesses and address those you control before rating time
• Management• Debt management• Long‐range strategic planning
98
Rating Agencies: How New Evaluation Criteria Could
Impact Your Rating