rating: buy | cmp: rs533 | tp: rs637
TRANSCRIPT
July 7, 2021 1
Rating: BUY | CMP: Rs533 | TP: Rs637
Heading into right direction
Quick Pointers:
Revenue growth trajectory to shift up with 17% CAGR over FY21-23 v/s
2.4%/4.7% CAGR over FY15-20/FY10-20.
Highest ever deal win TCV, +33% YoY growth in 2HFY21 with two mega deals.
Org structure and new leadership aligned to new strategic priorities coupled
with fast paced execution to accelerate revenues over medium term.
Wipro’s new CEO, Thierry Delaporte, (appointed on 6th July 2020) has
radically changed company’s operating model by 1) simplifying organization
structure and reducing P&Ls from 25 to 4, 2) overhauling senior management,
3) focusing on M&A to fast-track capability building as well as access
different geos and 4) bringing in sales orientation with centralized large deal
teams client centric structure. Thierry took some bold decisions and
executed them with speed, so that entire organization gets aligned with the
new strategy. We believe, Wipro’s turnaround effort is right on track given 1)
rise in large and mega deals wins (US4 1.4 Bn, 16.6% QoQ in 4QFY21) 2)
uptrend in revenue growth rate (strong organic guidance of 2-4% QoQ CC for
1QFY22E vs avg 0.5% QoQ in last 3 years) and 3) speedy closure of Capco
acquisition to further accelerate 1Q22 revenues. The company reported
19.4% EBIT margin, strong ~300 bps YoY increase in FY21 underscoring new
CEO’s focus on profitable growth.
We are upgrading Wipro’s multiple to 25X (earlier 20X, 10.7%/16% discount to
Infy/TCS resp.) given 1) new management’s aggressive yet sharp focus
towards growth can potentially lift up and sustain revenue growth trajectory
over medium term and 2) maintain EBIT margins between ~18-19% (vs 15-16%
of pre-covid levels). We forecast Wipro’s IT services organic growth of 15.5%
and US$ 587 mn revenue from Capco resulting in consolidated revenue
growth of 22.4% in FY22 (Exhibit 7). We assign BUY rating (earlier UNDER
REVIEW) and value Wipro on 25X FY-23 EPS of Rs.25.5 to arrive at changed
TP of INR 637. Wipro is currently trading at 24/21 for FY22/23E earnings of
INR 22/25 respectively with EPS CAGR of 16% for FY21-23 respectively.
Radical change in operating model
CEO Thierry Delaporte has brought about radical changes to Wipro's operating
structure, with an objective to growth the company at a pace closer to larger peers
(TCS/INFY) and at the same time deliver sustained margin performance.
Simplified org structure to drive agility and reduce overlapping costs:
New simplified operating model has replaced traditional 3 axes (7 industry
verticals, 5 service lines & 3 geos) with 2 axes comprising of 4 Strategic Market
Units (SMUs) – Americas 1, Americas 2, Europe & APMEA and 2 Global
Business Lines (GBLs) – iDEAS and iCORE. The new model has also reduced
P&Ls from 25 to just 4 which will be owned by the 4 SMUs. Speed of adopting
to this change is phenomenal with new organization structure coming into
Wipro (WPRO IN)
July 7, 2021
Company Update
Change in Estimates | ☑ Target | ☑ Reco
Change in Estimates
Current Previous
FY22E FY23E FY22E FY23E
Rating BUY UNDER REVIEW
Target Price 637 -
Sales (Rs. m) 7,57,854 8,71,383 7,57,854 8,71,383
% Chng. - -
EBITDA (Rs. m)1,67,892 1,93,173 1,67,892 1,93,173
% Chng. - -
EPS (Rs.) 22.0 25.5 22.0 25.5
% Chng. - -
Key Financials - Consolidated
Y/e Mar FY20 FY21 FY22E FY23E
Sales (Rs. bn) 610 619 758 871
EBITDA (Rs. bn) 122 149 168 193
Margin (%) 20.0 24.0 22.2 22.2
PAT (Rs. bn) 97 108 124 144
EPS (Rs.) 16.7 19.1 22.0 25.5
Gr. (%) 12.0 14.7 14.8 16.1
DPS (Rs.) 1.0 1.0 1.0 1.0
Yield (%) 0.2 0.2 0.2 0.2
RoE (%) 17.3 19.4 20.3 19.5
RoCE (%) 15.6 18.9 19.8 19.4
EV/Sales (x) 4.7 4.4 3.5 2.9
EV/EBITDA (x) 23.3 18.5 15.9 13.0
PE (x) 32.0 27.9 24.3 20.9
P/BV (x) 5.6 5.4 4.5 3.7
Key Data WIPR.BO | WPRO IN
52-W High / Low Rs.565 / Rs.219
Sensex / Nifty 52,861 / 15,818
Market Cap Rs.2,918bn/ $ 39,144m
Shares Outstanding 5,479m
3M Av g. Daily Value Rs.12216.47m
Shareholding Pattern (%)
Promoter’s 74.37
Foreign 8.46
Domestic Institution 6.08
Public & Others 11.09
Promoter Pledge (Rs bn) -
Stock Performance (%)
1M 6M 12M
Absolute (1.6) 31.1 139.2
Relativ e (3.0) 19.4 65.1
Aniket Pande
[email protected] | 91-22-66322300
Aditi Patil

Wipro
July 7, 2021 2
effect in Jan-21, within just six months of new CEOs appointment. This
simplification is expected to reduce overlapping efforts and costs, enable faster
decision making and drive agility and take the company closer to its vision of
One Wipro.
Focus on only selective high performing verticals in a specific geo: Wipro
is now focusing on only selective high performing verticals in a particular
geography and does not have dedicated resources for all verticals in all
geographies. Though de-prioritized sectors/geos contributed to only 2-3% of
revenues, yet significant portion of investments & resources that were tied up
can now be used to invest in focus areas.
Exhibit 1: Simplification of operating model has brought down 25 P&Ls to just 4
Source: Company, PL
Moved closer to clients: With an aim to make the company more client centric
and sales oriented, Wipro has assigned global account executive (GAE) to its
key accounts, top 80-100 accounts. GAEs have higher accountability and
decision making authority. They will be level 3/4 executives (vs. level 6/7
previously) and will represent 25% of top 200 leaders (vs. ~3% previously).
Shift to geography focused model and recent top leadership hires in Europe,
Brazil, ANZ, Japan who are local leaders in these regions also aligns with their
strategy of moving closer to clients. Thes e leaders can drive deeper client
relationships due to better understanding of the market.
Overhauled top leadership to energize growth: Wipro has brought in
several external hires in senior leadership positions with an objective of
strengthening sales capability and taking revenue growth trajectory to next
level. New leadership hires are from reputed global Tier-1 organizations and
are locals in their respective markets. Wipro has appointed Stephanie
Trautman from Accenture for the key role of Chief Growth Officer. She will be
responsible for driving sales and large deal focus. Most of their leadership team
is in place and the company will continue to hire GAEs.
Wipro
July 7, 2021 3
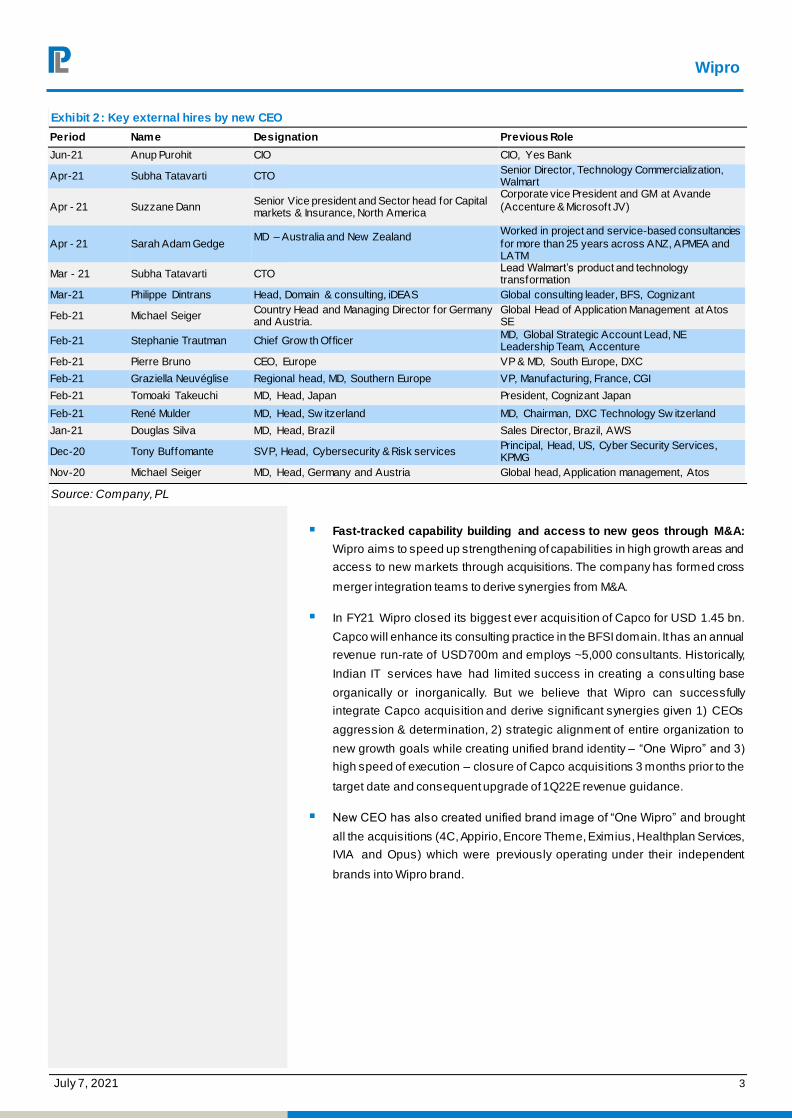
Exhibit 2: Key external hires by new CEO
Period Name Designation Previous Role
Jun-21 Anup Purohit CIO CIO, Yes Bank
Apr-21 Subha Tatavarti CTO Senior Director, Technology Commercialization, Walmart
Apr - 21 Suzzane Dann Senior Vice president and Sector head for Capital markets & Insurance, North America
Corporate vice President and GM at Avande
(Accenture & Microsoft JV)
Apr - 21 Sarah Adam Gedge MD – Australia and New Zealand
Worked in project and service-based consultancies
for more than 25 years across ANZ, APMEA and LATM
Mar - 21 Subha Tatavarti CTO Lead Walmart’s product and technology transformation
Mar-21 Philippe Dintrans Head, Domain & consulting, iDEAS Global consulting leader, BFS, Cognizant
Feb-21 Michael Seiger Country Head and Managing Director for Germany and Austria.
Global Head of Application Management at Atos SE
Feb-21 Stephanie Trautman Chief Grow th Officer MD, Global Strategic Account Lead, NE Leadership Team, Accenture
Feb-21 Pierre Bruno CEO, Europe VP & MD, South Europe, DXC
Feb-21 Graziella Neuvéglise Regional head, MD, Southern Europe VP, Manufacturing, France, CGI
Feb-21 Tomoaki Takeuchi MD, Head, Japan President, Cognizant Japan
Feb-21 René Mulder MD, Head, Sw itzerland MD, Chairman, DXC Technology Sw itzerland
Jan-21 Douglas Silva MD, Head, Brazil Sales Director, Brazil, AWS
Dec-20 Tony Buffomante SVP, Head, Cybersecurity & Risk services Principal, Head, US, Cyber Security Services, KPMG
Nov-20 Michael Seiger MD, Head, Germany and Austria Global head, Application management, Atos
Source: Company, PL
Fast-tracked capability building and access to new geos through M&A:
Wipro aims to speed up strengthening of capabilities in high growth areas and
access to new markets through acquisitions. The company has formed cross
merger integration teams to derive synergies from M&A.
In FY21 Wipro closed its biggest ever acquisition of Capco for USD 1.45 bn.
Capco will enhance its consulting practice in the BFSI domain. It has an annual
revenue run-rate of USD700m and employs ~5,000 consultants. Historically,
Indian IT services have had limited success in creating a consulting base
organically or inorganically. But we believe that Wipro can successfully
integrate Capco acquisition and derive significant synergies given 1) CEOs
aggression & determination, 2) strategic alignment of entire organization to
new growth goals while creating unified brand identity – “One Wipro” and 3)
high speed of execution – closure of Capco acquisitions 3 months prior to the
target date and consequent upgrade of 1Q22E revenue guidance.
New CEO has also created unified brand image of “One Wipro” and brought
all the acquisitions (4C, Appirio, Encore Theme, Eximius, Healthplan Services,
IVIA and Opus) which were previously operating under their independent
brands into Wipro brand.

Wipro
July 7, 2021 4
Exhibit 3: 6 acquisitions done in FY21 vs avg 2-3 acquisitions per year
Date Target Country Business description Consideration (mn) Sales (mn) Price/Sales
Apr-21 Ampion Australia Cybersecurity, DevOps & quality eng services US$117 US$85.5 1.4
Mar-21 Capco UK Global management and technology consultancy US$1450 US$720 2
Oct-20 Encore Theme India Finastra trade f inance solutions' implementation INR 950 INR 545 1.7
Oct-20 Eximius Design US VLSI and systems design engineering services US$80 US$35 2.3
Jul-20 4C Belgium Salesforce services EUR 68 EUR 31.8 2.1
Jul-20 IVIA Brazil IT services provider in Brazil US$22.4 US$13.5 1.7
Feb-20 Rational Interaction USA CRM, digital marketing US$52 NA NA
Jun-19 International
TechneGroup US Engineering services f irm US$45 US$23.2 1.9
Dec-18 Syfte Australia Strategic design consultancy NA NA NA
Oct-17 Cooper Softw are
Inc US Design and User Experience f irm US$8.5 US$8 1.1
Jun-17 IBM IP deal US IP partnership US$90 US$30 3
Jan-17 InfoSERVER Brazil A specialized IT services provider for BFSI in Brazil US$8.7 US$11 0.8
Oct-16 Appirio US Cloud services provider US$500 US$196 2.6
Feb-16 HealthPlan
Services US BPaaS provider US$460 US$223 2.1
Dec-15 celllent AG Germany IT services EUR 73.5 EUR 87.0 0.8
Jul-15 Designit Denmark Strategic design f irm EUR 85.0 EUR 27.0 3.1
Mar-15 Drivestream Inc US Consulting in Oracle cloud services US$5 NA NA
Jan-14 Opus Capital Markets
Consultants
US Risk management solutions for mortgage industry US$75 EUR 43.0 1.7
Apr-12 Promax
Applications Group Australia Trade promotion planning and optimization US$36.75 US$16.8 $2.2
Apr-11 SAIC US IT Services - Oil & Gas US$150 EUR 188.0 0.8
Dec-08 Citos US Infrastructure Management Services, ADM for BFSI US$127 US$80 $1.6
Source: Company, PL
Early signs of successful execution of turnaround plan
Wipro’s turnaround effort under new CEO is right on track given rise in large and
mega deals wins, uptrend in revenue growth rate and speedy closure of Capco
acquisition. He has energized the organization with an aspiration to drive industry
leading growth.
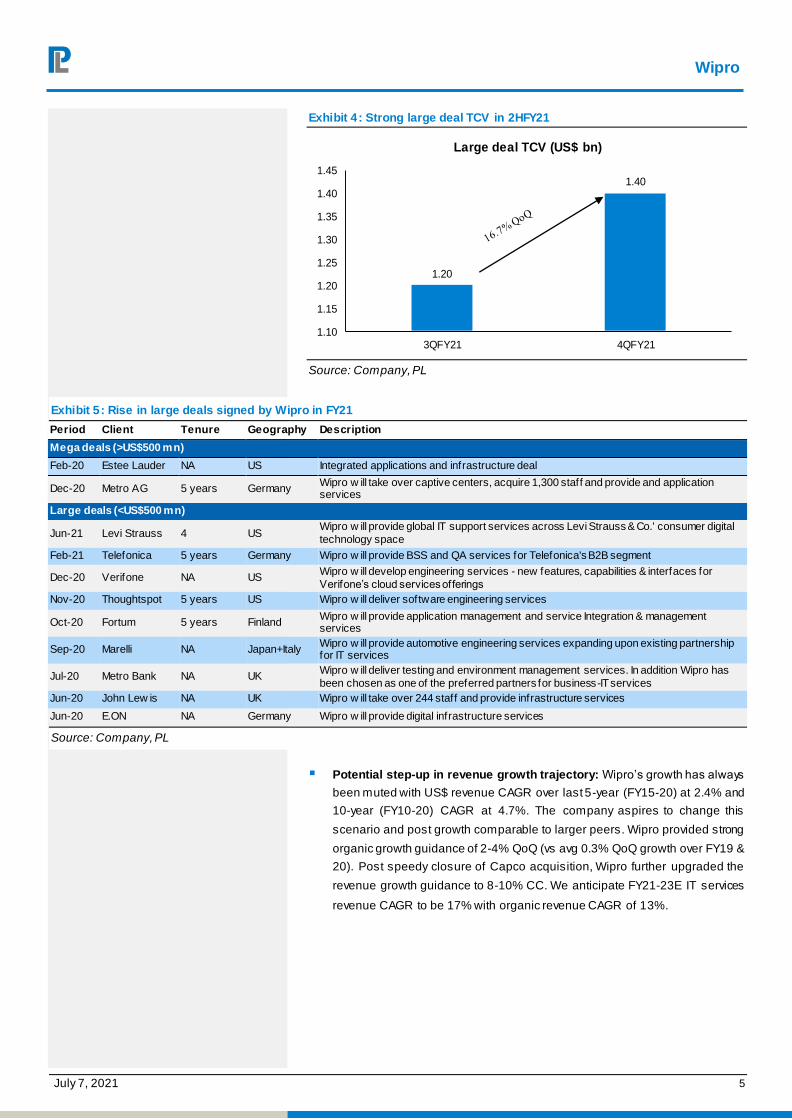
Increase in mega & large deal wins: Creation of centralized large deal teams,
client centric approach and new sales oriented organization is yielding results.
Wipro announced two mega deals in 2HFY21 – 1) deal with Estee Lauder in
Consumer space with potential TCV of US$ 1Bn and 2) 5-year US$ 700 mn
deal with Metro AG. Large deal TCV of US$ 1.4 Bn in 4QFY21 was 16.7%
higher QoQ and in 2HFY21 deal TCV increased by 33% YoY. Most of the large
deal wins are from new clients and will lead to strong ramp up in revenue in
FY22. Management also mentioned that there are more number of large deals
in the pipeline compared to previous year.
Wipro
July 7, 2021 5
Exhibit 4: Strong large deal TCV in 2HFY21
1.20
1.40
1.10
1.15
1.20
1.25
1.30
1.35
1.40
1.45
3QFY21 4QFY21
Large deal TCV (US$ bn)
Source: Company, PL
Exhibit 5: Rise in large deals signed by Wipro in FY21
Period Client Tenure Geography Description
Mega deals (>US$500 mn)
Feb-20 Estee Lauder NA US Integrated applications and infrastructure deal
Dec-20 Metro AG 5 years Germany Wipro w ill take over captive centers, acquire 1,300 staff and provide and application services
Large deals (<US$500 mn)
Jun-21 Levi Strauss 4 US Wipro w ill provide global IT support services across Levi Strauss & Co.' consumer digital
technology space
Feb-21 Telefonica 5 years Germany Wipro w ill provide BSS and QA services for Telefonica's B2B segment
Dec-20 Verifone NA US Wipro w ill develop engineering services - new features, capabilities & interfaces for
Verifone’s cloud services offerings
Nov-20 Thoughtspot 5 years US Wipro w ill deliver software engineering services
Oct-20 Fortum 5 years Finland Wipro w ill provide application management and service Integration & management services
Sep-20 Marelli NA Japan+Italy Wipro w ill provide automotive engineering services expanding upon existing partnership for IT services
Jul-20 Metro Bank NA UK Wipro w ill deliver testing and environment management services. In addition Wipro has
been chosen as one of the preferred partners for business-IT services
Jun-20 John Lew is NA UK Wipro w ill take over 244 staff and provide infrastructure services
Jun-20 E.ON NA Germany Wipro w ill provide digital infrastructure services
Source: Company, PL
Potential step-up in revenue growth trajectory: Wipro’s growth has always
been muted with US$ revenue CAGR over last 5-year (FY15-20) at 2.4% and
10-year (FY10-20) CAGR at 4.7%. The company aspires to change this
scenario and post growth comparable to larger peers. Wipro provided strong
organic growth guidance of 2-4% QoQ (vs avg 0.3% QoQ growth over FY19 &
20). Post speedy closure of Capco acquisition, Wipro further upgraded the
revenue growth guidance to 8-10% CC. We anticipate FY21-23E IT services
revenue CAGR to be 17% with organic revenue CAGR of 13%.

Wipro
July 7, 2021 6
Exhibit 6: Uptrend in YoY US$ revenue growth
2.9% 2.1%3.7% 2.8% 2.5% 2.0% 2.4%
-0.1%
-5.7%-2.8%
-1.1%
3.8%
22.2%
-12.0%
-8.0%
-4.0%
0.0%
4.0%
8.0%
12.0%
16.0%
20.0%
24.0%
28.0%
1Q
19
2Q
19
3Q
19
4Q
19
1Q
20
2Q
20
3Q
20
4Q
20
1Q
21
2Q
21
3Q
21
4Q
21
1Q
22E
YoY USD gowth
Infosys TCS Wipro (IT Services)
Source: Company, PL, Note: Wipro’s growth rates are mentioned in chart.
Exhibit 7: Revenue growth assumptions
Revenue growth assumptions FY21 FY22E FY23E
Consolidated US$ revenue grow th -2.4% 22.4% 11.9%
Overall IT Services US$ revenue growth -1.4% 22.7% 11.8%
Organic IT services US$ revenue growth -1.4% 15.5% 11.3%
Capco revenue (US$ mn) 587 706
Source: Company, PL
Exhibit 8: Wipro’s growth trajectory expected to shift upwards closer to peers
-9.0%
5.0%
2.2%3.8%
1.0%3.3%
1.7%
-2.4%
22.4%
11.9%
-15.0%
-10.0%
-5.0%
0.0%
5.0%
10.0%
15.0%
20.0%
25.0%
FY14 FY15 FY16 FY17 FY18 FY19 FY20 FY21 FY22E FY23E
USD Revenue growth
TCS Infosys Wipro
Source: Company, PL
Focus of driving profitable growth: Wipro reported strong ~300 bps YoY
increase in margins in FY21 underscoring new CEO’s focus on profitable
growth. There are headwinds to margins- 1) Wage hike rollouts and 2) Capco
integration to impact margins by ~200 bps in FY22 due to non-cash charges &
incentive plans. But we anticipate margins to be >18%, around 150-200 bps
above pre-covid levels aided by revenue growth leverage, operating
efficiencies derived from simplifying org structure and higher offshoring.

Wipro
July 7, 2021 7
Exhibit 9: EBIT margins to expected to be above 18%
18.2%
15.6% 15.2% 15.8%16.6%
19.4%18.1% 18.3% 18.3%
0.0%
5.0%
10.0%
15.0%
20.0%
25.0%
FY16 FY17 FY18 FY19 FY20 FY21 FY22E FY23E FY24E
EBIT Margin
Source: Company, PL
Exhibit 10: Sharp improvement in margins in FY21
15.8
%
16.4
%
14.3
% 16.2
%
16.8
%
14.3
%
13.7
%
14.3
%
13.2
%
18.4
%
17.0
%
16.2
%
17.3
%
17.1
%
15.9
%
17.2
% 18.5
%
21.3
%
20.5
%
10.0%
12.0%
14.0%
16.0%
18.0%
20.0%
22.0%
2Q
17
3Q
17
4Q
17
1Q
18
2Q
18
3Q
18
4Q
18
1Q
19
2Q
19
3Q
19
4Q
19
1Q
20
2Q
20
3Q
20
4Q
20
1Q
21
2Q
21
3Q
21
4Q
21
EBIT Margins
Source: Company, PL
Exhibit 11: ROE improved by 200bps in FY21
20%
17%16%
17% 17%19%
FY16 FY17 FY18 FY19 FY20 FY21
RoE
Source: Company, PL
Exhibit 12: Healthy payout levels
121%
53%
187%
6%
143%
79%
FY16 FY17 FY18 FY19 FY20 FY21
Payout as % of FCF
Source: Company, PL, Note: FY19 payout spilled over to FY20
Wipro
July 7, 2021 8
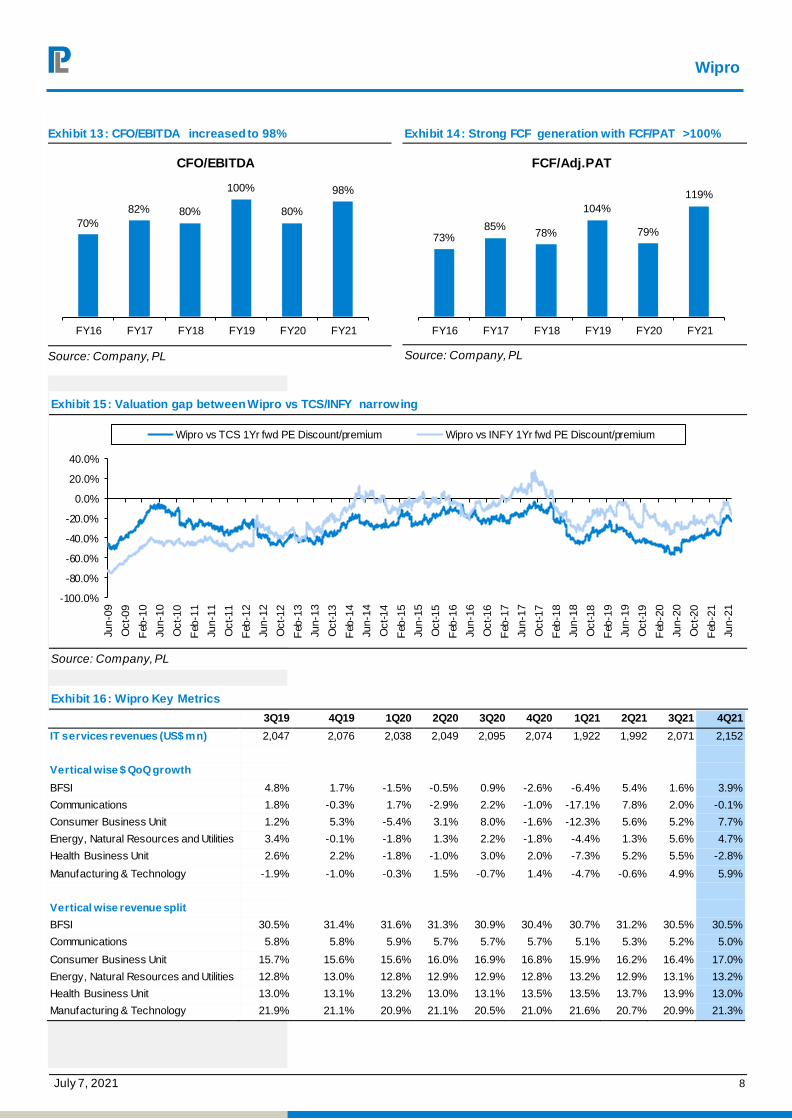
Exhibit 13: CFO/EBITDA increased to 98%
70%
82% 80%
100%
80%
98%
FY16 FY17 FY18 FY19 FY20 FY21
CFO/EBITDA
Source: Company, PL
Exhibit 14: Strong FCF generation with FCF/PAT >100%
73%85%
78%
104%
79%
119%
FY16 FY17 FY18 FY19 FY20 FY21
FCF/Adj.PAT
Source: Company, PL
Exhibit 15: Valuation gap between Wipro vs TCS/INFY narrowing
-100.0%
-80.0%
-60.0%
-40.0%
-20.0%
0.0%
20.0%
40.0%
Jun-0
9
Oct-09
Feb
-10
Jun-1
0
Oct-10
Feb
-11
Jun-1
1
Oct-11
Feb
-12
Jun-1
2
Oct-12
Feb
-13
Jun-1
3
Oct-13
Feb
-14
Jun-1
4
Oct-14
Feb
-15
Jun-1
5
Oct-15
Feb
-16
Jun-1
6
Oct-16
Feb
-17
Jun-1
7
Oct-17
Feb
-18
Jun-1
8
Oct-18
Feb
-19
Jun-1
9
Oct-19
Feb
-20
Jun-2
0
Oct-20
Feb
-21
Jun-2
1
Wipro vs TCS 1Yr fwd PE Discount/premium Wipro vs INFY 1Yr fwd PE Discount/premium
Source: Company, PL
Exhibit 16: Wipro Key Metrics
3Q19 4Q19 1Q20 2Q20 3Q20 4Q20 1Q21 2Q21 3Q21 4Q21
IT services revenues (US$ mn) 2,047 2,076 2,038 2,049 2,095 2,074 1,922 1,992 2,071 2,152
Vertical wise $ QoQ growth
BFSI 4.8% 1.7% -1.5% -0.5% 0.9% -2.6% -6.4% 5.4% 1.6% 3.9%
Communications 1.8% -0.3% 1.7% -2.9% 2.2% -1.0% -17.1% 7.8% 2.0% -0.1%
Consumer Business Unit 1.2% 5.3% -5.4% 3.1% 8.0% -1.6% -12.3% 5.6% 5.2% 7.7%
Energy, Natural Resources and Utilities 3.4% -0.1% -1.8% 1.3% 2.2% -1.8% -4.4% 1.3% 5.6% 4.7%
Health Business Unit 2.6% 2.2% -1.8% -1.0% 3.0% 2.0% -7.3% 5.2% 5.5% -2.8%
Manufacturing & Technology -1.9% -1.0% -0.3% 1.5% -0.7% 1.4% -4.7% -0.6% 4.9% 5.9%
Vertical wise revenue split
BFSI 30.5% 31.4% 31.6% 31.3% 30.9% 30.4% 30.7% 31.2% 30.5% 30.5%
Communications 5.8% 5.8% 5.9% 5.7% 5.7% 5.7% 5.1% 5.3% 5.2% 5.0%
Consumer Business Unit 15.7% 15.6% 15.6% 16.0% 16.9% 16.8% 15.9% 16.2% 16.4% 17.0%
Energy, Natural Resources and Utilities 12.8% 13.0% 12.8% 12.9% 12.9% 12.8% 13.2% 12.9% 13.1% 13.2%
Health Business Unit 13.0% 13.1% 13.2% 13.0% 13.1% 13.5% 13.5% 13.7% 13.9% 13.0%
Manufacturing & Technology 21.9% 21.1% 20.9% 21.1% 20.5% 21.0% 21.6% 20.7% 20.9% 21.3%
Wipro
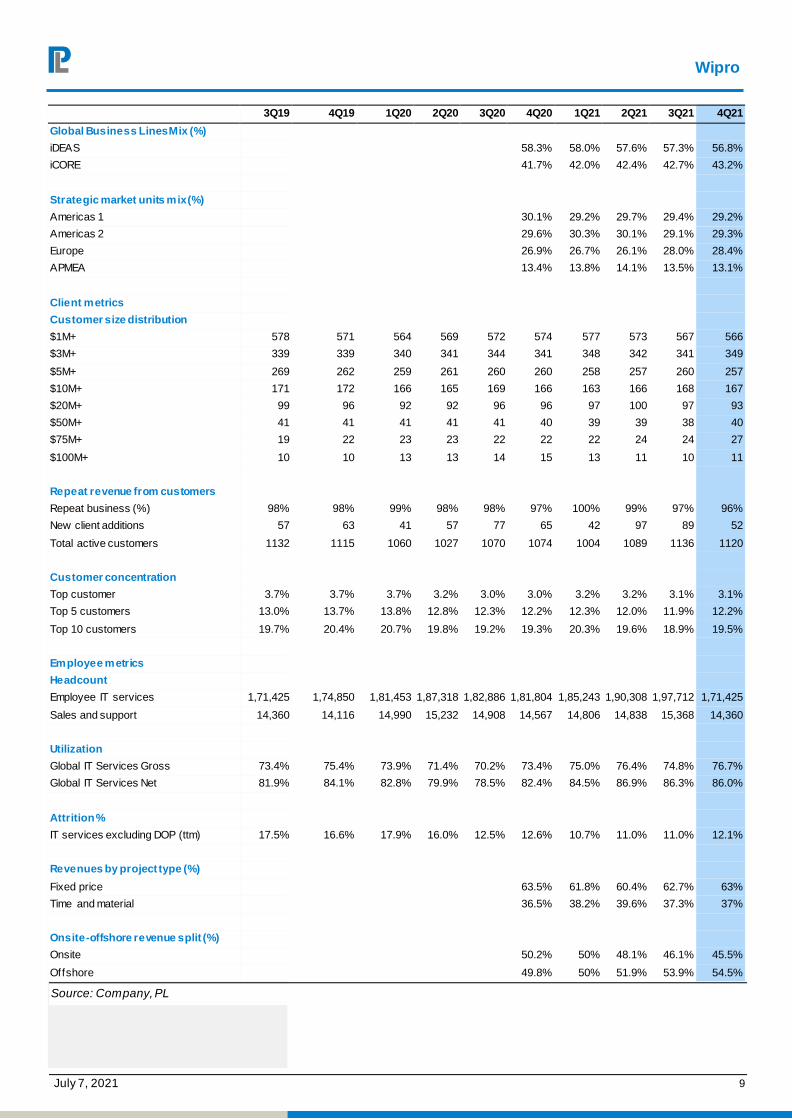
July 7, 2021 9
3Q19 4Q19 1Q20 2Q20 3Q20 4Q20 1Q21 2Q21 3Q21 4Q21
Global Business Lines Mix (%)
iDEAS 58.3% 58.0% 57.6% 57.3% 56.8%
iCORE 41.7% 42.0% 42.4% 42.7% 43.2%
Strategic market units mix (%)
Americas 1 30.1% 29.2% 29.7% 29.4% 29.2%
Americas 2 29.6% 30.3% 30.1% 29.1% 29.3%
Europe 26.9% 26.7% 26.1% 28.0% 28.4%
APMEA 13.4% 13.8% 14.1% 13.5% 13.1%
Client metrics
Customer size distribution
$1M+ 578 571 564 569 572 574 577 573 567 566
$3M+ 339 339 340 341 344 341 348 342 341 349
$5M+ 269 262 259 261 260 260 258 257 260 257
$10M+ 171 172 166 165 169 166 163 166 168 167
$20M+ 99 96 92 92 96 96 97 100 97 93
$50M+ 41 41 41 41 41 40 39 39 38 40
$75M+ 19 22 23 23 22 22 22 24 24 27
$100M+ 10 10 13 13 14 15 13 11 10 11
Repeat revenue from customers
Repeat business (%) 98% 98% 99% 98% 98% 97% 100% 99% 97% 96%
New client additions 57 63 41 57 77 65 42 97 89 52
Total active customers 1132 1115 1060 1027 1070 1074 1004 1089 1136 1120
Customer concentration
Top customer 3.7% 3.7% 3.7% 3.2% 3.0% 3.0% 3.2% 3.2% 3.1% 3.1%
Top 5 customers 13.0% 13.7% 13.8% 12.8% 12.3% 12.2% 12.3% 12.0% 11.9% 12.2%
Top 10 customers 19.7% 20.4% 20.7% 19.8% 19.2% 19.3% 20.3% 19.6% 18.9% 19.5%
Employee metrics
Headcount
Employee IT services 1,71,425 1,74,850 1,81,453 1,87,318 1,82,886 1,81,804 1,85,243 1,90,308 1,97,712 1,71,425
Sales and support 14,360 14,116 14,990 15,232 14,908 14,567 14,806 14,838 15,368 14,360
Utilization
Global IT Services Gross 73.4% 75.4% 73.9% 71.4% 70.2% 73.4% 75.0% 76.4% 74.8% 76.7%
Global IT Services Net 81.9% 84.1% 82.8% 79.9% 78.5% 82.4% 84.5% 86.9% 86.3% 86.0%
Attrition %
IT services excluding DOP (ttm) 17.5% 16.6% 17.9% 16.0% 12.5% 12.6% 10.7% 11.0% 11.0% 12.1%
Revenues by project type (%)
Fixed price 63.5% 61.8% 60.4% 62.7% 63%
Time and material 36.5% 38.2% 39.6% 37.3% 37%
Onsite-offshore revenue split (%)
Onsite 50.2% 50% 48.1% 46.1% 45.5%
Offshore 49.8% 50% 51.9% 53.9% 54.5%
Source: Company, PL
Wipro
July 7, 2021 10
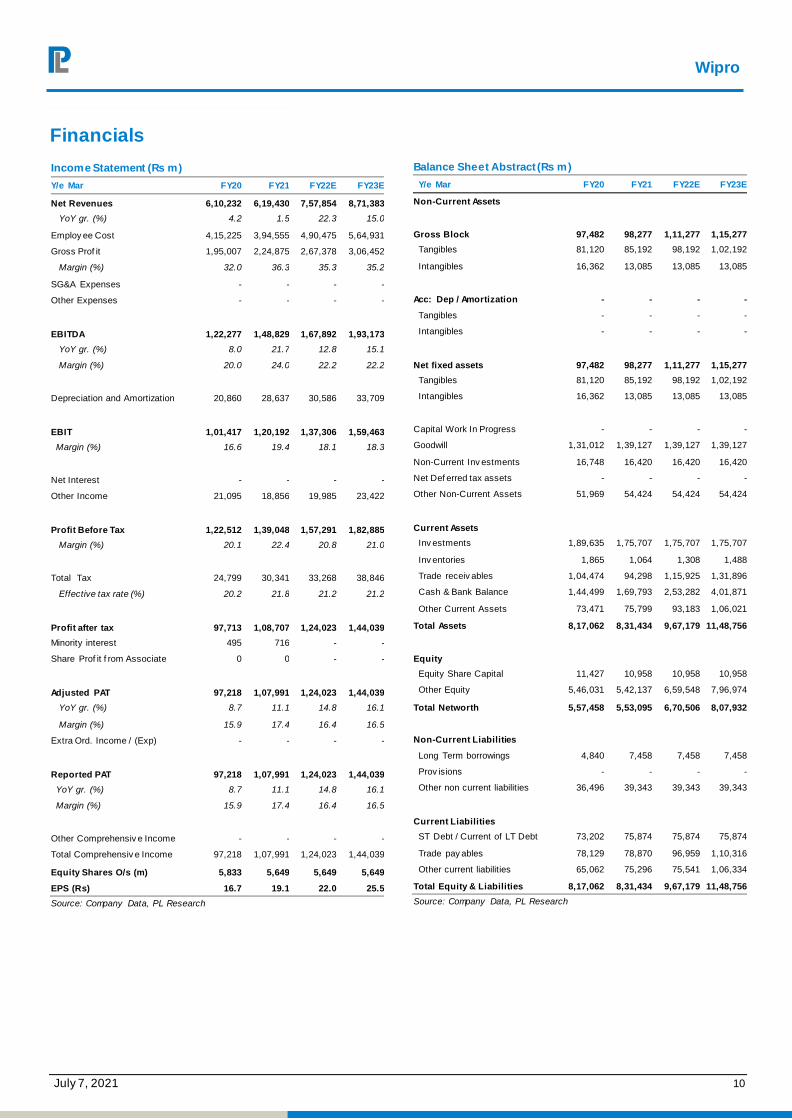
Financials Income Statement (Rs m)
Y/e Mar FY20 FY21 FY22E FY23E
Net Revenues 6,10,232 6,19,430 7,57,854 8,71,383
YoY gr. (%) 4.2 1.5 22.3 15.0
Employ ee Cost 4,15,225 3,94,555 4,90,475 5,64,931
Gross Prof it 1,95,007 2,24,875 2,67,378 3,06,452
Margin (%) 32.0 36.3 35.3 35.2
SG&A Expenses - - - -
Other Expenses - - - -
EBITDA 1,22,277 1,48,829 1,67,892 1,93,173
YoY gr. (%) 8.0 21.7 12.8 15.1
Margin (%) 20.0 24.0 22.2 22.2
Depreciation and Amortization 20,860 28,637 30,586 33,709
EBIT 1,01,417 1,20,192 1,37,306 1,59,463
Margin (%) 16.6 19.4 18.1 18.3
Net Interest - - - -
Other Income 21,095 18,856 19,985 23,422
Profit Before Tax 1,22,512 1,39,048 1,57,291 1,82,885
Margin (%) 20.1 22.4 20.8 21.0
Total Tax 24,799 30,341 33,268 38,846
Effective tax rate (%) 20.2 21.8 21.2 21.2
Profit after tax 97,713 1,08,707 1,24,023 1,44,039
Minority interest 495 716 - -
Share Prof it f rom Associate 0 0 - -
Adjusted PAT 97,218 1,07,991 1,24,023 1,44,039
YoY gr. (%) 8.7 11.1 14.8 16.1
Margin (%) 15.9 17.4 16.4 16.5
Extra Ord. Income / (Exp) - - - -
Reported PAT 97,218 1,07,991 1,24,023 1,44,039
YoY gr. (%) 8.7 11.1 14.8 16.1
Margin (%) 15.9 17.4 16.4 16.5
Other Comprehensiv e Income - - - -
Total Comprehensiv e Income 97,218 1,07,991 1,24,023 1,44,039
Equity Shares O/s (m) 5,833 5,649 5,649 5,649
EPS (Rs) 16.7 19.1 22.0 25.5
Source: Company Data, PL Research
Balance Sheet Abstract (Rs m)
Y/e Mar FY20 FY21 FY22E FY23E
Non-Current Assets
Gross Block 97,482 98,277 1,11,277 1,15,277
Tangibles 81,120 85,192 98,192 1,02,192
Intangibles 16,362 13,085 13,085 13,085
Acc: Dep / Amortization - - - -
Tangibles - - - -
Intangibles - - - -
Net fixed assets 97,482 98,277 1,11,277 1,15,277
Tangibles 81,120 85,192 98,192 1,02,192
Intangibles 16,362 13,085 13,085 13,085
Capital Work In Progress - - - -
Goodwill 1,31,012 1,39,127 1,39,127 1,39,127
Non-Current Inv estments 16,748 16,420 16,420 16,420
Net Def erred tax assets - - - -
Other Non-Current Assets 51,969 54,424 54,424 54,424
Current Assets
Inv estments 1,89,635 1,75,707 1,75,707 1,75,707
Inv entories 1,865 1,064 1,308 1,488
Trade receiv ables 1,04,474 94,298 1,15,925 1,31,896
Cash & Bank Balance 1,44,499 1,69,793 2,53,282 4,01,871
Other Current Assets 73,471 75,799 93,183 1,06,021
Total Assets 8,17,062 8,31,434 9,67,179 11,48,756
Equity
Equity Share Capital 11,427 10,958 10,958 10,958
Other Equity 5,46,031 5,42,137 6,59,548 7,96,974
Total Networth 5,57,458 5,53,095 6,70,506 8,07,932
Non-Current Liabilities
Long Term borrowings 4,840 7,458 7,458 7,458
Prov isions - - - -
Other non current liabilities 36,496 39,343 39,343 39,343
Current Liabilities
ST Debt / Current of LT Debt 73,202 75,874 75,874 75,874
Trade pay ables 78,129 78,870 96,959 1,10,316
Other current liabilities 65,062 75,296 75,541 1,06,334
Total Equity & Liabilities 8,17,062 8,31,434 9,67,179 11,48,756
Source: Company Data, PL Research
Wipro
July 7, 2021 11
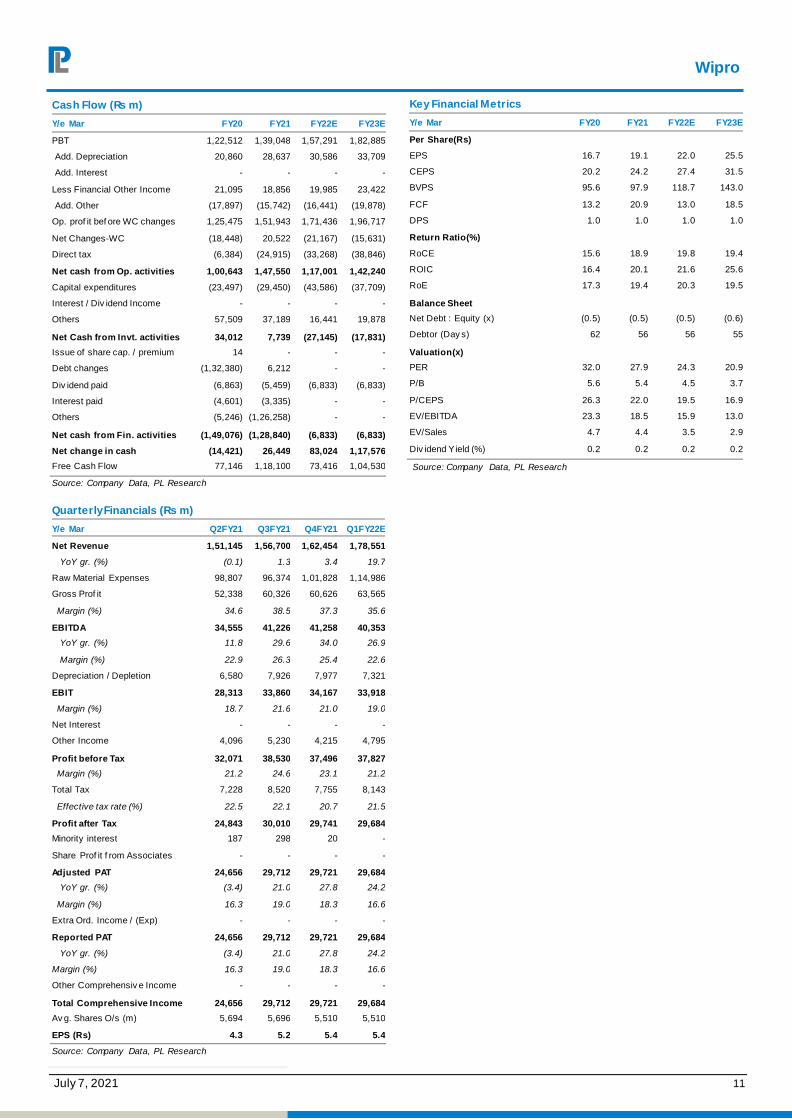
Cash Flow (Rs m)
Y/e Mar FY20 FY21 FY22E FY23E Year
PBT 1,22,512 1,39,048 1,57,291 1,82,885
Add. Depreciation 20,860 28,637 30,586 33,709
Add. Interest - - - -
Less Financial Other Income 21,095 18,856 19,985 23,422
Add. Other (17,897) (15,742) (16,441) (19,878)
Op. prof it bef ore WC changes 1,25,475 1,51,943 1,71,436 1,96,717
Net Changes-WC (18,448) 20,522 (21,167) (15,631)
Direct tax (6,384) (24,915) (33,268) (38,846)
Net cash from Op. activities 1,00,643 1,47,550 1,17,001 1,42,240
Capital expenditures (23,497) (29,450) (43,586) (37,709)
Interest / Div idend Income - - - -
Others 57,509 37,189 16,441 19,878
Net Cash from Invt. activities 34,012 7,739 (27,145) (17,831)
Issue of share cap. / premium 14 - - -
Debt changes (1,32,380) 6,212 - -
Div idend paid (6,863) (5,459) (6,833) (6,833)
Interest paid (4,601) (3,335) - -
Others (5,246) (1,26,258) - -
Net cash from Fin. activities (1,49,076) (1,28,840) (6,833) (6,833)
Net change in cash (14,421) 26,449 83,024 1,17,576
Free Cash Flow 77,146 1,18,100 73,416 1,04,530
Source: Company Data, PL Research
Quarterly Financials (Rs m)
Y/e Mar Q2FY21 Q3FY21 Q4FY21 Q1FY22E
Net Revenue 1,51,145 1,56,700 1,62,454 1,78,551
YoY gr. (%) (0.1) 1.3 3.4 19.7
Raw Material Expenses 98,807 96,374 1,01,828 1,14,986
Gross Prof it 52,338 60,326 60,626 63,565
Margin (%) 34.6 38.5 37.3 35.6
EBITDA 34,555 41,226 41,258 40,353
YoY gr. (%) 11.8 29.6 34.0 26.9
Margin (%) 22.9 26.3 25.4 22.6
Depreciation / Depletion 6,580 7,926 7,977 7,321
EBIT 28,313 33,860 34,167 33,918
Margin (%) 18.7 21.6 21.0 19.0
Net Interest - - - -
Other Income 4,096 5,230 4,215 4,795
Profit before Tax 32,071 38,530 37,496 37,827
Margin (%) 21.2 24.6 23.1 21.2
Total Tax 7,228 8,520 7,755 8,143
Effective tax rate (%) 22.5 22.1 20.7 21.5
Profit after Tax 24,843 30,010 29,741 29,684
Minority interest 187 298 20 -
Share Prof it f rom Associates - - - -
Adjusted PAT 24,656 29,712 29,721 29,684
YoY gr. (%) (3.4) 21.0 27.8 24.2
Margin (%) 16.3 19.0 18.3 16.6
Extra Ord. Income / (Exp) - - - -
Reported PAT 24,656 29,712 29,721 29,684
YoY gr. (%) (3.4) 21.0 27.8 24.2
Margin (%) 16.3 19.0 18.3 16.6
Other Comprehensiv e Income - - - -
Total Comprehensive Income 24,656 29,712 29,721 29,684
Av g. Shares O/s (m) 5,694 5,696 5,510 5,510
EPS (Rs) 4.3 5.2 5.4 5.4
Source: Company Data, PL Research
Key Financial Metrics
Y/e Mar FY20 FY21 FY22E FY23E
Per Share(Rs)
EPS 16.7 19.1 22.0 25.5
CEPS 20.2 24.2 27.4 31.5
BVPS 95.6 97.9 118.7 143.0
FCF 13.2 20.9 13.0 18.5
DPS 1.0 1.0 1.0 1.0
Return Ratio(%)
RoCE 15.6 18.9 19.8 19.4
ROIC 16.4 20.1 21.6 25.6
RoE 17.3 19.4 20.3 19.5
Balance Sheet
Net Debt : Equity (x) (0.5) (0.5) (0.5) (0.6)
Debtor (Day s) 62 56 56 55
Valuation(x)
PER 32.0 27.9 24.3 20.9
P/B 5.6 5.4 4.5 3.7
P/CEPS 26.3 22.0 19.5 16.9
EV/EBITDA 23.3 18.5 15.9 13.0
EV/Sales 4.7 4.4 3.5 2.9
Div idend Yield (%) 0.2 0.2 0.2 0.2
Source: Company Data, PL Research
Wipro
July 7, 2021 12
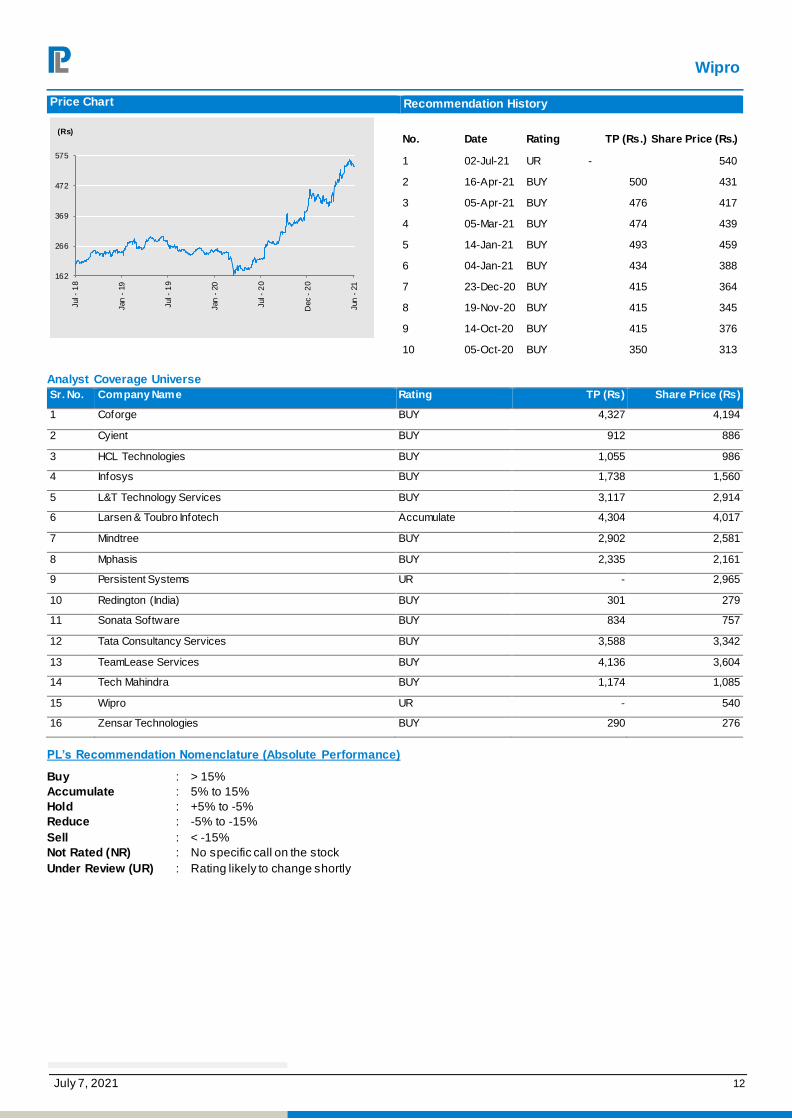
Price Chart Recommendation History
No. Date Rating TP (Rs.) Share Price (Rs.)
1 02-Jul-21 UR - 540
2 16-Apr-21 BUY 500 431
3 05-Apr-21 BUY 476 417
4 05-Mar-21 BUY 474 439
5 14-Jan-21 BUY 493 459
6 04-Jan-21 BUY 434 388
7 23-Dec-20 BUY 415 364
8 19-Nov-20 BUY 415 345
9 14-Oct-20 BUY 415 376
10 05-Oct-20 BUY 350 313
Analyst Coverage Universe
Sr. No. Company Name Rating TP (Rs) Share Price (Rs)
1 Coforge BUY 4,327 4,194
2 Cyient BUY 912 886
3 HCL Technologies BUY 1,055 986
4 Infosys BUY 1,738 1,560
5 L&T Technology Services BUY 3,117 2,914
6 Larsen & Toubro Infotech Accumulate 4,304 4,017
7 Mindtree BUY 2,902 2,581
8 Mphasis BUY 2,335 2,161
9 Persistent Systems UR - 2,965
10 Redington (India) BUY 301 279
11 Sonata Software BUY 834 757
12 Tata Consultancy Services BUY 3,588 3,342
13 TeamLease Services BUY 4,136 3,604
14 Tech Mahindra BUY 1,174 1,085
15 Wipro UR - 540
16 Zensar Technologies BUY 290 276
PL’s Recommendation Nomenclature (Absolute Performance)
Buy : > 15%
Accumulate : 5% to 15%
Hold : +5% to -5%
Reduce : -5% to -15%
Sell : < -15%
Not Rated (NR) : No specific call on the stock
Under Review (UR) : Rating likely to change shortly
162
266
369
472
575
Jul -
18
Jan
- 1
9
Jul -
19
Jan
- 2
0
Jul -
20
Dec -
20
Jun
- 2
1
(Rs)
Wipro
July 7, 2021 13
ANALYST CERTIFICATION
(Indian Clients)
We/I, Mr. Aniket Pande- MBA, Ms. Aditi Patil- MBA Finance Research Analysts, authors and the names subscribed to this report, hereby certify that all of the views expressed in this research report accurately reflect our views about the subject issuer(s) or securities. We also certify that no part of our c ompensation was, is, or will be directly or indirectly related to
the specific recommendation(s) or view(s) in this report.
(US Clients)
The research analy sts, with respect to each issuer and its securities covered by them in this research report, certify that: All of the views expressed in this research report accurately ref lect his or her or their personal views about all of the issuers and their securities; and No part of his or her or their compensation was, is or will be directly related to the specific
recommendation or views expressed in this research report.
DISCLAIMER
Indian Clients
Prabhudas Lilladher Pvt. Ltd, Mumbai, India (hereinafter referred to as “PL”) is engaged in the business of Stock Broking, Portfolio Manager, Depository Participant and distribution for third party financial products. PL is a subsidiary of Prabhudas Lilladher Advisory Services Pvt Ltd. which has its various subsidiaries engaged in business of commodity broking,
inv estment banking, financial services (margin funding) and distribution of third party financial/other products, details in respect of which are available at www.plindia.com.
This document has been prepared by the Research Division of PL and is meant for use by the recipient only as information and is not for circulation. This document is not to be reported
or copied or made available to others without prior permission of PL. It should not be considered or taken as an offer to sell or a solicitation to buy or sell any security.
The inf ormation contained in this report has been obtained from sources that are considered to be reliable. However, PL has not independently verified the accuracy or completeness of the same. Neither PL nor any of its affiliates, its directors or its employees accepts any responsibility of whatsoever nature for the information, statements and opinion given, made av ailable or expressed herein or for any omission therein.
Recipients of this report should be aware that past performance is not necessarily a guide to future performance and value of investments can go down as well. The suitability or
otherwise of any investments will depend upon the recipient's particular circumstances and, in case of doubt, advice should be sought from an independent expert/advisor.
Either PL or its affiliates or its directors or its employees or its representatives or its clients or their relatives may have position(s), make market, act as principal or engage in transactions
of securities of companies referred to in this report and they may have used the research material prior to publication.
PL may from time to time solicit or perform investment banking or other services for any company mentioned in this document.
PL is in the process of applying for certificate of registration as Research Analyst under Securities and Exchange Board of I ndia (Research Analysts) Regulations, 2014
PL submits that no material disciplinary action has been taken on us by any Regulatory Authority impacting Equity Research Analysis activities.
PL or its research analysts or its associates or his relatives do not have any financial interest in the subject company.
PL or its research analysts or its associates or his relatives do not have actual/beneficial ownership of one per cent or more securities of the subject company at the end of the month immediately preceding the date of publication of the research report.
PL or its research analysts or its associates or his relatives do not have any material conflict of interest at the time of publication of the research report.
PL or its associates might have received compensation from the subject company in the past twelve months.
PL or its associates might have managed or co-managed public offering of securities for the subject company in the past twelve months or mandated by the subject company for any
other assignment in the past twelve months.
PL or its associates might have received any compensation for investment banking or merchant banking or brokerage services from the subject company in the past twelve months.
PL or its associates might have received any compensation for products or services other than investment banking or merchant banking or brokerage services from the subject
company in the past twelve months
PL or its associates might have received any compensation or other benefits from the subject company or third party in connection with the research report.
PL encourages independence in research report preparation and strives to minimize conflict in preparation of research report. PL or its analysts did not receive any compensation or other benef its from the subject Company or third party in connection with the preparation of the research report. PL or its Research Analysts do not have any material conflict of interest
at the time of publication of this report.
It is confirmed that Mr. Aniket Pande- MBA, Ms. Aditi Patil- MBA Finance Research Analysts of this report have not received any compensation from the companies mentioned in the
report in the preceding twelve months
Compensation of our Research Analysts is not based on any specific merchant banking, investment banking or brokerage service transactions.
The Research analysts for this report certifies that all of the views expressed in this report accurately reflect his or her personal views about the subject company or companies and its
or their securities, and no part of his or her compensation was, is or will be, directly or indirectly related to specific recommendations or views expressed in this report.
The research analysts for this report has not served as an officer, director or employee of the subject company PL or its research analysts have not engaged in market making activity
f or the subject company
Our sales people, traders, and other professionals or affiliates may provide oral or written market commentary or trading strategies to our clients that reflect opinions that are contrary to the opinions expressed herein, and our proprietary trading and investing businesses may make investment decisions that are inconsistent with the recommendations expressed
herein. In rev iewing these materials, you should be aware that any or all of the foregoing, among other things, may give rise to real or potential conflicts of interest.
PL and its associates, their directors and employees may (a) from time to time, have a long or short position in, and buy or sell the securities of the subject company or (b) be engaged in any other transaction involving such securities and earn brokerage or other compensation or act as a market maker in the f inancial instruments of the subject company or act as an
adv isor or lender/borrower to the subject company or may have any other potential conflict of interests with respect to any recommendation and other related informat ion and opinions.
US Clients
This research report is a product of Prabhudas Lilladher Pvt. Ltd., which is the employer of the research analyst(s) who has prepared the research report. The research analyst(s) preparing the research report is/are resident outside the United States (U.S.) and are not associated persons of any U.S. regulated broker-dealer and therefore the analyst(s) is/are not subject to supervision by a U.S. broker-dealer, and is/are not required to satisfy the regulatory licensing requirements of FINRA or required to otherwise comply wit h U.S. rules or
regulations regarding, among other things, communications with a subject company, public appearances and trading securities held by a research analyst account.
This report is intended for distribution by Prabhudas Lilladher Pvt. Ltd. only to "Major Institutional Investors" as defined by Rule 15a-6(b)(4) of the U.S. Securities and Exchange Act, 1934 (the Exchange Act) and interpretations thereof by U.S. Securities and Exchange Commission (SEC) in reliance on Rule 15a 6(a)(2). If the recipient of this report is not a Major Institutional Investor as specified above, then it should not act upon this report and return the same to the sender. Further, this report may not be copied, duplicated and/or transmitted
onward to any U.S. person, which is not the Major Institutional Investor.
In reliance on the exemption from registration provided by Rule 15a-6 of the Exchange Act and interpretations thereof by the SEC in order to conduct certain business with Major
Institutional Investors, Prabhudas Lilladher Pvt. Ltd. has entered into an agreement with a U.S. registered broker-dealer, Marco Polo Securities Inc. ("Marco Polo").
Transactions in securities discussed in this research report should be effected through Marco Polo or another U.S. registered broker dealer.
Prabhudas Lilladher Pvt. Ltd. 3rd Floor, Sadhana House, 570, P. B. Marg, Worli, Mumbai-400 018, India | Tel: (91 22) 6632 2222 Fax: (91 22) 6632 2209
www.plindia.com