ratings - home - english - siemens global website» global scale, multiple market leadership...
TRANSCRIPT
CORPORATES
CREDIT OPINION22 August 2017
Update
RATINGS
Siemens AktiengesellschaftDomicile Germany
Long Term Rating A1
Type LT Issuer Rating - FgnCurr
Outlook Stable
Please see the ratings section at the end of this reportfor more information. The ratings and outlook shownreflect information as of the publication date.
Contacts
Martin Kohlhase 49-69-70730-719VP-Sr Credit [email protected]
Matthias Hellstern 49-69-70730-745MD-Corporate [email protected]
OleksandrYermolayev
+49 69 7073 0752
Associate [email protected]
CLIENT SERVICES
Americas 1-212-553-1653
Asia Pacific 852-3551-3077
Japan 81-3-5408-4100
EMEA 44-20-7772-5454
Siemens AktiengesellschaftUpdate to credit analysis
Summary Rating RationaleSiemens A1 ratings reflect (1) its diversified revenue base by product and geography; (2)leading market positions in a range of key industrial technologies and services with highbarriers to entry; (3) the ability to consistently generate high positive free cash flow (FCF)during the cycle, sometimes offset by share buy back programmes reducing excess cash, (4)its recently improved profitability to sustainably above 10%, although still somewhat on thelow side for the sector, and (5) a strong liquidity profile supported by a well-balanced debtmaturity profile, sizeable cash and cash equivalents on hand as well as good access to thecapital markets.
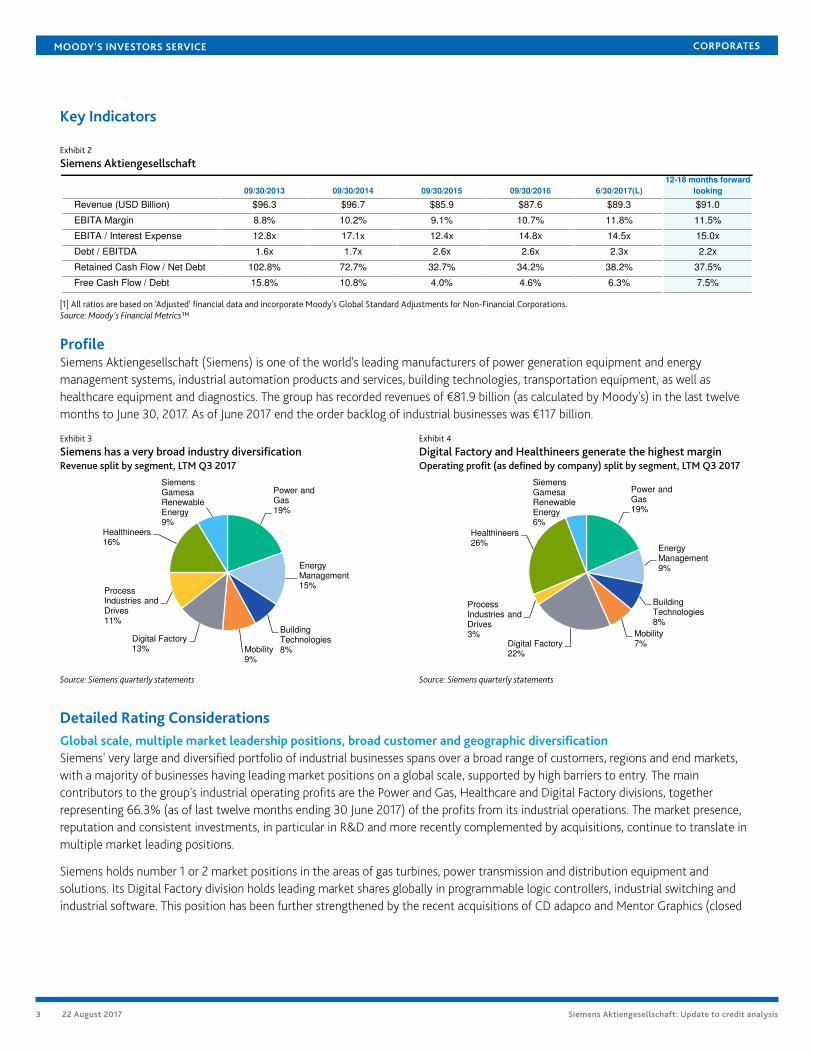
Siemens also has recently been able to reduce its (Moody's adjusted) leverage to 2.3x (Q32017), which is just in line with the triggers set for the rating following elevated levels in2015 and 2016. In the last couple of years the company has started to manage its balancesheet more aggressively, putting it at the lower end of the capital structure that we deemnecessary to maintain its current rating. However, this is balanced by an improving operatingperformance with less or no one-off charges related to large projects. Siemens has alsostarted to improve the performance of some of its underperforming businesses, althoughfurther improvements are still expected.
Exhibit 1
Moody's expects adjusted gross leverage to decrease gradually and remain within the guidancefor A1 rating
0.0x
0.5x
1.0x
1.5x
2.0x
2.5x
3.0x
2012 2013 2014 2015 2016 LTM Q3 2017 FY 2017E
Debt / EBITDA Factor That Can Change the Rating - Up
Factor That Can Change the Rating - Down
* Metric incorporates Moody's Standard Adjustments and represents Moody's forward view; not the view of the issuer.Source: Moody's Investors Service
The rating also takes into account the growing asset size of Siemens' finance captive, whichhas almost doubled in the last seven years to €26.5 billion. This is adding the risks typical

MOODY'S INVESTORS SERVICE CORPORATES
for a vendor financing operation to the usual risks that a manufacturing company is usually exposed to. This is mainly balanced bySiemens' ability to offer its customers bespoke financing solutions, which is differentiating Siemens from some of its competitors.
Credit Strengths
» Global scale, multiple market leadership positions, broad customer and geographic diversification
» Strong R&D capabilities, complemented by acquisitions funded through asset disposals
» Strong liquidity profile, underpinned by diversity of internal and external sources
Credit Challenges
» Recent M&A activity (e.g. Dresser-Rand, CD-adapco, Gamesa merger and Mentor Graphics) and a high pension deficit negativelyaffect Siemens' credit metrics
» Underperforming businesses remain a constraint for group performance
» Growing asset size of Siemens Financial Services (SFS), its finance captive arm
Rating OutlookThe stable rating reflects our expectation that Siemens will remain one of the leading players in the global power generation, industrialautomation and healthcare equipment sectors, and that even with cyclical pressures and periodic shareholder return initiatives, thecompany's operating performance and financial policies will remain solidly supportive of an A1 rating over the long-term, as evidencedby EBITA margins of above 10% and debt to EBITDA around 2.0x (Moody's adjusted). With leverage of 2.3x (as of June 30, 2017) andFCF/Debt of 6.3%, there is limited headroom in the A1 rating category. However, Siemens' A1 rating factors in our expectation that thecompany's leverage and cash flow generation will improve over the next 12-18 months.
Factors that Could Lead to an Upgrade
» Reduced competitive pressures and revenue growth throughout Siemens' broad operations
» EBITA margins > 13%
» Adjusted gross debt / EBITDA < 1.5x
» Strong liquidity
Factors that Could Lead to a Downgrade
» Evidence of a sustained erosion in Siemens' competitive strength, profitability and cash flow generation
» A more aggressive financial policy, either through additional debt-funded acquisitions or share buybacks exceeding free cash flowgeneration
» Adjusted gross debt / EBITDA > 2.5x
» EBITA margin meaningfully below 10%
» Weak asset quality in Siemens' captive finance operations
This publication does not announce a credit rating action. For any credit ratings referenced in this publication, please see the ratings tab on the issuer/entity page onwww.moodys.com for the most updated credit rating action information and rating history.
2 22 August 2017 Siemens Aktiengesellschaft: Update to credit analysis
MOODY'S INVESTORS SERVICE CORPORATES
Key Indicators
Exhibit 2
Siemens Aktiengesellschaft
09/30/2013 09/30/2014 09/30/2015 09/30/2016 6/30/2017(L)
12-18 months forward-
looking
Revenue (USD Billion) $96.3 $96.7 $85.9 $87.6 $89.3 $91.0
EBITA Margin 8.8% 10.2% 9.1% 10.7% 11.8% 11.5%
EBITA / Interest Expense 12.8x 17.1x 12.4x 14.8x 14.5x 15.0x
Debt / EBITDA 1.6x 1.7x 2.6x 2.6x 2.3x 2.2x
Retained Cash Flow / Net Debt 102.8% 72.7% 32.7% 34.2% 38.2% 37.5%
Free Cash Flow / Debt 15.8% 10.8% 4.0% 4.6% 6.3% 7.5%
[1] All ratios are based on 'Adjusted' financial data and incorporate Moody's Global Standard Adjustments for Non-Financial Corporations.Source: Moody's Financial Metrics™
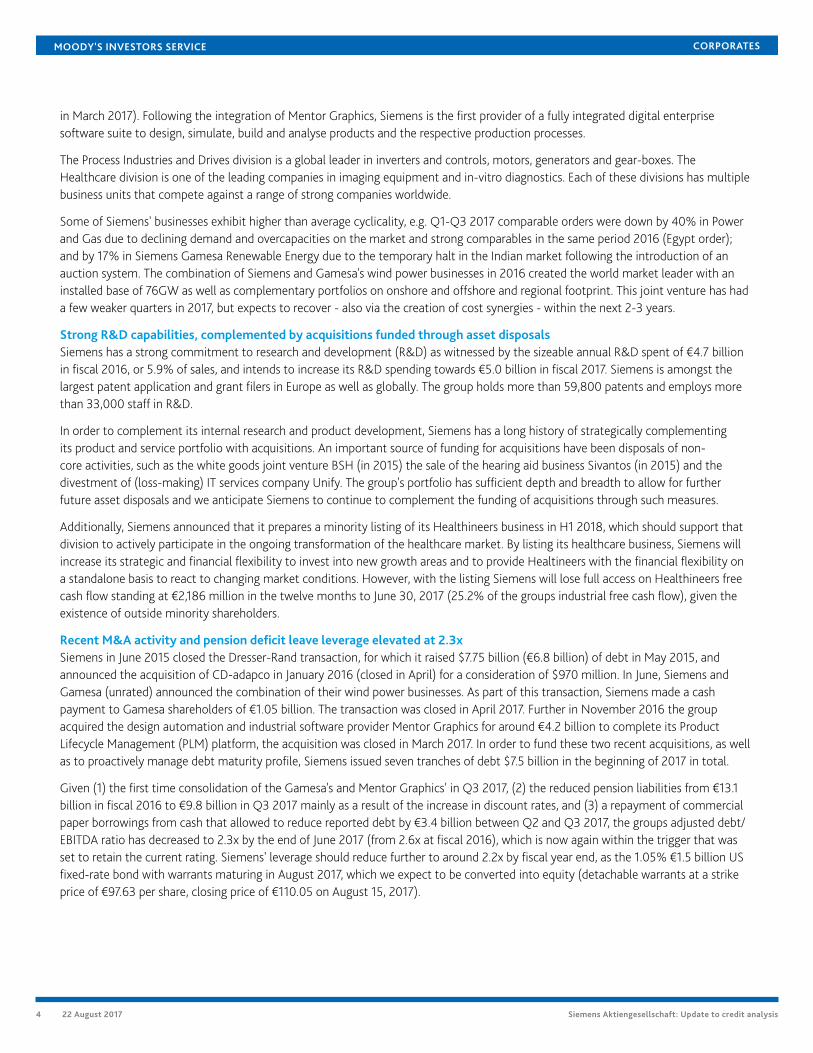
ProfileSiemens Aktiengesellschaft (Siemens) is one of the world's leading manufacturers of power generation equipment and energymanagement systems, industrial automation products and services, building technologies, transportation equipment, as well ashealthcare equipment and diagnostics. The group has recorded revenues of €81.9 billion (as calculated by Moody's) in the last twelvemonths to June 30, 2017. As of June 2017 end the order backlog of industrial businesses was €117 billion.
Exhibit 3
Siemens has a very broad industry diversificationRevenue split by segment, LTM Q3 2017
Exhibit 4
Digital Factory and Healthineers generate the highest marginOperating profit (as defined by company) split by segment, LTM Q3 2017
Power and Gas19%
Energy Management15%
Building Technologies8%Mobility
9%
Digital Factory13%
Process Industries and Drives11%
Healthineers16%
Siemens Gamesa Renewable Energy9%
Source: Siemens quarterly statements
Power and Gas19%
Energy Management9%
Building Technologies8%
Mobility7%Digital Factory
22%
Process Industries and Drives3%
Healthineers26%
Siemens Gamesa Renewable Energy6%
Source: Siemens quarterly statements
Detailed Rating ConsiderationsGlobal scale, multiple market leadership positions, broad customer and geographic diversificationSiemens' very large and diversified portfolio of industrial businesses spans over a broad range of customers, regions and end markets,with a majority of businesses having leading market positions on a global scale, supported by high barriers to entry. The maincontributors to the group's industrial operating profits are the Power and Gas, Healthcare and Digital Factory divisions, togetherrepresenting 66.3% (as of last twelve months ending 30 June 2017) of the profits from its industrial operations. The market presence,reputation and consistent investments, in particular in R&D and more recently complemented by acquisitions, continue to translate inmultiple market leading positions.
Siemens holds number 1 or 2 market positions in the areas of gas turbines, power transmission and distribution equipment andsolutions. Its Digital Factory division holds leading market shares globally in programmable logic controllers, industrial switching andindustrial software. This position has been further strengthened by the recent acquisitions of CD adapco and Mentor Graphics (closed
3 22 August 2017 Siemens Aktiengesellschaft: Update to credit analysis
MOODY'S INVESTORS SERVICE CORPORATES
in March 2017). Following the integration of Mentor Graphics, Siemens is the first provider of a fully integrated digital enterprisesoftware suite to design, simulate, build and analyse products and the respective production processes.
The Process Industries and Drives division is a global leader in inverters and controls, motors, generators and gear-boxes. TheHealthcare division is one of the leading companies in imaging equipment and in-vitro diagnostics. Each of these divisions has multiplebusiness units that compete against a range of strong companies worldwide.
Some of Siemens' businesses exhibit higher than average cyclicality, e.g. Q1-Q3 2017 comparable orders were down by 40% in Powerand Gas due to declining demand and overcapacities on the market and strong comparables in the same period 2016 (Egypt order);and by 17% in Siemens Gamesa Renewable Energy due to the temporary halt in the Indian market following the introduction of anauction system. The combination of Siemens and Gamesa's wind power businesses in 2016 created the world market leader with aninstalled base of 76GW as well as complementary portfolios on onshore and offshore and regional footprint. This joint venture has hada few weaker quarters in 2017, but expects to recover - also via the creation of cost synergies - within the next 2-3 years.
Strong R&D capabilities, complemented by acquisitions funded through asset disposalsSiemens has a strong commitment to research and development (R&D) as witnessed by the sizeable annual R&D spent of €4.7 billionin fiscal 2016, or 5.9% of sales, and intends to increase its R&D spending towards €5.0 billion in fiscal 2017. Siemens is amongst thelargest patent application and grant filers in Europe as well as globally. The group holds more than 59,800 patents and employs morethan 33,000 staff in R&D.
In order to complement its internal research and product development, Siemens has a long history of strategically complementingits product and service portfolio with acquisitions. An important source of funding for acquisitions have been disposals of non-core activities, such as the white goods joint venture BSH (in 2015) the sale of the hearing aid business Sivantos (in 2015) and thedivestment of (loss-making) IT services company Unify. The group's portfolio has sufficient depth and breadth to allow for furtherfuture asset disposals and we anticipate Siemens to continue to complement the funding of acquisitions through such measures.
Additionally, Siemens announced that it prepares a minority listing of its Healthineers business in H1 2018, which should support thatdivision to actively participate in the ongoing transformation of the healthcare market. By listing its healthcare business, Siemens willincrease its strategic and financial flexibility to invest into new growth areas and to provide Healtineers with the financial flexibility ona standalone basis to react to changing market conditions. However, with the listing Siemens will lose full access on Healthineers freecash flow standing at €2,186 million in the twelve months to June 30, 2017 (25.2% of the groups industrial free cash flow), given theexistence of outside minority shareholders.
Recent M&A activity and pension deficit leave leverage elevated at 2.3xSiemens in June 2015 closed the Dresser-Rand transaction, for which it raised $7.75 billion (€6.8 billion) of debt in May 2015, andannounced the acquisition of CD-adapco in January 2016 (closed in April) for a consideration of $970 million. In June, Siemens andGamesa (unrated) announced the combination of their wind power businesses. As part of this transaction, Siemens made a cashpayment to Gamesa shareholders of €1.05 billion. The transaction was closed in April 2017. Further in November 2016 the groupacquired the design automation and industrial software provider Mentor Graphics for around €4.2 billion to complete its ProductLifecycle Management (PLM) platform, the acquisition was closed in March 2017. In order to fund these two recent acquisitions, as wellas to proactively manage debt maturity profile, Siemens issued seven tranches of debt $7.5 billion in the beginning of 2017 in total.
Given (1) the first time consolidation of the Gamesa's and Mentor Graphics' in Q3 2017, (2) the reduced pension liabilities from €13.1billion in fiscal 2016 to €9.8 billion in Q3 2017 mainly as a result of the increase in discount rates, and (3) a repayment of commercialpaper borrowings from cash that allowed to reduce reported debt by €3.4 billion between Q2 and Q3 2017, the groups adjusted debt/EBITDA ratio has decreased to 2.3x by the end of June 2017 (from 2.6x at fiscal 2016), which is now again within the trigger that wasset to retain the current rating. Siemens' leverage should reduce further to around 2.2x by fiscal year end, as the 1.05% €1.5 billion USfixed-rate bond with warrants maturing in August 2017, which we expect to be converted into equity (detachable warrants at a strikeprice of €97.63 per share, closing price of €110.05 on August 15, 2017).
4 22 August 2017 Siemens Aktiengesellschaft: Update to credit analysis

MOODY'S INVESTORS SERVICE CORPORATES
Prudent leverage management, in combination with the company's upgraded profit guidance in Q1 2017 and better cash flows in itscore industrial business in fiscal 2017 and beyond will be key to strengthening the rating positioning in the A1 category in the next12-18 months.
Underperforming businesses, remain a constraint for group performanceSiemens has been able to improve its profit margin by 0.7pp to 11.5% year-to-date per June 2017 (company definition) driven byalmost all divisions. However, around 15% (around €12.6 billion of sales) of its business portfolio (we estimate a significant part ofthese activities to be reported in the Energy Management and Process Industries & Drives) has generated margins of around 3%, farbelow the groups internal expectations. Whilst progress has been made in fixing underperforming businesses, which in 2015 generateda profit margin of only 1%, significant progress is still to be made to achieve the management target of around 6% in 2017 and evenabove 8% by 2020 for these businesses.
Siemens has a long track record in terms of “execution” challenges, particulary in activities related to Energy Management and Mobilityand as evidenced by sizeable write offs and restructuring charges in the past. These charges have been a drag on operating profitabilityand cash flow generation. However, Siemens has responded to these charges by focusing on operational excellence and has notrecorded any significant charges since 2016. To offset price inflation and to achieve productivity gains, the company targets annualproductivity savings of between 3% and 5% and has concluded by the end of September 2016 a €1.0 billion cost saving programme.
Growing asset size of finance captiveSiemens Financial Services (SFS) is one of nine divisions and responsible for managing a portfolio of €26.5 billion of assets, includingproject and commercial finance, equity investments and financial leases. SFS' activities support the other eight industrial business-related divisions and hence are an integral part of Siemens' strategy. Despite the high growth rates of SFS' asset size in the last six years(2010: €12.5 billion, 2016: €26.5 billion; compared to revenues for the Siemens group 2010: €69.0 billion, 2016: €79.6 billion), weexpect future growth of SFS' assets to be more in line with revenue growth of the group, i.e. in the low to mid single digit range (%).
The counterparties of SFS are strictly other businesses and are not consumer-related. This also holds true for Siemens Bank GmbH(A1 stable), a wholly-owned bank that is regulated. SFS benefits from its access to Siemens global deal flow and to sector specialistswith technical know how. Funding is obtained through Siemens treasury operations, and is maturity and currency matched. As partof its mandate, SFS is engaged in long-term project finance transactions in line with Siemens' project business. Although the life ofsome projects, especially those related to infrastructure and energy projects, is long, SFS is engaged in the early years (especially duringthe construction phase) of the overall life span of a project to facilitate the respective financing. Consequently, SFS may not holdthe exposure over the full project life cycle. Therefore we expect average maturities for SFS to be between three and four years andgenerally believe the portfolio is well-diversified and with low defaults.
We monitor SFS' asset growth, gearing and income before income taxes to assess any potential impact its activities might have on theindustrial business of Siemens.
Liquidity AnalysisStrong liquidity profile, underpinned by diverse internal and external sourcesSiemens' liquidity is strong. For the quarter ending June 2017 the company reported nearly €8.5 billion of cash and cash equivalentsand almost €1.3 billion available-for-sale financial assets, which was supported with stronger funds from operations (Moody'sdefinition) amounting to around €10.2 billion comparing to an average of €8.2 billion over the past five years.
Among the external liquidity sources are, a €4.0 billion syndicated credit facility (maturing in June 25, 2021), a $3.0 billion syndicatedcredit facility maturing in September 27, 2020 and a €450 million revolving bilateral credit facility maturing in September 2017. As ofSeptember 2016 the equivalent of €7.1 billion of lines of credit were unused.
The multiple sources of liquidity allow Siemens to cover cash uses such as working cash (approximated as 3% of annual sales), workingcapital movements, capital expenditures (5-year average: €3.0 billion), dividend payments (5-year average: €2.8 billion) and share buy-backs (5-year average: €1.2 billion). Siemens has had the capacity to fund transactions of a certain size, such as CD-adapco or Gamesa(both around €1.0 billion), with existing sources, whilst it reverted to the debt capital market for the funding of Dresser-Rand (about$7.8 billion) and Mentor Graphics ($4.5 billion).
5 22 August 2017 Siemens Aktiengesellschaft: Update to credit analysis
MOODY'S INVESTORS SERVICE CORPORATES
Further, Siemens also has $1.5 billion worth of bonds that are due in August 2017 and that have detachable warrants exercisable at astrike price of €97.63 per share. Provided the share price remains above the strike price (closing price of €110.05 on August 15, 2017),we expect warrant holders to convert their warrants into Siemens shares.
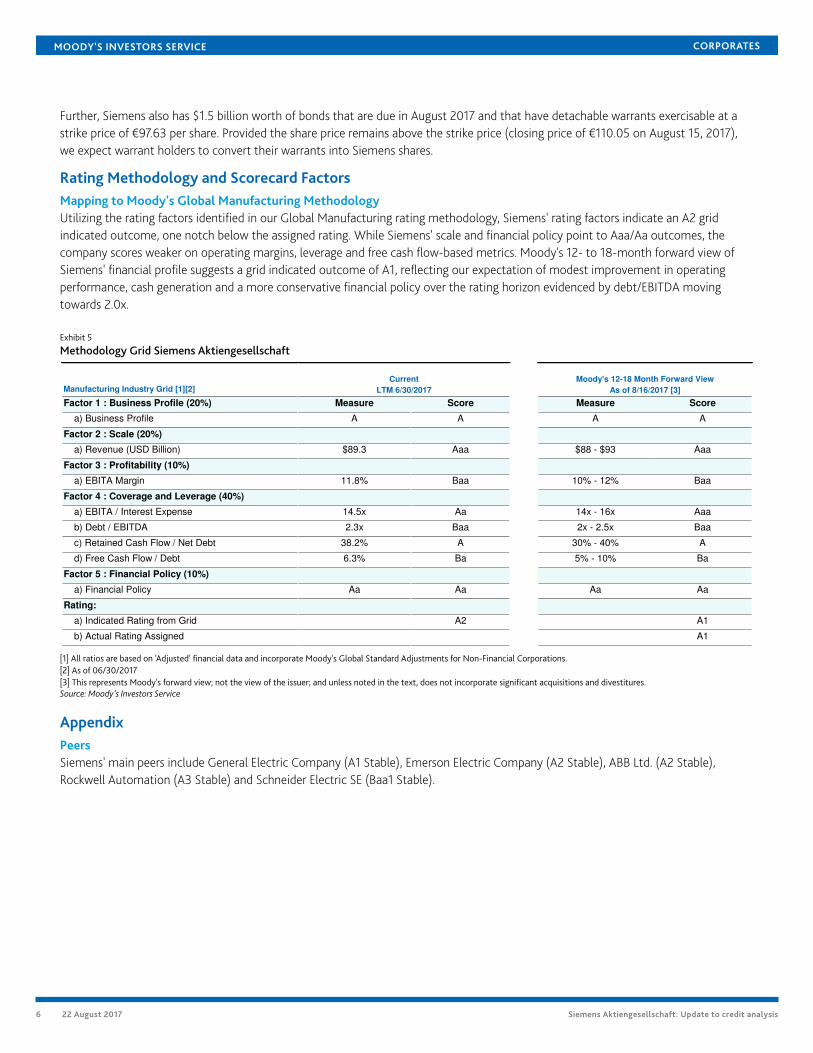
Rating Methodology and Scorecard FactorsMapping to Moody's Global Manufacturing MethodologyUtilizing the rating factors identified in our Global Manufacturing rating methodology, Siemens' rating factors indicate an A2 gridindicated outcome, one notch below the assigned rating. While Siemens' scale and financial policy point to Aaa/Aa outcomes, thecompany scores weaker on operating margins, leverage and free cash flow-based metrics. Moody's 12- to 18-month forward view ofSiemens' financial profile suggests a grid indicated outcome of A1, reflecting our expectation of modest improvement in operatingperformance, cash generation and a more conservative financial policy over the rating horizon evidenced by debt/EBITDA movingtowards 2.0x.
Exhibit 5
Methodology Grid Siemens Aktiengesellschaft
Manufacturing Industry Grid [1][2]
Factor 1 : Business Profile (20%) Measure Score Measure Score
a) Business Profile A A A A
Factor 2 : Scale (20%)
a) Revenue (USD Billion) $89.3 Aaa $88 - $93 Aaa
Factor 3 : Profitability (10%)
a) EBITA Margin 11.8% Baa 10% - 12% Baa
Factor 4 : Coverage and Leverage (40%)
a) EBITA / Interest Expense 14.5x Aa 14x - 16x Aaa
b) Debt / EBITDA 2.3x Baa 2x - 2.5x Baa
c) Retained Cash Flow / Net Debt 38.2% A 30% - 40% A
d) Free Cash Flow / Debt 6.3% Ba 5% - 10% Ba
Factor 5 : Financial Policy (10%)
a) Financial Policy Aa Aa Aa Aa
Rating:
a) Indicated Rating from Grid A2 A1
b) Actual Rating Assigned A1
Current
LTM 6/30/2017
Moody's 12-18 Month Forward View
As of 8/16/2017 [3]
[1] All ratios are based on 'Adjusted' financial data and incorporate Moody's Global Standard Adjustments for Non-Financial Corporations.[2] As of 06/30/2017[3] This represents Moody's forward view; not the view of the issuer; and unless noted in the text, does not incorporate significant acquisitions and divestitures.Source: Moody's Investors Service
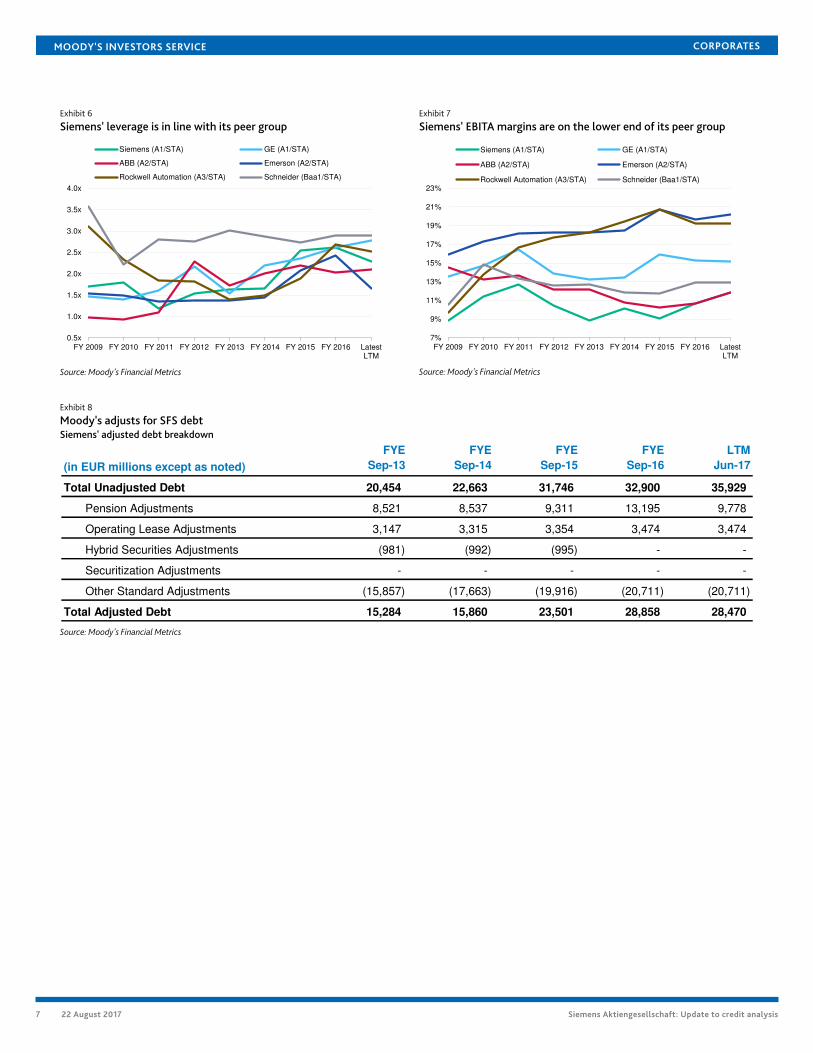
AppendixPeersSiemens' main peers include General Electric Company (A1 Stable), Emerson Electric Company (A2 Stable), ABB Ltd. (A2 Stable),Rockwell Automation (A3 Stable) and Schneider Electric SE (Baa1 Stable).
6 22 August 2017 Siemens Aktiengesellschaft: Update to credit analysis
MOODY'S INVESTORS SERVICE CORPORATES
Exhibit 6
Siemens' leverage is in line with its peer groupExhibit 7
Siemens' EBITA margins are on the lower end of its peer group
0.5x
1.0x
1.5x
2.0x
2.5x
3.0x
3.5x
4.0x
FY 2009 FY 2010 FY 2011 FY 2012 FY 2013 FY 2014 FY 2015 FY 2016 LatestLTM
Siemens (A1/STA) GE (A1/STA)
ABB (A2/STA) Emerson (A2/STA)
Rockwell Automation (A3/STA) Schneider (Baa1/STA)
Source: Moody's Financial Metrics
7%
9%
11%
13%
15%
17%
19%
21%
23%
FY 2009 FY 2010 FY 2011 FY 2012 FY 2013 FY 2014 FY 2015 FY 2016 LatestLTM
Siemens (A1/STA) GE (A1/STA)
ABB (A2/STA) Emerson (A2/STA)
Rockwell Automation (A3/STA) Schneider (Baa1/STA)
Source: Moody's Financial Metrics
Exhibit 8
Moody's adjusts for SFS debtSiemens' adjusted debt breakdown
(in EUR millions except as noted)
FYE
Sep-13
FYE
Sep-14
FYE
Sep-15
FYE
Sep-16
LTM
Jun-17
Total Unadjusted Debt 20,454 22,663 31,746 32,900 35,929
Pension Adjustments 8,521 8,537 9,311 13,195 9,778
Operating Lease Adjustments 3,147 3,315 3,354 3,474 3,474
Hybrid Securities Adjustments (981) (992) (995) - -
Securitization Adjustments - - - - -
Other Standard Adjustments (15,857) (17,663) (19,916) (20,711) (20,711)
Total Adjusted Debt 15,284 15,860 23,501 28,858 28,470
Source: Moody's Financial Metrics
7 22 August 2017 Siemens Aktiengesellschaft: Update to credit analysis
MOODY'S INVESTORS SERVICE CORPORATES
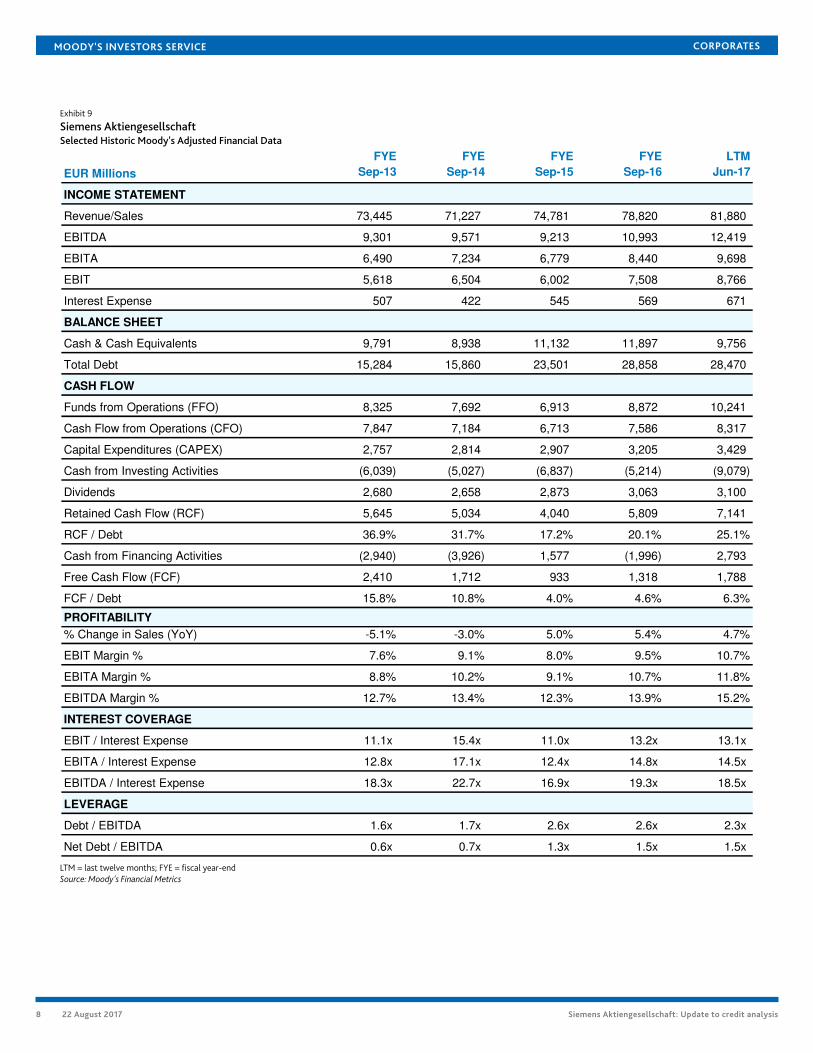
Exhibit 9
Siemens AktiengesellschaftSelected Historic Moody's Adjusted Financial Data
EUR Millions
FYE
Sep-13
FYE
Sep-14
FYE
Sep-15
FYE
Sep-16
LTM
Jun-17
INCOME STATEMENT
Revenue/Sales 73,445 71,227 74,781 78,820 81,880
EBITDA 9,301 9,571 9,213 10,993 12,419
EBITA 6,490 7,234 6,779 8,440 9,698
EBIT 5,618 6,504 6,002 7,508 8,766
Interest Expense 507 422 545 569 671
BALANCE SHEET
Cash & Cash Equivalents 9,791 8,938 11,132 11,897 9,756
Total Debt 15,284 15,860 23,501 28,858 28,470
CASH FLOW
Funds from Operations (FFO) 8,325 7,692 6,913 8,872 10,241
Cash Flow from Operations (CFO) 7,847 7,184 6,713 7,586 8,317
Capital Expenditures (CAPEX) 2,757 2,814 2,907 3,205 3,429
Cash from Investing Activities (6,039) (5,027) (6,837) (5,214) (9,079)
Dividends 2,680 2,658 2,873 3,063 3,100
Retained Cash Flow (RCF) 5,645 5,034 4,040 5,809 7,141
RCF / Debt 36.9% 31.7% 17.2% 20.1% 25.1%
Cash from Financing Activities (2,940) (3,926) 1,577 (1,996) 2,793
Free Cash Flow (FCF) 2,410 1,712 933 1,318 1,788
FCF / Debt 15.8% 10.8% 4.0% 4.6% 6.3%
PROFITABILITY
% Change in Sales (YoY) -5.1% -3.0% 5.0% 5.4% 4.7%
EBIT Margin % 7.6% 9.1% 8.0% 9.5% 10.7%
EBITA Margin % 8.8% 10.2% 9.1% 10.7% 11.8%
EBITDA Margin % 12.7% 13.4% 12.3% 13.9% 15.2%
INTEREST COVERAGE
EBIT / Interest Expense 11.1x 15.4x 11.0x 13.2x 13.1x
EBITA / Interest Expense 12.8x 17.1x 12.4x 14.8x 14.5x
EBITDA / Interest Expense 18.3x 22.7x 16.9x 19.3x 18.5x
LEVERAGE
Debt / EBITDA 1.6x 1.7x 2.6x 2.6x 2.3x
Net Debt / EBITDA 0.6x 0.7x 1.3x 1.5x 1.5x
LTM = last twelve months; FYE = fiscal year-endSource: Moody's Financial Metrics
8 22 August 2017 Siemens Aktiengesellschaft: Update to credit analysis

MOODY'S INVESTORS SERVICE CORPORATES
Ratings
Exhibit 10Category Moody's RatingSIEMENS AKTIENGESELLSCHAFT
Outlook StableIssuer Rating A1Senior Unsecured MTN (P)A1Commercial Paper P-1Other Short Term (P)P-1
SIEMENS BANK GMBH
Outlook StableIssuer Rating A1ST Issuer Rating P-1
SIEMENS FINANCIERINGSMAATSCHAPPIJ N.V.
Outlook StableBkd Senior Unsecured A1Bkd Commercial Paper P-1Bkd Other Short Term (P)P-1
SIEMENS CAPITAL COMPANY, LLC
Outlook StableBkd Senior Unsecured A1Bkd Commercial Paper P-1Bkd Other Short Term (P)P-1
Source: Moody's Investors Service
9 22 August 2017 Siemens Aktiengesellschaft: Update to credit analysis

MOODY'S INVESTORS SERVICE CORPORATES
© 2017 Moody’s Corporation, Moody’s Investors Service, Inc., Moody’s Analytics, Inc. and/or their licensors and affiliates (collectively, “MOODY’S”). All rights reserved.
CREDIT RATINGS ISSUED BY MOODY'S INVESTORS SERVICE, INC. AND ITS RATINGS AFFILIATES (“MIS”) ARE MOODY’S CURRENT OPINIONS OF THE RELATIVE FUTURE CREDITRISK OF ENTITIES, CREDIT COMMITMENTS, OR DEBT OR DEBT-LIKE SECURITIES, AND MOODY’S PUBLICATIONS MAY INCLUDE MOODY’S CURRENT OPINIONS OF THERELATIVE FUTURE CREDIT RISK OF ENTITIES, CREDIT COMMITMENTS, OR DEBT OR DEBT-LIKE SECURITIES. MOODY’S DEFINES CREDIT RISK AS THE RISK THAT AN ENTITYMAY NOT MEET ITS CONTRACTUAL, FINANCIAL OBLIGATIONS AS THEY COME DUE AND ANY ESTIMATED FINANCIAL LOSS IN THE EVENT OF DEFAULT. CREDIT RATINGSDO NOT ADDRESS ANY OTHER RISK, INCLUDING BUT NOT LIMITED TO: LIQUIDITY RISK, MARKET VALUE RISK, OR PRICE VOLATILITY. CREDIT RATINGS AND MOODY’SOPINIONS INCLUDED IN MOODY’S PUBLICATIONS ARE NOT STATEMENTS OF CURRENT OR HISTORICAL FACT. MOODY’S PUBLICATIONS MAY ALSO INCLUDE QUANTITATIVEMODEL-BASED ESTIMATES OF CREDIT RISK AND RELATED OPINIONS OR COMMENTARY PUBLISHED BY MOODY’S ANALYTICS, INC. CREDIT RATINGS AND MOODY’SPUBLICATIONS DO NOT CONSTITUTE OR PROVIDE INVESTMENT OR FINANCIAL ADVICE, AND CREDIT RATINGS AND MOODY’S PUBLICATIONS ARE NOT AND DO NOTPROVIDE RECOMMENDATIONS TO PURCHASE, SELL, OR HOLD PARTICULAR SECURITIES. NEITHER CREDIT RATINGS NOR MOODY’S PUBLICATIONS COMMENT ON THESUITABILITY OF AN INVESTMENT FOR ANY PARTICULAR INVESTOR. MOODY’S ISSUES ITS CREDIT RATINGS AND PUBLISHES MOODY’S PUBLICATIONS WITH THE EXPECTATIONAND UNDERSTANDING THAT EACH INVESTOR WILL, WITH DUE CARE, MAKE ITS OWN STUDY AND EVALUATION OF EACH SECURITY THAT IS UNDER CONSIDERATION FORPURCHASE, HOLDING, OR SALE.
MOODY’S CREDIT RATINGS AND MOODY’S PUBLICATIONS ARE NOT INTENDED FOR USE BY RETAIL INVESTORS AND IT WOULD BE RECKLESS AND INAPPROPRIATE FORRETAIL INVESTORS TO USE MOODY’S CREDIT RATINGS OR MOODY’S PUBLICATIONS WHEN MAKING AN INVESTMENT DECISION. IF IN DOUBT YOU SHOULD CONTACTYOUR FINANCIAL OR OTHER PROFESSIONAL ADVISER. ALL INFORMATION CONTAINED HEREIN IS PROTECTED BY LAW, INCLUDING BUT NOT LIMITED TO, COPYRIGHT LAW,AND NONE OF SUCH INFORMATION MAY BE COPIED OR OTHERWISE REPRODUCED, REPACKAGED, FURTHER TRANSMITTED, TRANSFERRED, DISSEMINATED, REDISTRIBUTEDOR RESOLD, OR STORED FOR SUBSEQUENT USE FOR ANY SUCH PURPOSE, IN WHOLE OR IN PART, IN ANY FORM OR MANNER OR BY ANY MEANS WHATSOEVER, BY ANYPERSON WITHOUT MOODY’S PRIOR WRITTEN CONSENT.
All information contained herein is obtained by MOODY’S from sources believed by it to be accurate and reliable. Because of the possibility of human or mechanical error as wellas other factors, however, all information contained herein is provided “AS IS” without warranty of any kind. MOODY'S adopts all necessary measures so that the information ituses in assigning a credit rating is of sufficient quality and from sources MOODY'S considers to be reliable including, when appropriate, independent third-party sources. However,MOODY’S is not an auditor and cannot in every instance independently verify or validate information received in the rating process or in preparing the Moody’s publications.
To the extent permitted by law, MOODY’S and its directors, officers, employees, agents, representatives, licensors and suppliers disclaim liability to any person or entity for anyindirect, special, consequential, or incidental losses or damages whatsoever arising from or in connection with the information contained herein or the use of or inability to use anysuch information, even if MOODY’S or any of its directors, officers, employees, agents, representatives, licensors or suppliers is advised in advance of the possibility of such losses ordamages, including but not limited to: (a) any loss of present or prospective profits or (b) any loss or damage arising where the relevant financial instrument is not the subject of aparticular credit rating assigned by MOODY’S.
To the extent permitted by law, MOODY’S and its directors, officers, employees, agents, representatives, licensors and suppliers disclaim liability for any direct or compensatorylosses or damages caused to any person or entity, including but not limited to by any negligence (but excluding fraud, willful misconduct or any other type of liability that, for theavoidance of doubt, by law cannot be excluded) on the part of, or any contingency within or beyond the control of, MOODY’S or any of its directors, officers, employees, agents,representatives, licensors or suppliers, arising from or in connection with the information contained herein or the use of or inability to use any such information.
NO WARRANTY, EXPRESS OR IMPLIED, AS TO THE ACCURACY, TIMELINESS, COMPLETENESS, MERCHANTABILITY OR FITNESS FOR ANY PARTICULAR PURPOSE OF ANY SUCHRATING OR OTHER OPINION OR INFORMATION IS GIVEN OR MADE BY MOODY’S IN ANY FORM OR MANNER WHATSOEVER.
Moody’s Investors Service, Inc., a wholly-owned credit rating agency subsidiary of Moody’s Corporation (“MCO”), hereby discloses that most issuers of debt securities (includingcorporate and municipal bonds, debentures, notes and commercial paper) and preferred stock rated by Moody’s Investors Service, Inc. have, prior to assignment of any rating,agreed to pay to Moody’s Investors Service, Inc. for appraisal and rating services rendered by it fees ranging from $1,500 to approximately $2,500,000. MCO and MIS also maintainpolicies and procedures to address the independence of MIS’s ratings and rating processes. Information regarding certain affiliations that may exist between directors of MCO andrated entities, and between entities who hold ratings from MIS and have also publicly reported to the SEC an ownership interest in MCO of more than 5%, is posted annually atwww.moodys.com under the heading “Investor Relations — Corporate Governance — Director and Shareholder Affiliation Policy.”
Additional terms for Australia only: Any publication into Australia of this document is pursuant to the Australian Financial Services License of MOODY’S affiliate, Moody’s InvestorsService Pty Limited ABN 61 003 399 657AFSL 336969 and/or Moody’s Analytics Australia Pty Ltd ABN 94 105 136 972 AFSL 383569 (as applicable). This document is intendedto be provided only to “wholesale clients” within the meaning of section 761G of the Corporations Act 2001. By continuing to access this document from within Australia, yourepresent to MOODY’S that you are, or are accessing the document as a representative of, a “wholesale client” and that neither you nor the entity you represent will directly orindirectly disseminate this document or its contents to “retail clients” within the meaning of section 761G of the Corporations Act 2001. MOODY’S credit rating is an opinion asto the creditworthiness of a debt obligation of the issuer, not on the equity securities of the issuer or any form of security that is available to retail investors. It would be recklessand inappropriate for retail investors to use MOODY’S credit ratings or publications when making an investment decision. If in doubt you should contact your financial or otherprofessional adviser.
Additional terms for Japan only: Moody's Japan K.K. (“MJKK”) is a wholly-owned credit rating agency subsidiary of Moody's Group Japan G.K., which is wholly-owned by Moody’sOverseas Holdings Inc., a wholly-owned subsidiary of MCO. Moody’s SF Japan K.K. (“MSFJ”) is a wholly-owned credit rating agency subsidiary of MJKK. MSFJ is not a NationallyRecognized Statistical Rating Organization (“NRSRO”). Therefore, credit ratings assigned by MSFJ are Non-NRSRO Credit Ratings. Non-NRSRO Credit Ratings are assigned by anentity that is not a NRSRO and, consequently, the rated obligation will not qualify for certain types of treatment under U.S. laws. MJKK and MSFJ are credit rating agencies registeredwith the Japan Financial Services Agency and their registration numbers are FSA Commissioner (Ratings) No. 2 and 3 respectively.
MJKK or MSFJ (as applicable) hereby disclose that most issuers of debt securities (including corporate and municipal bonds, debentures, notes and commercial paper) and preferredstock rated by MJKK or MSFJ (as applicable) have, prior to assignment of any rating, agreed to pay to MJKK or MSFJ (as applicable) for appraisal and rating services rendered by it feesranging from JPY200,000 to approximately JPY350,000,000.
MJKK and MSFJ also maintain policies and procedures to address Japanese regulatory requirements.
REPORT NUMBER 1087358
10 22 August 2017 Siemens Aktiengesellschaft: Update to credit analysis
MOODY'S INVESTORS SERVICE CORPORATES
CLIENT SERVICES
Americas 1-212-553-1653
Asia Pacific 852-3551-3077
Japan 81-3-5408-4100
EMEA 44-20-7772-5454
11 22 August 2017 Siemens Aktiengesellschaft: Update to credit analysis