ratnatunga jurnal case study
TRANSCRIPT

8202019 Ratnatunga Jurnal Case Study
httpslidepdfcomreaderfullratnatunga-jurnal-case-study 121
Cost Management in Sri Lanka A Case Study on
Volume Activity and Time as Cost Drivers
Janek Ratnatungaa Michael SC Tse b Kashi R Balachandranc
a
School of Commerce University of South Australia City West Campus GPO Box 2471 AdelaideSouth Australia 5001 Australia
b School of Accounting Economics and Finance Deakin University 221 Burwood Highway Burwood
Victoria 3125 Australiac Stern School of Business New York University New York NY USA
Received 18 July 2011
Abstract
Despite its theoretical superiority the activity-based costing (ABC) model has had only moderate
success in replacing the traditional volume-based absorption costing models in complex organizations
worldwide Even in organizations that have launched ABC projects the implementations often do not
sustain In response to this general lack of enthusiasm worldwide for ABC accountants developed the
time-driven activity-based costing (TDABC) model as an alternative cost allocation model This paper
presents a comparison of the TDABC model with ABC and considers if this alternative cost allocation
model (1) is easier to implement from an international perspective and (2) provides comparable cost
information for decision making We use a case study in a country outside the models country of origin
to understand the similarities and differences in absorption costing systems that use lsquovolumersquo
lsquoactivities
rsquo and
lsquotime
rsquoas the drivers of indirect cost allocations We also use the case study to ascertain if
any country‐speci1047297c factors impede ABC implementation We conclude the following the TDABC
model has similar implementation complexities to ABC if modelling conditions are strictly adhered to
these complexities are independent of country‐speci1047297c factors and in its simplest form the model
generates the same decision information errors of traditional costing
copy 2012 University of Illinois All rights reserved
JEL classification M41
Keywords Cost management Activity-based costing TDABC Time-driven activity-based costing
Corresponding author
E-mail addresses janekratnatungaunisaeduau (J Ratnatunga) Michaeltsedeakineduau (MSC Tse)
kbalachasternnyuedu (KR Balachandran)
0020-7063$ - see front matter copy 2012 University of Illinois All rights reserved
doi101016jintacc201207001
Available online at wwwsciencedirectcom
The International Journal of Accounting 47 (2012) 281 ndash301
8202019 Ratnatunga Jurnal Case Study
httpslidepdfcomreaderfullratnatunga-jurnal-case-study 221
1 Introduction
Like the value of economic goods the value of a management accounting system depends
on its costs and benefits (Horngren 2004) For an organization the benefit of its management accounting system rests on the systems ability to provide relevant information for decision
making (Anderson 2007 Sprinkle 2003) The cost management system as part of a
management accounting system is no exception
A cost management system has the ability to provide relevant information in part because
of its costing model In recent decades advances in information technology have resulted in
huge improvements in the collection and communication of cost data in organizations
Unfortunately traditional volume-based cost allocation models (either full absorption costing
or variable costing) still do not make good use of all available cost driver data available in
modern organizations Limited availability of cost data in the past led traditional volume-
based cost allocation models to make simplified assumptions about cost behaviour (Cooper ampKaplan 1988) Today when organizations operate in a stable environment with low
variability in outputs these models continue to serve organizations reasonably well
However when the complexities in the business environment increase these traditional
volume-driven costing models are less capable of providing accurate cost information
(Cooper 1987 Drury 1990)
2 The reign of ABC
To address the weaknesses of traditional volume-based cost allocation models
accountants developed the activity-based costing (ABC) in late 1980s (Fig 1) The adoption
of the ABC model helps organizations to avoid product cost cross-subsidisation between
high-volume low-complexity organizational outputs and low-volume high-complexity
organizational outputs by allocating resource costs through the multiple activities performed
at different levels within an organization (Cohen Venieris amp Kaimenaki 2005 Cooper amp
Kaplan 1988 Swenson 1995)
Labor (Wages amp
Salaries)
Depreciation
Energy
Other Factory
Costs
Purchasing
Manufacturing
Alpha
Beta
OthersQuality Control
Fig 1 ABC-based costing model cost flows
282 J Ratnatunga et al The International Journal of Accounting 47 (2012) 281 ndash 301
8202019 Ratnatunga Jurnal Case Study
httpslidepdfcomreaderfullratnatunga-jurnal-case-study 321
While the ABC model is technically superior to the volume-based cost allocation models
it has had limited success in replacing these traditional costing models In addition to criticism
in terms of methodology (Anderson 1995 Gosselin 1997 2007 Krumwiede 1998 Malmi
1997) users have also criticized its complexity in implementation Kaplan himself acknowledged this criticism and recommended abandoning it (Kaplan amp Anderson 2007)
Problems with implementation are true for complex organizations that ostensibly require
dynamic cost allocation systems to keep pace with change in competitive environments The
adoption rate of the ABC model in business organizations remains low A significant body of
literature implementation difficulties worldwide result in a vast majority of ABC implemen-
tations not sustaining (being abandoned) in the long run (see Byrne Stower amp Torry 2009
Cobb Innes amp Mitchell 1992 Cotton Jackson amp Brown 2003 Foster amp Swenson 1997
Gosselin 1997 Innes Mitchel amp Sinclair 2000 Kaplan amp Anderson 2004 2007 Kiani amp
Sangeladji 2003 McGowan amp Klammer 1997 Nguyen amp Brooks 1997 Shields 1995)
Commonly cited reasons for failures in adopting and implementing the ABC model at the
start-up phase include (i) it takes a long time to collect data requiring significant resources
commitments (ii) the model requires recognizing too many activities and cost drivers for
organizational complexity thus requiring high data processing capacities and (iii) the model
does not recognize unused capacity in the statements of time
Other problems cause projects to be abandoned Users encountered the following issues
(i) the complex ABC-based cost management systems in large organizations necessitate
repeat interviews in order to allot time to the activities (Kaplan amp Anderson 2004 Pernot
Roodhooft amp van den Abbeele 2007) (ii) the ABC-based cost management systems did not
integrate with other parts of organizational information systems (Sharman 2003) and (iii) themodel lacked ongoing management support (Cohen et al 2005 Kaplan amp Anderson 2007
Kiani amp Sangeladji 2003)
Further analysis of the first two reasons for the lack of implementationsustenance of ABC
implementation projects shows that they arise from difficulties in controlling a key calculation
in stage 1 of the process ie allocating resource costs into activity cost pools1 In response to
these stage 1 difficulties many organizations elected not to implement fully an ABC-based
cost management system after they performed analyses of organizational activities Instead
they used the information gathered from the analyses to improve their existing volume-based
cost allocation systems (Baird Harrison amp Reeve 2004 Gosselin 1997)
Implementing the ABC model requires an organization to analyze links betweenorganizational activities and organizational outputs Therefore even a partial analysis enables
management to understand the values of organizational activities and helps to eliminate
activities that do not add value (Gosselin 1997 McNair 2007) An activity analysis is
beneficial to an organization even when an ABC-based cost management system is not
subsequently implemented However once an ABC project is abandoned it is unlikely that
even a partial activity analysis will be carried out
As the ABC model failed to provide a cost-effective and sustainable cost management
solution (especially due to stage 1 difficulties in allocating resource costs into activity cost
1 Stage 2 of an ABC allocation process is to map activity cost pools into cost objects such as products
customers and organizational processes (white-collar departments) This is relatively easy to control via activity
cost drivers
283 J Ratnatunga et al The International Journal of Accounting 47 (2012) 281 ndash 301
8202019 Ratnatunga Jurnal Case Study
httpslidepdfcomreaderfullratnatunga-jurnal-case-study 421
pools) the time-driven activity-based costing (TDABC) model was developed to succeed the
ABC model Kaplan and Anderson proposed this model in 2004 as a method in its own right
although the first traces of this approach could be found in the Cooper and Kaplan and
publication of 1998 (Cooper amp Kaplan 1998 p 292ndash296)The TDABC model was designed to address the implementation problems of the ABC
model especially the stage 1 difficulties r eferred to above Kaplan and Anderson denied any
relationship to the original ABC method2 (2007 p 6 17ndash18) and insisted that this method
was not lsquoOld Wine (ABC) in New Bottles (TDABC)rsquo3 In this paper we will look closely at
the TDABC model and consider if it is a worthy and more user-friendly alternative to the
ABC model We will focus particularly on examining if country‐specific factors cause stage 1
implementation difficulties in ABC and if TDABC will alleviate these difficulties
3 Time-driven activity-based costing (TDABC)
The TDABC model is a variant of the ABC model that is specifically designed to simplify
the implementation and maintenance of activity-based cost management systems (Kaplan amp
Anderson 2004 2007) The main difference between the two methods is that the ABC
method asks employees how long they spend on different activities in order to link costs with
the activities whereas the TDABC method estimates the time t aken to perform these tasks
and then multiplies it by the number of tasks and the hourly cost 4 The model removes activity
pools and the use of quantity-based resource-activity cost drives to address the difficulties
faced by management in the stage 1 implementation of an ABC-based cost management
system It is based on an equivalence approach which uses duration drivers (standards of
working hours) instead of transaction drivers (Everaert amp Bruggeman 2007) The standards
can be revised when the production conditions change To implement the TDABC model
organizations would need to combine standard costing into the ABC methodology
Supporters of the model suggest that TDABC‐ based cost management systems can provide
equally accurate cost information while removing the need for performing costly and
time-consuming employee surveys5 in developing and maintaining the costing model
(Barrett 2005 Kaplan amp Anderson 2004)
Kaplan and Anderson (2007 p 3) claim that over 200 companies use the TDABC
method
6
However the concept remains largely ignored in the academic literature Only afew academic articles (eg Cardinaels amp Labro 2008 Everaert amp Bruggeman 2007 Hoozeacutee
amp Bruggeman 2007 2010 Levant amp Zimnovitch 2008 Tse amp Gong 2009) and a few case
2 Kaplan and Anderson have referred to the original version of the ABC model as lsquoRate-Based ABCrsquo (Kaplan amp
Anderson 2003) lsquoTraditional ABCrsquo (Kaplan amp Anderson 2004) or lsquoConventional ABCrsquo (Kaplan amp Anderson
2007) and have taken pains to contrast this to TDABC3 This denial was as a result of issues raised earlier by Shank (1989) regarding management accounting research
in general4 This denial is a direct reference to Coopers article (1997)5 There may be country speci1047297c factors that make surveying of employees more dif 1047297cult in some cultures than
in others This could lead to problems in the activity analysis and data collection stages of ABC model buildingand in the long-term sustenance of the ABC model6 It is mainly used by one consultancy 1047297rm Acorn of which Anderson is the Founder Director and Kaplan is a
Board Director
284 J Ratnatunga et al The International Journal of Accounting 47 (2012) 281 ndash 301
8202019 Ratnatunga Jurnal Case Study
httpslidepdfcomreaderfullratnatunga-jurnal-case-study 521
studies (eg Bruggeman Everaert Levant Saens amp Anderson 2008 McDonach amp
Mattimore 2008) appear to address the issue
According to Kaplan and Anderson (2004) TDABC simplifies the ABC method in two
significant areas
1 The number of activities is reduced and analysis takes place at the level of the departments
or processes Kaplan and Anderson (2004) present a case study where 1200 activities have
been reduced in 200 processes [However ABC can also reduce activities into a smaller
number of processes by re-defining what is meant by an lsquoactivityrsquo andor using fewer cost
drivers]7
2 The need to collect information from different services is limited because of the use of
standards Different types of drivers are expressed in terms of only one lsquoequivalent-time
driver rsquo This perhaps directly addresses the stage 1 difficulties faced worldwide by ABC
and if the resultant allocations have similar decision information to ABC then TDABC is a
worthy contender as an ABC replacement
4 Research objectives
From the ease of implementation perspective the TDABC model shows some promise as
the successor to both the traditional volume-based cost allocation model and the ABC model
The only theoretical justification for the switch is cost benefit The reduction in the quality of
information for a true ABC system has a lower reduction in benefits than the cost savings of
TDABC If TDABC is accepted by more firms than ABC then we can infer that the foregoing
is true However there are limited empirical studies on either the usefulness or of the
acceptance of the TDABC model There is no research on whether the two models can
alleviate problems in ABC implementations As discussed above stage 1 difficulties play a
key role in ABC implementation failures and country‐specific factors may be at play here
Therefore the ability to alleviate ABC implementation problems is an essential criterion for a
costing model to succeed the ABC model
Sharma and Ratnatunga (1997) demonstrated that a cost model evolves via a number of
alternative routes ie the costing method (job or process costing) cost type (actual or
standard) treatment of overheads (full absorption or variable) and method of indirect cost
allocation (volume activity time capacity or resource)8 The objective of this paper is to
present a comprehensive case study that enables comparison and evaluation We will also
analyze the decision making information provided by the three competing cost allocation
models ie those using (1) volume (2) activities and (3) standard time equivalents as
platforms for indirect cost allocation
This paper contributes to international accounting literature because it examines how
different costing models alleviate country-independent difficulties in developing and
maintaining cost management systems Due to the absence of national regulatory standards
7
The logical extreme to this simpli1047297
cation is traditional volume based absorption costing in whichlsquomanufacturingrsquo is considered as one lsquo processrsquo8 The case study company presented in this paper initially used the job absorption costing method with actual
costs and a volume-based traditional cost allocation system
285 J Ratnatunga et al The International Journal of Accounting 47 (2012) 281 ndash 301
8202019 Ratnatunga Jurnal Case Study
httpslidepdfcomreaderfullratnatunga-jurnal-case-study 621
management accounting is international However Williams and Seaman (2001) OConnor
Deng and Luo (2006) and Hoozeacutee and Bruggeman (2010) have stated that the adoption of
management accounting practices in different countries is driven by both country-neutral
factors (eg industry management style) and country-specific factors (eg culture gover-nance structure economic environment etc) Therefore to understand the relevance of an
emerging management accounting practice like TDABC to a particular country we must
examine both types of factors As discussed in previous sections stage 1 difficulties hinder
the adoption of the ABC model in organizations because of country‐specific or country‐
independent factors or both Our understanding of the TDABC models ability to alleviate
stage 1 difficulties is a foundation for future research on the effects of these factors to the
TDABC model The use of data outside the country where the TDABC model was developed
(ie the USA) and in a developing economic environment (ie Sri Lanka) enhances the
validity of the findings because it reduces the risk of contamination by country-specific
factors
The remainder of this paper is organised as follows In the next section we introduce
details of a company from which we extracted data to run comparisons of the costing models
We found information on two product lines from a traditional volume-based costing system
and used it to implement an ABC-based costing model We report the difficulties (if any) in
the stage 1 activity analysis and data collection stages of implementation ascertain if there
were country‐specific factors that impeded ABC model building Next the ABC-based
costing model is converted to one based on the TDABC model We then compare the decision
information provided by the two models followed by a discussion of the issues raised in the
cost modelling In the final section we draw conclusions to ascertain if TDABC providesequally useful decision information while alleviating the implementation problems of ABC
5 Comparison of costing models A case study
51 The case study company
The case study company (which we shall call lsquoCompariso Ltdrsquo) is a listed manufacturing
company in Sri Lanka producing activated carbon This is a product made out of coconut
shells The company has factories in Sri Lanka Indonesia and Thailand The data in this case
study was obtained from the main Sri Lankan operationsThe production logistics are as follows Outside suppliers burn the husked and used
coconut shells in a controlled manner to produce lsquocharcoalrsquo The company then purchases the
charcoal via individual purchase contracts or from a vibrant trading market As there are
many lsquogradesrsquo of charcoal the purchased charcoal is stored in large bags of standard
sizes (components) Therefore the purchasing material handling and storage of these
lsquocomponentsrsquo are important activities of the company The manufacturing process consists of
crushing the charcoal to various size grades and using large kilns where steam is injected into
the micro-pores of the charcoal to lsquoactivatersquo it Depending on the final grades required the
activated carbon goes through a filtering process and further steam injection The factory may
do further work depending on if the end-use of the activated carbon is for gold absorptionwater purification pollution control etc There are also lsquospecialisedrsquo uses of activated carbon
such as for medicines clothing air purification combating blue-green algae etc Depending
286 J Ratnatunga et al The International Journal of Accounting 47 (2012) 281 ndash 301
8202019 Ratnatunga Jurnal Case Study
httpslidepdfcomreaderfullratnatunga-jurnal-case-study 721
on use some of the carbon needs to be lsquosilver impregnatedrsquo and requires further processing
Consequently the company had about 10 different end product lines some produced in
extremely high volumes (with batch sizes ranging from 500 to 1000 metric tonnes) and in
other cases the volumes were as low as a batch size of 1 metric tonne This requires varyingmachine setups Quality control is essential to test constantly the consistency of the activation
levels in the different grades Finally once the grades are tested the activated carbon is put
into 50 kg bags labelled and stored The sales unit is a metric tonne ie 20times50 kg bags
The data presented was collected in January 2009 and pertains to the third quarter of
companys financial year which was the calendar year 2008 [Permission was obtained to
present the information in a case study after the numbers were suitably modified for
confidentiality and competitive reasons] In the past few years Compariso had been
performing reasonably well but its market share declined as a result of severe competition
We give the companys income statement for the third quarter of 2008 using traditional
absorption costing in Appendix 1 Table 1
52 The traditional costing system
Compariso uses absorption costing for both external reporting as well as for providing
individual product line information for decision making The production overhead application
rate per direct labor hours for traditional absorption costing used for all product lines
manufactured was $20
In the period under observation Comparisos senior management was concerned with the
profit performance of some specific product lines The production manager was surprisedwhen the accountant showed him that some difficult and time‐consuming product lines had
similar profit margins to some of his favourite lines For example small batches for water
purification etc (Beta) sold equally well as products used for gold adsorption (Alpha) that
sold very well and were produced in large quantities The data relating to these two product
lines are shown in Appendix 1 Table 2 and the resultant gross margin calculations are
presented in Appendix 1 Table 3
One of the researchers of this paper was brought in as Comparisos financial consultant
and advised management to try an ABC system for 2009 (using 2008 data) while still
retaining the traditional costing system That researcher advised that an ABC system would
provide more accurate product cost and margin information to guide the companys strategic production and marketing effort and would highlight value adding and non-value adding
activities the company performed The data gathered for this project was used in this paper to
generate not only the ABC-based reports but also to test how the numbers would look if the
company decided to adopt the TDABC model
53 Development of ABC-based costing system
Fig 1 presents the cost mapping of an ABC-based cost allocation model The model
identifies four resource pools labor (wages and salaries) depreciation energy and other
factory costsThe four cost pools are linked to three activity pools purchasing manufacturing and
quality control (there are more activity pools in the data not shown for the sake of simplicity)
287 J Ratnatunga et al The International Journal of Accounting 47 (2012) 281 ndash 301
8202019 Ratnatunga Jurnal Case Study
httpslidepdfcomreaderfullratnatunga-jurnal-case-study 821
After allocating resource costs to the activity pools activity costs are subsequently allocated
to the two cost objects (the Alpha and Beta product lines) of interest in this case
Compariso had a very good ERP system It also had excellent document flow charts
prepared by the Internal Audit section that helped greatly in the activity mapping (stage 1) of the ABC project We used the information from interviews the general ledger and ERP and
MRP systems to map resource costs to activity cost pools identify cost drivers and compute
driver units actually used in the third quarter of 2008 (Appendix 1 Tables 4 and 5)9
In the activity analysis and date collection stages especially in conducting the interviews
there was no evidence of any country‐specific factors causing implementation difficulties
Certainly country-neutral factors such as the industry in which the company operated and its
management style affected model building However in Comparisos case these had a
positive effect as no impediments were placed on conducting interviews in the subsequent
cost modelling10 Thus we could directly compare the TDABC model and its results to the
results the ABC model obtained without any country‐specific factors contaminating it
For the purpose of comparing ABC with TDABC standard times allowed (in hours) were
determined for certain driver units (eg it was estimated that it would take 05 h to prepare an
average purchase order) and these are shown in Appendix 1 Table 6 Some volume‐ based
cost drivers could not be converted because they were unrelated to time and these were left
unchanged (eg number of components units sales dollars etc) Using the resource cost
information from Appendix 1 Tables 4 and 5 and the cost driver information from
Appendix 1 Table 6 we provide cost per cost driver calculations in Appendix 1 Table 7 The
cost drivers relating to the two product lines under investigation are shown in Appendix 1
Table 8 and the resultant gross margin calculations under ABC are presented in Appendix 1Table 9
The decision information we obtained from the ABC project was in keeping with the
perceptions of the management Management thought that the low‐volume and more complex
Beta product line made a significantly lower gross margin than the standard Alpha product
line In fact it was a loss product line if marketing costs were allocated to it These benefits are
well documented in ABC literature
We will now undertake cost modelling to illustrate how the data collected in the case study
company would be presented under the TDABC cost allocation model
6 From ABC to TDABC
Converting an ABC-based costing model to a TDABC-based one should be a relatively
simple process Relationships between resource cost pools activities and cost objects
identified in the ABC-based costing model can be adopted in the TDABC-based model via
lsquoresource groupsrsquo (eg purchasing manufacturing selling) using multiple time-based
drivers to allocate costs to cost objects or using a single time-based driver if the data has
9 Note that production wages were classi1047297ed as an overhead expense in the ABC- system It was also decided
not to allocate administration (general) expenses advertising and promotions and sales administration expenses to product lines under the ABC- system10 The country-neutral complexity arising out of maintaining the homogeneity condition in TDABC will be
discussed later
288 J Ratnatunga et al The International Journal of Accounting 47 (2012) 281 ndash 301
8202019 Ratnatunga Jurnal Case Study
httpslidepdfcomreaderfullratnatunga-jurnal-case-study 921
complexities Fig 2 illustrates the allocation via a resource group using multiple-drivers
and Fig 3 illustrates the allocation via a resource group using a single time-based driver
A ldquoresource grouprdquo could be an organizational unit department or section that may consist
of many different activities As there are fewer ldquoresource groupsrdquo than activities the method
seems to be reduce the complexity of data collection and reduce measurement errors This is
due to the use of time standards In ABC complex operations require adding more activities
into the model In TDABC this complexity is accounted for by using lsquoequivalent-timersquo
equations to determine how many resources each group consumes Equivalences are
established in a ldquoresource grouprdquo by means of a single driver the time needed to perform
them11 Using these equivalency equations the model should be easy to update For example
one could add an extra activity (if performed within a resource group) add variables to
explain the time spent take into account changes in productivity etc that no longer present an
ongoing maintenance problem It is not necessary to conduct regular and time‐consuming
surveys just to determine if the distribution of work time between different activities has
changed This simplifies the methods maintenance and enhances the sustainability of the
costing project The program requires conducting regular surveys to ensure that these
equivalent-time standards remain consistent with the latest practices in the organizationAt first glance the TDABC-based model shown in Fig 2 does not look much different
from the ABC-based model in Fig 112 The two models share the same resource cost pools
the same activities and the same cost objects The difference is that the activity cost pools
reside within a lsquoresource grouprsquo and some cost drivers are converted to equivalent-time
drivers (Barrett 2005 Kaplan amp Anderson 2004)
Quality Control
Labour (Wages
amp Salaries)
Depreciation
Energy
Other Factory
Costs
Factory Resource
Group
Alpha
Beta
Others
Purchasing
Manufacturing
Quality Control
Fig 2 The TDABC-based costing model the resource groups (multi-driver) variant
11 Kaplan and Anderson (2007) state that capacity drivers may also be used and if so that the method should be
called Capacity-Driven ABC rather than Time-Driven ABC12 The basic TDABC model is in fact an ABC model that uses time as a cost driver where the obtaining of
structural cost drivers is cumbersome (eg time to do purchase orders rather than the total number of purchase
orders)
289 J Ratnatunga et al The International Journal of Accounting 47 (2012) 281 ndash 301
8202019 Ratnatunga Jurnal Case Study
httpslidepdfcomreaderfullratnatunga-jurnal-case-study 1021
The value of a resource time-activity cost driver equals resource costs for a unit of the
resource (hours) multiplied by the number of hours for an activity (Everaert amp Bruggeman
2007 Kaplan amp Anderson 2004) The number of resource-activity cost drivers between a
resource pool and a cost object depends on each activitys resources consumption patterns
For instance wage and salary cost is consumed by all of the activities (such as purchasing
assembly and quality control) while energy cost bears no relationship with the purchasing
activity Therefore wage and salary cost is linked to each cost object through three separate
resource time-activity cost drivers while energy cost is only linked via one
In the case study company we first modelled the multiple-driver variant of TDABC
(Fig 2) Here resource costs are linked to resource time-activity cost drivers via activity
pools just as in ABC The only difference is the model uses resource time drivers instead of
cost drivers wherever data complexity issues arose13 The link between a cost driver and the
standard resource time to undertake an activity was shown in Appendix 1 Table 6 With this
information the cost per cost driver under TDABC can be calculated as shown in
Appendix 1 Table 10
Resource time drivers are derived from the cost drivers so the links to the cost object
would maintain a similar relationship Therefore the calculation of product line gross margins(Appendix 1 Table 11) would be the same as under ABC (compare Appendix 1 Table 9 with
Table 11) The conclusion we can draw from this modelling exercise is that if
transaction-based cost drivers are accurately converted to standard equivalent-time drivers
(Appendix 1 Table 6) and idle capacity issues are at a minimum then the decision
information provided to management would be almost identical
13
Even when using TDABC managers in the case study company argued that some non-time based volumemeasures (where the cause-effect relationship is more appropriate than time measures and there is no complexity
in collecting the data) should be used (eg number of components no of products) This was done in the cost
modelling
Labour (Wages
amp Salaries)
Depreciation
Energy
Other Factory
Costs
Factory
Resource Group
(includes Purchasing
Manufacturing and
Quality Control)
Alpha
Beta
Others
Fig 3 The TDABC-based costing model the resource groups (single-driver) variant
290 J Ratnatunga et al The International Journal of Accounting 47 (2012) 281 ndash 301
8202019 Ratnatunga Jurnal Case Study
httpslidepdfcomreaderfullratnatunga-jurnal-case-study 1121
8202019 Ratnatunga Jurnal Case Study
httpslidepdfcomreaderfullratnatunga-jurnal-case-study 1221
companies base their cost calculations on actual costs because (i) these costs are directly
based on reality and therefore perceived by the users as being more credible (ii) there is a
stronger link between the general ledger and management accounting and (iii) companies do
not need to make budget forecasts in order to use the model When companies use actualcosts they may experience delays from invoicing or slow recognition of expenses that can
skew the calculations (Kaplan amp Anderson 2007)16 They can solve this problem by ensuring
that data gathering periods are not too short and by spreading charges across the financial year
using statistical and other smoothing techniques
72 Idle capacity in a resource group
One of TDABCs advantages is that it can isolate idle capacity within a resource group
(Kaplan amp Anderson 2007 Tse amp Gong 2009) However this advantage is not unique toTDABC because ABC also has arguments in favor of capacity costing (Cooper amp Kaplan
1991 1992 Robinson 1990)
In the case study company a lsquonormal levelrsquo of activity was defined as the normal capacity
which we also used as the budgetedpractical capacity The company defined this normal
capacity as being about 80 of theoretical capacity which is in keeping with Kaplan and
Anderson (2003 2004) who proposed a ratio between practical capacity and theoretical
capacity for labor hours The managers of the case study company stated that there were wide
variations in capacity (mainly due to the availability of the machines ie kilns) with capacity
often being leased from competitors who had excess capacity Idle capacity was a non-issue in
the case study company
73 The homogeneity condition
An important condition of the single-driver version of TDABC (Fig 3) is that the
activities or transactions performed in one resource group and allocated to different cost
objects should consume resources in the same proportions ie for the calculation to be
correct the time must remain proportional to the average consumption of the department
This is referred to as the condition of homogeneity (Gervais 2005 Kaplan amp Anderson
2007)
The case study company had special equipment for manufacturing silver-impregnated
activated carbon Here the silver-impregnation process must be separated from other types of
activation as the resources used and the rate at which they are used are not the same The
critics of the TDABC method do not seem to highlight the importance of this condition and
most likely the users are also unaware of it
In TDABC any major changes to the production process and productivity gains must be
taken into account when using standard times as these changes could alter the proportionality
between times and thus alter the homogeneity condition Rigorous maintenance and regular
16 That may be true for ABC adopters however this goes against other survey evidence Shields Chow Kato and
Nakagawa (1991) in a cross-country study showed that a majority of manufacturers - about 60 of Japanese and
70 of US - used standard costs
292 J Ratnatunga et al The International Journal of Accounting 47 (2012) 281 ndash 301
8202019 Ratnatunga Jurnal Case Study
httpslidepdfcomreaderfullratnatunga-jurnal-case-study 1321
revision are thus necessary which runs contrary to the simplification of data collection and
analysis claimed as a benefit of the TDABC method
We have already modelled and shown that the single-driver version of TDABC is a
retrograde step with all of the problems of traditional costing (Appendix 1 Tables 12 and 13)When the complexity of maintaining the homogeneity condition is added to the list there
appears to be no merit in adopting the TDABC as a cost allocation approach
74 The estimation of time
The reason complex companies started using ABC was because using direct labor hours to
allocate indirect costs was perceived as being outdated in terms of changing production
technologies (including automation) and lean manufacturing processes of organizations
(Cooper 1987 Cooper amp Kaplan 1988 Johnson amp Kaplan 1987) However the use of labor
times still remains relevant in service organizations Purportedly TDABC enables such
organizations to model the variety and complexity that they encounter in the production of
services In fact the examples provided in the work of Kaplan and Anderson (2007) are based
on service activities
However labor times are more difficult to measure in service companies than in
manufacturing due to the more diverse range of activities performed by the workforce The
common practice is for employees to estimate the percentage of time spent on their various
activities Kaplan and Anderson (2003 2004 2007) are critical of this data collection
approach as they claim that often the total of these percentages is often equal to or greater
than 100 thus that unused capacities have been ignoredKaplan and Anderson (2007) prefer to determine the time necessary to perform tasks by
means of a direct estimation in minutes or hours based on contextual observation interviews
and comparative information by the cost modellers However other authors have done studies
that contradict what Kaplan and Anderson (2007) say They show that estimation errors by
cost modellers were more prone to errors than those obtained from the employees (Cardinaels
amp Labro 2008 Hoozeacutee amp Bruggeman 2007)
These estimation issues did not arise in the comparative cost modelling of the case study
company as (i) it was a manufacturing organization (ii) it had ERP and MRP systems that
largely provided this time equivalence information and (iii) non-time‐ based drivers were used
(where appropriate) in the multi-driver application of the model (Appendix 1 Table 10)
8 Conclusion
From the comparative gross margin results presented using the case study data it appears
that ABC is superior to traditional volume-based cost allocation systems However the
multi-driver version of TDABC seems no different to ABC if standard-activity times are used
as cost drivers We also showed that attempting to simplify the stage 1 activity analysis stage
of ABC implementation (by using a single-volume related cost driver) ultimately makes
TDABC no different than traditional costing systems
Both ABC and TDABC models can provide two types of information for decision making(1) costs allocated to cost objects and (2) links between resource pools and cost pools
However they provide such information in different ways with different levels of accuracy
293 J Ratnatunga et al The International Journal of Accounting 47 (2012) 281 ndash 301
8202019 Ratnatunga Jurnal Case Study
httpslidepdfcomreaderfullratnatunga-jurnal-case-study 1421
The adoption of an activity-based paradigm (via either ABC or TDABC) enables cost
management systems to provide information on how operating activities add value to
organizational outputs through linkages between resource pools and cost pools With
information on costs allocated to cost objects management can manage product costs bychanging quantities of organizational outputs Management can also reduce product costs
by reducing or eliminating non‐value-added activities with this type of information
(Gosselin 1997)
While the TDABC model is designed to address implementation problems faced by the
ABC model the adoption of the model in the case study company did not help to alleviate the
country-independent stage 1 activity analysis complexities of an ABC implementation
especially if it tried to maintain the homogeneity condition Thus TDABC is unable to help
organizations solve implementation problems in a manner that will not compromise accuracy
If implementation problems are the only criterion for organizations to adopt a costing system
then adoption of TDABC will not alleviate this problem
In this study we did not test if TDABC can provide valuable information on idle resources
to support decision making (Kaplan amp Anderson 2007 Tse amp Gong 2009) Future research
could focus on testing the usefulness of TDABC in providing information on idle resources
Alternately it could determine if information on idle resources is useful for decision making
In summary this case study determines that the TDABC model is ABC in sheeps
clothing In its extreme form TDABC provides decision information as erroneous as that
produced by traditional volume allocations As such we predict that TDABC will result in
even fewer implementations sustaining than ABC has managed
Appendix 1
Table 1
Compariso Ltd income statement for 3rd quarter 2008
Sales $40000000
Less Cost of goods sold
Materials $8000000
Labor $7500000
Production overheadsDepreciation $7000000
Energy $2500000
Other Factory Costs $500000 $10000000
Total $25500000
Gross margin $14500000
Less Marketing expenses
Delivery expenses $400000
Sales commissions $2000000
After sales service $500000
Advertising amp promotions $2000000
Sales administration $1000000 $5900000
Less Administration expenses $3000000Total $8900000
Net income before tax $5600000
294 J Ratnatunga et al The International Journal of Accounting 47 (2012) 281 ndash 301
8202019 Ratnatunga Jurnal Case Study
httpslidepdfcomreaderfullratnatunga-jurnal-case-study 1521
Table 2
Sales and cost data for 2 product lines
Product lines Alpha Beta
Per unit data
Price $8000 $40000
Direct materials costs $2000 $12000
Direct wages $1500 $6000
Labor hours 1 4
Table 3
Product line gross margins under traditional absorption costing
Alpha Beta
Sales $2400000 $800000
Costs
Materials $600000 $240000
Labor $450000 $120000
Overheads $600000 $160000
$1650000 $520000
Gross margin $750000 $280000
Gross margin percent 3125 3500
Table 4
Production expenses
Activity cost pools Cost $
Purchasing 1200000
Materials handling and storage 1000000
Machine setup 1350000
Quality control 800000
Labor and other overhead 10650000Packaging 2500000
Table 5
Marketing expenses
Activity cost pools Cost $
Delivery expenses 400000Sales commission 2000000
After sales service 500000
295 J Ratnatunga et al The International Journal of Accounting 47 (2012) 281 ndash 301
8202019 Ratnatunga Jurnal Case Study
httpslidepdfcomreaderfullratnatunga-jurnal-case-study 1621
Table 6
Driver units
Activity cost drivers Driver units Std time in hours
per driver unit
Time equivalent
driver units
No of components used 5000000 NA NA
No of setups 9000 40000 36000
No of batches 3200 10000 3200
No labor hours 500000 10000 500000
No machine hours 500000 10000 500000
No of units 625000 NA NA
No of sales orders 4000 05000 2000
Sales dollars $40000000 NA NA
No of service calls 10000 10000 10000
Table 7
Cost per cost driver calculations under ABC
Activity cost pool Cost driver identified Resource costs Driver units Cost per
driver unit
Mat handling and storage No of components used $1000000 5000000 $020
Machine setup No of setups $1350000 9000 $15000
Quality control No of batches $800000 3200 $25000
Manufacturing No labor hours $10650000 500000 $2130
Packaging No machine hours $2500000 625000 $400Delivery expenses No of sales orders $400000 4000 $10000
Sales commissions Sales dollars $2000000 40000000 $005
After sales service No of service calls $500000 10000 $5000
Total costs allocated $20400000
Sustaining costs unallocated $4000000
Total production direct costs $8000000
Total costs $32400000
Table 8Cost driver data for 2 product lines under ABC
Product lines Alpha Beta All product lines
ABC cost drivers
No purchase orders 200 200 3000
No of components used 450000 100000 5000000
No of setups 50 1000 9000
No of batches 50 200 3200
Total labor hours 30000 8000 500000
Total machine hours 30000 8000 500000
No of units produced and sold 30000 2000 625000
No of sales orders 300 400 4000Sales dollars $2400000 $800000 $40000000
No of service calls 50 500 10000
296 J Ratnatunga et al The International Journal of Accounting 47 (2012) 281 ndash 301
8202019 Ratnatunga Jurnal Case Study
httpslidepdfcomreaderfullratnatunga-jurnal-case-study 1721
Table 9
Product line gross margins under ABC absorption costing
Alpha Beta
units Price Value units Price Value
Sales 30000 $80 $2400000 2000 $400 $800000
Production costs
Direct materials 30000 $2000 $600000 2000 $120 $240000
Indirect costs Cost per
driver unit
Driver
units
Allocated
costs
Driver
units
Allocated
costs
Purchasing $40000 200 $80000 200 $80000
Mat handling and storage $020 450000 $90000 100000 $20000
Machine setup $15000 50 $7500 1000 $150000
Quality control $25000 50 $12500 200 $50000
Manufacturing $2130 30000 $639000 8000 $170400
Packaging $400 30000 $120000 2000 $8000
Total production costs $1549000 $718400
Gross margin $851000 $81600
Marketing costs
Delivery expenses $10000 300 $30000 400 $40000
Sales commissions $005 $2400000 $120000 $800000 $40000
After sales service $5000 50 $2500 500 $25000
Total $152500 $105000
Net income $698500 ($23400)Gross margin percent 3546 1020
Net margin percent 2910 -293
Table 10
Cost per cost driver calculations under TDABC (multi-driver) variant)
Activity cost pool Cost driver identified Resource costs Driver units Cost per
driver unit
Mat handling and storage No of components used $1000000 5000000 $020
Machine setup Time per setup $1350000 36000 $3750
Quality control Time per batch $800000 3200 $25000
Manufacturing No machine hours $10650000 500000 $2130
Packaging No of units $2500000 625000 $400
Delivery expenses Time per sales order $400000 2000 $20000
Sales commissions Sales dollars $2000000 40000000 $005
After sales service Time per Service Call $500000 10000 $5000
Total costs allocated $20400000
Sustaining costs unallocated $4000000Total production direct costs $8000000
Total costs $32400000
297 J Ratnatunga et al The International Journal of Accounting 47 (2012) 281 ndash 301
8202019 Ratnatunga Jurnal Case Study
httpslidepdfcomreaderfullratnatunga-jurnal-case-study 1821
Table 11
Product line gross margins under TDABC absorption costing (multi-driver variant)
Alpha Beta
units Price Value units Price Value
Sales 30000 $80 $2400000 2000 $400 $800000
Production costs
Direct materials 30000 $2000 $600000 2000 $120 $240000
Indirect costs Cost per
driver unit
Driver
units
Allocated
costs
Driver
units
Allocated
costs
Purchasing $80000 100 $80000 100 $80000
Mat handling and storage $020 450000 $90000 100000 $20000
Machine setup $3750 200 $7500 4000 $150000
Quality control $25000 50 $12500 200 $50000
Manufacturing $2130 30000 $639000 8000 $170400
Packaging $400 30000 $120000 2000 $8000
Total production costs $1549000 $718400
Gross margin $851000 $81600
Marketing costs
Delivery expenses $20000 150 $30000 200 $40000
Sales commissions $005 $2400000 $120000 $800000 $40000
After sales service $5000 50 $2500 500 $25000
Total $152500 $105000
Net income $698500 ($23400)Gross margin percent 3546 1020
Net margin percent 2910 -293
Table 12
Cost per cost driver calculations under lsquosingle-driver rsquo TDABC
Activity cost pool Cost driver identified Resource costs Driver units Cost per
driver unit
Mat handling and storage No labor hours $1000000 500000 $200
Machine setup No labor hours $1350000 500000 $270
Quality control No labor hours $800000 500000 $160
Manufacturing No labor hours $10650000 500000 $2130
Packaging No labor hours $2500000 500000 $500
Total factory resource cost $17500000 $3500
Delivery expenses Sales dollars $400000 40000000 $001
Sales commissions Sales dollars $2000000 40000000 $005
After sales service Sales dollars $500000 40000000 $001
Total costs allocated $20400000
Sustaining costs unallocated $4000000Total production direct costs $8000000
Total costs $32400000
298 J Ratnatunga et al The International Journal of Accounting 47 (2012) 281 ndash 301
8202019 Ratnatunga Jurnal Case Study
httpslidepdfcomreaderfullratnatunga-jurnal-case-study 1921
References
Anderson S W (1995) A Framework for assessing cost management system changes The case of activity-based
costing implementation at general motors 1986ndash1993 Journal of Management Accounting Research 7
1ndash51
Anderson S W (2007) Managing Costs and Cost Structure throughout the Value Chain Research on Strategic
Cost Management In C S Chapman A G Hopwood amp M D Shield (Eds) Handbook of Management
Accounting Research Vol 2 (pp 481ndash506) Oxford Elsevier
Baird K M Harrison G L amp Reeve R C (2004) Adoption of activity management practices A note on the
extent of adoption and the influence of organizational and cultural factors Management Accounting Research
15(4) 393ndash399
Barrett R (2005) Time-Driven Costing The Bottom Line on the New ABC Business Performance Management
35ndash39
Bruggeman W Everaert P Levant Y Saens G amp Anderson S (2008) Cost modelling in logistics using
time-driven ABC Experiences from a wholesaler International Journal of Physical Distribution amp Logistics
Management 38(3) 172ndash191
Byrne S Stower E amp Torry P (2009) Is ABC adoption a success in Australia Journal of Applied Management Accounting Research 7 (1) 37ndash52
Cardinaels E amp Labro E (2008) On the determinants of measurement error in time driven costing Accounting
Review 83(3) 735ndash756
Table 13
Product line gross margins under lsquosingle-diver rsquo TDABC absorption costing
Alpha Beta
units Price Value units Price Value
Sales 30000 $80 $2400000 2000 $400 $800000
Production costs
Direct materials 30000 $2000 $600000 2000 $120 $240000
Indirect costs Cost per
driver unit
Driver
units
Allocated
costs
Driver
units
Allocated
costs
Purchasing $240 30000 $72000 8000 $19200
Mat handling amp storage $200 30000 $60000 8000 $16000
Machine setup $270 30000 $81000 8000 $21600
Quality control $160 30000 $48000 8000 $12800
Manufacturing $2130 30000 $639000 8000 $170400
Packaging $500 30000 $150000 8000 $40000
Total production costs $1650000 $520000
Gross margin $750000 $280000
Marketing costs
Delivery expenses $001 2400000 $24000 800000 $8000
Sales commissions $005 2400000 $120000 800000 $40000
After sales service $001 2400000 $30000 800000 $10000
Total $174000 $58000
Net income $576000 $222000Gross margin percent 3125 3500
Net margin percent 2400 2775
299 J Ratnatunga et al The International Journal of Accounting 47 (2012) 281 ndash 301
8202019 Ratnatunga Jurnal Case Study
httpslidepdfcomreaderfullratnatunga-jurnal-case-study 2021
Cobb I Innes J amp Mitchell F (1992) Activity-based costing-problems in practice London CIMA
Cohen S Venieris G amp Kaimenaki E (2005) ABC Adopters supporters deniers and unawares Managerial
Auditing Journal 20(9) 981ndash1000
Cooper R (1987) Does your company need a new cost system Journal of Cost Management 1(1) 45ndash49
Cooper R (1997 Autumn) The two-stage procedure in cost accounting Part two Journal of Cost Management 39ndash45
Cooper R amp Kaplan R S (1988) Measure Costs Right Make the Right Decisions Harvard Business Review
66 (9) 96ndash103
Cooper R amp Kaplan R S (1991) Design of cost management systems Text cases and readings NJ
Prentice-Hall Englewood Cliffs
Cooper R amp Kaplan R S (1992) Activity based systems Measuring the costs of resource usage Accounting
Horizons 6 (3) 1ndash13
Cotton W Jackson S amp Brown R (2003) Note on a New Zealand replication of the Innes et al UK
activity-based costing survey Management Accounting Research 14(1) 67ndash72
Drury C (1990) Product costing in the 1990s Accountancy 1990 123ndash126
Everaert P amp Bruggeman W (2007) Time-driven activity-based costing exploring the underlying model Cost
Management 21(2) 16ndash
20Foster G amp Swenson D W (1997) Measuring the success of activity-based cost management and its
determinants Journal of Management Accounting Research 9 109ndash141
Gervais M (2005) Controcircle de Gestion (8th ed) Paris Economica
Gosselin M (1997) The effect of strategy and organizational structure on the adoption and implementation of
activity-based costing Accounting Organizations and Society 22(2) 105ndash122
Gosselin M (2007) A review of activity-based costing Technique implementation and consequences In C S
Chapman A G Hopwood amp M D Shield (Eds) Handbook of Management Accounting Research Vol 2
(pp 641ndash672) Oxford Elsevier
Hoozeacutee S amp Bruggeman W (2007) Time-driven activity-based costing Exploring the underlying model Cost
Management 21(2) 16ndash20
Hoozeacutee S amp Bruggeman W (2010) Identifying operating improvements during the design process of a
time-driven ABC system The role of collective worker participation and leadership style Management Accounting Research 21(3) 185ndash198
Horngren C T (2004) Management accounting Some comments Journal of Management Accounting
Research 16 207ndash211
Innes J Mitchel F amp Sinclair D (2000) Activity-based costing in the UKs largest companies A comparison
of 1994 and 1999 survey results Management Accounting Research 11(3) 349ndash362
Johnson H T amp Kaplan R S (1987) Relevance Lost The Rise and Fall of Management Accounting
Cambridge USA Harvard Business School Press
Kaplan R S amp Anderson S R (2003) Time-driven activity-based costing White paper presented at the First
European Summit on Time-Driven Activity-Based Costing Available from httpwwwhbseduresearch
facpubsworkingpaperspapers2030404-045pdf (Accessed 3 December 2010)
Kaplan R S amp Anderson S R (2004) Time-Driven Activity-Based Costing Harvard Business Review 82(11)
131ndash138
Kaplan R S amp Anderson S R (2007) The innovation of time-driven activity-based costing Cost Management
21(2) 5ndash15
Kiani R amp Sangeladji M (2003) An empirical study about the use of the ABCABM models by some of the
Fortune 500 largest industrial corporations in the USA Journal of American Academy of Business Cambridge
3(1ndash2) 174ndash182
Krumwiede K R (1998) The implementation stages of activity-based costing and the impact of contextual and
organizational factors Journal of Management Accounting Research 10 239ndash277
Levant Y amp Zimnovitch H (2008) An ill-known facet to the history of cost calculation The methods of
equivalence 20th Annual Conference of the Business History Research Unit Cardiff Business School (10ndash
11th September)
Malmi T (1997) Towards explaining activity-based costing failure Accounting and control in a decentralisedorganisation Management Accounting Research 8(4) 459ndash480
McDonach C amp Mattimore R (2008) Strategic applications of time driven ABC in the service sector Lessons from
Irish SME Rotterdam Communication at the 31st Annual Congress of the European Accounting Association
300 J Ratnatunga et al The International Journal of Accounting 47 (2012) 281 ndash 301
8202019 Ratnatunga Jurnal Case Study
httpslidepdfcomreaderfullratnatunga-jurnal-case-study 2121
McGowan A S amp Klammer T P (1997) Satisfaction with activity-based cost management implementation
Journal of Management Accounting Research 9 217ndash238
McNair C J (2007) Beyond the boundaries Future trends in cost management Cost Management 21(1) 10ndash21
Nguyen H V amp Brooks A (1997) An empirical investigation of adoption issues relating to activity-based
costing Asian Review of Accounting 5(1) 1ndash18
OConnor N G Deng J amp Luo Y (2006) Political constraints organization design and performance
measurement in Chinas state-owned enterprises Accounting Organizations and Society 31(2) 157ndash177
Pernot E Roodhooft F amp van den Abbeele A (2007) Time-driven activity-based costing for inter-library
services A case study in a university Journal of Academic of Librarianship 33(5) 551ndash560
Ratnatunga J (1983) Financial Controls in Marketing The Accounting-Marketing Interface Canberra Series in
Administrative Studies Monograph No 6 Canberra CAE Canberra Australia
Robinson M A (1990) Contribution margin analysis No longer relevant - strategic cost management the new
paradigm Journal of Management Accounting Research 2 1ndash32
Shank J (1989) Strategic cost management New wine or just new bottles Journal of Management Accounting
Research Fall 1(1) 47ndash65
Sharma R amp Ratnatunga J (1997) Traditional and activity based costing systems Accounting Education An International Journal 6 (4) 337ndash345
Sharman P A (2003) The case for management accounting Strategic Finance 85(4) 43ndash47
Shields M D (1995) An empirical analysis of firms implementation experiences with activity-based costing
Journal of Management Accounting Research 7 148ndash166
Shields M D Chow C W Kato Y amp Nakagawa Y (1991) Management accounting practices in the US and
Japan Comparative survey findings and research implications Journal of International Financial Management
and Accounting 3(1) 61ndash77
Sprinkle G B (2003) Perspectives on experimental research in managerial accounting Accounting Organizations
and Society 28(2ndash3) 287ndash318
Swenson D W (1995) The benefits of activity-based cost management to the manufacturing industry Journal of
Management Accounting Research 7 167ndash180
Tse M amp Gong M (2009) Recognition of idle resources in time-driven activity-based costing and resourceconsumption accounting models Journal of Applied Management Accounting Research 7 (2) 41ndash54
Williams J J amp Seaman A E (2001) Predicting changes in management accounting systems National culture
and industry effects Accounting Organizations and Society 26 (4ndash5) 443ndash460
301 J Ratnatunga et al The International Journal of Accounting 47 (2012) 281 ndash 301

8202019 Ratnatunga Jurnal Case Study
httpslidepdfcomreaderfullratnatunga-jurnal-case-study 421
pools) the time-driven activity-based costing (TDABC) model was developed to succeed the
ABC model Kaplan and Anderson proposed this model in 2004 as a method in its own right
although the first traces of this approach could be found in the Cooper and Kaplan and
publication of 1998 (Cooper amp Kaplan 1998 p 292ndash296)The TDABC model was designed to address the implementation problems of the ABC
model especially the stage 1 difficulties r eferred to above Kaplan and Anderson denied any
relationship to the original ABC method2 (2007 p 6 17ndash18) and insisted that this method
was not lsquoOld Wine (ABC) in New Bottles (TDABC)rsquo3 In this paper we will look closely at
the TDABC model and consider if it is a worthy and more user-friendly alternative to the
ABC model We will focus particularly on examining if country‐specific factors cause stage 1
implementation difficulties in ABC and if TDABC will alleviate these difficulties
3 Time-driven activity-based costing (TDABC)
The TDABC model is a variant of the ABC model that is specifically designed to simplify
the implementation and maintenance of activity-based cost management systems (Kaplan amp
Anderson 2004 2007) The main difference between the two methods is that the ABC
method asks employees how long they spend on different activities in order to link costs with
the activities whereas the TDABC method estimates the time t aken to perform these tasks
and then multiplies it by the number of tasks and the hourly cost 4 The model removes activity
pools and the use of quantity-based resource-activity cost drives to address the difficulties
faced by management in the stage 1 implementation of an ABC-based cost management
system It is based on an equivalence approach which uses duration drivers (standards of
working hours) instead of transaction drivers (Everaert amp Bruggeman 2007) The standards
can be revised when the production conditions change To implement the TDABC model
organizations would need to combine standard costing into the ABC methodology
Supporters of the model suggest that TDABC‐ based cost management systems can provide
equally accurate cost information while removing the need for performing costly and
time-consuming employee surveys5 in developing and maintaining the costing model
(Barrett 2005 Kaplan amp Anderson 2004)
Kaplan and Anderson (2007 p 3) claim that over 200 companies use the TDABC
method
6
However the concept remains largely ignored in the academic literature Only afew academic articles (eg Cardinaels amp Labro 2008 Everaert amp Bruggeman 2007 Hoozeacutee
amp Bruggeman 2007 2010 Levant amp Zimnovitch 2008 Tse amp Gong 2009) and a few case
2 Kaplan and Anderson have referred to the original version of the ABC model as lsquoRate-Based ABCrsquo (Kaplan amp
Anderson 2003) lsquoTraditional ABCrsquo (Kaplan amp Anderson 2004) or lsquoConventional ABCrsquo (Kaplan amp Anderson
2007) and have taken pains to contrast this to TDABC3 This denial was as a result of issues raised earlier by Shank (1989) regarding management accounting research
in general4 This denial is a direct reference to Coopers article (1997)5 There may be country speci1047297c factors that make surveying of employees more dif 1047297cult in some cultures than
in others This could lead to problems in the activity analysis and data collection stages of ABC model buildingand in the long-term sustenance of the ABC model6 It is mainly used by one consultancy 1047297rm Acorn of which Anderson is the Founder Director and Kaplan is a
Board Director
284 J Ratnatunga et al The International Journal of Accounting 47 (2012) 281 ndash 301
8202019 Ratnatunga Jurnal Case Study
httpslidepdfcomreaderfullratnatunga-jurnal-case-study 521
studies (eg Bruggeman Everaert Levant Saens amp Anderson 2008 McDonach amp
Mattimore 2008) appear to address the issue
According to Kaplan and Anderson (2004) TDABC simplifies the ABC method in two
significant areas
1 The number of activities is reduced and analysis takes place at the level of the departments
or processes Kaplan and Anderson (2004) present a case study where 1200 activities have
been reduced in 200 processes [However ABC can also reduce activities into a smaller
number of processes by re-defining what is meant by an lsquoactivityrsquo andor using fewer cost
drivers]7
2 The need to collect information from different services is limited because of the use of
standards Different types of drivers are expressed in terms of only one lsquoequivalent-time
driver rsquo This perhaps directly addresses the stage 1 difficulties faced worldwide by ABC
and if the resultant allocations have similar decision information to ABC then TDABC is a
worthy contender as an ABC replacement
4 Research objectives
From the ease of implementation perspective the TDABC model shows some promise as
the successor to both the traditional volume-based cost allocation model and the ABC model
The only theoretical justification for the switch is cost benefit The reduction in the quality of
information for a true ABC system has a lower reduction in benefits than the cost savings of
TDABC If TDABC is accepted by more firms than ABC then we can infer that the foregoing
is true However there are limited empirical studies on either the usefulness or of the
acceptance of the TDABC model There is no research on whether the two models can
alleviate problems in ABC implementations As discussed above stage 1 difficulties play a
key role in ABC implementation failures and country‐specific factors may be at play here
Therefore the ability to alleviate ABC implementation problems is an essential criterion for a
costing model to succeed the ABC model
Sharma and Ratnatunga (1997) demonstrated that a cost model evolves via a number of
alternative routes ie the costing method (job or process costing) cost type (actual or
standard) treatment of overheads (full absorption or variable) and method of indirect cost
allocation (volume activity time capacity or resource)8 The objective of this paper is to
present a comprehensive case study that enables comparison and evaluation We will also
analyze the decision making information provided by the three competing cost allocation
models ie those using (1) volume (2) activities and (3) standard time equivalents as
platforms for indirect cost allocation
This paper contributes to international accounting literature because it examines how
different costing models alleviate country-independent difficulties in developing and
maintaining cost management systems Due to the absence of national regulatory standards
7
The logical extreme to this simpli1047297
cation is traditional volume based absorption costing in whichlsquomanufacturingrsquo is considered as one lsquo processrsquo8 The case study company presented in this paper initially used the job absorption costing method with actual
costs and a volume-based traditional cost allocation system
285 J Ratnatunga et al The International Journal of Accounting 47 (2012) 281 ndash 301
8202019 Ratnatunga Jurnal Case Study
httpslidepdfcomreaderfullratnatunga-jurnal-case-study 621
management accounting is international However Williams and Seaman (2001) OConnor
Deng and Luo (2006) and Hoozeacutee and Bruggeman (2010) have stated that the adoption of
management accounting practices in different countries is driven by both country-neutral
factors (eg industry management style) and country-specific factors (eg culture gover-nance structure economic environment etc) Therefore to understand the relevance of an
emerging management accounting practice like TDABC to a particular country we must
examine both types of factors As discussed in previous sections stage 1 difficulties hinder
the adoption of the ABC model in organizations because of country‐specific or country‐
independent factors or both Our understanding of the TDABC models ability to alleviate
stage 1 difficulties is a foundation for future research on the effects of these factors to the
TDABC model The use of data outside the country where the TDABC model was developed
(ie the USA) and in a developing economic environment (ie Sri Lanka) enhances the
validity of the findings because it reduces the risk of contamination by country-specific
factors
The remainder of this paper is organised as follows In the next section we introduce
details of a company from which we extracted data to run comparisons of the costing models
We found information on two product lines from a traditional volume-based costing system
and used it to implement an ABC-based costing model We report the difficulties (if any) in
the stage 1 activity analysis and data collection stages of implementation ascertain if there
were country‐specific factors that impeded ABC model building Next the ABC-based
costing model is converted to one based on the TDABC model We then compare the decision
information provided by the two models followed by a discussion of the issues raised in the
cost modelling In the final section we draw conclusions to ascertain if TDABC providesequally useful decision information while alleviating the implementation problems of ABC
5 Comparison of costing models A case study
51 The case study company
The case study company (which we shall call lsquoCompariso Ltdrsquo) is a listed manufacturing
company in Sri Lanka producing activated carbon This is a product made out of coconut
shells The company has factories in Sri Lanka Indonesia and Thailand The data in this case
study was obtained from the main Sri Lankan operationsThe production logistics are as follows Outside suppliers burn the husked and used
coconut shells in a controlled manner to produce lsquocharcoalrsquo The company then purchases the
charcoal via individual purchase contracts or from a vibrant trading market As there are
many lsquogradesrsquo of charcoal the purchased charcoal is stored in large bags of standard
sizes (components) Therefore the purchasing material handling and storage of these
lsquocomponentsrsquo are important activities of the company The manufacturing process consists of
crushing the charcoal to various size grades and using large kilns where steam is injected into
the micro-pores of the charcoal to lsquoactivatersquo it Depending on the final grades required the
activated carbon goes through a filtering process and further steam injection The factory may
do further work depending on if the end-use of the activated carbon is for gold absorptionwater purification pollution control etc There are also lsquospecialisedrsquo uses of activated carbon
such as for medicines clothing air purification combating blue-green algae etc Depending
286 J Ratnatunga et al The International Journal of Accounting 47 (2012) 281 ndash 301
8202019 Ratnatunga Jurnal Case Study
httpslidepdfcomreaderfullratnatunga-jurnal-case-study 721
on use some of the carbon needs to be lsquosilver impregnatedrsquo and requires further processing
Consequently the company had about 10 different end product lines some produced in
extremely high volumes (with batch sizes ranging from 500 to 1000 metric tonnes) and in
other cases the volumes were as low as a batch size of 1 metric tonne This requires varyingmachine setups Quality control is essential to test constantly the consistency of the activation
levels in the different grades Finally once the grades are tested the activated carbon is put
into 50 kg bags labelled and stored The sales unit is a metric tonne ie 20times50 kg bags
The data presented was collected in January 2009 and pertains to the third quarter of
companys financial year which was the calendar year 2008 [Permission was obtained to
present the information in a case study after the numbers were suitably modified for
confidentiality and competitive reasons] In the past few years Compariso had been
performing reasonably well but its market share declined as a result of severe competition
We give the companys income statement for the third quarter of 2008 using traditional
absorption costing in Appendix 1 Table 1
52 The traditional costing system
Compariso uses absorption costing for both external reporting as well as for providing
individual product line information for decision making The production overhead application
rate per direct labor hours for traditional absorption costing used for all product lines
manufactured was $20
In the period under observation Comparisos senior management was concerned with the
profit performance of some specific product lines The production manager was surprisedwhen the accountant showed him that some difficult and time‐consuming product lines had
similar profit margins to some of his favourite lines For example small batches for water
purification etc (Beta) sold equally well as products used for gold adsorption (Alpha) that
sold very well and were produced in large quantities The data relating to these two product
lines are shown in Appendix 1 Table 2 and the resultant gross margin calculations are
presented in Appendix 1 Table 3
One of the researchers of this paper was brought in as Comparisos financial consultant
and advised management to try an ABC system for 2009 (using 2008 data) while still
retaining the traditional costing system That researcher advised that an ABC system would
provide more accurate product cost and margin information to guide the companys strategic production and marketing effort and would highlight value adding and non-value adding
activities the company performed The data gathered for this project was used in this paper to
generate not only the ABC-based reports but also to test how the numbers would look if the
company decided to adopt the TDABC model
53 Development of ABC-based costing system
Fig 1 presents the cost mapping of an ABC-based cost allocation model The model
identifies four resource pools labor (wages and salaries) depreciation energy and other
factory costsThe four cost pools are linked to three activity pools purchasing manufacturing and
quality control (there are more activity pools in the data not shown for the sake of simplicity)
287 J Ratnatunga et al The International Journal of Accounting 47 (2012) 281 ndash 301
8202019 Ratnatunga Jurnal Case Study
httpslidepdfcomreaderfullratnatunga-jurnal-case-study 821
After allocating resource costs to the activity pools activity costs are subsequently allocated
to the two cost objects (the Alpha and Beta product lines) of interest in this case
Compariso had a very good ERP system It also had excellent document flow charts
prepared by the Internal Audit section that helped greatly in the activity mapping (stage 1) of the ABC project We used the information from interviews the general ledger and ERP and
MRP systems to map resource costs to activity cost pools identify cost drivers and compute
driver units actually used in the third quarter of 2008 (Appendix 1 Tables 4 and 5)9
In the activity analysis and date collection stages especially in conducting the interviews
there was no evidence of any country‐specific factors causing implementation difficulties
Certainly country-neutral factors such as the industry in which the company operated and its
management style affected model building However in Comparisos case these had a
positive effect as no impediments were placed on conducting interviews in the subsequent
cost modelling10 Thus we could directly compare the TDABC model and its results to the
results the ABC model obtained without any country‐specific factors contaminating it
For the purpose of comparing ABC with TDABC standard times allowed (in hours) were
determined for certain driver units (eg it was estimated that it would take 05 h to prepare an
average purchase order) and these are shown in Appendix 1 Table 6 Some volume‐ based
cost drivers could not be converted because they were unrelated to time and these were left
unchanged (eg number of components units sales dollars etc) Using the resource cost
information from Appendix 1 Tables 4 and 5 and the cost driver information from
Appendix 1 Table 6 we provide cost per cost driver calculations in Appendix 1 Table 7 The
cost drivers relating to the two product lines under investigation are shown in Appendix 1
Table 8 and the resultant gross margin calculations under ABC are presented in Appendix 1Table 9
The decision information we obtained from the ABC project was in keeping with the
perceptions of the management Management thought that the low‐volume and more complex
Beta product line made a significantly lower gross margin than the standard Alpha product
line In fact it was a loss product line if marketing costs were allocated to it These benefits are
well documented in ABC literature
We will now undertake cost modelling to illustrate how the data collected in the case study
company would be presented under the TDABC cost allocation model
6 From ABC to TDABC
Converting an ABC-based costing model to a TDABC-based one should be a relatively
simple process Relationships between resource cost pools activities and cost objects
identified in the ABC-based costing model can be adopted in the TDABC-based model via
lsquoresource groupsrsquo (eg purchasing manufacturing selling) using multiple time-based
drivers to allocate costs to cost objects or using a single time-based driver if the data has
9 Note that production wages were classi1047297ed as an overhead expense in the ABC- system It was also decided
not to allocate administration (general) expenses advertising and promotions and sales administration expenses to product lines under the ABC- system10 The country-neutral complexity arising out of maintaining the homogeneity condition in TDABC will be
discussed later
288 J Ratnatunga et al The International Journal of Accounting 47 (2012) 281 ndash 301
8202019 Ratnatunga Jurnal Case Study
httpslidepdfcomreaderfullratnatunga-jurnal-case-study 921
complexities Fig 2 illustrates the allocation via a resource group using multiple-drivers
and Fig 3 illustrates the allocation via a resource group using a single time-based driver
A ldquoresource grouprdquo could be an organizational unit department or section that may consist
of many different activities As there are fewer ldquoresource groupsrdquo than activities the method
seems to be reduce the complexity of data collection and reduce measurement errors This is
due to the use of time standards In ABC complex operations require adding more activities
into the model In TDABC this complexity is accounted for by using lsquoequivalent-timersquo
equations to determine how many resources each group consumes Equivalences are
established in a ldquoresource grouprdquo by means of a single driver the time needed to perform
them11 Using these equivalency equations the model should be easy to update For example
one could add an extra activity (if performed within a resource group) add variables to
explain the time spent take into account changes in productivity etc that no longer present an
ongoing maintenance problem It is not necessary to conduct regular and time‐consuming
surveys just to determine if the distribution of work time between different activities has
changed This simplifies the methods maintenance and enhances the sustainability of the
costing project The program requires conducting regular surveys to ensure that these
equivalent-time standards remain consistent with the latest practices in the organizationAt first glance the TDABC-based model shown in Fig 2 does not look much different
from the ABC-based model in Fig 112 The two models share the same resource cost pools
the same activities and the same cost objects The difference is that the activity cost pools
reside within a lsquoresource grouprsquo and some cost drivers are converted to equivalent-time
drivers (Barrett 2005 Kaplan amp Anderson 2004)
Quality Control
Labour (Wages
amp Salaries)
Depreciation
Energy
Other Factory
Costs
Factory Resource
Group
Alpha
Beta
Others
Purchasing
Manufacturing
Quality Control
Fig 2 The TDABC-based costing model the resource groups (multi-driver) variant
11 Kaplan and Anderson (2007) state that capacity drivers may also be used and if so that the method should be
called Capacity-Driven ABC rather than Time-Driven ABC12 The basic TDABC model is in fact an ABC model that uses time as a cost driver where the obtaining of
structural cost drivers is cumbersome (eg time to do purchase orders rather than the total number of purchase
orders)
289 J Ratnatunga et al The International Journal of Accounting 47 (2012) 281 ndash 301
8202019 Ratnatunga Jurnal Case Study
httpslidepdfcomreaderfullratnatunga-jurnal-case-study 1021
The value of a resource time-activity cost driver equals resource costs for a unit of the
resource (hours) multiplied by the number of hours for an activity (Everaert amp Bruggeman
2007 Kaplan amp Anderson 2004) The number of resource-activity cost drivers between a
resource pool and a cost object depends on each activitys resources consumption patterns
For instance wage and salary cost is consumed by all of the activities (such as purchasing
assembly and quality control) while energy cost bears no relationship with the purchasing
activity Therefore wage and salary cost is linked to each cost object through three separate
resource time-activity cost drivers while energy cost is only linked via one
In the case study company we first modelled the multiple-driver variant of TDABC
(Fig 2) Here resource costs are linked to resource time-activity cost drivers via activity
pools just as in ABC The only difference is the model uses resource time drivers instead of
cost drivers wherever data complexity issues arose13 The link between a cost driver and the
standard resource time to undertake an activity was shown in Appendix 1 Table 6 With this
information the cost per cost driver under TDABC can be calculated as shown in
Appendix 1 Table 10
Resource time drivers are derived from the cost drivers so the links to the cost object
would maintain a similar relationship Therefore the calculation of product line gross margins(Appendix 1 Table 11) would be the same as under ABC (compare Appendix 1 Table 9 with
Table 11) The conclusion we can draw from this modelling exercise is that if
transaction-based cost drivers are accurately converted to standard equivalent-time drivers
(Appendix 1 Table 6) and idle capacity issues are at a minimum then the decision
information provided to management would be almost identical
13
Even when using TDABC managers in the case study company argued that some non-time based volumemeasures (where the cause-effect relationship is more appropriate than time measures and there is no complexity
in collecting the data) should be used (eg number of components no of products) This was done in the cost
modelling
Labour (Wages
amp Salaries)
Depreciation
Energy
Other Factory
Costs
Factory
Resource Group
(includes Purchasing
Manufacturing and
Quality Control)
Alpha
Beta
Others
Fig 3 The TDABC-based costing model the resource groups (single-driver) variant
290 J Ratnatunga et al The International Journal of Accounting 47 (2012) 281 ndash 301
8202019 Ratnatunga Jurnal Case Study
httpslidepdfcomreaderfullratnatunga-jurnal-case-study 1121
8202019 Ratnatunga Jurnal Case Study
httpslidepdfcomreaderfullratnatunga-jurnal-case-study 1221
companies base their cost calculations on actual costs because (i) these costs are directly
based on reality and therefore perceived by the users as being more credible (ii) there is a
stronger link between the general ledger and management accounting and (iii) companies do
not need to make budget forecasts in order to use the model When companies use actualcosts they may experience delays from invoicing or slow recognition of expenses that can
skew the calculations (Kaplan amp Anderson 2007)16 They can solve this problem by ensuring
that data gathering periods are not too short and by spreading charges across the financial year
using statistical and other smoothing techniques
72 Idle capacity in a resource group
One of TDABCs advantages is that it can isolate idle capacity within a resource group
(Kaplan amp Anderson 2007 Tse amp Gong 2009) However this advantage is not unique toTDABC because ABC also has arguments in favor of capacity costing (Cooper amp Kaplan
1991 1992 Robinson 1990)
In the case study company a lsquonormal levelrsquo of activity was defined as the normal capacity
which we also used as the budgetedpractical capacity The company defined this normal
capacity as being about 80 of theoretical capacity which is in keeping with Kaplan and
Anderson (2003 2004) who proposed a ratio between practical capacity and theoretical
capacity for labor hours The managers of the case study company stated that there were wide
variations in capacity (mainly due to the availability of the machines ie kilns) with capacity
often being leased from competitors who had excess capacity Idle capacity was a non-issue in
the case study company
73 The homogeneity condition
An important condition of the single-driver version of TDABC (Fig 3) is that the
activities or transactions performed in one resource group and allocated to different cost
objects should consume resources in the same proportions ie for the calculation to be
correct the time must remain proportional to the average consumption of the department
This is referred to as the condition of homogeneity (Gervais 2005 Kaplan amp Anderson
2007)
The case study company had special equipment for manufacturing silver-impregnated
activated carbon Here the silver-impregnation process must be separated from other types of
activation as the resources used and the rate at which they are used are not the same The
critics of the TDABC method do not seem to highlight the importance of this condition and
most likely the users are also unaware of it
In TDABC any major changes to the production process and productivity gains must be
taken into account when using standard times as these changes could alter the proportionality
between times and thus alter the homogeneity condition Rigorous maintenance and regular
16 That may be true for ABC adopters however this goes against other survey evidence Shields Chow Kato and
Nakagawa (1991) in a cross-country study showed that a majority of manufacturers - about 60 of Japanese and
70 of US - used standard costs
292 J Ratnatunga et al The International Journal of Accounting 47 (2012) 281 ndash 301
8202019 Ratnatunga Jurnal Case Study
httpslidepdfcomreaderfullratnatunga-jurnal-case-study 1321
revision are thus necessary which runs contrary to the simplification of data collection and
analysis claimed as a benefit of the TDABC method
We have already modelled and shown that the single-driver version of TDABC is a
retrograde step with all of the problems of traditional costing (Appendix 1 Tables 12 and 13)When the complexity of maintaining the homogeneity condition is added to the list there
appears to be no merit in adopting the TDABC as a cost allocation approach
74 The estimation of time
The reason complex companies started using ABC was because using direct labor hours to
allocate indirect costs was perceived as being outdated in terms of changing production
technologies (including automation) and lean manufacturing processes of organizations
(Cooper 1987 Cooper amp Kaplan 1988 Johnson amp Kaplan 1987) However the use of labor
times still remains relevant in service organizations Purportedly TDABC enables such
organizations to model the variety and complexity that they encounter in the production of
services In fact the examples provided in the work of Kaplan and Anderson (2007) are based
on service activities
However labor times are more difficult to measure in service companies than in
manufacturing due to the more diverse range of activities performed by the workforce The
common practice is for employees to estimate the percentage of time spent on their various
activities Kaplan and Anderson (2003 2004 2007) are critical of this data collection
approach as they claim that often the total of these percentages is often equal to or greater
than 100 thus that unused capacities have been ignoredKaplan and Anderson (2007) prefer to determine the time necessary to perform tasks by
means of a direct estimation in minutes or hours based on contextual observation interviews
and comparative information by the cost modellers However other authors have done studies
that contradict what Kaplan and Anderson (2007) say They show that estimation errors by
cost modellers were more prone to errors than those obtained from the employees (Cardinaels
amp Labro 2008 Hoozeacutee amp Bruggeman 2007)
These estimation issues did not arise in the comparative cost modelling of the case study
company as (i) it was a manufacturing organization (ii) it had ERP and MRP systems that
largely provided this time equivalence information and (iii) non-time‐ based drivers were used
(where appropriate) in the multi-driver application of the model (Appendix 1 Table 10)
8 Conclusion
From the comparative gross margin results presented using the case study data it appears
that ABC is superior to traditional volume-based cost allocation systems However the
multi-driver version of TDABC seems no different to ABC if standard-activity times are used
as cost drivers We also showed that attempting to simplify the stage 1 activity analysis stage
of ABC implementation (by using a single-volume related cost driver) ultimately makes
TDABC no different than traditional costing systems
Both ABC and TDABC models can provide two types of information for decision making(1) costs allocated to cost objects and (2) links between resource pools and cost pools
However they provide such information in different ways with different levels of accuracy
293 J Ratnatunga et al The International Journal of Accounting 47 (2012) 281 ndash 301
8202019 Ratnatunga Jurnal Case Study
httpslidepdfcomreaderfullratnatunga-jurnal-case-study 1421
The adoption of an activity-based paradigm (via either ABC or TDABC) enables cost
management systems to provide information on how operating activities add value to
organizational outputs through linkages between resource pools and cost pools With
information on costs allocated to cost objects management can manage product costs bychanging quantities of organizational outputs Management can also reduce product costs
by reducing or eliminating non‐value-added activities with this type of information
(Gosselin 1997)
While the TDABC model is designed to address implementation problems faced by the
ABC model the adoption of the model in the case study company did not help to alleviate the
country-independent stage 1 activity analysis complexities of an ABC implementation
especially if it tried to maintain the homogeneity condition Thus TDABC is unable to help
organizations solve implementation problems in a manner that will not compromise accuracy
If implementation problems are the only criterion for organizations to adopt a costing system
then adoption of TDABC will not alleviate this problem
In this study we did not test if TDABC can provide valuable information on idle resources
to support decision making (Kaplan amp Anderson 2007 Tse amp Gong 2009) Future research
could focus on testing the usefulness of TDABC in providing information on idle resources
Alternately it could determine if information on idle resources is useful for decision making
In summary this case study determines that the TDABC model is ABC in sheeps
clothing In its extreme form TDABC provides decision information as erroneous as that
produced by traditional volume allocations As such we predict that TDABC will result in
even fewer implementations sustaining than ABC has managed
Appendix 1
Table 1
Compariso Ltd income statement for 3rd quarter 2008
Sales $40000000
Less Cost of goods sold
Materials $8000000
Labor $7500000
Production overheadsDepreciation $7000000
Energy $2500000
Other Factory Costs $500000 $10000000
Total $25500000
Gross margin $14500000
Less Marketing expenses
Delivery expenses $400000
Sales commissions $2000000
After sales service $500000
Advertising amp promotions $2000000
Sales administration $1000000 $5900000
Less Administration expenses $3000000Total $8900000
Net income before tax $5600000
294 J Ratnatunga et al The International Journal of Accounting 47 (2012) 281 ndash 301
8202019 Ratnatunga Jurnal Case Study
httpslidepdfcomreaderfullratnatunga-jurnal-case-study 1521
Table 2
Sales and cost data for 2 product lines
Product lines Alpha Beta
Per unit data
Price $8000 $40000
Direct materials costs $2000 $12000
Direct wages $1500 $6000
Labor hours 1 4
Table 3
Product line gross margins under traditional absorption costing
Alpha Beta
Sales $2400000 $800000
Costs
Materials $600000 $240000
Labor $450000 $120000
Overheads $600000 $160000
$1650000 $520000
Gross margin $750000 $280000
Gross margin percent 3125 3500
Table 4
Production expenses
Activity cost pools Cost $
Purchasing 1200000
Materials handling and storage 1000000
Machine setup 1350000
Quality control 800000
Labor and other overhead 10650000Packaging 2500000
Table 5
Marketing expenses
Activity cost pools Cost $
Delivery expenses 400000Sales commission 2000000
After sales service 500000
295 J Ratnatunga et al The International Journal of Accounting 47 (2012) 281 ndash 301
8202019 Ratnatunga Jurnal Case Study
httpslidepdfcomreaderfullratnatunga-jurnal-case-study 1621
Table 6
Driver units
Activity cost drivers Driver units Std time in hours
per driver unit
Time equivalent
driver units
No of components used 5000000 NA NA
No of setups 9000 40000 36000
No of batches 3200 10000 3200
No labor hours 500000 10000 500000
No machine hours 500000 10000 500000
No of units 625000 NA NA
No of sales orders 4000 05000 2000
Sales dollars $40000000 NA NA
No of service calls 10000 10000 10000
Table 7
Cost per cost driver calculations under ABC
Activity cost pool Cost driver identified Resource costs Driver units Cost per
driver unit
Mat handling and storage No of components used $1000000 5000000 $020
Machine setup No of setups $1350000 9000 $15000
Quality control No of batches $800000 3200 $25000
Manufacturing No labor hours $10650000 500000 $2130
Packaging No machine hours $2500000 625000 $400Delivery expenses No of sales orders $400000 4000 $10000
Sales commissions Sales dollars $2000000 40000000 $005
After sales service No of service calls $500000 10000 $5000
Total costs allocated $20400000
Sustaining costs unallocated $4000000
Total production direct costs $8000000
Total costs $32400000
Table 8Cost driver data for 2 product lines under ABC
Product lines Alpha Beta All product lines
ABC cost drivers
No purchase orders 200 200 3000
No of components used 450000 100000 5000000
No of setups 50 1000 9000
No of batches 50 200 3200
Total labor hours 30000 8000 500000
Total machine hours 30000 8000 500000
No of units produced and sold 30000 2000 625000
No of sales orders 300 400 4000Sales dollars $2400000 $800000 $40000000
No of service calls 50 500 10000
296 J Ratnatunga et al The International Journal of Accounting 47 (2012) 281 ndash 301
8202019 Ratnatunga Jurnal Case Study
httpslidepdfcomreaderfullratnatunga-jurnal-case-study 1721
Table 9
Product line gross margins under ABC absorption costing
Alpha Beta
units Price Value units Price Value
Sales 30000 $80 $2400000 2000 $400 $800000
Production costs
Direct materials 30000 $2000 $600000 2000 $120 $240000
Indirect costs Cost per
driver unit
Driver
units
Allocated
costs
Driver
units
Allocated
costs
Purchasing $40000 200 $80000 200 $80000
Mat handling and storage $020 450000 $90000 100000 $20000
Machine setup $15000 50 $7500 1000 $150000
Quality control $25000 50 $12500 200 $50000
Manufacturing $2130 30000 $639000 8000 $170400
Packaging $400 30000 $120000 2000 $8000
Total production costs $1549000 $718400
Gross margin $851000 $81600
Marketing costs
Delivery expenses $10000 300 $30000 400 $40000
Sales commissions $005 $2400000 $120000 $800000 $40000
After sales service $5000 50 $2500 500 $25000
Total $152500 $105000
Net income $698500 ($23400)Gross margin percent 3546 1020
Net margin percent 2910 -293
Table 10
Cost per cost driver calculations under TDABC (multi-driver) variant)
Activity cost pool Cost driver identified Resource costs Driver units Cost per
driver unit
Mat handling and storage No of components used $1000000 5000000 $020
Machine setup Time per setup $1350000 36000 $3750
Quality control Time per batch $800000 3200 $25000
Manufacturing No machine hours $10650000 500000 $2130
Packaging No of units $2500000 625000 $400
Delivery expenses Time per sales order $400000 2000 $20000
Sales commissions Sales dollars $2000000 40000000 $005
After sales service Time per Service Call $500000 10000 $5000
Total costs allocated $20400000
Sustaining costs unallocated $4000000Total production direct costs $8000000
Total costs $32400000
297 J Ratnatunga et al The International Journal of Accounting 47 (2012) 281 ndash 301
8202019 Ratnatunga Jurnal Case Study
httpslidepdfcomreaderfullratnatunga-jurnal-case-study 1821
Table 11
Product line gross margins under TDABC absorption costing (multi-driver variant)
Alpha Beta
units Price Value units Price Value
Sales 30000 $80 $2400000 2000 $400 $800000
Production costs
Direct materials 30000 $2000 $600000 2000 $120 $240000
Indirect costs Cost per
driver unit
Driver
units
Allocated
costs
Driver
units
Allocated
costs
Purchasing $80000 100 $80000 100 $80000
Mat handling and storage $020 450000 $90000 100000 $20000
Machine setup $3750 200 $7500 4000 $150000
Quality control $25000 50 $12500 200 $50000
Manufacturing $2130 30000 $639000 8000 $170400
Packaging $400 30000 $120000 2000 $8000
Total production costs $1549000 $718400
Gross margin $851000 $81600
Marketing costs
Delivery expenses $20000 150 $30000 200 $40000
Sales commissions $005 $2400000 $120000 $800000 $40000
After sales service $5000 50 $2500 500 $25000
Total $152500 $105000
Net income $698500 ($23400)Gross margin percent 3546 1020
Net margin percent 2910 -293
Table 12
Cost per cost driver calculations under lsquosingle-driver rsquo TDABC
Activity cost pool Cost driver identified Resource costs Driver units Cost per
driver unit
Mat handling and storage No labor hours $1000000 500000 $200
Machine setup No labor hours $1350000 500000 $270
Quality control No labor hours $800000 500000 $160
Manufacturing No labor hours $10650000 500000 $2130
Packaging No labor hours $2500000 500000 $500
Total factory resource cost $17500000 $3500
Delivery expenses Sales dollars $400000 40000000 $001
Sales commissions Sales dollars $2000000 40000000 $005
After sales service Sales dollars $500000 40000000 $001
Total costs allocated $20400000
Sustaining costs unallocated $4000000Total production direct costs $8000000
Total costs $32400000
298 J Ratnatunga et al The International Journal of Accounting 47 (2012) 281 ndash 301
8202019 Ratnatunga Jurnal Case Study
httpslidepdfcomreaderfullratnatunga-jurnal-case-study 1921
References
Anderson S W (1995) A Framework for assessing cost management system changes The case of activity-based
costing implementation at general motors 1986ndash1993 Journal of Management Accounting Research 7
1ndash51
Anderson S W (2007) Managing Costs and Cost Structure throughout the Value Chain Research on Strategic
Cost Management In C S Chapman A G Hopwood amp M D Shield (Eds) Handbook of Management
Accounting Research Vol 2 (pp 481ndash506) Oxford Elsevier
Baird K M Harrison G L amp Reeve R C (2004) Adoption of activity management practices A note on the
extent of adoption and the influence of organizational and cultural factors Management Accounting Research
15(4) 393ndash399
Barrett R (2005) Time-Driven Costing The Bottom Line on the New ABC Business Performance Management
35ndash39
Bruggeman W Everaert P Levant Y Saens G amp Anderson S (2008) Cost modelling in logistics using
time-driven ABC Experiences from a wholesaler International Journal of Physical Distribution amp Logistics
Management 38(3) 172ndash191
Byrne S Stower E amp Torry P (2009) Is ABC adoption a success in Australia Journal of Applied Management Accounting Research 7 (1) 37ndash52
Cardinaels E amp Labro E (2008) On the determinants of measurement error in time driven costing Accounting
Review 83(3) 735ndash756
Table 13
Product line gross margins under lsquosingle-diver rsquo TDABC absorption costing
Alpha Beta
units Price Value units Price Value
Sales 30000 $80 $2400000 2000 $400 $800000
Production costs
Direct materials 30000 $2000 $600000 2000 $120 $240000
Indirect costs Cost per
driver unit
Driver
units
Allocated
costs
Driver
units
Allocated
costs
Purchasing $240 30000 $72000 8000 $19200
Mat handling amp storage $200 30000 $60000 8000 $16000
Machine setup $270 30000 $81000 8000 $21600
Quality control $160 30000 $48000 8000 $12800
Manufacturing $2130 30000 $639000 8000 $170400
Packaging $500 30000 $150000 8000 $40000
Total production costs $1650000 $520000
Gross margin $750000 $280000
Marketing costs
Delivery expenses $001 2400000 $24000 800000 $8000
Sales commissions $005 2400000 $120000 800000 $40000
After sales service $001 2400000 $30000 800000 $10000
Total $174000 $58000
Net income $576000 $222000Gross margin percent 3125 3500
Net margin percent 2400 2775
299 J Ratnatunga et al The International Journal of Accounting 47 (2012) 281 ndash 301
8202019 Ratnatunga Jurnal Case Study
httpslidepdfcomreaderfullratnatunga-jurnal-case-study 2021
Cobb I Innes J amp Mitchell F (1992) Activity-based costing-problems in practice London CIMA
Cohen S Venieris G amp Kaimenaki E (2005) ABC Adopters supporters deniers and unawares Managerial
Auditing Journal 20(9) 981ndash1000
Cooper R (1987) Does your company need a new cost system Journal of Cost Management 1(1) 45ndash49
Cooper R (1997 Autumn) The two-stage procedure in cost accounting Part two Journal of Cost Management 39ndash45
Cooper R amp Kaplan R S (1988) Measure Costs Right Make the Right Decisions Harvard Business Review
66 (9) 96ndash103
Cooper R amp Kaplan R S (1991) Design of cost management systems Text cases and readings NJ
Prentice-Hall Englewood Cliffs
Cooper R amp Kaplan R S (1992) Activity based systems Measuring the costs of resource usage Accounting
Horizons 6 (3) 1ndash13
Cotton W Jackson S amp Brown R (2003) Note on a New Zealand replication of the Innes et al UK
activity-based costing survey Management Accounting Research 14(1) 67ndash72
Drury C (1990) Product costing in the 1990s Accountancy 1990 123ndash126
Everaert P amp Bruggeman W (2007) Time-driven activity-based costing exploring the underlying model Cost
Management 21(2) 16ndash
20Foster G amp Swenson D W (1997) Measuring the success of activity-based cost management and its
determinants Journal of Management Accounting Research 9 109ndash141
Gervais M (2005) Controcircle de Gestion (8th ed) Paris Economica
Gosselin M (1997) The effect of strategy and organizational structure on the adoption and implementation of
activity-based costing Accounting Organizations and Society 22(2) 105ndash122
Gosselin M (2007) A review of activity-based costing Technique implementation and consequences In C S
Chapman A G Hopwood amp M D Shield (Eds) Handbook of Management Accounting Research Vol 2
(pp 641ndash672) Oxford Elsevier
Hoozeacutee S amp Bruggeman W (2007) Time-driven activity-based costing Exploring the underlying model Cost
Management 21(2) 16ndash20
Hoozeacutee S amp Bruggeman W (2010) Identifying operating improvements during the design process of a
time-driven ABC system The role of collective worker participation and leadership style Management Accounting Research 21(3) 185ndash198
Horngren C T (2004) Management accounting Some comments Journal of Management Accounting
Research 16 207ndash211
Innes J Mitchel F amp Sinclair D (2000) Activity-based costing in the UKs largest companies A comparison
of 1994 and 1999 survey results Management Accounting Research 11(3) 349ndash362
Johnson H T amp Kaplan R S (1987) Relevance Lost The Rise and Fall of Management Accounting
Cambridge USA Harvard Business School Press
Kaplan R S amp Anderson S R (2003) Time-driven activity-based costing White paper presented at the First
European Summit on Time-Driven Activity-Based Costing Available from httpwwwhbseduresearch
facpubsworkingpaperspapers2030404-045pdf (Accessed 3 December 2010)
Kaplan R S amp Anderson S R (2004) Time-Driven Activity-Based Costing Harvard Business Review 82(11)
131ndash138
Kaplan R S amp Anderson S R (2007) The innovation of time-driven activity-based costing Cost Management
21(2) 5ndash15
Kiani R amp Sangeladji M (2003) An empirical study about the use of the ABCABM models by some of the
Fortune 500 largest industrial corporations in the USA Journal of American Academy of Business Cambridge
3(1ndash2) 174ndash182
Krumwiede K R (1998) The implementation stages of activity-based costing and the impact of contextual and
organizational factors Journal of Management Accounting Research 10 239ndash277
Levant Y amp Zimnovitch H (2008) An ill-known facet to the history of cost calculation The methods of
equivalence 20th Annual Conference of the Business History Research Unit Cardiff Business School (10ndash
11th September)
Malmi T (1997) Towards explaining activity-based costing failure Accounting and control in a decentralisedorganisation Management Accounting Research 8(4) 459ndash480
McDonach C amp Mattimore R (2008) Strategic applications of time driven ABC in the service sector Lessons from
Irish SME Rotterdam Communication at the 31st Annual Congress of the European Accounting Association
300 J Ratnatunga et al The International Journal of Accounting 47 (2012) 281 ndash 301
8202019 Ratnatunga Jurnal Case Study
httpslidepdfcomreaderfullratnatunga-jurnal-case-study 2121
McGowan A S amp Klammer T P (1997) Satisfaction with activity-based cost management implementation
Journal of Management Accounting Research 9 217ndash238
McNair C J (2007) Beyond the boundaries Future trends in cost management Cost Management 21(1) 10ndash21
Nguyen H V amp Brooks A (1997) An empirical investigation of adoption issues relating to activity-based
costing Asian Review of Accounting 5(1) 1ndash18
OConnor N G Deng J amp Luo Y (2006) Political constraints organization design and performance
measurement in Chinas state-owned enterprises Accounting Organizations and Society 31(2) 157ndash177
Pernot E Roodhooft F amp van den Abbeele A (2007) Time-driven activity-based costing for inter-library
services A case study in a university Journal of Academic of Librarianship 33(5) 551ndash560
Ratnatunga J (1983) Financial Controls in Marketing The Accounting-Marketing Interface Canberra Series in
Administrative Studies Monograph No 6 Canberra CAE Canberra Australia
Robinson M A (1990) Contribution margin analysis No longer relevant - strategic cost management the new
paradigm Journal of Management Accounting Research 2 1ndash32
Shank J (1989) Strategic cost management New wine or just new bottles Journal of Management Accounting
Research Fall 1(1) 47ndash65
Sharma R amp Ratnatunga J (1997) Traditional and activity based costing systems Accounting Education An International Journal 6 (4) 337ndash345
Sharman P A (2003) The case for management accounting Strategic Finance 85(4) 43ndash47
Shields M D (1995) An empirical analysis of firms implementation experiences with activity-based costing
Journal of Management Accounting Research 7 148ndash166
Shields M D Chow C W Kato Y amp Nakagawa Y (1991) Management accounting practices in the US and
Japan Comparative survey findings and research implications Journal of International Financial Management
and Accounting 3(1) 61ndash77
Sprinkle G B (2003) Perspectives on experimental research in managerial accounting Accounting Organizations
and Society 28(2ndash3) 287ndash318
Swenson D W (1995) The benefits of activity-based cost management to the manufacturing industry Journal of
Management Accounting Research 7 167ndash180
Tse M amp Gong M (2009) Recognition of idle resources in time-driven activity-based costing and resourceconsumption accounting models Journal of Applied Management Accounting Research 7 (2) 41ndash54
Williams J J amp Seaman A E (2001) Predicting changes in management accounting systems National culture
and industry effects Accounting Organizations and Society 26 (4ndash5) 443ndash460
301 J Ratnatunga et al The International Journal of Accounting 47 (2012) 281 ndash 301
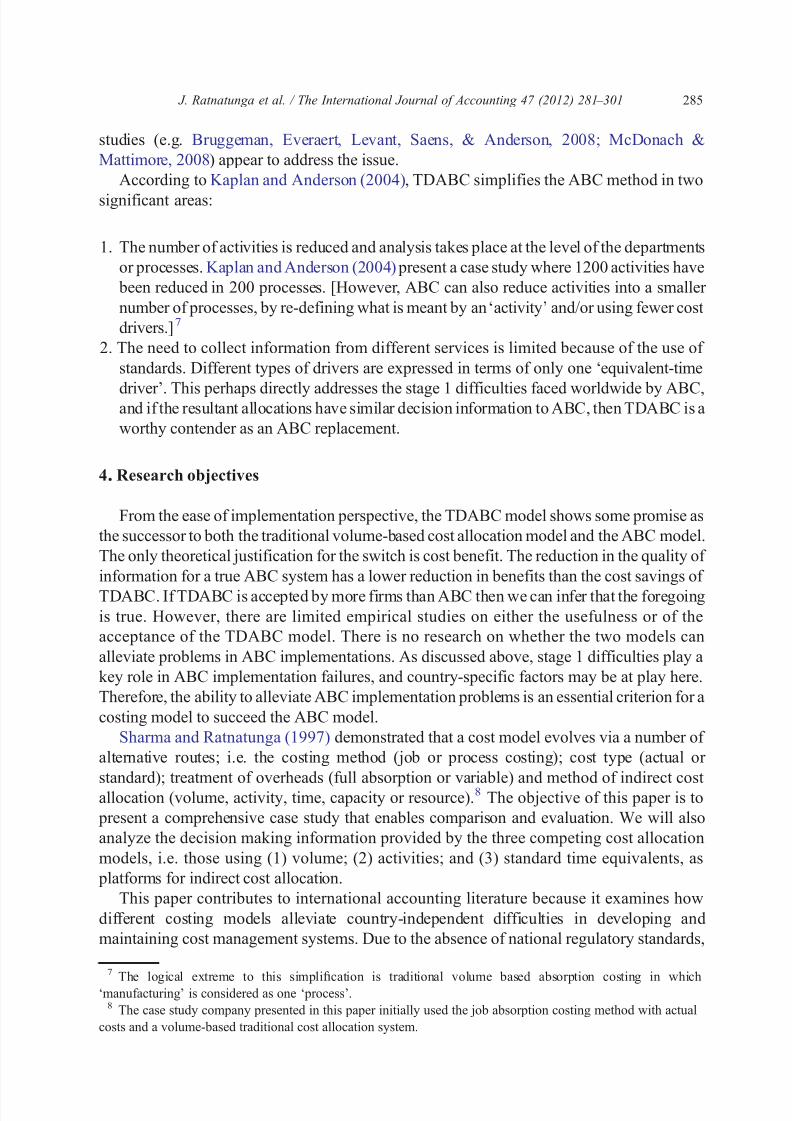
8202019 Ratnatunga Jurnal Case Study
httpslidepdfcomreaderfullratnatunga-jurnal-case-study 821
After allocating resource costs to the activity pools activity costs are subsequently allocated
to the two cost objects (the Alpha and Beta product lines) of interest in this case
Compariso had a very good ERP system It also had excellent document flow charts
prepared by the Internal Audit section that helped greatly in the activity mapping (stage 1) of the ABC project We used the information from interviews the general ledger and ERP and
MRP systems to map resource costs to activity cost pools identify cost drivers and compute
driver units actually used in the third quarter of 2008 (Appendix 1 Tables 4 and 5)9
In the activity analysis and date collection stages especially in conducting the interviews
there was no evidence of any country‐specific factors causing implementation difficulties
Certainly country-neutral factors such as the industry in which the company operated and its
management style affected model building However in Comparisos case these had a
positive effect as no impediments were placed on conducting interviews in the subsequent
cost modelling10 Thus we could directly compare the TDABC model and its results to the
results the ABC model obtained without any country‐specific factors contaminating it
For the purpose of comparing ABC with TDABC standard times allowed (in hours) were
determined for certain driver units (eg it was estimated that it would take 05 h to prepare an
average purchase order) and these are shown in Appendix 1 Table 6 Some volume‐ based
cost drivers could not be converted because they were unrelated to time and these were left
unchanged (eg number of components units sales dollars etc) Using the resource cost
information from Appendix 1 Tables 4 and 5 and the cost driver information from
Appendix 1 Table 6 we provide cost per cost driver calculations in Appendix 1 Table 7 The
cost drivers relating to the two product lines under investigation are shown in Appendix 1
Table 8 and the resultant gross margin calculations under ABC are presented in Appendix 1Table 9
The decision information we obtained from the ABC project was in keeping with the
perceptions of the management Management thought that the low‐volume and more complex
Beta product line made a significantly lower gross margin than the standard Alpha product
line In fact it was a loss product line if marketing costs were allocated to it These benefits are
well documented in ABC literature
We will now undertake cost modelling to illustrate how the data collected in the case study
company would be presented under the TDABC cost allocation model
6 From ABC to TDABC
Converting an ABC-based costing model to a TDABC-based one should be a relatively
simple process Relationships between resource cost pools activities and cost objects
identified in the ABC-based costing model can be adopted in the TDABC-based model via
lsquoresource groupsrsquo (eg purchasing manufacturing selling) using multiple time-based
drivers to allocate costs to cost objects or using a single time-based driver if the data has
9 Note that production wages were classi1047297ed as an overhead expense in the ABC- system It was also decided
not to allocate administration (general) expenses advertising and promotions and sales administration expenses to product lines under the ABC- system10 The country-neutral complexity arising out of maintaining the homogeneity condition in TDABC will be
discussed later
288 J Ratnatunga et al The International Journal of Accounting 47 (2012) 281 ndash 301
8202019 Ratnatunga Jurnal Case Study
httpslidepdfcomreaderfullratnatunga-jurnal-case-study 921
complexities Fig 2 illustrates the allocation via a resource group using multiple-drivers
and Fig 3 illustrates the allocation via a resource group using a single time-based driver
A ldquoresource grouprdquo could be an organizational unit department or section that may consist
of many different activities As there are fewer ldquoresource groupsrdquo than activities the method
seems to be reduce the complexity of data collection and reduce measurement errors This is
due to the use of time standards In ABC complex operations require adding more activities
into the model In TDABC this complexity is accounted for by using lsquoequivalent-timersquo
equations to determine how many resources each group consumes Equivalences are
established in a ldquoresource grouprdquo by means of a single driver the time needed to perform
them11 Using these equivalency equations the model should be easy to update For example
one could add an extra activity (if performed within a resource group) add variables to
explain the time spent take into account changes in productivity etc that no longer present an
ongoing maintenance problem It is not necessary to conduct regular and time‐consuming
surveys just to determine if the distribution of work time between different activities has
changed This simplifies the methods maintenance and enhances the sustainability of the
costing project The program requires conducting regular surveys to ensure that these
equivalent-time standards remain consistent with the latest practices in the organizationAt first glance the TDABC-based model shown in Fig 2 does not look much different
from the ABC-based model in Fig 112 The two models share the same resource cost pools
the same activities and the same cost objects The difference is that the activity cost pools
reside within a lsquoresource grouprsquo and some cost drivers are converted to equivalent-time
drivers (Barrett 2005 Kaplan amp Anderson 2004)
Quality Control
Labour (Wages
amp Salaries)
Depreciation
Energy
Other Factory
Costs
Factory Resource
Group
Alpha
Beta
Others
Purchasing
Manufacturing
Quality Control
Fig 2 The TDABC-based costing model the resource groups (multi-driver) variant
11 Kaplan and Anderson (2007) state that capacity drivers may also be used and if so that the method should be
called Capacity-Driven ABC rather than Time-Driven ABC12 The basic TDABC model is in fact an ABC model that uses time as a cost driver where the obtaining of
structural cost drivers is cumbersome (eg time to do purchase orders rather than the total number of purchase
orders)
289 J Ratnatunga et al The International Journal of Accounting 47 (2012) 281 ndash 301
8202019 Ratnatunga Jurnal Case Study
httpslidepdfcomreaderfullratnatunga-jurnal-case-study 1021
The value of a resource time-activity cost driver equals resource costs for a unit of the
resource (hours) multiplied by the number of hours for an activity (Everaert amp Bruggeman
2007 Kaplan amp Anderson 2004) The number of resource-activity cost drivers between a
resource pool and a cost object depends on each activitys resources consumption patterns
For instance wage and salary cost is consumed by all of the activities (such as purchasing
assembly and quality control) while energy cost bears no relationship with the purchasing
activity Therefore wage and salary cost is linked to each cost object through three separate
resource time-activity cost drivers while energy cost is only linked via one
In the case study company we first modelled the multiple-driver variant of TDABC
(Fig 2) Here resource costs are linked to resource time-activity cost drivers via activity
pools just as in ABC The only difference is the model uses resource time drivers instead of
cost drivers wherever data complexity issues arose13 The link between a cost driver and the
standard resource time to undertake an activity was shown in Appendix 1 Table 6 With this
information the cost per cost driver under TDABC can be calculated as shown in
Appendix 1 Table 10
Resource time drivers are derived from the cost drivers so the links to the cost object
would maintain a similar relationship Therefore the calculation of product line gross margins(Appendix 1 Table 11) would be the same as under ABC (compare Appendix 1 Table 9 with
Table 11) The conclusion we can draw from this modelling exercise is that if
transaction-based cost drivers are accurately converted to standard equivalent-time drivers
(Appendix 1 Table 6) and idle capacity issues are at a minimum then the decision
information provided to management would be almost identical
13
Even when using TDABC managers in the case study company argued that some non-time based volumemeasures (where the cause-effect relationship is more appropriate than time measures and there is no complexity
in collecting the data) should be used (eg number of components no of products) This was done in the cost
modelling
Labour (Wages
amp Salaries)
Depreciation
Energy
Other Factory
Costs
Factory
Resource Group
(includes Purchasing
Manufacturing and
Quality Control)
Alpha
Beta
Others
Fig 3 The TDABC-based costing model the resource groups (single-driver) variant
290 J Ratnatunga et al The International Journal of Accounting 47 (2012) 281 ndash 301
8202019 Ratnatunga Jurnal Case Study
httpslidepdfcomreaderfullratnatunga-jurnal-case-study 1121
8202019 Ratnatunga Jurnal Case Study
httpslidepdfcomreaderfullratnatunga-jurnal-case-study 1221
companies base their cost calculations on actual costs because (i) these costs are directly
based on reality and therefore perceived by the users as being more credible (ii) there is a
stronger link between the general ledger and management accounting and (iii) companies do
not need to make budget forecasts in order to use the model When companies use actualcosts they may experience delays from invoicing or slow recognition of expenses that can
skew the calculations (Kaplan amp Anderson 2007)16 They can solve this problem by ensuring
that data gathering periods are not too short and by spreading charges across the financial year
using statistical and other smoothing techniques
72 Idle capacity in a resource group
One of TDABCs advantages is that it can isolate idle capacity within a resource group
(Kaplan amp Anderson 2007 Tse amp Gong 2009) However this advantage is not unique toTDABC because ABC also has arguments in favor of capacity costing (Cooper amp Kaplan
1991 1992 Robinson 1990)
In the case study company a lsquonormal levelrsquo of activity was defined as the normal capacity
which we also used as the budgetedpractical capacity The company defined this normal
capacity as being about 80 of theoretical capacity which is in keeping with Kaplan and
Anderson (2003 2004) who proposed a ratio between practical capacity and theoretical
capacity for labor hours The managers of the case study company stated that there were wide
variations in capacity (mainly due to the availability of the machines ie kilns) with capacity
often being leased from competitors who had excess capacity Idle capacity was a non-issue in
the case study company
73 The homogeneity condition
An important condition of the single-driver version of TDABC (Fig 3) is that the
activities or transactions performed in one resource group and allocated to different cost
objects should consume resources in the same proportions ie for the calculation to be
correct the time must remain proportional to the average consumption of the department
This is referred to as the condition of homogeneity (Gervais 2005 Kaplan amp Anderson
2007)
The case study company had special equipment for manufacturing silver-impregnated
activated carbon Here the silver-impregnation process must be separated from other types of
activation as the resources used and the rate at which they are used are not the same The
critics of the TDABC method do not seem to highlight the importance of this condition and
most likely the users are also unaware of it
In TDABC any major changes to the production process and productivity gains must be
taken into account when using standard times as these changes could alter the proportionality
between times and thus alter the homogeneity condition Rigorous maintenance and regular
16 That may be true for ABC adopters however this goes against other survey evidence Shields Chow Kato and
Nakagawa (1991) in a cross-country study showed that a majority of manufacturers - about 60 of Japanese and
70 of US - used standard costs
292 J Ratnatunga et al The International Journal of Accounting 47 (2012) 281 ndash 301
8202019 Ratnatunga Jurnal Case Study
httpslidepdfcomreaderfullratnatunga-jurnal-case-study 1321
revision are thus necessary which runs contrary to the simplification of data collection and
analysis claimed as a benefit of the TDABC method
We have already modelled and shown that the single-driver version of TDABC is a
retrograde step with all of the problems of traditional costing (Appendix 1 Tables 12 and 13)When the complexity of maintaining the homogeneity condition is added to the list there
appears to be no merit in adopting the TDABC as a cost allocation approach
74 The estimation of time
The reason complex companies started using ABC was because using direct labor hours to
allocate indirect costs was perceived as being outdated in terms of changing production
technologies (including automation) and lean manufacturing processes of organizations
(Cooper 1987 Cooper amp Kaplan 1988 Johnson amp Kaplan 1987) However the use of labor
times still remains relevant in service organizations Purportedly TDABC enables such
organizations to model the variety and complexity that they encounter in the production of
services In fact the examples provided in the work of Kaplan and Anderson (2007) are based
on service activities
However labor times are more difficult to measure in service companies than in
manufacturing due to the more diverse range of activities performed by the workforce The
common practice is for employees to estimate the percentage of time spent on their various
activities Kaplan and Anderson (2003 2004 2007) are critical of this data collection
approach as they claim that often the total of these percentages is often equal to or greater
than 100 thus that unused capacities have been ignoredKaplan and Anderson (2007) prefer to determine the time necessary to perform tasks by
means of a direct estimation in minutes or hours based on contextual observation interviews
and comparative information by the cost modellers However other authors have done studies
that contradict what Kaplan and Anderson (2007) say They show that estimation errors by
cost modellers were more prone to errors than those obtained from the employees (Cardinaels
amp Labro 2008 Hoozeacutee amp Bruggeman 2007)
These estimation issues did not arise in the comparative cost modelling of the case study
company as (i) it was a manufacturing organization (ii) it had ERP and MRP systems that
largely provided this time equivalence information and (iii) non-time‐ based drivers were used
(where appropriate) in the multi-driver application of the model (Appendix 1 Table 10)
8 Conclusion
From the comparative gross margin results presented using the case study data it appears
that ABC is superior to traditional volume-based cost allocation systems However the
multi-driver version of TDABC seems no different to ABC if standard-activity times are used
as cost drivers We also showed that attempting to simplify the stage 1 activity analysis stage
of ABC implementation (by using a single-volume related cost driver) ultimately makes
TDABC no different than traditional costing systems
Both ABC and TDABC models can provide two types of information for decision making(1) costs allocated to cost objects and (2) links between resource pools and cost pools
However they provide such information in different ways with different levels of accuracy
293 J Ratnatunga et al The International Journal of Accounting 47 (2012) 281 ndash 301
8202019 Ratnatunga Jurnal Case Study
httpslidepdfcomreaderfullratnatunga-jurnal-case-study 1421
The adoption of an activity-based paradigm (via either ABC or TDABC) enables cost
management systems to provide information on how operating activities add value to
organizational outputs through linkages between resource pools and cost pools With
information on costs allocated to cost objects management can manage product costs bychanging quantities of organizational outputs Management can also reduce product costs
by reducing or eliminating non‐value-added activities with this type of information
(Gosselin 1997)
While the TDABC model is designed to address implementation problems faced by the
ABC model the adoption of the model in the case study company did not help to alleviate the
country-independent stage 1 activity analysis complexities of an ABC implementation
especially if it tried to maintain the homogeneity condition Thus TDABC is unable to help
organizations solve implementation problems in a manner that will not compromise accuracy
If implementation problems are the only criterion for organizations to adopt a costing system
then adoption of TDABC will not alleviate this problem
In this study we did not test if TDABC can provide valuable information on idle resources
to support decision making (Kaplan amp Anderson 2007 Tse amp Gong 2009) Future research
could focus on testing the usefulness of TDABC in providing information on idle resources
Alternately it could determine if information on idle resources is useful for decision making
In summary this case study determines that the TDABC model is ABC in sheeps
clothing In its extreme form TDABC provides decision information as erroneous as that
produced by traditional volume allocations As such we predict that TDABC will result in
even fewer implementations sustaining than ABC has managed
Appendix 1
Table 1
Compariso Ltd income statement for 3rd quarter 2008
Sales $40000000
Less Cost of goods sold
Materials $8000000
Labor $7500000
Production overheadsDepreciation $7000000
Energy $2500000
Other Factory Costs $500000 $10000000
Total $25500000
Gross margin $14500000
Less Marketing expenses
Delivery expenses $400000
Sales commissions $2000000
After sales service $500000
Advertising amp promotions $2000000
Sales administration $1000000 $5900000
Less Administration expenses $3000000Total $8900000
Net income before tax $5600000
294 J Ratnatunga et al The International Journal of Accounting 47 (2012) 281 ndash 301
8202019 Ratnatunga Jurnal Case Study
httpslidepdfcomreaderfullratnatunga-jurnal-case-study 1521
Table 2
Sales and cost data for 2 product lines
Product lines Alpha Beta
Per unit data
Price $8000 $40000
Direct materials costs $2000 $12000
Direct wages $1500 $6000
Labor hours 1 4
Table 3
Product line gross margins under traditional absorption costing
Alpha Beta
Sales $2400000 $800000
Costs
Materials $600000 $240000
Labor $450000 $120000
Overheads $600000 $160000
$1650000 $520000
Gross margin $750000 $280000
Gross margin percent 3125 3500
Table 4
Production expenses
Activity cost pools Cost $
Purchasing 1200000
Materials handling and storage 1000000
Machine setup 1350000
Quality control 800000
Labor and other overhead 10650000Packaging 2500000
Table 5
Marketing expenses
Activity cost pools Cost $
Delivery expenses 400000Sales commission 2000000
After sales service 500000
295 J Ratnatunga et al The International Journal of Accounting 47 (2012) 281 ndash 301
8202019 Ratnatunga Jurnal Case Study
httpslidepdfcomreaderfullratnatunga-jurnal-case-study 1621
Table 6
Driver units
Activity cost drivers Driver units Std time in hours
per driver unit
Time equivalent
driver units
No of components used 5000000 NA NA
No of setups 9000 40000 36000
No of batches 3200 10000 3200
No labor hours 500000 10000 500000
No machine hours 500000 10000 500000
No of units 625000 NA NA
No of sales orders 4000 05000 2000
Sales dollars $40000000 NA NA
No of service calls 10000 10000 10000
Table 7
Cost per cost driver calculations under ABC
Activity cost pool Cost driver identified Resource costs Driver units Cost per
driver unit
Mat handling and storage No of components used $1000000 5000000 $020
Machine setup No of setups $1350000 9000 $15000
Quality control No of batches $800000 3200 $25000
Manufacturing No labor hours $10650000 500000 $2130
Packaging No machine hours $2500000 625000 $400Delivery expenses No of sales orders $400000 4000 $10000
Sales commissions Sales dollars $2000000 40000000 $005
After sales service No of service calls $500000 10000 $5000
Total costs allocated $20400000
Sustaining costs unallocated $4000000
Total production direct costs $8000000
Total costs $32400000
Table 8Cost driver data for 2 product lines under ABC
Product lines Alpha Beta All product lines
ABC cost drivers
No purchase orders 200 200 3000
No of components used 450000 100000 5000000
No of setups 50 1000 9000
No of batches 50 200 3200
Total labor hours 30000 8000 500000
Total machine hours 30000 8000 500000
No of units produced and sold 30000 2000 625000
No of sales orders 300 400 4000Sales dollars $2400000 $800000 $40000000
No of service calls 50 500 10000
296 J Ratnatunga et al The International Journal of Accounting 47 (2012) 281 ndash 301
8202019 Ratnatunga Jurnal Case Study
httpslidepdfcomreaderfullratnatunga-jurnal-case-study 1721
Table 9
Product line gross margins under ABC absorption costing
Alpha Beta
units Price Value units Price Value
Sales 30000 $80 $2400000 2000 $400 $800000
Production costs
Direct materials 30000 $2000 $600000 2000 $120 $240000
Indirect costs Cost per
driver unit
Driver
units
Allocated
costs
Driver
units
Allocated
costs
Purchasing $40000 200 $80000 200 $80000
Mat handling and storage $020 450000 $90000 100000 $20000
Machine setup $15000 50 $7500 1000 $150000
Quality control $25000 50 $12500 200 $50000
Manufacturing $2130 30000 $639000 8000 $170400
Packaging $400 30000 $120000 2000 $8000
Total production costs $1549000 $718400
Gross margin $851000 $81600
Marketing costs
Delivery expenses $10000 300 $30000 400 $40000
Sales commissions $005 $2400000 $120000 $800000 $40000
After sales service $5000 50 $2500 500 $25000
Total $152500 $105000
Net income $698500 ($23400)Gross margin percent 3546 1020
Net margin percent 2910 -293
Table 10
Cost per cost driver calculations under TDABC (multi-driver) variant)
Activity cost pool Cost driver identified Resource costs Driver units Cost per
driver unit
Mat handling and storage No of components used $1000000 5000000 $020
Machine setup Time per setup $1350000 36000 $3750
Quality control Time per batch $800000 3200 $25000
Manufacturing No machine hours $10650000 500000 $2130
Packaging No of units $2500000 625000 $400
Delivery expenses Time per sales order $400000 2000 $20000
Sales commissions Sales dollars $2000000 40000000 $005
After sales service Time per Service Call $500000 10000 $5000
Total costs allocated $20400000
Sustaining costs unallocated $4000000Total production direct costs $8000000
Total costs $32400000
297 J Ratnatunga et al The International Journal of Accounting 47 (2012) 281 ndash 301
8202019 Ratnatunga Jurnal Case Study
httpslidepdfcomreaderfullratnatunga-jurnal-case-study 1821
Table 11
Product line gross margins under TDABC absorption costing (multi-driver variant)
Alpha Beta
units Price Value units Price Value
Sales 30000 $80 $2400000 2000 $400 $800000
Production costs
Direct materials 30000 $2000 $600000 2000 $120 $240000
Indirect costs Cost per
driver unit
Driver
units
Allocated
costs
Driver
units
Allocated
costs
Purchasing $80000 100 $80000 100 $80000
Mat handling and storage $020 450000 $90000 100000 $20000
Machine setup $3750 200 $7500 4000 $150000
Quality control $25000 50 $12500 200 $50000
Manufacturing $2130 30000 $639000 8000 $170400
Packaging $400 30000 $120000 2000 $8000
Total production costs $1549000 $718400
Gross margin $851000 $81600
Marketing costs
Delivery expenses $20000 150 $30000 200 $40000
Sales commissions $005 $2400000 $120000 $800000 $40000
After sales service $5000 50 $2500 500 $25000
Total $152500 $105000
Net income $698500 ($23400)Gross margin percent 3546 1020
Net margin percent 2910 -293
Table 12
Cost per cost driver calculations under lsquosingle-driver rsquo TDABC
Activity cost pool Cost driver identified Resource costs Driver units Cost per
driver unit
Mat handling and storage No labor hours $1000000 500000 $200
Machine setup No labor hours $1350000 500000 $270
Quality control No labor hours $800000 500000 $160
Manufacturing No labor hours $10650000 500000 $2130
Packaging No labor hours $2500000 500000 $500
Total factory resource cost $17500000 $3500
Delivery expenses Sales dollars $400000 40000000 $001
Sales commissions Sales dollars $2000000 40000000 $005
After sales service Sales dollars $500000 40000000 $001
Total costs allocated $20400000
Sustaining costs unallocated $4000000Total production direct costs $8000000
Total costs $32400000
298 J Ratnatunga et al The International Journal of Accounting 47 (2012) 281 ndash 301
8202019 Ratnatunga Jurnal Case Study
httpslidepdfcomreaderfullratnatunga-jurnal-case-study 1921
References
Anderson S W (1995) A Framework for assessing cost management system changes The case of activity-based
costing implementation at general motors 1986ndash1993 Journal of Management Accounting Research 7
1ndash51
Anderson S W (2007) Managing Costs and Cost Structure throughout the Value Chain Research on Strategic
Cost Management In C S Chapman A G Hopwood amp M D Shield (Eds) Handbook of Management
Accounting Research Vol 2 (pp 481ndash506) Oxford Elsevier
Baird K M Harrison G L amp Reeve R C (2004) Adoption of activity management practices A note on the
extent of adoption and the influence of organizational and cultural factors Management Accounting Research
15(4) 393ndash399
Barrett R (2005) Time-Driven Costing The Bottom Line on the New ABC Business Performance Management
35ndash39
Bruggeman W Everaert P Levant Y Saens G amp Anderson S (2008) Cost modelling in logistics using
time-driven ABC Experiences from a wholesaler International Journal of Physical Distribution amp Logistics
Management 38(3) 172ndash191
Byrne S Stower E amp Torry P (2009) Is ABC adoption a success in Australia Journal of Applied Management Accounting Research 7 (1) 37ndash52
Cardinaels E amp Labro E (2008) On the determinants of measurement error in time driven costing Accounting
Review 83(3) 735ndash756
Table 13
Product line gross margins under lsquosingle-diver rsquo TDABC absorption costing
Alpha Beta
units Price Value units Price Value
Sales 30000 $80 $2400000 2000 $400 $800000
Production costs
Direct materials 30000 $2000 $600000 2000 $120 $240000
Indirect costs Cost per
driver unit
Driver
units
Allocated
costs
Driver
units
Allocated
costs
Purchasing $240 30000 $72000 8000 $19200
Mat handling amp storage $200 30000 $60000 8000 $16000
Machine setup $270 30000 $81000 8000 $21600
Quality control $160 30000 $48000 8000 $12800
Manufacturing $2130 30000 $639000 8000 $170400
Packaging $500 30000 $150000 8000 $40000
Total production costs $1650000 $520000
Gross margin $750000 $280000
Marketing costs
Delivery expenses $001 2400000 $24000 800000 $8000
Sales commissions $005 2400000 $120000 800000 $40000
After sales service $001 2400000 $30000 800000 $10000
Total $174000 $58000
Net income $576000 $222000Gross margin percent 3125 3500
Net margin percent 2400 2775
299 J Ratnatunga et al The International Journal of Accounting 47 (2012) 281 ndash 301
8202019 Ratnatunga Jurnal Case Study
httpslidepdfcomreaderfullratnatunga-jurnal-case-study 2021
Cobb I Innes J amp Mitchell F (1992) Activity-based costing-problems in practice London CIMA
Cohen S Venieris G amp Kaimenaki E (2005) ABC Adopters supporters deniers and unawares Managerial
Auditing Journal 20(9) 981ndash1000
Cooper R (1987) Does your company need a new cost system Journal of Cost Management 1(1) 45ndash49
Cooper R (1997 Autumn) The two-stage procedure in cost accounting Part two Journal of Cost Management 39ndash45
Cooper R amp Kaplan R S (1988) Measure Costs Right Make the Right Decisions Harvard Business Review
66 (9) 96ndash103
Cooper R amp Kaplan R S (1991) Design of cost management systems Text cases and readings NJ
Prentice-Hall Englewood Cliffs
Cooper R amp Kaplan R S (1992) Activity based systems Measuring the costs of resource usage Accounting
Horizons 6 (3) 1ndash13
Cotton W Jackson S amp Brown R (2003) Note on a New Zealand replication of the Innes et al UK
activity-based costing survey Management Accounting Research 14(1) 67ndash72
Drury C (1990) Product costing in the 1990s Accountancy 1990 123ndash126
Everaert P amp Bruggeman W (2007) Time-driven activity-based costing exploring the underlying model Cost
Management 21(2) 16ndash
20Foster G amp Swenson D W (1997) Measuring the success of activity-based cost management and its
determinants Journal of Management Accounting Research 9 109ndash141
Gervais M (2005) Controcircle de Gestion (8th ed) Paris Economica
Gosselin M (1997) The effect of strategy and organizational structure on the adoption and implementation of
activity-based costing Accounting Organizations and Society 22(2) 105ndash122
Gosselin M (2007) A review of activity-based costing Technique implementation and consequences In C S
Chapman A G Hopwood amp M D Shield (Eds) Handbook of Management Accounting Research Vol 2
(pp 641ndash672) Oxford Elsevier
Hoozeacutee S amp Bruggeman W (2007) Time-driven activity-based costing Exploring the underlying model Cost
Management 21(2) 16ndash20
Hoozeacutee S amp Bruggeman W (2010) Identifying operating improvements during the design process of a
time-driven ABC system The role of collective worker participation and leadership style Management Accounting Research 21(3) 185ndash198
Horngren C T (2004) Management accounting Some comments Journal of Management Accounting
Research 16 207ndash211
Innes J Mitchel F amp Sinclair D (2000) Activity-based costing in the UKs largest companies A comparison
of 1994 and 1999 survey results Management Accounting Research 11(3) 349ndash362
Johnson H T amp Kaplan R S (1987) Relevance Lost The Rise and Fall of Management Accounting
Cambridge USA Harvard Business School Press
Kaplan R S amp Anderson S R (2003) Time-driven activity-based costing White paper presented at the First
European Summit on Time-Driven Activity-Based Costing Available from httpwwwhbseduresearch
facpubsworkingpaperspapers2030404-045pdf (Accessed 3 December 2010)
Kaplan R S amp Anderson S R (2004) Time-Driven Activity-Based Costing Harvard Business Review 82(11)
131ndash138
Kaplan R S amp Anderson S R (2007) The innovation of time-driven activity-based costing Cost Management
21(2) 5ndash15
Kiani R amp Sangeladji M (2003) An empirical study about the use of the ABCABM models by some of the
Fortune 500 largest industrial corporations in the USA Journal of American Academy of Business Cambridge
3(1ndash2) 174ndash182
Krumwiede K R (1998) The implementation stages of activity-based costing and the impact of contextual and
organizational factors Journal of Management Accounting Research 10 239ndash277
Levant Y amp Zimnovitch H (2008) An ill-known facet to the history of cost calculation The methods of
equivalence 20th Annual Conference of the Business History Research Unit Cardiff Business School (10ndash
11th September)
Malmi T (1997) Towards explaining activity-based costing failure Accounting and control in a decentralisedorganisation Management Accounting Research 8(4) 459ndash480
McDonach C amp Mattimore R (2008) Strategic applications of time driven ABC in the service sector Lessons from
Irish SME Rotterdam Communication at the 31st Annual Congress of the European Accounting Association
300 J Ratnatunga et al The International Journal of Accounting 47 (2012) 281 ndash 301
8202019 Ratnatunga Jurnal Case Study
httpslidepdfcomreaderfullratnatunga-jurnal-case-study 2121
McGowan A S amp Klammer T P (1997) Satisfaction with activity-based cost management implementation
Journal of Management Accounting Research 9 217ndash238
McNair C J (2007) Beyond the boundaries Future trends in cost management Cost Management 21(1) 10ndash21
Nguyen H V amp Brooks A (1997) An empirical investigation of adoption issues relating to activity-based
costing Asian Review of Accounting 5(1) 1ndash18
OConnor N G Deng J amp Luo Y (2006) Political constraints organization design and performance
measurement in Chinas state-owned enterprises Accounting Organizations and Society 31(2) 157ndash177
Pernot E Roodhooft F amp van den Abbeele A (2007) Time-driven activity-based costing for inter-library
services A case study in a university Journal of Academic of Librarianship 33(5) 551ndash560
Ratnatunga J (1983) Financial Controls in Marketing The Accounting-Marketing Interface Canberra Series in
Administrative Studies Monograph No 6 Canberra CAE Canberra Australia
Robinson M A (1990) Contribution margin analysis No longer relevant - strategic cost management the new
paradigm Journal of Management Accounting Research 2 1ndash32
Shank J (1989) Strategic cost management New wine or just new bottles Journal of Management Accounting
Research Fall 1(1) 47ndash65
Sharma R amp Ratnatunga J (1997) Traditional and activity based costing systems Accounting Education An International Journal 6 (4) 337ndash345
Sharman P A (2003) The case for management accounting Strategic Finance 85(4) 43ndash47
Shields M D (1995) An empirical analysis of firms implementation experiences with activity-based costing
Journal of Management Accounting Research 7 148ndash166
Shields M D Chow C W Kato Y amp Nakagawa Y (1991) Management accounting practices in the US and
Japan Comparative survey findings and research implications Journal of International Financial Management
and Accounting 3(1) 61ndash77
Sprinkle G B (2003) Perspectives on experimental research in managerial accounting Accounting Organizations
and Society 28(2ndash3) 287ndash318
Swenson D W (1995) The benefits of activity-based cost management to the manufacturing industry Journal of
Management Accounting Research 7 167ndash180
Tse M amp Gong M (2009) Recognition of idle resources in time-driven activity-based costing and resourceconsumption accounting models Journal of Applied Management Accounting Research 7 (2) 41ndash54
Williams J J amp Seaman A E (2001) Predicting changes in management accounting systems National culture
and industry effects Accounting Organizations and Society 26 (4ndash5) 443ndash460
301 J Ratnatunga et al The International Journal of Accounting 47 (2012) 281 ndash 301
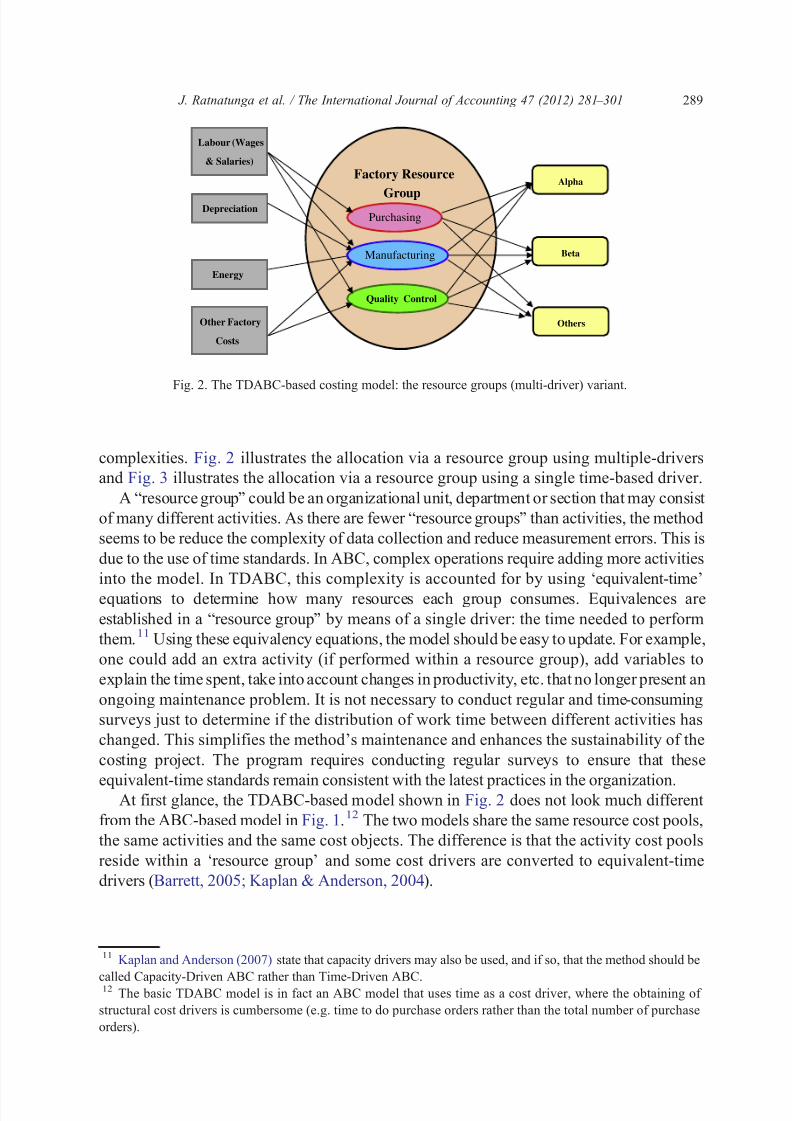
8202019 Ratnatunga Jurnal Case Study
httpslidepdfcomreaderfullratnatunga-jurnal-case-study 921
complexities Fig 2 illustrates the allocation via a resource group using multiple-drivers
and Fig 3 illustrates the allocation via a resource group using a single time-based driver
A ldquoresource grouprdquo could be an organizational unit department or section that may consist
of many different activities As there are fewer ldquoresource groupsrdquo than activities the method
seems to be reduce the complexity of data collection and reduce measurement errors This is
due to the use of time standards In ABC complex operations require adding more activities
into the model In TDABC this complexity is accounted for by using lsquoequivalent-timersquo
equations to determine how many resources each group consumes Equivalences are
established in a ldquoresource grouprdquo by means of a single driver the time needed to perform
them11 Using these equivalency equations the model should be easy to update For example
one could add an extra activity (if performed within a resource group) add variables to
explain the time spent take into account changes in productivity etc that no longer present an
ongoing maintenance problem It is not necessary to conduct regular and time‐consuming
surveys just to determine if the distribution of work time between different activities has
changed This simplifies the methods maintenance and enhances the sustainability of the
costing project The program requires conducting regular surveys to ensure that these
equivalent-time standards remain consistent with the latest practices in the organizationAt first glance the TDABC-based model shown in Fig 2 does not look much different
from the ABC-based model in Fig 112 The two models share the same resource cost pools
the same activities and the same cost objects The difference is that the activity cost pools
reside within a lsquoresource grouprsquo and some cost drivers are converted to equivalent-time
drivers (Barrett 2005 Kaplan amp Anderson 2004)
Quality Control
Labour (Wages
amp Salaries)
Depreciation
Energy
Other Factory
Costs
Factory Resource
Group
Alpha
Beta
Others
Purchasing
Manufacturing
Quality Control
Fig 2 The TDABC-based costing model the resource groups (multi-driver) variant
11 Kaplan and Anderson (2007) state that capacity drivers may also be used and if so that the method should be
called Capacity-Driven ABC rather than Time-Driven ABC12 The basic TDABC model is in fact an ABC model that uses time as a cost driver where the obtaining of
structural cost drivers is cumbersome (eg time to do purchase orders rather than the total number of purchase
orders)
289 J Ratnatunga et al The International Journal of Accounting 47 (2012) 281 ndash 301
8202019 Ratnatunga Jurnal Case Study
httpslidepdfcomreaderfullratnatunga-jurnal-case-study 1021
The value of a resource time-activity cost driver equals resource costs for a unit of the
resource (hours) multiplied by the number of hours for an activity (Everaert amp Bruggeman
2007 Kaplan amp Anderson 2004) The number of resource-activity cost drivers between a
resource pool and a cost object depends on each activitys resources consumption patterns
For instance wage and salary cost is consumed by all of the activities (such as purchasing
assembly and quality control) while energy cost bears no relationship with the purchasing
activity Therefore wage and salary cost is linked to each cost object through three separate
resource time-activity cost drivers while energy cost is only linked via one
In the case study company we first modelled the multiple-driver variant of TDABC
(Fig 2) Here resource costs are linked to resource time-activity cost drivers via activity
pools just as in ABC The only difference is the model uses resource time drivers instead of
cost drivers wherever data complexity issues arose13 The link between a cost driver and the
standard resource time to undertake an activity was shown in Appendix 1 Table 6 With this
information the cost per cost driver under TDABC can be calculated as shown in
Appendix 1 Table 10
Resource time drivers are derived from the cost drivers so the links to the cost object
would maintain a similar relationship Therefore the calculation of product line gross margins(Appendix 1 Table 11) would be the same as under ABC (compare Appendix 1 Table 9 with
Table 11) The conclusion we can draw from this modelling exercise is that if
transaction-based cost drivers are accurately converted to standard equivalent-time drivers
(Appendix 1 Table 6) and idle capacity issues are at a minimum then the decision
information provided to management would be almost identical
13
Even when using TDABC managers in the case study company argued that some non-time based volumemeasures (where the cause-effect relationship is more appropriate than time measures and there is no complexity
in collecting the data) should be used (eg number of components no of products) This was done in the cost
modelling
Labour (Wages
amp Salaries)
Depreciation
Energy
Other Factory
Costs
Factory
Resource Group
(includes Purchasing
Manufacturing and
Quality Control)
Alpha
Beta
Others
Fig 3 The TDABC-based costing model the resource groups (single-driver) variant
290 J Ratnatunga et al The International Journal of Accounting 47 (2012) 281 ndash 301
8202019 Ratnatunga Jurnal Case Study
httpslidepdfcomreaderfullratnatunga-jurnal-case-study 1121
8202019 Ratnatunga Jurnal Case Study
httpslidepdfcomreaderfullratnatunga-jurnal-case-study 1221
companies base their cost calculations on actual costs because (i) these costs are directly
based on reality and therefore perceived by the users as being more credible (ii) there is a
stronger link between the general ledger and management accounting and (iii) companies do
not need to make budget forecasts in order to use the model When companies use actualcosts they may experience delays from invoicing or slow recognition of expenses that can
skew the calculations (Kaplan amp Anderson 2007)16 They can solve this problem by ensuring
that data gathering periods are not too short and by spreading charges across the financial year
using statistical and other smoothing techniques
72 Idle capacity in a resource group
One of TDABCs advantages is that it can isolate idle capacity within a resource group
(Kaplan amp Anderson 2007 Tse amp Gong 2009) However this advantage is not unique toTDABC because ABC also has arguments in favor of capacity costing (Cooper amp Kaplan
1991 1992 Robinson 1990)
In the case study company a lsquonormal levelrsquo of activity was defined as the normal capacity
which we also used as the budgetedpractical capacity The company defined this normal
capacity as being about 80 of theoretical capacity which is in keeping with Kaplan and
Anderson (2003 2004) who proposed a ratio between practical capacity and theoretical
capacity for labor hours The managers of the case study company stated that there were wide
variations in capacity (mainly due to the availability of the machines ie kilns) with capacity
often being leased from competitors who had excess capacity Idle capacity was a non-issue in
the case study company
73 The homogeneity condition
An important condition of the single-driver version of TDABC (Fig 3) is that the
activities or transactions performed in one resource group and allocated to different cost
objects should consume resources in the same proportions ie for the calculation to be
correct the time must remain proportional to the average consumption of the department
This is referred to as the condition of homogeneity (Gervais 2005 Kaplan amp Anderson
2007)
The case study company had special equipment for manufacturing silver-impregnated
activated carbon Here the silver-impregnation process must be separated from other types of
activation as the resources used and the rate at which they are used are not the same The
critics of the TDABC method do not seem to highlight the importance of this condition and
most likely the users are also unaware of it
In TDABC any major changes to the production process and productivity gains must be
taken into account when using standard times as these changes could alter the proportionality
between times and thus alter the homogeneity condition Rigorous maintenance and regular
16 That may be true for ABC adopters however this goes against other survey evidence Shields Chow Kato and
Nakagawa (1991) in a cross-country study showed that a majority of manufacturers - about 60 of Japanese and
70 of US - used standard costs
292 J Ratnatunga et al The International Journal of Accounting 47 (2012) 281 ndash 301
8202019 Ratnatunga Jurnal Case Study
httpslidepdfcomreaderfullratnatunga-jurnal-case-study 1321
revision are thus necessary which runs contrary to the simplification of data collection and
analysis claimed as a benefit of the TDABC method
We have already modelled and shown that the single-driver version of TDABC is a
retrograde step with all of the problems of traditional costing (Appendix 1 Tables 12 and 13)When the complexity of maintaining the homogeneity condition is added to the list there
appears to be no merit in adopting the TDABC as a cost allocation approach
74 The estimation of time
The reason complex companies started using ABC was because using direct labor hours to
allocate indirect costs was perceived as being outdated in terms of changing production
technologies (including automation) and lean manufacturing processes of organizations
(Cooper 1987 Cooper amp Kaplan 1988 Johnson amp Kaplan 1987) However the use of labor
times still remains relevant in service organizations Purportedly TDABC enables such
organizations to model the variety and complexity that they encounter in the production of
services In fact the examples provided in the work of Kaplan and Anderson (2007) are based
on service activities
However labor times are more difficult to measure in service companies than in
manufacturing due to the more diverse range of activities performed by the workforce The
common practice is for employees to estimate the percentage of time spent on their various
activities Kaplan and Anderson (2003 2004 2007) are critical of this data collection
approach as they claim that often the total of these percentages is often equal to or greater
than 100 thus that unused capacities have been ignoredKaplan and Anderson (2007) prefer to determine the time necessary to perform tasks by
means of a direct estimation in minutes or hours based on contextual observation interviews
and comparative information by the cost modellers However other authors have done studies
that contradict what Kaplan and Anderson (2007) say They show that estimation errors by
cost modellers were more prone to errors than those obtained from the employees (Cardinaels
amp Labro 2008 Hoozeacutee amp Bruggeman 2007)
These estimation issues did not arise in the comparative cost modelling of the case study
company as (i) it was a manufacturing organization (ii) it had ERP and MRP systems that
largely provided this time equivalence information and (iii) non-time‐ based drivers were used
(where appropriate) in the multi-driver application of the model (Appendix 1 Table 10)
8 Conclusion
From the comparative gross margin results presented using the case study data it appears
that ABC is superior to traditional volume-based cost allocation systems However the
multi-driver version of TDABC seems no different to ABC if standard-activity times are used
as cost drivers We also showed that attempting to simplify the stage 1 activity analysis stage
of ABC implementation (by using a single-volume related cost driver) ultimately makes
TDABC no different than traditional costing systems
Both ABC and TDABC models can provide two types of information for decision making(1) costs allocated to cost objects and (2) links between resource pools and cost pools
However they provide such information in different ways with different levels of accuracy
293 J Ratnatunga et al The International Journal of Accounting 47 (2012) 281 ndash 301
8202019 Ratnatunga Jurnal Case Study
httpslidepdfcomreaderfullratnatunga-jurnal-case-study 1421
The adoption of an activity-based paradigm (via either ABC or TDABC) enables cost
management systems to provide information on how operating activities add value to
organizational outputs through linkages between resource pools and cost pools With
information on costs allocated to cost objects management can manage product costs bychanging quantities of organizational outputs Management can also reduce product costs
by reducing or eliminating non‐value-added activities with this type of information
(Gosselin 1997)
While the TDABC model is designed to address implementation problems faced by the
ABC model the adoption of the model in the case study company did not help to alleviate the
country-independent stage 1 activity analysis complexities of an ABC implementation
especially if it tried to maintain the homogeneity condition Thus TDABC is unable to help
organizations solve implementation problems in a manner that will not compromise accuracy
If implementation problems are the only criterion for organizations to adopt a costing system
then adoption of TDABC will not alleviate this problem
In this study we did not test if TDABC can provide valuable information on idle resources
to support decision making (Kaplan amp Anderson 2007 Tse amp Gong 2009) Future research
could focus on testing the usefulness of TDABC in providing information on idle resources
Alternately it could determine if information on idle resources is useful for decision making
In summary this case study determines that the TDABC model is ABC in sheeps
clothing In its extreme form TDABC provides decision information as erroneous as that
produced by traditional volume allocations As such we predict that TDABC will result in
even fewer implementations sustaining than ABC has managed
Appendix 1
Table 1
Compariso Ltd income statement for 3rd quarter 2008
Sales $40000000
Less Cost of goods sold
Materials $8000000
Labor $7500000
Production overheadsDepreciation $7000000
Energy $2500000
Other Factory Costs $500000 $10000000
Total $25500000
Gross margin $14500000
Less Marketing expenses
Delivery expenses $400000
Sales commissions $2000000
After sales service $500000
Advertising amp promotions $2000000
Sales administration $1000000 $5900000
Less Administration expenses $3000000Total $8900000
Net income before tax $5600000
294 J Ratnatunga et al The International Journal of Accounting 47 (2012) 281 ndash 301
8202019 Ratnatunga Jurnal Case Study
httpslidepdfcomreaderfullratnatunga-jurnal-case-study 1521
Table 2
Sales and cost data for 2 product lines
Product lines Alpha Beta
Per unit data
Price $8000 $40000
Direct materials costs $2000 $12000
Direct wages $1500 $6000
Labor hours 1 4
Table 3
Product line gross margins under traditional absorption costing
Alpha Beta
Sales $2400000 $800000
Costs
Materials $600000 $240000
Labor $450000 $120000
Overheads $600000 $160000
$1650000 $520000
Gross margin $750000 $280000
Gross margin percent 3125 3500
Table 4
Production expenses
Activity cost pools Cost $
Purchasing 1200000
Materials handling and storage 1000000
Machine setup 1350000
Quality control 800000
Labor and other overhead 10650000Packaging 2500000
Table 5
Marketing expenses
Activity cost pools Cost $
Delivery expenses 400000Sales commission 2000000
After sales service 500000
295 J Ratnatunga et al The International Journal of Accounting 47 (2012) 281 ndash 301
8202019 Ratnatunga Jurnal Case Study
httpslidepdfcomreaderfullratnatunga-jurnal-case-study 1621
Table 6
Driver units
Activity cost drivers Driver units Std time in hours
per driver unit
Time equivalent
driver units
No of components used 5000000 NA NA
No of setups 9000 40000 36000
No of batches 3200 10000 3200
No labor hours 500000 10000 500000
No machine hours 500000 10000 500000
No of units 625000 NA NA
No of sales orders 4000 05000 2000
Sales dollars $40000000 NA NA
No of service calls 10000 10000 10000
Table 7
Cost per cost driver calculations under ABC
Activity cost pool Cost driver identified Resource costs Driver units Cost per
driver unit
Mat handling and storage No of components used $1000000 5000000 $020
Machine setup No of setups $1350000 9000 $15000
Quality control No of batches $800000 3200 $25000
Manufacturing No labor hours $10650000 500000 $2130
Packaging No machine hours $2500000 625000 $400Delivery expenses No of sales orders $400000 4000 $10000
Sales commissions Sales dollars $2000000 40000000 $005
After sales service No of service calls $500000 10000 $5000
Total costs allocated $20400000
Sustaining costs unallocated $4000000
Total production direct costs $8000000
Total costs $32400000
Table 8Cost driver data for 2 product lines under ABC
Product lines Alpha Beta All product lines
ABC cost drivers
No purchase orders 200 200 3000
No of components used 450000 100000 5000000
No of setups 50 1000 9000
No of batches 50 200 3200
Total labor hours 30000 8000 500000
Total machine hours 30000 8000 500000
No of units produced and sold 30000 2000 625000
No of sales orders 300 400 4000Sales dollars $2400000 $800000 $40000000
No of service calls 50 500 10000
296 J Ratnatunga et al The International Journal of Accounting 47 (2012) 281 ndash 301
8202019 Ratnatunga Jurnal Case Study
httpslidepdfcomreaderfullratnatunga-jurnal-case-study 1721
Table 9
Product line gross margins under ABC absorption costing
Alpha Beta
units Price Value units Price Value
Sales 30000 $80 $2400000 2000 $400 $800000
Production costs
Direct materials 30000 $2000 $600000 2000 $120 $240000
Indirect costs Cost per
driver unit
Driver
units
Allocated
costs
Driver
units
Allocated
costs
Purchasing $40000 200 $80000 200 $80000
Mat handling and storage $020 450000 $90000 100000 $20000
Machine setup $15000 50 $7500 1000 $150000
Quality control $25000 50 $12500 200 $50000
Manufacturing $2130 30000 $639000 8000 $170400
Packaging $400 30000 $120000 2000 $8000
Total production costs $1549000 $718400
Gross margin $851000 $81600
Marketing costs
Delivery expenses $10000 300 $30000 400 $40000
Sales commissions $005 $2400000 $120000 $800000 $40000
After sales service $5000 50 $2500 500 $25000
Total $152500 $105000
Net income $698500 ($23400)Gross margin percent 3546 1020
Net margin percent 2910 -293
Table 10
Cost per cost driver calculations under TDABC (multi-driver) variant)
Activity cost pool Cost driver identified Resource costs Driver units Cost per
driver unit
Mat handling and storage No of components used $1000000 5000000 $020
Machine setup Time per setup $1350000 36000 $3750
Quality control Time per batch $800000 3200 $25000
Manufacturing No machine hours $10650000 500000 $2130
Packaging No of units $2500000 625000 $400
Delivery expenses Time per sales order $400000 2000 $20000
Sales commissions Sales dollars $2000000 40000000 $005
After sales service Time per Service Call $500000 10000 $5000
Total costs allocated $20400000
Sustaining costs unallocated $4000000Total production direct costs $8000000
Total costs $32400000
297 J Ratnatunga et al The International Journal of Accounting 47 (2012) 281 ndash 301
8202019 Ratnatunga Jurnal Case Study
httpslidepdfcomreaderfullratnatunga-jurnal-case-study 1821
Table 11
Product line gross margins under TDABC absorption costing (multi-driver variant)
Alpha Beta
units Price Value units Price Value
Sales 30000 $80 $2400000 2000 $400 $800000
Production costs
Direct materials 30000 $2000 $600000 2000 $120 $240000
Indirect costs Cost per
driver unit
Driver
units
Allocated
costs
Driver
units
Allocated
costs
Purchasing $80000 100 $80000 100 $80000
Mat handling and storage $020 450000 $90000 100000 $20000
Machine setup $3750 200 $7500 4000 $150000
Quality control $25000 50 $12500 200 $50000
Manufacturing $2130 30000 $639000 8000 $170400
Packaging $400 30000 $120000 2000 $8000
Total production costs $1549000 $718400
Gross margin $851000 $81600
Marketing costs
Delivery expenses $20000 150 $30000 200 $40000
Sales commissions $005 $2400000 $120000 $800000 $40000
After sales service $5000 50 $2500 500 $25000
Total $152500 $105000
Net income $698500 ($23400)Gross margin percent 3546 1020
Net margin percent 2910 -293
Table 12
Cost per cost driver calculations under lsquosingle-driver rsquo TDABC
Activity cost pool Cost driver identified Resource costs Driver units Cost per
driver unit
Mat handling and storage No labor hours $1000000 500000 $200
Machine setup No labor hours $1350000 500000 $270
Quality control No labor hours $800000 500000 $160
Manufacturing No labor hours $10650000 500000 $2130
Packaging No labor hours $2500000 500000 $500
Total factory resource cost $17500000 $3500
Delivery expenses Sales dollars $400000 40000000 $001
Sales commissions Sales dollars $2000000 40000000 $005
After sales service Sales dollars $500000 40000000 $001
Total costs allocated $20400000
Sustaining costs unallocated $4000000Total production direct costs $8000000
Total costs $32400000
298 J Ratnatunga et al The International Journal of Accounting 47 (2012) 281 ndash 301
8202019 Ratnatunga Jurnal Case Study
httpslidepdfcomreaderfullratnatunga-jurnal-case-study 1921
References
Anderson S W (1995) A Framework for assessing cost management system changes The case of activity-based
costing implementation at general motors 1986ndash1993 Journal of Management Accounting Research 7
1ndash51
Anderson S W (2007) Managing Costs and Cost Structure throughout the Value Chain Research on Strategic
Cost Management In C S Chapman A G Hopwood amp M D Shield (Eds) Handbook of Management
Accounting Research Vol 2 (pp 481ndash506) Oxford Elsevier
Baird K M Harrison G L amp Reeve R C (2004) Adoption of activity management practices A note on the
extent of adoption and the influence of organizational and cultural factors Management Accounting Research
15(4) 393ndash399
Barrett R (2005) Time-Driven Costing The Bottom Line on the New ABC Business Performance Management
35ndash39
Bruggeman W Everaert P Levant Y Saens G amp Anderson S (2008) Cost modelling in logistics using
time-driven ABC Experiences from a wholesaler International Journal of Physical Distribution amp Logistics
Management 38(3) 172ndash191
Byrne S Stower E amp Torry P (2009) Is ABC adoption a success in Australia Journal of Applied Management Accounting Research 7 (1) 37ndash52
Cardinaels E amp Labro E (2008) On the determinants of measurement error in time driven costing Accounting
Review 83(3) 735ndash756
Table 13
Product line gross margins under lsquosingle-diver rsquo TDABC absorption costing
Alpha Beta
units Price Value units Price Value
Sales 30000 $80 $2400000 2000 $400 $800000
Production costs
Direct materials 30000 $2000 $600000 2000 $120 $240000
Indirect costs Cost per
driver unit
Driver
units
Allocated
costs
Driver
units
Allocated
costs
Purchasing $240 30000 $72000 8000 $19200
Mat handling amp storage $200 30000 $60000 8000 $16000
Machine setup $270 30000 $81000 8000 $21600
Quality control $160 30000 $48000 8000 $12800
Manufacturing $2130 30000 $639000 8000 $170400
Packaging $500 30000 $150000 8000 $40000
Total production costs $1650000 $520000
Gross margin $750000 $280000
Marketing costs
Delivery expenses $001 2400000 $24000 800000 $8000
Sales commissions $005 2400000 $120000 800000 $40000
After sales service $001 2400000 $30000 800000 $10000
Total $174000 $58000
Net income $576000 $222000Gross margin percent 3125 3500
Net margin percent 2400 2775
299 J Ratnatunga et al The International Journal of Accounting 47 (2012) 281 ndash 301
8202019 Ratnatunga Jurnal Case Study
httpslidepdfcomreaderfullratnatunga-jurnal-case-study 2021
Cobb I Innes J amp Mitchell F (1992) Activity-based costing-problems in practice London CIMA
Cohen S Venieris G amp Kaimenaki E (2005) ABC Adopters supporters deniers and unawares Managerial
Auditing Journal 20(9) 981ndash1000
Cooper R (1987) Does your company need a new cost system Journal of Cost Management 1(1) 45ndash49
Cooper R (1997 Autumn) The two-stage procedure in cost accounting Part two Journal of Cost Management 39ndash45
Cooper R amp Kaplan R S (1988) Measure Costs Right Make the Right Decisions Harvard Business Review
66 (9) 96ndash103
Cooper R amp Kaplan R S (1991) Design of cost management systems Text cases and readings NJ
Prentice-Hall Englewood Cliffs
Cooper R amp Kaplan R S (1992) Activity based systems Measuring the costs of resource usage Accounting
Horizons 6 (3) 1ndash13
Cotton W Jackson S amp Brown R (2003) Note on a New Zealand replication of the Innes et al UK
activity-based costing survey Management Accounting Research 14(1) 67ndash72
Drury C (1990) Product costing in the 1990s Accountancy 1990 123ndash126
Everaert P amp Bruggeman W (2007) Time-driven activity-based costing exploring the underlying model Cost
Management 21(2) 16ndash
20Foster G amp Swenson D W (1997) Measuring the success of activity-based cost management and its
determinants Journal of Management Accounting Research 9 109ndash141
Gervais M (2005) Controcircle de Gestion (8th ed) Paris Economica
Gosselin M (1997) The effect of strategy and organizational structure on the adoption and implementation of
activity-based costing Accounting Organizations and Society 22(2) 105ndash122
Gosselin M (2007) A review of activity-based costing Technique implementation and consequences In C S
Chapman A G Hopwood amp M D Shield (Eds) Handbook of Management Accounting Research Vol 2
(pp 641ndash672) Oxford Elsevier
Hoozeacutee S amp Bruggeman W (2007) Time-driven activity-based costing Exploring the underlying model Cost
Management 21(2) 16ndash20
Hoozeacutee S amp Bruggeman W (2010) Identifying operating improvements during the design process of a
time-driven ABC system The role of collective worker participation and leadership style Management Accounting Research 21(3) 185ndash198
Horngren C T (2004) Management accounting Some comments Journal of Management Accounting
Research 16 207ndash211
Innes J Mitchel F amp Sinclair D (2000) Activity-based costing in the UKs largest companies A comparison
of 1994 and 1999 survey results Management Accounting Research 11(3) 349ndash362
Johnson H T amp Kaplan R S (1987) Relevance Lost The Rise and Fall of Management Accounting
Cambridge USA Harvard Business School Press
Kaplan R S amp Anderson S R (2003) Time-driven activity-based costing White paper presented at the First
European Summit on Time-Driven Activity-Based Costing Available from httpwwwhbseduresearch
facpubsworkingpaperspapers2030404-045pdf (Accessed 3 December 2010)
Kaplan R S amp Anderson S R (2004) Time-Driven Activity-Based Costing Harvard Business Review 82(11)
131ndash138
Kaplan R S amp Anderson S R (2007) The innovation of time-driven activity-based costing Cost Management
21(2) 5ndash15
Kiani R amp Sangeladji M (2003) An empirical study about the use of the ABCABM models by some of the
Fortune 500 largest industrial corporations in the USA Journal of American Academy of Business Cambridge
3(1ndash2) 174ndash182
Krumwiede K R (1998) The implementation stages of activity-based costing and the impact of contextual and
organizational factors Journal of Management Accounting Research 10 239ndash277
Levant Y amp Zimnovitch H (2008) An ill-known facet to the history of cost calculation The methods of
equivalence 20th Annual Conference of the Business History Research Unit Cardiff Business School (10ndash
11th September)
Malmi T (1997) Towards explaining activity-based costing failure Accounting and control in a decentralisedorganisation Management Accounting Research 8(4) 459ndash480
McDonach C amp Mattimore R (2008) Strategic applications of time driven ABC in the service sector Lessons from
Irish SME Rotterdam Communication at the 31st Annual Congress of the European Accounting Association
300 J Ratnatunga et al The International Journal of Accounting 47 (2012) 281 ndash 301
8202019 Ratnatunga Jurnal Case Study
httpslidepdfcomreaderfullratnatunga-jurnal-case-study 2121
McGowan A S amp Klammer T P (1997) Satisfaction with activity-based cost management implementation
Journal of Management Accounting Research 9 217ndash238
McNair C J (2007) Beyond the boundaries Future trends in cost management Cost Management 21(1) 10ndash21
Nguyen H V amp Brooks A (1997) An empirical investigation of adoption issues relating to activity-based
costing Asian Review of Accounting 5(1) 1ndash18
OConnor N G Deng J amp Luo Y (2006) Political constraints organization design and performance
measurement in Chinas state-owned enterprises Accounting Organizations and Society 31(2) 157ndash177
Pernot E Roodhooft F amp van den Abbeele A (2007) Time-driven activity-based costing for inter-library
services A case study in a university Journal of Academic of Librarianship 33(5) 551ndash560
Ratnatunga J (1983) Financial Controls in Marketing The Accounting-Marketing Interface Canberra Series in
Administrative Studies Monograph No 6 Canberra CAE Canberra Australia
Robinson M A (1990) Contribution margin analysis No longer relevant - strategic cost management the new
paradigm Journal of Management Accounting Research 2 1ndash32
Shank J (1989) Strategic cost management New wine or just new bottles Journal of Management Accounting
Research Fall 1(1) 47ndash65
Sharma R amp Ratnatunga J (1997) Traditional and activity based costing systems Accounting Education An International Journal 6 (4) 337ndash345
Sharman P A (2003) The case for management accounting Strategic Finance 85(4) 43ndash47
Shields M D (1995) An empirical analysis of firms implementation experiences with activity-based costing
Journal of Management Accounting Research 7 148ndash166
Shields M D Chow C W Kato Y amp Nakagawa Y (1991) Management accounting practices in the US and
Japan Comparative survey findings and research implications Journal of International Financial Management
and Accounting 3(1) 61ndash77
Sprinkle G B (2003) Perspectives on experimental research in managerial accounting Accounting Organizations
and Society 28(2ndash3) 287ndash318
Swenson D W (1995) The benefits of activity-based cost management to the manufacturing industry Journal of
Management Accounting Research 7 167ndash180
Tse M amp Gong M (2009) Recognition of idle resources in time-driven activity-based costing and resourceconsumption accounting models Journal of Applied Management Accounting Research 7 (2) 41ndash54
Williams J J amp Seaman A E (2001) Predicting changes in management accounting systems National culture
and industry effects Accounting Organizations and Society 26 (4ndash5) 443ndash460
301 J Ratnatunga et al The International Journal of Accounting 47 (2012) 281 ndash 301
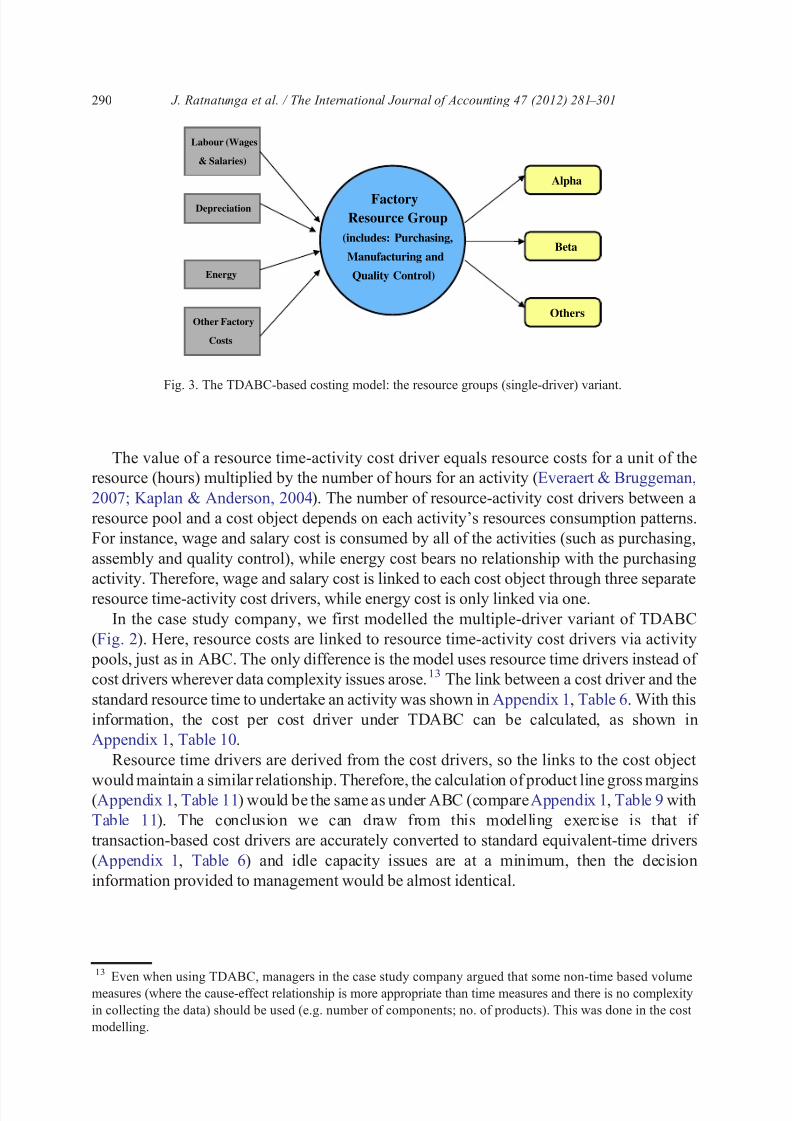
8202019 Ratnatunga Jurnal Case Study
httpslidepdfcomreaderfullratnatunga-jurnal-case-study 1021
The value of a resource time-activity cost driver equals resource costs for a unit of the
resource (hours) multiplied by the number of hours for an activity (Everaert amp Bruggeman
2007 Kaplan amp Anderson 2004) The number of resource-activity cost drivers between a
resource pool and a cost object depends on each activitys resources consumption patterns
For instance wage and salary cost is consumed by all of the activities (such as purchasing
assembly and quality control) while energy cost bears no relationship with the purchasing
activity Therefore wage and salary cost is linked to each cost object through three separate
resource time-activity cost drivers while energy cost is only linked via one
In the case study company we first modelled the multiple-driver variant of TDABC
(Fig 2) Here resource costs are linked to resource time-activity cost drivers via activity
pools just as in ABC The only difference is the model uses resource time drivers instead of
cost drivers wherever data complexity issues arose13 The link between a cost driver and the
standard resource time to undertake an activity was shown in Appendix 1 Table 6 With this
information the cost per cost driver under TDABC can be calculated as shown in
Appendix 1 Table 10
Resource time drivers are derived from the cost drivers so the links to the cost object
would maintain a similar relationship Therefore the calculation of product line gross margins(Appendix 1 Table 11) would be the same as under ABC (compare Appendix 1 Table 9 with
Table 11) The conclusion we can draw from this modelling exercise is that if
transaction-based cost drivers are accurately converted to standard equivalent-time drivers
(Appendix 1 Table 6) and idle capacity issues are at a minimum then the decision
information provided to management would be almost identical
13
Even when using TDABC managers in the case study company argued that some non-time based volumemeasures (where the cause-effect relationship is more appropriate than time measures and there is no complexity
in collecting the data) should be used (eg number of components no of products) This was done in the cost
modelling
Labour (Wages
amp Salaries)
Depreciation
Energy
Other Factory
Costs
Factory
Resource Group
(includes Purchasing
Manufacturing and
Quality Control)
Alpha
Beta
Others
Fig 3 The TDABC-based costing model the resource groups (single-driver) variant
290 J Ratnatunga et al The International Journal of Accounting 47 (2012) 281 ndash 301
8202019 Ratnatunga Jurnal Case Study
httpslidepdfcomreaderfullratnatunga-jurnal-case-study 1121
8202019 Ratnatunga Jurnal Case Study
httpslidepdfcomreaderfullratnatunga-jurnal-case-study 1221
companies base their cost calculations on actual costs because (i) these costs are directly
based on reality and therefore perceived by the users as being more credible (ii) there is a
stronger link between the general ledger and management accounting and (iii) companies do
not need to make budget forecasts in order to use the model When companies use actualcosts they may experience delays from invoicing or slow recognition of expenses that can
skew the calculations (Kaplan amp Anderson 2007)16 They can solve this problem by ensuring
that data gathering periods are not too short and by spreading charges across the financial year
using statistical and other smoothing techniques
72 Idle capacity in a resource group
One of TDABCs advantages is that it can isolate idle capacity within a resource group
(Kaplan amp Anderson 2007 Tse amp Gong 2009) However this advantage is not unique toTDABC because ABC also has arguments in favor of capacity costing (Cooper amp Kaplan
1991 1992 Robinson 1990)
In the case study company a lsquonormal levelrsquo of activity was defined as the normal capacity
which we also used as the budgetedpractical capacity The company defined this normal
capacity as being about 80 of theoretical capacity which is in keeping with Kaplan and
Anderson (2003 2004) who proposed a ratio between practical capacity and theoretical
capacity for labor hours The managers of the case study company stated that there were wide
variations in capacity (mainly due to the availability of the machines ie kilns) with capacity
often being leased from competitors who had excess capacity Idle capacity was a non-issue in
the case study company
73 The homogeneity condition
An important condition of the single-driver version of TDABC (Fig 3) is that the
activities or transactions performed in one resource group and allocated to different cost
objects should consume resources in the same proportions ie for the calculation to be
correct the time must remain proportional to the average consumption of the department
This is referred to as the condition of homogeneity (Gervais 2005 Kaplan amp Anderson
2007)
The case study company had special equipment for manufacturing silver-impregnated
activated carbon Here the silver-impregnation process must be separated from other types of
activation as the resources used and the rate at which they are used are not the same The
critics of the TDABC method do not seem to highlight the importance of this condition and
most likely the users are also unaware of it
In TDABC any major changes to the production process and productivity gains must be
taken into account when using standard times as these changes could alter the proportionality
between times and thus alter the homogeneity condition Rigorous maintenance and regular
16 That may be true for ABC adopters however this goes against other survey evidence Shields Chow Kato and
Nakagawa (1991) in a cross-country study showed that a majority of manufacturers - about 60 of Japanese and
70 of US - used standard costs
292 J Ratnatunga et al The International Journal of Accounting 47 (2012) 281 ndash 301
8202019 Ratnatunga Jurnal Case Study
httpslidepdfcomreaderfullratnatunga-jurnal-case-study 1321
revision are thus necessary which runs contrary to the simplification of data collection and
analysis claimed as a benefit of the TDABC method
We have already modelled and shown that the single-driver version of TDABC is a
retrograde step with all of the problems of traditional costing (Appendix 1 Tables 12 and 13)When the complexity of maintaining the homogeneity condition is added to the list there
appears to be no merit in adopting the TDABC as a cost allocation approach
74 The estimation of time
The reason complex companies started using ABC was because using direct labor hours to
allocate indirect costs was perceived as being outdated in terms of changing production
technologies (including automation) and lean manufacturing processes of organizations
(Cooper 1987 Cooper amp Kaplan 1988 Johnson amp Kaplan 1987) However the use of labor
times still remains relevant in service organizations Purportedly TDABC enables such
organizations to model the variety and complexity that they encounter in the production of
services In fact the examples provided in the work of Kaplan and Anderson (2007) are based
on service activities
However labor times are more difficult to measure in service companies than in
manufacturing due to the more diverse range of activities performed by the workforce The
common practice is for employees to estimate the percentage of time spent on their various
activities Kaplan and Anderson (2003 2004 2007) are critical of this data collection
approach as they claim that often the total of these percentages is often equal to or greater
than 100 thus that unused capacities have been ignoredKaplan and Anderson (2007) prefer to determine the time necessary to perform tasks by
means of a direct estimation in minutes or hours based on contextual observation interviews
and comparative information by the cost modellers However other authors have done studies
that contradict what Kaplan and Anderson (2007) say They show that estimation errors by
cost modellers were more prone to errors than those obtained from the employees (Cardinaels
amp Labro 2008 Hoozeacutee amp Bruggeman 2007)
These estimation issues did not arise in the comparative cost modelling of the case study
company as (i) it was a manufacturing organization (ii) it had ERP and MRP systems that
largely provided this time equivalence information and (iii) non-time‐ based drivers were used
(where appropriate) in the multi-driver application of the model (Appendix 1 Table 10)
8 Conclusion
From the comparative gross margin results presented using the case study data it appears
that ABC is superior to traditional volume-based cost allocation systems However the
multi-driver version of TDABC seems no different to ABC if standard-activity times are used
as cost drivers We also showed that attempting to simplify the stage 1 activity analysis stage
of ABC implementation (by using a single-volume related cost driver) ultimately makes
TDABC no different than traditional costing systems
Both ABC and TDABC models can provide two types of information for decision making(1) costs allocated to cost objects and (2) links between resource pools and cost pools
However they provide such information in different ways with different levels of accuracy
293 J Ratnatunga et al The International Journal of Accounting 47 (2012) 281 ndash 301
8202019 Ratnatunga Jurnal Case Study
httpslidepdfcomreaderfullratnatunga-jurnal-case-study 1421
The adoption of an activity-based paradigm (via either ABC or TDABC) enables cost
management systems to provide information on how operating activities add value to
organizational outputs through linkages between resource pools and cost pools With
information on costs allocated to cost objects management can manage product costs bychanging quantities of organizational outputs Management can also reduce product costs
by reducing or eliminating non‐value-added activities with this type of information
(Gosselin 1997)
While the TDABC model is designed to address implementation problems faced by the
ABC model the adoption of the model in the case study company did not help to alleviate the
country-independent stage 1 activity analysis complexities of an ABC implementation
especially if it tried to maintain the homogeneity condition Thus TDABC is unable to help
organizations solve implementation problems in a manner that will not compromise accuracy
If implementation problems are the only criterion for organizations to adopt a costing system
then adoption of TDABC will not alleviate this problem
In this study we did not test if TDABC can provide valuable information on idle resources
to support decision making (Kaplan amp Anderson 2007 Tse amp Gong 2009) Future research
could focus on testing the usefulness of TDABC in providing information on idle resources
Alternately it could determine if information on idle resources is useful for decision making
In summary this case study determines that the TDABC model is ABC in sheeps
clothing In its extreme form TDABC provides decision information as erroneous as that
produced by traditional volume allocations As such we predict that TDABC will result in
even fewer implementations sustaining than ABC has managed
Appendix 1
Table 1
Compariso Ltd income statement for 3rd quarter 2008
Sales $40000000
Less Cost of goods sold
Materials $8000000
Labor $7500000
Production overheadsDepreciation $7000000
Energy $2500000
Other Factory Costs $500000 $10000000
Total $25500000
Gross margin $14500000
Less Marketing expenses
Delivery expenses $400000
Sales commissions $2000000
After sales service $500000
Advertising amp promotions $2000000
Sales administration $1000000 $5900000
Less Administration expenses $3000000Total $8900000
Net income before tax $5600000
294 J Ratnatunga et al The International Journal of Accounting 47 (2012) 281 ndash 301
8202019 Ratnatunga Jurnal Case Study
httpslidepdfcomreaderfullratnatunga-jurnal-case-study 1521
Table 2
Sales and cost data for 2 product lines
Product lines Alpha Beta
Per unit data
Price $8000 $40000
Direct materials costs $2000 $12000
Direct wages $1500 $6000
Labor hours 1 4
Table 3
Product line gross margins under traditional absorption costing
Alpha Beta
Sales $2400000 $800000
Costs
Materials $600000 $240000
Labor $450000 $120000
Overheads $600000 $160000
$1650000 $520000
Gross margin $750000 $280000
Gross margin percent 3125 3500
Table 4
Production expenses
Activity cost pools Cost $
Purchasing 1200000
Materials handling and storage 1000000
Machine setup 1350000
Quality control 800000
Labor and other overhead 10650000Packaging 2500000
Table 5
Marketing expenses
Activity cost pools Cost $
Delivery expenses 400000Sales commission 2000000
After sales service 500000
295 J Ratnatunga et al The International Journal of Accounting 47 (2012) 281 ndash 301
8202019 Ratnatunga Jurnal Case Study
httpslidepdfcomreaderfullratnatunga-jurnal-case-study 1621
Table 6
Driver units
Activity cost drivers Driver units Std time in hours
per driver unit
Time equivalent
driver units
No of components used 5000000 NA NA
No of setups 9000 40000 36000
No of batches 3200 10000 3200
No labor hours 500000 10000 500000
No machine hours 500000 10000 500000
No of units 625000 NA NA
No of sales orders 4000 05000 2000
Sales dollars $40000000 NA NA
No of service calls 10000 10000 10000
Table 7
Cost per cost driver calculations under ABC
Activity cost pool Cost driver identified Resource costs Driver units Cost per
driver unit
Mat handling and storage No of components used $1000000 5000000 $020
Machine setup No of setups $1350000 9000 $15000
Quality control No of batches $800000 3200 $25000
Manufacturing No labor hours $10650000 500000 $2130
Packaging No machine hours $2500000 625000 $400Delivery expenses No of sales orders $400000 4000 $10000
Sales commissions Sales dollars $2000000 40000000 $005
After sales service No of service calls $500000 10000 $5000
Total costs allocated $20400000
Sustaining costs unallocated $4000000
Total production direct costs $8000000
Total costs $32400000
Table 8Cost driver data for 2 product lines under ABC
Product lines Alpha Beta All product lines
ABC cost drivers
No purchase orders 200 200 3000
No of components used 450000 100000 5000000
No of setups 50 1000 9000
No of batches 50 200 3200
Total labor hours 30000 8000 500000
Total machine hours 30000 8000 500000
No of units produced and sold 30000 2000 625000
No of sales orders 300 400 4000Sales dollars $2400000 $800000 $40000000
No of service calls 50 500 10000
296 J Ratnatunga et al The International Journal of Accounting 47 (2012) 281 ndash 301
8202019 Ratnatunga Jurnal Case Study
httpslidepdfcomreaderfullratnatunga-jurnal-case-study 1721
Table 9
Product line gross margins under ABC absorption costing
Alpha Beta
units Price Value units Price Value
Sales 30000 $80 $2400000 2000 $400 $800000
Production costs
Direct materials 30000 $2000 $600000 2000 $120 $240000
Indirect costs Cost per
driver unit
Driver
units
Allocated
costs
Driver
units
Allocated
costs
Purchasing $40000 200 $80000 200 $80000
Mat handling and storage $020 450000 $90000 100000 $20000
Machine setup $15000 50 $7500 1000 $150000
Quality control $25000 50 $12500 200 $50000
Manufacturing $2130 30000 $639000 8000 $170400
Packaging $400 30000 $120000 2000 $8000
Total production costs $1549000 $718400
Gross margin $851000 $81600
Marketing costs
Delivery expenses $10000 300 $30000 400 $40000
Sales commissions $005 $2400000 $120000 $800000 $40000
After sales service $5000 50 $2500 500 $25000
Total $152500 $105000
Net income $698500 ($23400)Gross margin percent 3546 1020
Net margin percent 2910 -293
Table 10
Cost per cost driver calculations under TDABC (multi-driver) variant)
Activity cost pool Cost driver identified Resource costs Driver units Cost per
driver unit
Mat handling and storage No of components used $1000000 5000000 $020
Machine setup Time per setup $1350000 36000 $3750
Quality control Time per batch $800000 3200 $25000
Manufacturing No machine hours $10650000 500000 $2130
Packaging No of units $2500000 625000 $400
Delivery expenses Time per sales order $400000 2000 $20000
Sales commissions Sales dollars $2000000 40000000 $005
After sales service Time per Service Call $500000 10000 $5000
Total costs allocated $20400000
Sustaining costs unallocated $4000000Total production direct costs $8000000
Total costs $32400000
297 J Ratnatunga et al The International Journal of Accounting 47 (2012) 281 ndash 301
8202019 Ratnatunga Jurnal Case Study
httpslidepdfcomreaderfullratnatunga-jurnal-case-study 1821
Table 11
Product line gross margins under TDABC absorption costing (multi-driver variant)
Alpha Beta
units Price Value units Price Value
Sales 30000 $80 $2400000 2000 $400 $800000
Production costs
Direct materials 30000 $2000 $600000 2000 $120 $240000
Indirect costs Cost per
driver unit
Driver
units
Allocated
costs
Driver
units
Allocated
costs
Purchasing $80000 100 $80000 100 $80000
Mat handling and storage $020 450000 $90000 100000 $20000
Machine setup $3750 200 $7500 4000 $150000
Quality control $25000 50 $12500 200 $50000
Manufacturing $2130 30000 $639000 8000 $170400
Packaging $400 30000 $120000 2000 $8000
Total production costs $1549000 $718400
Gross margin $851000 $81600
Marketing costs
Delivery expenses $20000 150 $30000 200 $40000
Sales commissions $005 $2400000 $120000 $800000 $40000
After sales service $5000 50 $2500 500 $25000
Total $152500 $105000
Net income $698500 ($23400)Gross margin percent 3546 1020
Net margin percent 2910 -293
Table 12
Cost per cost driver calculations under lsquosingle-driver rsquo TDABC
Activity cost pool Cost driver identified Resource costs Driver units Cost per
driver unit
Mat handling and storage No labor hours $1000000 500000 $200
Machine setup No labor hours $1350000 500000 $270
Quality control No labor hours $800000 500000 $160
Manufacturing No labor hours $10650000 500000 $2130
Packaging No labor hours $2500000 500000 $500
Total factory resource cost $17500000 $3500
Delivery expenses Sales dollars $400000 40000000 $001
Sales commissions Sales dollars $2000000 40000000 $005
After sales service Sales dollars $500000 40000000 $001
Total costs allocated $20400000
Sustaining costs unallocated $4000000Total production direct costs $8000000
Total costs $32400000
298 J Ratnatunga et al The International Journal of Accounting 47 (2012) 281 ndash 301
8202019 Ratnatunga Jurnal Case Study
httpslidepdfcomreaderfullratnatunga-jurnal-case-study 1921
References
Anderson S W (1995) A Framework for assessing cost management system changes The case of activity-based
costing implementation at general motors 1986ndash1993 Journal of Management Accounting Research 7
1ndash51
Anderson S W (2007) Managing Costs and Cost Structure throughout the Value Chain Research on Strategic
Cost Management In C S Chapman A G Hopwood amp M D Shield (Eds) Handbook of Management
Accounting Research Vol 2 (pp 481ndash506) Oxford Elsevier
Baird K M Harrison G L amp Reeve R C (2004) Adoption of activity management practices A note on the
extent of adoption and the influence of organizational and cultural factors Management Accounting Research
15(4) 393ndash399
Barrett R (2005) Time-Driven Costing The Bottom Line on the New ABC Business Performance Management
35ndash39
Bruggeman W Everaert P Levant Y Saens G amp Anderson S (2008) Cost modelling in logistics using
time-driven ABC Experiences from a wholesaler International Journal of Physical Distribution amp Logistics
Management 38(3) 172ndash191
Byrne S Stower E amp Torry P (2009) Is ABC adoption a success in Australia Journal of Applied Management Accounting Research 7 (1) 37ndash52
Cardinaels E amp Labro E (2008) On the determinants of measurement error in time driven costing Accounting
Review 83(3) 735ndash756
Table 13
Product line gross margins under lsquosingle-diver rsquo TDABC absorption costing
Alpha Beta
units Price Value units Price Value
Sales 30000 $80 $2400000 2000 $400 $800000
Production costs
Direct materials 30000 $2000 $600000 2000 $120 $240000
Indirect costs Cost per
driver unit
Driver
units
Allocated
costs
Driver
units
Allocated
costs
Purchasing $240 30000 $72000 8000 $19200
Mat handling amp storage $200 30000 $60000 8000 $16000
Machine setup $270 30000 $81000 8000 $21600
Quality control $160 30000 $48000 8000 $12800
Manufacturing $2130 30000 $639000 8000 $170400
Packaging $500 30000 $150000 8000 $40000
Total production costs $1650000 $520000
Gross margin $750000 $280000
Marketing costs
Delivery expenses $001 2400000 $24000 800000 $8000
Sales commissions $005 2400000 $120000 800000 $40000
After sales service $001 2400000 $30000 800000 $10000
Total $174000 $58000
Net income $576000 $222000Gross margin percent 3125 3500
Net margin percent 2400 2775
299 J Ratnatunga et al The International Journal of Accounting 47 (2012) 281 ndash 301
8202019 Ratnatunga Jurnal Case Study
httpslidepdfcomreaderfullratnatunga-jurnal-case-study 2021
Cobb I Innes J amp Mitchell F (1992) Activity-based costing-problems in practice London CIMA
Cohen S Venieris G amp Kaimenaki E (2005) ABC Adopters supporters deniers and unawares Managerial
Auditing Journal 20(9) 981ndash1000
Cooper R (1987) Does your company need a new cost system Journal of Cost Management 1(1) 45ndash49
Cooper R (1997 Autumn) The two-stage procedure in cost accounting Part two Journal of Cost Management 39ndash45
Cooper R amp Kaplan R S (1988) Measure Costs Right Make the Right Decisions Harvard Business Review
66 (9) 96ndash103
Cooper R amp Kaplan R S (1991) Design of cost management systems Text cases and readings NJ
Prentice-Hall Englewood Cliffs
Cooper R amp Kaplan R S (1992) Activity based systems Measuring the costs of resource usage Accounting
Horizons 6 (3) 1ndash13
Cotton W Jackson S amp Brown R (2003) Note on a New Zealand replication of the Innes et al UK
activity-based costing survey Management Accounting Research 14(1) 67ndash72
Drury C (1990) Product costing in the 1990s Accountancy 1990 123ndash126
Everaert P amp Bruggeman W (2007) Time-driven activity-based costing exploring the underlying model Cost
Management 21(2) 16ndash
20Foster G amp Swenson D W (1997) Measuring the success of activity-based cost management and its
determinants Journal of Management Accounting Research 9 109ndash141
Gervais M (2005) Controcircle de Gestion (8th ed) Paris Economica
Gosselin M (1997) The effect of strategy and organizational structure on the adoption and implementation of
activity-based costing Accounting Organizations and Society 22(2) 105ndash122
Gosselin M (2007) A review of activity-based costing Technique implementation and consequences In C S
Chapman A G Hopwood amp M D Shield (Eds) Handbook of Management Accounting Research Vol 2
(pp 641ndash672) Oxford Elsevier
Hoozeacutee S amp Bruggeman W (2007) Time-driven activity-based costing Exploring the underlying model Cost
Management 21(2) 16ndash20
Hoozeacutee S amp Bruggeman W (2010) Identifying operating improvements during the design process of a
time-driven ABC system The role of collective worker participation and leadership style Management Accounting Research 21(3) 185ndash198
Horngren C T (2004) Management accounting Some comments Journal of Management Accounting
Research 16 207ndash211
Innes J Mitchel F amp Sinclair D (2000) Activity-based costing in the UKs largest companies A comparison
of 1994 and 1999 survey results Management Accounting Research 11(3) 349ndash362
Johnson H T amp Kaplan R S (1987) Relevance Lost The Rise and Fall of Management Accounting
Cambridge USA Harvard Business School Press
Kaplan R S amp Anderson S R (2003) Time-driven activity-based costing White paper presented at the First
European Summit on Time-Driven Activity-Based Costing Available from httpwwwhbseduresearch
facpubsworkingpaperspapers2030404-045pdf (Accessed 3 December 2010)
Kaplan R S amp Anderson S R (2004) Time-Driven Activity-Based Costing Harvard Business Review 82(11)
131ndash138
Kaplan R S amp Anderson S R (2007) The innovation of time-driven activity-based costing Cost Management
21(2) 5ndash15
Kiani R amp Sangeladji M (2003) An empirical study about the use of the ABCABM models by some of the
Fortune 500 largest industrial corporations in the USA Journal of American Academy of Business Cambridge
3(1ndash2) 174ndash182
Krumwiede K R (1998) The implementation stages of activity-based costing and the impact of contextual and
organizational factors Journal of Management Accounting Research 10 239ndash277
Levant Y amp Zimnovitch H (2008) An ill-known facet to the history of cost calculation The methods of
equivalence 20th Annual Conference of the Business History Research Unit Cardiff Business School (10ndash
11th September)
Malmi T (1997) Towards explaining activity-based costing failure Accounting and control in a decentralisedorganisation Management Accounting Research 8(4) 459ndash480
McDonach C amp Mattimore R (2008) Strategic applications of time driven ABC in the service sector Lessons from
Irish SME Rotterdam Communication at the 31st Annual Congress of the European Accounting Association
300 J Ratnatunga et al The International Journal of Accounting 47 (2012) 281 ndash 301
8202019 Ratnatunga Jurnal Case Study
httpslidepdfcomreaderfullratnatunga-jurnal-case-study 2121
McGowan A S amp Klammer T P (1997) Satisfaction with activity-based cost management implementation
Journal of Management Accounting Research 9 217ndash238
McNair C J (2007) Beyond the boundaries Future trends in cost management Cost Management 21(1) 10ndash21
Nguyen H V amp Brooks A (1997) An empirical investigation of adoption issues relating to activity-based
costing Asian Review of Accounting 5(1) 1ndash18
OConnor N G Deng J amp Luo Y (2006) Political constraints organization design and performance
measurement in Chinas state-owned enterprises Accounting Organizations and Society 31(2) 157ndash177
Pernot E Roodhooft F amp van den Abbeele A (2007) Time-driven activity-based costing for inter-library
services A case study in a university Journal of Academic of Librarianship 33(5) 551ndash560
Ratnatunga J (1983) Financial Controls in Marketing The Accounting-Marketing Interface Canberra Series in
Administrative Studies Monograph No 6 Canberra CAE Canberra Australia
Robinson M A (1990) Contribution margin analysis No longer relevant - strategic cost management the new
paradigm Journal of Management Accounting Research 2 1ndash32
Shank J (1989) Strategic cost management New wine or just new bottles Journal of Management Accounting
Research Fall 1(1) 47ndash65
Sharma R amp Ratnatunga J (1997) Traditional and activity based costing systems Accounting Education An International Journal 6 (4) 337ndash345
Sharman P A (2003) The case for management accounting Strategic Finance 85(4) 43ndash47
Shields M D (1995) An empirical analysis of firms implementation experiences with activity-based costing
Journal of Management Accounting Research 7 148ndash166
Shields M D Chow C W Kato Y amp Nakagawa Y (1991) Management accounting practices in the US and
Japan Comparative survey findings and research implications Journal of International Financial Management
and Accounting 3(1) 61ndash77
Sprinkle G B (2003) Perspectives on experimental research in managerial accounting Accounting Organizations
and Society 28(2ndash3) 287ndash318
Swenson D W (1995) The benefits of activity-based cost management to the manufacturing industry Journal of
Management Accounting Research 7 167ndash180
Tse M amp Gong M (2009) Recognition of idle resources in time-driven activity-based costing and resourceconsumption accounting models Journal of Applied Management Accounting Research 7 (2) 41ndash54
Williams J J amp Seaman A E (2001) Predicting changes in management accounting systems National culture
and industry effects Accounting Organizations and Society 26 (4ndash5) 443ndash460
301 J Ratnatunga et al The International Journal of Accounting 47 (2012) 281 ndash 301
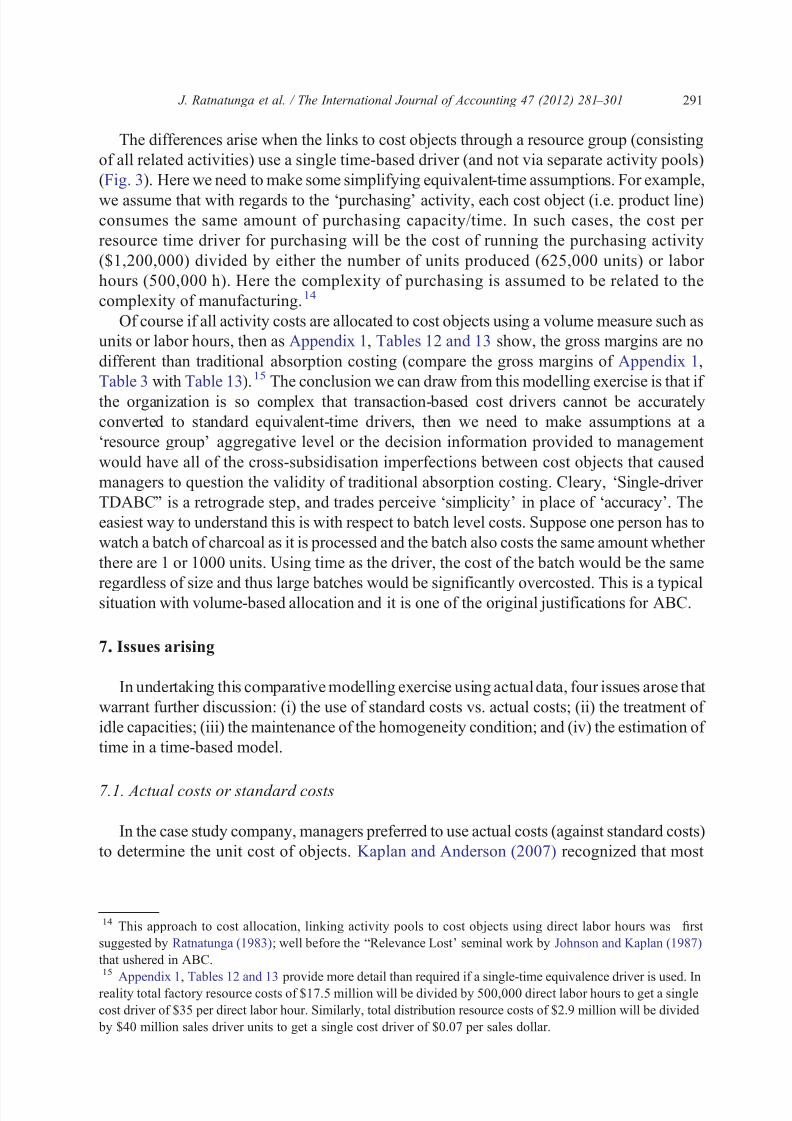
8202019 Ratnatunga Jurnal Case Study
httpslidepdfcomreaderfullratnatunga-jurnal-case-study 1121
8202019 Ratnatunga Jurnal Case Study
httpslidepdfcomreaderfullratnatunga-jurnal-case-study 1221
companies base their cost calculations on actual costs because (i) these costs are directly
based on reality and therefore perceived by the users as being more credible (ii) there is a
stronger link between the general ledger and management accounting and (iii) companies do
not need to make budget forecasts in order to use the model When companies use actualcosts they may experience delays from invoicing or slow recognition of expenses that can
skew the calculations (Kaplan amp Anderson 2007)16 They can solve this problem by ensuring
that data gathering periods are not too short and by spreading charges across the financial year
using statistical and other smoothing techniques
72 Idle capacity in a resource group
One of TDABCs advantages is that it can isolate idle capacity within a resource group
(Kaplan amp Anderson 2007 Tse amp Gong 2009) However this advantage is not unique toTDABC because ABC also has arguments in favor of capacity costing (Cooper amp Kaplan
1991 1992 Robinson 1990)
In the case study company a lsquonormal levelrsquo of activity was defined as the normal capacity
which we also used as the budgetedpractical capacity The company defined this normal
capacity as being about 80 of theoretical capacity which is in keeping with Kaplan and
Anderson (2003 2004) who proposed a ratio between practical capacity and theoretical
capacity for labor hours The managers of the case study company stated that there were wide
variations in capacity (mainly due to the availability of the machines ie kilns) with capacity
often being leased from competitors who had excess capacity Idle capacity was a non-issue in
the case study company
73 The homogeneity condition
An important condition of the single-driver version of TDABC (Fig 3) is that the
activities or transactions performed in one resource group and allocated to different cost
objects should consume resources in the same proportions ie for the calculation to be
correct the time must remain proportional to the average consumption of the department
This is referred to as the condition of homogeneity (Gervais 2005 Kaplan amp Anderson
2007)
The case study company had special equipment for manufacturing silver-impregnated
activated carbon Here the silver-impregnation process must be separated from other types of
activation as the resources used and the rate at which they are used are not the same The
critics of the TDABC method do not seem to highlight the importance of this condition and
most likely the users are also unaware of it
In TDABC any major changes to the production process and productivity gains must be
taken into account when using standard times as these changes could alter the proportionality
between times and thus alter the homogeneity condition Rigorous maintenance and regular
16 That may be true for ABC adopters however this goes against other survey evidence Shields Chow Kato and
Nakagawa (1991) in a cross-country study showed that a majority of manufacturers - about 60 of Japanese and
70 of US - used standard costs
292 J Ratnatunga et al The International Journal of Accounting 47 (2012) 281 ndash 301
8202019 Ratnatunga Jurnal Case Study
httpslidepdfcomreaderfullratnatunga-jurnal-case-study 1321
revision are thus necessary which runs contrary to the simplification of data collection and
analysis claimed as a benefit of the TDABC method
We have already modelled and shown that the single-driver version of TDABC is a
retrograde step with all of the problems of traditional costing (Appendix 1 Tables 12 and 13)When the complexity of maintaining the homogeneity condition is added to the list there
appears to be no merit in adopting the TDABC as a cost allocation approach
74 The estimation of time
The reason complex companies started using ABC was because using direct labor hours to
allocate indirect costs was perceived as being outdated in terms of changing production
technologies (including automation) and lean manufacturing processes of organizations
(Cooper 1987 Cooper amp Kaplan 1988 Johnson amp Kaplan 1987) However the use of labor
times still remains relevant in service organizations Purportedly TDABC enables such
organizations to model the variety and complexity that they encounter in the production of
services In fact the examples provided in the work of Kaplan and Anderson (2007) are based
on service activities
However labor times are more difficult to measure in service companies than in
manufacturing due to the more diverse range of activities performed by the workforce The
common practice is for employees to estimate the percentage of time spent on their various
activities Kaplan and Anderson (2003 2004 2007) are critical of this data collection
approach as they claim that often the total of these percentages is often equal to or greater
than 100 thus that unused capacities have been ignoredKaplan and Anderson (2007) prefer to determine the time necessary to perform tasks by
means of a direct estimation in minutes or hours based on contextual observation interviews
and comparative information by the cost modellers However other authors have done studies
that contradict what Kaplan and Anderson (2007) say They show that estimation errors by
cost modellers were more prone to errors than those obtained from the employees (Cardinaels
amp Labro 2008 Hoozeacutee amp Bruggeman 2007)
These estimation issues did not arise in the comparative cost modelling of the case study
company as (i) it was a manufacturing organization (ii) it had ERP and MRP systems that
largely provided this time equivalence information and (iii) non-time‐ based drivers were used
(where appropriate) in the multi-driver application of the model (Appendix 1 Table 10)
8 Conclusion
From the comparative gross margin results presented using the case study data it appears
that ABC is superior to traditional volume-based cost allocation systems However the
multi-driver version of TDABC seems no different to ABC if standard-activity times are used
as cost drivers We also showed that attempting to simplify the stage 1 activity analysis stage
of ABC implementation (by using a single-volume related cost driver) ultimately makes
TDABC no different than traditional costing systems
Both ABC and TDABC models can provide two types of information for decision making(1) costs allocated to cost objects and (2) links between resource pools and cost pools
However they provide such information in different ways with different levels of accuracy
293 J Ratnatunga et al The International Journal of Accounting 47 (2012) 281 ndash 301
8202019 Ratnatunga Jurnal Case Study
httpslidepdfcomreaderfullratnatunga-jurnal-case-study 1421
The adoption of an activity-based paradigm (via either ABC or TDABC) enables cost
management systems to provide information on how operating activities add value to
organizational outputs through linkages between resource pools and cost pools With
information on costs allocated to cost objects management can manage product costs bychanging quantities of organizational outputs Management can also reduce product costs
by reducing or eliminating non‐value-added activities with this type of information
(Gosselin 1997)
While the TDABC model is designed to address implementation problems faced by the
ABC model the adoption of the model in the case study company did not help to alleviate the
country-independent stage 1 activity analysis complexities of an ABC implementation
especially if it tried to maintain the homogeneity condition Thus TDABC is unable to help
organizations solve implementation problems in a manner that will not compromise accuracy
If implementation problems are the only criterion for organizations to adopt a costing system
then adoption of TDABC will not alleviate this problem
In this study we did not test if TDABC can provide valuable information on idle resources
to support decision making (Kaplan amp Anderson 2007 Tse amp Gong 2009) Future research
could focus on testing the usefulness of TDABC in providing information on idle resources
Alternately it could determine if information on idle resources is useful for decision making
In summary this case study determines that the TDABC model is ABC in sheeps
clothing In its extreme form TDABC provides decision information as erroneous as that
produced by traditional volume allocations As such we predict that TDABC will result in
even fewer implementations sustaining than ABC has managed
Appendix 1
Table 1
Compariso Ltd income statement for 3rd quarter 2008
Sales $40000000
Less Cost of goods sold
Materials $8000000
Labor $7500000
Production overheadsDepreciation $7000000
Energy $2500000
Other Factory Costs $500000 $10000000
Total $25500000
Gross margin $14500000
Less Marketing expenses
Delivery expenses $400000
Sales commissions $2000000
After sales service $500000
Advertising amp promotions $2000000
Sales administration $1000000 $5900000
Less Administration expenses $3000000Total $8900000
Net income before tax $5600000
294 J Ratnatunga et al The International Journal of Accounting 47 (2012) 281 ndash 301
8202019 Ratnatunga Jurnal Case Study
httpslidepdfcomreaderfullratnatunga-jurnal-case-study 1521
Table 2
Sales and cost data for 2 product lines
Product lines Alpha Beta
Per unit data
Price $8000 $40000
Direct materials costs $2000 $12000
Direct wages $1500 $6000
Labor hours 1 4
Table 3
Product line gross margins under traditional absorption costing
Alpha Beta
Sales $2400000 $800000
Costs
Materials $600000 $240000
Labor $450000 $120000
Overheads $600000 $160000
$1650000 $520000
Gross margin $750000 $280000
Gross margin percent 3125 3500
Table 4
Production expenses
Activity cost pools Cost $
Purchasing 1200000
Materials handling and storage 1000000
Machine setup 1350000
Quality control 800000
Labor and other overhead 10650000Packaging 2500000
Table 5
Marketing expenses
Activity cost pools Cost $
Delivery expenses 400000Sales commission 2000000
After sales service 500000
295 J Ratnatunga et al The International Journal of Accounting 47 (2012) 281 ndash 301
8202019 Ratnatunga Jurnal Case Study
httpslidepdfcomreaderfullratnatunga-jurnal-case-study 1621
Table 6
Driver units
Activity cost drivers Driver units Std time in hours
per driver unit
Time equivalent
driver units
No of components used 5000000 NA NA
No of setups 9000 40000 36000
No of batches 3200 10000 3200
No labor hours 500000 10000 500000
No machine hours 500000 10000 500000
No of units 625000 NA NA
No of sales orders 4000 05000 2000
Sales dollars $40000000 NA NA
No of service calls 10000 10000 10000
Table 7
Cost per cost driver calculations under ABC
Activity cost pool Cost driver identified Resource costs Driver units Cost per
driver unit
Mat handling and storage No of components used $1000000 5000000 $020
Machine setup No of setups $1350000 9000 $15000
Quality control No of batches $800000 3200 $25000
Manufacturing No labor hours $10650000 500000 $2130
Packaging No machine hours $2500000 625000 $400Delivery expenses No of sales orders $400000 4000 $10000
Sales commissions Sales dollars $2000000 40000000 $005
After sales service No of service calls $500000 10000 $5000
Total costs allocated $20400000
Sustaining costs unallocated $4000000
Total production direct costs $8000000
Total costs $32400000
Table 8Cost driver data for 2 product lines under ABC
Product lines Alpha Beta All product lines
ABC cost drivers
No purchase orders 200 200 3000
No of components used 450000 100000 5000000
No of setups 50 1000 9000
No of batches 50 200 3200
Total labor hours 30000 8000 500000
Total machine hours 30000 8000 500000
No of units produced and sold 30000 2000 625000
No of sales orders 300 400 4000Sales dollars $2400000 $800000 $40000000
No of service calls 50 500 10000
296 J Ratnatunga et al The International Journal of Accounting 47 (2012) 281 ndash 301
8202019 Ratnatunga Jurnal Case Study
httpslidepdfcomreaderfullratnatunga-jurnal-case-study 1721
Table 9
Product line gross margins under ABC absorption costing
Alpha Beta
units Price Value units Price Value
Sales 30000 $80 $2400000 2000 $400 $800000
Production costs
Direct materials 30000 $2000 $600000 2000 $120 $240000
Indirect costs Cost per
driver unit
Driver
units
Allocated
costs
Driver
units
Allocated
costs
Purchasing $40000 200 $80000 200 $80000
Mat handling and storage $020 450000 $90000 100000 $20000
Machine setup $15000 50 $7500 1000 $150000
Quality control $25000 50 $12500 200 $50000
Manufacturing $2130 30000 $639000 8000 $170400
Packaging $400 30000 $120000 2000 $8000
Total production costs $1549000 $718400
Gross margin $851000 $81600
Marketing costs
Delivery expenses $10000 300 $30000 400 $40000
Sales commissions $005 $2400000 $120000 $800000 $40000
After sales service $5000 50 $2500 500 $25000
Total $152500 $105000
Net income $698500 ($23400)Gross margin percent 3546 1020
Net margin percent 2910 -293
Table 10
Cost per cost driver calculations under TDABC (multi-driver) variant)
Activity cost pool Cost driver identified Resource costs Driver units Cost per
driver unit
Mat handling and storage No of components used $1000000 5000000 $020
Machine setup Time per setup $1350000 36000 $3750
Quality control Time per batch $800000 3200 $25000
Manufacturing No machine hours $10650000 500000 $2130
Packaging No of units $2500000 625000 $400
Delivery expenses Time per sales order $400000 2000 $20000
Sales commissions Sales dollars $2000000 40000000 $005
After sales service Time per Service Call $500000 10000 $5000
Total costs allocated $20400000
Sustaining costs unallocated $4000000Total production direct costs $8000000
Total costs $32400000
297 J Ratnatunga et al The International Journal of Accounting 47 (2012) 281 ndash 301
8202019 Ratnatunga Jurnal Case Study
httpslidepdfcomreaderfullratnatunga-jurnal-case-study 1821
Table 11
Product line gross margins under TDABC absorption costing (multi-driver variant)
Alpha Beta
units Price Value units Price Value
Sales 30000 $80 $2400000 2000 $400 $800000
Production costs
Direct materials 30000 $2000 $600000 2000 $120 $240000
Indirect costs Cost per
driver unit
Driver
units
Allocated
costs
Driver
units
Allocated
costs
Purchasing $80000 100 $80000 100 $80000
Mat handling and storage $020 450000 $90000 100000 $20000
Machine setup $3750 200 $7500 4000 $150000
Quality control $25000 50 $12500 200 $50000
Manufacturing $2130 30000 $639000 8000 $170400
Packaging $400 30000 $120000 2000 $8000
Total production costs $1549000 $718400
Gross margin $851000 $81600
Marketing costs
Delivery expenses $20000 150 $30000 200 $40000
Sales commissions $005 $2400000 $120000 $800000 $40000
After sales service $5000 50 $2500 500 $25000
Total $152500 $105000
Net income $698500 ($23400)Gross margin percent 3546 1020
Net margin percent 2910 -293
Table 12
Cost per cost driver calculations under lsquosingle-driver rsquo TDABC
Activity cost pool Cost driver identified Resource costs Driver units Cost per
driver unit
Mat handling and storage No labor hours $1000000 500000 $200
Machine setup No labor hours $1350000 500000 $270
Quality control No labor hours $800000 500000 $160
Manufacturing No labor hours $10650000 500000 $2130
Packaging No labor hours $2500000 500000 $500
Total factory resource cost $17500000 $3500
Delivery expenses Sales dollars $400000 40000000 $001
Sales commissions Sales dollars $2000000 40000000 $005
After sales service Sales dollars $500000 40000000 $001
Total costs allocated $20400000
Sustaining costs unallocated $4000000Total production direct costs $8000000
Total costs $32400000
298 J Ratnatunga et al The International Journal of Accounting 47 (2012) 281 ndash 301
8202019 Ratnatunga Jurnal Case Study
httpslidepdfcomreaderfullratnatunga-jurnal-case-study 1921
References
Anderson S W (1995) A Framework for assessing cost management system changes The case of activity-based
costing implementation at general motors 1986ndash1993 Journal of Management Accounting Research 7
1ndash51
Anderson S W (2007) Managing Costs and Cost Structure throughout the Value Chain Research on Strategic
Cost Management In C S Chapman A G Hopwood amp M D Shield (Eds) Handbook of Management
Accounting Research Vol 2 (pp 481ndash506) Oxford Elsevier
Baird K M Harrison G L amp Reeve R C (2004) Adoption of activity management practices A note on the
extent of adoption and the influence of organizational and cultural factors Management Accounting Research
15(4) 393ndash399
Barrett R (2005) Time-Driven Costing The Bottom Line on the New ABC Business Performance Management
35ndash39
Bruggeman W Everaert P Levant Y Saens G amp Anderson S (2008) Cost modelling in logistics using
time-driven ABC Experiences from a wholesaler International Journal of Physical Distribution amp Logistics
Management 38(3) 172ndash191
Byrne S Stower E amp Torry P (2009) Is ABC adoption a success in Australia Journal of Applied Management Accounting Research 7 (1) 37ndash52
Cardinaels E amp Labro E (2008) On the determinants of measurement error in time driven costing Accounting
Review 83(3) 735ndash756
Table 13
Product line gross margins under lsquosingle-diver rsquo TDABC absorption costing
Alpha Beta
units Price Value units Price Value
Sales 30000 $80 $2400000 2000 $400 $800000
Production costs
Direct materials 30000 $2000 $600000 2000 $120 $240000
Indirect costs Cost per
driver unit
Driver
units
Allocated
costs
Driver
units
Allocated
costs
Purchasing $240 30000 $72000 8000 $19200
Mat handling amp storage $200 30000 $60000 8000 $16000
Machine setup $270 30000 $81000 8000 $21600
Quality control $160 30000 $48000 8000 $12800
Manufacturing $2130 30000 $639000 8000 $170400
Packaging $500 30000 $150000 8000 $40000
Total production costs $1650000 $520000
Gross margin $750000 $280000
Marketing costs
Delivery expenses $001 2400000 $24000 800000 $8000
Sales commissions $005 2400000 $120000 800000 $40000
After sales service $001 2400000 $30000 800000 $10000
Total $174000 $58000
Net income $576000 $222000Gross margin percent 3125 3500
Net margin percent 2400 2775
299 J Ratnatunga et al The International Journal of Accounting 47 (2012) 281 ndash 301
8202019 Ratnatunga Jurnal Case Study
httpslidepdfcomreaderfullratnatunga-jurnal-case-study 2021
Cobb I Innes J amp Mitchell F (1992) Activity-based costing-problems in practice London CIMA
Cohen S Venieris G amp Kaimenaki E (2005) ABC Adopters supporters deniers and unawares Managerial
Auditing Journal 20(9) 981ndash1000
Cooper R (1987) Does your company need a new cost system Journal of Cost Management 1(1) 45ndash49
Cooper R (1997 Autumn) The two-stage procedure in cost accounting Part two Journal of Cost Management 39ndash45
Cooper R amp Kaplan R S (1988) Measure Costs Right Make the Right Decisions Harvard Business Review
66 (9) 96ndash103
Cooper R amp Kaplan R S (1991) Design of cost management systems Text cases and readings NJ
Prentice-Hall Englewood Cliffs
Cooper R amp Kaplan R S (1992) Activity based systems Measuring the costs of resource usage Accounting
Horizons 6 (3) 1ndash13
Cotton W Jackson S amp Brown R (2003) Note on a New Zealand replication of the Innes et al UK
activity-based costing survey Management Accounting Research 14(1) 67ndash72
Drury C (1990) Product costing in the 1990s Accountancy 1990 123ndash126
Everaert P amp Bruggeman W (2007) Time-driven activity-based costing exploring the underlying model Cost
Management 21(2) 16ndash
20Foster G amp Swenson D W (1997) Measuring the success of activity-based cost management and its
determinants Journal of Management Accounting Research 9 109ndash141
Gervais M (2005) Controcircle de Gestion (8th ed) Paris Economica
Gosselin M (1997) The effect of strategy and organizational structure on the adoption and implementation of
activity-based costing Accounting Organizations and Society 22(2) 105ndash122
Gosselin M (2007) A review of activity-based costing Technique implementation and consequences In C S
Chapman A G Hopwood amp M D Shield (Eds) Handbook of Management Accounting Research Vol 2
(pp 641ndash672) Oxford Elsevier
Hoozeacutee S amp Bruggeman W (2007) Time-driven activity-based costing Exploring the underlying model Cost
Management 21(2) 16ndash20
Hoozeacutee S amp Bruggeman W (2010) Identifying operating improvements during the design process of a
time-driven ABC system The role of collective worker participation and leadership style Management Accounting Research 21(3) 185ndash198
Horngren C T (2004) Management accounting Some comments Journal of Management Accounting
Research 16 207ndash211
Innes J Mitchel F amp Sinclair D (2000) Activity-based costing in the UKs largest companies A comparison
of 1994 and 1999 survey results Management Accounting Research 11(3) 349ndash362
Johnson H T amp Kaplan R S (1987) Relevance Lost The Rise and Fall of Management Accounting
Cambridge USA Harvard Business School Press
Kaplan R S amp Anderson S R (2003) Time-driven activity-based costing White paper presented at the First
European Summit on Time-Driven Activity-Based Costing Available from httpwwwhbseduresearch
facpubsworkingpaperspapers2030404-045pdf (Accessed 3 December 2010)
Kaplan R S amp Anderson S R (2004) Time-Driven Activity-Based Costing Harvard Business Review 82(11)
131ndash138
Kaplan R S amp Anderson S R (2007) The innovation of time-driven activity-based costing Cost Management
21(2) 5ndash15
Kiani R amp Sangeladji M (2003) An empirical study about the use of the ABCABM models by some of the
Fortune 500 largest industrial corporations in the USA Journal of American Academy of Business Cambridge
3(1ndash2) 174ndash182
Krumwiede K R (1998) The implementation stages of activity-based costing and the impact of contextual and
organizational factors Journal of Management Accounting Research 10 239ndash277
Levant Y amp Zimnovitch H (2008) An ill-known facet to the history of cost calculation The methods of
equivalence 20th Annual Conference of the Business History Research Unit Cardiff Business School (10ndash
11th September)
Malmi T (1997) Towards explaining activity-based costing failure Accounting and control in a decentralisedorganisation Management Accounting Research 8(4) 459ndash480
McDonach C amp Mattimore R (2008) Strategic applications of time driven ABC in the service sector Lessons from
Irish SME Rotterdam Communication at the 31st Annual Congress of the European Accounting Association
300 J Ratnatunga et al The International Journal of Accounting 47 (2012) 281 ndash 301
8202019 Ratnatunga Jurnal Case Study
httpslidepdfcomreaderfullratnatunga-jurnal-case-study 2121
McGowan A S amp Klammer T P (1997) Satisfaction with activity-based cost management implementation
Journal of Management Accounting Research 9 217ndash238
McNair C J (2007) Beyond the boundaries Future trends in cost management Cost Management 21(1) 10ndash21
Nguyen H V amp Brooks A (1997) An empirical investigation of adoption issues relating to activity-based
costing Asian Review of Accounting 5(1) 1ndash18
OConnor N G Deng J amp Luo Y (2006) Political constraints organization design and performance
measurement in Chinas state-owned enterprises Accounting Organizations and Society 31(2) 157ndash177
Pernot E Roodhooft F amp van den Abbeele A (2007) Time-driven activity-based costing for inter-library
services A case study in a university Journal of Academic of Librarianship 33(5) 551ndash560
Ratnatunga J (1983) Financial Controls in Marketing The Accounting-Marketing Interface Canberra Series in
Administrative Studies Monograph No 6 Canberra CAE Canberra Australia
Robinson M A (1990) Contribution margin analysis No longer relevant - strategic cost management the new
paradigm Journal of Management Accounting Research 2 1ndash32
Shank J (1989) Strategic cost management New wine or just new bottles Journal of Management Accounting
Research Fall 1(1) 47ndash65
Sharma R amp Ratnatunga J (1997) Traditional and activity based costing systems Accounting Education An International Journal 6 (4) 337ndash345
Sharman P A (2003) The case for management accounting Strategic Finance 85(4) 43ndash47
Shields M D (1995) An empirical analysis of firms implementation experiences with activity-based costing
Journal of Management Accounting Research 7 148ndash166
Shields M D Chow C W Kato Y amp Nakagawa Y (1991) Management accounting practices in the US and
Japan Comparative survey findings and research implications Journal of International Financial Management
and Accounting 3(1) 61ndash77
Sprinkle G B (2003) Perspectives on experimental research in managerial accounting Accounting Organizations
and Society 28(2ndash3) 287ndash318
Swenson D W (1995) The benefits of activity-based cost management to the manufacturing industry Journal of
Management Accounting Research 7 167ndash180
Tse M amp Gong M (2009) Recognition of idle resources in time-driven activity-based costing and resourceconsumption accounting models Journal of Applied Management Accounting Research 7 (2) 41ndash54
Williams J J amp Seaman A E (2001) Predicting changes in management accounting systems National culture
and industry effects Accounting Organizations and Society 26 (4ndash5) 443ndash460
301 J Ratnatunga et al The International Journal of Accounting 47 (2012) 281 ndash 301
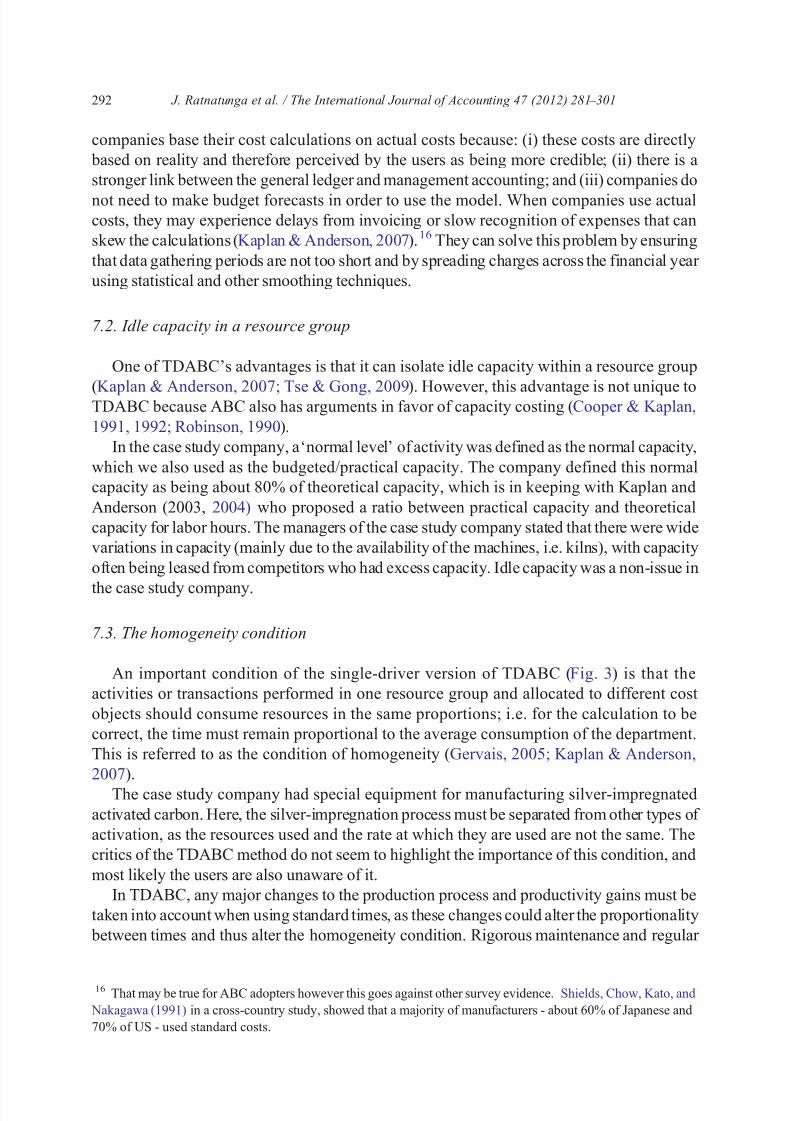
8202019 Ratnatunga Jurnal Case Study
httpslidepdfcomreaderfullratnatunga-jurnal-case-study 1221
companies base their cost calculations on actual costs because (i) these costs are directly
based on reality and therefore perceived by the users as being more credible (ii) there is a
stronger link between the general ledger and management accounting and (iii) companies do
not need to make budget forecasts in order to use the model When companies use actualcosts they may experience delays from invoicing or slow recognition of expenses that can
skew the calculations (Kaplan amp Anderson 2007)16 They can solve this problem by ensuring
that data gathering periods are not too short and by spreading charges across the financial year
using statistical and other smoothing techniques
72 Idle capacity in a resource group
One of TDABCs advantages is that it can isolate idle capacity within a resource group
(Kaplan amp Anderson 2007 Tse amp Gong 2009) However this advantage is not unique toTDABC because ABC also has arguments in favor of capacity costing (Cooper amp Kaplan
1991 1992 Robinson 1990)
In the case study company a lsquonormal levelrsquo of activity was defined as the normal capacity
which we also used as the budgetedpractical capacity The company defined this normal
capacity as being about 80 of theoretical capacity which is in keeping with Kaplan and
Anderson (2003 2004) who proposed a ratio between practical capacity and theoretical
capacity for labor hours The managers of the case study company stated that there were wide
variations in capacity (mainly due to the availability of the machines ie kilns) with capacity
often being leased from competitors who had excess capacity Idle capacity was a non-issue in
the case study company
73 The homogeneity condition
An important condition of the single-driver version of TDABC (Fig 3) is that the
activities or transactions performed in one resource group and allocated to different cost
objects should consume resources in the same proportions ie for the calculation to be
correct the time must remain proportional to the average consumption of the department
This is referred to as the condition of homogeneity (Gervais 2005 Kaplan amp Anderson
2007)
The case study company had special equipment for manufacturing silver-impregnated
activated carbon Here the silver-impregnation process must be separated from other types of
activation as the resources used and the rate at which they are used are not the same The
critics of the TDABC method do not seem to highlight the importance of this condition and
most likely the users are also unaware of it
In TDABC any major changes to the production process and productivity gains must be
taken into account when using standard times as these changes could alter the proportionality
between times and thus alter the homogeneity condition Rigorous maintenance and regular
16 That may be true for ABC adopters however this goes against other survey evidence Shields Chow Kato and
Nakagawa (1991) in a cross-country study showed that a majority of manufacturers - about 60 of Japanese and
70 of US - used standard costs
292 J Ratnatunga et al The International Journal of Accounting 47 (2012) 281 ndash 301
8202019 Ratnatunga Jurnal Case Study
httpslidepdfcomreaderfullratnatunga-jurnal-case-study 1321
revision are thus necessary which runs contrary to the simplification of data collection and
analysis claimed as a benefit of the TDABC method
We have already modelled and shown that the single-driver version of TDABC is a
retrograde step with all of the problems of traditional costing (Appendix 1 Tables 12 and 13)When the complexity of maintaining the homogeneity condition is added to the list there
appears to be no merit in adopting the TDABC as a cost allocation approach
74 The estimation of time
The reason complex companies started using ABC was because using direct labor hours to
allocate indirect costs was perceived as being outdated in terms of changing production
technologies (including automation) and lean manufacturing processes of organizations
(Cooper 1987 Cooper amp Kaplan 1988 Johnson amp Kaplan 1987) However the use of labor
times still remains relevant in service organizations Purportedly TDABC enables such
organizations to model the variety and complexity that they encounter in the production of
services In fact the examples provided in the work of Kaplan and Anderson (2007) are based
on service activities
However labor times are more difficult to measure in service companies than in
manufacturing due to the more diverse range of activities performed by the workforce The
common practice is for employees to estimate the percentage of time spent on their various
activities Kaplan and Anderson (2003 2004 2007) are critical of this data collection
approach as they claim that often the total of these percentages is often equal to or greater
than 100 thus that unused capacities have been ignoredKaplan and Anderson (2007) prefer to determine the time necessary to perform tasks by
means of a direct estimation in minutes or hours based on contextual observation interviews
and comparative information by the cost modellers However other authors have done studies
that contradict what Kaplan and Anderson (2007) say They show that estimation errors by
cost modellers were more prone to errors than those obtained from the employees (Cardinaels
amp Labro 2008 Hoozeacutee amp Bruggeman 2007)
These estimation issues did not arise in the comparative cost modelling of the case study
company as (i) it was a manufacturing organization (ii) it had ERP and MRP systems that
largely provided this time equivalence information and (iii) non-time‐ based drivers were used
(where appropriate) in the multi-driver application of the model (Appendix 1 Table 10)
8 Conclusion
From the comparative gross margin results presented using the case study data it appears
that ABC is superior to traditional volume-based cost allocation systems However the
multi-driver version of TDABC seems no different to ABC if standard-activity times are used
as cost drivers We also showed that attempting to simplify the stage 1 activity analysis stage
of ABC implementation (by using a single-volume related cost driver) ultimately makes
TDABC no different than traditional costing systems
Both ABC and TDABC models can provide two types of information for decision making(1) costs allocated to cost objects and (2) links between resource pools and cost pools
However they provide such information in different ways with different levels of accuracy
293 J Ratnatunga et al The International Journal of Accounting 47 (2012) 281 ndash 301
8202019 Ratnatunga Jurnal Case Study
httpslidepdfcomreaderfullratnatunga-jurnal-case-study 1421
The adoption of an activity-based paradigm (via either ABC or TDABC) enables cost
management systems to provide information on how operating activities add value to
organizational outputs through linkages between resource pools and cost pools With
information on costs allocated to cost objects management can manage product costs bychanging quantities of organizational outputs Management can also reduce product costs
by reducing or eliminating non‐value-added activities with this type of information
(Gosselin 1997)
While the TDABC model is designed to address implementation problems faced by the
ABC model the adoption of the model in the case study company did not help to alleviate the
country-independent stage 1 activity analysis complexities of an ABC implementation
especially if it tried to maintain the homogeneity condition Thus TDABC is unable to help
organizations solve implementation problems in a manner that will not compromise accuracy
If implementation problems are the only criterion for organizations to adopt a costing system
then adoption of TDABC will not alleviate this problem
In this study we did not test if TDABC can provide valuable information on idle resources
to support decision making (Kaplan amp Anderson 2007 Tse amp Gong 2009) Future research
could focus on testing the usefulness of TDABC in providing information on idle resources
Alternately it could determine if information on idle resources is useful for decision making
In summary this case study determines that the TDABC model is ABC in sheeps
clothing In its extreme form TDABC provides decision information as erroneous as that
produced by traditional volume allocations As such we predict that TDABC will result in
even fewer implementations sustaining than ABC has managed
Appendix 1
Table 1
Compariso Ltd income statement for 3rd quarter 2008
Sales $40000000
Less Cost of goods sold
Materials $8000000
Labor $7500000
Production overheadsDepreciation $7000000
Energy $2500000
Other Factory Costs $500000 $10000000
Total $25500000
Gross margin $14500000
Less Marketing expenses
Delivery expenses $400000
Sales commissions $2000000
After sales service $500000
Advertising amp promotions $2000000
Sales administration $1000000 $5900000
Less Administration expenses $3000000Total $8900000
Net income before tax $5600000
294 J Ratnatunga et al The International Journal of Accounting 47 (2012) 281 ndash 301
8202019 Ratnatunga Jurnal Case Study
httpslidepdfcomreaderfullratnatunga-jurnal-case-study 1521
Table 2
Sales and cost data for 2 product lines
Product lines Alpha Beta
Per unit data
Price $8000 $40000
Direct materials costs $2000 $12000
Direct wages $1500 $6000
Labor hours 1 4
Table 3
Product line gross margins under traditional absorption costing
Alpha Beta
Sales $2400000 $800000
Costs
Materials $600000 $240000
Labor $450000 $120000
Overheads $600000 $160000
$1650000 $520000
Gross margin $750000 $280000
Gross margin percent 3125 3500
Table 4
Production expenses
Activity cost pools Cost $
Purchasing 1200000
Materials handling and storage 1000000
Machine setup 1350000
Quality control 800000
Labor and other overhead 10650000Packaging 2500000
Table 5
Marketing expenses
Activity cost pools Cost $
Delivery expenses 400000Sales commission 2000000
After sales service 500000
295 J Ratnatunga et al The International Journal of Accounting 47 (2012) 281 ndash 301
8202019 Ratnatunga Jurnal Case Study
httpslidepdfcomreaderfullratnatunga-jurnal-case-study 1621
Table 6
Driver units
Activity cost drivers Driver units Std time in hours
per driver unit
Time equivalent
driver units
No of components used 5000000 NA NA
No of setups 9000 40000 36000
No of batches 3200 10000 3200
No labor hours 500000 10000 500000
No machine hours 500000 10000 500000
No of units 625000 NA NA
No of sales orders 4000 05000 2000
Sales dollars $40000000 NA NA
No of service calls 10000 10000 10000
Table 7
Cost per cost driver calculations under ABC
Activity cost pool Cost driver identified Resource costs Driver units Cost per
driver unit
Mat handling and storage No of components used $1000000 5000000 $020
Machine setup No of setups $1350000 9000 $15000
Quality control No of batches $800000 3200 $25000
Manufacturing No labor hours $10650000 500000 $2130
Packaging No machine hours $2500000 625000 $400Delivery expenses No of sales orders $400000 4000 $10000
Sales commissions Sales dollars $2000000 40000000 $005
After sales service No of service calls $500000 10000 $5000
Total costs allocated $20400000
Sustaining costs unallocated $4000000
Total production direct costs $8000000
Total costs $32400000
Table 8Cost driver data for 2 product lines under ABC
Product lines Alpha Beta All product lines
ABC cost drivers
No purchase orders 200 200 3000
No of components used 450000 100000 5000000
No of setups 50 1000 9000
No of batches 50 200 3200
Total labor hours 30000 8000 500000
Total machine hours 30000 8000 500000
No of units produced and sold 30000 2000 625000
No of sales orders 300 400 4000Sales dollars $2400000 $800000 $40000000
No of service calls 50 500 10000
296 J Ratnatunga et al The International Journal of Accounting 47 (2012) 281 ndash 301
8202019 Ratnatunga Jurnal Case Study
httpslidepdfcomreaderfullratnatunga-jurnal-case-study 1721
Table 9
Product line gross margins under ABC absorption costing
Alpha Beta
units Price Value units Price Value
Sales 30000 $80 $2400000 2000 $400 $800000
Production costs
Direct materials 30000 $2000 $600000 2000 $120 $240000
Indirect costs Cost per
driver unit
Driver
units
Allocated
costs
Driver
units
Allocated
costs
Purchasing $40000 200 $80000 200 $80000
Mat handling and storage $020 450000 $90000 100000 $20000
Machine setup $15000 50 $7500 1000 $150000
Quality control $25000 50 $12500 200 $50000
Manufacturing $2130 30000 $639000 8000 $170400
Packaging $400 30000 $120000 2000 $8000
Total production costs $1549000 $718400
Gross margin $851000 $81600
Marketing costs
Delivery expenses $10000 300 $30000 400 $40000
Sales commissions $005 $2400000 $120000 $800000 $40000
After sales service $5000 50 $2500 500 $25000
Total $152500 $105000
Net income $698500 ($23400)Gross margin percent 3546 1020
Net margin percent 2910 -293
Table 10
Cost per cost driver calculations under TDABC (multi-driver) variant)
Activity cost pool Cost driver identified Resource costs Driver units Cost per
driver unit
Mat handling and storage No of components used $1000000 5000000 $020
Machine setup Time per setup $1350000 36000 $3750
Quality control Time per batch $800000 3200 $25000
Manufacturing No machine hours $10650000 500000 $2130
Packaging No of units $2500000 625000 $400
Delivery expenses Time per sales order $400000 2000 $20000
Sales commissions Sales dollars $2000000 40000000 $005
After sales service Time per Service Call $500000 10000 $5000
Total costs allocated $20400000
Sustaining costs unallocated $4000000Total production direct costs $8000000
Total costs $32400000
297 J Ratnatunga et al The International Journal of Accounting 47 (2012) 281 ndash 301
8202019 Ratnatunga Jurnal Case Study
httpslidepdfcomreaderfullratnatunga-jurnal-case-study 1821
Table 11
Product line gross margins under TDABC absorption costing (multi-driver variant)
Alpha Beta
units Price Value units Price Value
Sales 30000 $80 $2400000 2000 $400 $800000
Production costs
Direct materials 30000 $2000 $600000 2000 $120 $240000
Indirect costs Cost per
driver unit
Driver
units
Allocated
costs
Driver
units
Allocated
costs
Purchasing $80000 100 $80000 100 $80000
Mat handling and storage $020 450000 $90000 100000 $20000
Machine setup $3750 200 $7500 4000 $150000
Quality control $25000 50 $12500 200 $50000
Manufacturing $2130 30000 $639000 8000 $170400
Packaging $400 30000 $120000 2000 $8000
Total production costs $1549000 $718400
Gross margin $851000 $81600
Marketing costs
Delivery expenses $20000 150 $30000 200 $40000
Sales commissions $005 $2400000 $120000 $800000 $40000
After sales service $5000 50 $2500 500 $25000
Total $152500 $105000
Net income $698500 ($23400)Gross margin percent 3546 1020
Net margin percent 2910 -293
Table 12
Cost per cost driver calculations under lsquosingle-driver rsquo TDABC
Activity cost pool Cost driver identified Resource costs Driver units Cost per
driver unit
Mat handling and storage No labor hours $1000000 500000 $200
Machine setup No labor hours $1350000 500000 $270
Quality control No labor hours $800000 500000 $160
Manufacturing No labor hours $10650000 500000 $2130
Packaging No labor hours $2500000 500000 $500
Total factory resource cost $17500000 $3500
Delivery expenses Sales dollars $400000 40000000 $001
Sales commissions Sales dollars $2000000 40000000 $005
After sales service Sales dollars $500000 40000000 $001
Total costs allocated $20400000
Sustaining costs unallocated $4000000Total production direct costs $8000000
Total costs $32400000
298 J Ratnatunga et al The International Journal of Accounting 47 (2012) 281 ndash 301
8202019 Ratnatunga Jurnal Case Study
httpslidepdfcomreaderfullratnatunga-jurnal-case-study 1921
References
Anderson S W (1995) A Framework for assessing cost management system changes The case of activity-based
costing implementation at general motors 1986ndash1993 Journal of Management Accounting Research 7
1ndash51
Anderson S W (2007) Managing Costs and Cost Structure throughout the Value Chain Research on Strategic
Cost Management In C S Chapman A G Hopwood amp M D Shield (Eds) Handbook of Management
Accounting Research Vol 2 (pp 481ndash506) Oxford Elsevier
Baird K M Harrison G L amp Reeve R C (2004) Adoption of activity management practices A note on the
extent of adoption and the influence of organizational and cultural factors Management Accounting Research
15(4) 393ndash399
Barrett R (2005) Time-Driven Costing The Bottom Line on the New ABC Business Performance Management
35ndash39
Bruggeman W Everaert P Levant Y Saens G amp Anderson S (2008) Cost modelling in logistics using
time-driven ABC Experiences from a wholesaler International Journal of Physical Distribution amp Logistics
Management 38(3) 172ndash191
Byrne S Stower E amp Torry P (2009) Is ABC adoption a success in Australia Journal of Applied Management Accounting Research 7 (1) 37ndash52
Cardinaels E amp Labro E (2008) On the determinants of measurement error in time driven costing Accounting
Review 83(3) 735ndash756
Table 13
Product line gross margins under lsquosingle-diver rsquo TDABC absorption costing
Alpha Beta
units Price Value units Price Value
Sales 30000 $80 $2400000 2000 $400 $800000
Production costs
Direct materials 30000 $2000 $600000 2000 $120 $240000
Indirect costs Cost per
driver unit
Driver
units
Allocated
costs
Driver
units
Allocated
costs
Purchasing $240 30000 $72000 8000 $19200
Mat handling amp storage $200 30000 $60000 8000 $16000
Machine setup $270 30000 $81000 8000 $21600
Quality control $160 30000 $48000 8000 $12800
Manufacturing $2130 30000 $639000 8000 $170400
Packaging $500 30000 $150000 8000 $40000
Total production costs $1650000 $520000
Gross margin $750000 $280000
Marketing costs
Delivery expenses $001 2400000 $24000 800000 $8000
Sales commissions $005 2400000 $120000 800000 $40000
After sales service $001 2400000 $30000 800000 $10000
Total $174000 $58000
Net income $576000 $222000Gross margin percent 3125 3500
Net margin percent 2400 2775
299 J Ratnatunga et al The International Journal of Accounting 47 (2012) 281 ndash 301
8202019 Ratnatunga Jurnal Case Study
httpslidepdfcomreaderfullratnatunga-jurnal-case-study 2021
Cobb I Innes J amp Mitchell F (1992) Activity-based costing-problems in practice London CIMA
Cohen S Venieris G amp Kaimenaki E (2005) ABC Adopters supporters deniers and unawares Managerial
Auditing Journal 20(9) 981ndash1000
Cooper R (1987) Does your company need a new cost system Journal of Cost Management 1(1) 45ndash49
Cooper R (1997 Autumn) The two-stage procedure in cost accounting Part two Journal of Cost Management 39ndash45
Cooper R amp Kaplan R S (1988) Measure Costs Right Make the Right Decisions Harvard Business Review
66 (9) 96ndash103
Cooper R amp Kaplan R S (1991) Design of cost management systems Text cases and readings NJ
Prentice-Hall Englewood Cliffs
Cooper R amp Kaplan R S (1992) Activity based systems Measuring the costs of resource usage Accounting
Horizons 6 (3) 1ndash13
Cotton W Jackson S amp Brown R (2003) Note on a New Zealand replication of the Innes et al UK
activity-based costing survey Management Accounting Research 14(1) 67ndash72
Drury C (1990) Product costing in the 1990s Accountancy 1990 123ndash126
Everaert P amp Bruggeman W (2007) Time-driven activity-based costing exploring the underlying model Cost
Management 21(2) 16ndash
20Foster G amp Swenson D W (1997) Measuring the success of activity-based cost management and its
determinants Journal of Management Accounting Research 9 109ndash141
Gervais M (2005) Controcircle de Gestion (8th ed) Paris Economica
Gosselin M (1997) The effect of strategy and organizational structure on the adoption and implementation of
activity-based costing Accounting Organizations and Society 22(2) 105ndash122
Gosselin M (2007) A review of activity-based costing Technique implementation and consequences In C S
Chapman A G Hopwood amp M D Shield (Eds) Handbook of Management Accounting Research Vol 2
(pp 641ndash672) Oxford Elsevier
Hoozeacutee S amp Bruggeman W (2007) Time-driven activity-based costing Exploring the underlying model Cost
Management 21(2) 16ndash20
Hoozeacutee S amp Bruggeman W (2010) Identifying operating improvements during the design process of a
time-driven ABC system The role of collective worker participation and leadership style Management Accounting Research 21(3) 185ndash198
Horngren C T (2004) Management accounting Some comments Journal of Management Accounting
Research 16 207ndash211
Innes J Mitchel F amp Sinclair D (2000) Activity-based costing in the UKs largest companies A comparison
of 1994 and 1999 survey results Management Accounting Research 11(3) 349ndash362
Johnson H T amp Kaplan R S (1987) Relevance Lost The Rise and Fall of Management Accounting
Cambridge USA Harvard Business School Press
Kaplan R S amp Anderson S R (2003) Time-driven activity-based costing White paper presented at the First
European Summit on Time-Driven Activity-Based Costing Available from httpwwwhbseduresearch
facpubsworkingpaperspapers2030404-045pdf (Accessed 3 December 2010)
Kaplan R S amp Anderson S R (2004) Time-Driven Activity-Based Costing Harvard Business Review 82(11)
131ndash138
Kaplan R S amp Anderson S R (2007) The innovation of time-driven activity-based costing Cost Management
21(2) 5ndash15
Kiani R amp Sangeladji M (2003) An empirical study about the use of the ABCABM models by some of the
Fortune 500 largest industrial corporations in the USA Journal of American Academy of Business Cambridge
3(1ndash2) 174ndash182
Krumwiede K R (1998) The implementation stages of activity-based costing and the impact of contextual and
organizational factors Journal of Management Accounting Research 10 239ndash277
Levant Y amp Zimnovitch H (2008) An ill-known facet to the history of cost calculation The methods of
equivalence 20th Annual Conference of the Business History Research Unit Cardiff Business School (10ndash
11th September)
Malmi T (1997) Towards explaining activity-based costing failure Accounting and control in a decentralisedorganisation Management Accounting Research 8(4) 459ndash480
McDonach C amp Mattimore R (2008) Strategic applications of time driven ABC in the service sector Lessons from
Irish SME Rotterdam Communication at the 31st Annual Congress of the European Accounting Association
300 J Ratnatunga et al The International Journal of Accounting 47 (2012) 281 ndash 301
8202019 Ratnatunga Jurnal Case Study
httpslidepdfcomreaderfullratnatunga-jurnal-case-study 2121
McGowan A S amp Klammer T P (1997) Satisfaction with activity-based cost management implementation
Journal of Management Accounting Research 9 217ndash238
McNair C J (2007) Beyond the boundaries Future trends in cost management Cost Management 21(1) 10ndash21
Nguyen H V amp Brooks A (1997) An empirical investigation of adoption issues relating to activity-based
costing Asian Review of Accounting 5(1) 1ndash18
OConnor N G Deng J amp Luo Y (2006) Political constraints organization design and performance
measurement in Chinas state-owned enterprises Accounting Organizations and Society 31(2) 157ndash177
Pernot E Roodhooft F amp van den Abbeele A (2007) Time-driven activity-based costing for inter-library
services A case study in a university Journal of Academic of Librarianship 33(5) 551ndash560
Ratnatunga J (1983) Financial Controls in Marketing The Accounting-Marketing Interface Canberra Series in
Administrative Studies Monograph No 6 Canberra CAE Canberra Australia
Robinson M A (1990) Contribution margin analysis No longer relevant - strategic cost management the new
paradigm Journal of Management Accounting Research 2 1ndash32
Shank J (1989) Strategic cost management New wine or just new bottles Journal of Management Accounting
Research Fall 1(1) 47ndash65
Sharma R amp Ratnatunga J (1997) Traditional and activity based costing systems Accounting Education An International Journal 6 (4) 337ndash345
Sharman P A (2003) The case for management accounting Strategic Finance 85(4) 43ndash47
Shields M D (1995) An empirical analysis of firms implementation experiences with activity-based costing
Journal of Management Accounting Research 7 148ndash166
Shields M D Chow C W Kato Y amp Nakagawa Y (1991) Management accounting practices in the US and
Japan Comparative survey findings and research implications Journal of International Financial Management
and Accounting 3(1) 61ndash77
Sprinkle G B (2003) Perspectives on experimental research in managerial accounting Accounting Organizations
and Society 28(2ndash3) 287ndash318
Swenson D W (1995) The benefits of activity-based cost management to the manufacturing industry Journal of
Management Accounting Research 7 167ndash180
Tse M amp Gong M (2009) Recognition of idle resources in time-driven activity-based costing and resourceconsumption accounting models Journal of Applied Management Accounting Research 7 (2) 41ndash54
Williams J J amp Seaman A E (2001) Predicting changes in management accounting systems National culture
and industry effects Accounting Organizations and Society 26 (4ndash5) 443ndash460
301 J Ratnatunga et al The International Journal of Accounting 47 (2012) 281 ndash 301
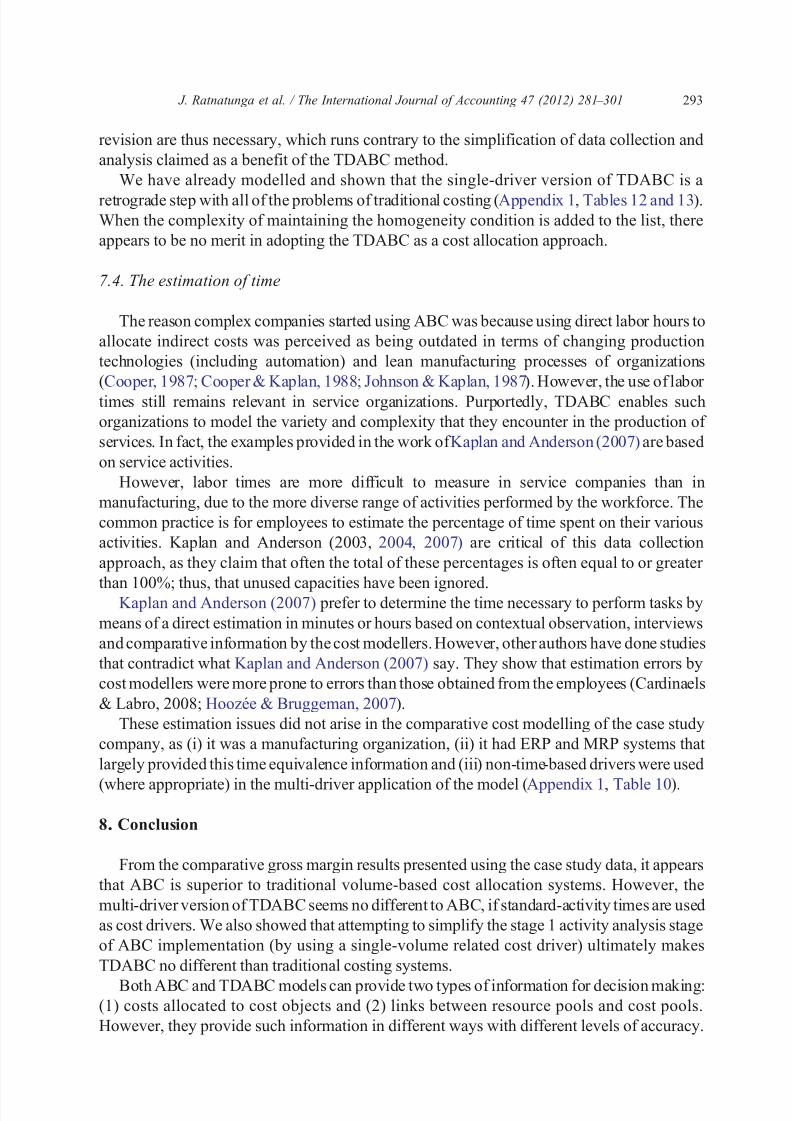
8202019 Ratnatunga Jurnal Case Study
httpslidepdfcomreaderfullratnatunga-jurnal-case-study 1321
revision are thus necessary which runs contrary to the simplification of data collection and
analysis claimed as a benefit of the TDABC method
We have already modelled and shown that the single-driver version of TDABC is a
retrograde step with all of the problems of traditional costing (Appendix 1 Tables 12 and 13)When the complexity of maintaining the homogeneity condition is added to the list there
appears to be no merit in adopting the TDABC as a cost allocation approach
74 The estimation of time
The reason complex companies started using ABC was because using direct labor hours to
allocate indirect costs was perceived as being outdated in terms of changing production
technologies (including automation) and lean manufacturing processes of organizations
(Cooper 1987 Cooper amp Kaplan 1988 Johnson amp Kaplan 1987) However the use of labor
times still remains relevant in service organizations Purportedly TDABC enables such
organizations to model the variety and complexity that they encounter in the production of
services In fact the examples provided in the work of Kaplan and Anderson (2007) are based
on service activities
However labor times are more difficult to measure in service companies than in
manufacturing due to the more diverse range of activities performed by the workforce The
common practice is for employees to estimate the percentage of time spent on their various
activities Kaplan and Anderson (2003 2004 2007) are critical of this data collection
approach as they claim that often the total of these percentages is often equal to or greater
than 100 thus that unused capacities have been ignoredKaplan and Anderson (2007) prefer to determine the time necessary to perform tasks by
means of a direct estimation in minutes or hours based on contextual observation interviews
and comparative information by the cost modellers However other authors have done studies
that contradict what Kaplan and Anderson (2007) say They show that estimation errors by
cost modellers were more prone to errors than those obtained from the employees (Cardinaels
amp Labro 2008 Hoozeacutee amp Bruggeman 2007)
These estimation issues did not arise in the comparative cost modelling of the case study
company as (i) it was a manufacturing organization (ii) it had ERP and MRP systems that
largely provided this time equivalence information and (iii) non-time‐ based drivers were used
(where appropriate) in the multi-driver application of the model (Appendix 1 Table 10)
8 Conclusion
From the comparative gross margin results presented using the case study data it appears
that ABC is superior to traditional volume-based cost allocation systems However the
multi-driver version of TDABC seems no different to ABC if standard-activity times are used
as cost drivers We also showed that attempting to simplify the stage 1 activity analysis stage
of ABC implementation (by using a single-volume related cost driver) ultimately makes
TDABC no different than traditional costing systems
Both ABC and TDABC models can provide two types of information for decision making(1) costs allocated to cost objects and (2) links between resource pools and cost pools
However they provide such information in different ways with different levels of accuracy
293 J Ratnatunga et al The International Journal of Accounting 47 (2012) 281 ndash 301
8202019 Ratnatunga Jurnal Case Study
httpslidepdfcomreaderfullratnatunga-jurnal-case-study 1421
The adoption of an activity-based paradigm (via either ABC or TDABC) enables cost
management systems to provide information on how operating activities add value to
organizational outputs through linkages between resource pools and cost pools With
information on costs allocated to cost objects management can manage product costs bychanging quantities of organizational outputs Management can also reduce product costs
by reducing or eliminating non‐value-added activities with this type of information
(Gosselin 1997)
While the TDABC model is designed to address implementation problems faced by the
ABC model the adoption of the model in the case study company did not help to alleviate the
country-independent stage 1 activity analysis complexities of an ABC implementation
especially if it tried to maintain the homogeneity condition Thus TDABC is unable to help
organizations solve implementation problems in a manner that will not compromise accuracy
If implementation problems are the only criterion for organizations to adopt a costing system
then adoption of TDABC will not alleviate this problem
In this study we did not test if TDABC can provide valuable information on idle resources
to support decision making (Kaplan amp Anderson 2007 Tse amp Gong 2009) Future research
could focus on testing the usefulness of TDABC in providing information on idle resources
Alternately it could determine if information on idle resources is useful for decision making
In summary this case study determines that the TDABC model is ABC in sheeps
clothing In its extreme form TDABC provides decision information as erroneous as that
produced by traditional volume allocations As such we predict that TDABC will result in
even fewer implementations sustaining than ABC has managed
Appendix 1
Table 1
Compariso Ltd income statement for 3rd quarter 2008
Sales $40000000
Less Cost of goods sold
Materials $8000000
Labor $7500000
Production overheadsDepreciation $7000000
Energy $2500000
Other Factory Costs $500000 $10000000
Total $25500000
Gross margin $14500000
Less Marketing expenses
Delivery expenses $400000
Sales commissions $2000000
After sales service $500000
Advertising amp promotions $2000000
Sales administration $1000000 $5900000
Less Administration expenses $3000000Total $8900000
Net income before tax $5600000
294 J Ratnatunga et al The International Journal of Accounting 47 (2012) 281 ndash 301
8202019 Ratnatunga Jurnal Case Study
httpslidepdfcomreaderfullratnatunga-jurnal-case-study 1521
Table 2
Sales and cost data for 2 product lines
Product lines Alpha Beta
Per unit data
Price $8000 $40000
Direct materials costs $2000 $12000
Direct wages $1500 $6000
Labor hours 1 4
Table 3
Product line gross margins under traditional absorption costing
Alpha Beta
Sales $2400000 $800000
Costs
Materials $600000 $240000
Labor $450000 $120000
Overheads $600000 $160000
$1650000 $520000
Gross margin $750000 $280000
Gross margin percent 3125 3500
Table 4
Production expenses
Activity cost pools Cost $
Purchasing 1200000
Materials handling and storage 1000000
Machine setup 1350000
Quality control 800000
Labor and other overhead 10650000Packaging 2500000
Table 5
Marketing expenses
Activity cost pools Cost $
Delivery expenses 400000Sales commission 2000000
After sales service 500000
295 J Ratnatunga et al The International Journal of Accounting 47 (2012) 281 ndash 301
8202019 Ratnatunga Jurnal Case Study
httpslidepdfcomreaderfullratnatunga-jurnal-case-study 1621
Table 6
Driver units
Activity cost drivers Driver units Std time in hours
per driver unit
Time equivalent
driver units
No of components used 5000000 NA NA
No of setups 9000 40000 36000
No of batches 3200 10000 3200
No labor hours 500000 10000 500000
No machine hours 500000 10000 500000
No of units 625000 NA NA
No of sales orders 4000 05000 2000
Sales dollars $40000000 NA NA
No of service calls 10000 10000 10000
Table 7
Cost per cost driver calculations under ABC
Activity cost pool Cost driver identified Resource costs Driver units Cost per
driver unit
Mat handling and storage No of components used $1000000 5000000 $020
Machine setup No of setups $1350000 9000 $15000
Quality control No of batches $800000 3200 $25000
Manufacturing No labor hours $10650000 500000 $2130
Packaging No machine hours $2500000 625000 $400Delivery expenses No of sales orders $400000 4000 $10000
Sales commissions Sales dollars $2000000 40000000 $005
After sales service No of service calls $500000 10000 $5000
Total costs allocated $20400000
Sustaining costs unallocated $4000000
Total production direct costs $8000000
Total costs $32400000
Table 8Cost driver data for 2 product lines under ABC
Product lines Alpha Beta All product lines
ABC cost drivers
No purchase orders 200 200 3000
No of components used 450000 100000 5000000
No of setups 50 1000 9000
No of batches 50 200 3200
Total labor hours 30000 8000 500000
Total machine hours 30000 8000 500000
No of units produced and sold 30000 2000 625000
No of sales orders 300 400 4000Sales dollars $2400000 $800000 $40000000
No of service calls 50 500 10000
296 J Ratnatunga et al The International Journal of Accounting 47 (2012) 281 ndash 301
8202019 Ratnatunga Jurnal Case Study
httpslidepdfcomreaderfullratnatunga-jurnal-case-study 1721
Table 9
Product line gross margins under ABC absorption costing
Alpha Beta
units Price Value units Price Value
Sales 30000 $80 $2400000 2000 $400 $800000
Production costs
Direct materials 30000 $2000 $600000 2000 $120 $240000
Indirect costs Cost per
driver unit
Driver
units
Allocated
costs
Driver
units
Allocated
costs
Purchasing $40000 200 $80000 200 $80000
Mat handling and storage $020 450000 $90000 100000 $20000
Machine setup $15000 50 $7500 1000 $150000
Quality control $25000 50 $12500 200 $50000
Manufacturing $2130 30000 $639000 8000 $170400
Packaging $400 30000 $120000 2000 $8000
Total production costs $1549000 $718400
Gross margin $851000 $81600
Marketing costs
Delivery expenses $10000 300 $30000 400 $40000
Sales commissions $005 $2400000 $120000 $800000 $40000
After sales service $5000 50 $2500 500 $25000
Total $152500 $105000
Net income $698500 ($23400)Gross margin percent 3546 1020
Net margin percent 2910 -293
Table 10
Cost per cost driver calculations under TDABC (multi-driver) variant)
Activity cost pool Cost driver identified Resource costs Driver units Cost per
driver unit
Mat handling and storage No of components used $1000000 5000000 $020
Machine setup Time per setup $1350000 36000 $3750
Quality control Time per batch $800000 3200 $25000
Manufacturing No machine hours $10650000 500000 $2130
Packaging No of units $2500000 625000 $400
Delivery expenses Time per sales order $400000 2000 $20000
Sales commissions Sales dollars $2000000 40000000 $005
After sales service Time per Service Call $500000 10000 $5000
Total costs allocated $20400000
Sustaining costs unallocated $4000000Total production direct costs $8000000
Total costs $32400000
297 J Ratnatunga et al The International Journal of Accounting 47 (2012) 281 ndash 301
8202019 Ratnatunga Jurnal Case Study
httpslidepdfcomreaderfullratnatunga-jurnal-case-study 1821
Table 11
Product line gross margins under TDABC absorption costing (multi-driver variant)
Alpha Beta
units Price Value units Price Value
Sales 30000 $80 $2400000 2000 $400 $800000
Production costs
Direct materials 30000 $2000 $600000 2000 $120 $240000
Indirect costs Cost per
driver unit
Driver
units
Allocated
costs
Driver
units
Allocated
costs
Purchasing $80000 100 $80000 100 $80000
Mat handling and storage $020 450000 $90000 100000 $20000
Machine setup $3750 200 $7500 4000 $150000
Quality control $25000 50 $12500 200 $50000
Manufacturing $2130 30000 $639000 8000 $170400
Packaging $400 30000 $120000 2000 $8000
Total production costs $1549000 $718400
Gross margin $851000 $81600
Marketing costs
Delivery expenses $20000 150 $30000 200 $40000
Sales commissions $005 $2400000 $120000 $800000 $40000
After sales service $5000 50 $2500 500 $25000
Total $152500 $105000
Net income $698500 ($23400)Gross margin percent 3546 1020
Net margin percent 2910 -293
Table 12
Cost per cost driver calculations under lsquosingle-driver rsquo TDABC
Activity cost pool Cost driver identified Resource costs Driver units Cost per
driver unit
Mat handling and storage No labor hours $1000000 500000 $200
Machine setup No labor hours $1350000 500000 $270
Quality control No labor hours $800000 500000 $160
Manufacturing No labor hours $10650000 500000 $2130
Packaging No labor hours $2500000 500000 $500
Total factory resource cost $17500000 $3500
Delivery expenses Sales dollars $400000 40000000 $001
Sales commissions Sales dollars $2000000 40000000 $005
After sales service Sales dollars $500000 40000000 $001
Total costs allocated $20400000
Sustaining costs unallocated $4000000Total production direct costs $8000000
Total costs $32400000
298 J Ratnatunga et al The International Journal of Accounting 47 (2012) 281 ndash 301
8202019 Ratnatunga Jurnal Case Study
httpslidepdfcomreaderfullratnatunga-jurnal-case-study 1921
References
Anderson S W (1995) A Framework for assessing cost management system changes The case of activity-based
costing implementation at general motors 1986ndash1993 Journal of Management Accounting Research 7
1ndash51
Anderson S W (2007) Managing Costs and Cost Structure throughout the Value Chain Research on Strategic
Cost Management In C S Chapman A G Hopwood amp M D Shield (Eds) Handbook of Management
Accounting Research Vol 2 (pp 481ndash506) Oxford Elsevier
Baird K M Harrison G L amp Reeve R C (2004) Adoption of activity management practices A note on the
extent of adoption and the influence of organizational and cultural factors Management Accounting Research
15(4) 393ndash399
Barrett R (2005) Time-Driven Costing The Bottom Line on the New ABC Business Performance Management
35ndash39
Bruggeman W Everaert P Levant Y Saens G amp Anderson S (2008) Cost modelling in logistics using
time-driven ABC Experiences from a wholesaler International Journal of Physical Distribution amp Logistics
Management 38(3) 172ndash191
Byrne S Stower E amp Torry P (2009) Is ABC adoption a success in Australia Journal of Applied Management Accounting Research 7 (1) 37ndash52
Cardinaels E amp Labro E (2008) On the determinants of measurement error in time driven costing Accounting
Review 83(3) 735ndash756
Table 13
Product line gross margins under lsquosingle-diver rsquo TDABC absorption costing
Alpha Beta
units Price Value units Price Value
Sales 30000 $80 $2400000 2000 $400 $800000
Production costs
Direct materials 30000 $2000 $600000 2000 $120 $240000
Indirect costs Cost per
driver unit
Driver
units
Allocated
costs
Driver
units
Allocated
costs
Purchasing $240 30000 $72000 8000 $19200
Mat handling amp storage $200 30000 $60000 8000 $16000
Machine setup $270 30000 $81000 8000 $21600
Quality control $160 30000 $48000 8000 $12800
Manufacturing $2130 30000 $639000 8000 $170400
Packaging $500 30000 $150000 8000 $40000
Total production costs $1650000 $520000
Gross margin $750000 $280000
Marketing costs
Delivery expenses $001 2400000 $24000 800000 $8000
Sales commissions $005 2400000 $120000 800000 $40000
After sales service $001 2400000 $30000 800000 $10000
Total $174000 $58000
Net income $576000 $222000Gross margin percent 3125 3500
Net margin percent 2400 2775
299 J Ratnatunga et al The International Journal of Accounting 47 (2012) 281 ndash 301
8202019 Ratnatunga Jurnal Case Study
httpslidepdfcomreaderfullratnatunga-jurnal-case-study 2021
Cobb I Innes J amp Mitchell F (1992) Activity-based costing-problems in practice London CIMA
Cohen S Venieris G amp Kaimenaki E (2005) ABC Adopters supporters deniers and unawares Managerial
Auditing Journal 20(9) 981ndash1000
Cooper R (1987) Does your company need a new cost system Journal of Cost Management 1(1) 45ndash49
Cooper R (1997 Autumn) The two-stage procedure in cost accounting Part two Journal of Cost Management 39ndash45
Cooper R amp Kaplan R S (1988) Measure Costs Right Make the Right Decisions Harvard Business Review
66 (9) 96ndash103
Cooper R amp Kaplan R S (1991) Design of cost management systems Text cases and readings NJ
Prentice-Hall Englewood Cliffs
Cooper R amp Kaplan R S (1992) Activity based systems Measuring the costs of resource usage Accounting
Horizons 6 (3) 1ndash13
Cotton W Jackson S amp Brown R (2003) Note on a New Zealand replication of the Innes et al UK
activity-based costing survey Management Accounting Research 14(1) 67ndash72
Drury C (1990) Product costing in the 1990s Accountancy 1990 123ndash126
Everaert P amp Bruggeman W (2007) Time-driven activity-based costing exploring the underlying model Cost
Management 21(2) 16ndash
20Foster G amp Swenson D W (1997) Measuring the success of activity-based cost management and its
determinants Journal of Management Accounting Research 9 109ndash141
Gervais M (2005) Controcircle de Gestion (8th ed) Paris Economica
Gosselin M (1997) The effect of strategy and organizational structure on the adoption and implementation of
activity-based costing Accounting Organizations and Society 22(2) 105ndash122
Gosselin M (2007) A review of activity-based costing Technique implementation and consequences In C S
Chapman A G Hopwood amp M D Shield (Eds) Handbook of Management Accounting Research Vol 2
(pp 641ndash672) Oxford Elsevier
Hoozeacutee S amp Bruggeman W (2007) Time-driven activity-based costing Exploring the underlying model Cost
Management 21(2) 16ndash20
Hoozeacutee S amp Bruggeman W (2010) Identifying operating improvements during the design process of a
time-driven ABC system The role of collective worker participation and leadership style Management Accounting Research 21(3) 185ndash198
Horngren C T (2004) Management accounting Some comments Journal of Management Accounting
Research 16 207ndash211
Innes J Mitchel F amp Sinclair D (2000) Activity-based costing in the UKs largest companies A comparison
of 1994 and 1999 survey results Management Accounting Research 11(3) 349ndash362
Johnson H T amp Kaplan R S (1987) Relevance Lost The Rise and Fall of Management Accounting
Cambridge USA Harvard Business School Press
Kaplan R S amp Anderson S R (2003) Time-driven activity-based costing White paper presented at the First
European Summit on Time-Driven Activity-Based Costing Available from httpwwwhbseduresearch
facpubsworkingpaperspapers2030404-045pdf (Accessed 3 December 2010)
Kaplan R S amp Anderson S R (2004) Time-Driven Activity-Based Costing Harvard Business Review 82(11)
131ndash138
Kaplan R S amp Anderson S R (2007) The innovation of time-driven activity-based costing Cost Management
21(2) 5ndash15
Kiani R amp Sangeladji M (2003) An empirical study about the use of the ABCABM models by some of the
Fortune 500 largest industrial corporations in the USA Journal of American Academy of Business Cambridge
3(1ndash2) 174ndash182
Krumwiede K R (1998) The implementation stages of activity-based costing and the impact of contextual and
organizational factors Journal of Management Accounting Research 10 239ndash277
Levant Y amp Zimnovitch H (2008) An ill-known facet to the history of cost calculation The methods of
equivalence 20th Annual Conference of the Business History Research Unit Cardiff Business School (10ndash
11th September)
Malmi T (1997) Towards explaining activity-based costing failure Accounting and control in a decentralisedorganisation Management Accounting Research 8(4) 459ndash480
McDonach C amp Mattimore R (2008) Strategic applications of time driven ABC in the service sector Lessons from
Irish SME Rotterdam Communication at the 31st Annual Congress of the European Accounting Association
300 J Ratnatunga et al The International Journal of Accounting 47 (2012) 281 ndash 301
8202019 Ratnatunga Jurnal Case Study
httpslidepdfcomreaderfullratnatunga-jurnal-case-study 2121
McGowan A S amp Klammer T P (1997) Satisfaction with activity-based cost management implementation
Journal of Management Accounting Research 9 217ndash238
McNair C J (2007) Beyond the boundaries Future trends in cost management Cost Management 21(1) 10ndash21
Nguyen H V amp Brooks A (1997) An empirical investigation of adoption issues relating to activity-based
costing Asian Review of Accounting 5(1) 1ndash18
OConnor N G Deng J amp Luo Y (2006) Political constraints organization design and performance
measurement in Chinas state-owned enterprises Accounting Organizations and Society 31(2) 157ndash177
Pernot E Roodhooft F amp van den Abbeele A (2007) Time-driven activity-based costing for inter-library
services A case study in a university Journal of Academic of Librarianship 33(5) 551ndash560
Ratnatunga J (1983) Financial Controls in Marketing The Accounting-Marketing Interface Canberra Series in
Administrative Studies Monograph No 6 Canberra CAE Canberra Australia
Robinson M A (1990) Contribution margin analysis No longer relevant - strategic cost management the new
paradigm Journal of Management Accounting Research 2 1ndash32
Shank J (1989) Strategic cost management New wine or just new bottles Journal of Management Accounting
Research Fall 1(1) 47ndash65
Sharma R amp Ratnatunga J (1997) Traditional and activity based costing systems Accounting Education An International Journal 6 (4) 337ndash345
Sharman P A (2003) The case for management accounting Strategic Finance 85(4) 43ndash47
Shields M D (1995) An empirical analysis of firms implementation experiences with activity-based costing
Journal of Management Accounting Research 7 148ndash166
Shields M D Chow C W Kato Y amp Nakagawa Y (1991) Management accounting practices in the US and
Japan Comparative survey findings and research implications Journal of International Financial Management
and Accounting 3(1) 61ndash77
Sprinkle G B (2003) Perspectives on experimental research in managerial accounting Accounting Organizations
and Society 28(2ndash3) 287ndash318
Swenson D W (1995) The benefits of activity-based cost management to the manufacturing industry Journal of
Management Accounting Research 7 167ndash180
Tse M amp Gong M (2009) Recognition of idle resources in time-driven activity-based costing and resourceconsumption accounting models Journal of Applied Management Accounting Research 7 (2) 41ndash54
Williams J J amp Seaman A E (2001) Predicting changes in management accounting systems National culture
and industry effects Accounting Organizations and Society 26 (4ndash5) 443ndash460
301 J Ratnatunga et al The International Journal of Accounting 47 (2012) 281 ndash 301
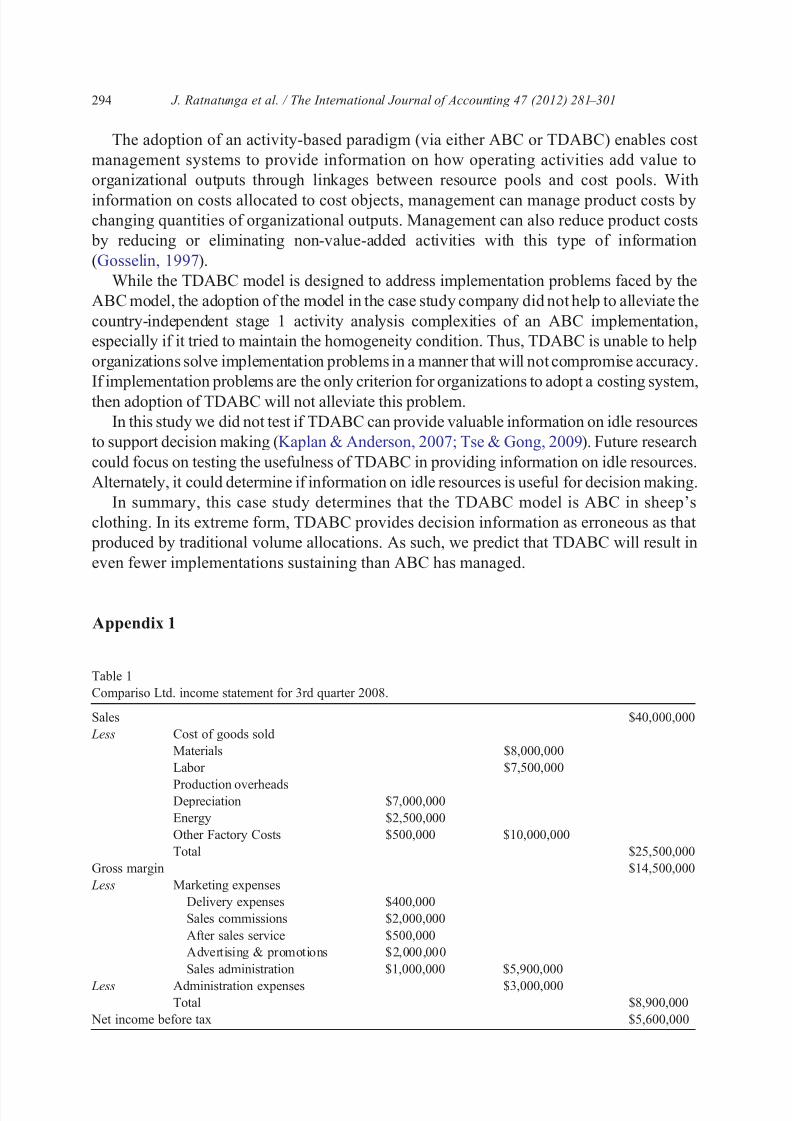
8202019 Ratnatunga Jurnal Case Study
httpslidepdfcomreaderfullratnatunga-jurnal-case-study 1521
Table 2
Sales and cost data for 2 product lines
Product lines Alpha Beta
Per unit data
Price $8000 $40000
Direct materials costs $2000 $12000
Direct wages $1500 $6000
Labor hours 1 4
Table 3
Product line gross margins under traditional absorption costing
Alpha Beta
Sales $2400000 $800000
Costs
Materials $600000 $240000
Labor $450000 $120000
Overheads $600000 $160000
$1650000 $520000
Gross margin $750000 $280000
Gross margin percent 3125 3500
Table 4
Production expenses
Activity cost pools Cost $
Purchasing 1200000
Materials handling and storage 1000000
Machine setup 1350000
Quality control 800000
Labor and other overhead 10650000Packaging 2500000
Table 5
Marketing expenses
Activity cost pools Cost $
Delivery expenses 400000Sales commission 2000000
After sales service 500000
295 J Ratnatunga et al The International Journal of Accounting 47 (2012) 281 ndash 301
8202019 Ratnatunga Jurnal Case Study
httpslidepdfcomreaderfullratnatunga-jurnal-case-study 1621
Table 6
Driver units
Activity cost drivers Driver units Std time in hours
per driver unit
Time equivalent
driver units
No of components used 5000000 NA NA
No of setups 9000 40000 36000
No of batches 3200 10000 3200
No labor hours 500000 10000 500000
No machine hours 500000 10000 500000
No of units 625000 NA NA
No of sales orders 4000 05000 2000
Sales dollars $40000000 NA NA
No of service calls 10000 10000 10000
Table 7
Cost per cost driver calculations under ABC
Activity cost pool Cost driver identified Resource costs Driver units Cost per
driver unit
Mat handling and storage No of components used $1000000 5000000 $020
Machine setup No of setups $1350000 9000 $15000
Quality control No of batches $800000 3200 $25000
Manufacturing No labor hours $10650000 500000 $2130
Packaging No machine hours $2500000 625000 $400Delivery expenses No of sales orders $400000 4000 $10000
Sales commissions Sales dollars $2000000 40000000 $005
After sales service No of service calls $500000 10000 $5000
Total costs allocated $20400000
Sustaining costs unallocated $4000000
Total production direct costs $8000000
Total costs $32400000
Table 8Cost driver data for 2 product lines under ABC
Product lines Alpha Beta All product lines
ABC cost drivers
No purchase orders 200 200 3000
No of components used 450000 100000 5000000
No of setups 50 1000 9000
No of batches 50 200 3200
Total labor hours 30000 8000 500000
Total machine hours 30000 8000 500000
No of units produced and sold 30000 2000 625000
No of sales orders 300 400 4000Sales dollars $2400000 $800000 $40000000
No of service calls 50 500 10000
296 J Ratnatunga et al The International Journal of Accounting 47 (2012) 281 ndash 301
8202019 Ratnatunga Jurnal Case Study
httpslidepdfcomreaderfullratnatunga-jurnal-case-study 1721
Table 9
Product line gross margins under ABC absorption costing
Alpha Beta
units Price Value units Price Value
Sales 30000 $80 $2400000 2000 $400 $800000
Production costs
Direct materials 30000 $2000 $600000 2000 $120 $240000
Indirect costs Cost per
driver unit
Driver
units
Allocated
costs
Driver
units
Allocated
costs
Purchasing $40000 200 $80000 200 $80000
Mat handling and storage $020 450000 $90000 100000 $20000
Machine setup $15000 50 $7500 1000 $150000
Quality control $25000 50 $12500 200 $50000
Manufacturing $2130 30000 $639000 8000 $170400
Packaging $400 30000 $120000 2000 $8000
Total production costs $1549000 $718400
Gross margin $851000 $81600
Marketing costs
Delivery expenses $10000 300 $30000 400 $40000
Sales commissions $005 $2400000 $120000 $800000 $40000
After sales service $5000 50 $2500 500 $25000
Total $152500 $105000
Net income $698500 ($23400)Gross margin percent 3546 1020
Net margin percent 2910 -293
Table 10
Cost per cost driver calculations under TDABC (multi-driver) variant)
Activity cost pool Cost driver identified Resource costs Driver units Cost per
driver unit
Mat handling and storage No of components used $1000000 5000000 $020
Machine setup Time per setup $1350000 36000 $3750
Quality control Time per batch $800000 3200 $25000
Manufacturing No machine hours $10650000 500000 $2130
Packaging No of units $2500000 625000 $400
Delivery expenses Time per sales order $400000 2000 $20000
Sales commissions Sales dollars $2000000 40000000 $005
After sales service Time per Service Call $500000 10000 $5000
Total costs allocated $20400000
Sustaining costs unallocated $4000000Total production direct costs $8000000
Total costs $32400000
297 J Ratnatunga et al The International Journal of Accounting 47 (2012) 281 ndash 301
8202019 Ratnatunga Jurnal Case Study
httpslidepdfcomreaderfullratnatunga-jurnal-case-study 1821
Table 11
Product line gross margins under TDABC absorption costing (multi-driver variant)
Alpha Beta
units Price Value units Price Value
Sales 30000 $80 $2400000 2000 $400 $800000
Production costs
Direct materials 30000 $2000 $600000 2000 $120 $240000
Indirect costs Cost per
driver unit
Driver
units
Allocated
costs
Driver
units
Allocated
costs
Purchasing $80000 100 $80000 100 $80000
Mat handling and storage $020 450000 $90000 100000 $20000
Machine setup $3750 200 $7500 4000 $150000
Quality control $25000 50 $12500 200 $50000
Manufacturing $2130 30000 $639000 8000 $170400
Packaging $400 30000 $120000 2000 $8000
Total production costs $1549000 $718400
Gross margin $851000 $81600
Marketing costs
Delivery expenses $20000 150 $30000 200 $40000
Sales commissions $005 $2400000 $120000 $800000 $40000
After sales service $5000 50 $2500 500 $25000
Total $152500 $105000
Net income $698500 ($23400)Gross margin percent 3546 1020
Net margin percent 2910 -293
Table 12
Cost per cost driver calculations under lsquosingle-driver rsquo TDABC
Activity cost pool Cost driver identified Resource costs Driver units Cost per
driver unit
Mat handling and storage No labor hours $1000000 500000 $200
Machine setup No labor hours $1350000 500000 $270
Quality control No labor hours $800000 500000 $160
Manufacturing No labor hours $10650000 500000 $2130
Packaging No labor hours $2500000 500000 $500
Total factory resource cost $17500000 $3500
Delivery expenses Sales dollars $400000 40000000 $001
Sales commissions Sales dollars $2000000 40000000 $005
After sales service Sales dollars $500000 40000000 $001
Total costs allocated $20400000
Sustaining costs unallocated $4000000Total production direct costs $8000000
Total costs $32400000
298 J Ratnatunga et al The International Journal of Accounting 47 (2012) 281 ndash 301
8202019 Ratnatunga Jurnal Case Study
httpslidepdfcomreaderfullratnatunga-jurnal-case-study 1921
References
Anderson S W (1995) A Framework for assessing cost management system changes The case of activity-based
costing implementation at general motors 1986ndash1993 Journal of Management Accounting Research 7
1ndash51
Anderson S W (2007) Managing Costs and Cost Structure throughout the Value Chain Research on Strategic
Cost Management In C S Chapman A G Hopwood amp M D Shield (Eds) Handbook of Management
Accounting Research Vol 2 (pp 481ndash506) Oxford Elsevier
Baird K M Harrison G L amp Reeve R C (2004) Adoption of activity management practices A note on the
extent of adoption and the influence of organizational and cultural factors Management Accounting Research
15(4) 393ndash399
Barrett R (2005) Time-Driven Costing The Bottom Line on the New ABC Business Performance Management
35ndash39
Bruggeman W Everaert P Levant Y Saens G amp Anderson S (2008) Cost modelling in logistics using
time-driven ABC Experiences from a wholesaler International Journal of Physical Distribution amp Logistics
Management 38(3) 172ndash191
Byrne S Stower E amp Torry P (2009) Is ABC adoption a success in Australia Journal of Applied Management Accounting Research 7 (1) 37ndash52
Cardinaels E amp Labro E (2008) On the determinants of measurement error in time driven costing Accounting
Review 83(3) 735ndash756
Table 13
Product line gross margins under lsquosingle-diver rsquo TDABC absorption costing
Alpha Beta
units Price Value units Price Value
Sales 30000 $80 $2400000 2000 $400 $800000
Production costs
Direct materials 30000 $2000 $600000 2000 $120 $240000
Indirect costs Cost per
driver unit
Driver
units
Allocated
costs
Driver
units
Allocated
costs
Purchasing $240 30000 $72000 8000 $19200
Mat handling amp storage $200 30000 $60000 8000 $16000
Machine setup $270 30000 $81000 8000 $21600
Quality control $160 30000 $48000 8000 $12800
Manufacturing $2130 30000 $639000 8000 $170400
Packaging $500 30000 $150000 8000 $40000
Total production costs $1650000 $520000
Gross margin $750000 $280000
Marketing costs
Delivery expenses $001 2400000 $24000 800000 $8000
Sales commissions $005 2400000 $120000 800000 $40000
After sales service $001 2400000 $30000 800000 $10000
Total $174000 $58000
Net income $576000 $222000Gross margin percent 3125 3500
Net margin percent 2400 2775
299 J Ratnatunga et al The International Journal of Accounting 47 (2012) 281 ndash 301
8202019 Ratnatunga Jurnal Case Study
httpslidepdfcomreaderfullratnatunga-jurnal-case-study 2021
Cobb I Innes J amp Mitchell F (1992) Activity-based costing-problems in practice London CIMA
Cohen S Venieris G amp Kaimenaki E (2005) ABC Adopters supporters deniers and unawares Managerial
Auditing Journal 20(9) 981ndash1000
Cooper R (1987) Does your company need a new cost system Journal of Cost Management 1(1) 45ndash49
Cooper R (1997 Autumn) The two-stage procedure in cost accounting Part two Journal of Cost Management 39ndash45
Cooper R amp Kaplan R S (1988) Measure Costs Right Make the Right Decisions Harvard Business Review
66 (9) 96ndash103
Cooper R amp Kaplan R S (1991) Design of cost management systems Text cases and readings NJ
Prentice-Hall Englewood Cliffs
Cooper R amp Kaplan R S (1992) Activity based systems Measuring the costs of resource usage Accounting
Horizons 6 (3) 1ndash13
Cotton W Jackson S amp Brown R (2003) Note on a New Zealand replication of the Innes et al UK
activity-based costing survey Management Accounting Research 14(1) 67ndash72
Drury C (1990) Product costing in the 1990s Accountancy 1990 123ndash126
Everaert P amp Bruggeman W (2007) Time-driven activity-based costing exploring the underlying model Cost
Management 21(2) 16ndash
20Foster G amp Swenson D W (1997) Measuring the success of activity-based cost management and its
determinants Journal of Management Accounting Research 9 109ndash141
Gervais M (2005) Controcircle de Gestion (8th ed) Paris Economica
Gosselin M (1997) The effect of strategy and organizational structure on the adoption and implementation of
activity-based costing Accounting Organizations and Society 22(2) 105ndash122
Gosselin M (2007) A review of activity-based costing Technique implementation and consequences In C S
Chapman A G Hopwood amp M D Shield (Eds) Handbook of Management Accounting Research Vol 2
(pp 641ndash672) Oxford Elsevier
Hoozeacutee S amp Bruggeman W (2007) Time-driven activity-based costing Exploring the underlying model Cost
Management 21(2) 16ndash20
Hoozeacutee S amp Bruggeman W (2010) Identifying operating improvements during the design process of a
time-driven ABC system The role of collective worker participation and leadership style Management Accounting Research 21(3) 185ndash198
Horngren C T (2004) Management accounting Some comments Journal of Management Accounting
Research 16 207ndash211
Innes J Mitchel F amp Sinclair D (2000) Activity-based costing in the UKs largest companies A comparison
of 1994 and 1999 survey results Management Accounting Research 11(3) 349ndash362
Johnson H T amp Kaplan R S (1987) Relevance Lost The Rise and Fall of Management Accounting
Cambridge USA Harvard Business School Press
Kaplan R S amp Anderson S R (2003) Time-driven activity-based costing White paper presented at the First
European Summit on Time-Driven Activity-Based Costing Available from httpwwwhbseduresearch
facpubsworkingpaperspapers2030404-045pdf (Accessed 3 December 2010)
Kaplan R S amp Anderson S R (2004) Time-Driven Activity-Based Costing Harvard Business Review 82(11)
131ndash138
Kaplan R S amp Anderson S R (2007) The innovation of time-driven activity-based costing Cost Management
21(2) 5ndash15
Kiani R amp Sangeladji M (2003) An empirical study about the use of the ABCABM models by some of the
Fortune 500 largest industrial corporations in the USA Journal of American Academy of Business Cambridge
3(1ndash2) 174ndash182
Krumwiede K R (1998) The implementation stages of activity-based costing and the impact of contextual and
organizational factors Journal of Management Accounting Research 10 239ndash277
Levant Y amp Zimnovitch H (2008) An ill-known facet to the history of cost calculation The methods of
equivalence 20th Annual Conference of the Business History Research Unit Cardiff Business School (10ndash
11th September)
Malmi T (1997) Towards explaining activity-based costing failure Accounting and control in a decentralisedorganisation Management Accounting Research 8(4) 459ndash480
McDonach C amp Mattimore R (2008) Strategic applications of time driven ABC in the service sector Lessons from
Irish SME Rotterdam Communication at the 31st Annual Congress of the European Accounting Association
300 J Ratnatunga et al The International Journal of Accounting 47 (2012) 281 ndash 301
8202019 Ratnatunga Jurnal Case Study
httpslidepdfcomreaderfullratnatunga-jurnal-case-study 2121
McGowan A S amp Klammer T P (1997) Satisfaction with activity-based cost management implementation
Journal of Management Accounting Research 9 217ndash238
McNair C J (2007) Beyond the boundaries Future trends in cost management Cost Management 21(1) 10ndash21
Nguyen H V amp Brooks A (1997) An empirical investigation of adoption issues relating to activity-based
costing Asian Review of Accounting 5(1) 1ndash18
OConnor N G Deng J amp Luo Y (2006) Political constraints organization design and performance
measurement in Chinas state-owned enterprises Accounting Organizations and Society 31(2) 157ndash177
Pernot E Roodhooft F amp van den Abbeele A (2007) Time-driven activity-based costing for inter-library
services A case study in a university Journal of Academic of Librarianship 33(5) 551ndash560
Ratnatunga J (1983) Financial Controls in Marketing The Accounting-Marketing Interface Canberra Series in
Administrative Studies Monograph No 6 Canberra CAE Canberra Australia
Robinson M A (1990) Contribution margin analysis No longer relevant - strategic cost management the new
paradigm Journal of Management Accounting Research 2 1ndash32
Shank J (1989) Strategic cost management New wine or just new bottles Journal of Management Accounting
Research Fall 1(1) 47ndash65
Sharma R amp Ratnatunga J (1997) Traditional and activity based costing systems Accounting Education An International Journal 6 (4) 337ndash345
Sharman P A (2003) The case for management accounting Strategic Finance 85(4) 43ndash47
Shields M D (1995) An empirical analysis of firms implementation experiences with activity-based costing
Journal of Management Accounting Research 7 148ndash166
Shields M D Chow C W Kato Y amp Nakagawa Y (1991) Management accounting practices in the US and
Japan Comparative survey findings and research implications Journal of International Financial Management
and Accounting 3(1) 61ndash77
Sprinkle G B (2003) Perspectives on experimental research in managerial accounting Accounting Organizations
and Society 28(2ndash3) 287ndash318
Swenson D W (1995) The benefits of activity-based cost management to the manufacturing industry Journal of
Management Accounting Research 7 167ndash180
Tse M amp Gong M (2009) Recognition of idle resources in time-driven activity-based costing and resourceconsumption accounting models Journal of Applied Management Accounting Research 7 (2) 41ndash54
Williams J J amp Seaman A E (2001) Predicting changes in management accounting systems National culture
and industry effects Accounting Organizations and Society 26 (4ndash5) 443ndash460
301 J Ratnatunga et al The International Journal of Accounting 47 (2012) 281 ndash 301
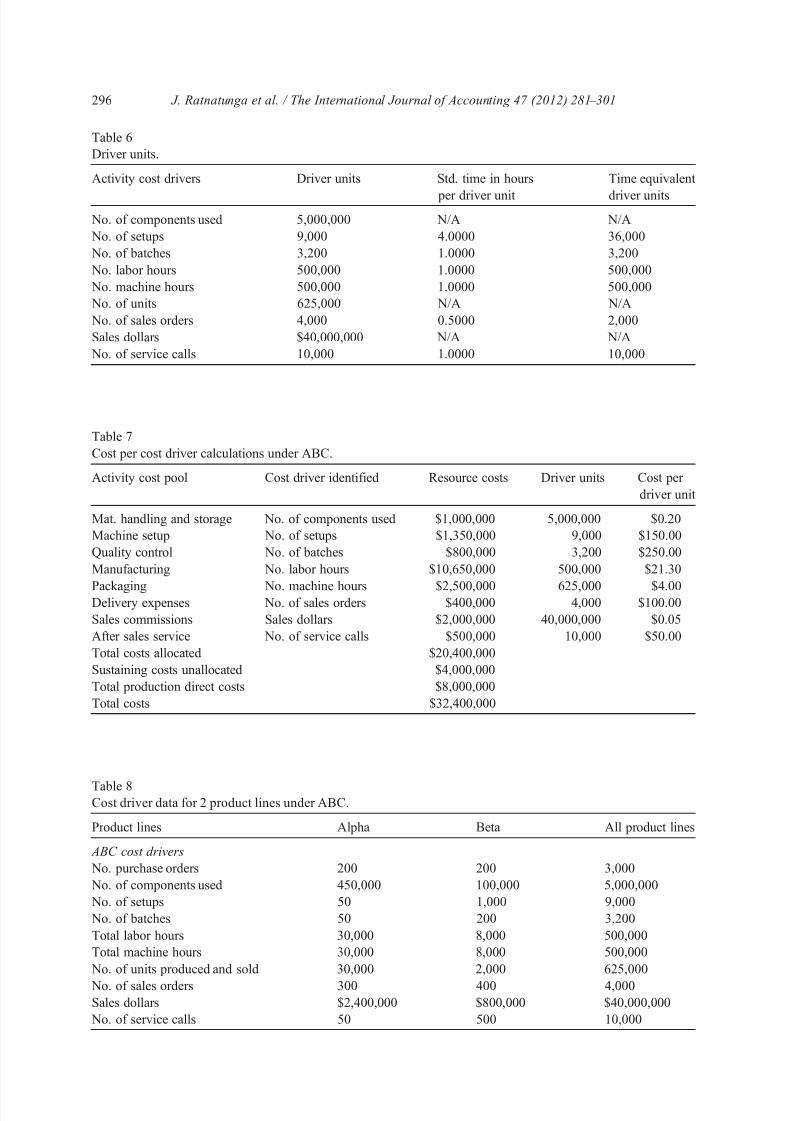
8202019 Ratnatunga Jurnal Case Study
httpslidepdfcomreaderfullratnatunga-jurnal-case-study 1621
Table 6
Driver units
Activity cost drivers Driver units Std time in hours
per driver unit
Time equivalent
driver units
No of components used 5000000 NA NA
No of setups 9000 40000 36000
No of batches 3200 10000 3200
No labor hours 500000 10000 500000
No machine hours 500000 10000 500000
No of units 625000 NA NA
No of sales orders 4000 05000 2000
Sales dollars $40000000 NA NA
No of service calls 10000 10000 10000
Table 7
Cost per cost driver calculations under ABC
Activity cost pool Cost driver identified Resource costs Driver units Cost per
driver unit
Mat handling and storage No of components used $1000000 5000000 $020
Machine setup No of setups $1350000 9000 $15000
Quality control No of batches $800000 3200 $25000
Manufacturing No labor hours $10650000 500000 $2130
Packaging No machine hours $2500000 625000 $400Delivery expenses No of sales orders $400000 4000 $10000
Sales commissions Sales dollars $2000000 40000000 $005
After sales service No of service calls $500000 10000 $5000
Total costs allocated $20400000
Sustaining costs unallocated $4000000
Total production direct costs $8000000
Total costs $32400000
Table 8Cost driver data for 2 product lines under ABC
Product lines Alpha Beta All product lines
ABC cost drivers
No purchase orders 200 200 3000
No of components used 450000 100000 5000000
No of setups 50 1000 9000
No of batches 50 200 3200
Total labor hours 30000 8000 500000
Total machine hours 30000 8000 500000
No of units produced and sold 30000 2000 625000
No of sales orders 300 400 4000Sales dollars $2400000 $800000 $40000000
No of service calls 50 500 10000
296 J Ratnatunga et al The International Journal of Accounting 47 (2012) 281 ndash 301
8202019 Ratnatunga Jurnal Case Study
httpslidepdfcomreaderfullratnatunga-jurnal-case-study 1721
Table 9
Product line gross margins under ABC absorption costing
Alpha Beta
units Price Value units Price Value
Sales 30000 $80 $2400000 2000 $400 $800000
Production costs
Direct materials 30000 $2000 $600000 2000 $120 $240000
Indirect costs Cost per
driver unit
Driver
units
Allocated
costs
Driver
units
Allocated
costs
Purchasing $40000 200 $80000 200 $80000
Mat handling and storage $020 450000 $90000 100000 $20000
Machine setup $15000 50 $7500 1000 $150000
Quality control $25000 50 $12500 200 $50000
Manufacturing $2130 30000 $639000 8000 $170400
Packaging $400 30000 $120000 2000 $8000
Total production costs $1549000 $718400
Gross margin $851000 $81600
Marketing costs
Delivery expenses $10000 300 $30000 400 $40000
Sales commissions $005 $2400000 $120000 $800000 $40000
After sales service $5000 50 $2500 500 $25000
Total $152500 $105000
Net income $698500 ($23400)Gross margin percent 3546 1020
Net margin percent 2910 -293
Table 10
Cost per cost driver calculations under TDABC (multi-driver) variant)
Activity cost pool Cost driver identified Resource costs Driver units Cost per
driver unit
Mat handling and storage No of components used $1000000 5000000 $020
Machine setup Time per setup $1350000 36000 $3750
Quality control Time per batch $800000 3200 $25000
Manufacturing No machine hours $10650000 500000 $2130
Packaging No of units $2500000 625000 $400
Delivery expenses Time per sales order $400000 2000 $20000
Sales commissions Sales dollars $2000000 40000000 $005
After sales service Time per Service Call $500000 10000 $5000
Total costs allocated $20400000
Sustaining costs unallocated $4000000Total production direct costs $8000000
Total costs $32400000
297 J Ratnatunga et al The International Journal of Accounting 47 (2012) 281 ndash 301
8202019 Ratnatunga Jurnal Case Study
httpslidepdfcomreaderfullratnatunga-jurnal-case-study 1821
Table 11
Product line gross margins under TDABC absorption costing (multi-driver variant)
Alpha Beta
units Price Value units Price Value
Sales 30000 $80 $2400000 2000 $400 $800000
Production costs
Direct materials 30000 $2000 $600000 2000 $120 $240000
Indirect costs Cost per
driver unit
Driver
units
Allocated
costs
Driver
units
Allocated
costs
Purchasing $80000 100 $80000 100 $80000
Mat handling and storage $020 450000 $90000 100000 $20000
Machine setup $3750 200 $7500 4000 $150000
Quality control $25000 50 $12500 200 $50000
Manufacturing $2130 30000 $639000 8000 $170400
Packaging $400 30000 $120000 2000 $8000
Total production costs $1549000 $718400
Gross margin $851000 $81600
Marketing costs
Delivery expenses $20000 150 $30000 200 $40000
Sales commissions $005 $2400000 $120000 $800000 $40000
After sales service $5000 50 $2500 500 $25000
Total $152500 $105000
Net income $698500 ($23400)Gross margin percent 3546 1020
Net margin percent 2910 -293
Table 12
Cost per cost driver calculations under lsquosingle-driver rsquo TDABC
Activity cost pool Cost driver identified Resource costs Driver units Cost per
driver unit
Mat handling and storage No labor hours $1000000 500000 $200
Machine setup No labor hours $1350000 500000 $270
Quality control No labor hours $800000 500000 $160
Manufacturing No labor hours $10650000 500000 $2130
Packaging No labor hours $2500000 500000 $500
Total factory resource cost $17500000 $3500
Delivery expenses Sales dollars $400000 40000000 $001
Sales commissions Sales dollars $2000000 40000000 $005
After sales service Sales dollars $500000 40000000 $001
Total costs allocated $20400000
Sustaining costs unallocated $4000000Total production direct costs $8000000
Total costs $32400000
298 J Ratnatunga et al The International Journal of Accounting 47 (2012) 281 ndash 301
8202019 Ratnatunga Jurnal Case Study
httpslidepdfcomreaderfullratnatunga-jurnal-case-study 1921
References
Anderson S W (1995) A Framework for assessing cost management system changes The case of activity-based
costing implementation at general motors 1986ndash1993 Journal of Management Accounting Research 7
1ndash51
Anderson S W (2007) Managing Costs and Cost Structure throughout the Value Chain Research on Strategic
Cost Management In C S Chapman A G Hopwood amp M D Shield (Eds) Handbook of Management
Accounting Research Vol 2 (pp 481ndash506) Oxford Elsevier
Baird K M Harrison G L amp Reeve R C (2004) Adoption of activity management practices A note on the
extent of adoption and the influence of organizational and cultural factors Management Accounting Research
15(4) 393ndash399
Barrett R (2005) Time-Driven Costing The Bottom Line on the New ABC Business Performance Management
35ndash39
Bruggeman W Everaert P Levant Y Saens G amp Anderson S (2008) Cost modelling in logistics using
time-driven ABC Experiences from a wholesaler International Journal of Physical Distribution amp Logistics
Management 38(3) 172ndash191
Byrne S Stower E amp Torry P (2009) Is ABC adoption a success in Australia Journal of Applied Management Accounting Research 7 (1) 37ndash52
Cardinaels E amp Labro E (2008) On the determinants of measurement error in time driven costing Accounting
Review 83(3) 735ndash756
Table 13
Product line gross margins under lsquosingle-diver rsquo TDABC absorption costing
Alpha Beta
units Price Value units Price Value
Sales 30000 $80 $2400000 2000 $400 $800000
Production costs
Direct materials 30000 $2000 $600000 2000 $120 $240000
Indirect costs Cost per
driver unit
Driver
units
Allocated
costs
Driver
units
Allocated
costs
Purchasing $240 30000 $72000 8000 $19200
Mat handling amp storage $200 30000 $60000 8000 $16000
Machine setup $270 30000 $81000 8000 $21600
Quality control $160 30000 $48000 8000 $12800
Manufacturing $2130 30000 $639000 8000 $170400
Packaging $500 30000 $150000 8000 $40000
Total production costs $1650000 $520000
Gross margin $750000 $280000
Marketing costs
Delivery expenses $001 2400000 $24000 800000 $8000
Sales commissions $005 2400000 $120000 800000 $40000
After sales service $001 2400000 $30000 800000 $10000
Total $174000 $58000
Net income $576000 $222000Gross margin percent 3125 3500
Net margin percent 2400 2775
299 J Ratnatunga et al The International Journal of Accounting 47 (2012) 281 ndash 301
8202019 Ratnatunga Jurnal Case Study
httpslidepdfcomreaderfullratnatunga-jurnal-case-study 2021
Cobb I Innes J amp Mitchell F (1992) Activity-based costing-problems in practice London CIMA
Cohen S Venieris G amp Kaimenaki E (2005) ABC Adopters supporters deniers and unawares Managerial
Auditing Journal 20(9) 981ndash1000
Cooper R (1987) Does your company need a new cost system Journal of Cost Management 1(1) 45ndash49
Cooper R (1997 Autumn) The two-stage procedure in cost accounting Part two Journal of Cost Management 39ndash45
Cooper R amp Kaplan R S (1988) Measure Costs Right Make the Right Decisions Harvard Business Review
66 (9) 96ndash103
Cooper R amp Kaplan R S (1991) Design of cost management systems Text cases and readings NJ
Prentice-Hall Englewood Cliffs
Cooper R amp Kaplan R S (1992) Activity based systems Measuring the costs of resource usage Accounting
Horizons 6 (3) 1ndash13
Cotton W Jackson S amp Brown R (2003) Note on a New Zealand replication of the Innes et al UK
activity-based costing survey Management Accounting Research 14(1) 67ndash72
Drury C (1990) Product costing in the 1990s Accountancy 1990 123ndash126
Everaert P amp Bruggeman W (2007) Time-driven activity-based costing exploring the underlying model Cost
Management 21(2) 16ndash
20Foster G amp Swenson D W (1997) Measuring the success of activity-based cost management and its
determinants Journal of Management Accounting Research 9 109ndash141
Gervais M (2005) Controcircle de Gestion (8th ed) Paris Economica
Gosselin M (1997) The effect of strategy and organizational structure on the adoption and implementation of
activity-based costing Accounting Organizations and Society 22(2) 105ndash122
Gosselin M (2007) A review of activity-based costing Technique implementation and consequences In C S
Chapman A G Hopwood amp M D Shield (Eds) Handbook of Management Accounting Research Vol 2
(pp 641ndash672) Oxford Elsevier
Hoozeacutee S amp Bruggeman W (2007) Time-driven activity-based costing Exploring the underlying model Cost
Management 21(2) 16ndash20
Hoozeacutee S amp Bruggeman W (2010) Identifying operating improvements during the design process of a
time-driven ABC system The role of collective worker participation and leadership style Management Accounting Research 21(3) 185ndash198
Horngren C T (2004) Management accounting Some comments Journal of Management Accounting
Research 16 207ndash211
Innes J Mitchel F amp Sinclair D (2000) Activity-based costing in the UKs largest companies A comparison
of 1994 and 1999 survey results Management Accounting Research 11(3) 349ndash362
Johnson H T amp Kaplan R S (1987) Relevance Lost The Rise and Fall of Management Accounting
Cambridge USA Harvard Business School Press
Kaplan R S amp Anderson S R (2003) Time-driven activity-based costing White paper presented at the First
European Summit on Time-Driven Activity-Based Costing Available from httpwwwhbseduresearch
facpubsworkingpaperspapers2030404-045pdf (Accessed 3 December 2010)
Kaplan R S amp Anderson S R (2004) Time-Driven Activity-Based Costing Harvard Business Review 82(11)
131ndash138
Kaplan R S amp Anderson S R (2007) The innovation of time-driven activity-based costing Cost Management
21(2) 5ndash15
Kiani R amp Sangeladji M (2003) An empirical study about the use of the ABCABM models by some of the
Fortune 500 largest industrial corporations in the USA Journal of American Academy of Business Cambridge
3(1ndash2) 174ndash182
Krumwiede K R (1998) The implementation stages of activity-based costing and the impact of contextual and
organizational factors Journal of Management Accounting Research 10 239ndash277
Levant Y amp Zimnovitch H (2008) An ill-known facet to the history of cost calculation The methods of
equivalence 20th Annual Conference of the Business History Research Unit Cardiff Business School (10ndash
11th September)
Malmi T (1997) Towards explaining activity-based costing failure Accounting and control in a decentralisedorganisation Management Accounting Research 8(4) 459ndash480
McDonach C amp Mattimore R (2008) Strategic applications of time driven ABC in the service sector Lessons from
Irish SME Rotterdam Communication at the 31st Annual Congress of the European Accounting Association
300 J Ratnatunga et al The International Journal of Accounting 47 (2012) 281 ndash 301
8202019 Ratnatunga Jurnal Case Study
httpslidepdfcomreaderfullratnatunga-jurnal-case-study 2121
McGowan A S amp Klammer T P (1997) Satisfaction with activity-based cost management implementation
Journal of Management Accounting Research 9 217ndash238
McNair C J (2007) Beyond the boundaries Future trends in cost management Cost Management 21(1) 10ndash21
Nguyen H V amp Brooks A (1997) An empirical investigation of adoption issues relating to activity-based
costing Asian Review of Accounting 5(1) 1ndash18
OConnor N G Deng J amp Luo Y (2006) Political constraints organization design and performance
measurement in Chinas state-owned enterprises Accounting Organizations and Society 31(2) 157ndash177
Pernot E Roodhooft F amp van den Abbeele A (2007) Time-driven activity-based costing for inter-library
services A case study in a university Journal of Academic of Librarianship 33(5) 551ndash560
Ratnatunga J (1983) Financial Controls in Marketing The Accounting-Marketing Interface Canberra Series in
Administrative Studies Monograph No 6 Canberra CAE Canberra Australia
Robinson M A (1990) Contribution margin analysis No longer relevant - strategic cost management the new
paradigm Journal of Management Accounting Research 2 1ndash32
Shank J (1989) Strategic cost management New wine or just new bottles Journal of Management Accounting
Research Fall 1(1) 47ndash65
Sharma R amp Ratnatunga J (1997) Traditional and activity based costing systems Accounting Education An International Journal 6 (4) 337ndash345
Sharman P A (2003) The case for management accounting Strategic Finance 85(4) 43ndash47
Shields M D (1995) An empirical analysis of firms implementation experiences with activity-based costing
Journal of Management Accounting Research 7 148ndash166
Shields M D Chow C W Kato Y amp Nakagawa Y (1991) Management accounting practices in the US and
Japan Comparative survey findings and research implications Journal of International Financial Management
and Accounting 3(1) 61ndash77
Sprinkle G B (2003) Perspectives on experimental research in managerial accounting Accounting Organizations
and Society 28(2ndash3) 287ndash318
Swenson D W (1995) The benefits of activity-based cost management to the manufacturing industry Journal of
Management Accounting Research 7 167ndash180
Tse M amp Gong M (2009) Recognition of idle resources in time-driven activity-based costing and resourceconsumption accounting models Journal of Applied Management Accounting Research 7 (2) 41ndash54
Williams J J amp Seaman A E (2001) Predicting changes in management accounting systems National culture
and industry effects Accounting Organizations and Society 26 (4ndash5) 443ndash460
301 J Ratnatunga et al The International Journal of Accounting 47 (2012) 281 ndash 301
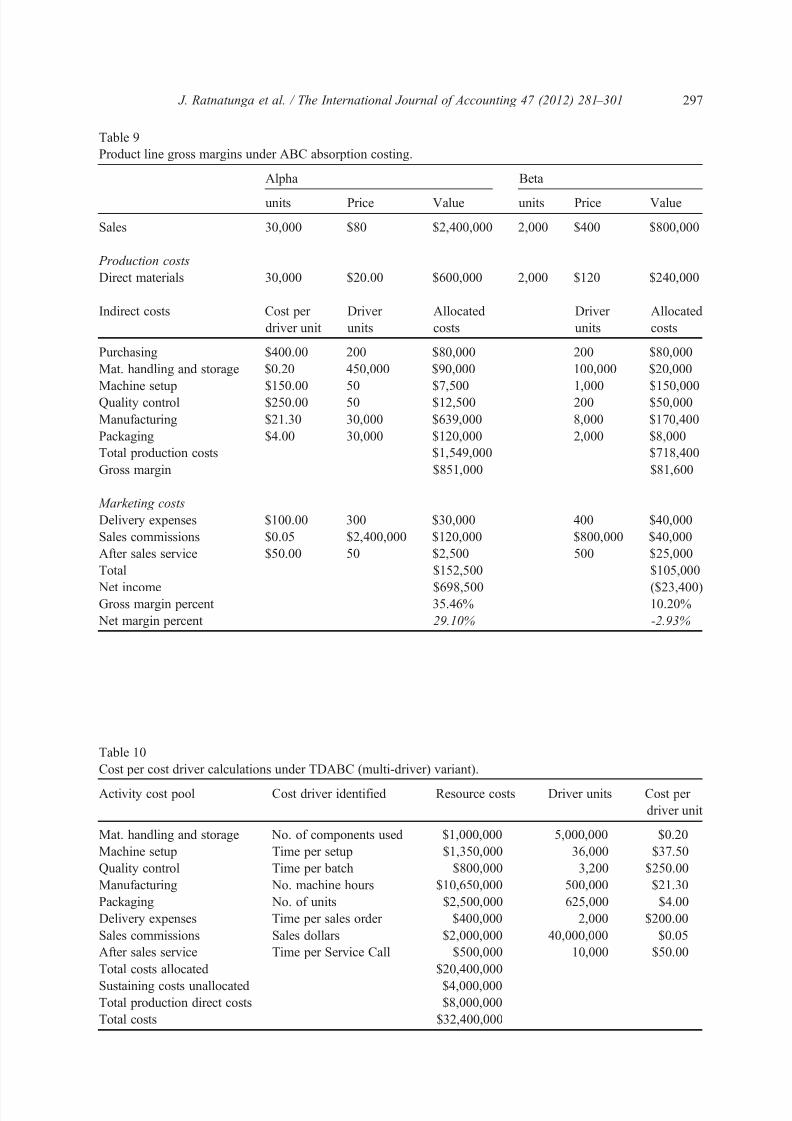
8202019 Ratnatunga Jurnal Case Study
httpslidepdfcomreaderfullratnatunga-jurnal-case-study 1721
Table 9
Product line gross margins under ABC absorption costing
Alpha Beta
units Price Value units Price Value
Sales 30000 $80 $2400000 2000 $400 $800000
Production costs
Direct materials 30000 $2000 $600000 2000 $120 $240000
Indirect costs Cost per
driver unit
Driver
units
Allocated
costs
Driver
units
Allocated
costs
Purchasing $40000 200 $80000 200 $80000
Mat handling and storage $020 450000 $90000 100000 $20000
Machine setup $15000 50 $7500 1000 $150000
Quality control $25000 50 $12500 200 $50000
Manufacturing $2130 30000 $639000 8000 $170400
Packaging $400 30000 $120000 2000 $8000
Total production costs $1549000 $718400
Gross margin $851000 $81600
Marketing costs
Delivery expenses $10000 300 $30000 400 $40000
Sales commissions $005 $2400000 $120000 $800000 $40000
After sales service $5000 50 $2500 500 $25000
Total $152500 $105000
Net income $698500 ($23400)Gross margin percent 3546 1020
Net margin percent 2910 -293
Table 10
Cost per cost driver calculations under TDABC (multi-driver) variant)
Activity cost pool Cost driver identified Resource costs Driver units Cost per
driver unit
Mat handling and storage No of components used $1000000 5000000 $020
Machine setup Time per setup $1350000 36000 $3750
Quality control Time per batch $800000 3200 $25000
Manufacturing No machine hours $10650000 500000 $2130
Packaging No of units $2500000 625000 $400
Delivery expenses Time per sales order $400000 2000 $20000
Sales commissions Sales dollars $2000000 40000000 $005
After sales service Time per Service Call $500000 10000 $5000
Total costs allocated $20400000
Sustaining costs unallocated $4000000Total production direct costs $8000000
Total costs $32400000
297 J Ratnatunga et al The International Journal of Accounting 47 (2012) 281 ndash 301
8202019 Ratnatunga Jurnal Case Study
httpslidepdfcomreaderfullratnatunga-jurnal-case-study 1821
Table 11
Product line gross margins under TDABC absorption costing (multi-driver variant)
Alpha Beta
units Price Value units Price Value
Sales 30000 $80 $2400000 2000 $400 $800000
Production costs
Direct materials 30000 $2000 $600000 2000 $120 $240000
Indirect costs Cost per
driver unit
Driver
units
Allocated
costs
Driver
units
Allocated
costs
Purchasing $80000 100 $80000 100 $80000
Mat handling and storage $020 450000 $90000 100000 $20000
Machine setup $3750 200 $7500 4000 $150000
Quality control $25000 50 $12500 200 $50000
Manufacturing $2130 30000 $639000 8000 $170400
Packaging $400 30000 $120000 2000 $8000
Total production costs $1549000 $718400
Gross margin $851000 $81600
Marketing costs
Delivery expenses $20000 150 $30000 200 $40000
Sales commissions $005 $2400000 $120000 $800000 $40000
After sales service $5000 50 $2500 500 $25000
Total $152500 $105000
Net income $698500 ($23400)Gross margin percent 3546 1020
Net margin percent 2910 -293
Table 12
Cost per cost driver calculations under lsquosingle-driver rsquo TDABC
Activity cost pool Cost driver identified Resource costs Driver units Cost per
driver unit
Mat handling and storage No labor hours $1000000 500000 $200
Machine setup No labor hours $1350000 500000 $270
Quality control No labor hours $800000 500000 $160
Manufacturing No labor hours $10650000 500000 $2130
Packaging No labor hours $2500000 500000 $500
Total factory resource cost $17500000 $3500
Delivery expenses Sales dollars $400000 40000000 $001
Sales commissions Sales dollars $2000000 40000000 $005
After sales service Sales dollars $500000 40000000 $001
Total costs allocated $20400000
Sustaining costs unallocated $4000000Total production direct costs $8000000
Total costs $32400000
298 J Ratnatunga et al The International Journal of Accounting 47 (2012) 281 ndash 301
8202019 Ratnatunga Jurnal Case Study
httpslidepdfcomreaderfullratnatunga-jurnal-case-study 1921
References
Anderson S W (1995) A Framework for assessing cost management system changes The case of activity-based
costing implementation at general motors 1986ndash1993 Journal of Management Accounting Research 7
1ndash51
Anderson S W (2007) Managing Costs and Cost Structure throughout the Value Chain Research on Strategic
Cost Management In C S Chapman A G Hopwood amp M D Shield (Eds) Handbook of Management
Accounting Research Vol 2 (pp 481ndash506) Oxford Elsevier
Baird K M Harrison G L amp Reeve R C (2004) Adoption of activity management practices A note on the
extent of adoption and the influence of organizational and cultural factors Management Accounting Research
15(4) 393ndash399
Barrett R (2005) Time-Driven Costing The Bottom Line on the New ABC Business Performance Management
35ndash39
Bruggeman W Everaert P Levant Y Saens G amp Anderson S (2008) Cost modelling in logistics using
time-driven ABC Experiences from a wholesaler International Journal of Physical Distribution amp Logistics
Management 38(3) 172ndash191
Byrne S Stower E amp Torry P (2009) Is ABC adoption a success in Australia Journal of Applied Management Accounting Research 7 (1) 37ndash52
Cardinaels E amp Labro E (2008) On the determinants of measurement error in time driven costing Accounting
Review 83(3) 735ndash756
Table 13
Product line gross margins under lsquosingle-diver rsquo TDABC absorption costing
Alpha Beta
units Price Value units Price Value
Sales 30000 $80 $2400000 2000 $400 $800000
Production costs
Direct materials 30000 $2000 $600000 2000 $120 $240000
Indirect costs Cost per
driver unit
Driver
units
Allocated
costs
Driver
units
Allocated
costs
Purchasing $240 30000 $72000 8000 $19200
Mat handling amp storage $200 30000 $60000 8000 $16000
Machine setup $270 30000 $81000 8000 $21600
Quality control $160 30000 $48000 8000 $12800
Manufacturing $2130 30000 $639000 8000 $170400
Packaging $500 30000 $150000 8000 $40000
Total production costs $1650000 $520000
Gross margin $750000 $280000
Marketing costs
Delivery expenses $001 2400000 $24000 800000 $8000
Sales commissions $005 2400000 $120000 800000 $40000
After sales service $001 2400000 $30000 800000 $10000
Total $174000 $58000
Net income $576000 $222000Gross margin percent 3125 3500
Net margin percent 2400 2775
299 J Ratnatunga et al The International Journal of Accounting 47 (2012) 281 ndash 301
8202019 Ratnatunga Jurnal Case Study
httpslidepdfcomreaderfullratnatunga-jurnal-case-study 2021
Cobb I Innes J amp Mitchell F (1992) Activity-based costing-problems in practice London CIMA
Cohen S Venieris G amp Kaimenaki E (2005) ABC Adopters supporters deniers and unawares Managerial
Auditing Journal 20(9) 981ndash1000
Cooper R (1987) Does your company need a new cost system Journal of Cost Management 1(1) 45ndash49
Cooper R (1997 Autumn) The two-stage procedure in cost accounting Part two Journal of Cost Management 39ndash45
Cooper R amp Kaplan R S (1988) Measure Costs Right Make the Right Decisions Harvard Business Review
66 (9) 96ndash103
Cooper R amp Kaplan R S (1991) Design of cost management systems Text cases and readings NJ
Prentice-Hall Englewood Cliffs
Cooper R amp Kaplan R S (1992) Activity based systems Measuring the costs of resource usage Accounting
Horizons 6 (3) 1ndash13
Cotton W Jackson S amp Brown R (2003) Note on a New Zealand replication of the Innes et al UK
activity-based costing survey Management Accounting Research 14(1) 67ndash72
Drury C (1990) Product costing in the 1990s Accountancy 1990 123ndash126
Everaert P amp Bruggeman W (2007) Time-driven activity-based costing exploring the underlying model Cost
Management 21(2) 16ndash
20Foster G amp Swenson D W (1997) Measuring the success of activity-based cost management and its
determinants Journal of Management Accounting Research 9 109ndash141
Gervais M (2005) Controcircle de Gestion (8th ed) Paris Economica
Gosselin M (1997) The effect of strategy and organizational structure on the adoption and implementation of
activity-based costing Accounting Organizations and Society 22(2) 105ndash122
Gosselin M (2007) A review of activity-based costing Technique implementation and consequences In C S
Chapman A G Hopwood amp M D Shield (Eds) Handbook of Management Accounting Research Vol 2
(pp 641ndash672) Oxford Elsevier
Hoozeacutee S amp Bruggeman W (2007) Time-driven activity-based costing Exploring the underlying model Cost
Management 21(2) 16ndash20
Hoozeacutee S amp Bruggeman W (2010) Identifying operating improvements during the design process of a
time-driven ABC system The role of collective worker participation and leadership style Management Accounting Research 21(3) 185ndash198
Horngren C T (2004) Management accounting Some comments Journal of Management Accounting
Research 16 207ndash211
Innes J Mitchel F amp Sinclair D (2000) Activity-based costing in the UKs largest companies A comparison
of 1994 and 1999 survey results Management Accounting Research 11(3) 349ndash362
Johnson H T amp Kaplan R S (1987) Relevance Lost The Rise and Fall of Management Accounting
Cambridge USA Harvard Business School Press
Kaplan R S amp Anderson S R (2003) Time-driven activity-based costing White paper presented at the First
European Summit on Time-Driven Activity-Based Costing Available from httpwwwhbseduresearch
facpubsworkingpaperspapers2030404-045pdf (Accessed 3 December 2010)
Kaplan R S amp Anderson S R (2004) Time-Driven Activity-Based Costing Harvard Business Review 82(11)
131ndash138
Kaplan R S amp Anderson S R (2007) The innovation of time-driven activity-based costing Cost Management
21(2) 5ndash15
Kiani R amp Sangeladji M (2003) An empirical study about the use of the ABCABM models by some of the
Fortune 500 largest industrial corporations in the USA Journal of American Academy of Business Cambridge
3(1ndash2) 174ndash182
Krumwiede K R (1998) The implementation stages of activity-based costing and the impact of contextual and
organizational factors Journal of Management Accounting Research 10 239ndash277
Levant Y amp Zimnovitch H (2008) An ill-known facet to the history of cost calculation The methods of
equivalence 20th Annual Conference of the Business History Research Unit Cardiff Business School (10ndash
11th September)
Malmi T (1997) Towards explaining activity-based costing failure Accounting and control in a decentralisedorganisation Management Accounting Research 8(4) 459ndash480
McDonach C amp Mattimore R (2008) Strategic applications of time driven ABC in the service sector Lessons from
Irish SME Rotterdam Communication at the 31st Annual Congress of the European Accounting Association
300 J Ratnatunga et al The International Journal of Accounting 47 (2012) 281 ndash 301
8202019 Ratnatunga Jurnal Case Study
httpslidepdfcomreaderfullratnatunga-jurnal-case-study 2121
McGowan A S amp Klammer T P (1997) Satisfaction with activity-based cost management implementation
Journal of Management Accounting Research 9 217ndash238
McNair C J (2007) Beyond the boundaries Future trends in cost management Cost Management 21(1) 10ndash21
Nguyen H V amp Brooks A (1997) An empirical investigation of adoption issues relating to activity-based
costing Asian Review of Accounting 5(1) 1ndash18
OConnor N G Deng J amp Luo Y (2006) Political constraints organization design and performance
measurement in Chinas state-owned enterprises Accounting Organizations and Society 31(2) 157ndash177
Pernot E Roodhooft F amp van den Abbeele A (2007) Time-driven activity-based costing for inter-library
services A case study in a university Journal of Academic of Librarianship 33(5) 551ndash560
Ratnatunga J (1983) Financial Controls in Marketing The Accounting-Marketing Interface Canberra Series in
Administrative Studies Monograph No 6 Canberra CAE Canberra Australia
Robinson M A (1990) Contribution margin analysis No longer relevant - strategic cost management the new
paradigm Journal of Management Accounting Research 2 1ndash32
Shank J (1989) Strategic cost management New wine or just new bottles Journal of Management Accounting
Research Fall 1(1) 47ndash65
Sharma R amp Ratnatunga J (1997) Traditional and activity based costing systems Accounting Education An International Journal 6 (4) 337ndash345
Sharman P A (2003) The case for management accounting Strategic Finance 85(4) 43ndash47
Shields M D (1995) An empirical analysis of firms implementation experiences with activity-based costing
Journal of Management Accounting Research 7 148ndash166
Shields M D Chow C W Kato Y amp Nakagawa Y (1991) Management accounting practices in the US and
Japan Comparative survey findings and research implications Journal of International Financial Management
and Accounting 3(1) 61ndash77
Sprinkle G B (2003) Perspectives on experimental research in managerial accounting Accounting Organizations
and Society 28(2ndash3) 287ndash318
Swenson D W (1995) The benefits of activity-based cost management to the manufacturing industry Journal of
Management Accounting Research 7 167ndash180
Tse M amp Gong M (2009) Recognition of idle resources in time-driven activity-based costing and resourceconsumption accounting models Journal of Applied Management Accounting Research 7 (2) 41ndash54
Williams J J amp Seaman A E (2001) Predicting changes in management accounting systems National culture
and industry effects Accounting Organizations and Society 26 (4ndash5) 443ndash460
301 J Ratnatunga et al The International Journal of Accounting 47 (2012) 281 ndash 301
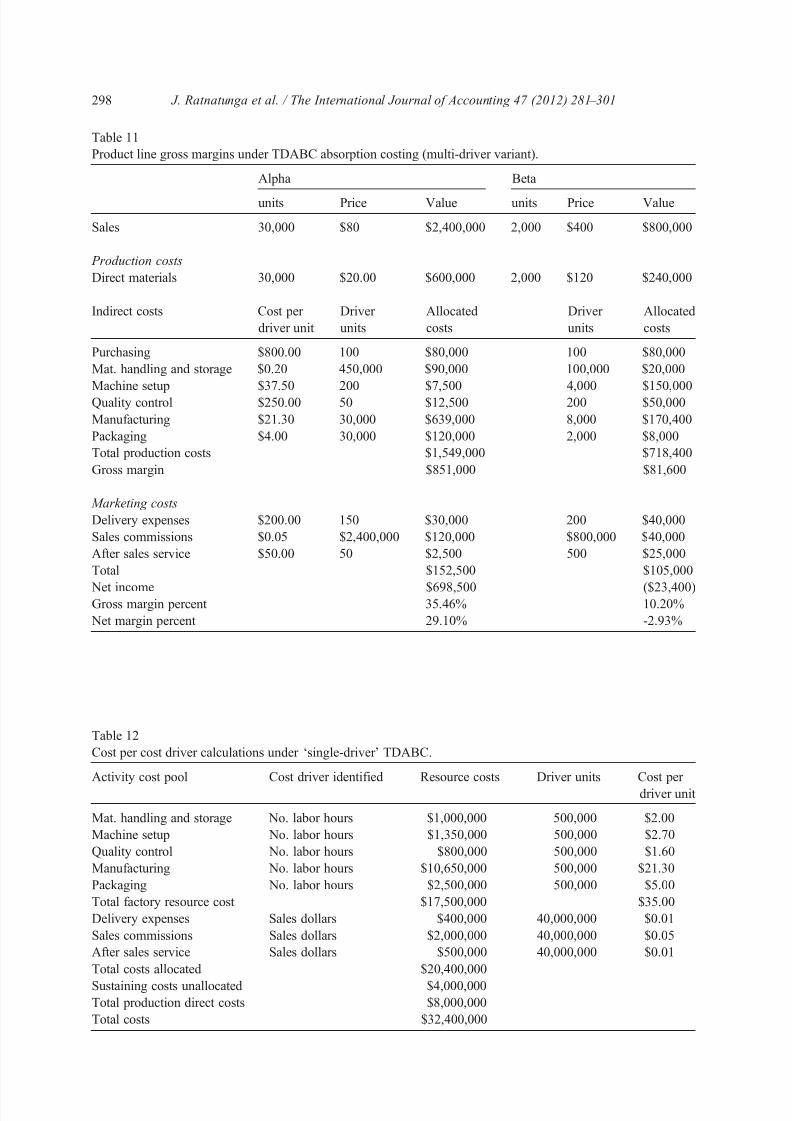
8202019 Ratnatunga Jurnal Case Study
httpslidepdfcomreaderfullratnatunga-jurnal-case-study 1821
Table 11
Product line gross margins under TDABC absorption costing (multi-driver variant)
Alpha Beta
units Price Value units Price Value
Sales 30000 $80 $2400000 2000 $400 $800000
Production costs
Direct materials 30000 $2000 $600000 2000 $120 $240000
Indirect costs Cost per
driver unit
Driver
units
Allocated
costs
Driver
units
Allocated
costs
Purchasing $80000 100 $80000 100 $80000
Mat handling and storage $020 450000 $90000 100000 $20000
Machine setup $3750 200 $7500 4000 $150000
Quality control $25000 50 $12500 200 $50000
Manufacturing $2130 30000 $639000 8000 $170400
Packaging $400 30000 $120000 2000 $8000
Total production costs $1549000 $718400
Gross margin $851000 $81600
Marketing costs
Delivery expenses $20000 150 $30000 200 $40000
Sales commissions $005 $2400000 $120000 $800000 $40000
After sales service $5000 50 $2500 500 $25000
Total $152500 $105000
Net income $698500 ($23400)Gross margin percent 3546 1020
Net margin percent 2910 -293
Table 12
Cost per cost driver calculations under lsquosingle-driver rsquo TDABC
Activity cost pool Cost driver identified Resource costs Driver units Cost per
driver unit
Mat handling and storage No labor hours $1000000 500000 $200
Machine setup No labor hours $1350000 500000 $270
Quality control No labor hours $800000 500000 $160
Manufacturing No labor hours $10650000 500000 $2130
Packaging No labor hours $2500000 500000 $500
Total factory resource cost $17500000 $3500
Delivery expenses Sales dollars $400000 40000000 $001
Sales commissions Sales dollars $2000000 40000000 $005
After sales service Sales dollars $500000 40000000 $001
Total costs allocated $20400000
Sustaining costs unallocated $4000000Total production direct costs $8000000
Total costs $32400000
298 J Ratnatunga et al The International Journal of Accounting 47 (2012) 281 ndash 301
8202019 Ratnatunga Jurnal Case Study
httpslidepdfcomreaderfullratnatunga-jurnal-case-study 1921
References
Anderson S W (1995) A Framework for assessing cost management system changes The case of activity-based
costing implementation at general motors 1986ndash1993 Journal of Management Accounting Research 7
1ndash51
Anderson S W (2007) Managing Costs and Cost Structure throughout the Value Chain Research on Strategic
Cost Management In C S Chapman A G Hopwood amp M D Shield (Eds) Handbook of Management
Accounting Research Vol 2 (pp 481ndash506) Oxford Elsevier
Baird K M Harrison G L amp Reeve R C (2004) Adoption of activity management practices A note on the
extent of adoption and the influence of organizational and cultural factors Management Accounting Research
15(4) 393ndash399
Barrett R (2005) Time-Driven Costing The Bottom Line on the New ABC Business Performance Management
35ndash39
Bruggeman W Everaert P Levant Y Saens G amp Anderson S (2008) Cost modelling in logistics using
time-driven ABC Experiences from a wholesaler International Journal of Physical Distribution amp Logistics
Management 38(3) 172ndash191
Byrne S Stower E amp Torry P (2009) Is ABC adoption a success in Australia Journal of Applied Management Accounting Research 7 (1) 37ndash52
Cardinaels E amp Labro E (2008) On the determinants of measurement error in time driven costing Accounting
Review 83(3) 735ndash756
Table 13
Product line gross margins under lsquosingle-diver rsquo TDABC absorption costing
Alpha Beta
units Price Value units Price Value
Sales 30000 $80 $2400000 2000 $400 $800000
Production costs
Direct materials 30000 $2000 $600000 2000 $120 $240000
Indirect costs Cost per
driver unit
Driver
units
Allocated
costs
Driver
units
Allocated
costs
Purchasing $240 30000 $72000 8000 $19200
Mat handling amp storage $200 30000 $60000 8000 $16000
Machine setup $270 30000 $81000 8000 $21600
Quality control $160 30000 $48000 8000 $12800
Manufacturing $2130 30000 $639000 8000 $170400
Packaging $500 30000 $150000 8000 $40000
Total production costs $1650000 $520000
Gross margin $750000 $280000
Marketing costs
Delivery expenses $001 2400000 $24000 800000 $8000
Sales commissions $005 2400000 $120000 800000 $40000
After sales service $001 2400000 $30000 800000 $10000
Total $174000 $58000
Net income $576000 $222000Gross margin percent 3125 3500
Net margin percent 2400 2775
299 J Ratnatunga et al The International Journal of Accounting 47 (2012) 281 ndash 301
8202019 Ratnatunga Jurnal Case Study
httpslidepdfcomreaderfullratnatunga-jurnal-case-study 2021
Cobb I Innes J amp Mitchell F (1992) Activity-based costing-problems in practice London CIMA
Cohen S Venieris G amp Kaimenaki E (2005) ABC Adopters supporters deniers and unawares Managerial
Auditing Journal 20(9) 981ndash1000
Cooper R (1987) Does your company need a new cost system Journal of Cost Management 1(1) 45ndash49
Cooper R (1997 Autumn) The two-stage procedure in cost accounting Part two Journal of Cost Management 39ndash45
Cooper R amp Kaplan R S (1988) Measure Costs Right Make the Right Decisions Harvard Business Review
66 (9) 96ndash103
Cooper R amp Kaplan R S (1991) Design of cost management systems Text cases and readings NJ
Prentice-Hall Englewood Cliffs
Cooper R amp Kaplan R S (1992) Activity based systems Measuring the costs of resource usage Accounting
Horizons 6 (3) 1ndash13
Cotton W Jackson S amp Brown R (2003) Note on a New Zealand replication of the Innes et al UK
activity-based costing survey Management Accounting Research 14(1) 67ndash72
Drury C (1990) Product costing in the 1990s Accountancy 1990 123ndash126
Everaert P amp Bruggeman W (2007) Time-driven activity-based costing exploring the underlying model Cost
Management 21(2) 16ndash
20Foster G amp Swenson D W (1997) Measuring the success of activity-based cost management and its
determinants Journal of Management Accounting Research 9 109ndash141
Gervais M (2005) Controcircle de Gestion (8th ed) Paris Economica
Gosselin M (1997) The effect of strategy and organizational structure on the adoption and implementation of
activity-based costing Accounting Organizations and Society 22(2) 105ndash122
Gosselin M (2007) A review of activity-based costing Technique implementation and consequences In C S
Chapman A G Hopwood amp M D Shield (Eds) Handbook of Management Accounting Research Vol 2
(pp 641ndash672) Oxford Elsevier
Hoozeacutee S amp Bruggeman W (2007) Time-driven activity-based costing Exploring the underlying model Cost
Management 21(2) 16ndash20
Hoozeacutee S amp Bruggeman W (2010) Identifying operating improvements during the design process of a
time-driven ABC system The role of collective worker participation and leadership style Management Accounting Research 21(3) 185ndash198
Horngren C T (2004) Management accounting Some comments Journal of Management Accounting
Research 16 207ndash211
Innes J Mitchel F amp Sinclair D (2000) Activity-based costing in the UKs largest companies A comparison
of 1994 and 1999 survey results Management Accounting Research 11(3) 349ndash362
Johnson H T amp Kaplan R S (1987) Relevance Lost The Rise and Fall of Management Accounting
Cambridge USA Harvard Business School Press
Kaplan R S amp Anderson S R (2003) Time-driven activity-based costing White paper presented at the First
European Summit on Time-Driven Activity-Based Costing Available from httpwwwhbseduresearch
facpubsworkingpaperspapers2030404-045pdf (Accessed 3 December 2010)
Kaplan R S amp Anderson S R (2004) Time-Driven Activity-Based Costing Harvard Business Review 82(11)
131ndash138
Kaplan R S amp Anderson S R (2007) The innovation of time-driven activity-based costing Cost Management
21(2) 5ndash15
Kiani R amp Sangeladji M (2003) An empirical study about the use of the ABCABM models by some of the
Fortune 500 largest industrial corporations in the USA Journal of American Academy of Business Cambridge
3(1ndash2) 174ndash182
Krumwiede K R (1998) The implementation stages of activity-based costing and the impact of contextual and
organizational factors Journal of Management Accounting Research 10 239ndash277
Levant Y amp Zimnovitch H (2008) An ill-known facet to the history of cost calculation The methods of
equivalence 20th Annual Conference of the Business History Research Unit Cardiff Business School (10ndash
11th September)
Malmi T (1997) Towards explaining activity-based costing failure Accounting and control in a decentralisedorganisation Management Accounting Research 8(4) 459ndash480
McDonach C amp Mattimore R (2008) Strategic applications of time driven ABC in the service sector Lessons from
Irish SME Rotterdam Communication at the 31st Annual Congress of the European Accounting Association
300 J Ratnatunga et al The International Journal of Accounting 47 (2012) 281 ndash 301
8202019 Ratnatunga Jurnal Case Study
httpslidepdfcomreaderfullratnatunga-jurnal-case-study 2121
McGowan A S amp Klammer T P (1997) Satisfaction with activity-based cost management implementation
Journal of Management Accounting Research 9 217ndash238
McNair C J (2007) Beyond the boundaries Future trends in cost management Cost Management 21(1) 10ndash21
Nguyen H V amp Brooks A (1997) An empirical investigation of adoption issues relating to activity-based
costing Asian Review of Accounting 5(1) 1ndash18
OConnor N G Deng J amp Luo Y (2006) Political constraints organization design and performance
measurement in Chinas state-owned enterprises Accounting Organizations and Society 31(2) 157ndash177
Pernot E Roodhooft F amp van den Abbeele A (2007) Time-driven activity-based costing for inter-library
services A case study in a university Journal of Academic of Librarianship 33(5) 551ndash560
Ratnatunga J (1983) Financial Controls in Marketing The Accounting-Marketing Interface Canberra Series in
Administrative Studies Monograph No 6 Canberra CAE Canberra Australia
Robinson M A (1990) Contribution margin analysis No longer relevant - strategic cost management the new
paradigm Journal of Management Accounting Research 2 1ndash32
Shank J (1989) Strategic cost management New wine or just new bottles Journal of Management Accounting
Research Fall 1(1) 47ndash65
Sharma R amp Ratnatunga J (1997) Traditional and activity based costing systems Accounting Education An International Journal 6 (4) 337ndash345
Sharman P A (2003) The case for management accounting Strategic Finance 85(4) 43ndash47
Shields M D (1995) An empirical analysis of firms implementation experiences with activity-based costing
Journal of Management Accounting Research 7 148ndash166
Shields M D Chow C W Kato Y amp Nakagawa Y (1991) Management accounting practices in the US and
Japan Comparative survey findings and research implications Journal of International Financial Management
and Accounting 3(1) 61ndash77
Sprinkle G B (2003) Perspectives on experimental research in managerial accounting Accounting Organizations
and Society 28(2ndash3) 287ndash318
Swenson D W (1995) The benefits of activity-based cost management to the manufacturing industry Journal of
Management Accounting Research 7 167ndash180
Tse M amp Gong M (2009) Recognition of idle resources in time-driven activity-based costing and resourceconsumption accounting models Journal of Applied Management Accounting Research 7 (2) 41ndash54
Williams J J amp Seaman A E (2001) Predicting changes in management accounting systems National culture
and industry effects Accounting Organizations and Society 26 (4ndash5) 443ndash460
301 J Ratnatunga et al The International Journal of Accounting 47 (2012) 281 ndash 301
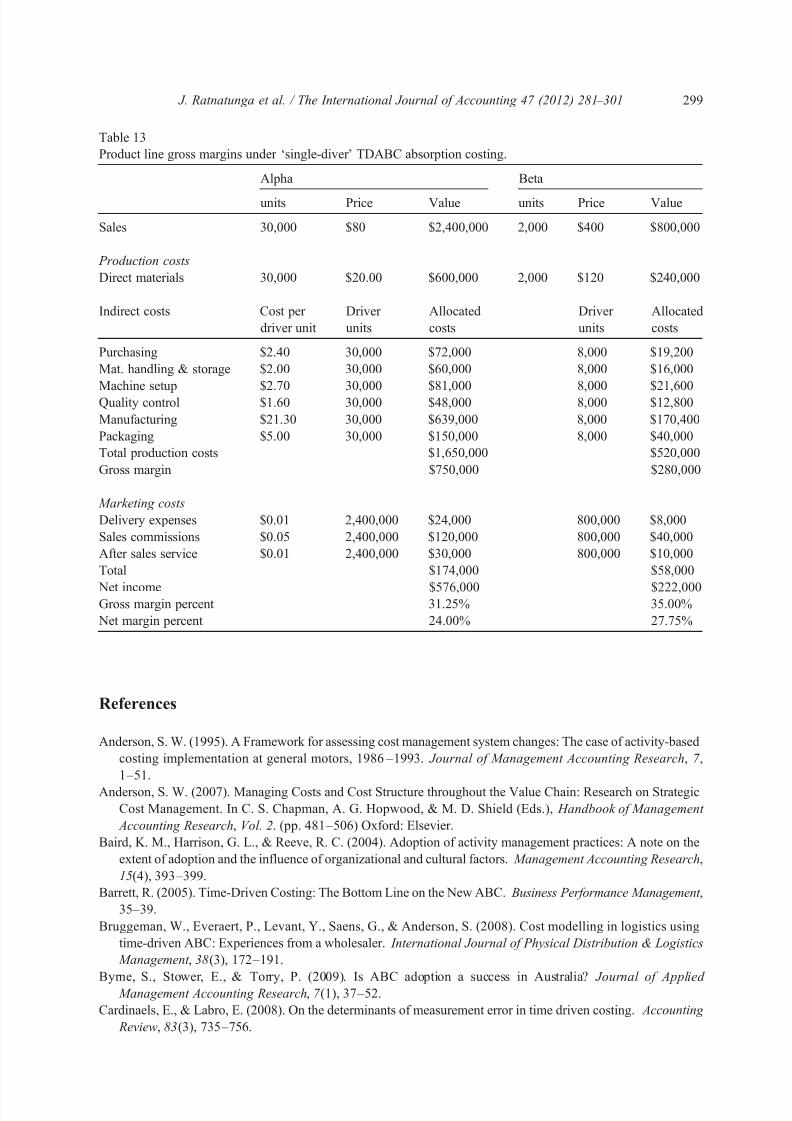
8202019 Ratnatunga Jurnal Case Study
httpslidepdfcomreaderfullratnatunga-jurnal-case-study 2121
McGowan A S amp Klammer T P (1997) Satisfaction with activity-based cost management implementation
Journal of Management Accounting Research 9 217ndash238
McNair C J (2007) Beyond the boundaries Future trends in cost management Cost Management 21(1) 10ndash21
Nguyen H V amp Brooks A (1997) An empirical investigation of adoption issues relating to activity-based
costing Asian Review of Accounting 5(1) 1ndash18
OConnor N G Deng J amp Luo Y (2006) Political constraints organization design and performance
measurement in Chinas state-owned enterprises Accounting Organizations and Society 31(2) 157ndash177
Pernot E Roodhooft F amp van den Abbeele A (2007) Time-driven activity-based costing for inter-library
services A case study in a university Journal of Academic of Librarianship 33(5) 551ndash560
Ratnatunga J (1983) Financial Controls in Marketing The Accounting-Marketing Interface Canberra Series in
Administrative Studies Monograph No 6 Canberra CAE Canberra Australia
Robinson M A (1990) Contribution margin analysis No longer relevant - strategic cost management the new
paradigm Journal of Management Accounting Research 2 1ndash32
Shank J (1989) Strategic cost management New wine or just new bottles Journal of Management Accounting
Research Fall 1(1) 47ndash65
Sharma R amp Ratnatunga J (1997) Traditional and activity based costing systems Accounting Education An International Journal 6 (4) 337ndash345
Sharman P A (2003) The case for management accounting Strategic Finance 85(4) 43ndash47
Shields M D (1995) An empirical analysis of firms implementation experiences with activity-based costing
Journal of Management Accounting Research 7 148ndash166
Shields M D Chow C W Kato Y amp Nakagawa Y (1991) Management accounting practices in the US and
Japan Comparative survey findings and research implications Journal of International Financial Management
and Accounting 3(1) 61ndash77
Sprinkle G B (2003) Perspectives on experimental research in managerial accounting Accounting Organizations
and Society 28(2ndash3) 287ndash318
Swenson D W (1995) The benefits of activity-based cost management to the manufacturing industry Journal of
Management Accounting Research 7 167ndash180
Tse M amp Gong M (2009) Recognition of idle resources in time-driven activity-based costing and resourceconsumption accounting models Journal of Applied Management Accounting Research 7 (2) 41ndash54
Williams J J amp Seaman A E (2001) Predicting changes in management accounting systems National culture
and industry effects Accounting Organizations and Society 26 (4ndash5) 443ndash460
301 J Ratnatunga et al The International Journal of Accounting 47 (2012) 281 ndash 301