raytheon company - superfund records collections | … by raytheon company, under direction of the...
TRANSCRIPT

Raytheon Company
PO Box 11337, Bldg. 826 Tucson, AZ 85734-1337
520.794.9450 In reply refer to: 8200/TJA/ 9324March 15, 2005 Mr. George Warner ASC/EMR 1801 Tenth St, Bldg. 8 Ste. 2 Wright-Patterson AFB, OH 45433-7626
Mr. William Ellett ADEQ Project Manager, Superfund Program 400 West Congress, Suite 433 Tucson, AZ 85701
Mr. Matthew Jefferson US EPA, Region IX 75 Hawthorne St D-7-1 San Francisco, CA 94105-3901
ADWR Water Quality Section 500 N. Third St. Phoenix, AZ 85004-3903
re: Summary of Reclamation Well Field and Soil Remediation Operations, July through December 2004 U.S. Air Force Plant 44 (AFP 44), Tucson, Arizona Dear Agency Representatives: Enclosed for your review is the annual report titled "Summary of Reclamation Well Field and Soil Remediation Operations, July through December, 2004, U.S. Air Force Plant 44, Tucson, Arizona". This report contains operations data for the Installation Restoration Program (IRP) groundwater and soils remediation activities at AFP 44, located in the southern portion of the Tucson International Airport Area Superfund National Priorities List site. The report is prepared by Raytheon Company, under direction of the United States Air Force Aeronautical Systems Center, Installation Restoration Program If you have any questions regarding any of the information contained within this report, please contact me at 520-794-9450 or e-mail me at [email protected] . Sincerely, RAYTHEON COMPANY
Timothy J. Allen Hydrogeologist Environmental Restoration Program
SDMS DOCID# 2129335

Distribution:
Biggs, Jeff COT Water Cronin, K. Tohono O’Odham De la Cruz Superfund Library DiGuiseppi, W. Earth Tech Gomez, I. UCAB Graham, D. USGS Grimaldi, R. Pima County DEQ Herrera, M. TCE Subcommittee Huckelberry, C. Pima County Mgr. Kafura, C. ADEQ Katz, L. Montgomery & Assoc. Keene, J. City of Tucson D. Kusel ADWR R. Marra COT Water Pearthree, M. COT Water Rogers, S. San Xavier District
Raytheon:
Bramhall, D. Coyle, J. Hannifan, R. Luhrs, R. Roberts, I.J. Orton, M Samorano, D. Steiner, G.D.
File 826
SUMMARY OF RECLAMATION WELL FIELD AND SOIL REMEDIATION OPERATIONS,
JULY THROUGH DECEMBER, 2004 U.S. AIR FORCE PLANT 44 (AFP 44), TUCSON, ARIZONA
TABLE OF CONTENTS
LIST OF APPENDICES: APPENDIX A-1 Monthly Groundwater Well Pumpage for the period 01-July-2004 through 31-December-2004 APPENDIX A-2 Summary of Reclamation System Downtime for the period 01-July-
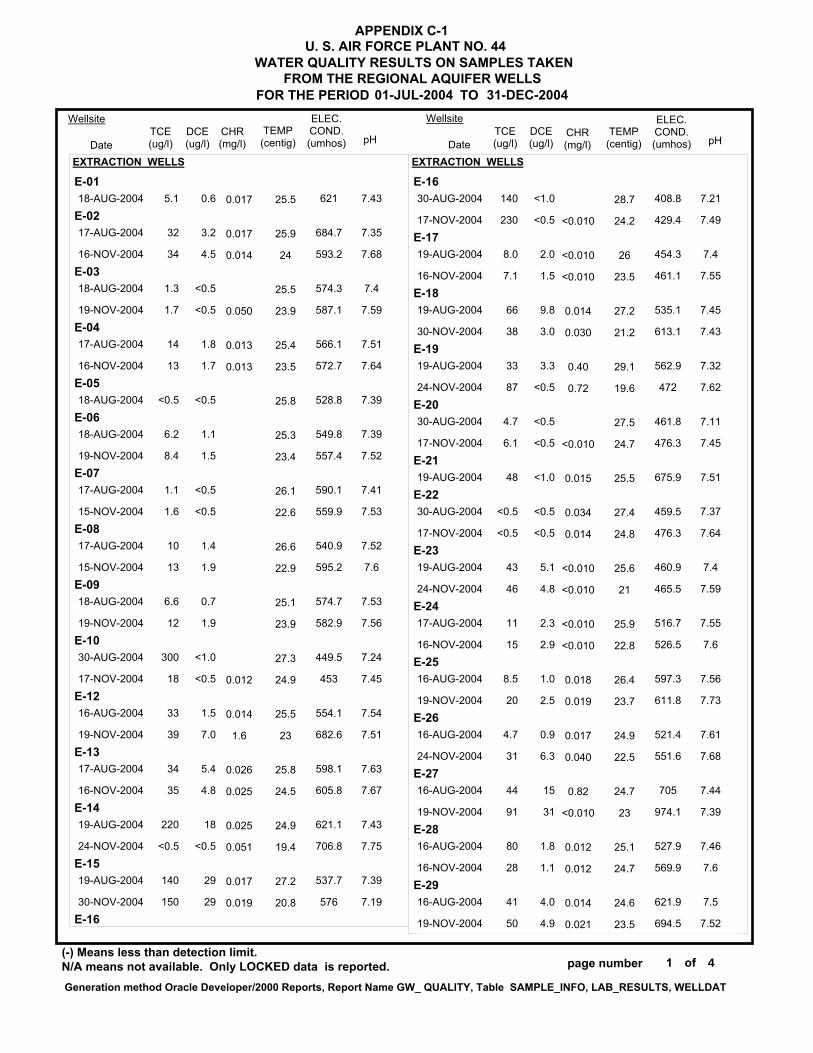
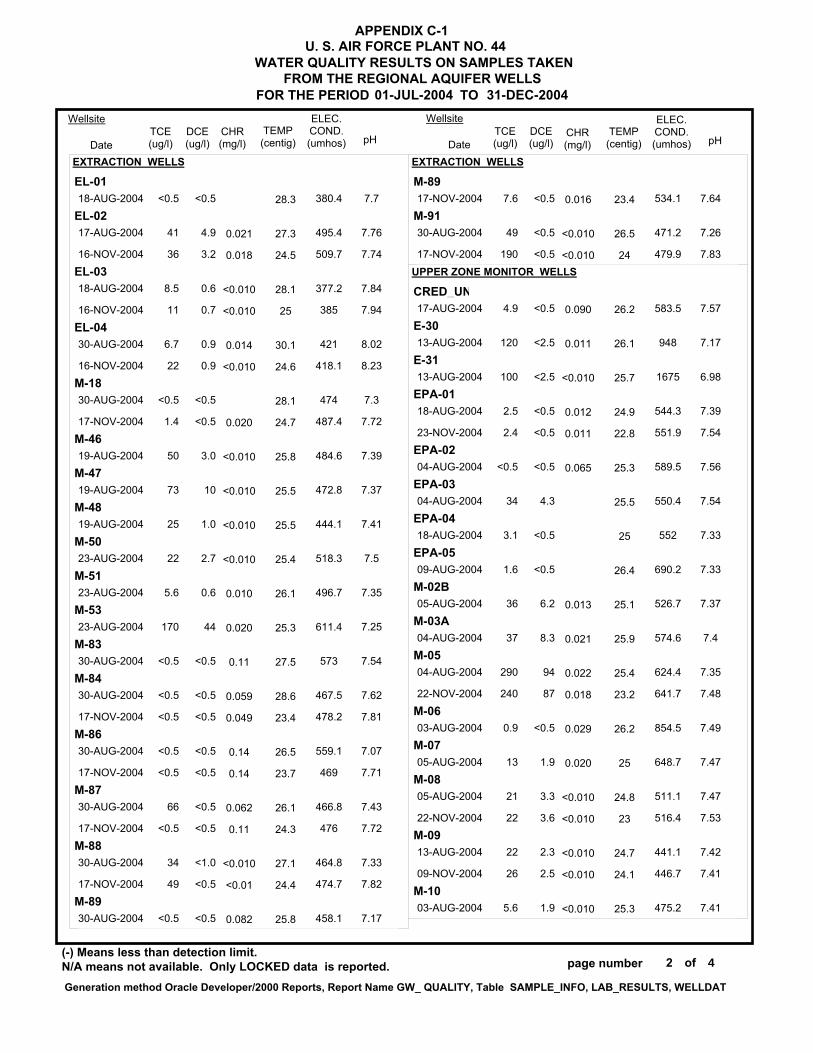
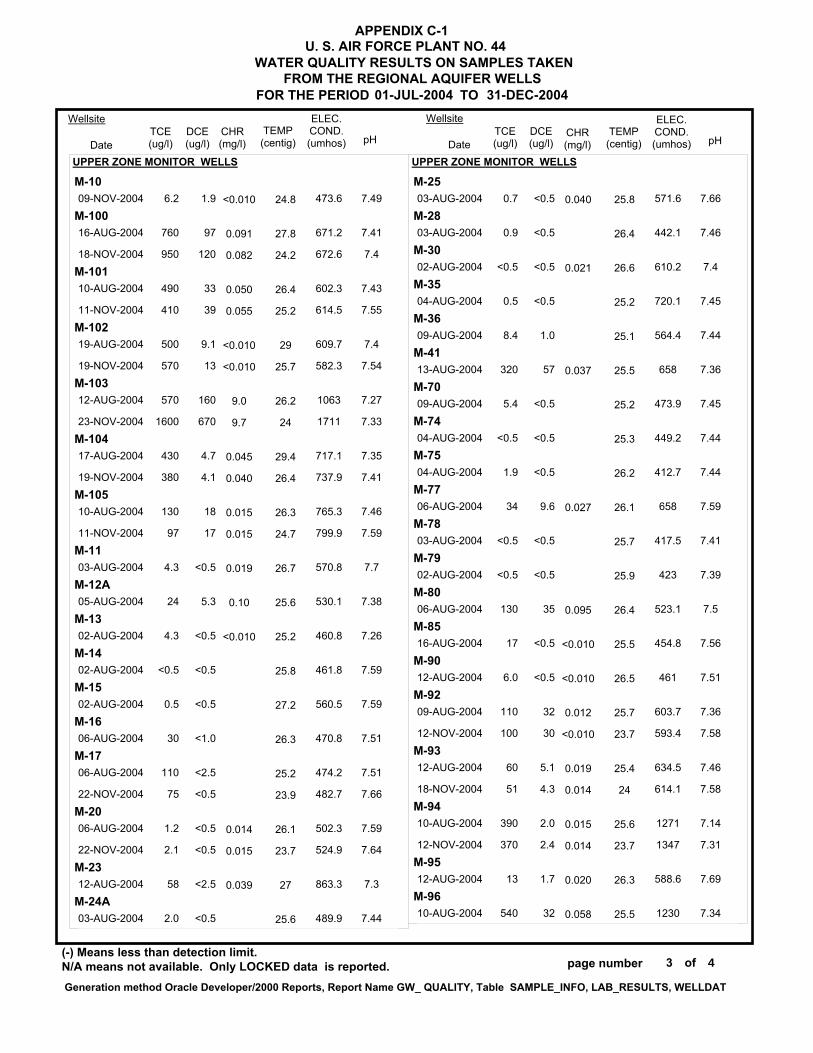
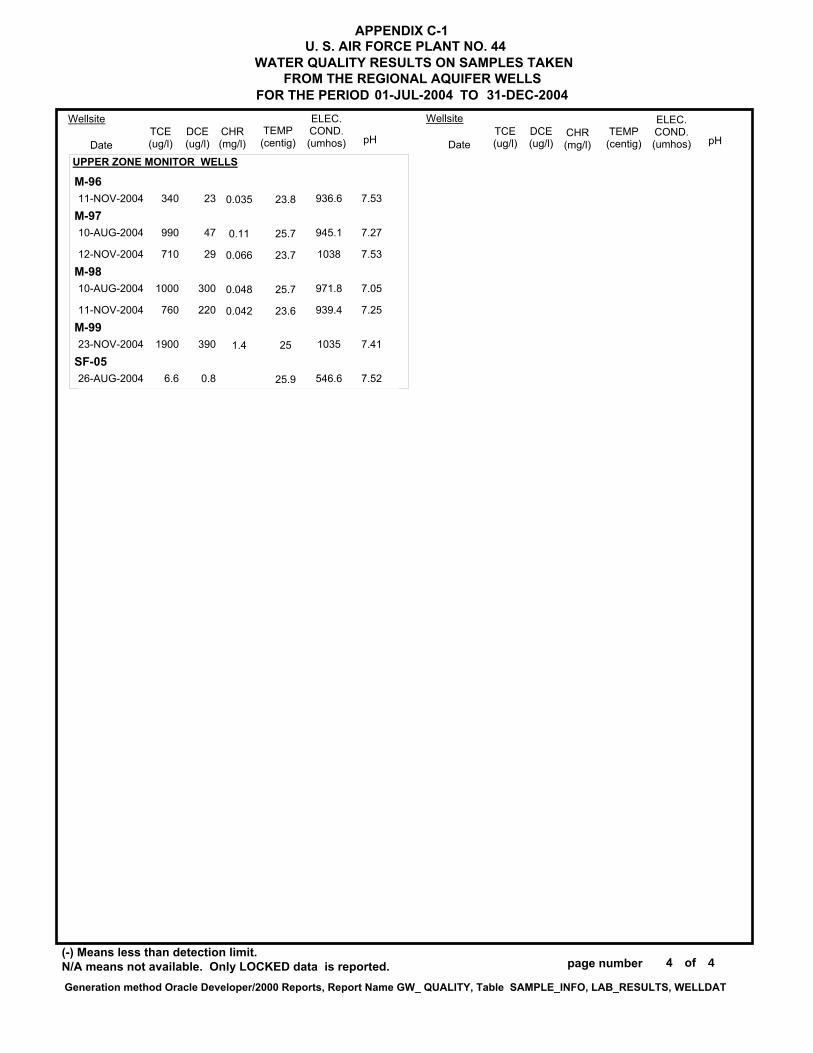
2004 through 31-December-2004 APPENDIX B-1 Summary of Water Level Elevations for Regional Aquifer for the period 01-July-2004 through 31-December-2004 APPENDIX B-2 Summary of Water Level Elevations, Shallow Groundwater Zone for the period 01-July-2004 through 31-December-2004 APPENDIX C-1 Water Quality Results on Samples Taken from the Regional Aquifer Wells for the period 01-July-2004 through 31-December-2004 APPENDIX C-2 Water Quality Results on Samples Taken from the SP- 140 and
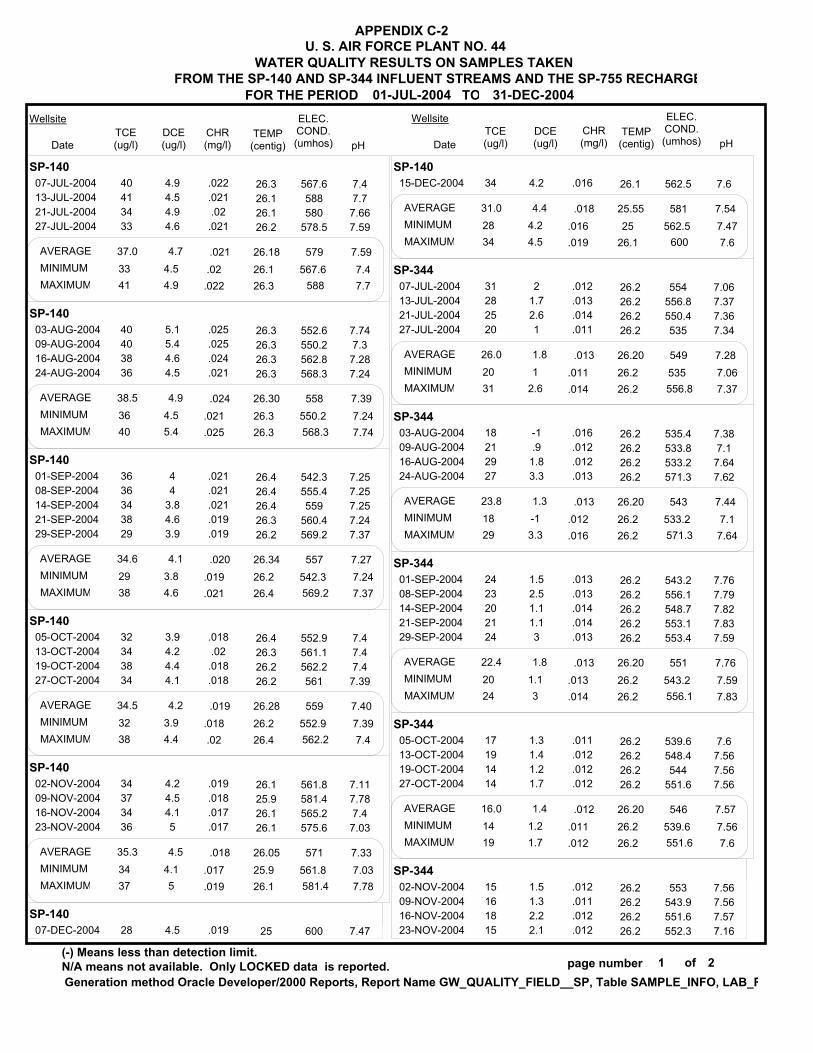
SP-344 Influent Streams and the SP-755 Recharge for the period 01-July-2004 through 31-December-2004
APPENDIX C-3 Water Quality Results on Samples Taken from the Shallow
Groundwater Zone Wells for the period 01-July-2004 through 31-December-2004
APPENDIX D-1 Vapor Quality Results on Samples Taken from the Soil Vapor
Extraction Wells for the period 01-July-2004 through 31-December-2004
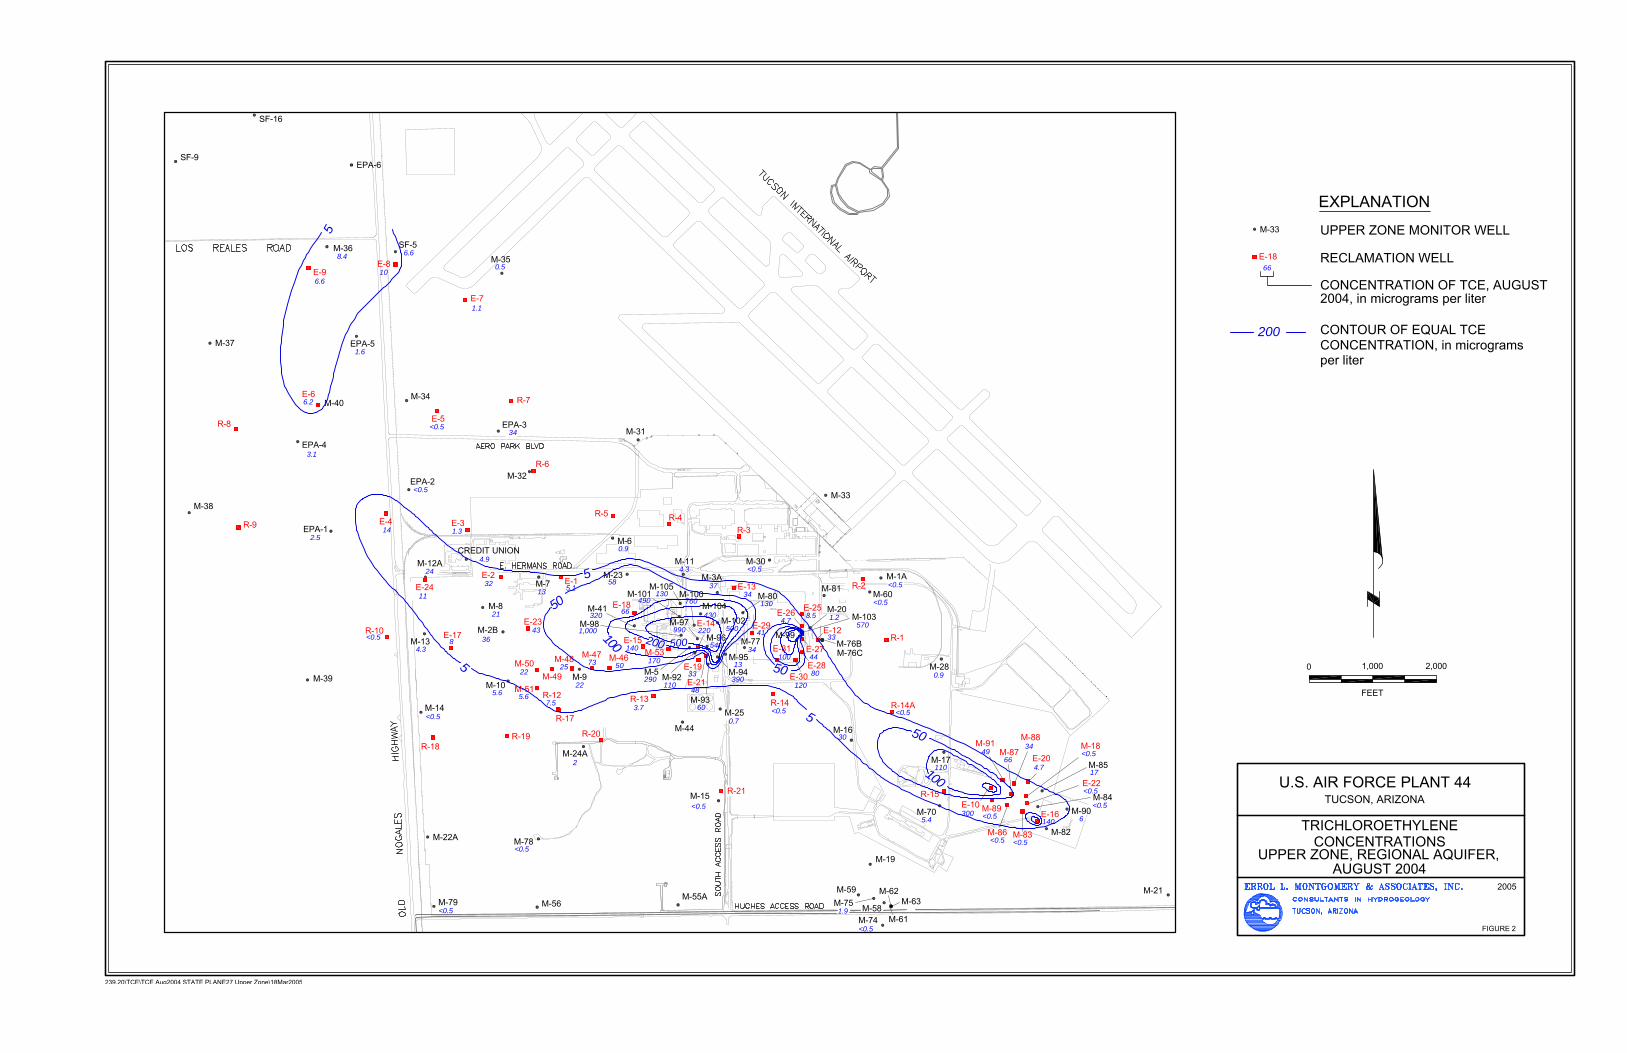
LIST OF FIGURES: FIGURE 1 Water Level Altitude – Regional Aquifer Upper Zone, August 2004 FIGURE 2 Trichloroethylene Concentrations - Regional Aquifer Upper Zone, August 2004
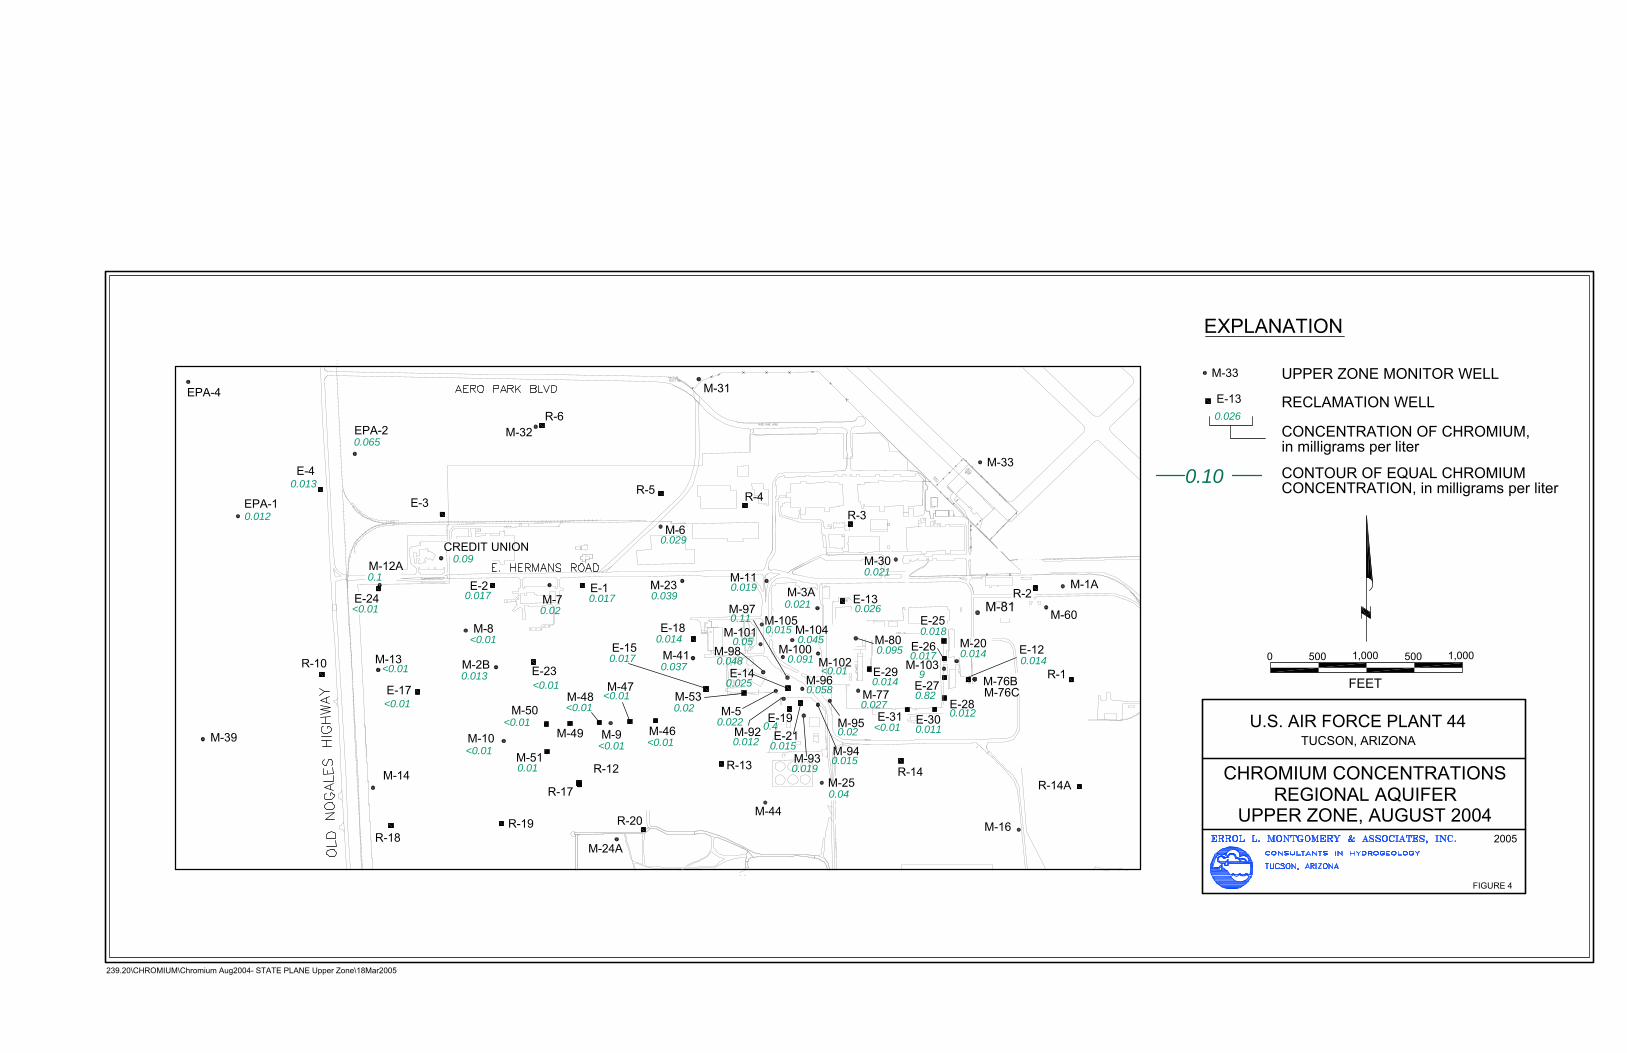
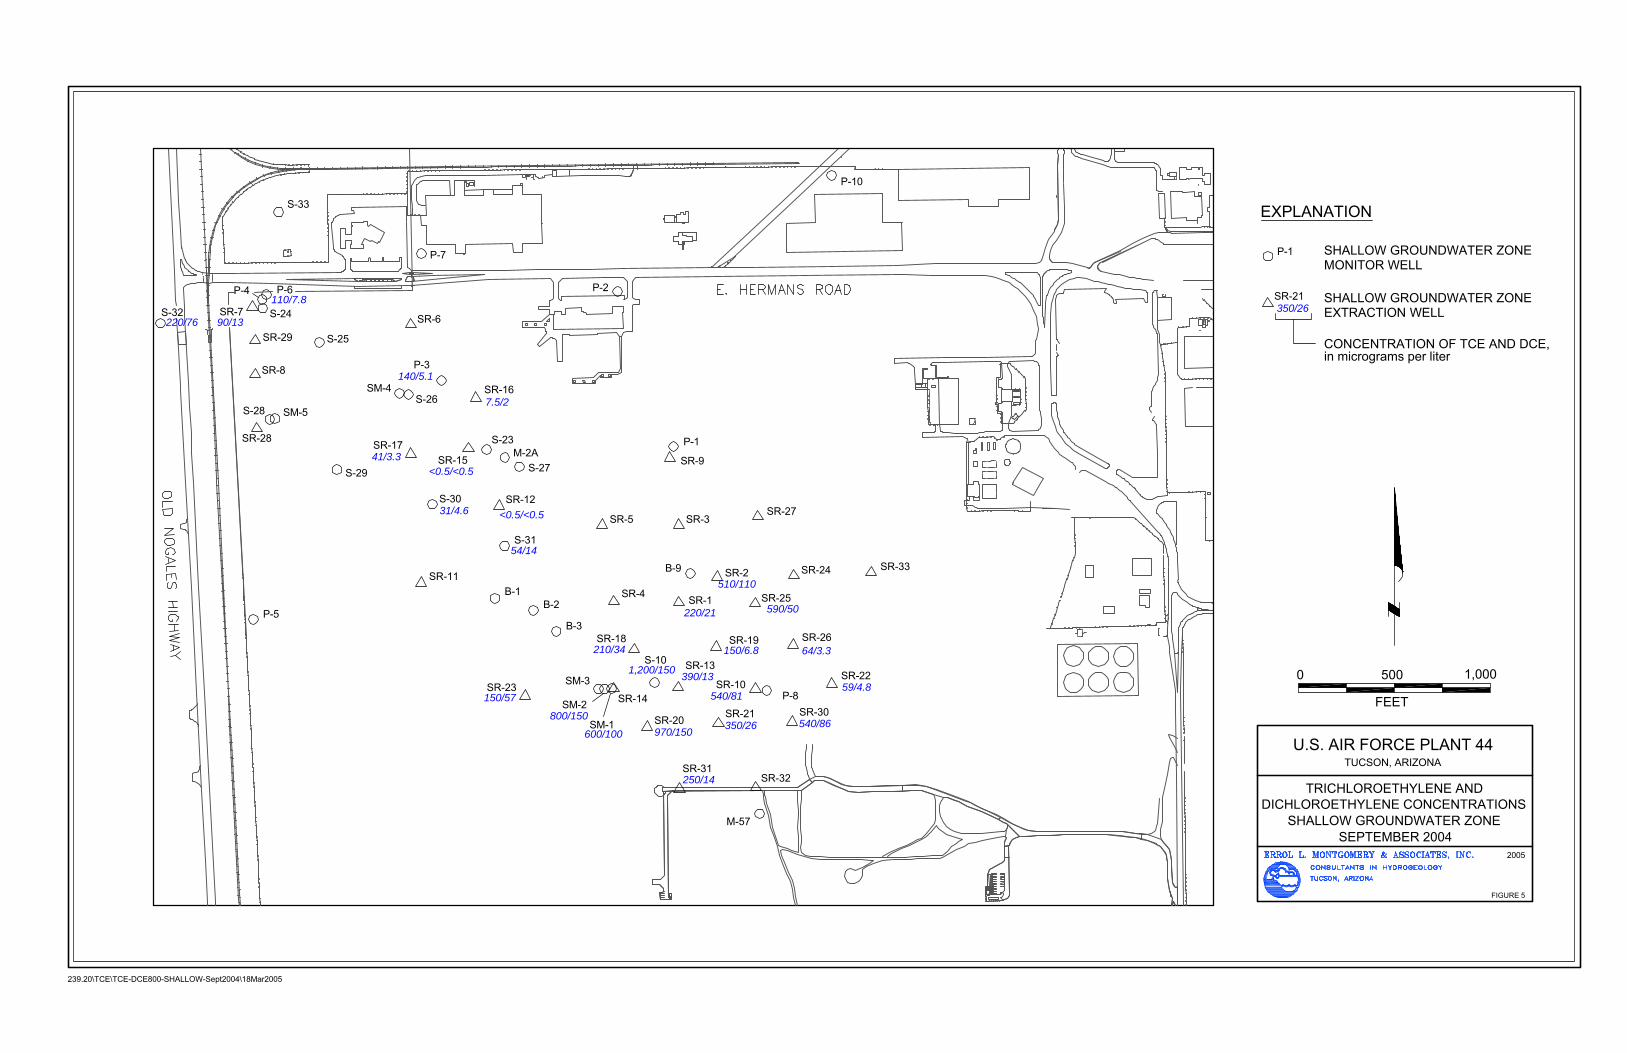
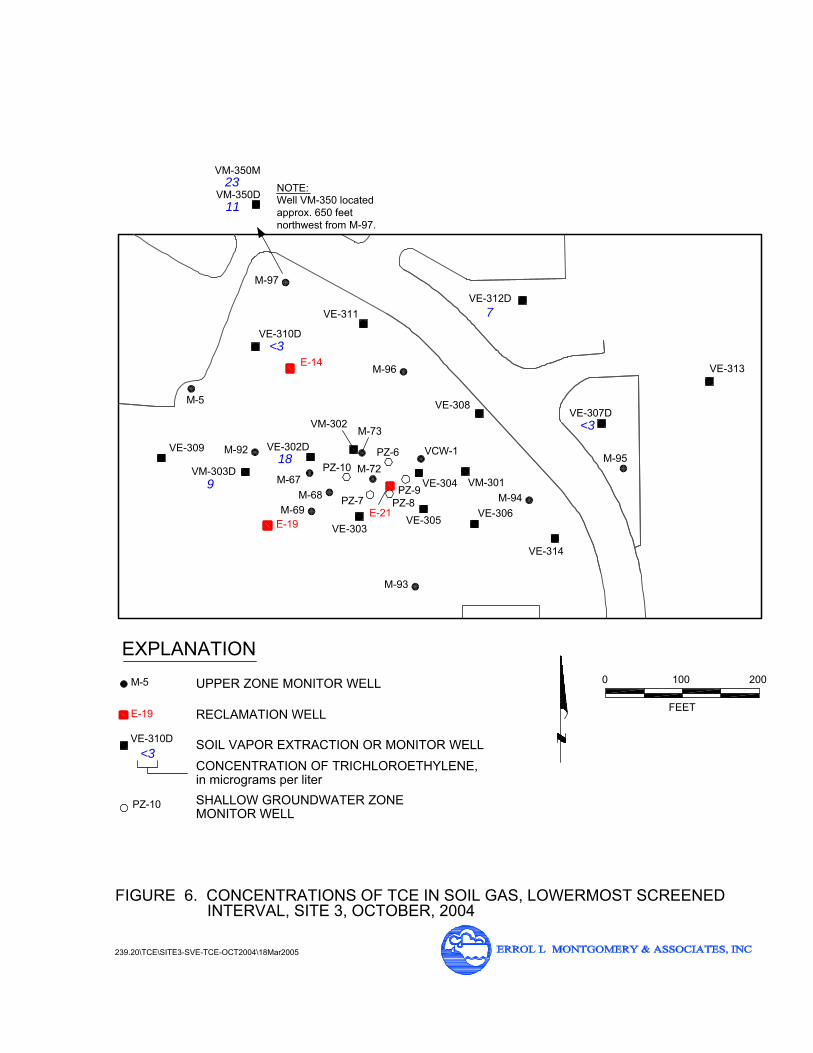
FIGURE 3 Dichloroethylene Concentrations - Regional Aquifer Upper Zone, August 2004 FIGURE 4 Chromium Concentrations - Regional Aquifer Upper Zone, August 2004 FIGURE 5 Trichloroethylene and Dichloroethylene Concentrations, Shallow Groundwater Zone, September, 2004 FIGURE 6 Concentrations of TCE in Soil Gas, Lowermost Screened Interval, Site 3, October, 2004 FIGURE 7 Concentrations of TCE in Soil Gas, Lowermost Screened Interval, Site 5, October, 2004 FIGURE 8 Trichloroethylene Concentrations in Soil Gas, Shallow Groundwater Zone, July, 2004
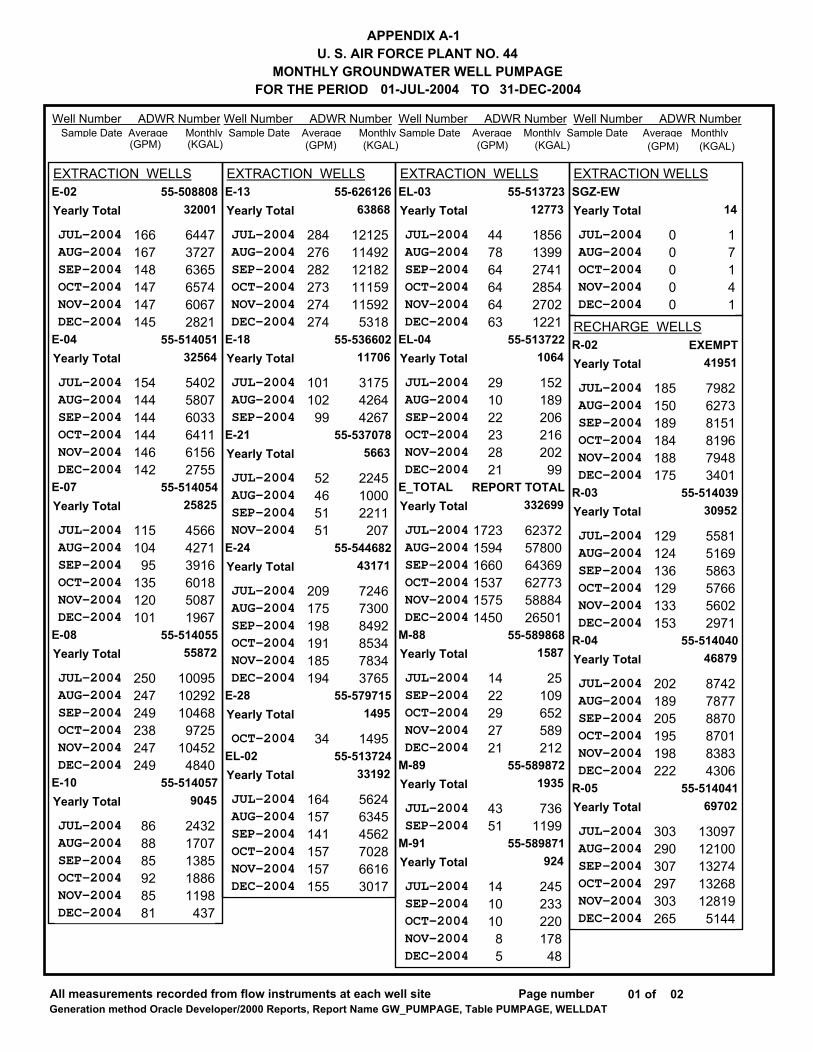
Well Number ADWR Number Well Number ADWR Number Well Number ADWR Number Well Number ADWR Number Sample Date Average Monthly Sample Date Average Monthly Sample Date Average Monthly Sample Date Average Monthly
All measurements recorded from flow instruments at each well site 01Page number ofGeneration method Oracle Developer/2000 Reports, Report Name GW_PUMPAGE, Table PUMPAGE, WELLDAT
APPENDIX A-1U. S. AIR FORCE PLANT NO. 44
MONTHLY GROUNDWATER WELL PUMPAGEFOR THE PERIOD 01-JUL-2004 31-DEC-2004TO
(GPM) (KGAL) (GPM) (KGAL) (GPM) (KGAL) (GPM) (KGAL)
02
JUL-2004AUG-2004SEP-2004OCT-2004NOV-2004DEC-2004
JUL-2004AUG-2004SEP-2004OCT-2004NOV-2004DEC-2004
JUL-2004AUG-2004SEP-2004OCT-2004NOV-2004DEC-2004
JUL-2004AUG-2004SEP-2004OCT-2004NOV-2004DEC-2004
JUL-2004AUG-2004SEP-2004OCT-2004NOV-2004DEC-2004
JUL-2004AUG-2004SEP-2004OCT-2004NOV-2004DEC-2004
JUL-2004AUG-2004SEP-2004
JUL-2004AUG-2004SEP-2004NOV-2004
JUL-2004AUG-2004SEP-2004OCT-2004NOV-2004DEC-2004
OCT-2004
JUL-2004AUG-2004SEP-2004OCT-2004NOV-2004DEC-2004
JUL-2004AUG-2004SEP-2004OCT-2004NOV-2004DEC-2004
JUL-2004AUG-2004SEP-2004OCT-2004NOV-2004DEC-2004
JUL-2004AUG-2004SEP-2004OCT-2004NOV-2004DEC-2004
JUL-2004SEP-2004OCT-2004NOV-2004DEC-2004
JUL-2004SEP-2004
JUL-2004SEP-2004OCT-2004NOV-2004DEC-2004
JUL-2004AUG-2004OCT-2004NOV-2004DEC-2004
JUL-2004AUG-2004SEP-2004OCT-2004NOV-2004DEC-2004
JUL-2004AUG-2004SEP-2004OCT-2004NOV-2004DEC-2004
JUL-2004AUG-2004SEP-2004OCT-2004NOV-2004DEC-2004
JUL-2004AUG-2004SEP-2004OCT-2004NOV-2004DEC-2004
166167148147147145
154144144144146142
115104
95135120101
250247249238247249
868885928581
284276282273274274
101102
99
52465151
209175198191185194
34
164157141157157155
447864646463
291022232821
172315941660153715751450
1422292721
4351
141010
85
00000
185150189184188175
129124136129133153
202189205195198222
303290307297303265
644737276365657460672821
540258076033641161562755
456642713916601850871967
1009510292104689725
104524840
24321707138518861198
437
1212511492121821115911592
5318
317542644267
224510002211
207
724673008492853478343765
1495
562463454562702866163017
185613992741285427021221
152189206216202
99
623725780064369627735888426501
25109652589212
7361199
245233220178
48
17141
798262738151819679483401
558151695863576656022971
874278778870870183834306
1309712100132741326812819
5144
Yearly Total
Yearly Total
Yearly Total
Yearly Total
Yearly Total
Yearly Total
Yearly Total
Yearly Total
Yearly Total
Yearly Total
Yearly Total
Yearly Total
Yearly Total
Yearly Total
Yearly Total
Yearly Total
Yearly Total
Yearly Total
Yearly Total
Yearly Total
Yearly Total
Yearly Total
55-508808
55-514051
55-514054
55-514055
55-514057
55-626126
55-536602
55-537078
55-544682
55-579715
55-513724
55-513723
55-513722
REPORT TOTAL
55-589868
55-589872
55-589871
EXEMPT
55-514039
55-514040
55-514041
32001
32564
25825
55872
9045
63868
11706
5663
43171
1495
33192
12773
1064
332699
1587
1935
924
14
41951
30952
46879
69702
E-02
E-04
E-07
E-08
E-10
E-13
E-18
E-21
E-24
E-28
EL-02
EL-03
EL-04
E_TOTAL
M-88
M-89
M-91
SGZ-EW
R-02
R-03
R-04
R-05
EXTRACTION WELLS EXTRACTION WELLS EXTRACTION WELLS EXTRACTION WELLS
RECHARGE WELLS
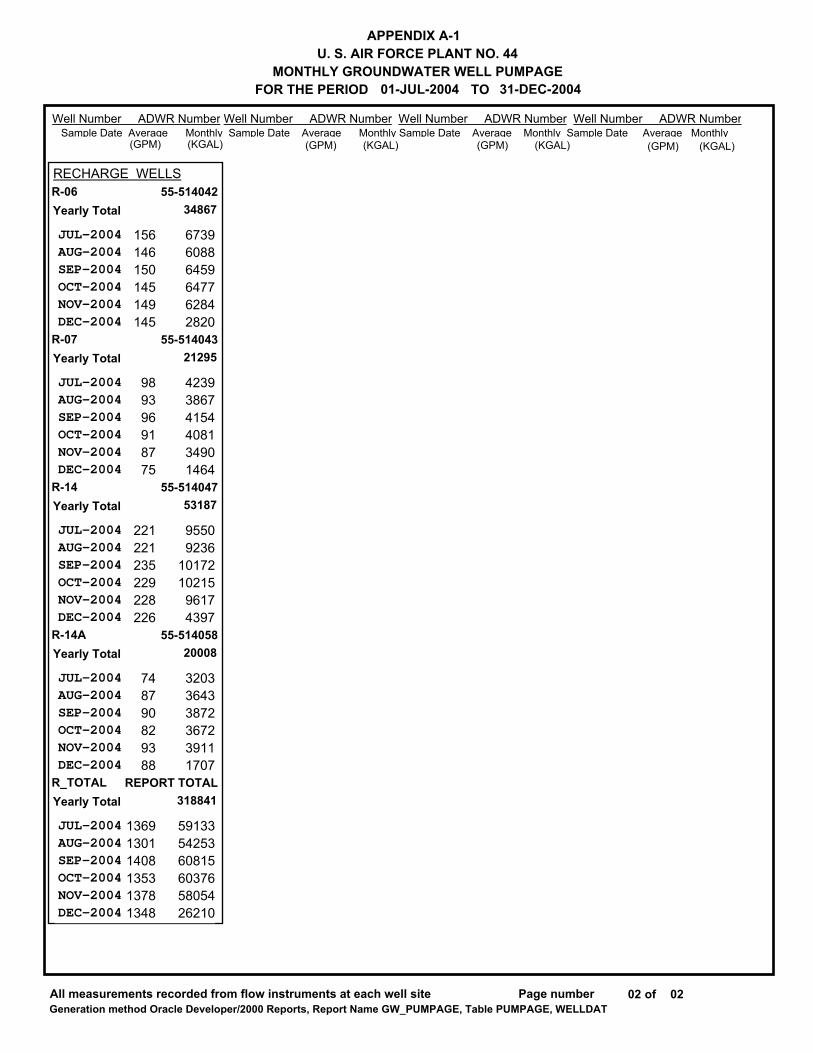
Well Number ADWR Number Well Number ADWR Number Well Number ADWR Number Well Number ADWR Number Sample Date Average Monthly Sample Date Average Monthly Sample Date Average Monthly Sample Date Average Monthly
All measurements recorded from flow instruments at each well site 02Page number ofGeneration method Oracle Developer/2000 Reports, Report Name GW_PUMPAGE, Table PUMPAGE, WELLDAT
APPENDIX A-1U. S. AIR FORCE PLANT NO. 44
MONTHLY GROUNDWATER WELL PUMPAGEFOR THE PERIOD 01-JUL-2004 31-DEC-2004TO
(GPM) (KGAL) (GPM) (KGAL) (GPM) (KGAL) (GPM) (KGAL)
02
JUL-2004AUG-2004SEP-2004OCT-2004NOV-2004DEC-2004
JUL-2004AUG-2004SEP-2004OCT-2004NOV-2004DEC-2004
JUL-2004AUG-2004SEP-2004OCT-2004NOV-2004DEC-2004
JUL-2004AUG-2004SEP-2004OCT-2004NOV-2004DEC-2004
JUL-2004AUG-2004SEP-2004OCT-2004NOV-2004DEC-2004
156146150145149145
989396918775
221221235229228226
748790829388
136913011408135313781348
673960886459647762842820
423938674154408134901464
95509236
101721021596174397
320336433872367239111707
591335425360815603765805426210
Yearly Total
Yearly Total
Yearly Total
Yearly Total
Yearly Total
55-514042
55-514043
55-514047
55-514058
REPORT TOTAL
34867
21295
53187
20008
318841
R-06
R-07
R-14
R-14A
R_TOTAL
RECHARGE WELLS
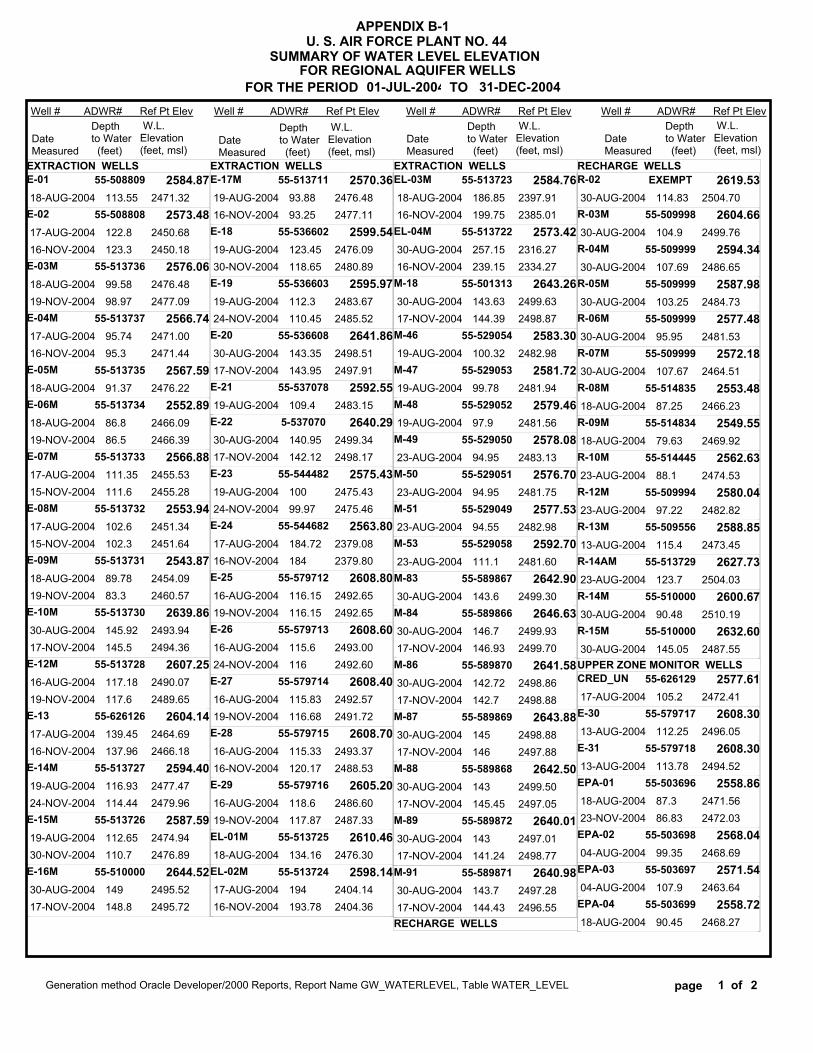
APPENDIX B-1U. S. AIR FORCE PLANT NO. 44
SUMMARY OF WATER LEVEL ELEVATION
FOR THE PERIOD 01-JUL-2004 31-DEC-2004TO
Generation method Oracle Developer/2000 Reports, Report Name GW_WATERLEVEL, Table WATER_LEVEL 1 ofpage
Well # ADWR# Ref Pt Elev Well # ADWR# Ref Pt Elev Well # ADWR# Ref Pt Elev Well # ADWR# Ref Pt Elev
FOR REGIONAL AQUIFER WELLS
DateMeasured
Depth to Water (feet)
W.L.Elevation(feet, msl)
DateMeasured
Depth to Water (feet)
W.L.Elevation(feet, msl)
DateMeasured
Depth to Water (feet)
W.L.Elevation(feet, msl)
DateMeasured
Depth to Water (feet)
W.L.Elevation(feet, msl)
2
18-AUG-2004
17-AUG-200416-NOV-2004
18-AUG-200419-NOV-2004
17-AUG-200416-NOV-2004
18-AUG-2004
18-AUG-200419-NOV-2004
17-AUG-200415-NOV-2004
17-AUG-200415-NOV-2004
18-AUG-200419-NOV-2004
30-AUG-200417-NOV-2004
16-AUG-200419-NOV-2004
17-AUG-200416-NOV-2004
19-AUG-200424-NOV-2004
19-AUG-200430-NOV-2004
30-AUG-200417-NOV-2004
19-AUG-200416-NOV-2004
19-AUG-200430-NOV-2004
19-AUG-200424-NOV-2004
30-AUG-200417-NOV-2004
19-AUG-2004
30-AUG-200417-NOV-2004
19-AUG-200424-NOV-2004
17-AUG-200416-NOV-2004
16-AUG-200419-NOV-2004
16-AUG-200424-NOV-2004
16-AUG-200419-NOV-2004
16-AUG-200416-NOV-2004
16-AUG-200419-NOV-2004
18-AUG-2004
17-AUG-200416-NOV-2004
18-AUG-200416-NOV-2004
30-AUG-200416-NOV-2004
30-AUG-200417-NOV-2004
19-AUG-2004
19-AUG-2004
19-AUG-2004
23-AUG-2004
23-AUG-2004
23-AUG-2004
23-AUG-2004
30-AUG-2004
30-AUG-200417-NOV-2004
30-AUG-200417-NOV-2004
30-AUG-200417-NOV-2004
30-AUG-200417-NOV-2004
30-AUG-200417-NOV-2004
30-AUG-200417-NOV-2004
30-AUG-2004
30-AUG-2004
30-AUG-2004
30-AUG-2004
30-AUG-2004
30-AUG-2004
18-AUG-2004
18-AUG-2004
23-AUG-2004
23-AUG-2004
13-AUG-2004
23-AUG-2004
30-AUG-2004
30-AUG-2004
17-AUG-2004
13-AUG-2004
13-AUG-2004
18-AUG-200423-NOV-2004
04-AUG-2004
04-AUG-2004
18-AUG-2004
113.55
122.8123.3
99.5898.97
95.7495.3
91.37
86.886.5
111.35111.6
102.6102.3
89.7883.3
145.92145.5
117.18117.6
139.45137.96
116.93114.44
112.65110.7
149148.8
93.8893.25
123.45118.65
112.3110.45
143.35143.95
109.4
140.95142.12
10099.97
184.72184
116.15116.15
115.6116
115.83116.68
115.33120.17
118.6117.87
134.16
194193.78
186.85199.75
257.15239.15
143.63144.39
100.32
99.78
97.9
94.95
94.95
94.55
111.1
143.6
146.7146.93
142.72142.7
145146
143145.45
143141.24
143.7144.43
114.83
104.9
107.69
103.25
95.95
107.67
87.25
79.63
88.1
97.22
115.4
123.7
90.48
145.05
105.2
112.25
113.78
87.386.83
99.35
107.9
90.45
2471.32
2450.68 2450.18
2476.48 2477.09
2471.00 2471.44
2476.22
2466.09 2466.39
2455.53 2455.28
2451.34 2451.64
2454.09 2460.57
2493.94 2494.36
2490.07 2489.65
2464.69 2466.18
2477.47 2479.96
2474.94 2476.89
2495.52 2495.72
2476.48 2477.11
2476.09 2480.89
2483.67 2485.52
2498.51 2497.91
2483.15
2499.34 2498.17
2475.43 2475.46
2379.08 2379.80
2492.65 2492.65
2493.00 2492.60
2492.57 2491.72
2493.37 2488.53
2486.60 2487.33
2476.30
2404.14 2404.36
2397.91 2385.01
2316.27 2334.27
2499.63 2498.87
2482.98
2481.94
2481.56
2483.13
2481.75
2482.98
2481.60
2499.30
2499.93 2499.70
2498.86 2498.88
2498.88 2497.88
2499.50 2497.05
2497.01 2498.77
2497.28 2496.55
2504.70
2499.76
2486.65
2484.73
2481.53
2464.51
2466.23
2469.92
2474.53
2482.82
2473.45
2504.03
2510.19
2487.55
2472.41
2496.05
2494.52
2471.56 2472.03
2468.69
2463.64
2468.27
E-01
E-02
E-03M
E-04M
E-05M
E-06M
E-07M
E-08M
E-09M
E-10M
E-12M
E-13
E-14M
E-15M
E-16M
E-17M
E-18
E-19
E-20
E-21
E-22
E-23
E-24
E-25
E-26
E-27
E-28
E-29
EL-01M
EL-02M
EL-03M
EL-04M
M-18
M-46
M-47
M-48
M-49
M-50
M-51
M-53
M-83
M-84
M-86
M-87
M-88
M-89
M-91
R-02
R-03M
R-04M
R-05M
R-06M
R-07M
R-08M
R-09M
R-10M
R-12M
R-13M
R-14AM
R-14M
R-15M
CRED_UN
E-30
E-31
EPA-01
EPA-02
EPA-03
EPA-04
55-508809
55-508808
55-513736
55-513737
55-513735
55-513734
55-513733
55-513732
55-513731
55-513730
55-513728
55-626126
55-513727
55-513726
55-510000
55-513711
55-536602
55-536603
55-536608
55-537078
5-537070
55-544482
55-544682
55-579712
55-579713
55-579714
55-579715
55-579716
55-513725
55-513724
55-513723
55-513722
55-501313
55-529054
55-529053
55-529052
55-529050
55-529051
55-529049
55-529058
55-589867
55-589866
55-589870
55-589869
55-589868
55-589872
55-589871
EXEMPT
55-509998
55-509999
55-509999
55-509999
55-509999
55-514835
55-514834
55-514445
55-509994
55-509556
55-513729
55-510000
55-510000
55-626129
55-579717
55-579718
55-503696
55-503698
55-503697
55-503699
2584.87
2573.48
2576.06
2566.74
2567.59
2552.89
2566.88
2553.94
2543.87
2639.86
2607.25
2604.14
2594.40
2587.59
2644.52
2570.36
2599.54
2595.97
2641.86
2592.55
2640.29
2575.43
2563.80
2608.80
2608.60
2608.40
2608.70
2605.20
2610.46
2598.14
2584.76
2573.42
2643.26
2583.30
2581.72
2579.46
2578.08
2576.70
2577.53
2592.70
2642.90
2646.63
2641.58
2643.88
2642.50
2640.01
2640.98
2619.53
2604.66
2594.34
2587.98
2577.48
2572.18
2553.48
2549.55
2562.63
2580.04
2588.85
2627.73
2600.67
2632.60
2577.61
2608.30
2608.30
2558.86
2568.04
2571.54
2558.72
EXTRACTION WELLS EXTRACTION WELLS EXTRACTION WELLS
RECHARGE WELLS
RECHARGE WELLS
UPPER ZONE MONITOR WELLS
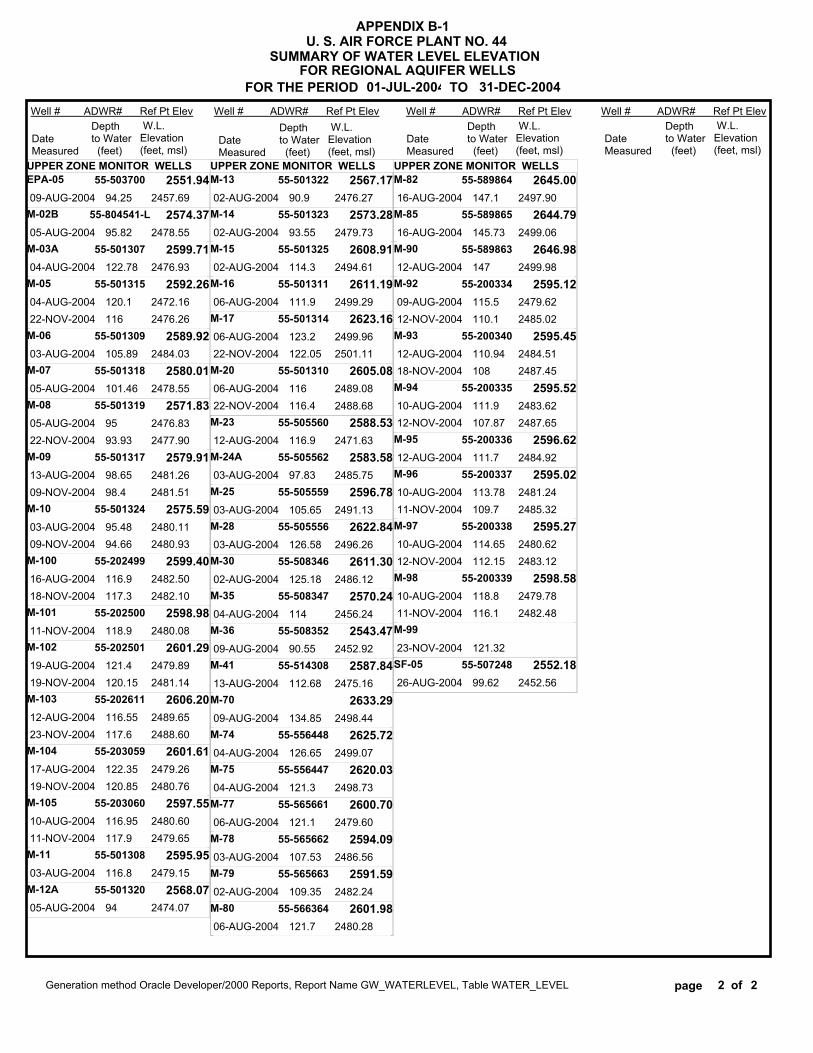
APPENDIX B-1U. S. AIR FORCE PLANT NO. 44
SUMMARY OF WATER LEVEL ELEVATION
FOR THE PERIOD 01-JUL-2004 31-DEC-2004TO
Generation method Oracle Developer/2000 Reports, Report Name GW_WATERLEVEL, Table WATER_LEVEL 2 ofpage
Well # ADWR# Ref Pt Elev Well # ADWR# Ref Pt Elev Well # ADWR# Ref Pt Elev Well # ADWR# Ref Pt Elev
FOR REGIONAL AQUIFER WELLS
DateMeasured
Depth to Water (feet)
W.L.Elevation(feet, msl)
DateMeasured
Depth to Water (feet)
W.L.Elevation(feet, msl)
DateMeasured
Depth to Water (feet)
W.L.Elevation(feet, msl)
DateMeasured
Depth to Water (feet)
W.L.Elevation(feet, msl)
2
09-AUG-2004
05-AUG-2004
04-AUG-2004
04-AUG-200422-NOV-2004
03-AUG-2004
05-AUG-2004
05-AUG-200422-NOV-2004
13-AUG-200409-NOV-2004
03-AUG-200409-NOV-2004
16-AUG-200418-NOV-2004
11-NOV-2004
19-AUG-200419-NOV-2004
12-AUG-200423-NOV-2004
17-AUG-200419-NOV-2004
10-AUG-200411-NOV-2004
03-AUG-2004
05-AUG-2004
02-AUG-2004
02-AUG-2004
02-AUG-2004
06-AUG-2004
06-AUG-200422-NOV-2004
06-AUG-200422-NOV-2004
12-AUG-2004
03-AUG-2004
03-AUG-2004
03-AUG-2004
02-AUG-2004
04-AUG-2004
09-AUG-2004
13-AUG-2004
09-AUG-2004
04-AUG-2004
04-AUG-2004
06-AUG-2004
03-AUG-2004
02-AUG-2004
06-AUG-2004
16-AUG-2004
16-AUG-2004
12-AUG-2004
09-AUG-200412-NOV-2004
12-AUG-200418-NOV-2004
10-AUG-200412-NOV-2004
12-AUG-2004
10-AUG-200411-NOV-2004
10-AUG-200412-NOV-2004
10-AUG-200411-NOV-2004
23-NOV-2004
26-AUG-2004
94.25
95.82
122.78
120.1116
105.89
101.46
9593.93
98.6598.4
95.4894.66
116.9117.3
118.9
121.4120.15
116.55117.6
122.35120.85
116.95117.9
116.8
94
90.9
93.55
114.3
111.9
123.2122.05
116116.4
116.9
97.83
105.65
126.58
125.18
114
90.55
112.68
134.85
126.65
121.3
121.1
107.53
109.35
121.7
147.1
145.73
147
115.5110.1
110.94108
111.9107.87
111.7
113.78109.7
114.65112.15
118.8116.1
121.32
99.62
2457.69
2478.55
2476.93
2472.16 2476.26
2484.03
2478.55
2476.83 2477.90
2481.26 2481.51
2480.11 2480.93
2482.50 2482.10
2480.08
2479.89 2481.14
2489.65 2488.60
2479.26 2480.76
2480.60 2479.65
2479.15
2474.07
2476.27
2479.73
2494.61
2499.29
2499.96 2501.11
2489.08 2488.68
2471.63
2485.75
2491.13
2496.26
2486.12
2456.24
2452.92
2475.16
2498.44
2499.07
2498.73
2479.60
2486.56
2482.24
2480.28
2497.90
2499.06
2499.98
2479.62 2485.02
2484.51 2487.45
2483.62 2487.65
2484.92
2481.24 2485.32
2480.62 2483.12
2479.78 2482.48
2452.56
EPA-05
M-02B
M-03A
M-05
M-06
M-07
M-08
M-09
M-10
M-100
M-101
M-102
M-103
M-104
M-105
M-11
M-12A
M-13
M-14
M-15
M-16
M-17
M-20
M-23
M-24A
M-25
M-28
M-30
M-35
M-36
M-41
M-70
M-74
M-75
M-77
M-78
M-79
M-80
M-82
M-85
M-90
M-92
M-93
M-94
M-95
M-96
M-97
M-98
M-99
SF-05
55-503700
55-804541-L
55-501307
55-501315
55-501309
55-501318
55-501319
55-501317
55-501324
55-202499
55-202500
55-202501
55-202611
55-203059
55-203060
55-501308
55-501320
55-501322
55-501323
55-501325
55-501311
55-501314
55-501310
55-505560
55-505562
55-505559
55-505556
55-508346
55-508347
55-508352
55-514308
55-556448
55-556447
55-565661
55-565662
55-565663
55-566364
55-589864
55-589865
55-589863
55-200334
55-200340
55-200335
55-200336
55-200337
55-200338
55-200339
55-507248
2551.94
2574.37
2599.71
2592.26
2589.92
2580.01
2571.83
2579.91
2575.59
2599.40
2598.98
2601.29
2606.20
2601.61
2597.55
2595.95
2568.07
2567.17
2573.28
2608.91
2611.19
2623.16
2605.08
2588.53
2583.58
2596.78
2622.84
2611.30
2570.24
2543.47
2587.84
2633.29
2625.72
2620.03
2600.70
2594.09
2591.59
2601.98
2645.00
2644.79
2646.98
2595.12
2595.45
2595.52
2596.62
2595.02
2595.27
2598.58
2552.18
UPPER ZONE MONITOR WELLS UPPER ZONE MONITOR WELLS UPPER ZONE MONITOR WELLS
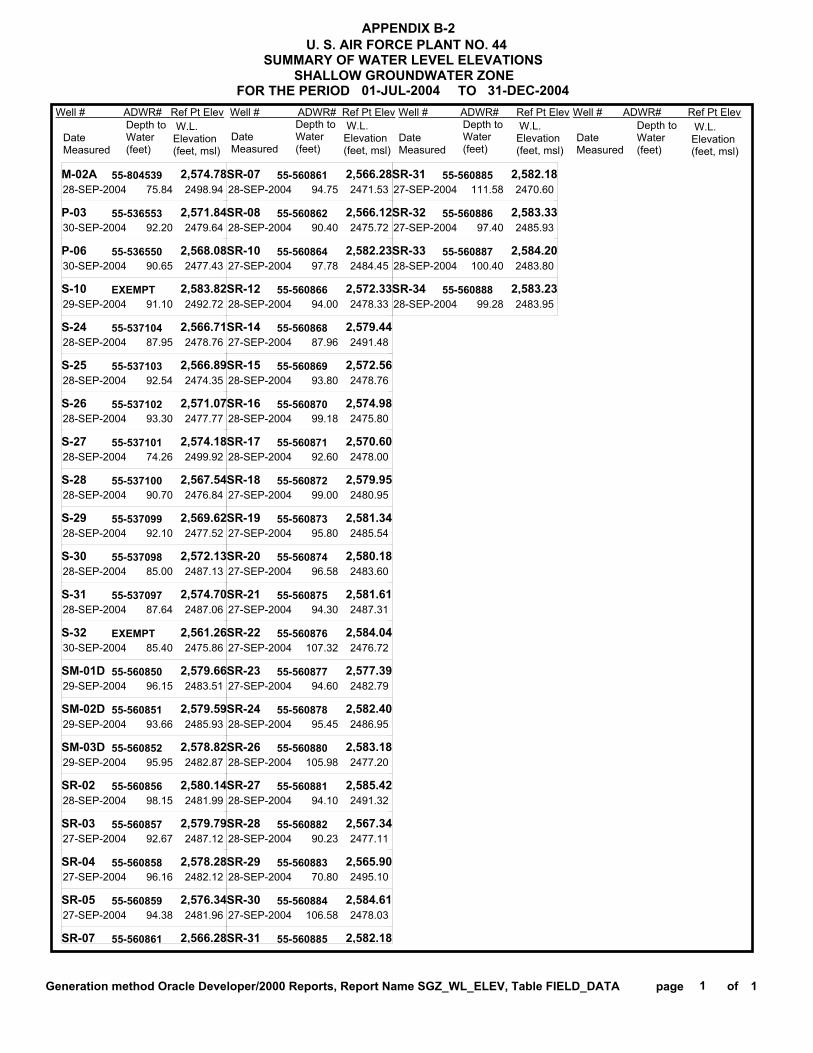
U. S. AIR FORCE PLANT NO. 44
SHALLOW GROUNDWATER ZONE FOR THE PERIOD 01-JUL-2004 31-DEC-2004TO
Generation method Oracle Developer/2000 Reports, Report Name SGZ_WL_ELEV, Table FIELD_DATA 1 of
Well # ADWR# Ref Pt Elev Well # ADWR# Ref Pt Elev Well # ADWR# Ref Pt Elev Well # ADWR# Ref Pt Elev
SUMMARY OF WATER LEVEL ELEVATIONS
DateMeasured
Depth toWater(feet)
W.L.Elevation(feet, msl)
DateMeasured
DateMeasured
DateMeasured
Depth toWater(feet)
W.L.Elevation(feet, msl)
Depth toWater(feet)
W.L.Elevation(feet, msl)
Depth toWater(feet)
W.L.Elevation(feet, msl)
APPENDIX B-2
page 1
28-SEP-2004
30-SEP-2004
30-SEP-2004
29-SEP-2004
28-SEP-2004
28-SEP-2004
28-SEP-2004
28-SEP-2004
28-SEP-2004
28-SEP-2004
28-SEP-2004
28-SEP-2004
30-SEP-2004
29-SEP-2004
29-SEP-2004
29-SEP-2004
28-SEP-2004
27-SEP-2004
27-SEP-2004
27-SEP-2004
28-SEP-2004
28-SEP-2004
27-SEP-2004
28-SEP-2004
27-SEP-2004
28-SEP-2004
28-SEP-2004
28-SEP-2004
27-SEP-2004
27-SEP-2004
27-SEP-2004
27-SEP-2004
27-SEP-2004
27-SEP-2004
28-SEP-2004
28-SEP-2004
28-SEP-2004
28-SEP-2004
28-SEP-2004
27-SEP-2004
27-SEP-2004
27-SEP-2004
28-SEP-2004
28-SEP-2004
75.84
92.20
90.65
91.10
87.95
92.54
93.30
74.26
90.70
92.10
85.00
87.64
85.40
96.15
93.66
95.95
98.15
92.67
96.16
94.38
94.75
90.40
97.78
94.00
87.96
93.80
99.18
92.60
99.00
95.80
96.58
94.30
107.32
94.60
95.45
105.98
94.10
90.23
70.80
106.58
111.58
97.40
100.40
99.28
2498.94
2479.64
2477.43
2492.72
2478.76
2474.35
2477.77
2499.92
2476.84
2477.52
2487.13
2487.06
2475.86
2483.51
2485.93
2482.87
2481.99
2487.12
2482.12
2481.96
2471.53
2475.72
2484.45
2478.33
2491.48
2478.76
2475.80
2478.00
2480.95
2485.54
2483.60
2487.31
2476.72
2482.79
2486.95
2477.20
2491.32
2477.11
2495.10
2478.03
2470.60
2485.93
2483.80
2483.95
M-02A
P-03
P-06
S-10
S-24
S-25
S-26
S-27
S-28
S-29
S-30
S-31
S-32
SM-01D
SM-02D
SM-03D
SR-02
SR-03
SR-04
SR-05
SR-07
SR-07
SR-08
SR-10
SR-12
SR-14
SR-15
SR-16
SR-17
SR-18
SR-19
SR-20
SR-21
SR-22
SR-23
SR-24
SR-26
SR-27
SR-28
SR-29
SR-30
SR-31
SR-31
SR-32
SR-33
SR-34
55-804539
55-536553
55-536550
EXEMPT
55-537104
55-537103
55-537102
55-537101
55-537100
55-537099
55-537098
55-537097
EXEMPT
55-560850
55-560851
55-560852
55-560856
55-560857
55-560858
55-560859
55-560861
55-560861
55-560862
55-560864
55-560866
55-560868
55-560869
55-560870
55-560871
55-560872
55-560873
55-560874
55-560875
55-560876
55-560877
55-560878
55-560880
55-560881
55-560882
55-560883
55-560884
55-560885
55-560885
55-560886
55-560887
55-560888
2,574.78
2,571.84
2,568.08
2,583.82
2,566.71
2,566.89
2,571.07
2,574.18
2,567.54
2,569.62
2,572.13
2,574.70
2,561.26
2,579.66
2,579.59
2,578.82
2,580.14
2,579.79
2,578.28
2,576.34
2,566.28
2,566.28
2,566.12
2,582.23
2,572.33
2,579.44
2,572.56
2,574.98
2,570.60
2,579.95
2,581.34
2,580.18
2,581.61
2,584.04
2,577.39
2,582.40
2,583.18
2,585.42
2,567.34
2,565.90
2,584.61
2,582.18
2,582.18
2,583.33
2,584.20
2,583.23
DateTCE(ug/l)
Wellsite
APPENDIX C-1U. S. AIR FORCE PLANT NO. 44
FROM THE REGIONAL AQUIFER WELLSFOR THE PERIOD 01-JUL-2004 31-DEC-2004TO
(-) Means less than detection limit.N/A means not available. Only LOCKED data is reported.Generation method Oracle Developer/2000 Reports, Report Name GW_ QUALITY, Table SAMPLE_INFO, LAB_RESULTS, WELLDAT
1 ofpage number
DCE(ug/l) Date
TCE(ug/l)
WellsiteDCE(ug/l)
WATER QUALITY RESULTS ON SAMPLES TAKEN
CHR(mg/l)
TEMP(centig)
ELEC.COND.(umhos) pH CHR
(mg/l)TEMP
(centig)
ELEC.COND.(umhos) pH
4
EXTRACTION WELLS EXTRACTION WELLS
E-01
E-02
E-03
E-04
E-05
E-06
E-07
E-08
E-09
E-10
E-12
E-13
E-14
E-15
E-16
E-16
E-17
E-18
E-19
E-20
E-21
E-22
E-23
E-24
E-25
E-26
E-27
E-28
E-29
18-AUG-2004
17-AUG-2004
16-NOV-2004
18-AUG-2004
19-NOV-2004
17-AUG-2004
16-NOV-2004
18-AUG-2004
18-AUG-2004
19-NOV-2004
17-AUG-2004
15-NOV-2004
17-AUG-2004
15-NOV-2004
18-AUG-2004
19-NOV-2004
30-AUG-2004
17-NOV-2004
16-AUG-2004
19-NOV-2004
17-AUG-2004
16-NOV-2004
19-AUG-2004
24-NOV-2004
19-AUG-2004
30-NOV-2004
30-AUG-2004
17-NOV-2004
19-AUG-2004
16-NOV-2004
19-AUG-2004
30-NOV-2004
19-AUG-2004
24-NOV-2004
30-AUG-2004
17-NOV-2004
19-AUG-2004
30-AUG-2004
17-NOV-2004
19-AUG-2004
24-NOV-2004
17-AUG-2004
16-NOV-2004
16-AUG-2004
19-NOV-2004
16-AUG-2004
24-NOV-2004
16-AUG-2004
19-NOV-2004
16-AUG-2004
16-NOV-2004
16-AUG-2004
19-NOV-2004
5.1
32
34
1.3
1.7
14
13
<0.5
6.2
8.4
1.1
1.6
10
13
6.6
12
300
18
33
39
34
35
220
<0.5
140
150
140
230
8.0
7.1
66
38
33
87
4.7
6.1
48
<0.5
<0.5
43
46
11
15
8.5
20
4.7
31
44
91
80
28
41
50
0.6
3.2
4.5
<0.5
<0.5
1.8
1.7
<0.5
1.1
1.5
<0.5
<0.5
1.4
1.9
0.7
1.9
<1.0
<0.5
1.5
7.0
5.4
4.8
18
<0.5
29
29
<1.0
<0.5
2.0
1.5
9.8
3.0
3.3
<0.5
<0.5
<0.5
<1.0
<0.5
<0.5
5.1
4.8
2.3
2.9
1.0
2.5
0.9
6.3
15
31
1.8
1.1
4.0
4.9
25.5
25.9
24
25.5
23.9
25.4
23.5
25.8
25.3
23.4
26.1
22.6
26.6
22.9
25.1
23.9
27.3
24.9
25.5
23
25.8
24.5
24.9
19.4
27.2
20.8
28.7
24.2
26
23.5
27.2
21.2
29.1
19.6
27.5
24.7
25.5
27.4
24.8
25.6
21
25.9
22.8
26.4
23.7
24.9
22.5
24.7
23
25.1
24.7
24.6
23.5
621
684.7
593.2
574.3
587.1
566.1
572.7
528.8
549.8
557.4
590.1
559.9
540.9
595.2
574.7
582.9
449.5
453
554.1
682.6
598.1
605.8
621.1
706.8
537.7
576
408.8
429.4
454.3
461.1
535.1
613.1
562.9
472
461.8
476.3
675.9
459.5
476.3
460.9
465.5
516.7
526.5
597.3
611.8
521.4
551.6
705
974.1
527.9
569.9
621.9
694.5
7.43
7.35
7.68
7.4
7.59
7.51
7.64
7.39
7.39
7.52
7.41
7.53
7.52
7.6
7.53
7.56
7.24
7.45
7.54
7.51
7.63
7.67
7.43
7.75
7.39
7.19
7.21
7.49
7.4
7.55
7.45
7.43
7.32
7.62
7.11
7.45
7.51
7.37
7.64
7.4
7.59
7.55
7.6
7.56
7.73
7.61
7.68
7.44
7.39
7.46
7.6
7.5
7.52
0.017
0.017
0.014
0.050
0.013
0.013
0.012
0.014
1.6
0.026
0.025
0.025
0.051
0.017
0.019
<0.010
<0.010
<0.010
0.014
0.030
0.40
0.72
<0.010
0.015
0.034
0.014
<0.010
<0.010
<0.010
<0.010
0.018
0.019
0.017
0.040
0.82
<0.010
0.012
0.012
0.014
0.021
DateTCE(ug/l)
Wellsite
APPENDIX C-1U. S. AIR FORCE PLANT NO. 44
FROM THE REGIONAL AQUIFER WELLSFOR THE PERIOD 01-JUL-2004 31-DEC-2004TO
(-) Means less than detection limit.N/A means not available. Only LOCKED data is reported.Generation method Oracle Developer/2000 Reports, Report Name GW_ QUALITY, Table SAMPLE_INFO, LAB_RESULTS, WELLDAT
2 ofpage number
DCE(ug/l) Date
TCE(ug/l)
WellsiteDCE(ug/l)
WATER QUALITY RESULTS ON SAMPLES TAKEN
CHR(mg/l)
TEMP(centig)
ELEC.COND.(umhos) pH CHR
(mg/l)TEMP
(centig)
ELEC.COND.(umhos) pH
4
EXTRACTION WELLS EXTRACTION WELLS
UPPER ZONE MONITOR WELLS
EL-01
EL-02
EL-03
EL-04
M-18
M-46
M-47
M-48
M-50
M-51
M-53
M-83
M-84
M-86
M-87
M-88
M-89
M-89
M-91
CRED_UN
E-30
E-31
EPA-01
EPA-02
EPA-03
EPA-04
EPA-05
M-02B
M-03A
M-05
M-06
M-07
M-08
M-09
M-10
18-AUG-2004
17-AUG-2004
16-NOV-2004
18-AUG-2004
16-NOV-2004
30-AUG-2004
16-NOV-2004
30-AUG-2004
17-NOV-2004
19-AUG-2004
19-AUG-2004
19-AUG-2004
23-AUG-2004
23-AUG-2004
23-AUG-2004
30-AUG-2004
30-AUG-2004
17-NOV-2004
30-AUG-2004
17-NOV-2004
30-AUG-2004
17-NOV-2004
30-AUG-2004
17-NOV-2004
30-AUG-2004
17-NOV-2004
30-AUG-2004
17-NOV-2004
17-AUG-2004
13-AUG-2004
13-AUG-2004
18-AUG-2004
23-NOV-2004
04-AUG-2004
04-AUG-2004
18-AUG-2004
09-AUG-2004
05-AUG-2004
04-AUG-2004
04-AUG-2004
22-NOV-2004
03-AUG-2004
05-AUG-2004
05-AUG-2004
22-NOV-2004
13-AUG-2004
09-NOV-2004
03-AUG-2004
<0.5
41
36
8.5
11
6.7
22
<0.5
1.4
50
73
25
22
5.6
170
<0.5
<0.5
<0.5
<0.5
<0.5
66
<0.5
34
49
<0.5
7.6
49
190
4.9
120
100
2.5
2.4
<0.5
34
3.1
1.6
36
37
290
240
0.9
13
21
22
22
26
5.6
<0.5
4.9
3.2
0.6
0.7
0.9
0.9
<0.5
<0.5
3.0
10
1.0
2.7
0.6
44
<0.5
<0.5
<0.5
<0.5
<0.5
<0.5
<0.5
<1.0
<0.5
<0.5
<0.5
<0.5
<0.5
<0.5
<2.5
<2.5
<0.5
<0.5
<0.5
4.3
<0.5
<0.5
6.2
8.3
94
87
<0.5
1.9
3.3
3.6
2.3
2.5
1.9
28.3
27.3
24.5
28.1
25
30.1
24.6
28.1
24.7
25.8
25.5
25.5
25.4
26.1
25.3
27.5
28.6
23.4
26.5
23.7
26.1
24.3
27.1
24.4
25.8
23.4
26.5
24
26.2
26.1
25.7
24.9
22.8
25.3
25.5
25
26.4
25.1
25.9
25.4
23.2
26.2
25
24.8
23
24.7
24.1
25.3
380.4
495.4
509.7
377.2
385
421
418.1
474
487.4
484.6
472.8
444.1
518.3
496.7
611.4
573
467.5
478.2
559.1
469
466.8
476
464.8
474.7
458.1
534.1
471.2
479.9
583.5
948
1675
544.3
551.9
589.5
550.4
552
690.2
526.7
574.6
624.4
641.7
854.5
648.7
511.1
516.4
441.1
446.7
475.2
7.7
7.76
7.74
7.84
7.94
8.02
8.23
7.3
7.72
7.39
7.37
7.41
7.5
7.35
7.25
7.54
7.62
7.81
7.07
7.71
7.43
7.72
7.33
7.82
7.17
7.64
7.26
7.83
7.57
7.17
6.98
7.39
7.54
7.56
7.54
7.33
7.33
7.37
7.4
7.35
7.48
7.49
7.47
7.47
7.53
7.42
7.41
7.41
0.021
0.018
<0.010
<0.010
0.014
<0.010
0.020
<0.010
<0.010
<0.010
<0.010
0.010
0.020
0.11
0.059
0.049
0.14
0.14
0.062
0.11
<0.010
<0.01
0.082
0.016
<0.010
<0.010
0.090
0.011
<0.010
0.012
0.011
0.065
0.013
0.021
0.022
0.018
0.029
0.020
<0.010
<0.010
<0.010
<0.010
<0.010
DateTCE(ug/l)
Wellsite
APPENDIX C-1U. S. AIR FORCE PLANT NO. 44
FROM THE REGIONAL AQUIFER WELLSFOR THE PERIOD 01-JUL-2004 31-DEC-2004TO
(-) Means less than detection limit.N/A means not available. Only LOCKED data is reported.Generation method Oracle Developer/2000 Reports, Report Name GW_ QUALITY, Table SAMPLE_INFO, LAB_RESULTS, WELLDAT
3 ofpage number
DCE(ug/l) Date
TCE(ug/l)
WellsiteDCE(ug/l)
WATER QUALITY RESULTS ON SAMPLES TAKEN
CHR(mg/l)
TEMP(centig)
ELEC.COND.(umhos) pH CHR
(mg/l)TEMP
(centig)
ELEC.COND.(umhos) pH
4
UPPER ZONE MONITOR WELLS UPPER ZONE MONITOR WELLS
M-10
M-100
M-101
M-102
M-103
M-104
M-105
M-11
M-12A
M-13
M-14
M-15
M-16
M-17
M-20
M-23
M-24A
M-25
M-28
M-30
M-35
M-36
M-41
M-70
M-74
M-75
M-77
M-78
M-79
M-80
M-85
M-90
M-92
M-93
M-94
M-95
M-96
09-NOV-2004
16-AUG-2004
18-NOV-2004
10-AUG-2004
11-NOV-2004
19-AUG-2004
19-NOV-2004
12-AUG-2004
23-NOV-2004
17-AUG-2004
19-NOV-2004
10-AUG-2004
11-NOV-2004
03-AUG-2004
05-AUG-2004
02-AUG-2004
02-AUG-2004
02-AUG-2004
06-AUG-2004
06-AUG-2004
22-NOV-2004
06-AUG-2004
22-NOV-2004
12-AUG-2004
03-AUG-2004
03-AUG-2004
03-AUG-2004
02-AUG-2004
04-AUG-2004
09-AUG-2004
13-AUG-2004
09-AUG-2004
04-AUG-2004
04-AUG-2004
06-AUG-2004
03-AUG-2004
02-AUG-2004
06-AUG-2004
16-AUG-2004
12-AUG-2004
09-AUG-2004
12-NOV-2004
12-AUG-2004
18-NOV-2004
10-AUG-2004
12-NOV-2004
12-AUG-2004
10-AUG-2004
6.2
760
950
490
410
500
570
570
1600
430
380
130
97
4.3
24
4.3
<0.5
0.5
30
110
75
1.2
2.1
58
2.0
0.7
0.9
<0.5
0.5
8.4
320
5.4
<0.5
1.9
34
<0.5
<0.5
130
17
6.0
110
100
60
51
390
370
13
540
1.9
97
120
33
39
9.1
13
160
670
4.7
4.1
18
17
<0.5
5.3
<0.5
<0.5
<0.5
<1.0
<2.5
<0.5
<0.5
<0.5
<2.5
<0.5
<0.5
<0.5
<0.5
<0.5
1.0
57
<0.5
<0.5
<0.5
9.6
<0.5
<0.5
35
<0.5
<0.5
32
30
5.1
4.3
2.0
2.4
1.7
32
24.8
27.8
24.2
26.4
25.2
29
25.7
26.2
24
29.4
26.4
26.3
24.7
26.7
25.6
25.2
25.8
27.2
26.3
25.2
23.9
26.1
23.7
27
25.6
25.8
26.4
26.6
25.2
25.1
25.5
25.2
25.3
26.2
26.1
25.7
25.9
26.4
25.5
26.5
25.7
23.7
25.4
24
25.6
23.7
26.3
25.5
473.6
671.2
672.6
602.3
614.5
609.7
582.3
1063
1711
717.1
737.9
765.3
799.9
570.8
530.1
460.8
461.8
560.5
470.8
474.2
482.7
502.3
524.9
863.3
489.9
571.6
442.1
610.2
720.1
564.4
658
473.9
449.2
412.7
658
417.5
423
523.1
454.8
461
603.7
593.4
634.5
614.1
1271
1347
588.6
1230
7.49
7.41
7.4
7.43
7.55
7.4
7.54
7.27
7.33
7.35
7.41
7.46
7.59
7.7
7.38
7.26
7.59
7.59
7.51
7.51
7.66
7.59
7.64
7.3
7.44
7.66
7.46
7.4
7.45
7.44
7.36
7.45
7.44
7.44
7.59
7.41
7.39
7.5
7.56
7.51
7.36
7.58
7.46
7.58
7.14
7.31
7.69
7.34
<0.010
0.091
0.082
0.050
0.055
<0.010
<0.010
9.0
9.7
0.045
0.040
0.015
0.015
0.019
0.10
<0.010
0.014
0.015
0.039
0.040
0.021
0.037
0.027
0.095
<0.010
<0.010
0.012
<0.010
0.019
0.014
0.015
0.014
0.020
0.058
DateTCE(ug/l)
Wellsite
APPENDIX C-1U. S. AIR FORCE PLANT NO. 44
FROM THE REGIONAL AQUIFER WELLSFOR THE PERIOD 01-JUL-2004 31-DEC-2004TO
(-) Means less than detection limit.N/A means not available. Only LOCKED data is reported.Generation method Oracle Developer/2000 Reports, Report Name GW_ QUALITY, Table SAMPLE_INFO, LAB_RESULTS, WELLDAT
4 ofpage number
DCE(ug/l) Date
TCE(ug/l)
WellsiteDCE(ug/l)
WATER QUALITY RESULTS ON SAMPLES TAKEN
CHR(mg/l)
TEMP(centig)
ELEC.COND.(umhos) pH CHR
(mg/l)TEMP
(centig)
ELEC.COND.(umhos) pH
4
UPPER ZONE MONITOR WELLS
M-96
M-97
M-98
M-99
SF-05
11-NOV-2004
10-AUG-2004
12-NOV-2004
10-AUG-2004
11-NOV-2004
23-NOV-2004
26-AUG-2004
340
990
710
1000
760
1900
6.6
23
47
29
300
220
390
0.8
23.8
25.7
23.7
25.7
23.6
25
25.9
936.6
945.1
1038
971.8
939.4
1035
546.6
7.53
7.27
7.53
7.05
7.25
7.41
7.52
0.035
0.11
0.066
0.048
0.042
1.4
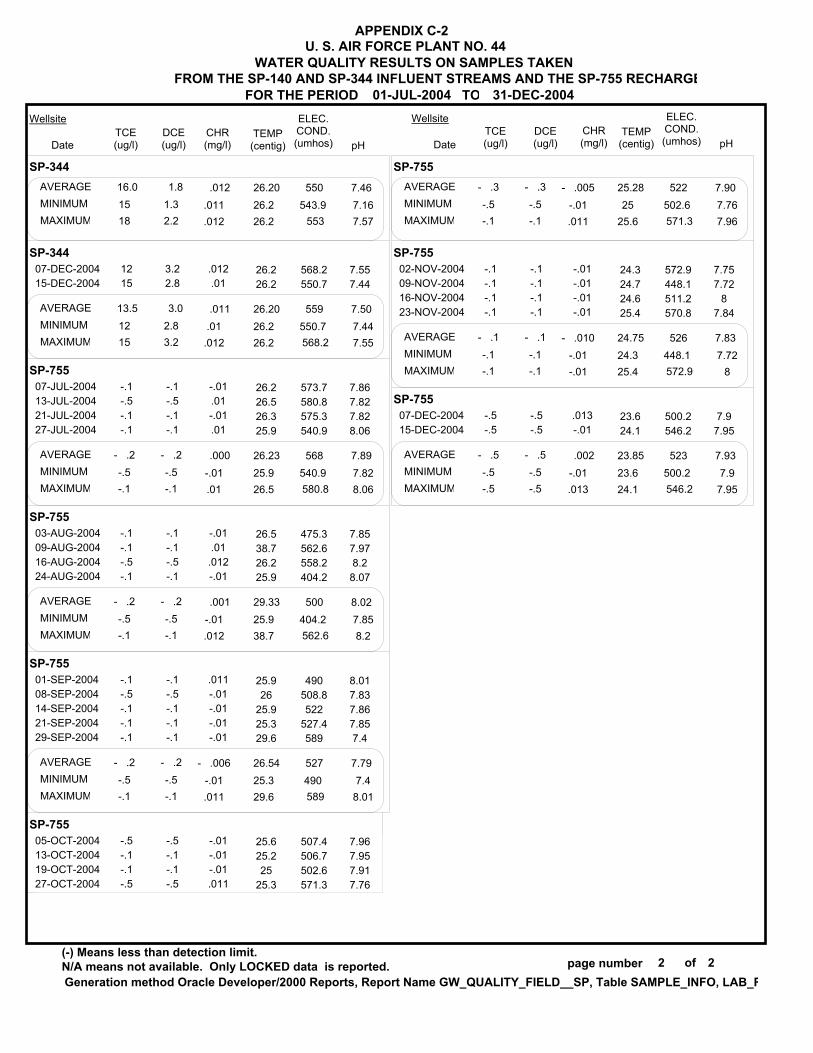
DateTCE(ug/l)
Wellsite
APPENDIX C-2U. S. AIR FORCE PLANT NO. 44
FROM THE SP-140 AND SP-344 INFLUENT STREAMS AND THE SP-755 RECHARGEFOR THE PERIOD 01-JUL-2004 31-DEC-2004TO
(-) Means less than detection limit.N/A means not available. Only LOCKED data is reported.Generation method Oracle Developer/2000 Reports, Report Name GW_QUALITY_FIELD__SP, Table SAMPLE_INFO, LAB_R
1 ofpage number
DCE(ug/l) Date
TCE(ug/l)
WellsiteDCE(ug/l)
WATER QUALITY RESULTS ON SAMPLES TAKEN
CHR(mg/l)
CHR(mg/l)
TEMP(centig)
ELEC.COND.(umhos) pH
TEMP(centig)
ELEC.COND.(umhos) pH
2
SP-140
SP-140
SP-140
SP-140
SP-140
SP-140
SP-140
SP-344
SP-344
SP-344
SP-344
SP-344
07-JUL-200413-JUL-200421-JUL-200427-JUL-2004
03-AUG-200409-AUG-200416-AUG-200424-AUG-2004
01-SEP-200408-SEP-200414-SEP-200421-SEP-200429-SEP-2004
05-OCT-200413-OCT-200419-OCT-200427-OCT-2004
02-NOV-200409-NOV-200416-NOV-200423-NOV-2004
07-DEC-2004
15-DEC-2004
07-JUL-200413-JUL-200421-JUL-200427-JUL-2004
03-AUG-200409-AUG-200416-AUG-200424-AUG-2004
01-SEP-200408-SEP-200414-SEP-200421-SEP-200429-SEP-2004
05-OCT-200413-OCT-200419-OCT-200427-OCT-2004
02-NOV-200409-NOV-200416-NOV-200423-NOV-2004
40413433
40403836
3636343829
32343834
34373436
28
34
31282520
18212927
2423202124
17191414
15161815
4.94.54.94.6
5.15.44.64.5
44
3.84.63.9
3.94.24.44.1
4.24.54.15
4.5
4.2
21.72.61
-1.9
1.83.3
1.52.51.11.13
1.31.41.21.7
1.51.32.22.1
37.0
38.5
34.6
34.5
35.3
31.0
26.0
23.8
22.4
16.0
4.7
4.9
4.1
4.2
4.5
4.4
1.8
1.3
1.8
1.4
AVERAGE
AVERAGE
AVERAGE
AVERAGE
AVERAGE
AVERAGE
AVERAGE
AVERAGE
AVERAGE
AVERAGE
33
36
29
32
34
28
20
18
20
14
4.5
4.5
3.8
3.9
4.1
4.2
1
-1
1.1
1.2
MINIMUM
MINIMUM
MINIMUM
MINIMUM
MINIMUM
MINIMUM
MINIMUM
MINIMUM
MINIMUM
MINIMUM
41
40
38
38
37
34
31
29
24
19
4.9
5.4
4.6
4.4
5
4.5
2.6
3.3
3
1.7
MAXIMUM
MAXIMUM
MAXIMUM
MAXIMUM
MAXIMUM
MAXIMUM
MAXIMUM
MAXIMUM
MAXIMUM
MAXIMUM
.022
.021.02
.021
.025
.025
.024
.021
.021
.021
.021
.019
.019
.018.02
.018
.018
.019
.018
.017
.017
.019
.016
.012
.013
.014
.011
.016
.012
.012
.013
.013
.013
.014
.014
.013
.011
.012
.012
.012
.012
.011
.012
.012
.021
.024
.020
.019
.018
.018
.013
.013
.013
.012
.02
.021
.019
.018
.017
.016
.011
.012
.013
.011
.022
.025
.021
.02
.019
.019
.014
.016
.014
.012
26.326.126.126.2
26.326.326.326.3
26.426.426.426.326.2
26.426.326.226.2
26.125.926.126.1
25
26.1
26.226.226.226.2
26.226.226.226.2
26.226.226.226.226.2
26.226.226.226.2
26.226.226.226.2
567.6588580
578.5
552.6550.2562.8568.3
542.3555.4559
560.4569.2
552.9561.1562.2561
561.8581.4565.2575.6
600
562.5
554556.8550.4535
535.4533.8533.2571.3
543.2556.1548.7553.1553.4
539.6548.4544
551.6
553543.9551.6552.3
7.47.7
7.667.59
7.747.3
7.287.24
7.257.257.257.247.37
7.47.47.4
7.39
7.117.787.4
7.03
7.47
7.6
7.067.377.367.34
7.387.1
7.647.62
7.767.797.827.837.59
7.67.567.567.56
7.567.567.577.16
26.18
26.30
26.34
26.28
26.05
25.55
26.20
26.20
26.20
26.20
26.1
26.3
26.2
26.2
25.9
25
26.2
26.2
26.2
26.2
26.3
26.3
26.4
26.4
26.1
26.1
26.2
26.2
26.2
26.2
579
558
557
559
571
581
549
543
551
546
567.6
550.2
542.3
552.9
561.8
562.5
535
533.2
543.2
539.6
7.59
7.39
7.27
7.40
7.33
7.54
7.28
7.44
7.76
7.57
7.4
7.24
7.24
7.39
7.03
7.47
7.06
7.1
7.59
7.56
588
568.3
569.2
562.2
581.4
600
556.8
571.3
556.1
551.6
7.7
7.74
7.37
7.4
7.78
7.6
7.37
7.64
7.83
7.6
DateTCE(ug/l)
Wellsite
APPENDIX C-2U. S. AIR FORCE PLANT NO. 44
FROM THE SP-140 AND SP-344 INFLUENT STREAMS AND THE SP-755 RECHARGEFOR THE PERIOD 01-JUL-2004 31-DEC-2004TO
(-) Means less than detection limit.N/A means not available. Only LOCKED data is reported.Generation method Oracle Developer/2000 Reports, Report Name GW_QUALITY_FIELD__SP, Table SAMPLE_INFO, LAB_R
2 ofpage number
DCE(ug/l) Date
TCE(ug/l)
WellsiteDCE(ug/l)
WATER QUALITY RESULTS ON SAMPLES TAKEN
CHR(mg/l)
CHR(mg/l)
TEMP(centig)
ELEC.COND.(umhos) pH
TEMP(centig)
ELEC.COND.(umhos) pH
2
SP-344
SP-344
SP-755
SP-755
SP-755
SP-755
SP-755
SP-755
SP-755
07-DEC-200415-DEC-2004
07-JUL-200413-JUL-200421-JUL-200427-JUL-2004
03-AUG-200409-AUG-200416-AUG-200424-AUG-2004
01-SEP-200408-SEP-200414-SEP-200421-SEP-200429-SEP-2004
05-OCT-200413-OCT-200419-OCT-200427-OCT-2004
02-NOV-200409-NOV-200416-NOV-200423-NOV-2004
07-DEC-200415-DEC-2004
1215
-.1-.5-.1-.1
-.1-.1-.5-.1
-.1-.5-.1-.1-.1
-.5-.1-.1-.5
-.1-.1-.1-.1
-.5-.5
3.22.8
-.1-.5-.1-.1
-.1-.1-.5-.1
-.1-.5-.1-.1-.1
-.5-.1-.1-.5
-.1-.1-.1-.1
-.5-.5
16.0
13.5
- .2
- .2
- .2
- .3
- .1
- .5
1.8
3.0
- .2
- .2
- .2
- .3
- .1
- .5
AVERAGE
AVERAGE
AVERAGE
AVERAGE
AVERAGE
AVERAGE
AVERAGE
AVERAGE
15
12
-.5
-.5
-.5
-.5
-.1
-.5
1.3
2.8
-.5
-.5
-.5
-.5
-.1
-.5
MINIMUM
MINIMUM
MINIMUM
MINIMUM
MINIMUM
MINIMUM
MINIMUM
MINIMUM
18
15
-.1
-.1
-.1
-.1
-.1
-.5
2.2
3.2
-.1
-.1
-.1
-.1
-.1
-.5
MAXIMUM
MAXIMUM
MAXIMUM
MAXIMUM
MAXIMUM
MAXIMUM
MAXIMUM
MAXIMUM
.012.01
-.01.01-.01.01
-.01.01
.012-.01
.011-.01-.01-.01-.01
-.01-.01-.01.011
-.01-.01-.01-.01
.013-.01
.012
.011
.000
.001
- .006
- .005
- .010
.002
.011
.01
-.01
-.01
-.01
-.01
-.01
-.01
.012
.012
.01
.012
.011
.011
-.01
.013
26.226.2
26.226.526.325.9
26.538.726.225.9
25.926
25.925.329.6
25.625.225
25.3
24.324.724.625.4
23.624.1
568.2550.7
573.7580.8575.3540.9
475.3562.6558.2404.2
490508.8522
527.4589
507.4506.7502.6571.3
572.9448.1511.2570.8
500.2546.2
7.557.44
7.867.827.828.06
7.857.978.2
8.07
8.017.837.867.857.4
7.967.957.917.76
7.757.72
87.84
7.97.95
26.20
26.20
26.23
29.33
26.54
25.28
24.75
23.85
26.2
26.2
25.9
25.9
25.3
25
24.3
23.6
26.2
26.2
26.5
38.7
29.6
25.6
25.4
24.1
550
559
568
500
527
522
526
523
543.9
550.7
540.9
404.2
490
502.6
448.1
500.2
7.46
7.50
7.89
8.02
7.79
7.90
7.83
7.93
7.16
7.44
7.82
7.85
7.4
7.76
7.72
7.9
553
568.2
580.8
562.6
589
571.3
572.9
546.2
7.57
7.55
8.06
8.2
8.01
7.96
8
7.95
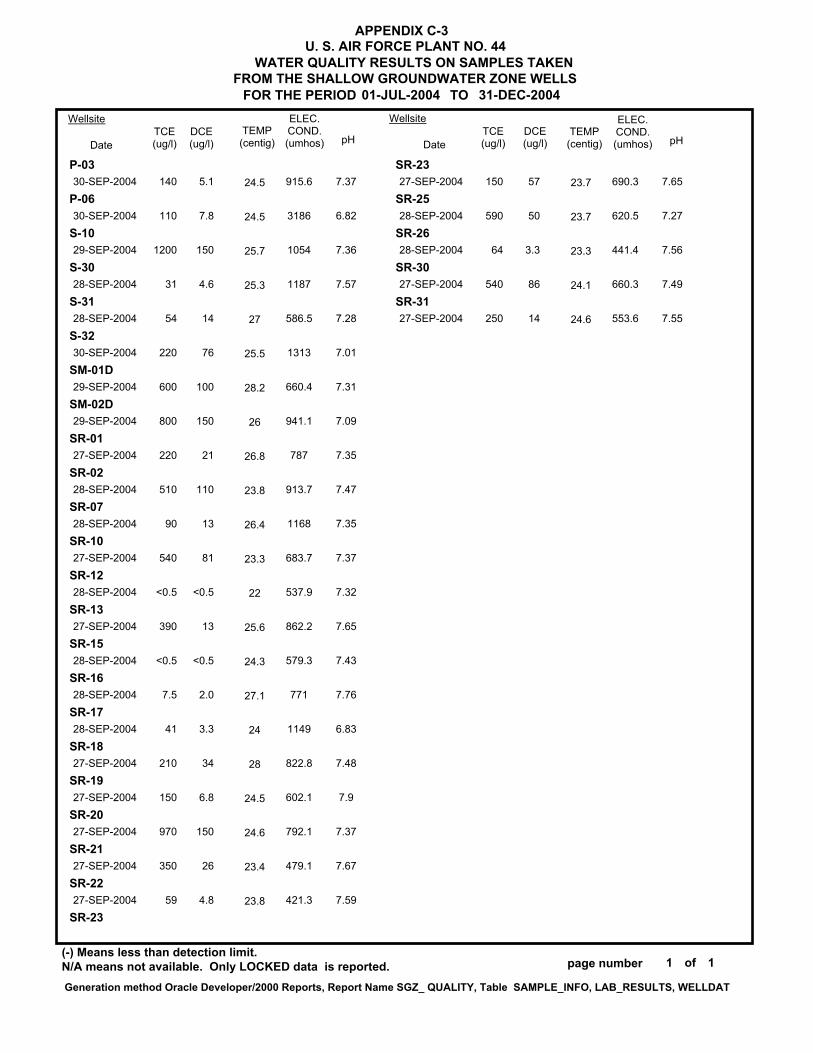
DateTCE(ug/l)
Wellsite
APPENDIX C-3U. S. AIR FORCE PLANT NO. 44
FROM THE SHALLOW GROUNDWATER ZONE WELLSFOR THE PERIOD 01-JUL-2004 31-DEC-2004TO
(-) Means less than detection limit.N/A means not available. Only LOCKED data is reported.Generation method Oracle Developer/2000 Reports, Report Name SGZ_ QUALITY, Table SAMPLE_INFO, LAB_RESULTS, WELLDAT
1 ofpage number
DCE(ug/l) Date
TCE(ug/l)
WellsiteDCE(ug/l)
WATER QUALITY RESULTS ON SAMPLES TAKEN
TEMP(centig)
ELEC.COND.(umhos) pH
TEMP(centig)
ELEC.COND.(umhos) pH
1
P-03
P-06
S-10
S-30
S-31
S-32
SM-01D
SM-02D
SR-01
SR-02
SR-07
SR-10
SR-12
SR-13
SR-15
SR-16
SR-17
SR-18
SR-19
SR-20
SR-21
SR-22
SR-23
SR-23
SR-25
SR-26
SR-30
SR-31
30-SEP-2004
30-SEP-2004
29-SEP-2004
28-SEP-2004
28-SEP-2004
30-SEP-2004
29-SEP-2004
29-SEP-2004
27-SEP-2004
28-SEP-2004
28-SEP-2004
27-SEP-2004
28-SEP-2004
27-SEP-2004
28-SEP-2004
28-SEP-2004
28-SEP-2004
27-SEP-2004
27-SEP-2004
27-SEP-2004
27-SEP-2004
27-SEP-2004
27-SEP-2004
28-SEP-2004
28-SEP-2004
27-SEP-2004
27-SEP-2004
140
110
1200
31
54
220
600
800
220
510
90
540
<0.5
390
<0.5
7.5
41
210
150
970
350
59
150
590
64
540
250
5.1
7.8
150
4.6
14
76
100
150
21
110
13
81
<0.5
13
<0.5
2.0
3.3
34
6.8
150
26
4.8
57
50
3.3
86
14
24.5
24.5
25.7
25.3
27
25.5
28.2
26
26.8
23.8
26.4
23.3
22
25.6
24.3
27.1
24
28
24.5
24.6
23.4
23.8
23.7
23.7
23.3
24.1
24.6
915.6
3186
1054
1187
586.5
1313
660.4
941.1
787
913.7
1168
683.7
537.9
862.2
579.3
771
1149
822.8
602.1
792.1
479.1
421.3
690.3
620.5
441.4
660.3
553.6
7.37
6.82
7.36
7.57
7.28
7.01
7.31
7.09
7.35
7.47
7.35
7.37
7.32
7.65
7.43
7.76
6.83
7.48
7.9
7.37
7.67
7.59
7.65
7.27
7.56
7.49
7.55

DateTCE(ug/l)
Wellsite
FROM THE VAPOR EXTRACTION WELLSFOR THE PERIOD 01-JUL-2004 31-DEC-2004TO
(-) Means less than detection limit. U= Unlocked dataN/A means not available. Only LOCKED data is reported.Generation method Oracle Developer/2000 Reports, Report Name SVE_QUAL, Table SAMPLE_INFO, LAB_RESULTS
1 ofpage number
DCE(ug/l) Date
TCE(ug/l)
WellsiteDCE(ug/l)
VAPOR QUALITY RESULTS ON SAMPLES TAKEN
DateTCE(ug/l)
WellsiteDCE(ug/l) Date
TCE(ug/l)
WellsiteDCE(ug/l)
APPENDIX D-1U. S. AIR FORCE PLANT NO. 44
1
S-24
S-28
SP-01
SP-03
SR-01
SR-02
SR-03
SR-05
SR-06
SR-10
SR-11
SR-14
SR-19
SR-20
SR-21
SR-22
SR-25
SR-28
SR-28
SR-31
SP-01
SP-03
VE-302D
VE-307D
VE-310D
VE-312D
VM-303D
VM-350D
VM-350M
VM-350S
SP-01
SP-03
E-25D
E-25S
E-26D
E-27D
E-27S
VM-506D
VM-507D
19-JUL-2004
19-JUL-2004
07-JUL-200404-AUG-200409-SEP-200413-OCT-200403-NOV-200407-DEC-2004
07-JUL-200404-AUG-200409-SEP-200413-OCT-200403-NOV-200407-DEC-2004
13-JUL-2004
19-JUL-2004
13-JUL-2004
13-JUL-2004
19-JUL-2004
13-JUL-2004
19-JUL-2004
13-JUL-2004
13-JUL-2004
13-JUL-2004
13-JUL-2004
13-JUL-2004
19-JUL-2004
19-JUL-2004
13-JUL-2004
07-JUL-2004
07-JUL-2004
14-JUL-200421-OCT-2004
14-JUL-200421-OCT-2004
14-JUL-200421-OCT-2004
21-OCT-2004
14-JUL-200421-OCT-2004
14-JUL-200421-OCT-2004
14-JUL-200421-OCT-2004
14-JUL-2004
07-JUL-2004
07-JUL-2004
14-JUL-200421-OCT-2004
14-JUL-200421-OCT-2004
14-JUL-200421-OCT-2004
14-JUL-200421-OCT-2004
14-JUL-200421-OCT-2004
14-JUL-200421-OCT-2004
14-JUL-200421-OCT-2004
4
3
533333
<3<3<3<3<3<3
4
8
16
10
12
6
7
4
5
11
6
8
8
9
16
3
<3
2518
16<3
47<3
7
2809
611
523
6
6
<3
3<3
33
<3<3
<3<3
1319
<3<3
3<3
<2
<2
<2<2<2<2<2<2
<2<2<2<2<2<2
2
3
4
3
<2
<2
3
2
<2
4
<2
<2
2
2
5
<2
<2
33
<2<2
6<2
<2
933
<22
<25
<2
<2
<2
<2<2
<2<2
<2<2
<2<2
<2<2
<2<2
<2<2
14V1 3V1
3V2
5V1

0 1,000 2,000
FEET
EXPLANATION
FIGURE 1
2005
UPPER ZONE MONITOR WELL
RECLAMATION WELL
239.20\Water level\Aug2004-STATE PLANE WL-Upper Zone\18Mar2005
U.S. AIR FORCE PLANT 44TUCSON, ARIZONA
REGIONAL AQUIFER, UPPER ZONEWATER LEVEL ALTITUDE
AUGUST 2004
WATER LEVEL ALTITUDE,in feet above mean sea level
M-1A
M-6
M-8
M-13
M-14
M-15
M-16M-17 M-18
M-19
M-20
M-22A
M-23
M-28
M-31
M-32M-33
M-34
M-35
M-36
M-37
M-38
M-39
M-40
M-55AM-56M-58
M-59
M-60
M-61
M-62M-63
M-70
M-74M-75
M-76C
M-78
EPA-1
EPA-2
EPA-4
EPA-5
EPA-6
SF-5
SF-9
SF-16
E-1E-2
E-3
E-4
E-5
E-7
E-8
E-10
R-14
E-12
E-13
E-16
E-17
E-20
E-24
R-1
R-2
R-3
R-4R-5
R-6
R-7
R-8
R-9
R-10
R-14A
R-15
R-18
E-6
E-9
M-76B
M-33
M-3A
E-18
E-23
R-21
M-41M-2B
M-10 M-49
M-50
M-51
E-15
E-19
R-12 R-13
R-17
R-19 R-20
M-5
M-24A
M-44
M-48 M-53
E-29
E-30
E-31
E-18
M-21
EPA-3
WATER LEVEL ALTITUDE CONTOUR,in feet above mean sea level
M-81
M-79
M-9
M-47
M-46
M-25
E-21
E-14
M-11
E-25
E-28
M-30
M-7M-80
E-26
E-27
2,476.09
M-82
M-83
M-84
M-85
M-86
M-87
M-88
M-89 M-90
M-91
APPROXIMATE LIMIT OFHYDRAULIC CAPTURE
CREDIT UNION
M-92M-93
M-94M-95
M-96M-97
M-98
M-100M-101 M-102
M-104M-105
E-22
M-103
2,500
M-12A2472.41
2,471.322,450.68
2,476.48
2,471.00
2,476.222,466.09
2,455.53
2,451.342,454.09
2,493.94
2,490.07
2,464.69
2,477.472,474.94
2,495.52
2,476.48
2,476.09
2,483.67
2,498.51
2,483.15
2,499.34
2,475.43
2,379.08 2,492.65
2,493
2,492.57
2,493.37
2,486.6
2,496.05
2,494.52
2,471.56
2,468.69
2,463.64
2,468.27
2,457.69
2,478.55
2,476.93
2,472.16
2,484.03
2,478.55
2,476.83
2,481.262,480.11
2,482.5
2,479.89
2,489.65
2,479.262,480.6
2,479.152,474.07
2,476.27
2,479.73
2,494.61
2,499.292,499.96 2,499.63
2,489.08
2,471.63
2,485.75
2,491.13
2,496.26
2,486.12
2,456.24
2,452.92
2,475.16
2,482.98
2,481.94
2,481.56
2,483.13
2,481.75
2,482.98
2,481.6
2,498.44
2,499.072,498.73
2,479.6
2,486.56
2,482.24
2,480.28
2,497.9
2,499.3
2,499.93
2,499.06
2,498.86
2,498.88
2,499.5
2,497.01 2,499.98
2,497.28
2,479.622,484.51
2,483.62
2,484.92
2,481.24
2,480.622,479.78
2,504.7
2,499.76
2,486.652,484.73
2,481.53
2,464.51
2,466.23
2,469.92
2,474.53
2,482.82 2,473.452,504.032,510.19
2,487.55
2,452.562,4
55
2,460
2,465
2,470
2,475
2,480
2,485
2,490
2,4952,500
2,505
2,500
2,495
2,470
M-77
0 1,000 2,000
FEET
EXPLANATION
FIGURE 2
2005
UPPER ZONE MONITOR WELL
RECLAMATION WELL
239.20\TCE\TCE Aug2004 STATE PLANE27 Upper Zone\18Mar2005
U.S. AIR FORCE PLANT 44TUCSON, ARIZONA
CONCENTRATIONSTRICHLOROETHYLENE
AUGUST 2004
CONCENTRATION OF TCE, AUGUST2004, in micrograms per liter
M-1A
M-6
M-8
M-12A
M-13
M-14
M-15
M-16
M-17M-18
M-19
M-20
M-22A
M-28
M-31
M-32
M-33
M-34
M-35M-36
M-37
M-38
M-39
M-40
M-55AM-56 M-58
M-59
M-60
M-61
M-62M-63
M-70
M-74
M-75
M-76C
M-78
EPA-1
EPA-2
EPA-4
EPA-5
EPA-6
SF-5
SF-9
SF-16
E-1E-2
E-3E-4
E-5
E-7
E-10
R-14
E-12
E-16
E-17
E-20
E-24
R-1
R-2
R-3R-4R-5
R-6
R-7
R-8
R-9
R-10
R-14A
R-18
E-6
E-9
M-76B
M-33
E-18
E-23
R-21
M-2B
M-10M-49
M-50
M-51R-12 R-13
R-17
R-19 R-20
M-24A
M-44
E-18
M-21
EPA-3
CONTOUR OF EQUAL TCECONCENTRATION, in micrograms
M-81
M-79
M-9
M-47 M-46
M-25
E-14
M-11
E-25
M-30
M-80
E-26
E-27
M-83
M-84
M-85
M-86
M-87
M-88
M-89 M-90
M-91
M-93
M-94
M-95
per liter
M-103
E-22
M-7
66
<0.5
1.9
<0.5
2
<0.5
11
8
5.6
21
3643
22
22
2573
5.158
3.1
6.2
6.6
8.4
1.6
6.6
1.1
0.5
<0.5
<0.5
2.514 1.3
34
4.9
66320
140
50
3.7
0.7
220
3734
130
170
290110
33
60
390
13
41990
100
120
80
44
4.78.5 1.2
33
<0.5
<0.5
0.9
30
110
5.4
174.7
3449
760490
7.5
24 4.3 <0.5
32
48
34
140
5.6
570
500200100
50
5
130
200
5
550
100
5
E-810
<0.5
<0.5
<0.5
0.9
13
4.3
<0.5
6
<0.5
<0.566
<0.5 <0.5
<0.5
<0.5
M-23E-13
M-3A
M-41
E-15
E-19M-5M-48
M-53
E-29
E-30
E-31
E-28
M-77M-99
50
R-15
M-82
300 <0.5
M-96
M-97M-98
M-100M-101
M-102
M-104
1,000
540
500
430
E-21M-92
M-105
CREDIT UNION
UPPER ZONE, REGIONAL AQUIFER,

0 1,000 2,000
FEET
EXPLANATION
FIGURE 3
2005
UPPER ZONE MONITOR WELL
RECLAMATION WELL
239.20\DCE\DCE-Aug2004 STATE PLANE-Upper Zone\18Mar2005
U.S. AIR FORCE PLANT 44TUCSON, ARIZONA
CONCENTRATIONSDICHLOROETHYLENE
AUGUST 2004
CONCENTRATION OF DCE, AUGUST2004, in micrograms per liter
M-1A
M-6
M-8
M-12A
M-13
M-14
M-15
M-16M-17
M-18
M-19
M-20
M-22A
M-23
M-28
M-31
M-32
M-33
M-34
M-35M-36
M-37
M-38
M-39
M-40
M-55AM-56 M-58
M-59
M-60
M-61
M-62M-63
M-70
M-74
M-75
M-76C
M-78
EPA-1
EPA-2
EPA-4
EPA-5
EPA-6
SF-5
SF-9
SF-16
E-1E-2
E-3
E-4
E-5
E-7
E-8
E-10
R-14
E-12
E-13
E-17
E-20
E-24
R-1
R-2
R-3R-4R-5
R-6
R-7
R-8
R-9
R-10
R-14A
R-15
R-18
E-6
E-9
M-76B
M-33
M-3A
E-18
E-23
R-21
M-10 M-49
M-50
M-51
E-15
E-19
R-12 R-13
R-17
R-19 R-20
M-24A
M-44
M-53
E-29
E-30E-31
E-18
M-21
EPA-3
CONTOUR OF EQUAL DCECONCENTRATION, in micrograms
M-81
M-79
M-9
M-47
M-46
M-25
E-21
E-14
M-11
E-25
E-28
M-30
M-7
M-80E-26
M-82M-83
M-84
M-85
M-86
M-87M-88
M-89 M-90
M-91
CREDIT UNION
M-92 M-93M-94
M-95
M-96
M-97
M-98
M-101M-102
M-105
per liter
0.81
0.7
<0.5
1.4
<0.5
<0.5
2
2.3
<0.5<0.5
1.8
<0.54.3
<0.55.3
3.3
6.2 5.1
2.7
0.6
0.7
<0.5
10
2.3
0.6 <2.5
9.8
57
29
3 32 5.1
2
329.6
<2.5
<0.5
<0.5
<1
<2.51.8
0.91
4
35
8.3<0.5
5.4
<0.5
<0.5
1.5
<1
<0.5
<0.5
<1
<2.5
<0.5 <0.5
<0.5E-22
<0.5
<0.5
18300
47
1.7
9.8
507
7
<0.5
<0.5
10033
9.1
<0.5<0.5
<1
<0.5<0.5
<0.5
<0.5<0.5
<0.5
160
4.7
18
<0.5
<1
3.3
3.21.9
<0.5
1.9
<0.5
<0.5
1.1
<0.5
<0.5
<0.5
<0.5
7
4415
M-2B
M-481 M-5
94
97M-100
M-104
M-77
E-16
E-27
M-103M-99
M-41
UPPER ZONE, REGIONAL AQUIFER
239.20\CHROMIUM\Chromium Aug2004- STATE PLANE Upper Zone\18Mar2005
M-1A
M-6
M-8
M-12A
M-13
M-14
M-16
M-20
M-23
M-31
M-32
M-33
M-39
M-60
M-76C
EPA-1
EPA-2
EPA-4
E-1E-2
E-3
E-4
R-14
E-12
E-13
E-17
E-24
R-1
R-2
R-3R-4R-5
R-6
R-10
R-14A
R-18
M-76B
M-3A
E-18
E-23M-41
M-2B
M-10 M-49
M-50
M-51
E-15
E-19
R-12 R-13
R-17
R-19 R-20
M-5
M-24A
M-44
M-48 M-53
E-29
E-30E-31
M-81
M-9
M-47
M-46
M-25
E-21
E-14
M-11
E-25
E-28M-77
M-30
M-7
M-80 E-26
E-27
CREDIT UNION
M-92
M-93 M-94
M-95
M-96
M-97
M-98 M-100M-101
M-102
M-104M-105
0 500 1,000
FEET
EXPLANATION
FIGURE 4
2005
UPPER ZONE MONITOR WELL
RECLAMATION WELL
U.S. AIR FORCE PLANT 44TUCSON, ARIZONA
REGIONAL AQUIFERCHROMIUM CONCENTRATIONS
UPPER ZONE, AUGUST 2004
CONCENTRATION OF CHROMIUM,in milligrams per liter
CONTOUR OF EQUAL CHROMIUM CONCENTRATION, in milligrams per liter0.10
M-33
E-13
500 1,000M-103
0.065
0.013
0.012
0.1
<0.01
<0.01
0.013
<0.01
0.017
0.09
0.017
<0.01
<0.01
<0.01
<0.01<0.01
0.039
0.014
0.0370.017
<0.01 0.012
0.019
0.04
0.011<0.01
0.048
0.025
0.020.022
0.021
0.4
0.015
0.11
0.058
0.015
0.02
0.012
0.820.027
0.014
0.026
0.018
0.0140.017 0.014
0.0210.019
0.026
0.095
0.01
0.029
<0.01
0.091
0.05
<0.01 9
0.0450.015
<0.01
0.02
SR-14
FIGURE 5
2005
B-1
P-1
P-2
P-3
P-4
P-5
P-6
P-7
P-10
S-23
S-24
S-25
S-26
S-27
S-28
S-29
S-30
S-31
S-32
S-33
SM-4
SM-5
SR-6SR-7
SR-8
SR-11
SR-12
SR-15
SR-16
SR-17
SR-23
SR-28
SR-29
0 500 1,000
FEET
EXPLANATION
SHALLOW GROUNDWATER ZONEMONITOR WELL
SHALLOW GROUNDWATER ZONEEXTRACTION WELL
P-1
U.S. AIR FORCE PLANT 44TUCSON, ARIZONA
SHALLOW GROUNDWATER ZONE
239.20\TCE\TCE-DCE800-SHALLOW-Sept2004\18Mar2005
M-57
B-2
B-3
SR-9
B-9
P-8
S-10
SM-1
SM-2
SM-3
SR-1
SR-2
SR-3
SR-4
SR-5
SR-10
SR-13
SR-18 SR-19
SR-20 SR-21
SR-22
SR-24
SR-25
SR-26
SR-27
SR-30
SR-31SR-32
SR-33
DICHLOROETHYLENE CONCENTRATIONS
SEPTEMBER 2004
CONCENTRATION OF TCE AND DCE,
SR-21
M-2A
in micrograms per liter
350/26110/7.8
140/5.1
7.5/2
41/3.3
540/86
<0.5/<0.5
970/150
250/14
540/81
350/26
59/4.8
510/110
64/3.3150/6.8
TRICHLOROETHYLENE AND
1,200/150390/13
220/21
<0.5/<0.5
90/13
54/14
210/34
150/57
31/4.6
220/76
600/100
800/150
590/50
M-5
M-67M-68
M-69
M-72
M-73
VCW-1
E-14
E-19E-21
VE-302D
VE-303
VE-304
VE-305
VM-301
VM-302
VM-303D
VE-306
VE-307DVE-308
VE-309
VE-310D
VE-311VE-312D
VE-314
0 100 200
FEET
EXPLANATIONUPPER ZONE MONITOR WELL
RECLAMATION WELL
SOIL VAPOR EXTRACTION OR MONITOR WELL
E-19
VE-310D
M-5
FIGURE 6. CONCENTRATIONS OF TCE IN SOIL GAS, LOWERMOST SCREENED
239.20\TCE\SITE3-SVE-TCE-OCT2004\18Mar2005
PZ-6
PZ-7 PZ-8PZ-9
PZ-10
SHALLOW GROUNDWATER ZONEMONITOR WELL
VE-313
18
<3
<3
CONCENTRATION OF TRICHLOROETHYLENE,in micrograms per liter
<3
PZ-10
7
M-92
M-97
M-96
M-94
M-95
M-93
9
VM-350D
VM-350M
11
23 NOTE:Well VM-350 locatedapprox. 650 feetnorthwest from M-97.
INTERVAL, SITE 3, OCTOBER, 2004
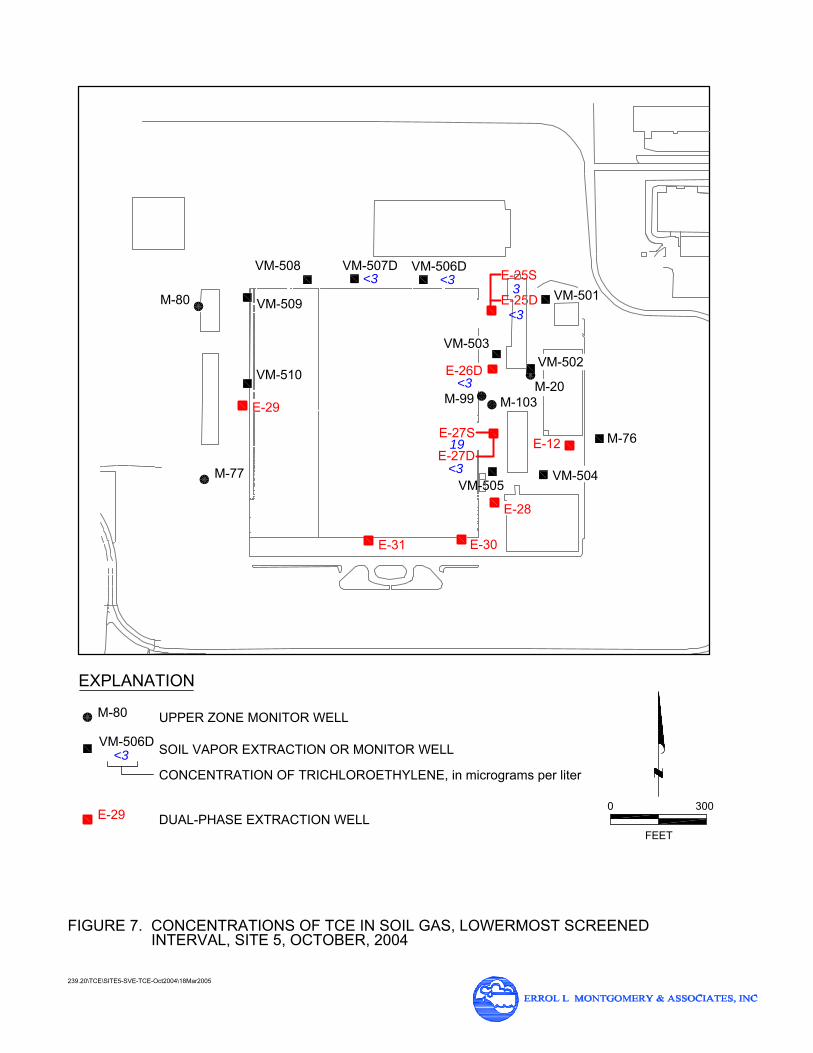
FEETDUAL-PHASE EXTRACTION WELLE-29
239.20\TCE\SITE5-SVE-TCE-Oct2004\18Mar2005
0 300
EXPLANATION
M-80
VM-506D
E-31 E-30
VM-505
VM-509
VM-510
VM-508
VM-503
VM-506DVM-507D
VM-504
E-12 M-76
M-20
VM-502
VM-501
UPPER ZONE MONITOR WELL
SOIL VAPOR EXTRACTION OR MONITOR WELL
E-27D
E-26D
E-28
M-80
M-77
E-25D
E-29
FIGURE 7. CONCENTRATIONS OF TCE IN SOIL GAS, LOWERMOST SCREENED
CONCENTRATION OF TRICHLOROETHYLENE, in micrograms per liter<3
M-103M-99
<3
<3
<3
<3<3 E-25S3
E-27S19
INTERVAL, SITE 5, OCTOBER, 2004

FIGURE 8
2005
B-1
P-1
P-2
P-3
P-4
P-5
P-6
P-7
P-10
S-23
S-24
S-25
S-26
S-27
S-28
S-29
S-30
S-31
S-32
S-33
SM-4
SM-5
SR-6SR-7
SR-8
SR-11
SR-12
SR-15
SR-16
SR-17
SR-23
SR-28
SR-29
0 500 1,000
FEET
EXPLANATION
SHALLOW GROUNDWATER ZONEMONITOR WELL
SHALLOW GROUNDWATER ZONEEXTRACTION WELL
P-1
U.S. AIR FORCE PLANT 44TUCSON, ARIZONA
SHALLOW GROUNDWATER ZONE
239.20\TCE\TCE-SV800-SHALLOW-July2004\18Mar2005
M-57
B-2
B-3
SR-9
B-9
P-8S-10
SM-1SM-2
SM-3
SR-1
SR-2
SR-3
SR-4
SR-5
SR-10SR-13
SR-14
SR-18 SR-19
SR-20 SR-21
SR-22
SR-24
SR-25
SR-26
SR-27
SR-30
SR-31 SR-32
SR-33
CONCENTRATIONS IN SOIL GAS
JULY 2004
CONCENTRATION OF TCE IN SOIL
SR-21
M-2A
VAPOR, in micrograms per liter
6
TRICHLOROETHYLENE
4
3
4
8
1610
12
6
7
4
5
11 6
8
8
9
16