rbc 2015-mlp-investor-conference
TRANSCRIPT

2015 RBC Capital Markets
MLP Conference
November 2015
Disclaimers
2
Forward Looking StatementsThis presentation contains forward-looking statements. These statements discuss future expectations, contain projections of results of operations or of financial condition or state other forward-looking information. These statements are based upon various assumptions, many of which are based, in turn, upon further assumptions, including examination of historical operating trendsmade by the management of the Partnership. Although the Partnership believes that these assumptions were reasonable when made, because assumptions are inherently subject to significant uncertainties and contingencies, which are difficult or impossible to predict and are beyond its control, the Partnership cannot give assurance that it will achieve or accomplish these expectations, beliefs or intentions. These forward-looking statements involve risks and uncertainties. When considering these forward- lookingstatements, you should keep in mind the risk factors and other cautionary statements in the Partnership’s 10-K and other documents on file with the Securities and Exchange Commission. The risk factors and other factors noted in the Partnership’s public filings could cause the Partnership’s actual results to differ materially from those contained in any forward-looking statement.
This document includes certain non-GAAP financial measures as defined under SEC Regulation G. A reconciliation of those measures to most directly comparable GAPP measures is provided in the appendix to this presentation.
Non-GAAP MeasuresAdjusted EBITDA is defined as net income (loss) plus (minus) interest expense (income), income tax expense (benefit), depreciation and amortization expense, asset impairments, (gains) losses on asset sales, certain non-cash charges such as non-cash equity compensation and non-cash vacation expense, non-cash (gains) losses on commodity derivative contracts (total (gain) loss on commodity derivatives less net cash flow associated with commodity derivatives settled during the period) and selected (gains) charges and transaction costs that are unusual or non-recurring and other selected items that impact comparability.
We define distributable cash flow as Adjusted EBITDA less net cash interest paid, income taxes paid and maintenance capital expenditures.
Quarterly Review (Q3 2015)
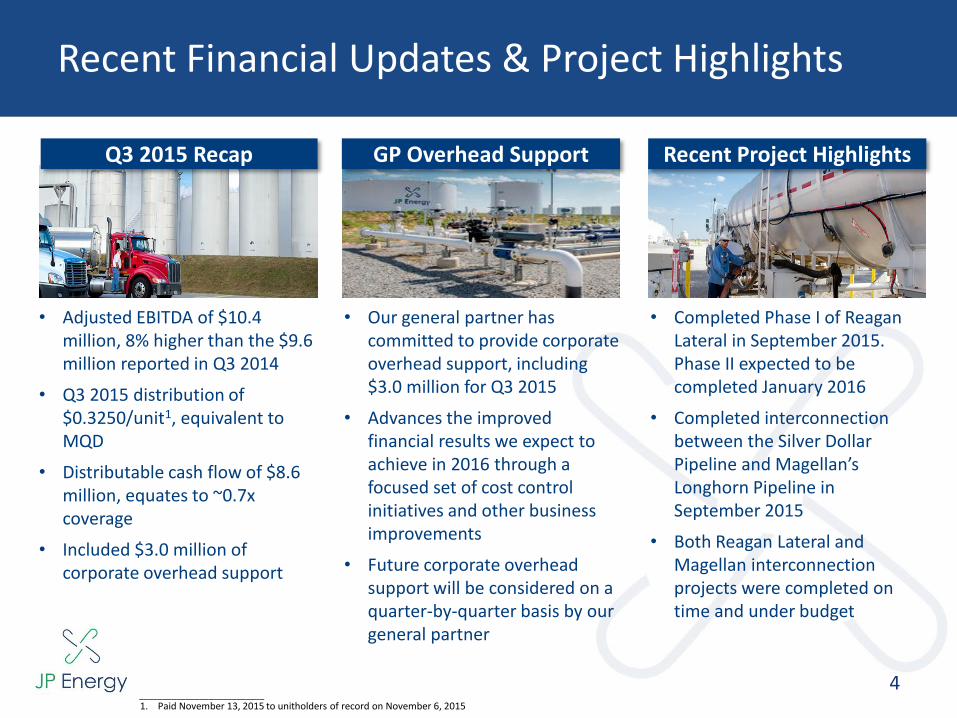
Recent Financial Updates & Project Highlights
4
Q3 2015 Recap
• Adjusted EBITDA of $10.4 million, 8% higher than the $9.6 million reported in Q3 2014
• Q3 2015 distribution of $0.3250/unit1, equivalent to MQD
• Distributable cash flow of $8.6 million, equates to ~0.7x coverage
• Included $3.0 million of corporate overhead support
___________________________1. Paid November 13, 2015 to unitholders of record on November 6, 2015
GP Overhead Support Recent Project Highlights
• Our general partner has committed to provide corporate overhead support, including $3.0 million for Q3 2015
• Advances the improved financial results we expect to achieve in 2016 through a focused set of cost control initiatives and other business improvements
• Future corporate overhead support will be considered on a quarter-by-quarter basis by our general partner
• Completed Phase I of Reagan Lateral in September 2015. Phase II expected to be completed January 2016
• Completed interconnection between the Silver Dollar Pipeline and Magellan’s Longhorn Pipeline in September 2015
• Both Reagan Lateral and Magellan interconnection projects were completed on time and under budget
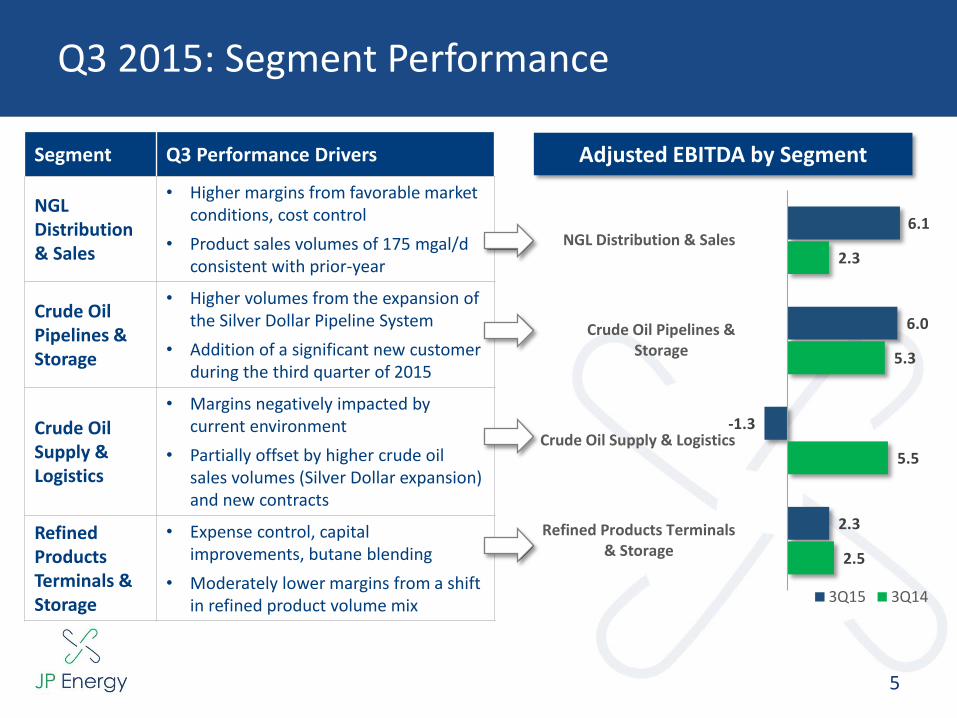
Q3 2015: Segment Performance
5
Adjusted EBITDA by SegmentSegment Q3 Performance Drivers
NGL Distribution & Sales
• Higher margins from favorable market conditions, cost control
• Product sales volumes of 175 mgal/d consistent with prior-year
Crude Oil Pipelines & Storage
• Higher volumes from the expansion of the Silver Dollar Pipeline System
• Addition of a significant new customer during the third quarter of 2015
Crude Oil Supply & Logistics
• Margins negatively impacted by current environment
• Partially offset by higher crude oil sales volumes (Silver Dollar expansion) and new contracts
Refined Products Terminals & Storage
• Expense control, capital improvements, butane blending
• Moderately lower margins from a shift in refined product volume mix
2.5
5.5
5.3
2.3
2.3
-1.3
6.0
6.1
Refined Products Terminals& Storage
Crude Oil Supply & Logistics
Crude Oil Pipelines &Storage
NGL Distribution & Sales
3Q15 3Q14
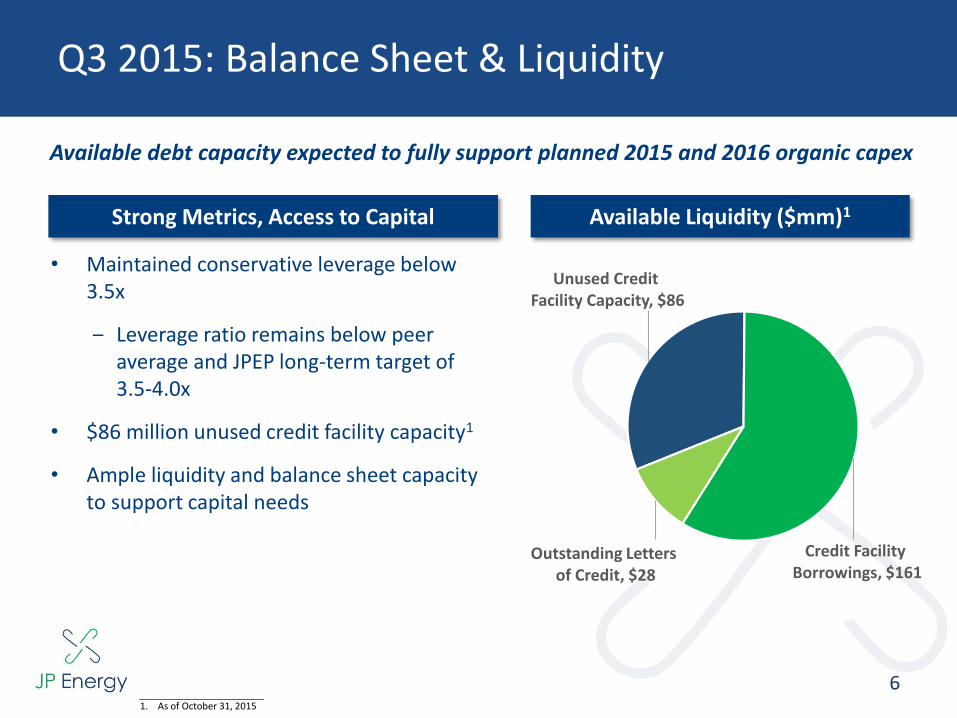
Q3 2015: Balance Sheet & Liquidity
6
Strong Metrics, Access to Capital
• Maintained conservative leverage below 3.5x
‒ Leverage ratio remains below peer average and JPEP long-term target of 3.5-4.0x
• $86 million unused credit facility capacity1
• Ample liquidity and balance sheet capacity to support capital needs
Available Liquidity ($mm)1
Available debt capacity expected to fully support planned 2015 and 2016 organic capex
___________________________1. As of October 31, 2015
Unused Credit Facility Capacity, $86
Credit Facility Borrowings, $161
Outstanding Letters of Credit, $28
$ 0
$ 2
$ 4
$ 6
$ 8
$ 10
$ 12
$ 14
$ 16
4Q14 1Q15 2Q15 3Q15 Average
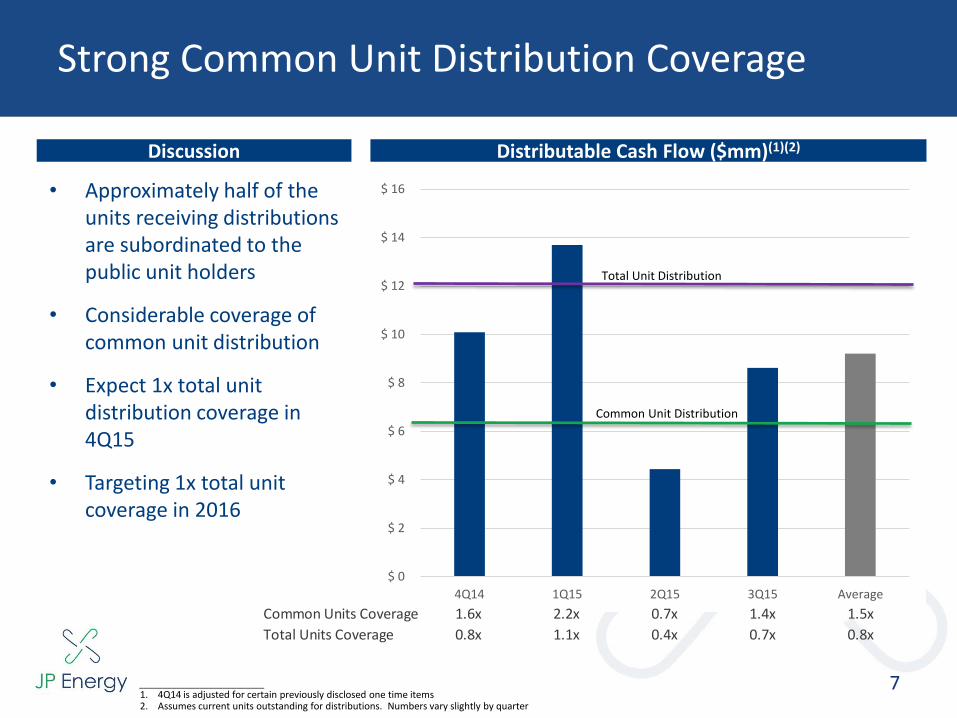
Strong Common Unit Distribution Coverage
7___________________________1. 4Q14 is adjusted for certain previously disclosed one time items2. Assumes current units outstanding for distributions. Numbers vary slightly by quarter
Distributable Cash Flow ($mm)(1)(2)
Common Unit Distribution
Total Unit Distribution
Discussion
• Approximately half of the units receiving distributions are subordinated to the public unit holders
• Considerable coverage of common unit distribution
• Expect 1x total unit distribution coverage in 4Q15
• Targeting 1x total unit coverage in 2016
Common Units Coverage 1.6x 2.2x 0.7x 1.4x 1.5x
Total Units Coverage 0.8x 1.1x 0.4x 0.7x 0.8x
JP Energy Growth Update
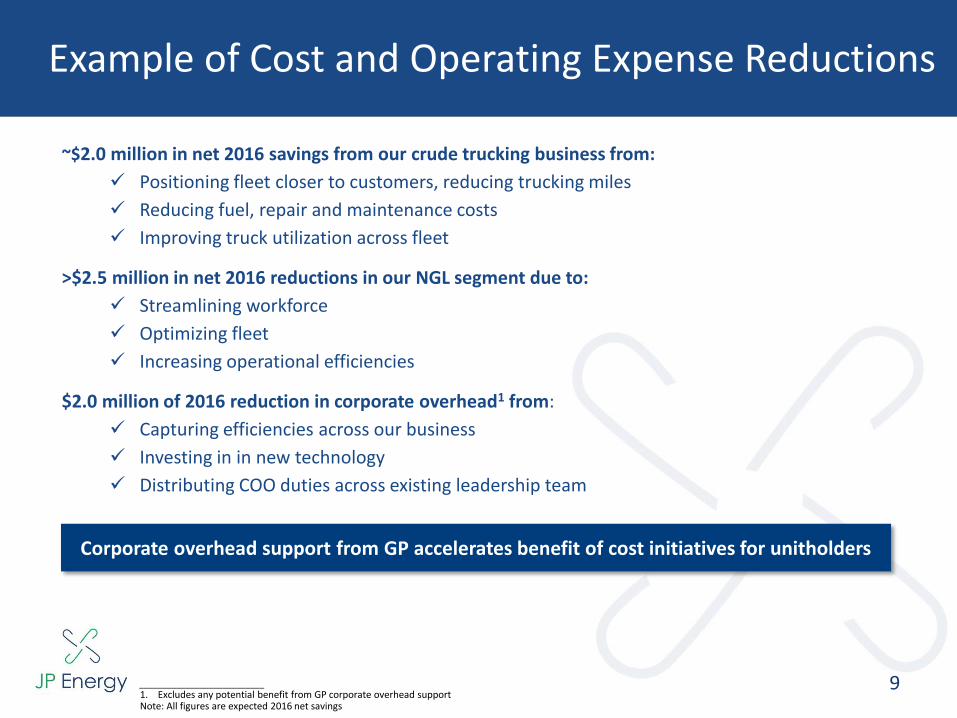
Example of Cost and Operating Expense Reductions
9
~$2.0 million in net 2016 savings from our crude trucking business from:
Positioning fleet closer to customers, reducing trucking miles
Reducing fuel, repair and maintenance costs
Improving truck utilization across fleet
>$2.5 million in net 2016 reductions in our NGL segment due to:
Streamlining workforce
Optimizing fleet
Increasing operational efficiencies
$2.0 million of 2016 reduction in corporate overhead1 from:
Capturing efficiencies across our business
Investing in in new technology
Distributing COO duties across existing leadership team
___________________________1. Excludes any potential benefit from GP corporate overhead supportNote: All figures are expected 2016 net savings
Corporate overhead support from GP accelerates benefit of cost initiatives for unitholders
10
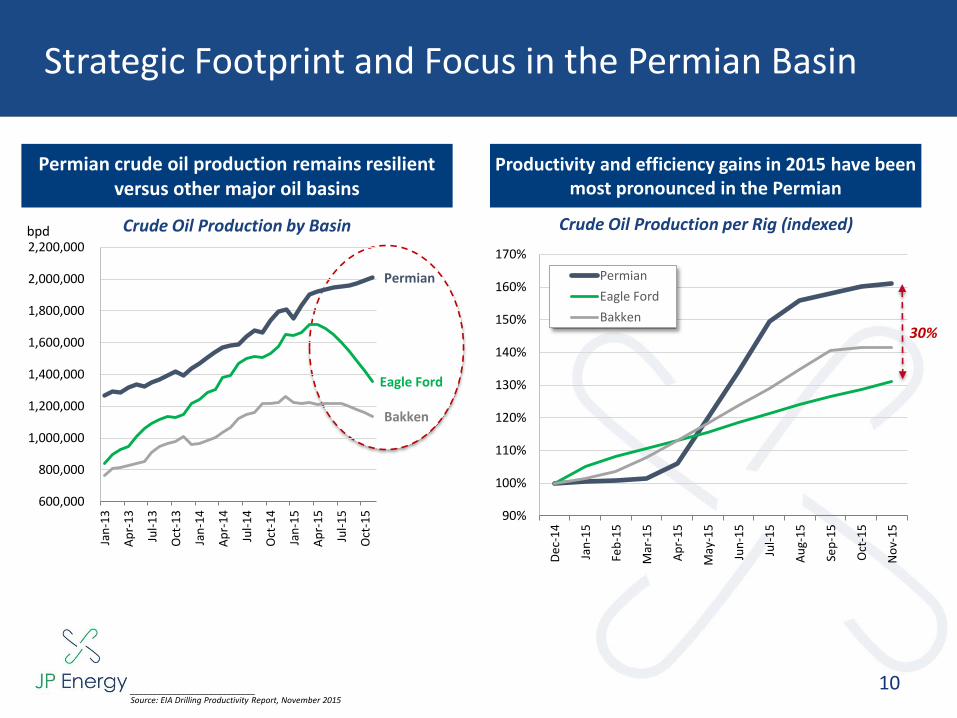
Strategic Footprint and Focus in the Permian Basin
Permian crude oil production remains resilient versus other major oil basins
___________________________Source: EIA Drilling Productivity Report, November 2015
Productivity and efficiency gains in 2015 have been most pronounced in the Permian
Crude Oil Production by Basin Crude Oil Production per Rig (indexed)
90%
100%
110%
120%
130%
140%
150%
160%
170%
De
c-1
4
Jan
-15
Feb
-15
Mar
-15
Ap
r-1
5
May
-15
Jun
-15
Jul-
15
Au
g-1
5
Sep
-15
Oct
-15
No
v-1
5
Permian
Eagle Ford
Bakken30%
Permian
Eagle Ford
Bakken
600,000
800,000
1,000,000
1,200,000
1,400,000
1,600,000
1,800,000
2,000,000
2,200,000
Jan
-13
Ap
r-1
3
Jul-
13
Oct
-13
Jan
-14
Ap
r-1
4
Jul-
14
Oct
-14
Jan
-15
Ap
r-1
5
Jul-
15
Oct
-15
bpd
11
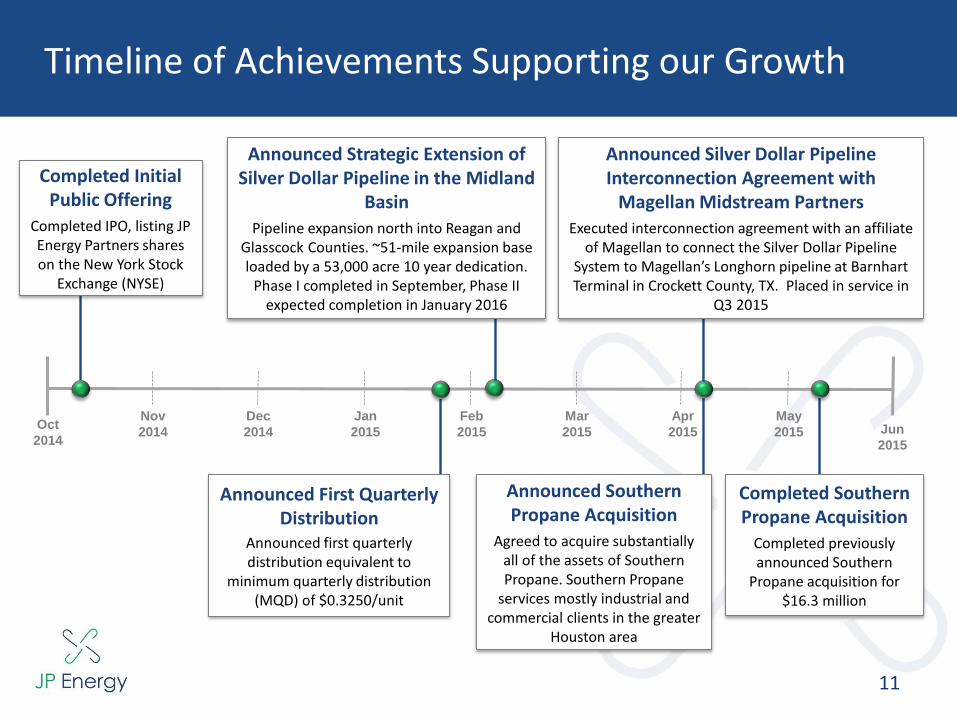
Timeline of Achievements Supporting our Growth
Oct
2014
Nov
2014
Dec
2014
Jan
2015
Feb
2015
Mar
2015
Apr
2015
Announced Strategic Extension of Silver Dollar Pipeline in the Midland
Basin
Pipeline expansion north into Reagan and Glasscock Counties. ~51-mile expansion base loaded by a 53,000 acre 10 year dedication.
Phase I completed in September, Phase II expected completion in January 2016
Announced Silver Dollar Pipeline Interconnection Agreement with
Magellan Midstream Partners
Executed interconnection agreement with an affiliate of Magellan to connect the Silver Dollar Pipeline
System to Magellan’s Longhorn pipeline at Barnhart Terminal in Crockett County, TX. Placed in service in
Q3 2015
Announced Southern Propane Acquisition
Agreed to acquire substantially all of the assets of Southern Propane. Southern Propane
services mostly industrial and commercial clients in the greater
Houston area
Completed Southern Propane Acquisition
Completed previously announced Southern
Propane acquisition for $16.3 million
May
2015 Jun
2015
Completed Initial Public Offering
Completed IPO, listing JP Energy Partners shares on the New York Stock
Exchange (NYSE)
Announced First Quarterly Distribution
Announced first quarterly distribution equivalent to
minimum quarterly distribution (MQD) of $0.3250/unit

Overview
Silver Dollar Pipeline – Recent Updates
12
Reagan Lateral
• Completed Phase I of the project in September 2015 on time and under budget. Includes 32-miles of pipeline and associated truck and measurement facilities. Expect Phase II to be completed in January 2016
• Expands capture area in the Midland Basin by extending Silver Dollar north into Reagan and Glasscock. Lateral is base loaded by a 53,000 acre 10 year dedication
Magellan Longhorn Interconnect
• In September 2015, completed an interconnection between the Silver Dollar Pipeline and the Longhorn Pipeline at Barnhart Terminal in Crocket County, TX
• Provides third take-away option for producers and provides producers with direct access from the core of the Midland Basin to Houston end markets
Reagan
Irion
Crockett
Sterling
Glasscock
Tom Green
Silver Dollar Pipeline - Reagan Lateral
Legend
Reagan Lateral Station
Future Station
Stations
Active Pipeline
Reagan Lateral
Rail
Major Highways
Oxy Barnhart Station (Centurion Interconnect
to Colorado City)
Owens Station(Plains Interconnect
to Midland)
MidwayTruck
Station
Future TruckStation
Future TruckStation
TruckStation
TruckStation
Magellan Barnhart Station (Longhorn Interconnect
to E. Houston – Q3 2015)
Planned Expansion
Midland (via Plains)
Colorado City (via Oxy Cline’s
Centurion)
Silver Dollar
Houston (via Magellan Longhorn)
Overview
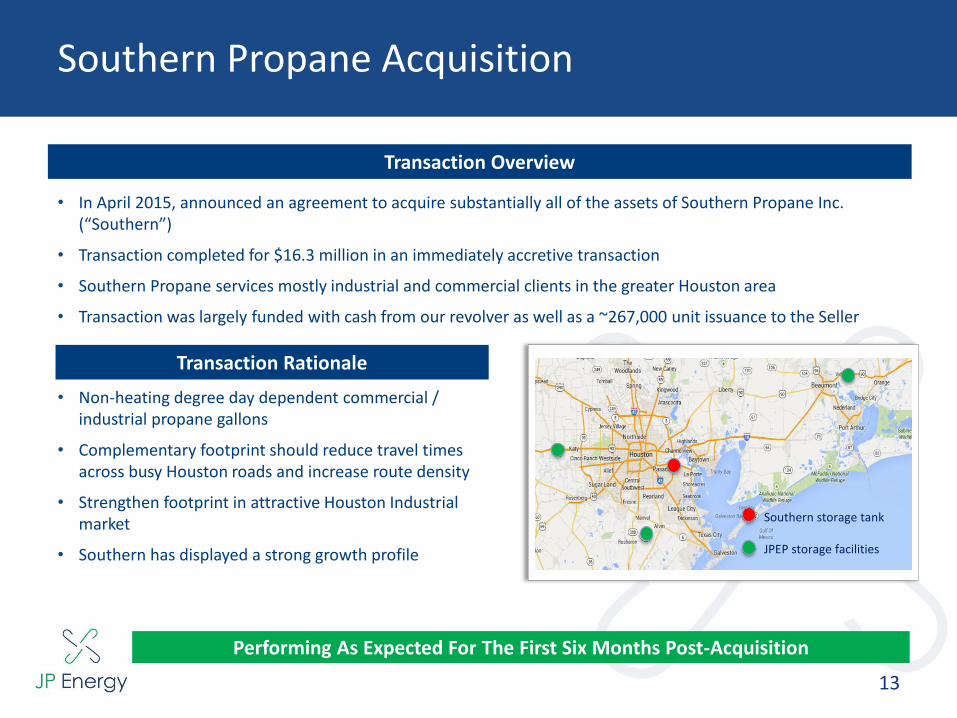
Southern Propane Acquisition
13
Transaction Overview
• In April 2015, announced an agreement to acquire substantially all of the assets of Southern Propane Inc. (“Southern”)
• Transaction completed for $16.3 million in an immediately accretive transaction
• Southern Propane services mostly industrial and commercial clients in the greater Houston area
• Transaction was largely funded with cash from our revolver as well as a ~267,000 unit issuance to the Seller
Transaction Rationale
• Non-heating degree day dependent commercial / industrial propane gallons
• Complementary footprint should reduce travel times across busy Houston roads and increase route density
• Strengthen footprint in attractive Houston Industrial market
• Southern has displayed a strong growth profile
• Southern storage tank
• JPEP storage facilities
Performing As Expected For The First Six Months Post-Acquisition
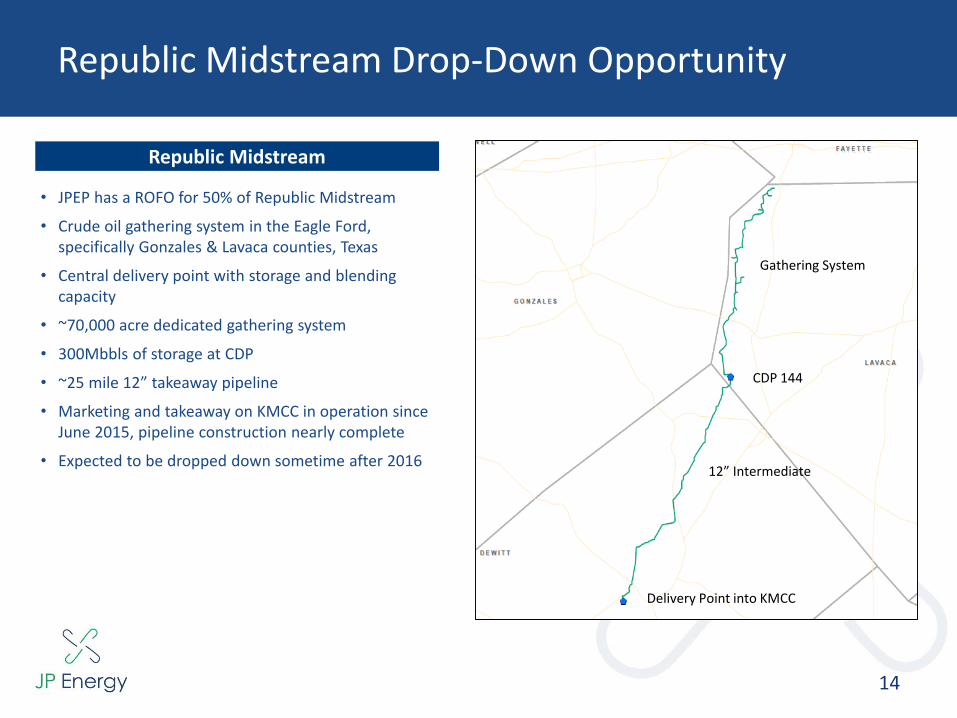
Republic Midstream Drop-Down Opportunity
14
Gathering System
CDP 144
12” Intermediate
Delivery Point into KMCC
Republic Midstream
• JPEP has a ROFO for 50% of Republic Midstream
• Crude oil gathering system in the Eagle Ford, specifically Gonzales & Lavaca counties, Texas
• Central delivery point with storage and blending capacity
• ~70,000 acre dedicated gathering system
• 300Mbbls of storage at CDP
• ~25 mile 12” takeaway pipeline
• Marketing and takeaway on KMCC in operation since June 2015, pipeline construction nearly complete
• Expected to be dropped down sometime after 2016
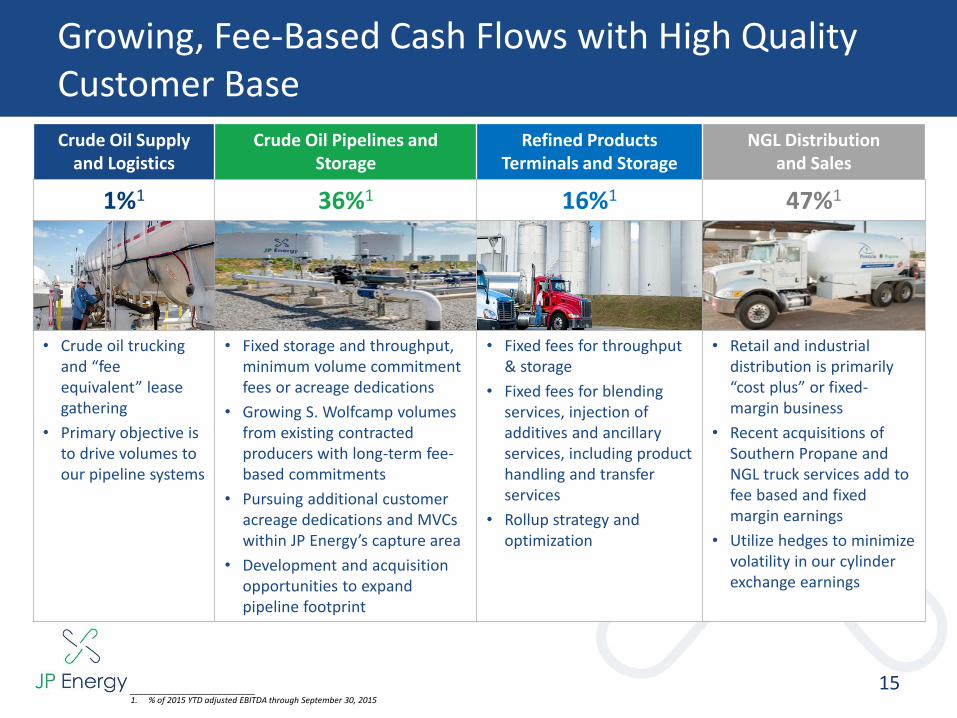
Growing, Fee-Based Cash Flows with High Quality Customer Base
15
Crude Oil Supply and Logistics
Crude Oil Pipelines and Storage
Refined Products Terminals and Storage
NGL Distributionand Sales
1%1 36%1 16%1 47%1
• Crude oil trucking and “fee equivalent” lease gathering
• Primary objective is to drive volumes to our pipeline systems
• Fixed storage and throughput, minimum volume commitment fees or acreage dedications
• Growing S. Wolfcamp volumesfrom existing contracted producers with long-term fee-based commitments
• Pursuing additional customer acreage dedications and MVCs within JP Energy’s capture area
• Development and acquisition opportunities to expand pipeline footprint
• Fixed fees for throughput & storage
• Fixed fees for blending services, injection of additives and ancillary services, including product handling and transfer services
• Rollup strategy and optimization
• Retail and industrial distribution is primarily “cost plus” or fixed-margin business
• Recent acquisitions of Southern Propane and NGL truck services add to fee based and fixed margin earnings
• Utilize hedges to minimize volatility in our cylinder exchange earnings
___________________________1. % of 2015 YTD adjusted EBITDA through September 30, 2015
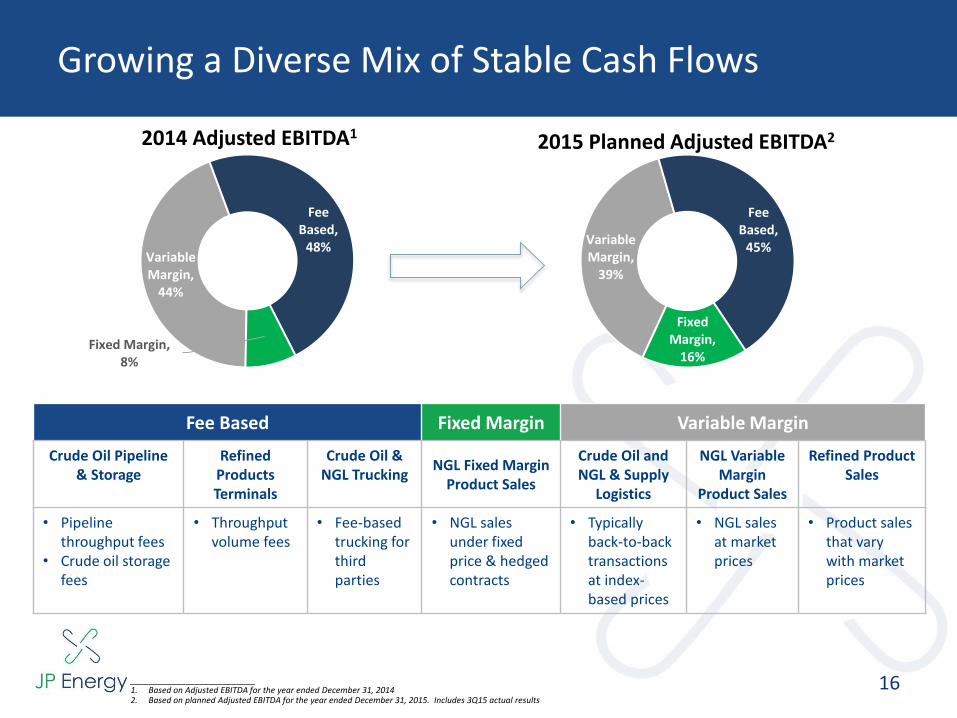
Growing a Diverse Mix of Stable Cash Flows
16___________________________1. Based on Adjusted EBITDA for the year ended December 31, 20142. Based on planned Adjusted EBITDA for the year ended December 31, 2015. Includes 3Q15 actual results
Fee Based Fixed Margin Variable Margin
Crude Oil Pipeline & Storage
Refined Products Terminals
Crude Oil & NGL Trucking
NGL Fixed Margin Product Sales
Crude Oil and NGL & Supply
Logistics
NGL Variable Margin
Product Sales
Refined Product Sales
• Pipeline throughput fees
• Crude oil storage fees
• Throughput volume fees
• Fee-basedtrucking for third parties
• NGL sales under fixed price & hedged contracts
• Typically back-to-back transactionsat index-based prices
• NGL salesat market prices
• Product sales that vary with market prices
2014 Adjusted EBITDA1 2015 Planned Adjusted EBITDA2
Variable Margin,
44%
Fee Based,
48%
Fixed Margin, 8%
Variable Margin,
39%
Fee Based,
45%
Fixed Margin,
16%
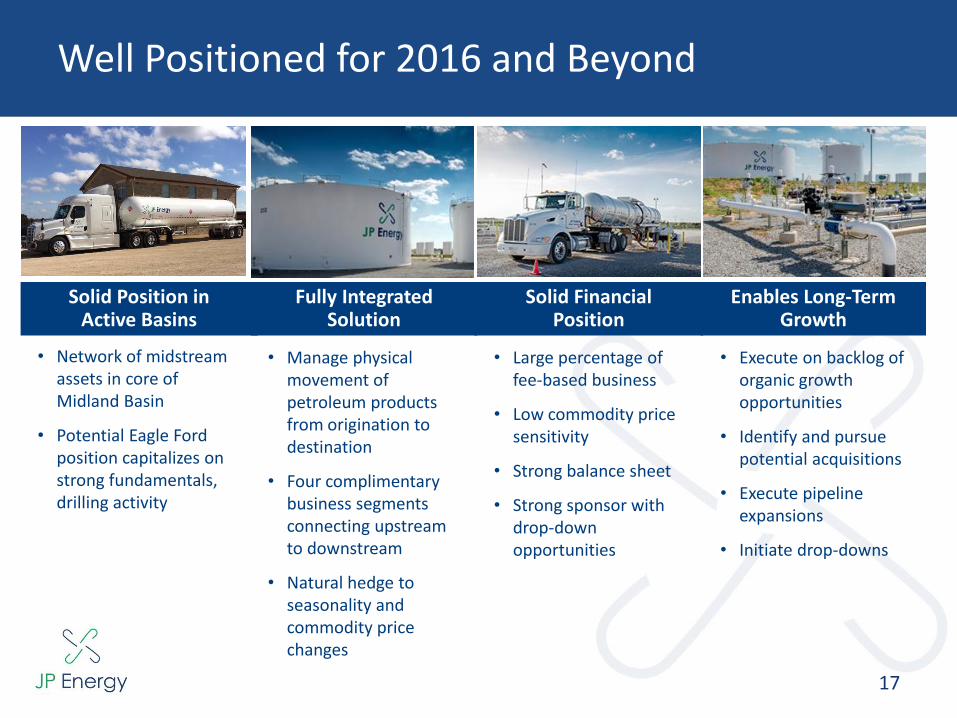
Well Positioned for 2016 and Beyond
17
Solid Position in Active Basins
Fully Integrated Solution
Solid Financial Position
• Network of midstream assets in core of Midland Basin
• Potential Eagle Ford position capitalizes on strong fundamentals, drilling activity
• Manage physical movement of petroleum products from origination to destination
• Four complimentary business segments connecting upstream to downstream
• Natural hedge to seasonality and commodity price changes
• Large percentage of fee-based business
• Low commodity price sensitivity
• Strong balance sheet
• Strong sponsor with drop-down opportunities
Enables Long-Term Growth
• Execute on backlog of organic growth opportunities
• Identify and pursue potential acquisitions
• Execute pipeline expansions
• Initiate drop-downs
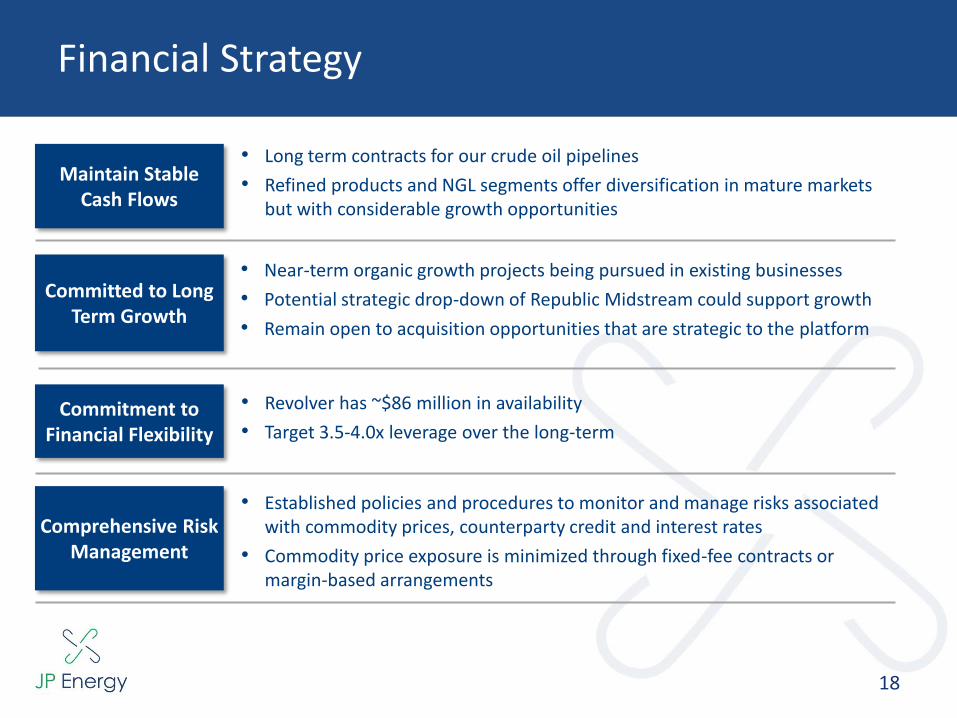
Financial Strategy
18
Maintain Stable Cash Flows
• Long term contracts for our crude oil pipelines
• Refined products and NGL segments offer diversification in mature markets but with considerable growth opportunities
Committed to Long Term Growth
• Near-term organic growth projects being pursued in existing businesses
• Potential strategic drop-down of Republic Midstream could support growth
• Remain open to acquisition opportunities that are strategic to the platform
Commitment to Financial Flexibility
• Revolver has ~$86 million in availability
• Target 3.5-4.0x leverage over the long-term
Comprehensive Risk Management
• Established policies and procedures to monitor and manage risks associated with commodity prices, counterparty credit and interest rates
• Commodity price exposure is minimized through fixed-fee contracts or margin-based arrangements

JPEP Investment Summary
19
Diversified Business
• Four unique but complementary business segments connecting upstream supply to downstream demand
• Opportunity to seek further value chain integration
• Approximately 80% of 2015 YTD EBITDA is generated outside of Crude Oil Supply and Logistics and our Crude Oil Pipelines business
Strategically Located Crude
Assets
• JP Energy Partners and JP Energy Development have strategically developed and acquired assets in the most profitable basins in North America
• Truck locations managed dynamically to optimize returns of Crude Oil Supply and Logistics and Crude Oil Pipelines segments
Stable Cash Flows
• Limited direct commodity price exposure
• 61% of 2015 Adjusted EBITDA is fee-based or fixed margin
Strong Equity Sponsorship
• Owns over 50% of the LP units and approximately 71% of the GP
• Experienced sponsor that is active in the market
• Remains committed to long-term drop down strategy, including Republic Midstream
Conservative Balance Sheet
• Focused on financially responsible and conservative growth and cost containment
• Revolver has ~$86 million in availability, target 3.5-4.0x leverage over the long-term
Appendix

Non-GAAP Reconciliation – Adjusted EBITDA
21
2015 2014 2015 2014
Segment Adjusted EBITDA
Crude oil pipelines and storage 5,988$ 5,301$ 17,593$ 15,447$
Crude oil supply and logistics (1,276) 5,477 394 7,139
Refined products terminals and storage 2,261 2,525 7,601 7,666
NGL distribution and sales 6,135 2,256 23,083 9,902
Discontinued operations - - - 983
Corporate and other (2,661) (5,966) (15,971) (19,502)
Total Adjusted EBITDA 10,447 9,593 32,700 21,635
Depreciation and amortization (12,343) (10,395) (35,768) (30,569)
Interest expense (1,514) (2,406) (4,069) (7,957)
Loss on extinguishment of debt - - - (1,634)
Income tax (expense) benefit (82) 158 (333) 2
Gain (loss) on disposal of assets, net 14 (533) (1,395) (1,193)
Unit-based compensation (323) (578) (875) (1,163)
Total gain (loss) on commodity derivatives 3,471 (762) (1,449) (730)
7,503 105 15,918 (483)
Early settlement of commodity derivatives (8,745) - (8,745) -
Non-cash inventory costing adjustment (3,662) - (2,671) -
Corporate overhead support from general partner (3,000) - (3,000) -
Transaction costs and other (214) (792) (3,033) (1,724)
Discontinued operations - - - (10,591)
Net loss (8,448)$ (5,610)$ (12,720)$ (34,407)$
Three months ended September 30,
Net cash (receipts) payments for commodity derivatives
settled during the period
Nine months ended September 30,
(in thousands)
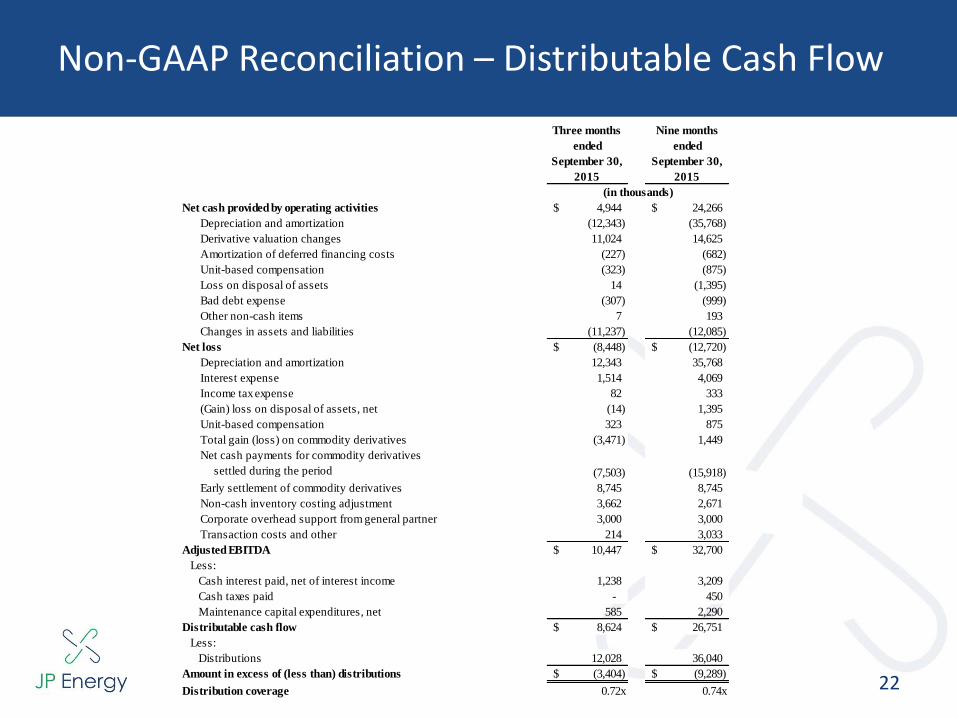
Non-GAAP Reconciliation – Distributable Cash Flow
22
Three months
ended
September 30,
2015
Nine months
ended
September 30,
2015
Net cash provided by operating activities 4,944$ 24,266$
Depreciation and amortization (12,343) (35,768)
Derivative valuation changes 11,024 14,625
Amortization of deferred financing costs (227) (682)
Unit-based compensation (323) (875)
Loss on disposal of assets 14 (1,395)
Bad debt expense (307) (999)
Other non-cash items 7 193
Changes in assets and liabilities (11,237) (12,085)
Net loss (8,448)$ (12,720)$
Depreciation and amortization 12,343 35,768
Interest expense 1,514 4,069
Income tax expense 82 333
(Gain) loss on disposal of assets, net (14) 1,395
Unit-based compensation 323 875
Total gain (loss) on commodity derivatives (3,471) 1,449
(7,503) (15,918)
Early settlement of commodity derivatives 8,745 8,745
Non-cash inventory costing adjustment 3,662 2,671
Corporate overhead support from general partner 3,000 3,000
Transaction costs and other 214 3,033
Adjusted EBITDA 10,447$ 32,700$
Less:
Cash interest paid, net of interest income 1,238 3,209
Cash taxes paid - 450
Maintenance capital expenditures, net 585 2,290
Distributable cash flow 8,624$ 26,751$
Less:
Distributions 12,028 36,040
Amount in excess of (less than) distributions (3,404)$ (9,289)$
Distribution coverage 0.72x 0.74x
Net cash payments for commodity derivatives
settled during the period
(in thousands)

Consolidated Income Statement
23
Three Months Ended September 30, Nine Months Ended September 30,
2015 2014 2015 2014
REVENUES:
210,422$ 371,623$ 730,859$ 1,102,030$
196 - 196 -
6,457 8,130 20,057 23,923
926 - 1,206 -
34,773 41,982 127,028 142,146
- 476 - 7,409
3,373 3,069 9,549 7,290
- 74 - 1,521
3,436 3,237 10,461 10,086
Total revenues 259,583 428,591 899,356 1,294,405
COSTS AND EXPENSES:
Cost of sales, excluding depreciation and amortization 224,425 392,662 781,173 1,190,859
Operating expense 19,119 17,048 53,676 52,304
General and administrative 10,669 11,315 36,132 35,196
Depreciation and amortization 12,343 10,395 35,768 30,569
(Gain) loss on disposal of assets, net (14) 533 1,395 1,193
Total costs and expenses 266,542 431,953 908,144 1,310,121
OPERATING LOSS (6,959) (3,362) (8,788) (15,716)
OTHER INCOME (EXPENSE)
Interest expense (1,514) (2,406) (4,069) (7,957)
Loss on extinguishment of debt - - - (1,634)
Other income, net 107 - 470 506
LOSS FROM CONTINUING OPERATIONS BEFORE INCOME TAXES (8,366) (5,768) (12,387) (24,801)
Income tax (expense) benefit (82) 158 (333) 2
LOSS FROM CONTINUING OPERATIONS (8,448) (5,610) (12,720) (24,799)
DISCONTINUED OPERATIONS
- - - (9,608)
NET LOSS (8,448)$ (5,610)$ (12,720)$ (34,407)$
Crude oil sales
NGL and refined product sales
Refined products terminals and storage fees
Net loss from discontinued operations
(in thousands, except unit and per unit data)
Crude oil sales - related parties
Gathering, transportation and storage fees
Gathering, transportation and storage fees - related parties
NGL and refined product sales - related parties
Refined products terminals and storage fees - related parties
Other revenues