rbc corporate class funds 2 1 2017 annual...
TRANSCRIPT

42374 (06-2017)
March
31, 2017R
BC
CO
RP
OR
ATE C
LAS
S FU
ND
S 2017 A
NN
UA
L REP
OR
T
RBC CORPORATE CLASS FUNDS
2017 Annual Report

1
Management Report of Fund Performance
FIXED-INCOME FUNDS
RBC Short Term Income Class 2
RBC $U.S. Short Term Income Class 9
BlueBay Global Convertible Bond Class (Canada) 16
BlueBay $U.S. Global Convertible Bond Class (Canada) 25
BALANCED FUNDS
Phillips, Hager & North Monthly Income Class 32
RBC Balanced Growth & Income Class 40
CANADIAN EQUITY FUNDS
RBC Canadian Dividend Class 47
RBC Canadian Equity Class 54
RBC QUBE Low Volatility Canadian Equity Class 61
Phillips, Hager & North Canadian Equity Value Class 68
RBC Canadian Equity Income Class 75
RBC Canadian Mid-Cap Equity Class 83
NORTH AMERICAN EQUITY FUNDS
RBC North American Value Class 90
U.S. EQUITY FUNDS
RBC U.S. Dividend Class 98
RBC U.S. Equity Class 105
RBC QUBE Low Volatility U.S. Equity Class 112
RBC U.S. Equity Value Class 119
Phillips, Hager & North U.S. Multi-Style
All-Cap Equity Class 126
RBC U.S. Mid-Cap Value Equity Class 133
RBC U.S. Small-Cap Core Equity Class 140
INTERNATIONAL EQUITY FUNDS
RBC International Equity Class 147
Phillips, Hager & North Overseas Equity Class 154
RBC European Equity Class 162
RBC Emerging Markets Equity Class 169
GLOBAL EQUITY FUNDS
RBC Global Equity Class 177
RBC QUBE Low Volatility Global Equity Class 184
RBC Global Resources Class 191
Financial Statements
MANAGEMENT’S RESPONSIBILITY FOR FINANCIAL REPORTING 199
INDEPENDENT AUDITOR’S REPORT 200
FIXED-INCOME FUNDSRBC Short Term Income Class 201RBC $U.S. Shor t Term Income Class 207BlueBay Global Conver tible Bond Class (Canada) 213BlueBay $U.S. Global Conver tible Bond Class (Canada) 221
BALANCED FUNDSPhillips, Hager & North Monthly Income Class 228RBC Balanced Growth & Income Class 236
CANADIAN EQUITY FUNDSRBC Canadian Dividend Class 244RBC Canadian Equity Class 250RBC QUBE Low Volatility Canadian Equity Class 256Phillips, Hager & North Canadian Equity Value Class 262RBC Canadian Equity Income Class 268RBC Canadian Mid-Cap Equity Class 276
NORTH AMERICAN EQUITY FUNDSRBC North American Value Class 282
U.S. EQUITY FUNDSRBC U.S. Dividend Class 288RBC U.S. Equity Class 294RBC QUBE Low Volatility U.S. Equity Class 300RBC U.S. Equity Value Class 306Phillips, Hager & North U.S. Multi-Style All-Cap Equity Class 312RBC U.S. Mid-Cap Value Equity Class 318RBC U.S. Small-Cap Core Equity Class 324
INTERNATIONAL EQUITY FUNDSRBC International Equity Class 330Phillips, Hager & North Overseas Equity Class 336RBC European Equity Class 343RBC Emerging Markets Equity Class 350
GLOBAL EQUITY FUNDSRBC Global Equity Class 356RBC QUBE Low Volatility Global Equity Class 362RBC Global Resources Class 368
GENERIC NOTES TO FINANCIAL STATEMENTS 374
CONTACT US 380
TABLE OF CONTENTS
1

ANNUAL MANAGEMENT REPORT OF FUND PERFORMANCE
2
FIXED-INCOME FUND
RBC SHORT TERM INCOME CLASS
March 31, 2017
Portfolio Manager RBC Global Asset Management Inc. (“RBC GAM”)
This annual management report of fund performance (“MRFP”) contains financial highlights but does not contain the complete annual financial statements of the Fund. You can get a copy of the financial statements at your request, and at no cost, by calling 1-800-463-FUND (3863), by writing to us at RBC Global Asset Management Inc., P.O. Box 7500, Station A, Toronto, Ontario M5W 1P9, or by visiting our website at www.rbcgam.com/reports or SEDAR at www.sedar.com. Security holders may also contact us using one of these methods to request a copy of the Fund’s proxy voting policies and procedures, proxy voting disclosure record, or quarterly portfolio disclosure.
The Board of Directors of RBC Corporate Class Inc. approved this annual management report of fund performance on May 11, 2017.
A Note on Forward-looking Statements
This report may contain forward-looking statements about the Fund, its future performance, strategies or prospects, and possible future Fund action. The words “may,” “could,” “should,” “would,” “suspect,” “outlook,” “believe,” “plan,” “anticipate,” “estimate,” “expect,” “intend,” “forecast,” “objective” and similar expressions are intended to identify forward-looking statements.
Forward-looking statements are not guarantees of future performance. Forward-looking statements involve inherent risks and uncertainties, both about the Fund and general economic factors, so it is possible that predictions, forecasts, projections and other forward-looking statements will not be achieved. We caution you not to place undue reliance on these statements as a number of important factors could cause actual events or results to differ materially from those expressed or implied in any forward-looking statement made in relation to the Fund. These factors include, but are not limited to, general economic, political and market factors in Canada, the United States and internationally, interest and foreign exchange rates, global equity and capital markets, business competition, technological changes, changes in laws and regulations, judicial or regulatory judgments, legal proceedings and catastrophic events.
The above list of important factors that may affect future results is not exhaustive. Before making any investment decisions, we encourage you to consider these and other factors carefully. All opinions contained in forward-looking statements are subject to change without notice and are provided in good faith but without legal responsibility.
2
ANNUAL MANAGEMENT REPORT OF FUND PERFORMANCE
March 31, 2017
3
MANAGEMENT DISCUSSION OF FUND PERFORMANCE
Investment Objective and StrategiesThe Fund seeks to provide current income and liquidity consistent with short-term money market rates, and to preserve the value of an investment.
To achieve its investment objective, the Fund invests most of its assets in the RBC Canadian Money Market Fund (the “underlying fund”), which holds primarily high-quality short-term government and corporate-debt securities with a maximum term of 365 days. The underlying fund’s corporate-debt holdings are deemed by major debt-rating agencies to be suitable for conservative investors. The underlying fund also includes short-term debt issued by Canadian chartered banks and promissory notes issued or guaranteed by Canadian governments or their agencies.
RiskThere were no significant changes to the investment objective and strategies that affected the Fund’s overall level of risk during the reporting period. The risks of investing in the Fund and the suitability of the Fund for investors remain as discussed in the Simplified Prospectus.
Results of OperationsThe Fund’s net asset value fell to $12 million as of March 31, 2017, from $40 million as of March 31, 2016. The reduction was due to net redemptions.
Over the past year, the Fund’s Series A shares gained 0.4%, which underperformed the 0.5% rise in the benchmark. The Fund’s return is after the deduction of fees and expenses, while the benchmark and broad-based index returns do not include any costs of investing. See the Financial Highlights section for the management expense ratios and the Past Performance section for the returns of any other series, which may vary because of differences in management fees and expenses.
Canadian money-market yields rose slightly during the period, pulled higher by a rise in U.S. yields. However, the increase in money-market Canadian yields was much smaller than it was for comparable U.S. yields, as a slow and uneven Canadian economic recovery kept the Bank of Canada (the “BOC”) from raising its benchmark interest rate. The Canadian economy continued to deal with the headwinds of tepid trade, lacklustre business investment and Alberta wildfires that crimped oil production. Another brake on the BOC was concern that raising rates would destabilize hot housing markets in Toronto and Vancouver. While Canada’s economy struggled, the U.S. was gaining momentum, leading to two rates hikes by the U.S. Federal Reserve (the “Fed”) toward the end of the period. Fuelling the brighter U.S. outlook was Donald Trump’s election as president and his promises of deregulation, higher government spending and lower taxes. As a result, U.S. money-market yields climbed about 0.55 percentage
point, compared with about 0.07 point for similar Canadian securities. Globally, developed economies continued to struggle in their goal to generate growth.
With the odds of a BOC rate hike being slim, the portfolio manager kept the Fund’s average term to maturity somewhat elevated and used periodic jumps in market yields to lock in higher yields. The Fund favoured higher-yielding asset-backed commercial paper, as commercial-paper issuance was persistently weak. Regulatory liquidity requirements were satisfied through active maturity management and a position in provincial securities.
Recent DevelopmentsRecent rate hikes by the Fed are at odds with the trend at all other major central banks, which many investors do not expect to raise rates anytime soon. The Fed is wary that relatively low U.S. interest rates will fuel inflation, and the portfolio manager expects two more rate hikes within a year. The portfolio manager believes that the BOC is unlikely to follow the Fed, given uncertainty about whether President Trump will follow through on threats to erect trade barriers and the failure so far of the Canadian economy to substitute trade for the output lost due to the fall in energy prices in recent years. The portfolio manager anticipates that the BOC will keep its benchmark interest rate where it is for the remainder of the year. In the portfolio manager’s view, this policy stance, in tandem with the Fed’s preference for tighter monetary policy, will likely result in a weaker dollar and spur domestic growth.
On December 15, 2016, the Canadian government enacted new tax rules that eliminate the ability of investors to switch among different classes of RBC Corporate Class Funds on a tax-deferred basis. The new rules do not apply to switches between different series of the same fund.
Effective December 1, 2016, Mr. Lloyd R. McGinnis retired and Ms. Élaine Cousineau was appointed as Chair of the Independent Review Committee (the “IRC”). Mr. Charles F. Macfarlane was appointed as Vice Chair of the IRC. Effective January 1, 2017, Ms. Suromitra Sanatani and Ms. Catherine Kloepfer were appointed as members of the IRC.
Effective July 1, 2016, Deloitte LLP resigned and PricewaterhouseCoopers LLP was appointed as auditors of the Fund.
Effective June 30, 2016, Series H mutual fund shares and Series I mutual fund shares were closed to all investors.
RBC SHORT TERM INCOME CLASS
3

ANNUAL MANAGEMENT REPORT OF FUND PERFORMANCE
March 31, 2017
4
RBC SHORT TERM INCOME CLASS
Related-Party TransactionsManager and Portfolio ManagerRBC GAM is an indirect, wholly owned subsidiary of Royal Bank of Canada (“Royal Bank”) and is the manager and portfolio manager of the Fund. RBC GAM is responsible for the Fund’s day-to-day operations, provides investment advice and portfolio management services to the Fund and appoints distributors for the Fund. RBC GAM is paid a management fee by the Fund as compensation for its services. The Fund pays a fixed administration fee to RBC GAM, which, in turn, pays certain operating expenses of the Fund.
Affiliates of RBC GAM that provide services to the Fund in the course of their normal businesses are discussed below.
DistributorsRBC GAM, Royal Mutual Funds Inc., RBC Direct Investing Inc., RBC Dominion Securities Inc. and Phillips, Hager & North Investment Funds Ltd. are the principal distributors of, or distribute certain series of the mutual fund shares of, the Fund. Dealers receive an ongoing commission based on the total value of their clients’ Series A, Advisor Series and Series D mutual fund shares.
CustodianRBC Investor Services Trust (“RBC IS”) is the custodian and holds the assets of the Fund.
RegistrarsRoyal Bank, RBC IS and RBC GAM are the registrars of the Fund and keep records of who owns the mutual fund shares of the Fund.
Other Related-Party TransactionsPursuant to applicable securities legislation, the Fund relied on the standing instructions from the Independent Review Committee with respect to one or more of the following transactions:
Related-Party Trading Activities(a) trades in securities of Royal Bank;
(b) investments in the securities of issuers for which a related-party dealer acted as an underwriter during the distribution of such securities and the 60-day period following the conclusion of such distribution of the underwritten securities to the public;
(c) purchases of equity and debt securities from or sales of equity or debt securities to a related-party dealer, where it acted as principal; and
Inter-Fund Trading(d) purchases or sales of securities of an issuer from or to another
investment fund or managed account managed by RBC GAM.
The applicable standing instructions require that Related-Party Trading Activities and Inter-Fund Trading be conducted in accordance with RBC GAM policy and that RBC GAM advise the Independent Review Committee of a material breach of any standing instruction. RBC GAM policy requires that an investment decision in respect of Related-Party Trading Activities (i) is made free from any influence of Royal Bank or its associates or affiliates and without taking into account any consideration relevant to Royal Bank or its affiliates or associates, (ii) represents the business judgment of the portfolio manager, uninfluenced by considerations other than the best interests of the Fund, (iii) is in compliance with RBC GAM policies and procedures, and (iv) achieves a fair and reasonable result for the Fund. RBC GAM policy requires that an investment decision in respect of Inter-Fund Trading is in the best interests of each Fund.
4

ANNUAL MANAGEMENT REPORT OF FUND PERFORMANCE
March 31, 2017
5
FINANCIAL HIGHLIGHTS The following tables show selected key financial information about the Fund and are intended to help you understand the Fund’s financial performance for the past five years or for the periods since inception. This information is derived from the Fund’s audited annual financial statements. For financial years beginning on or after April 1, 2014, financial highlight information is derived from financial statements prepared in compliance with International Financial Reporting Standards (“IFRS”). For financial years prior to April 1, 2014, financial highlight information is derived from financial statements prepared in accordance with Canadian generally accepted accounting principles (“GAAP”). “Net Assets,” for the periods prior to April 1, 2014, are calculated in accordance with GAAP, and “Net Asset Value” is derived from the valuation method disclosed in the RBC Corporate Class Funds Annual Information Form and is used for transactional purposes (see Ratios and Supplemental Data). All other calculations for the purposes of this MRFP are made using Net Asset Value. There is no significant difference between “Net Assets” and “Net Asset Value” under IFRS.
Change in Net Assets Per Mutual Fund Share ($)
Annual Distributions2
Increase (Decrease) from Operations1 From Total Realized Unrealized Income From Net Assets For the Year/ Net Assets Revenue Total Gains Gains (Excluding From Capital Return End of Period Ended Beginning of Year/Period (Loss) Expenses (Losses) (Losses) Total Dividends) Dividends Gains of Capital Total Year/Period
Series AMar. 31, 2017 10.22 0.09 (0.06) – – 0.03 – – – – – 10.26 Mar. 31, 2016 10.19 0.09 (0.06) – – 0.03 – – – – – 10.22Mar. 31, 2015 10.13 0.12 (0.06) – – 0.06 – – – – – 10.19Mar. 31, 2014 10.07 0.12 (0.06) – – 0.06 – – – – – 10.13Mar. 31, 2013 10.01 0.12 (0.06) – – 0.06 – – – – – 10.07
Advisor SeriesMar. 31, 2017 10.20 0.10 (0.07) – – 0.03 – – – – – 10.23Mar. 31, 2016 10.18 0.09 (0.07) – – 0.02 – – – – – 10.20 Mar. 31, 2015 10.12 0.12 (0.07) – – 0.05 – – – – – 10.18 Mar. 31, 2014 10.06 0.12 (0.07) – – 0.05 – – – – – 10.12Mar. 31, 2013 10.00 0.14 (0.07) – – 0.07 – – – – – 10.06
Series DMar. 31, 2017 10.22 0.10 (0.06) – – 0.04 – – – – – 10.26Mar. 31, 2016 10.19 0.09 (0.06) – – 0.03 – – – – – 10.22Mar. 31, 2015 10.13 0.12 (0.06) – – 0.06 – – – – – 10.19 Mar. 31, 2014 10.07 0.13 (0.06) – – 0.07 – – – – – 10.13Mar. 31, 2013 10.00 0.13 (0.06) – – 0.07 – – – – – 10.07
Series FMar. 31, 2017 10.24 0.10 (0.06) – – 0.04 – – – – – 10.28Mar. 31, 2016 10.21 0.09 (0.06) – – 0.03 – – – – – 10.24Mar. 31, 2015 10.14 0.12 (0.06) – – 0.06 – – – – – 10.21 Mar. 31, 2014 10.07 0.12 (0.06) – – 0.06 – – – – – 10.14Mar. 31, 2013 10.01 0.15 (0.06) – – 0.09 – – – – – 10.07
Series OMar. 31, 2017 10.46 0.09 – – – 0.09 – – – – – 10.56Mar. 31, 2016 10.38 0.10 – – – 0.10 – – – – – 10.46 Mar. 31, 2015 10.26 0.12 – – – 0.12 – – – – – 10.38 Mar. 31, 2014 10.14 0.12 – – – 0.12 – – – – – 10.26Mar. 31, 2013 10.02 0.17 (0.01) – – 0.16 – – – – – 10.14
1 Net assets and distributions are based on the actual number of mutual fund shares outstanding at the relevant time. The increase/decrease from operations is based on the weighted average number of mutual fund shares outstanding over the financial period. This table is not intended to be a reconciliation of beginning to ending net assets per mutual fund share.
2 Distributions are reinvested in additional mutual fund shares of the Fund or paid in cash.
RBC SHORT TERM INCOME CLASS
5
ANNUAL MANAGEMENT REPORT OF FUND PERFORMANCE
March 31, 2017
6
RBC SHORT TERM INCOME CLASS
FINANCIAL HIGHLIGHTS (cont.)
Ratios and Supplemental Data
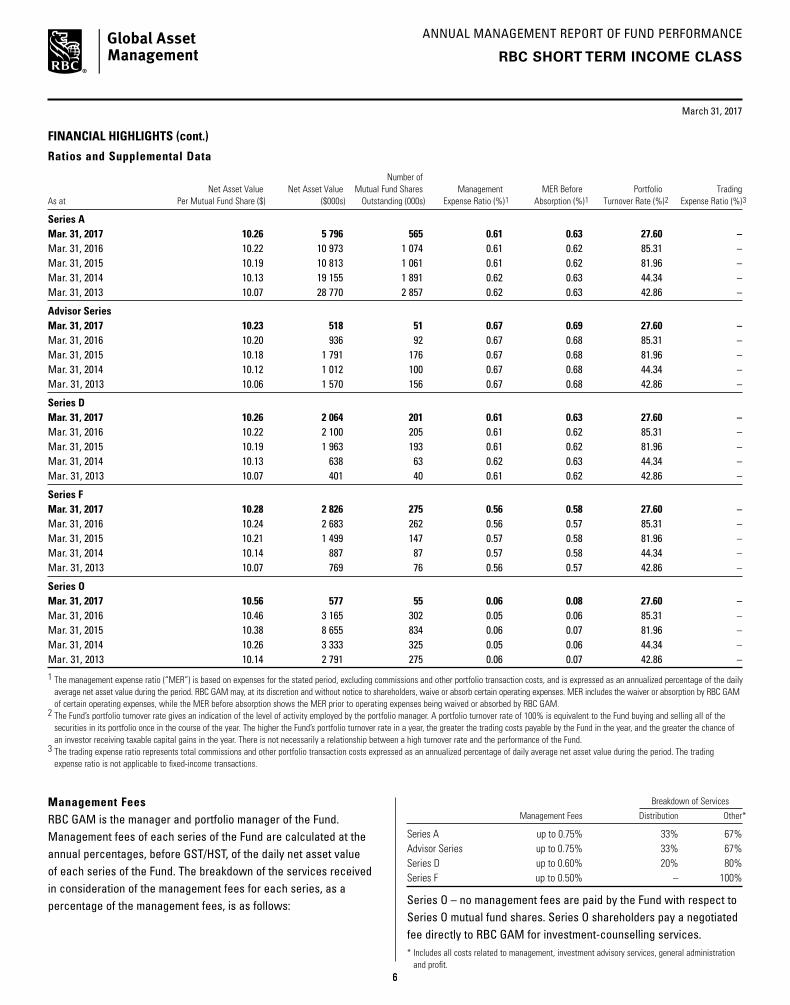
Number of Net Asset Value Net Asset Value Mutual Fund Shares Management MER Before Portfolio TradingAs at Per Mutual Fund Share ($) ($000s) Outstanding (000s) Expense Ratio (%)1 Absorption (%)1 Turnover Rate (%)2 Expense Ratio (%)3
Series AMar. 31, 2017 10.26 5 796 565 0.61 0.63 27.60 – Mar. 31, 2016 10.22 10 973 1 074 0.61 0.62 85.31 –Mar. 31, 2015 10.19 10 813 1 061 0.61 0.62 81.96 –Mar. 31, 2014 10.13 19 155 1 891 0.62 0.63 44.34 –Mar. 31, 2013 10.07 28 770 2 857 0.62 0.63 42.86 –
Advisor SeriesMar. 31, 2017 10.23 518 51 0.67 0.69 27.60 –Mar. 31, 2016 10.20 936 92 0.67 0.68 85.31 –Mar. 31, 2015 10.18 1 791 176 0.67 0.68 81.96 –Mar. 31, 2014 10.12 1 012 100 0.67 0.68 44.34 –Mar. 31, 2013 10.06 1 570 156 0.67 0.68 42.86 –
Series DMar. 31, 2017 10.26 2 064 201 0.61 0.63 27.60 –Mar. 31, 2016 10.22 2 100 205 0.61 0.62 85.31 –Mar. 31, 2015 10.19 1 963 193 0.61 0.62 81.96 – Mar. 31, 2014 10.13 638 63 0.62 0.63 44.34 –Mar. 31, 2013 10.07 401 40 0.61 0.62 42.86 –
Series FMar. 31, 2017 10.28 2 826 275 0.56 0.58 27.60 –Mar. 31, 2016 10.24 2 683 262 0.56 0.57 85.31 –Mar. 31, 2015 10.21 1 499 147 0.57 0.58 81.96 –Mar. 31, 2014 10.14 887 87 0.57 0.58 44.34 –Mar. 31, 2013 10.07 769 76 0.56 0.57 42.86 –
Series OMar. 31, 2017 10.56 577 55 0.06 0.08 27.60 –Mar. 31, 2016 10.46 3 165 302 0.05 0.06 85.31 –Mar. 31, 2015 10.38 8 655 834 0.06 0.07 81.96 –Mar. 31, 2014 10.26 3 333 325 0.05 0.06 44.34 –Mar. 31, 2013 10.14 2 791 275 0.06 0.07 42.86 –
1 The management expense ratio (“MER”) is based on expenses for the stated period, excluding commissions and other portfolio transaction costs, and is expressed as an annualized percentage of the daily average net asset value during the period. RBC GAM may, at its discretion and without notice to shareholders, waive or absorb certain operating expenses. MER includes the waiver or absorption by RBC GAM of certain operating expenses, while the MER before absorption shows the MER prior to operating expenses being waived or absorbed by RBC GAM.
2 The Fund’s portfolio turnover rate gives an indication of the level of activity employed by the portfolio manager. A portfolio turnover rate of 100% is equivalent to the Fund buying and selling all of the securities in its portfolio once in the course of the year. The higher the Fund’s portfolio turnover rate in a year, the greater the trading costs payable by the Fund in the year, and the greater the chance of an investor receiving taxable capital gains in the year. There is not necessarily a relationship between a high turnover rate and the performance of the Fund.
3 The trading expense ratio represents total commissions and other portfolio transaction costs expressed as an annualized percentage of daily average net asset value during the period. The trading expense ratio is not applicable to fixed-income transactions.
Management Fees RBC GAM is the manager and portfolio manager of the Fund. Management fees of each series of the Fund are calculated at the annual percentages, before GST/HST, of the daily net asset value of each series of the Fund. The breakdown of the services received in consideration of the management fees for each series, as a percentage of the management fees, is as follows:
Breakdown of Services
Management Fees Distribution Other*
Series A up to 0.75% 33% 67% Advisor Series up to 0.75% 33% 67% Series D up to 0.60% 20% 80%Series F up to 0.50% – 100%
Series O – no management fees are paid by the Fund with respect to Series O mutual fund shares. Series O shareholders pay a negotiated fee directly to RBC GAM for investment-counselling services.* Includes all costs related to management, investment advisory services, general administration
and profit.6
ANNUAL MANAGEMENT REPORT OF FUND PERFORMANCE
7
March 31, 2017
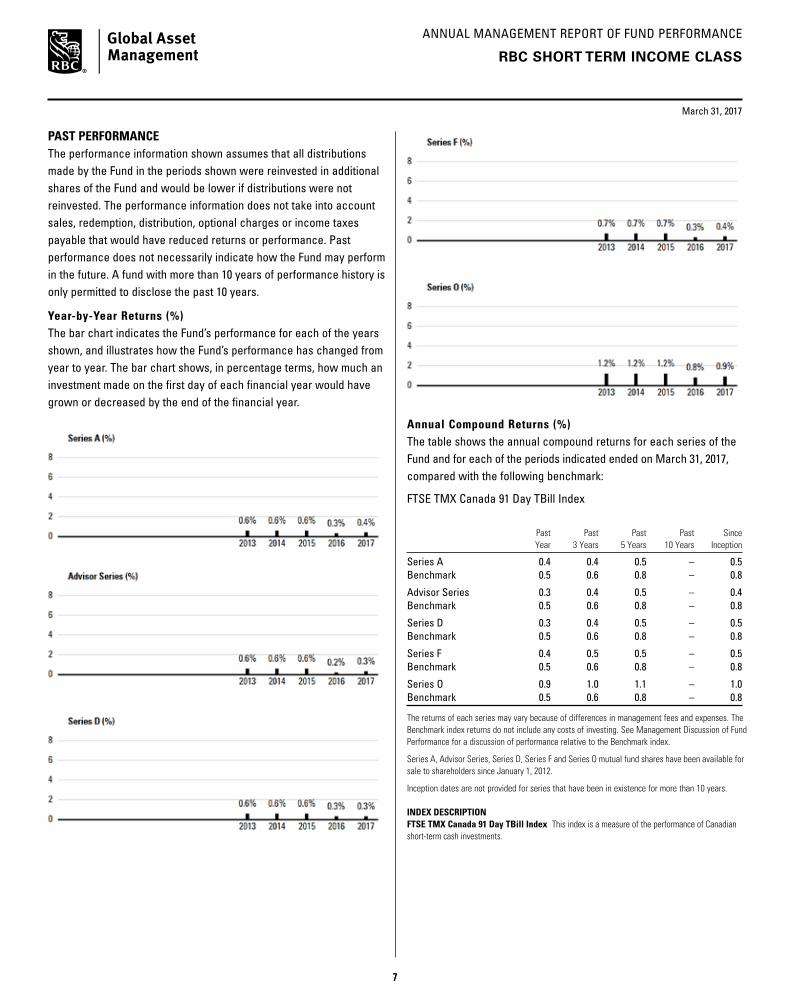
Annual Compound Returns (%) The table shows the annual compound returns for each series of the Fund and for each of the periods indicated ended on March 31, 2017, compared with the following benchmark:
FTSE TMX Canada 91 Day TBill Index
Past Past Past Past Since Year 3 Years 5 Years 10 Years Inception
Series A 0.4 0.4 0.5 – 0.5Benchmark 0.5 0.6 0.8 – 0.8
Advisor Series 0.3 0.4 0.5 – 0.4Benchmark 0.5 0.6 0.8 – 0.8
Series D 0.3 0.4 0.5 – 0.5Benchmark 0.5 0.6 0.8 – 0.8
Series F 0.4 0.5 0.5 – 0.5Benchmark 0.5 0.6 0.8 – 0.8
Series O 0.9 1.0 1.1 – 1.0Benchmark 0.5 0.6 0.8 – 0.8
The returns of each series may vary because of differences in management fees and expenses. The Benchmark index returns do not include any costs of investing. See Management Discussion of Fund Performance for a discussion of performance relative to the Benchmark index.
Series A, Advisor Series, Series D, Series F and Series O mutual fund shares have been available for sale to shareholders since January 1, 2012.
Inception dates are not provided for series that have been in existence for more than 10 years.
INDEX DESCRIPTIONFTSE TMX Canada 91 Day TBill Index This index is a measure of the performance of Canadian short-term cash investments.
RBC SHORT TERM INCOME CLASS
PAST PERFORMANCEThe performance information shown assumes that all distributions made by the Fund in the periods shown were reinvested in additional shares of the Fund and would be lower if distributions were not reinvested. The performance information does not take into account sales, redemption, distribution, optional charges or income taxes payable that would have reduced returns or performance. Past performance does not necessarily indicate how the Fund may perform in the future. A fund with more than 10 years of performance history is only permitted to disclose the past 10 years.
Year-by-Year Returns (%) The bar chart indicates the Fund’s performance for each of the years shown, and illustrates how the Fund’s performance has changed from year to year. The bar chart shows, in percentage terms, how much an investment made on the first day of each financial year would have grown or decreased by the end of the financial year.
7
ANNUAL MANAGEMENT REPORT OF FUND PERFORMANCE
March 31, 2017
8
RBC SHORT TERM INCOME CLASS
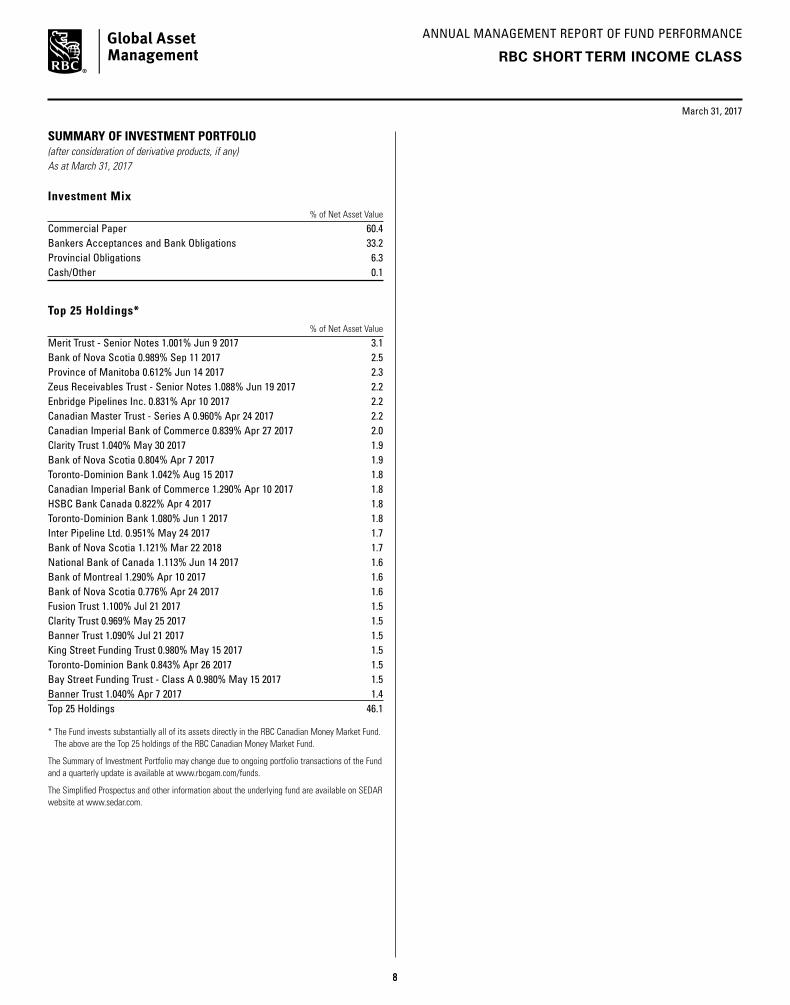
SUMMARY OF INVESTMENT PORTFOLIO(after consideration of derivative products, if any)As at March 31, 2017
Investment Mix % of Net Asset Value
Commercial Paper 60.4Bankers Acceptances and Bank Obligations 33.2Provincial Obligations 6.3Cash/Other 0.1
Top 25 Holdings* % of Net Asset Value
Merit Trust - Senior Notes 1.001% Jun 9 2017 3.1Bank of Nova Scotia 0.989% Sep 11 2017 2.5Province of Manitoba 0.612% Jun 14 2017 2.3Zeus Receivables Trust - Senior Notes 1.088% Jun 19 2017 2.2Enbridge Pipelines Inc. 0.831% Apr 10 2017 2.2Canadian Master Trust - Series A 0.960% Apr 24 2017 2.2Canadian Imperial Bank of Commerce 0.839% Apr 27 2017 2.0Clarity Trust 1.040% May 30 2017 1.9Bank of Nova Scotia 0.804% Apr 7 2017 1.9Toronto-Dominion Bank 1.042% Aug 15 2017 1.8Canadian Imperial Bank of Commerce 1.290% Apr 10 2017 1.8HSBC Bank Canada 0.822% Apr 4 2017 1.8Toronto-Dominion Bank 1.080% Jun 1 2017 1.8Inter Pipeline Ltd. 0.951% May 24 2017 1.7Bank of Nova Scotia 1.121% Mar 22 2018 1.7National Bank of Canada 1.113% Jun 14 2017 1.6Bank of Montreal 1.290% Apr 10 2017 1.6Bank of Nova Scotia 0.776% Apr 24 2017 1.6Fusion Trust 1.100% Jul 21 2017 1.5Clarity Trust 0.969% May 25 2017 1.5Banner Trust 1.090% Jul 21 2017 1.5King Street Funding Trust 0.980% May 15 2017 1.5Toronto-Dominion Bank 0.843% Apr 26 2017 1.5Bay Street Funding Trust - Class A 0.980% May 15 2017 1.5Banner Trust 1.040% Apr 7 2017 1.4Top 25 Holdings 46.1
* The Fund invests substantially all of its assets directly in the RBC Canadian Money Market Fund. The above are the Top 25 holdings of the RBC Canadian Money Market Fund.
The Summary of Investment Portfolio may change due to ongoing portfolio transactions of the Fund and a quarterly update is available at www.rbcgam.com/funds.
The Simplified Prospectus and other information about the underlying fund are available on SEDAR website at www.sedar.com.
8

ANNUAL MANAGEMENT REPORT OF FUND PERFORMANCE
9
FIXED-INCOME FUND
RBC $U.S. SHORT TERM INCOME CLASS
March 31, 2017
Portfolio Manager RBC Global Asset Management Inc. (“RBC GAM”)
This annual management report of fund performance (“MRFP”) contains financial highlights but does not contain the complete annual financial statements of the Fund. You can get a copy of the financial statements at your request, and at no cost, by calling 1-800-463-FUND (3863), by writing to us at RBC Global Asset Management Inc., P.O. Box 7500, Station A, Toronto, Ontario M5W 1P9, or by visiting our website at www.rbcgam.com/reports or SEDAR at www.sedar.com. Security holders may also contact us using one of these methods to request a copy of the Fund’s proxy voting policies and procedures, proxy voting disclosure record, or quarterly portfolio disclosure.
The Board of Directors of RBC Corporate Class Inc. approved this annual management report of fund performance on May 11, 2017.
A Note on Forward-looking Statements
This report may contain forward-looking statements about the Fund, its future performance, strategies or prospects, and possible future Fund action. The words “may,” “could,” “should,” “would,” “suspect,” “outlook,” “believe,” “plan,” “anticipate,” “estimate,” “expect,” “intend,” “forecast,” “objective” and similar expressions are intended to identify forward-looking statements.
Forward-looking statements are not guarantees of future performance. Forward-looking statements involve inherent risks and uncertainties, both about the Fund and general economic factors, so it is possible that predictions, forecasts, projections and other forward-looking statements will not be achieved. We caution you not to place undue reliance on these statements as a number of important factors could cause actual events or results to differ materially from those expressed or implied in any forward-looking statement made in relation to the Fund. These factors include, but are not limited to, general economic, political and market factors in Canada, the United States and internationally, interest and foreign exchange rates, global equity and capital markets, business competition, technological changes, changes in laws and regulations, judicial or regulatory judgments, legal proceedings and catastrophic events.
The above list of important factors that may affect future results is not exhaustive. Before making any investment decisions, we encourage you to consider these and other factors carefully. All opinions contained in forward-looking statements are subject to change without notice and are provided in good faith but without legal responsibility.
9

ANNUAL MANAGEMENT REPORT OF FUND PERFORMANCE
March 31, 2017
10
MANAGEMENT DISCUSSION OF FUND PERFORMANCE
Investment Objective and StrategiesThe Fund seeks to provide current income and liquidity consistent with short-term U.S. money market rates, to preserve the value of an investment, and to generate U.S. dollar returns, thereby providing investors with potential for currency diversification.
To achieve its investment objective, the Fund invests most of its assets in the RBC $U.S. Money Market Fund (the “underlying fund”), which holds primarily high-quality, short-term (one year or less) debt securities denominated in U.S. dollars, including treasury bills issued or guaranteed by Canadian or foreign governments or their agencies, bankers acceptances, asset-backed commercial paper and commercial paper issued by Canadian or foreign corporations and supranational agencies such as the World Bank.
RiskThere were no significant changes to the investment objective and strategies that affected the Fund’s overall level of risk during the reporting period. The risks of investing in the Fund and the suitability of the Fund for investors remain as discussed in the Simplified Prospectus.
Results of OperationsThe Fund’s net asset value rose to $281,000 as of March 31, 2017, from $150,000 as of March 31, 2016. The increase was due to net inflows.
Over the past year, the Fund’s Series A shares gained 0.7%, which outperformed the 0.3% rise in the benchmark. The Fund’s return is after the deduction of fees and expenses, while the benchmark and broad-based index returns do not include any costs of investing. See the Financial Highlights section for the management expense ratios and the Past Performance section for the returns of any other series, which may vary because of differences in management fees and expenses.
U.S. money-market yields increased, accelerating their ascent after the U.S. Federal Reserve (the “Fed”) twice boosted its benchmark interest rate toward the end of the period. The step by the Fed followed steady signs of economic recovery in the U.S. and momentum over the period, as the labour market tightened and consumer and business confidence improved. Fuelling the brighter U.S. economic outlook was Donald Trump’s election as president, which was built on promises of deregulation, higher government spending and lower taxes. The appeal of U.S. investments was boosted by decisions at the European Central Bank and the Bank of Japan, the other most important central banks, to keep rates unchanged as growth in these areas lagged and the U.K.’s decision to leave the Eurozone temporarily disrupted markets. U.S. yields rose about 0.55 percentage point during the period.
The portfolio manager managed the Fund’s average term to maturity around times when the Fed was expected to raise rates, maintaining lower holdings of short-dated securities when no hike was expected, and increasing them on the eve of an expected hike. This approach allowed the Fund to capture the immediate increase in rates once a rate hike occurred. Regulatory liquidity requirements were satisfied through active maturity management and a core position in provincial paper.
Recent DevelopmentsThe U.S. labour market is recovering and inflationary pressures are beginning to stir, leaving the Fed to weigh whether expectations of higher government spending will require further rate increases. Market indicators suggest that the Fed will boost rates two more times in the coming 12 months as investors bet that the U.S. central bank will seek to create some room to cut rates in the event of a recession. The portfolio manager anticipates that the Fed will gradually tighten monetary policy and that money-market yields will rise slowly. As a result, the portfolio manager expects to maintain a substantial percentage of the portfolio in assets that mature near the time of a Fed meeting so that the Fund can benefit from any imminent rate hike. In the portfolio manager’s view, this approach should result in a steadily increasing yield for the Fund.
On December 15, 2016, the Canadian government enacted new tax rules that eliminate the ability of investors to switch among different classes of RBC Corporate Class Funds on a tax-deferred basis. The new rules do not apply to switches between different series of the same fund.
Effective December 1, 2016, Mr. Lloyd R. McGinnis retired and Ms. Élaine Cousineau was appointed as Chair of the Independent Review Committee (the “IRC”). Mr. Charles F. Macfarlane was appointed as Vice Chair of the IRC. Effective January 1, 2017, Ms. Suromitra Sanatani and Ms. Catherine Kloepfer were appointed as members of the IRC.
Effective July 1, 2016, Deloitte LLP resigned and PricewaterhouseCoopers LLP was appointed as auditors of the Fund.
Related-Party TransactionsManager and Portfolio ManagerRBC GAM is an indirect, wholly owned subsidiary of Royal Bank of Canada (“Royal Bank”) and is the manager and portfolio manager of the Fund. RBC GAM is responsible for the Fund’s day-to-day operations, provides investment advice and portfolio management services to the Fund and appoints distributors for the Fund. RBC GAM is paid a management fee by the Fund as compensation for its services. The Fund pays a fixed administration fee to RBC GAM, which, in turn, pays certain operating expenses of the Fund.
RBC $U.S. SHORT TERM INCOME CLASS(IN U.S. DOLLARS)
10

ANNUAL MANAGEMENT REPORT OF FUND PERFORMANCE
March 31, 2017
11
RBC $U.S. SHORT TERM INCOME CLASS(IN U.S. DOLLARS)
Affiliates of RBC GAM that provide services to the Fund in the course of their normal businesses are discussed below.
DistributorsRBC GAM, Royal Mutual Funds Inc., RBC Direct Investing Inc., RBC Dominion Securities Inc. and Phillips, Hager & North Investment Funds Ltd. are the principal distributors of, or distribute certain series of the mutual fund shares of, the Fund. Dealers receive an ongoing commission based on the total value of their clients’ Series A and Series D mutual fund shares.
CustodianRBC Investor Services Trust (“RBC IS”) is the custodian and holds the assets of the Fund.
RegistrarsRoyal Bank, RBC IS and RBC GAM are the registrars of the Fund and keep records of who owns the mutual fund shares of the Fund.
Other Related-Party TransactionsPursuant to applicable securities legislation, the Fund relied on the standing instructions from the Independent Review Committee with respect to one or more of the following transactions:
Related-Party Trading Activities(a) trades in securities of Royal Bank;
(b) investments in the securities of issuers for which a related-party dealer acted as an underwriter during the distribution of such securities and the 60-day period following the conclusion of such distribution of the underwritten securities to the public;
(c) purchases of equity and debt securities from or sales of equity or debt securities to a related-party dealer, where it acted as principal; and
Inter-Fund Trading(d) purchases or sales of securities of an issuer from or to another
investment fund or managed account managed by RBC GAM.
The applicable standing instructions require that Related-Party Trading Activities and Inter-Fund Trading be conducted in accordance with RBC GAM policy and that RBC GAM advise the Independent Review Committee of a material breach of any standing instruction. RBC GAM policy requires that an investment decision in respect of Related-Party Trading Activities (i) is made free from any influence of Royal Bank or its associates or affiliates and without taking into account any consideration relevant to Royal Bank or its affiliates or associates, (ii) represents the business judgment of the portfolio manager, uninfluenced by considerations other than the best interests of the Fund, (iii) is in compliance with RBC GAM policies and procedures, and (iv) achieves a fair and reasonable result for the Fund. RBC GAM policy requires that an investment decision in respect of Inter-Fund Trading is in the best interests of each Fund.
11
ANNUAL MANAGEMENT REPORT OF FUND PERFORMANCE
March 31, 2017
12
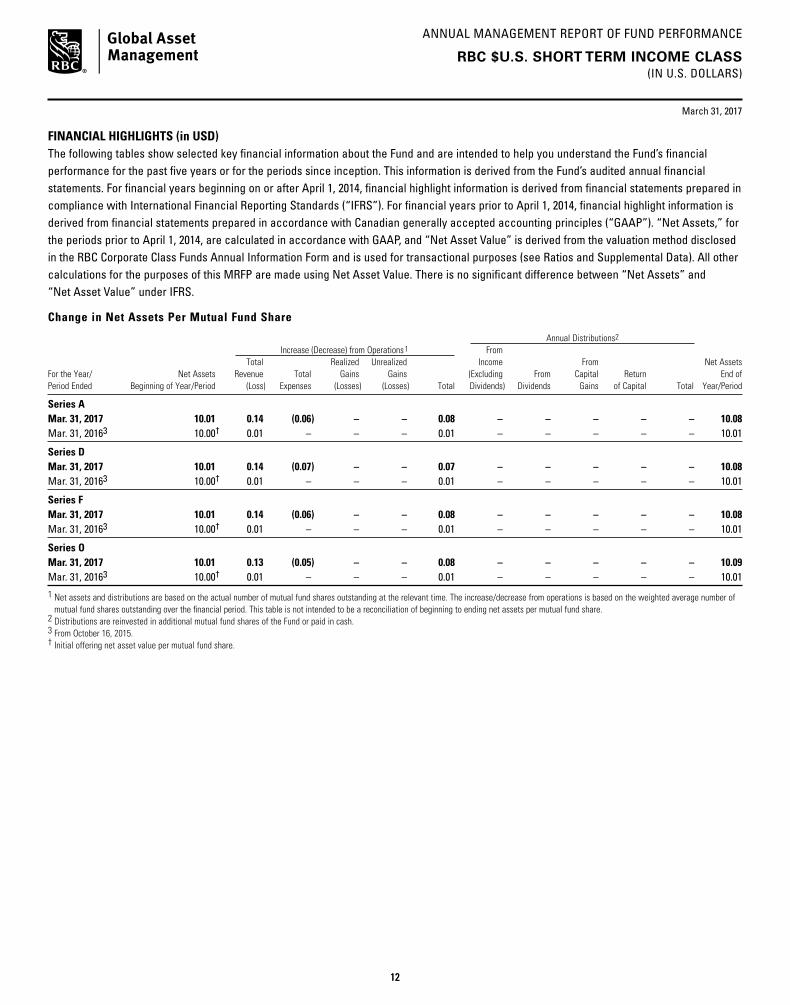
FINANCIAL HIGHLIGHTS (in USD)The following tables show selected key financial information about the Fund and are intended to help you understand the Fund’s financial performance for the past five years or for the periods since inception. This information is derived from the Fund’s audited annual financial statements. For financial years beginning on or after April 1, 2014, financial highlight information is derived from financial statements prepared in compliance with International Financial Reporting Standards (“IFRS”). For financial years prior to April 1, 2014, financial highlight information is derived from financial statements prepared in accordance with Canadian generally accepted accounting principles (“GAAP”). “Net Assets,” for the periods prior to April 1, 2014, are calculated in accordance with GAAP, and “Net Asset Value” is derived from the valuation method disclosed in the RBC Corporate Class Funds Annual Information Form and is used for transactional purposes (see Ratios and Supplemental Data). All other calculations for the purposes of this MRFP are made using Net Asset Value. There is no significant difference between “Net Assets” and “Net Asset Value” under IFRS.
Change in Net Assets Per Mutual Fund Share
Annual Distributions2
Increase (Decrease) from Operations1 From Total Realized Unrealized Income From Net Assets For the Year/ Net Assets Revenue Total Gains Gains (Excluding From Capital Return End of Period Ended Beginning of Year/Period (Loss) Expenses (Losses) (Losses) Total Dividends) Dividends Gains of Capital Total Year/Period
Series AMar. 31, 2017 10.01 0.14 (0.06) – – 0.08 – – – – – 10.08 Mar. 31, 20163 10.00† 0.01 – – – 0.01 – – – – – 10.01
Series DMar. 31, 2017 10.01 0.14 (0.07) – – 0.07 – – – – – 10.08Mar. 31, 20163 10.00† 0.01 – – – 0.01 – – – – – 10.01
Series FMar. 31, 2017 10.01 0.14 (0.06) – – 0.08 – – – – – 10.08Mar. 31, 20163 10.00† 0.01 – – – 0.01 – – – – – 10.01
Series OMar. 31, 2017 10.01 0.13 (0.05) – – 0.08 – – – – – 10.09Mar. 31, 20163 10.00† 0.01 – – – 0.01 – – – – – 10.01
1 Net assets and distributions are based on the actual number of mutual fund shares outstanding at the relevant time. The increase/decrease from operations is based on the weighted average number of mutual fund shares outstanding over the financial period. This table is not intended to be a reconciliation of beginning to ending net assets per mutual fund share.
2 Distributions are reinvested in additional mutual fund shares of the Fund or paid in cash.3 From October 16, 2015.† Initial offering net asset value per mutual fund share.
RBC $U.S. SHORT TERM INCOME CLASS(IN U.S. DOLLARS)
12

ANNUAL MANAGEMENT REPORT OF FUND PERFORMANCE
13
March 31, 2017
RBC $U.S. SHORT TERM INCOME CLASS(IN U.S. DOLLARS)
FINANCIAL HIGHLIGHTS (in USD) (cont.)
Ratios and Supplemental Data
Number of Net Asset Value Net Asset Value Mutual Fund Shares Management MER Before Portfolio TradingAs at Per Mutual Fund Share ($) ($000s) Outstanding (000s) Expense Ratio (%)1 Absorption (%)1 Turnover Rate (%)2 Expense Ratio (%)3
Series AMar. 31, 2017 10.08 72 7 0.28 1.26 44.86 – Mar. 31, 20164 10.01 1 – 0.22 0.22 n/a –
Series DMar. 31, 2017 10.08 2 – 0.29 1.27 44.86 –Mar. 31, 20164 10.01 1 – 0.22 0.22 n/a –
Series FMar. 31, 2017 10.08 59 6 0.23 1.21 44.86 –Mar. 31, 20164 10.01 1 – 0.17 0.17 n/a –
Series OMar. 31, 2017 10.09 148 15 0.05 1.03 44.86 –Mar. 31, 20164 10.01 147 15 0.05 0.05 n/a –
1 The management expense ratio (“MER”) is based on expenses for the stated period, excluding commissions and other portfolio transaction costs, and is expressed as an annualized percentage of the daily average net asset value during the period. RBC GAM may, at its discretion and without notice to shareholders, waive or absorb certain operating expenses. MER includes the waiver or absorption by RBC GAM of certain operating expenses, while the MER before absorption shows the MER prior to operating expenses being waived or absorbed by RBC GAM.
2 The Fund’s portfolio turnover rate gives an indication of the level of activity employed by the portfolio manager. A portfolio turnover rate of 100% is equivalent to the Fund buying and selling all of the securities in its portfolio once in the course of the year. The higher the Fund’s portfolio turnover rate in a year, the greater the trading costs payable by the Fund in the year, and the greater the chance of an investor receiving taxable capital gains in the year. There is not necessarily a relationship between a high turnover rate and the performance of the Fund.
3 The trading expense ratio represents total commissions and other portfolio transaction costs expressed as an annualized percentage of daily average net asset value during the period. The trading expense ratio is not applicable to fixed-income transactions.
4 From October 16, 2015.
Management Fees RBC GAM is the manager and portfolio manager of the Fund. Management fees of each series of the Fund are calculated at the annual percentages, before GST/HST, of the daily net asset value of each series of the Fund. The breakdown of the services received in consideration of the management fees for each series, as a percentage of the management fees, is as follows:
Breakdown of Services
Management Fees Distribution Other*
Series A up to 0.85% 29% 71%Series D up to 0.60% 17% 83%Series F up to 0.50% – 100%
Series O – no management fees are paid by the Fund with respect to Series O mutual fund shares. Series O shareholders pay a negotiated fee directly to RBC GAM for investment-counselling services.* Includes all costs related to management, investment advisory services, general administration
and profit.
13

ANNUAL MANAGEMENT REPORT OF FUND PERFORMANCE
March 31, 2017
14
RBC $U.S. SHORT TERM INCOME CLASS(IN U.S. DOLLARS)
PAST PERFORMANCE (in USD)The performance information shown assumes that all distributions made by the Fund in the periods shown were reinvested in additional shares of the Fund and would be lower if distributions were not reinvested. The performance information does not take into account sales, redemption, distribution, optional charges or income taxes payable that would have reduced returns or performance. Past performance does not necessarily indicate how the Fund may perform in the future. A fund with more than 10 years of performance history is only permitted to disclose the past 10 years.
Year-by-Year Returns (%) The bar chart indicates the Fund’s performance for each of the years shown, and illustrates how the Fund’s performance has changed from year to year. The bar chart shows, in percentage terms, how much an investment made on the first day of each financial year would have grown or decreased by the end of the financial year.
Annual Compound Returns (%) The table shows the annual compound returns for each series of the Fund and for each of the periods indicated ended on March 31, 2017, compared with the following benchmark:
Citigroup 3-Month TBill Index
Past Past Past Past Since Year 3 Years 5 Years 10 Years Inception
Series A 0.7 – – – 0.7Benchmark 0.3 – – – 0.3
Series D 0.7 – – – 0.6Benchmark 0.3 – – – 0.3
Series F 0.7 – – – 0.7Benchmark 0.3 – – – 0.3
Series O 0.8 – – – 0.8Benchmark 0.3 – – – 0.3
The returns of each series may vary because of differences in management fees and expenses. The Benchmark index returns do not include any costs of investing. See Management Discussion of Fund Performance for a discussion of performance relative to the Benchmark index.
Series A, Series D, Series F and Series O mutual fund shares have been available for sale to shareholders since January 25, 2016.
Inception dates are not provided for series that have been in existence for more than 10 years.
INDEX DESCRIPTIONCitigroup 3-Month TBill Index The index tracks the performance of short-term U.S. government debt instruments.
14

ANNUAL MANAGEMENT REPORT OF FUND PERFORMANCE
15
March 31, 2017
RBC $U.S. SHORT TERM INCOME CLASS(IN U.S. DOLLARS)
SUMMARY OF INVESTMENT PORTFOLIO (in USD)(after consideration of derivative products, if any)As at March 31, 2017
Investment Mix % of Net Asset Value
Commercial Paper 78.6Provincial Obligations 14.7Bankers Acceptances and Bank Obligations 6.6Cash/Other 0.1
Top 25 Holdings* % of Net Asset Value
Province of British Columbia 0.979% Jul 25 2017 6.3Province of Quebec 0.919% Jun 22 2017 6.1OMERS Realty Corp. 0.978% Apr 4 2017 5.5Caisse Centrale Desjardins 1.111% Jun 29 2017 4.4Caisse Centrale Desjardins 0.962% May 16 2017 3.7Ridge Trust 1.400% Jul 6 2017 3.5TMX Group Ltd. 1.081% May 3 2017 3.3Prime Trust - Senior Notes 1.419% Jun 19 2017 3.2BNP Paribas Capital Trust 1.119% Jun 22 2017 2.7Canadian Master Trust - Series A 1.248% May 9 2017 2.7Clarity Trust 1.370% Jun 13 2017 2.6SOUND Trust 1.272% Apr 10 2017 2.6National Bank of Canada 1.051% Jun 21 2017 2.6Banner Trust 1.220% Apr 24 2017 2.3Merit Trust - Senior Notes 1.222% Jun 1 2017 2.3Clarity Trust 1.218% May 11 2017 2.2Fusion Trust 1.419% Jun 19 2017 2.1Zeus Receivables Trust - Senior Notes 1.200% Apr 11 2017 2.1SURE Trust 1.418% Jun 21 2017 2.0Banner Trust 1.278% Apr 28 2017 1.9Banner Trust 1.150% May 15 2017 1.7Merit Trust - Senior Notes 1.419% Jun 19 2017 1.6Canadian Master Trust - Series A 1.418% Jul 6 2017 1.5Bank of Nova Scotia 1.237% Jun 1 2017 1.4Clarity Trust 1.419% Jun 19 2017 1.4Top 25 Holdings 71.7
* The Fund invests substantially all of its assets directly in the RBC $U.S. Money Market Fund. The above are the Top 25 holdings of the RBC $U.S. Money Market Fund.
The Summary of Investment Portfolio may change due to ongoing portfolio transactions of the Fund and a quarterly update is available at www.rbcgam.com/funds.
The Simplified Prospectus and other information about the underlying fund are available on SEDAR website at www.sedar.com.
15
ANNUAL MANAGEMENT REPORT OF FUND PERFORMANCE
16
FIXED-INCOME FUND
BLUEBAY GLOBAL CONVERTIBLE BOND CLASS (CANADA)
March 31, 2017
Portfolio Manager RBC Global Asset Management Inc. (“RBC GAM”)
This annual management report of fund performance (“MRFP”) contains financial highlights but does not contain the complete annual financial statements of the Fund. You can get a copy of the financial statements at your request, and at no cost, by calling 1-800-463-FUND (3863), by writing to us at RBC Global Asset Management Inc., P.O. Box 7500, Station A, Toronto, Ontario M5W 1P9, or by visiting our website at www.rbcgam.com/reports or SEDAR at www.sedar.com. Security holders may also contact us using one of these methods to request a copy of the Fund’s proxy voting policies and procedures, proxy voting disclosure record, or quarterly portfolio disclosure.
The Board of Directors of RBC Corporate Class Inc. approved this annual management report of fund performance on May 11, 2017.
A Note on Forward-looking Statements
This report may contain forward-looking statements about the Fund, its future performance, strategies or prospects, and possible future Fund action. The words “may,” “could,” “should,” “would,” “suspect,” “outlook,” “believe,” “plan,” “anticipate,” “estimate,” “expect,” “intend,” “forecast,” “objective” and similar expressions are intended to identify forward-looking statements.
Forward-looking statements are not guarantees of future performance. Forward-looking statements involve inherent risks and uncertainties, both about the Fund and general economic factors, so it is possible that predictions, forecasts, projections and other forward-looking statements will not be achieved. We caution you not to place undue reliance on these statements as a number of important factors could cause actual events or results to differ materially from those expressed or implied in any forward-looking statement made in relation to the Fund. These factors include, but are not limited to, general economic, political and market factors in Canada, the United States and internationally, interest and foreign exchange rates, global equity and capital markets, business competition, technological changes, changes in laws and regulations, judicial or regulatory judgments, legal proceedings and catastrophic events.
The above list of important factors that may affect future results is not exhaustive. Before making any investment decisions, we encourage you to consider these and other factors carefully. All opinions contained in forward-looking statements are subject to change without notice and are provided in good faith but without legal responsibility.
16

ANNUAL MANAGEMENT REPORT OF FUND PERFORMANCE
March 31, 2017
17
MANAGEMENT DISCUSSION OF FUND PERFORMANCE
Investment Objective and StrategiesThe Fund seeks to provide total returns consisting of interest income and modest capital appreciation through exposure to global convertible bonds.
To achieve the Fund’s objectives, the Fund invests most of its assets in the BlueBay Global Convertible Bond Fund (Canada) (the “underlying fund”), which holds mainly global convertible bonds issued by entities domiciled or carrying out business activities anywhere in the world. The portfolio manager of the underlying fund conducts detailed credit and equity analysis to identify investment opportunities offering high probabilities of superior rates of return while minimizing the prospect of default.
RiskThere were no significant changes to the investment objective and strategies that affected the Fund’s overall level of risk during the reporting period. The risks of investing in the Fund and the suitability of the Fund for investors remain as discussed in the Simplified Prospectus.
Results of OperationsThe Fund’s net asset value fell to $101 million as of March 31, 2017, from $151 million as of March 31, 2016. The decrease was due to net redemptions.
Over the past year, the Fund’s Series A shares gained 6.3%, which underperformed the 6.9% rise in the benchmark. The Fund’s return is after the deduction of fees and expenses, while the benchmark and broad-based index returns do not include any costs of investing. See the Financial Highlights section for the management expense ratios and the Past Performance section for the returns of any other series, which may vary because of differences in management fees and expenses.
Oil prices and global stocks climbed for much of the period after touching lows in early 2016. Equity markets largely ignored the U.K.’s unexpected decision in June to leave the EU, delivering their best returns in several years amid sustainable U.S. growth and economic-stimulus programs by the European Central Bank and the Bank of England. Donald Trump’s election in November as U.S. president boosted the shares of companies in financial services and infrastructure, but biotechnology shares weakened given discussions of drug-price cuts. While European central banks and the Bank of Japan loosened monetary policy, the U.S. Federal Reserve (the “Fed”) twice raised its benchmark rate late in the 12-month period. The increases suggested that the Fed was comfortable that the U.S. expansion would continue.
Investments that aided the Fund’s returns included DISH Network, a U.S. provider of satellite-television services. DISH has accumulated a “land bank” of highly desirable digital-spectrum bandwidth, making DISH an attractive takeover target in the view of the portfolio manager. The Fund also benefited from holdings in Tesaro, whose shares more than tripled over the period after the company released positive late-stage clinical results for its ovarian-cancer therapy. A robust product pipeline makes Tesaro another attractive takeover target, in the view of the portfolio manager.
The portfolio’s investments in semiconductor makers produced strong returns as investors sought more cyclically sensitive areas of the market. Notable contributions came from Micron and Microchip Technology in the U.S. and from Semiconductor Manufacturing International of Taiwan. The industry as a whole is benefiting from better returns on investment.
An investment in uranium miner Paladin Energy performed poorly after a delay in the closing of the company’s agreement to sell a minority stake in its main mine to a Chinese state-backed buyer. As a result, plans to free up money for debt repayments were put off, and the price of the bonds held in the portfolio declined.
Recent DevelopmentsThe portfolio manager believes that global financial markets remain in a “sweet spot” given continued low interest rates and expectations that the Trump administration will succeed in implementing pro-growth economic policies. Macroeconomic data, especially in the U.S. and Europe, has been strong recently, while major currencies have yet to remain stable despite political concerns and rising anti-trade rhetoric. In this environment, the portfolio manager expects equity markets and non-government debt to extend their strong performance.
On December 15, 2016, the Canadian government enacted new tax rules that eliminate the ability of investors to switch among different classes of RBC Corporate Class Funds on a tax-deferred basis. The new rules do not apply to switches between different series of the same fund.
Effective December 1, 2016, Mr. Lloyd R. McGinnis retired and Ms. Élaine Cousineau was appointed as Chair of the Independent Review Committee (the “IRC”). Mr. Charles F. Macfarlane was appointed as Vice Chair of the IRC. Effective January 1, 2017, Ms. Suromitra Sanatani and Ms. Catherine Kloepfer were appointed as members of the IRC.
Effective July 1, 2016, Deloitte LLP resigned and PricewaterhouseCoopers LLP was appointed as auditors of the Fund.
BLUEBAY GLOBAL CONVERTIBLE BOND CLASS (CANADA)
17
ANNUAL MANAGEMENT REPORT OF FUND PERFORMANCE
18
March 31, 2017
BLUEBAY GLOBAL CONVERTIBLE BOND CLASS (CANADA)
Effective June 30, 2016, management fees were reduced as follows: from 1.70% to 1.65% in respect of Series A mutual fund shares, Advisor Series mutual fund shares, Advisor T5 Series mutual fund shares and Series T5 mutual fund shares; from 1.10% to 1.05% in respect of Series D mutual fund shares; and from 0.95% to 0.90% in respect of Series F mutual fund shares and Series FT5 mutual fund shares. Also effective June 30, 2016, Series H mutual fund shares and Series I mutual fund shares were capped and no longer available for purchase by new investors.
Related-Party TransactionsManager and Portfolio ManagerRBC GAM is an indirect, wholly owned subsidiary of Royal Bank of Canada (“Royal Bank”) and is the manager and portfolio manager of the Fund. RBC GAM is responsible for the Fund’s day-to-day operations, provides investment advice and portfolio management services to the Fund and appoints distributors for the Fund. RBC GAM is paid a management fee by the Fund as compensation for its services. The Fund pays a fixed administration fee to RBC GAM, which, in turn, pays certain operating expenses of the Fund.
Affiliates of RBC GAM that provide services to the Fund in the course of their normal businesses are discussed below.
DistributorsRBC GAM, Royal Mutual Funds Inc., RBC Direct Investing Inc., RBC Dominion Securities Inc. and Phillips, Hager & North Investment Funds Ltd. are the principal distributors of, or distribute certain series of the mutual fund shares of, the Fund. Dealers receive an ongoing commission based on the total value of their clients’ Series A, Advisor Series, Advisor T5 Series, Series T5, Series H and Series D mutual fund shares.
CustodianRBC Investor Services Trust (“RBC IS”) is the custodian and holds the assets of the Fund.
RegistrarsRoyal Bank, RBC IS and RBC GAM are the registrars of the Fund and keep records of who owns the mutual fund shares of the Fund.
Other Related-Party TransactionsPursuant to applicable securities legislation, the Fund relied on the standing instructions from the Independent Review Committee with respect to one or more of the following transactions:
Related-Party Trading Activities(a) trades in securities of Royal Bank;
(b) investments in the securities of issuers for which a related-party dealer acted as an underwriter during the distribution of such securities and the 60-day period following the conclusion of such distribution of the underwritten securities to the public;
(c) purchases of equity and debt securities from or sales of equity or debt securities to a related-party dealer, where it acted as principal; and
Inter-Fund Trading(d) purchases or sales of securities of an issuer from or to another
investment fund or managed account managed by RBC GAM.
The applicable standing instructions require that Related-Party Trading Activities and Inter-Fund Trading be conducted in accordance with RBC GAM policy and that RBC GAM advise the Independent Review Committee of a material breach of any standing instruction. RBC GAM policy requires that an investment decision in respect of Related-Party Trading Activities (i) is made free from any influence of Royal Bank or its associates or affiliates and without taking into account any consideration relevant to Royal Bank or its affiliates or associates, (ii) represents the business judgment of the portfolio manager, uninfluenced by considerations other than the best interests of the Fund, (iii) is in compliance with RBC GAM policies and procedures, and (iv) achieves a fair and reasonable result for the Fund. RBC GAM policy requires that an investment decision in respect of Inter-Fund Trading is in the best interests of each Fund.
18

ANNUAL MANAGEMENT REPORT OF FUND PERFORMANCE
March 31, 2017
19
FINANCIAL HIGHLIGHTS The following tables show selected key financial information about the Fund and are intended to help you understand the Fund’s financial performance for the past five years or for the periods since inception. This information is derived from the Fund’s audited annual financial statements. For financial years beginning on or after April 1, 2014, financial highlight information is derived from financial statements prepared in compliance with International Financial Reporting Standards (“IFRS”). For financial years prior to April 1, 2014, financial highlight information is derived from financial statements prepared in accordance with Canadian generally accepted accounting principles (“GAAP”). “Net Assets,” for the periods prior to April 1, 2014, are calculated in accordance with GAAP, and “Net Asset Value” is derived from the valuation method disclosed in the RBC Corporate Class Funds Annual Information Form and is used for transactional purposes (see Ratios and Supplemental Data). All other calculations for the purposes of this MRFP are made using Net Asset Value. There is no significant difference between “Net Assets” and “Net Asset Value” under IFRS.
Change in Net Assets Per Mutual Fund Share ($)
Annual Distributions2
Increase (Decrease) from Operations1 From Total Realized Unrealized Income From Net Assets For the Year/ Net Assets Revenue Total Gains Gains (Excluding From Capital Return End of Period Ended Beginning of Year/Period (Loss) Expenses (Losses) (Losses) Total Dividends) Dividends Gains of Capital Total Year/Period
Series AMar. 31, 2017 10.29 0.02 (0.20) 0.27 0.56 0.65 – – – – – 10.94 Mar. 31, 2016 10.89 0.06 (0.20) (0.01) (0.55) (0.70) – – – – – 10.29Mar. 31, 2015 10.16 0.09 (0.20) 0.15 0.77 0.81 – – – – – 10.89Mar. 31, 20143 10.00† 0.05 (0.04) – 0.05 0.06 – – – – – 10.16
Advisor SeriesMar. 31, 2017 10.29 0.02 (0.20) 0.27 0.54 0.63 – – – – – 10.94Mar. 31, 2016 10.89 0.06 (0.21) (0.01) (0.55) (0.71) – – – – – 10.29Mar. 31, 2015 10.16 0.10 (0.20) 0.16 0.79 0.85 – – – – – 10.89Mar. 31, 20143 10.00† 0.06 (0.04) – 0.05 0.07 – – – – – 10.16
Advisor T5 SeriesMar. 31, 2017 9.33 0.02 (0.17) 0.24 0.47 0.56 – – – (0.48) (0.48) 9.42Mar. 31, 2016 10.37 0.06 (0.19) (0.01) (0.51) (0.65) – – – (0.50) (0.50) 9.33Mar. 31, 20154 10.13† 0.09 (0.18) 0.14 0.70 0.75 – – – (0.50) (0.50) 10.37
Series T5Mar. 31, 2017 9.33 0.02 (0.17) 0.23 0.34 0.42 – – – (0.48) (0.48) 9.42Mar. 31, 2016 10.37 0.06 (0.19) (0.01) (0.50) (0.64) – – – (0.50) (0.50) 9.33Mar. 31, 20154 10.13† 0.08 (0.18) 0.13 0.68 0.71 – – – (0.50) (0.50) 10.37
Series HMar. 31, 2017 10.35 0.02 (0.18) 0.27 0.53 0.64 – – – – – 11.03Mar. 31, 2016 10.93 0.06 (0.18) (0.01) (0.55) (0.68) – – – – – 10.35 Mar. 31, 2015 10.17 0.10 (0.17) 0.16 0.80 0.89 – – – – – 10.93Mar. 31, 20143 10.00† 0.05 (0.03) – 0.04 0.06 – – – – – 10.17
Series DMar. 31, 2017 10.45 0.02 (0.12) 0.28 0.55 0.73 – – – – – 11.19Mar. 31, 2016 10.98 0.06 (0.13) (0.01) (0.55) (0.63) – – – – – 10.45Mar. 31, 2015 10.17 0.09 (0.13) 0.15 0.78 0.89 – – – – – 10.98Mar. 31, 20143 10.00† 0.07 (0.03) – 0.06 0.10 – – – – – 10.17
Series FMar. 31, 2017 10.48 0.02 (0.11) 0.27 0.52 0.70 – – – – – 11.24Mar. 31, 2016 11.00 0.06 (0.12) (0.01) (0.55) (0.62) – – – – – 10.48Mar. 31, 2015 10.18 0.10 (0.12) 0.15 0.79 0.92 – – – – – 11.00Mar. 31, 20143 10.00† 0.05 (0.02) – 0.05 0.08 – – – – – 10.18
BLUEBAY GLOBAL CONVERTIBLE BOND CLASS (CANADA)
19

ANNUAL MANAGEMENT REPORT OF FUND PERFORMANCE
March 31, 2017
20
FINANCIAL HIGHLIGHTS (cont.)
Change in Net Assets Per Mutual Fund Share ($) (cont.)
Annual Distributions2
Increase (Decrease) from Operations1 From Total Realized Unrealized Income From Net Assets For the Year/ Net Assets Revenue Total Gains Gains (Excluding From Capital Return End of Period Ended Beginning of Year/Period (Loss) Expenses (Losses) (Losses) Total Dividends) Dividends Gains of Capital Total Year/Period
Series FT5Mar. 31, 2017 9.50 0.02 (0.10) 0.24 0.47 0.63 – – – (0.49) (0.49) 9.67Mar. 31, 2016 10.47 0.06 (0.11) (0.01) (0.51) (0.57) – – – (0.50) (0.50) 9.50Mar. 31, 20154 10.16† 0.08 (0.10) 0.13 0.65 0.76 – – – (0.50) (0.50) 10.47
Series IMar. 31, 2017 10.55 0.02 (0.09) 0.27 0.58 0.78 – – – – – 11.33Mar. 31, 2016 11.04 0.06 (0.09) (0.01) (0.56) (0.60) – – – – – 10.55Mar. 31, 2015 10.19 0.10 (0.09) 0.16 0.79 0.96 – – – – – 11.04Mar. 31, 20143 10.00† 0.06 (0.02) – 0.05 0.09 – – – – – 10.19
Series OMar. 31, 2017 10.74 0.02 – 0.29 0.55 0.86 – – – – – 11.62Mar. 31, 2016 11.15 0.06 – (0.01) (0.56) (0.51) – – – – – 10.74Mar. 31, 2015 10.20 0.13 – 0.21 1.08 1.42 – – – – – 11.15Mar. 31, 20143 10.00† 0.51 – – 0.45 0.96 – – – – – 10.20
1 Net assets and distributions are based on the actual number of mutual fund shares outstanding at the relevant time. The increase/decrease from operations is based on the weighted average number of mutual fund shares outstanding over the financial period. This table is not intended to be a reconciliation of beginning to ending net assets per mutual fund share.
2 Distributions are reinvested in additional mutual fund shares of the Fund or paid in cash.3 From January 20, 2014.4 From April 21, 2014.† Initial offering net asset value per mutual fund share.
Ratios and Supplemental Data
Number of Net Asset Value Net Asset Value Mutual Fund Shares Management MER Before Portfolio TradingAs at Per Mutual Fund Share ($) ($000s) Outstanding (000s) Expense Ratio (%)1 Absorption (%)1 Turnover Rate (%)2 Expense Ratio (%)3
Series AMar. 31, 2017 10.94 6 521 596 2.094 2.09 2.67 0.10Mar. 31, 2016 10.29 11 757 1 142 2.13 2.13 15.89 0.09 Mar. 31, 2015 10.89 10 889 1 000 2.16 2.17 4.43 0.14 Mar. 31, 20145 10.16 2 878 283 2.17 2.17 – –
Advisor SeriesMar. 31, 2017 10.94 20 986 1 919 2.114 2.11 2.67 0.10Mar. 31, 2016 10.29 33 418 3 247 2.16 2.16 15.89 0.09 Mar. 31, 2015 10.89 34 614 3 178 2.16 2.17 4.43 0.14 Mar. 31, 20145 10.16 12 360 1 216 2.17 2.17 – –
Advisor T5 SeriesMar. 31, 2017 9.42 1 581 168 2.084 2.08 2.67 0.10Mar. 31, 2016 9.33 2 271 244 2.11 2.11 15.89 0.09 Mar. 31, 20156 10.37 2 128 205 2.12 2.13 4.43 0.14
Series T5Mar. 31, 2017 9.42 606 64 2.084 2.08 2.67 0.10Mar. 31, 2016 9.33 1 584 170 2.10 2.10 15.89 0.09 Mar. 31, 20156 10.37 559 54 2.08 2.09 4.43 0.14
BLUEBAY GLOBAL CONVERTIBLE BOND CLASS (CANADA)
20

ANNUAL MANAGEMENT REPORT OF FUND PERFORMANCE
March 31, 2017
21
FINANCIAL HIGHLIGHTS (cont.)
Ratios and Supplemental Data (cont.)
Number of Net Asset Value Net Asset Value Mutual Fund Shares Management MER Before Portfolio TradingAs at Per Mutual Fund Share ($) ($000s) Outstanding (000s) Expense Ratio (%)1 Absorption (%)1 Turnover Rate (%)2 Expense Ratio (%)3
Series HMar. 31, 2017 11.03 11 953 1 084 1.89 1.89 2.67 0.10Mar. 31, 2016 10.35 16 461 1 590 1.90 1.90 15.89 0.09 Mar. 31, 2015 10.93 18 325 1 677 1.89 1.90 4.43 0.14 Mar. 31, 20145 10.17 5 474 538 1.90 1.90 – –
Series DMar. 31, 2017 11.19 2 449 219 1.384 1.38 2.67 0.10Mar. 31, 2016 10.45 2 735 262 1.42 1.42 15.89 0.09 Mar. 31, 2015 10.98 1 928 176 1.47 1.48 4.43 0.14 Mar. 31, 20145 10.17 567 56 1.50 1.50 – –
Series FMar. 31, 2017 11.24 35 252 3 137 1.274 1.27 2.67 0.10Mar. 31, 2016 10.48 50 665 4 833 1.31 1.31 15.89 0.09 Mar. 31, 2015 11.00 39 169 3 560 1.32 1.33 4.43 0.14 Mar. 31, 20145 10.18 11 255 1 106 1.32 1.32 – –
Series FT5Mar. 31, 2017 9.67 10 478 1 083 1.264 1.26 2.67 0.10Mar. 31, 2016 9.50 16 320 1 718 1.29 1.29 15.89 0.09 Mar. 31, 20156 10.47 7 436 710 1.28 1.29 4.43 0.14
Series IMar. 31, 2017 11.33 10 824 955 1.03 1.03 2.67 0.10Mar. 31, 2016 10.55 15 351 1 455 1.03 1.03 15.89 0.09 Mar. 31, 2015 11.04 16 443 1 490 1.04 1.05 4.43 0.14 Mar. 31, 20145 10.19 5 837 573 1.03 1.03 – –
Series OMar. 31, 2017 11.62 262 23 0.26 0.26 2.67 0.10Mar. 31, 2016 10.74 274 26 0.26 0.26 15.89 0.09 Mar. 31, 2015 11.15 147 13 0.25 0.26 4.43 0.14 Mar. 31, 20145 10.20 147 14 0.24 0.24 – –
1 The management expense ratio (“MER”) is based on expenses for the stated period, excluding commissions and other portfolio transaction costs, and is expressed as an annualized percentage of the daily average net asset value during the period. RBC GAM may, at its discretion and without notice to shareholders, waive or absorb certain operating expenses. MER includes the waiver or absorption by RBC GAM of certain operating expenses, while the MER before absorption shows the MER prior to operating expenses being waived or absorbed by RBC GAM.
2 The Fund’s portfolio turnover rate gives an indication of the level of activity employed by the portfolio manager. A portfolio turnover rate of 100% is equivalent to the Fund buying and selling all of the securities in its portfolio once in the course of the year. The higher the Fund’s portfolio turnover rate in a year, the greater the trading costs payable by the Fund in the year, and the greater the chance of an investor receiving taxable capital gains in the year. There is not necessarily a relationship between a high turnover rate and the performance of the Fund.
3 The trading expense ratio represents total commissions and other portfolio transaction costs expressed as an annualized percentage of daily average net asset value during the period. The trading expense ratio is not applicable to fixed-income transactions.
4 Effective June 30, 2016, the management fee was changed in respect of certain series of the Fund. If the change to the management fee would have been in effect throughout 2016, the adjusted MER for each series of the Fund would be: Series A – 2.07%, Advisor Series – 2.09%, Advisor T5 Series – 2.06%, Series T5 – 2.06%, Series D – 1.36%, Series F – 1.25% and Series FT5 – 1.24%.
5 From January 20, 2014.6 From April 21, 2014.
BLUEBAY GLOBAL CONVERTIBLE BOND CLASS (CANADA)
21
ANNUAL MANAGEMENT REPORT OF FUND PERFORMANCE
March 31, 2017
22
BLUEBAY GLOBAL CONVERTIBLE BOND CLASS (CANADA)
FINANCIAL HIGHLIGHTS (cont.)
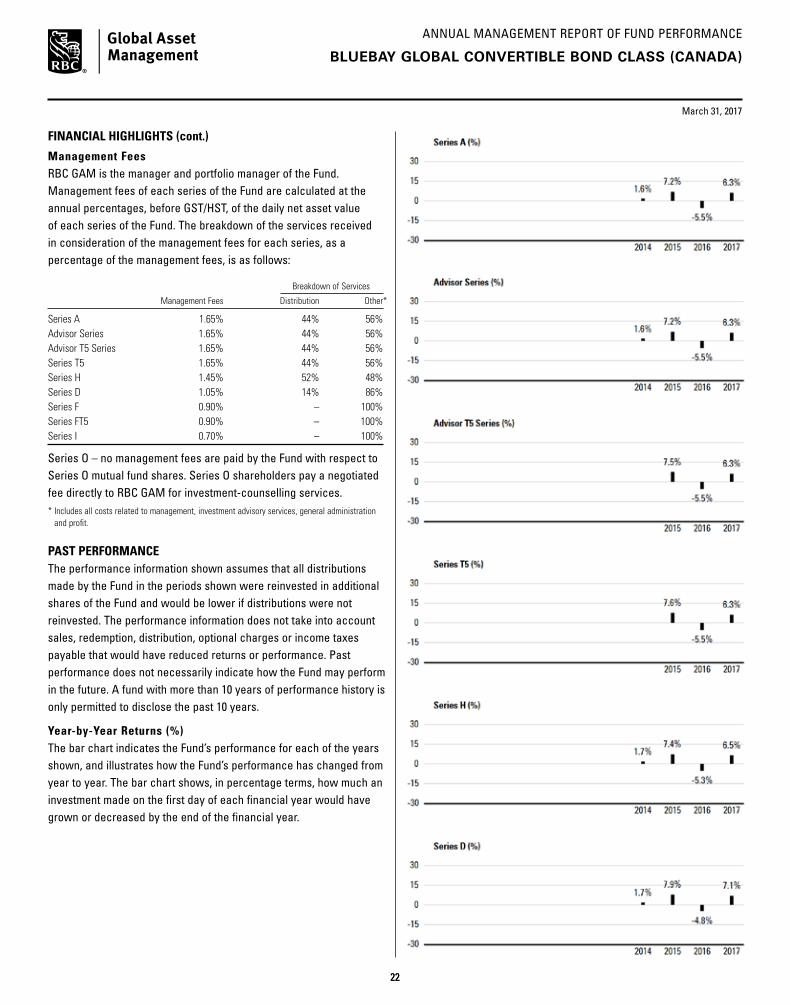
Management Fees RBC GAM is the manager and portfolio manager of the Fund. Management fees of each series of the Fund are calculated at the annual percentages, before GST/HST, of the daily net asset value of each series of the Fund. The breakdown of the services received in consideration of the management fees for each series, as a percentage of the management fees, is as follows:
Breakdown of Services
Management Fees Distribution Other*
Series A 1.65% 44% 56%Advisor Series 1.65% 44% 56%Advisor T5 Series 1.65% 44% 56%Series T5 1.65% 44% 56%Series H 1.45% 52% 48%Series D 1.05% 14% 86%Series F 0.90% – 100%Series FT5 0.90% – 100%Series I 0.70% – 100%
Series O – no management fees are paid by the Fund with respect to Series O mutual fund shares. Series O shareholders pay a negotiated fee directly to RBC GAM for investment-counselling services.* Includes all costs related to management, investment advisory services, general administration
and profit.
PAST PERFORMANCEThe performance information shown assumes that all distributions made by the Fund in the periods shown were reinvested in additional shares of the Fund and would be lower if distributions were not reinvested. The performance information does not take into account sales, redemption, distribution, optional charges or income taxes payable that would have reduced returns or performance. Past performance does not necessarily indicate how the Fund may perform in the future. A fund with more than 10 years of performance history is only permitted to disclose the past 10 years.
Year-by-Year Returns (%) The bar chart indicates the Fund’s performance for each of the years shown, and illustrates how the Fund’s performance has changed from year to year. The bar chart shows, in percentage terms, how much an investment made on the first day of each financial year would have grown or decreased by the end of the financial year.
22

ANNUAL MANAGEMENT REPORT OF FUND PERFORMANCE
23
March 31, 2017
PAST PERFORMANCE (cont.)
BLUEBAY GLOBAL CONVERTIBLE BOND CLASS (CANADA)
Annual Compound Returns (%) The table shows the annual compound returns for each series of the Fund and for each of the periods indicated ended on March 31, 2017, compared with the following benchmark:
Thomson Reuters Convertible Global Focus Index (hedged to CAD)
Past Past Past Past Since Year 3 Years 5 Years 10 Years Inception
Series A 6.3 2.5 – – 2.9Benchmark 6.9 3.4 – – 4.3
Advisor Series 6.3 2.5 – – 2.8Benchmark 6.9 3.4 – – 4.3
Advisor T5 Series 6.3 – – – 2.7Benchmark 6.9 – – – 3.4
Series T5 6.3 – – – 2.7Benchmark 6.9 – – – 3.4
Series H 6.5 2.7 – – 3.1Benchmark 6.9 3.4 – – 4.3
Series D 7.1 3.2 – – 3.6Benchmark 6.9 3.4 – – 4.3
Series F 7.2 3.3 – – 3.7Benchmark 6.9 3.4 – – 4.3
Series FT5 7.2 – – – 3.5Benchmark 6.9 – – – 3.4
Series I 7.4 3.6 – – 4.0Benchmark 6.9 3.4 – – 4.3
Series O 8.3 4.4 – – 4.8Benchmark 6.9 3.4 – – 4.3
The returns of each series may vary because of differences in management fees and expenses. The Benchmark index returns do not include any costs of investing. See Management Discussion of Fund Performance for a discussion of performance relative to the Benchmark index.
Advisor T5 Series, Series T5 and Series FT5 mutual fund shares have been available for sale to shareholders since April 21, 2014, and Series A, Advisor Series, Series H, Series D, Series F, Series I and Series O mutual fund shares since January 20, 2014.
Inception dates are not provided for series that have been in existence for more than 10 years.
INDEX DESCRIPTIONThomson Reuters Convertible Global Focus Index (hedged to CAD) This index is designed to measure the performance of global convertible bonds and focuses on larger convertible securities, with the number of constituents being limited to ensure breadth and manageability.
23

ANNUAL MANAGEMENT REPORT OF FUND PERFORMANCE
24
March 31, 2017
BLUEBAY GLOBAL CONVERTIBLE BOND CLASS (CANADA)
SUMMARY OF INVESTMENT PORTFOLIO(after consideration of derivative products, if any)As at March 31, 2017
Investment Mix % of Net Asset Value
United States 31.8Japan 15.0China 9.0Germany 6.1United Kingdom 5.9South Africa 3.0Hong Kong 2.7Taiwan 2.7Netherlands 2.3Norway 2.2Malaysia 1.7Singapore 1.3France 1.2United Arab Emirates 1.0Other Countries 6.0Cash/Other 8.1
Top 25 Holdings* % of Net Asset Value
Cash & Cash Equivalents 7.1DISH Network Corp., Convertible 3.375% Aug 15 2026 3.2Siemens Financieringsmaatschappij N.V., Convertible USD 1.050% Aug 16 2017 2.7Ctrip.com International Ltd., Convertible USD 1.250% Sep 15 2022 2.6Steinhoff Finance Holding GmbH, Convertible EUR 1.250% Oct 21 2023 2.1Citrix Systems Inc., Convertible 0.500% Apr 15 2019 1.8Tesla Inc., Convertible 1.250% Jan 3 2021 1.7Suzuki Motor Corp., Convertible JPY 0.000% Mar 31 2023 1.7Salesforce.com Inc., Convertible 0.250% Apr 1 2018 1.6RAG-Stiftung, Convertible EUR 0.000% Mar 16 2023 1.6Kunlun Energy Co. Ltd., Convertible CNY 1.625% Jul 25 2019 1.3Yamada Denki Co. Ltd., Convertible JPY 0.000% Jun 28 2019 1.3Micron Technology Inc., Convertible 3.000% Nov 15 2043 1.3The Priceline Group Inc., Convertible 1.000% Mar 15 2018 1.2Microchip Technology Inc., Convertible 1.625% Feb 15 2025 1.2Kawasaki Kisen Kaisha Ltd., Convertible JPY 0.000% Sep 26 2018 1.1Kansai Paint Co. Ltd., Convertible JPY 0.000% Jun 17 2022 1.1United Microelectronics Corp., Convertible USD 0.000% May 18 2020 1.1Bagan Capital Ltd., Convertible USD 0.000% Sep 23 2021 1.1Deutsche Wohnen AG, Convertible EUR 0.325% Jul 26 2024 1.1Toray Industries Inc., Convertible JPY 0.000% Aug 31 2021 1.1NXP Semiconductors N.V., Convertible USD 1.000% Dec 1 2019 1.0Ctrip.com International Ltd., Convertible USD 1.990% Jul 1 2025 1.0Aabar Investments PJSC, Convertible EUR 0.500% Mar 27 2020 1.0Intu Jersey 2 Ltd., Convertible GBP 2.875% Nov 1 2022 1.0Top 25 Holdings 43.0
* The Fund invests substantially all of its assets directly in the BlueBay Global Convertible Bond Fund (Canada). The above are the Top 25 holdings of the BlueBay Global Convertible Bond Fund (Canada).
The Summary of Investment Portfolio may change due to ongoing portfolio transactions of the Fund and a quarterly update is available at www.rbcgam.com/funds.
The Simplified Prospectus and other information about the underlying fund are available on SEDAR website at www.sedar.com.
24

ANNUAL MANAGEMENT REPORT OF FUND PERFORMANCE
25
FIXED-INCOME FUND
BLUEBAY $U.S. GLOBAL CONVERTIBLE BOND CLASS (CANADA)
March 31, 2017
Portfolio Manager RBC Global Asset Management Inc. (“RBC GAM”)
This annual management report of fund performance (“MRFP”) contains financial highlights but does not contain the complete annual financial statements of the Fund. You can get a copy of the financial statements at your request, and at no cost, by calling 1-800-463-FUND (3863), by writing to us at RBC Global Asset Management Inc., P.O. Box 7500, Station A, Toronto, Ontario M5W 1P9, or by visiting our website at www.rbcgam.com/reports or SEDAR at www.sedar.com. Security holders may also contact us using one of these methods to request a copy of the Fund’s proxy voting policies and procedures, proxy voting disclosure record, or quarterly portfolio disclosure.
The Board of Directors of RBC Corporate Class Inc. approved this annual management report of fund performance on May 11, 2017.
A Note on Forward-looking Statements
This report may contain forward-looking statements about the Fund, its future performance, strategies or prospects, and possible future Fund action. The words “may,” “could,” “should,” “would,” “suspect,” “outlook,” “believe,” “plan,” “anticipate,” “estimate,” “expect,” “intend,” “forecast,” “objective” and similar expressions are intended to identify forward-looking statements.
Forward-looking statements are not guarantees of future performance. Forward-looking statements involve inherent risks and uncertainties, both about the Fund and general economic factors, so it is possible that predictions, forecasts, projections and other forward-looking statements will not be achieved. We caution you not to place undue reliance on these statements as a number of important factors could cause actual events or results to differ materially from those expressed or implied in any forward-looking statement made in relation to the Fund. These factors include, but are not limited to, general economic, political and market factors in Canada, the United States and internationally, interest and foreign exchange rates, global equity and capital markets, business competition, technological changes, changes in laws and regulations, judicial or regulatory judgments, legal proceedings and catastrophic events.
The above list of important factors that may affect future results is not exhaustive. Before making any investment decisions, we encourage you to consider these and other factors carefully. All opinions contained in forward-looking statements are subject to change without notice and are provided in good faith but without legal responsibility.
25
ANNUAL MANAGEMENT REPORT OF FUND PERFORMANCE
March 31, 2017
26
MANAGEMENT DISCUSSION OF FUND PERFORMANCE
Investment Objective and StrategiesThe Fund seeks to provide U.S. dollar total returns comprised of interest income and modest capital appreciation through exposure to global convertible bonds.
To achieve the Fund’s objectives, the Fund invests most of its assets in the BlueBay $U.S. Global Convertible Bond Fund (Canada) (the “underlying fund”), which holds mainly global convertible bonds issued by entities domiciled or carrying out business activities anywhere in the world. The portfolio manager of the underlying fund conducts detailed credit and equity analysis to identify investment opportunities offering high probabilities of superior rates of return while minimizing the prospect of default.
RiskThere were no significant changes to the investment objective and strategies that affected the Fund’s overall level of risk during the reporting period. The risks of investing in the Fund and the suitability of the Fund for investors remain as discussed in the Simplified Prospectus.
Results of OperationsThe Fund’s net asset value fell to $213,000 as of March 31, 2017, from $250,000 as of March 31, 2016. The decrease was due to net redemptions.
Over the past year, the Fund’s Series A shares gained 5.5%, which underperformed the 7.0% rise in the benchmark. The Fund’s return is after the deduction of fees and expenses, while the benchmark and broad-based index returns do not include any costs of investing. See the Financial Highlights section for the management expense ratios and the Past Performance section for the returns of any other series, which may vary because of differences in management fees and expenses.
Oil prices and global stocks climbed for much of the period after touching lows in early 2016. Equity markets largely ignored the U.K.’s unexpected decision in June to leave the EU, delivering their best returns in several years amid sustainable U.S. growth and economic-stimulus programs by the European Central Bank and the Bank of England. Donald Trump’s election in November as U.S. president boosted the shares of companies in financial services and infrastructure, but biotechnology shares weakened given discussions of drug-price cuts. While European central banks and the Bank of Japan loosened monetary policy, the U.S. Federal Reserve (the “Fed”) twice raised its benchmark rate late in the 12-month period. The increases suggested that the Fed was comfortable that the U.S. expansion would continue.
The Fund benefited from holdings in Tesaro, whose shares more than tripled over the period after the company released positive late-stage clinical results for its ovarian-cancer therapy. A robust product pipeline makes Tesaro another attractive takeover target,
in the view of the portfolio manager. The portfolio’s investments in semiconductor makers produced strong returns as investors sought more cyclically sensitive areas of the market. Notable contributions came from Micron and Microchip Technology in the U.S. and from Semiconductor Manufacturing International of Taiwan. The industry as a whole is benefiting from better returns on investment.
Siemens, a big German industrial company and security held in the Fund, also performed well over the period. Performance was driven by improving prospects for sales of capital goods due to continuing strong European economic data. There was also speculation that Siemens would form a holding company for its business lines.
The Fund’s investment in uranium miner Paladin Energy lagged after a delay in the closing of the company’s agreement to sell a minority stake in its main mine to a Chinese state-backed buyer. As a result, plans to free up money for debt repayments were pushed back, and the price of the bonds held in the portfolio declined.
Recent DevelopmentsThe portfolio manager believes that global financial markets remain in a “sweet spot” given continued low interest rates and expectations that the Trump administration will succeed in implementing pro-growth economic policies. Macroeconomic data, especially in the U.S. and Europe, has been strong recently, while major currencies have yet to remain stable despite political concerns and rising anti-trade rhetoric. In this environment, the portfolio manager expects equity markets and non-government debt to extend their strong performance.
On December 15, 2016, the Canadian government enacted new tax rules that eliminate the ability of investors to switch among different classes of RBC Corporate Class Funds on a tax-deferred basis. The new rules do not apply to switches between different series of the same fund.
Effective December 1, 2016, Mr. Lloyd R. McGinnis retired and Ms. Élaine Cousineau was appointed as Chair of the Independent Review Committee (the “IRC”). Mr. Charles F. Macfarlane was appointed as Vice Chair of the IRC. Effective January 1, 2017, Ms. Suromitra Sanatani and Ms. Catherine Kloepfer were appointed as members of the IRC.
Effective July 1, 2016, Deloitte LLP resigned and PricewaterhouseCoopers LLP was appointed as auditors of the Fund.
Effective June 30, 2016, management fees were reduced as follows: from 1.70% to 1.65% in respect of Series A mutual fund shares and Advisor Series mutual fund shares; from 1.10% to 1.05% in respect of Series D mutual fund shares; and from 0.95% to 0.90% in respect of Series F mutual fund shares.
BLUEBAY $U.S. GLOBAL CONVERTIBLE BOND CLASS (CANADA)(IN U.S. DOLLARS)
26

ANNUAL MANAGEMENT REPORT OF FUND PERFORMANCE
27
March 31, 2017
BLUEBAY $U.S. GLOBAL CONVERTIBLE BOND CLASS (CANADA)(IN U.S. DOLLARS)
Related-Party TransactionsManager and Portfolio ManagerRBC GAM is an indirect, wholly owned subsidiary of Royal Bank of Canada (“Royal Bank”) and is the manager and portfolio manager of the Fund. RBC GAM is responsible for the Fund’s day-to-day operations, provides investment advice and portfolio management services to the Fund and appoints distributors for the Fund. RBC GAM is paid a management fee by the Fund as compensation for its services. The Fund pays a fixed administration fee to RBC GAM, which, in turn, pays certain operating expenses of the Fund.
Affiliates of RBC GAM that provide services to the Fund in the course of their normal businesses are discussed below.
DistributorsRBC GAM, Royal Mutual Funds Inc., RBC Direct Investing Inc., RBC Dominion Securities Inc. and Phillips, Hager & North Investment Funds Ltd. are the principal distributors of, or distribute certain series of the mutual fund shares of, the Fund. Dealers receive an ongoing commission based on the total value of their clients’ Series A, Advisor Series and Series D mutual fund shares.
CustodianRBC Investor Services Trust (“RBC IS”) is the custodian and holds the assets of the Fund.
RegistrarsRoyal Bank, RBC IS and RBC GAM are the registrars of the Fund and keep records of who owns the mutual fund shares of the Fund.
Other Related-Party TransactionsPursuant to applicable securities legislation, the Fund relied on the standing instructions from the Independent Review Committee with respect to one or more of the following transactions:
Related-Party Trading Activities(a) trades in securities of Royal Bank;
(b) investments in the securities of issuers for which a related-party dealer acted as an underwriter during the distribution of such securities and the 60-day period following the conclusion of such distribution of the underwritten securities to the public;
(c) purchases of equity and debt securities from or sales of equity or debt securities to a related-party dealer, where it acted as principal; and
Inter-Fund Trading(d) purchases or sales of securities of an issuer from or to another
investment fund or managed account managed by RBC GAM.
The applicable standing instructions require that Related-Party Trading Activities and Inter-Fund Trading be conducted in accordance with RBC GAM policy and that RBC GAM advise the Independent Review Committee of a material breach of any standing instruction. RBC GAM policy requires that an investment decision in respect of Related-Party Trading Activities (i) is made free from any influence of Royal Bank or its associates or affiliates and without taking into account any consideration relevant to Royal Bank or its affiliates or associates, (ii) represents the business judgment of the portfolio manager, uninfluenced by considerations other than the best interests of the Fund, (iii) is in compliance with RBC GAM policies and procedures, and (iv) achieves a fair and reasonable result for the Fund. RBC GAM policy requires that an investment decision in respect of Inter-Fund Trading is in the best interests of each Fund.
27

ANNUAL MANAGEMENT REPORT OF FUND PERFORMANCE
March 31, 2017
28
FINANCIAL HIGHLIGHTS (in USD)The following tables show selected key financial information about the Fund and are intended to help you understand the Fund’s financial performance for the past five years or for the periods since inception. This information is derived from the Fund’s audited annual financial statements. For financial years beginning on or after April 1, 2014, financial highlight information is derived from financial statements prepared in compliance with International Financial Reporting Standards (“IFRS”). For financial years prior to April 1, 2014, financial highlight information is derived from financial statements prepared in accordance with Canadian generally accepted accounting principles (“GAAP”). “Net Assets,” for the periods prior to April 1, 2014, are calculated in accordance with GAAP, and “Net Asset Value” is derived from the valuation method disclosed in the RBC Corporate Class Funds Annual Information Form and is used for transactional purposes (see Ratios and Supplemental Data). All other calculations for the purposes of this MRFP are made using Net Asset Value. There is no significant difference between “Net Assets” and “Net Asset Value” under IFRS.
Change in Net Assets Per Mutual Fund Share
Annual Distributions2
Increase (Decrease) from Operations1 From Total Realized Unrealized Income From Net Assets For the Year/ Net Assets Revenue Total Gains Gains (Excluding From Capital Return End of Period Ended Beginning of Year/Period (Loss) Expenses (Losses) (Losses) Total Dividends) Dividends Gains of Capital Total Year/Period
Series AMar. 31, 2017 10.26 – (0.23) 0.17 0.63 0.57 – – – – – 10.82 Mar. 31, 20163 10.00† – (0.03) – 0.32 0.29 – – – – – 10.26
Advisor SeriesMar. 31, 2017 10.26 – (0.23) 0.17 0.63 0.57 – – – – – 10.82Mar. 31, 20163 10.00† – (0.03) – 0.32 0.29 – – – – – 10.26
Series DMar. 31, 2017 10.27 – (0.15) 0.17 0.63 0.65 – – – – – 10.91Mar. 31, 20163 10.00† – (0.02) – 0.32 0.30 – – – – – 10.27
Series FMar. 31, 2017 10.27 – (0.15) 0.17 0.60 0.62 – – – – – 10.92Mar. 31, 20163 10.00† – (0.02) – 0.28 0.26 – – – – – 10.27
Series OMar. 31, 2017 10.29 – (0.04) 0.18 0.62 0.76 – – – – – 11.05Mar. 31, 20163 10.00† – – – 0.32 0.32 – – – – – 10.29
1 Net assets and distributions are based on the actual number of mutual fund shares outstanding at the relevant time. The increase/decrease from operations is based on the weighted average number of mutual fund shares outstanding over the financial period. This table is not intended to be a reconciliation of beginning to ending net assets per mutual fund share.
2 Distributions are reinvested in additional mutual fund shares of the Fund or paid in cash.3 From October 16, 2015.† Initial offering net asset value per mutual fund share.
BLUEBAY $U.S. GLOBAL CONVERTIBLE BOND CLASS (CANADA)(IN U.S. DOLLARS)
28

ANNUAL MANAGEMENT REPORT OF FUND PERFORMANCE
March 31, 2017
29
FINANCIAL HIGHLIGHTS (in USD) (cont.)
Ratios and Supplemental Data
Number of Net Asset Value Net Asset Value Mutual Fund Shares Management MER Before Portfolio TradingAs at Per Mutual Fund Share ($) ($000s) Outstanding (000s) Expense Ratio (%)1 Absorption (%)1 Turnover Rate (%)2 Expense Ratio (%)3
Series AMar. 31, 2017 10.82 1 – 2.074 2.92 n/a 0.01Mar. 31, 20165 10.26 1 – 2.16 2.16 n/a 0.03
Advisor SeriesMar. 31, 2017 10.82 1 – 2.074 2.92 n/a 0.01Mar. 31, 20165 10.26 1 – 2.16 2.16 n/a 0.03
Series DMar. 31, 2017 10.91 1 – 1.404 2.25 n/a 0.01Mar. 31, 20165 10.27 1 – 1.48 1.48 n/a 0.03
Series FMar. 31, 2017 10.92 49 4 1.264 2.11 n/a 0.01Mar. 31, 20165 10.27 97 9 1.31 1.31 n/a 0.03
Series OMar. 31, 2017 11.05 161 15 0.25 1.10 n/a 0.01Mar. 31, 20165 10.29 150 15 0.24 0.24 n/a 0.03
1 The management expense ratio (“MER”) is based on expenses for the stated period, excluding commissions and other portfolio transaction costs, and is expressed as an annualized percentage of the daily average net asset value during the period. RBC GAM may, at its discretion and without notice to shareholders, waive or absorb certain operating expenses. MER includes the waiver or absorption by RBC GAM of certain operating expenses, while the MER before absorption shows the MER prior to operating expenses being waived or absorbed by RBC GAM.
2 The Fund’s portfolio turnover rate gives an indication of the level of activity employed by the portfolio manager. A portfolio turnover rate of 100% is equivalent to the Fund buying and selling all of the securities in its portfolio once in the course of the year. The higher the Fund’s portfolio turnover rate in a year, the greater the trading costs payable by the Fund in the year, and the greater the chance of an investor receiving taxable capital gains in the year. There is not necessarily a relationship between a high turnover rate and the performance of the Fund.
3 The trading expense ratio represents total commissions and other portfolio transaction costs expressed as an annualized percentage of daily average net asset value during the period. The trading expense ratio is not applicable to fixed-income transactions.
4 Effective June 30, 2016, the management fee was changed in respect of certain series of the Fund. If the change to the management fee would have been in effect throughout 2016, the adjusted MER for each series of the Fund would be: Series A – 2.06%, Advisor Series – 2.06%, Series D – 1.38% and Series F – 1.25%.
5 From October 16, 2015.
BLUEBAY $U.S. GLOBAL CONVERTIBLE BOND CLASS (CANADA)(IN U.S. DOLLARS)
Management Fees RBC GAM is the manager and portfolio manager of the Fund. Management fees of each series of the Fund are calculated at the annual percentages, before GST/HST, of the daily net asset value of each series of the Fund. The breakdown of the services received in consideration of the management fees for each series, as a percentage of the management fees, is as follows:
Breakdown of Services
Management Fees Distribution Other*
Series A 1.65% 44% 56%Advisor Series 1.65% 44% 56%Series D 1.05% 14% 86%Series F 0.90% – 100%
Series O – no management fees are paid by the Fund with respect to Series O mutual fund shares. Series O shareholders pay a negotiated fee directly to RBC GAM for investment-counselling services.* Includes all costs related to management, investment advisory services, general administration
and profit.
29
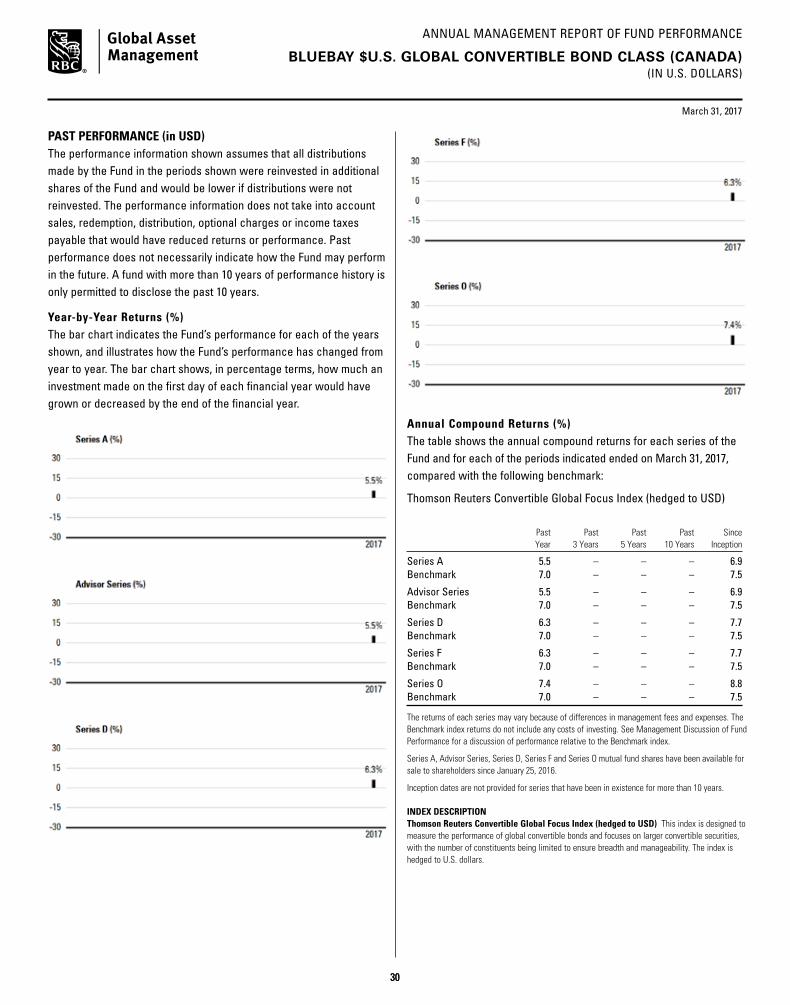
ANNUAL MANAGEMENT REPORT OF FUND PERFORMANCE
30
March 31, 2017
PAST PERFORMANCE (in USD)The performance information shown assumes that all distributions made by the Fund in the periods shown were reinvested in additional shares of the Fund and would be lower if distributions were not reinvested. The performance information does not take into account sales, redemption, distribution, optional charges or income taxes payable that would have reduced returns or performance. Past performance does not necessarily indicate how the Fund may perform in the future. A fund with more than 10 years of performance history is only permitted to disclose the past 10 years.
Year-by-Year Returns (%) The bar chart indicates the Fund’s performance for each of the years shown, and illustrates how the Fund’s performance has changed from year to year. The bar chart shows, in percentage terms, how much an investment made on the first day of each financial year would have grown or decreased by the end of the financial year.
BLUEBAY $U.S. GLOBAL CONVERTIBLE BOND CLASS (CANADA)(IN U.S. DOLLARS)
Annual Compound Returns (%) The table shows the annual compound returns for each series of the Fund and for each of the periods indicated ended on March 31, 2017, compared with the following benchmark:
Thomson Reuters Convertible Global Focus Index (hedged to USD)
Past Past Past Past Since Year 3 Years 5 Years 10 Years Inception
Series A 5.5 – – – 6.9Benchmark 7.0 – – – 7.5
Advisor Series 5.5 – – – 6.9Benchmark 7.0 – – – 7.5
Series D 6.3 – – – 7.7Benchmark 7.0 – – – 7.5
Series F 6.3 – – – 7.7Benchmark 7.0 – – – 7.5
Series O 7.4 – – – 8.8Benchmark 7.0 – – – 7.5
The returns of each series may vary because of differences in management fees and expenses. The Benchmark index returns do not include any costs of investing. See Management Discussion of Fund Performance for a discussion of performance relative to the Benchmark index.
Series A, Advisor Series, Series D, Series F and Series O mutual fund shares have been available for sale to shareholders since January 25, 2016.
Inception dates are not provided for series that have been in existence for more than 10 years.
INDEX DESCRIPTIONThomson Reuters Convertible Global Focus Index (hedged to USD) This index is designed to measure the performance of global convertible bonds and focuses on larger convertible securities, with the number of constituents being limited to ensure breadth and manageability. The index is hedged to U.S. dollars.
30

ANNUAL MANAGEMENT REPORT OF FUND PERFORMANCE
31
March 31, 2017
BLUEBAY $U.S. GLOBAL CONVERTIBLE BOND CLASS (CANADA)(IN U.S. DOLLARS)
SUMMARY OF INVESTMENT PORTFOLIO (in USD)(after consideration of derivative products, if any)As at March 31, 2017
Investment Mix % of Net Asset Value
United States 25.9Japan 16.5China 9.7Germany 6.9United Kingdom 5.9Taiwan 4.5Hong Kong 3.2Malaysia 3.2South Africa 2.9Norway 1.9Singapore 1.8Philippines 1.5France 1.3Netherlands 1.3United Arab Emirates 1.2Mexico 1.1Other Countries 3.3Cash/Other 7.9
Top 25 Holdings* % of Net Asset Value
Cash & Cash Equivalents 8.0Siemens Financieringsmaatschappij N.V., Convertible USD 1.050% Aug 16 2017 3.1Ctrip.com International Ltd., Convertible USD 1.990% Jul 1 2025 2.7Microchip Technology Inc., Convertible 1.625% Feb 15 2025 2.6Steinhoff Finance Holding GmbH, Convertible EUR 1.250% Oct 21 2023 2.6Cahaya Capital Ltd., Convertible USD 0.000% Sep 18 2021 2.3Citrix Systems Inc., Convertible 0.500% Apr 15 2019 2.1Suzuki Motor Corp., Convertible JPY 0.000% Mar 31 2023 1.7Kunlun Energy Co. Ltd., Convertible CNY 1.625% Jul 25 2019 1.6Salesforce.com Inc., Convertible 0.250% Apr 1 2018 1.5AYC Finance Ltd., Convertible USD 0.500% May 2 2019 1.5Tesla Inc., Convertible 1.250% Jan 3 2021 1.5United Microelectronics Corp., Convertible USD 0.000% May 18 2020 1.5RAG-Stiftung, Convertible EUR 0.000% Mar 16 2023 1.4CapitaLand Ltd., Convertible SGD 2.800% Jun 8 2025 1.3Deutsche Wohnen AG, Convertible EUR 0.325% Jul 26 2024 1.3Yamada Denki Co. Ltd., Convertible JPY 0.000% Jun 28 2019 1.3Micron Technology Inc., Convertible 3.000% Nov 15 2043 1.3Bagan Capital Ltd., Convertible USD 0.000% Sep 23 2021 1.2Aabar Investments PJSC, Convertible EUR 0.500% Mar 27 2020 1.2The Priceline Group Inc., Convertible 1.000% Mar 15 2018 1.2Kansai Paint Co. Ltd., Convertible JPY 0.000% Jun 17 2022 1.2Cemex S.A.B. de C.V., Convertible USD 3.750% Mar 15 2018 1.1Toray Industries Inc., Convertible JPY 0.000% Aug 31 2021 1.1BP Capital Markets Plc., Convertible GBP 1.000% Apr 28 2023 1.1Top 25 Holdings 47.4
* The Fund invests substantially all of its assets directly in the BlueBay $U.S. Global Convertible Bond Fund (Canada). The above are the Top 25 holdings of the BlueBay $U.S. Global Convertible Bond Fund (Canada).
The Summary of Investment Portfolio may change due to ongoing portfolio transactions of the Fund and a quarterly update is available at www.rbcgam.com/funds.
The Simplified Prospectus and other information about the underlying fund are available on SEDAR website at www.sedar.com.
31
ANNUAL MANAGEMENT REPORT OF FUND PERFORMANCE
32
BALANCED FUND
PHILLIPS, HAGER & NORTH MONTHLY INCOME CLASS
March 31, 2017
Portfolio Manager RBC Global Asset Management Inc. (“RBC GAM”)
This annual management report of fund performance (“MRFP”) contains financial highlights but does not contain the complete annual financial statements of the Fund. You can get a copy of the financial statements at your request, and at no cost, by calling 1-800-463-FUND (3863), by writing to us at RBC Global Asset Management Inc., P.O. Box 7500, Station A, Toronto, Ontario M5W 1P9, or by visiting our website at www.rbcgam.com/reports or SEDAR at www.sedar.com. Security holders may also contact us using one of these methods to request a copy of the Fund’s proxy voting policies and procedures, proxy voting disclosure record, or quarterly portfolio disclosure.
The Board of Directors of RBC Corporate Class Inc. approved this annual management report of fund performance on May 11, 2017.
A Note on Forward-looking Statements
This report may contain forward-looking statements about the Fund, its future performance, strategies or prospects, and possible future Fund action. The words “may,” “could,” “should,” “would,” “suspect,” “outlook,” “believe,” “plan,” “anticipate,” “estimate,” “expect,” “intend,” “forecast,” “objective” and similar expressions are intended to identify forward-looking statements.
Forward-looking statements are not guarantees of future performance. Forward-looking statements involve inherent risks and uncertainties, both about the Fund and general economic factors, so it is possible that predictions, forecasts, projections and other forward-looking statements will not be achieved. We caution you not to place undue reliance on these statements as a number of important factors could cause actual events or results to differ materially from those expressed or implied in any forward-looking statement made in relation to the Fund. These factors include, but are not limited to, general economic, political and market factors in Canada, the United States and internationally, interest and foreign exchange rates, global equity and capital markets, business competition, technological changes, changes in laws and regulations, judicial or regulatory judgments, legal proceedings and catastrophic events.
The above list of important factors that may affect future results is not exhaustive. Before making any investment decisions, we encourage you to consider these and other factors carefully. All opinions contained in forward-looking statements are subject to change without notice and are provided in good faith but without legal responsibility.
32

ANNUAL MANAGEMENT REPORT OF FUND PERFORMANCE
March 31, 2017
33
MANAGEMENT DISCUSSION OF FUND PERFORMANCE
Investment Objective and StrategiesThe Fund seeks to provide monthly income that may consist of dividend income, interest income, realized capital gains and return of capital. The Fund will also have the potential to provide modest capital growth. The Fund primarily invests in a well diversified balanced portfolio of income-producing equity securities, including, but not limited to, common shares of dividend-paying Canadian companies and income trusts. The Fund may also invest in fixed-income securities such as preferred shares, government and corporate bonds, debentures and notes, asset-backed commercial paper, mortgage-backed securities and other income-generating securities.
The Fund’s target weightings for each asset class are 50% for fixed income and 50% for equities. The target weightings for each asset class may be adjusted based on changes in the market outlook for each asset class.
To achieve its investment objective, the Fund invests most of its assets in the Phillips, Hager & North Monthly Income Fund and/or a combination of other mutual funds managed by RBC GAM (underlying funds). The underlying funds invest in income-producing equity securities, fixed-income securities, and may also hold income-generating securities such as convertible bonds and convertible preferred shares.
RiskThere were no significant changes to the investment objective and strategies that affected the Fund’s overall level of risk during the reporting period. The risks of investing in the Fund and the suitability of the Fund for investors remain as discussed in the Simplified Prospectus.
Results of OperationsThe Fund’s net asset value fell to $122 million as of March 31, 2017, from $135 million as of March 31, 2016. The decrease was due to net redemptions.
Over the past year, the Fund’s Series A shares gained 10.5%, which underperformed the 12.4% rise in the benchmark. The broad-based index rose 1.5%. The Fund’s return is after the deduction of fees and expenses, while the benchmark and broad-based index returns do not include any costs of investing. See the Financial Highlights section for the management expense ratios and the Past Performance section for the returns of any other series, which may vary because of differences in management fees and expenses.
The Canadian equity market, as measured by the S&P/TSX Capped Composite Index, generated strong returns over the period, supported by strength in the Financials sector, which benefited from rising interest rates. A recovery in the resource sectors was helped by improving commodity prices.
The Fund’s equity positions in Financials contributed to relative performance. Overweight positions in Sun Life Financial and Canadian Imperial Bank of Commerce boosted returns. Holding back relative returns were Energy-sector positions in Crescent Point Energy and Cenovus Energy.
In fixed income, government-bond yields climbed after the U.S. election, and ended the period slightly higher than they were at the beginning. Corporate and provincial bonds continued to outperform Government of Canada bonds, as low interest rates fuelled investor demand for yield, while slow-but-persistent economic growth boosted issuer creditworthiness. Within the Fund, allocations to provincial and corporate bonds had a positive impact on relative returns, especially given the extra yield they offered relative to Government of Canada fixed income securities.
Recent DevelopmentsIn the portfolio manager’s view, the economic outlook has improved globally. Positive economic data has supported heightened consumer and business confidence, and investors have focused on the potential for a shift from monetary stimulus to fiscal stimulus. However, central banks other than the U.S. Federal Reserve are continuing to rely on monetary stimulus until there is evidence that fiscal spending is ready to take over.
On December 15, 2016, the Canadian government enacted new tax rules that eliminate the ability of investors to switch among different classes of RBC Corporate Class Funds on a tax-deferred basis. The new rules do not apply to switches between different series of the same fund.
Effective December 1, 2016, Mr. Lloyd R. McGinnis retired and Ms. Élaine Cousineau was appointed as Chair of the Independent Review Committee (the “IRC”). Mr. Charles F. Macfarlane was appointed as Vice Chair of the IRC. Effective January 1, 2017, Ms. Suromitra Sanatani and Ms. Catherine Kloepfer were appointed as members of the IRC.
Effective July 1, 2016, Deloitte LLP resigned and PricewaterhouseCoopers LLP was appointed as auditors of the Fund.
Effective June 30, 2016, Series H mutual fund shares were capped and no longer available for purchase by new investors, and Series I mutual fund shares were closed to all investors.
PHILLIPS, HAGER & NORTH MONTHLY INCOME CLASS
33

ANNUAL MANAGEMENT REPORT OF FUND PERFORMANCE
March 31, 2017
34
PHILLIPS, HAGER & NORTH MONTHLY INCOME CLASS
Related-Party TransactionsManager and Portfolio ManagerRBC GAM is an indirect, wholly owned subsidiary of Royal Bank of Canada (“Royal Bank”) and is the manager and portfolio manager of the Fund. RBC GAM is responsible for the Fund’s day-to-day operations, provides investment advice and portfolio management services to the Fund and appoints distributors for the Fund. RBC GAM is paid a management fee by the Fund as compensation for its services. The Fund pays a fixed administration fee to RBC GAM, which, in turn, pays certain operating expenses of the Fund.
Affiliates of RBC GAM that provide services to the Fund in the course of their normal businesses are discussed below.
DistributorsRBC GAM, Royal Mutual Funds Inc., RBC Direct Investing Inc., RBC Dominion Securities Inc. and Phillips, Hager & North Investment Funds Ltd. are the principal distributors of, or distribute certain series of the mutual fund shares of, the Fund. Dealers receive an ongoing commission based on the total value of their clients’ Series A, Advisor Series, Advisor T5 Series, Series T5, Series H and Series D mutual fund shares.
CustodianRBC Investor Services Trust (“RBC IS”) is the custodian and holds the assets of the Fund.
RegistrarsRoyal Bank, RBC IS and RBC GAM are the registrars of the Fund and keep records of who owns the mutual fund shares of the Fund.
Other Related-Party TransactionsPursuant to applicable securities legislation, the Fund relied on the standing instructions from the Independent Review Committee with respect to one or more of the following transactions:
Related-Party Trading Activities(a) trades in securities of Royal Bank;
(b) investments in the securities of issuers for which a related-party dealer acted as an underwriter during the distribution of such securities and the 60-day period following the conclusion of such distribution of the underwritten securities to the public;
(c) purchases of equity and debt securities from or sales of equity or debt securities to a related-party dealer, where it acted as principal; and
Inter-Fund Trading(d) purchases or sales of securities of an issuer from or to another
investment fund or managed account managed by RBC GAM.
The applicable standing instructions require that Related-Party Trading Activities and Inter-Fund Trading be conducted in accordance with RBC GAM policy and that RBC GAM advise the Independent Review Committee of a material breach of any standing instruction. RBC GAM policy requires that an investment decision in respect of Related-Party Trading Activities (i) is made free from any influence of Royal Bank or its associates or affiliates and without taking into account any consideration relevant to Royal Bank or its affiliates or associates, (ii) represents the business judgment of the portfolio manager, uninfluenced by considerations other than the best interests of the Fund, (iii) is in compliance with RBC GAM policies and procedures, and (iv) achieves a fair and reasonable result for the Fund. RBC GAM policy requires that an investment decision in respect of Inter-Fund Trading is in the best interests of each Fund.
34

ANNUAL MANAGEMENT REPORT OF FUND PERFORMANCE
March 31, 2017
35
FINANCIAL HIGHLIGHTS The following tables show selected key financial information about the Fund and are intended to help you understand the Fund’s financial performance for the past five years or for the periods since inception. This information is derived from the Fund’s audited annual financial statements. For financial years beginning on or after April 1, 2014, financial highlight information is derived from financial statements prepared in compliance with International Financial Reporting Standards (“IFRS”). For financial years prior to April 1, 2014, financial highlight information is derived from financial statements prepared in accordance with Canadian generally accepted accounting principles (“GAAP”). “Net Assets,” for the periods prior to April 1, 2014, are calculated in accordance with GAAP, and “Net Asset Value” is derived from the valuation method disclosed in the RBC Corporate Class Funds Annual Information Form and is used for transactional purposes (see Ratios and Supplemental Data). All other calculations for the purposes of this MRFP are made using Net Asset Value. There is no significant difference between “Net Assets” and “Net Asset Value” under IFRS.
Change in Net Assets Per Mutual Fund Share ($)
Annual Distributions2
Increase (Decrease) from Operations1 From Total Realized Unrealized Income From Net Assets For the Year/ Net Assets Revenue Total Gains Gains (Excluding From Capital Return End of Period Ended Beginning of Year/Period (Loss) Expenses (Losses) (Losses) Total Dividends) Dividends Gains of Capital Total Year/Period
Series AMar. 31, 2017 10.87 0.38 (0.22) (0.10) 1.13 1.19 – (0.20) – – (0.20) 11.82 Mar. 31, 2016 11.52 0.56 (0.21) (0.41) (0.47) (0.53) – (0.27) – – (0.27) 10.87Mar. 31, 2015 11.15 0.57 (0.22) 0.59 (0.59) 0.35 – (0.13) – – (0.13) 11.52Mar. 31, 2014 10.43 0.53 (0.07) 0.18 0.42 1.06 – (0.12) – – (0.12) 11.15Mar. 31, 20133 10.00† 0.26 (0.04) 0.02 0.35 0.59 – (0.01) – – (0.01) 10.43
Advisor SeriesMar. 31, 2017 10.84 0.38 (0.22) (0.10) 1.10 1.16 – (0.20) – – (0.20) 11.79Mar. 31, 2016 11.50 0.56 (0.21) (0.40) (0.47) (0.52) – (0.27) – – (0.27) 10.84Mar. 31, 2015 11.13 0.57 (0.22) 0.59 (0.59) 0.35 – (0.13) – – (0.13) 11.50Mar. 31, 2014 10.43 0.53 (0.07) 0.18 0.42 1.06 – (0.13) – – (0.13) 11.13Mar. 31, 20133 10.00† 0.21 (0.01) 0.01 0.28 0.49 – (0.01) – – (0.01) 10.43
Advisor T5 SeriesMar. 31, 2017 9.62 0.33 (0.18) (0.09) 0.95 1.01 – (0.18) – (0.30) (0.48) 10.14Mar. 31, 2016 10.48 0.50 (0.18) (0.36) (0.41) (0.45) – (0.20) – (0.31) (0.51) 9.62 Mar. 31, 2015 10.51 0.55 (0.20) 0.56 (0.57) 0.34 – (0.17) – (0.34) (0.51) 10.48Mar. 31, 2014 10.26 0.53 (0.02) 0.18 0.42 1.11 – (0.18) – (0.33) (0.51) 10.51Mar. 31, 20133 10.00† 0.20 (0.01) 0.01 0.27 0.47 – (0.07) – (0.14) (0.21) 10.26
Series T5Mar. 31, 2017 9.61 0.33 (0.19) (0.09) 0.97 1.02 – (0.18) – (0.30) (0.48) 10.11Mar. 31, 2016 10.47 0.50 (0.19) (0.36) (0.42) (0.47) – (0.20) – (0.31) (0.51) 9.61Mar. 31, 2015 10.51 0.54 (0.20) 0.56 (0.56) 0.34 – (0.17) – (0.34) (0.51) 10.47Mar. 31, 2014 10.26 0.52 (0.03) 0.17 0.41 1.07 – (0.18) – (0.33) (0.51) 10.51Mar. 31, 20133 10.00† 0.24 (0.01) 0.01 0.33 0.57 – (0.07) – (0.14) (0.21) 10.26
Series HMar. 31, 2017 10.90 0.38 (0.20) (0.10) 1.11 1.19 – (0.26) – – (0.26) 11.80Mar. 31, 2016 11.57 0.56 (0.19) (0.40) (0.46) (0.49) – (0.30) – – (0.30) 10.90Mar. 31, 2015 11.17 0.57 (0.20) 0.59 (0.59) 0.37 – (0.12) – – (0.12) 11.57Mar. 31, 2014 10.44 0.51 (0.04) 0.17 0.41 1.05 – (0.12) – – (0.12) 11.17Mar. 31, 20133 10.00† 0.21 (0.01) 0.01 0.29 0.50 – (0.01) – – (0.01) 10.44
Series DMar. 31, 2017 11.11 0.39 (0.12) (0.11) 1.12 1.28 – (0.27) – – (0.27) 12.11Mar. 31, 2016 11.76 0.58 (0.12) (0.42) (0.49) (0.45) – (0.36) – – (0.36) 11.11Mar. 31, 2015 11.29 0.59 (0.12) 0.60 (0.61) 0.46 – (0.13) – – (0.13) 11.76Mar. 31, 2014 10.47 0.53 (0.03) 0.18 0.42 1.10 – (0.12) – – (0.12) 11.29Mar. 31, 20133 10.00† 0.20 – 0.01 0.27 0.48 – (0.01) – – (0.01) 10.47
PHILLIPS, HAGER & NORTH MONTHLY INCOME CLASS
35

ANNUAL MANAGEMENT REPORT OF FUND PERFORMANCE
March 31, 2017
36
FINANCIAL HIGHLIGHTS (cont.)
Change in Net Assets Per Mutual Fund Share ($) (cont.)
Annual Distributions2
Increase (Decrease) from Operations1 From Total Realized Unrealized Income From Net Assets For the Year/ Net Assets Revenue Total Gains Gains (Excluding From Capital Return End of Period Ended Beginning of Year/Period (Loss) Expenses (Losses) (Losses) Total Dividends) Dividends Gains of Capital Total Year/Period
Series FMar. 31, 2017 11.15 0.41 (0.09) (0.11) 0.98 1.19 – (0.30) – – (0.30) 12.16Mar. 31, 2016 11.82 0.58 (0.09) (0.42) (0.48) (0.41) – (0.40) – – (0.40) 11.15Mar. 31, 2015 11.29 0.55 (0.09) 0.57 (0.57) 0.46 – (0.11) – – (0.11) 11.82Mar. 31, 2014 10.48 0.54 (0.01) 0.18 0.43 1.14 – (0.16) – – (0.16) 11.29Mar. 31, 20133 10.00† 0.37 – 0.02 0.51 0.90 – (0.01) – – (0.01) 10.48
Series FT5Mar. 31, 2017 9.99 0.35 (0.08) (0.10) 0.90 1.07 – (0.19) – (0.31) (0.50) 10.64Mar. 31, 2016 10.76 0.52 (0.08) (0.37) (0.43) (0.36) – (0.19) – (0.33) (0.52) 9.99Mar. 31, 2015 10.67 0.52 (0.09) 0.54 (0.54) 0.43 – (0.17) – (0.35) (0.52) 10.76Mar. 31, 2014 10.31 0.54 – 0.18 0.43 1.15 – (0.18) – (0.33) (0.51) 10.67Mar. 31, 20133 10.00† 0.30 – 0.02 0.40 0.72 – (0.08) – (0.13) (0.21) 10.31
1 Net assets and distributions are based on the actual number of mutual fund shares outstanding at the relevant time. The increase/decrease from operations is based on the weighted average number of mutual fund shares outstanding over the financial period. This table is not intended to be a reconciliation of beginning to ending net assets per mutual fund share.
2 Distributions are reinvested in additional mutual fund shares of the Fund or paid in cash.3 From October 31, 2012.† Initial offering net asset value per mutual fund share.
Ratios and Supplemental Data
Number of Net Asset Value Net Asset Value Mutual Fund Shares Management MER Before Portfolio TradingAs at Per Mutual Fund Share ($) ($000s) Outstanding (000s) Expense Ratio (%)1 Absorption (%)1 Turnover Rate (%)2 Expense Ratio (%)3
Series AMar. 31, 2017 11.82 42 477 3 594 1.95 1.95 2.14 0.17 Mar. 31, 2016 10.87 61 964 5 699 1.96 1.96 5.53 0.24Mar. 31, 2015 11.52 85 328 7 405 1.95 1.96 7.11 0.24 Mar. 31, 2014 11.15 40 638 3 646 1.97 1.97 12.61 0.27Mar. 31, 20134 10.43 20 548 1 971 1.98 1.98 8.43 0.27
Advisor SeriesMar. 31, 2017 11.79 9 214 782 1.94 1.94 2.14 0.17Mar. 31, 2016 10.84 11 200 1 033 1.97 1.97 5.53 0.24Mar. 31, 2015 11.50 16 884 1 468 1.96 1.97 7.11 0.24 Mar. 31, 2014 11.13 9 781 879 1.98 1.98 12.61 0.27Mar. 31, 20134 10.43 4 497 431 1.98 1.98 8.43 0.27
Advisor T5 SeriesMar. 31, 2017 10.14 6 665 657 1.91 1.91 2.14 0.17Mar. 31, 2016 9.62 9 442 981 1.91 1.91 5.53 0.24Mar. 31, 2015 10.48 15 519 1 481 1.89 1.90 7.11 0.24 Mar. 31, 2014 10.51 14 118 1 343 1.90 1.90 12.61 0.27Mar. 31, 20134 10.26 9 975 976 1.97 1.97 8.43 0.27
Series T5Mar. 31, 2017 10.11 9 828 972 1.97 1.97 2.14 0.17Mar. 31, 2016 9.61 14 142 1 472 1.97 1.97 5.53 0.24Mar. 31, 2015 10.47 19 876 1 899 1.95 1.96 7.11 0.24 Mar. 31, 2014 10.51 16 365 1 558 1.95 1.95 12.61 0.27Mar. 31, 20134 10.26 8 989 880 1.98 1.98 8.43 0.27
PHILLIPS, HAGER & NORTH MONTHLY INCOME CLASS
36
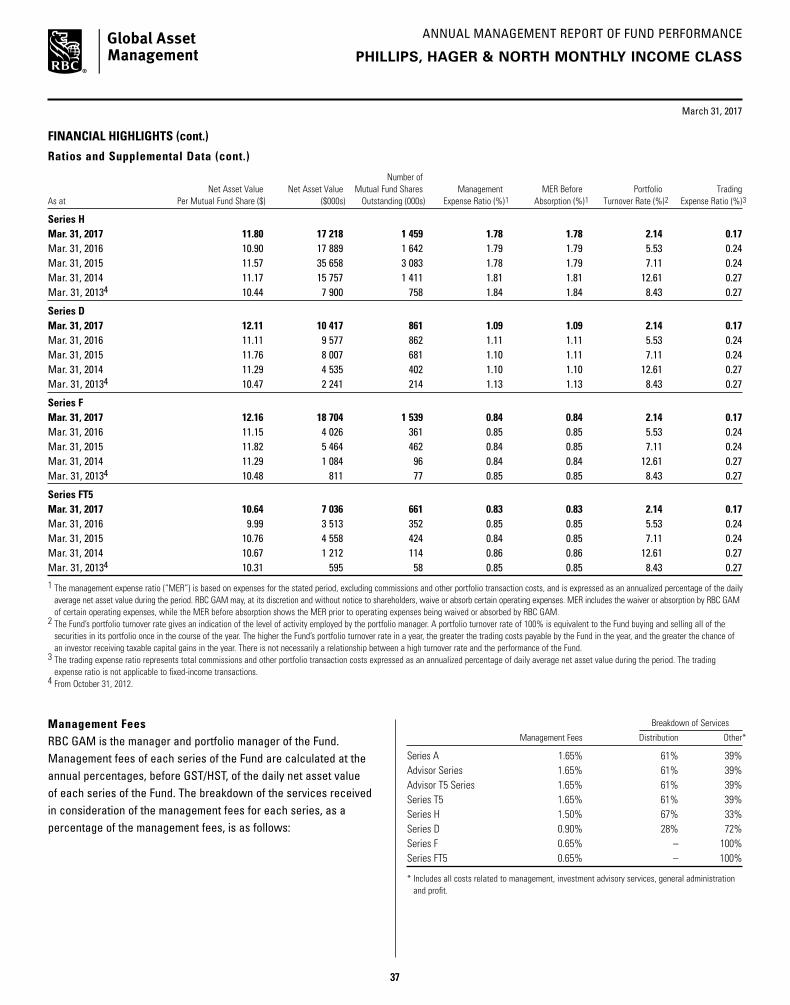
ANNUAL MANAGEMENT REPORT OF FUND PERFORMANCE
March 31, 2017
37
PHILLIPS, HAGER & NORTH MONTHLY INCOME CLASS
FINANCIAL HIGHLIGHTS (cont.)
Ratios and Supplemental Data (cont.)
Number of Net Asset Value Net Asset Value Mutual Fund Shares Management MER Before Portfolio TradingAs at Per Mutual Fund Share ($) ($000s) Outstanding (000s) Expense Ratio (%)1 Absorption (%)1 Turnover Rate (%)2 Expense Ratio (%)3
Series HMar. 31, 2017 11.80 17 218 1 459 1.78 1.78 2.14 0.17Mar. 31, 2016 10.90 17 889 1 642 1.79 1.79 5.53 0.24Mar. 31, 2015 11.57 35 658 3 083 1.78 1.79 7.11 0.24 Mar. 31, 2014 11.17 15 757 1 411 1.81 1.81 12.61 0.27Mar. 31, 20134 10.44 7 900 758 1.84 1.84 8.43 0.27
Series DMar. 31, 2017 12.11 10 417 861 1.09 1.09 2.14 0.17Mar. 31, 2016 11.11 9 577 862 1.11 1.11 5.53 0.24Mar. 31, 2015 11.76 8 007 681 1.10 1.11 7.11 0.24 Mar. 31, 2014 11.29 4 535 402 1.10 1.10 12.61 0.27Mar. 31, 20134 10.47 2 241 214 1.13 1.13 8.43 0.27
Series FMar. 31, 2017 12.16 18 704 1 539 0.84 0.84 2.14 0.17Mar. 31, 2016 11.15 4 026 361 0.85 0.85 5.53 0.24Mar. 31, 2015 11.82 5 464 462 0.84 0.85 7.11 0.24 Mar. 31, 2014 11.29 1 084 96 0.84 0.84 12.61 0.27Mar. 31, 20134 10.48 811 77 0.85 0.85 8.43 0.27
Series FT5Mar. 31, 2017 10.64 7 036 661 0.83 0.83 2.14 0.17Mar. 31, 2016 9.99 3 513 352 0.85 0.85 5.53 0.24Mar. 31, 2015 10.76 4 558 424 0.84 0.85 7.11 0.24 Mar. 31, 2014 10.67 1 212 114 0.86 0.86 12.61 0.27Mar. 31, 20134 10.31 595 58 0.85 0.85 8.43 0.27
1 The management expense ratio (“MER”) is based on expenses for the stated period, excluding commissions and other portfolio transaction costs, and is expressed as an annualized percentage of the daily average net asset value during the period. RBC GAM may, at its discretion and without notice to shareholders, waive or absorb certain operating expenses. MER includes the waiver or absorption by RBC GAM of certain operating expenses, while the MER before absorption shows the MER prior to operating expenses being waived or absorbed by RBC GAM.
2 The Fund’s portfolio turnover rate gives an indication of the level of activity employed by the portfolio manager. A portfolio turnover rate of 100% is equivalent to the Fund buying and selling all of the securities in its portfolio once in the course of the year. The higher the Fund’s portfolio turnover rate in a year, the greater the trading costs payable by the Fund in the year, and the greater the chance of an investor receiving taxable capital gains in the year. There is not necessarily a relationship between a high turnover rate and the performance of the Fund.
3 The trading expense ratio represents total commissions and other portfolio transaction costs expressed as an annualized percentage of daily average net asset value during the period. The trading expense ratio is not applicable to fixed-income transactions.
4 From October 31, 2012.
Management Fees RBC GAM is the manager and portfolio manager of the Fund. Management fees of each series of the Fund are calculated at the annual percentages, before GST/HST, of the daily net asset value of each series of the Fund. The breakdown of the services received in consideration of the management fees for each series, as a percentage of the management fees, is as follows:
Breakdown of Services
Management Fees Distribution Other*
Series A 1.65% 61% 39%Advisor Series 1.65% 61% 39%Advisor T5 Series 1.65% 61% 39%Series T5 1.65% 61% 39%Series H 1.50% 67% 33%Series D 0.90% 28% 72%Series F 0.65% – 100%Series FT5 0.65% – 100%
* Includes all costs related to management, investment advisory services, general administration and profit.
37

ANNUAL MANAGEMENT REPORT OF FUND PERFORMANCE
March 31, 2017
38
PHILLIPS, HAGER & NORTH MONTHLY INCOME CLASS
PAST PERFORMANCEThe performance information shown assumes that all distributions made by the Fund in the periods shown were reinvested in additional shares of the Fund and would be lower if distributions were not reinvested. The performance information does not take into account sales, redemption, distribution, optional charges or income taxes payable that would have reduced returns or performance. Past performance does not necessarily indicate how the Fund may perform in the future. A fund with more than 10 years of performance history is only permitted to disclose the past 10 years.
Year-by-Year Returns (%) The bar chart indicates the Fund’s performance for each of the years shown, and illustrates how the Fund’s performance has changed from year to year. The bar chart shows, in percentage terms, how much an investment made on the first day of each financial year would have grown or decreased by the end of the financial year.
38

ANNUAL MANAGEMENT REPORT OF FUND PERFORMANCE
March 31, 2017
39
S&P/TSX Preferred Share Total Return Index This index is composed of preferred stocks trading on the Toronto Stock Exchange that meet criteria relating to minimum size, liquidity, issuer rating and exchange listing.
SUMMARY OF INVESTMENT PORTFOLIO(after consideration of derivative products, if any)As at March 31, 2017
Investment Mix % of Net Asset Value
Canadian Equities 50.2Bonds 32.3Investment Funds 9.8Preferred Equities 5.4Cash/Other 2.3
Top 25 Holdings* % of Net Asset Value
RBC High Yield Bond Fund 5.6Toronto-Dominion Bank 4.4Phillips, Hager & North High Yield Bond Fund 4.2Bank of Nova Scotia 4.0Royal Bank of Canada 3.9Enbridge Inc. 3.5Brookfield Asset Management Inc., Class A 2.1Canadian Imperial Bank of Commerce 2.0Cash & Cash Equivalents 2.0Province of Ontario 7.600% Jun 2 2027 1.7Manulife Financial Corporation 1.7Alimentation Couche-Tard Inc. 1.5Canadian Natural Resources Ltd. 1.5Cenovus Energy Inc. 1.4Waste Connections Inc. 1.3Quebecor Inc., Class B 1.3Fortis Inc. 1.2Brookfield Property Partners LP 1.2Crescent Point Energy Corp. 1.2Keyera Corp. 1.1Sun Life Financial Inc. 1.1Canada Housing Trust No. 1 1.250% Jun 15 2021 1.1Stantec Inc. 1.1Government of Canada 0.500% Mar 1 2022 1.0Province of Ontario 3.500% Jun 2 2043 0.9Top 25 Holdings 52.0
* The Fund invests substantially all of its assets directly in the Phillips, Hager & North Monthly Income Fund. The above are the Top 25 holdings of the Phillips, Hager & North Monthly Income Fund.
The Summary of Investment Portfolio may change due to ongoing portfolio transactions of the Fund and a quarterly update is available at www.rbcgam.com/funds.
The Simplified Prospectus and other information about the underlying fund are available on SEDAR website at www.sedar.com.
PHILLIPS, HAGER & NORTH MONTHLY INCOME CLASS
PAST PERFORMANCE (cont.)Annual Compound Returns (%) The table shows the annual compound returns for each series of the Fund and for each of the periods indicated ended on March 31, 2017, compared with the following benchmarks:
The blended benchmark (the “Benchmark”) is composed of:
50% S&P/TSX Capped Composite Total Return Index 35% FTSE TMX Canada Universe Bond Index 10% Merrill Lynch Canadian High Yield Index 5% S&P/TSX Preferred Share Total Return Index
The broad-based index is the FTSE TMX Canada Universe Bond Index.
Past Past Past Past Since Year 3 Years 5 Years 10 Years Inception
Series A 10.5 3.8 – – 5.4Benchmark 12.4 4.9 – – 6.0Broad-based index 1.5 4.1 – – 3.2
Advisor Series 10.5 3.7 – – 5.3Benchmark 12.4 4.9 – – 6.0Broad-based index 1.5 4.1 – – 3.2
Advisor T5 Series 10.6 3.8 – – 5.4Benchmark 12.4 4.9 – – 6.0Broad-based index 1.5 4.1 – – 3.2
Series T5 10.5 3.7 – – 5.4Benchmark 12.4 4.9 – – 6.0Broad-based index 1.5 4.1 – – 3.2
Series H 10.7 3.9 – – 5.5Benchmark 12.4 4.9 – – 6.0Broad-based index 1.5 4.1 – – 3.2
Series D 11.5 4.6 – – 6.3Benchmark 12.4 4.9 – – 6.0Broad-based index 1.5 4.1 – – 3.2
Series F 11.7 4.9 – – 6.5Benchmark 12.4 4.9 – – 6.0Broad-based index 1.5 4.1 – – 3.2
Series FT5 11.8 4.9 – – 6.5Benchmark 12.4 4.9 – – 6.0Broad-based index 1.5 4.1 – – 3.2
The returns of each series may vary because of differences in management fees and expenses. The Benchmark and broad-based index returns do not include any costs of investing. See Management Discussion of Fund Performance for a discussion of performance relative to the Benchmark and broad-based index.
Series A, Advisor Series, Advisor T5 Series, Series T5, Series H, Series D, Series F and Series FT5 mutual fund shares have been available for sale to shareholders since October 31, 2012.
Inception dates are not provided for series that have been in existence for more than 10 years.
INDEX DESCRIPTIONSS&P/TSX Capped Composite Total Return Index This index is the amended capitalization-weighted index measuring the performance of selected securities listed on the Toronto Stock Exchange, with no individual stock exceeding 10% of the overall weight.FTSE TMX Canada Universe Bond Index This index is designed as a broad measure of the Canadian investment-grade fixed-income market and includes bonds with maturities of at least one year.Merrill Lynch Canadian High Yield Index This index tracks the performance of U.S. dollar- and Canadian dollar-denominated below-investment-grade corporate debt publicly issued by Canadian issuers in the Canadian or U.S. domestic markets.
39
ANNUAL MANAGEMENT REPORT OF FUND PERFORMANCE
40
BALANCED FUND
RBC BALANCED GROWTH & INCOME CLASS
March 31, 2017
Portfolio Manager RBC Global Asset Management Inc. (“RBC GAM”)
This annual management report of fund performance (“MRFP”) contains financial highlights but does not contain the complete annual financial statements of the Fund. You can get a copy of the financial statements at your request, and at no cost, by calling 1-800-463-FUND (3863), by writing to us at RBC Global Asset Management Inc., P.O. Box 7500, Station A, Toronto, Ontario M5W 1P9, or by visiting our website at www.rbcgam.com/reports or SEDAR at www.sedar.com. Security holders may also contact us using one of these methods to request a copy of the Fund’s proxy voting policies and procedures, proxy voting disclosure record, or quarterly portfolio disclosure.
The Board of Directors of RBC Corporate Class Inc. approved this annual management report of fund performance on May 11, 2017.
A Note on Forward-looking Statements
This report may contain forward-looking statements about the Fund, its future performance, strategies or prospects, and possible future Fund action. The words “may,” “could,” “should,” “would,” “suspect,” “outlook,” “believe,” “plan,” “anticipate,” “estimate,” “expect,” “intend,” “forecast,” “objective” and similar expressions are intended to identify forward-looking statements.
Forward-looking statements are not guarantees of future performance. Forward-looking statements involve inherent risks and uncertainties, both about the Fund and general economic factors, so it is possible that predictions, forecasts, projections and other forward-looking statements will not be achieved. We caution you not to place undue reliance on these statements as a number of important factors could cause actual events or results to differ materially from those expressed or implied in any forward-looking statement made in relation to the Fund. These factors include, but are not limited to, general economic, political and market factors in Canada, the United States and internationally, interest and foreign exchange rates, global equity and capital markets, business competition, technological changes, changes in laws and regulations, judicial or regulatory judgments, legal proceedings and catastrophic events.
The above list of important factors that may affect future results is not exhaustive. Before making any investment decisions, we encourage you to consider these and other factors carefully. All opinions contained in forward-looking statements are subject to change without notice and are provided in good faith but without legal responsibility.
40
ANNUAL MANAGEMENT REPORT OF FUND PERFORMANCE
41
March 31, 2017
MANAGEMENT DISCUSSION OF FUND PERFORMANCE
Investment Objective and StrategiesThe Fund seeks to provide a combination of capital growth and modest income by investing primarily in a diversified portfolio of income-producing equity and fixed-income securities from anywhere around the world.
The Fund’s target weightings for each asset class are 40% for fixed income and 60% for equities. The target weightings for each class may be adjusted based on changes in the market outlook for each asset class.
To achieve its investment objective, the Fund invests up to 100% of its net assets in units of other mutual funds managed by RBC GAM or an affiliate of RBC GAM (“underlying funds”). The underlying funds invest in income-producing equity securities and fixed-income securities from around the world such as dividend-paying common shares, income trusts, preferred shares, government and corporate bonds, high yield bonds, debentures and notes, asset-backed commercial paper, mortgage-backed securities and other income-generating securities. The underlying funds may also invest in emerging-market equity securities and emerging-market government and corporate bonds.
RiskThere were no significant changes to the investment objective and strategies that affected the Fund’s overall level of risk during the reporting period. The risks of investing in the Fund and the suitability of the Fund for investors remain as discussed in the Simplified Prospectus.
Results of OperationsThe Fund’s net asset value rose to $133 million as of March 31, 2017, from $101 million as of March 31, 2016. The increase was due to a mix of net inflows and investment returns.
Over the past year, the Fund’s Series A shares gained 12.6%, which outperformed the 11.9% rise in the benchmark. The broad-based index rose 1.5%. The Fund’s return is after the deduction of fees and expenses, while the benchmark and broad-based index returns do not include any costs of investing. See the Financial Highlights section for the management expense ratios and the Past Performance section for the returns of any other series, which may vary because of differences in management fees and expenses.
The global economy firmed over the course of the period, alleviating growth concerns present from early in 2016. The U.S. Federal Reserve resumed raising interest rates in December followed by another rate hike in March, reflecting optimism about the pace of the U.S. expansion. However, toward the end of the period longer-term U.S. bond yields fell due to increased concern that President Donald Trump might have trouble winning approval for his proposed economic reforms.
The Fund’s overweight position in equities and underweight position in fixed income had a positive impact on performance. Major government fixed-income markets posted modest losses during the period, with the exception of the U.K. Benchmark yields in most markets climbed amid optimism about faster global economic growth and inflation, especially after Trump won the U.S. presidency based on promises of deregulation, increased government spending and tax reform. However, investors gravitated to U.K. government debt after the decision by U.K. voters to leave the European Union (“Brexit”) prompted the Bank of England to cut interest rates on fears that economic growth might decelerate. While government bonds declined over the period, non-government bonds posted strong gains. As a result, the Fund’s performance benefited from holdings in the RBC Global High Yield Bond Fund, the BlueBay Global Monthly Income Bond Fund and the RBC Global Corporate Bond Fund.
Major equity markets posted double-digit gains, led by North America and emerging markets on optimism that economies around the world were gathering momentum. Surprisingly strong economic data, surging consumer and business confidence, and better-than-expected earnings propelled stocks higher. U.K. stocks lagged in Canadian-dollar terms after the Brexit vote. The Fund’s returns were aided by holdings in the RBC Emerging Markets Dividend Fund and the RBC European Dividend Fund, as well as exposure to U.S. equities.
Recent DevelopmentsLeading economic indicators are at their best levels in several years, economic surprises have been overwhelmingly positive and corporate earnings continue to recover from their prior stumbles. As a result, risk assets such as equities and corporate credit have performed well. The portfolio manager expects bond yields to rise, resulting in low or potentially negative fixed-income returns over the years ahead, and therefore the Fund remains underweight bonds. Long-term expected returns for stocks are more attractive, accounting for the Fund’s equity overweight. In the near term, however, uncertainty surrounding U.S. public policy and a variety of style and technical factors have led the portfolio manager to reduce the Fund’s exposure to stocks, where it remains overweight, but a little less so than before.
On December 15, 2016, the Canadian government enacted new tax rules that eliminate the ability of investors to switch among different classes of RBC Corporate Class Funds on a tax-deferred basis. The new rules do not apply to switches between different series of the same fund.
RBC BALANCED GROWTH & INCOME CLASS
41

ANNUAL MANAGEMENT REPORT OF FUND PERFORMANCE
March 31, 2017
42
RBC BALANCED GROWTH & INCOME CLASS
Effective December 1, 2016, Mr. Lloyd R. McGinnis retired and Ms. Élaine Cousineau was appointed as Chair of the Independent Review Committee (the “IRC”). Mr. Charles F. Macfarlane was appointed as Vice Chair of the IRC. Effective January 1, 2017, Ms. Suromitra Sanatani and Ms. Catherine Kloepfer were appointed as members of the IRC.
Effective July 1, 2016, Deloitte LLP resigned and PricewaterhouseCoopers LLP was appointed as auditors of the Fund.
Effective June 30, 2016, Series H mutual fund shares and Series I mutual fund shares were closed to all investors.
Related-Party TransactionsManager and Portfolio ManagerRBC GAM is an indirect, wholly owned subsidiary of Royal Bank of Canada (“Royal Bank”) and is the manager and portfolio manager of the Fund. RBC GAM is responsible for the Fund’s day-to-day operations, provides investment advice and portfolio management services to the Fund and appoints distributors for the Fund. RBC GAM is paid a management fee by the Fund as compensation for its services. The Fund pays a fixed administration fee to RBC GAM, which, in turn, pays certain operating expenses of the Fund.
Affiliates of RBC GAM that provide services to the Fund in the course of their normal businesses are discussed below.
DistributorsRBC GAM, Royal Mutual Funds Inc., RBC Direct Investing Inc., RBC Dominion Securities Inc. and Phillips, Hager & North Investment Funds Ltd. are the principal distributors of, or distribute certain series of the mutual fund shares of, the Fund. Dealers receive an ongoing commission based on the total value of their clients’ Series A, Advisor Series, Advisor T5 Series and Series T5 mutual fund shares.
CustodianRBC Investor Services Trust (“RBC IS”) is the custodian and holds the assets of the Fund.
RegistrarsRoyal Bank, RBC IS and RBC GAM are the registrars of the Fund and keep records of who owns the mutual fund shares of the Fund.
Other Related-Party TransactionsPursuant to applicable securities legislation, the Fund relied on the standing instructions from the Independent Review Committee with respect to one or more of the following transactions:
Related-Party Trading Activities(a) trades in securities of Royal Bank;
(b) investments in the securities of issuers for which a related-party dealer acted as an underwriter during the distribution of such securities and the 60-day period following the conclusion of such distribution of the underwritten securities to the public;
(c) purchases of equity and debt securities from or sales of equity or debt securities to a related-party dealer, where it acted as principal; and
Inter-Fund Trading(d) purchases or sales of securities of an issuer from or to another
investment fund or managed account managed by RBC GAM.
The applicable standing instructions require that Related-Party Trading Activities and Inter-Fund Trading be conducted in accordance with RBC GAM policy and that RBC GAM advise the Independent Review Committee of a material breach of any standing instruction. RBC GAM policy requires that an investment decision in respect of Related-Party Trading Activities (i) is made free from any influence of Royal Bank or its associates or affiliates and without taking into account any consideration relevant to Royal Bank or its affiliates or associates, (ii) represents the business judgment of the portfolio manager, uninfluenced by considerations other than the best interests of the Fund, (iii) is in compliance with RBC GAM policies and procedures, and (iv) achieves a fair and reasonable result for the Fund. RBC GAM policy requires that an investment decision in respect of Inter-Fund Trading is in the best interests of each Fund.
42

ANNUAL MANAGEMENT REPORT OF FUND PERFORMANCE
March 31, 2017
43
RBC BALANCED GROWTH & INCOME CLASS
FINANCIAL HIGHLIGHTS The following tables show selected key financial information about the Fund and are intended to help you understand the Fund’s financial performance for the past five years or for the periods since inception. This information is derived from the Fund’s audited annual financial statements. For financial years beginning on or after April 1, 2014, financial highlight information is derived from financial statements prepared in compliance with International Financial Reporting Standards (“IFRS”). For financial years prior to April 1, 2014, financial highlight information is derived from financial statements prepared in accordance with Canadian generally accepted accounting principles (“GAAP”). “Net Assets,” for the periods prior to April 1, 2014, are calculated in accordance with GAAP, and “Net Asset Value” is derived from the valuation method disclosed in the RBC Corporate Class Funds Annual Information Form and is used for transactional purposes (see Ratios and Supplemental Data). All other calculations for the purposes of this MRFP are made using Net Asset Value. There is no significant difference between “Net Assets” and “Net Asset Value” under IFRS.
Change in Net Assets Per Mutual Fund Share ($)
Annual Distributions2
Increase (Decrease) from Operations1 From Total Realized Unrealized Income From Net Assets For the Year/ Net Assets Revenue Total Gains Gains (Excluding From Capital Return End of Period Ended Beginning of Year/Period (Loss) Expenses (Losses) (Losses) Total Dividends) Dividends Gains of Capital Total Year/Period
Series AMar. 31, 2017 9.57 0.31 (0.20) 0.06 1.05 1.22 – (0.04) – – (0.04) 10.73 Mar. 31, 20163 10.00† 0.34 (0.18) 0.07 (0.40) (0.17) – (0.04) – – (0.04) 9.57
Advisor SeriesMar. 31, 2017 9.56 0.31 (0.20) 0.06 1.07 1.24 – (0.05) – – (0.05) 10.72Mar. 31, 20163 10.00† 0.39 (0.18) 0.08 (0.46) (0.17) – (0.06) – – (0.06) 9.56
Advisor T5 SeriesMar. 31, 2017 9.13 0.29 (0.19) 0.05 1.00 1.15 – (0.05) – (0.42) (0.47) 9.79Mar. 31, 20163 10.00† 0.39 (0.18) 0.08 (0.46) (0.17) – (0.32) – (0.17) (0.49) 9.13
Series T5Mar. 31, 2017 9.12 0.29 (0.19) 0.05 0.97 1.12 – (0.05) – (0.42) (0.47) 9.77Mar. 31, 20163 10.00† 0.31 (0.18) 0.07 (0.37) (0.17) – (0.29) – (0.20) (0.49) 9.12
Series FMar. 31, 2017 9.55 0.31 (0.09) 0.06 1.09 1.37 – (0.07) – – (0.07) 10.80Mar. 31, 20163 10.00† 0.35 (0.08) 0.08 (0.42) (0.07) – (0.16) – – (0.16) 9.55
Series FT5Mar. 31, 2017 9.22 0.29 (0.09) 0.05 1.04 1.29 – (0.05) – (0.42) (0.47) 10.00Mar. 31, 20163 10.00† 0.33 (0.08) 0.07 (0.40) (0.08) – (0.30) – (0.19) (0.49) 9.22
Series OMar. 31, 2017 9.55 0.32 – 0.06 1.04 1.42 – (0.08) – – (0.08) 10.88Mar. 31, 20163 10.00† 1.29 (0.01) 0.28 (1.52) 0.04 – (0.25) – – (0.25) 9.55
1 Net assets and distributions are based on the actual number of mutual fund shares outstanding at the relevant time. The increase/decrease from operations is based on the weighted average number of mutual fund shares outstanding over the financial period. This table is not intended to be a reconciliation of beginning to ending net assets per mutual fund share.
2 Distributions are reinvested in additional mutual fund shares of the Fund or paid in cash.3 From April 8, 2015.† Initial offering net asset value per mutual fund share.
43
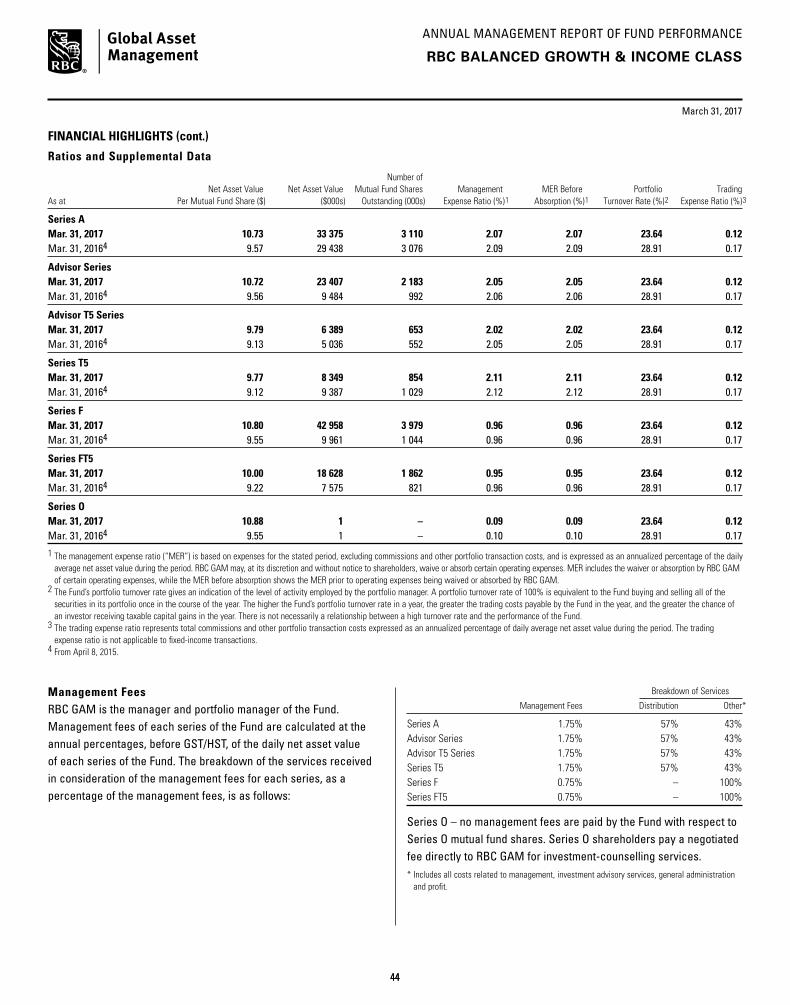
ANNUAL MANAGEMENT REPORT OF FUND PERFORMANCE
March 31, 2017
44
RBC BALANCED GROWTH & INCOME CLASS
FINANCIAL HIGHLIGHTS (cont.)
Ratios and Supplemental Data
Number of Net Asset Value Net Asset Value Mutual Fund Shares Management MER Before Portfolio TradingAs at Per Mutual Fund Share ($) ($000s) Outstanding (000s) Expense Ratio (%)1 Absorption (%)1 Turnover Rate (%)2 Expense Ratio (%)3
Series AMar. 31, 2017 10.73 33 375 3 110 2.07 2.07 23.64 0.12 Mar. 31, 20164 9.57 29 438 3 076 2.09 2.09 28.91 0.17
Advisor SeriesMar. 31, 2017 10.72 23 407 2 183 2.05 2.05 23.64 0.12Mar. 31, 20164 9.56 9 484 992 2.06 2.06 28.91 0.17
Advisor T5 SeriesMar. 31, 2017 9.79 6 389 653 2.02 2.02 23.64 0.12Mar. 31, 20164 9.13 5 036 552 2.05 2.05 28.91 0.17
Series T5Mar. 31, 2017 9.77 8 349 854 2.11 2.11 23.64 0.12Mar. 31, 20164 9.12 9 387 1 029 2.12 2.12 28.91 0.17
Series FMar. 31, 2017 10.80 42 958 3 979 0.96 0.96 23.64 0.12Mar. 31, 20164 9.55 9 961 1 044 0.96 0.96 28.91 0.17
Series FT5Mar. 31, 2017 10.00 18 628 1 862 0.95 0.95 23.64 0.12Mar. 31, 20164 9.22 7 575 821 0.96 0.96 28.91 0.17
Series OMar. 31, 2017 10.88 1 – 0.09 0.09 23.64 0.12Mar. 31, 20164 9.55 1 – 0.10 0.10 28.91 0.17
1 The management expense ratio (“MER”) is based on expenses for the stated period, excluding commissions and other portfolio transaction costs, and is expressed as an annualized percentage of the daily average net asset value during the period. RBC GAM may, at its discretion and without notice to shareholders, waive or absorb certain operating expenses. MER includes the waiver or absorption by RBC GAM of certain operating expenses, while the MER before absorption shows the MER prior to operating expenses being waived or absorbed by RBC GAM.
2 The Fund’s portfolio turnover rate gives an indication of the level of activity employed by the portfolio manager. A portfolio turnover rate of 100% is equivalent to the Fund buying and selling all of the securities in its portfolio once in the course of the year. The higher the Fund’s portfolio turnover rate in a year, the greater the trading costs payable by the Fund in the year, and the greater the chance of an investor receiving taxable capital gains in the year. There is not necessarily a relationship between a high turnover rate and the performance of the Fund.
3 The trading expense ratio represents total commissions and other portfolio transaction costs expressed as an annualized percentage of daily average net asset value during the period. The trading expense ratio is not applicable to fixed-income transactions.
4 From April 8, 2015.
Management Fees RBC GAM is the manager and portfolio manager of the Fund. Management fees of each series of the Fund are calculated at the annual percentages, before GST/HST, of the daily net asset value of each series of the Fund. The breakdown of the services received in consideration of the management fees for each series, as a percentage of the management fees, is as follows:
Breakdown of Services
Management Fees Distribution Other*
Series A 1.75% 57% 43%Advisor Series 1.75% 57% 43%Advisor T5 Series 1.75% 57% 43%Series T5 1.75% 57% 43%Series F 0.75% – 100%Series FT5 0.75% – 100%
Series O – no management fees are paid by the Fund with respect to Series O mutual fund shares. Series O shareholders pay a negotiated fee directly to RBC GAM for investment-counselling services.* Includes all costs related to management, investment advisory services, general administration
and profit.
44

ANNUAL MANAGEMENT REPORT OF FUND PERFORMANCE
45
March 31, 2017
PAST PERFORMANCEThe performance information shown assumes that all distributions made by the Fund in the periods shown were reinvested in additional shares of the Fund and would be lower if distributions were not reinvested. The performance information does not take into account sales, redemption, distribution, optional charges or income taxes payable that would have reduced returns or performance. Past performance does not necessarily indicate how the Fund may perform in the future. A fund with more than 10 years of performance history is only permitted to disclose the past 10 years.
Year-by-Year Returns (%) The bar chart indicates the Fund’s performance for each of the years shown, and illustrates how the Fund’s performance has changed from year to year. The bar chart shows, in percentage terms, how much an investment made on the first day of each financial year would have grown or decreased by the end of the financial year.
RBC BALANCED GROWTH & INCOME CLASS
45

ANNUAL MANAGEMENT REPORT OF FUND PERFORMANCE
46
March 31, 2017
RBC BALANCED GROWTH & INCOME CLASS
PAST PERFORMANCE (cont.)Annual Compound Returns (%) The table shows the annual compound returns for each series of the Fund and for each of the periods indicated ended on March 31, 2017, compared with the following benchmarks:
The blended benchmark (the “Benchmark”) is composed of:
40% FTSE TMX Canada Universe Bond Index25% S&P/TSX Capped Composite Total Return Index20% S&P 500 Total Return Index (CAD)10% MSCI Emerging Markets Total Return Net Index (CAD)5% MSCI Europe Total Return Net Index (CAD)
The broad-based index is the FTSE TMX Canada Universe Bond Index.
Past Past Past Past Since Year 3 Years 5 Years 10 Years Inception
Series A 12.6 – – – 4.2Benchmark 11.9 – – – 5.3Broad-based index 1.5 – – – 1.9
Advisor Series 12.6 – – – 4.2Benchmark 11.9 – – – 5.3Broad-based index 1.5 – – – 1.9
Advisor T5 Series 12.6 – – – 4.2Benchmark 11.9 – – – 5.3Broad-based index 1.5 – – – 1.9
Series T5 12.5 – – – 4.1Benchmark 11.9 – – – 5.3Broad-based index 1.5 – – – 1.9
Series F 13.8 – – – 5.3Benchmark 11.9 – – – 5.3Broad-based index 1.5 – – – 1.9
Series FT5 13.9 – – – 5.3Benchmark 11.9 – – – 5.3Broad-based index 1.5 – – – 1.9
Series O 14.8 – – – 6.2Benchmark 11.9 – – – 5.3Broad-based index 1.5 – – – 1.9
The returns of each series may vary because of differences in management fees and expenses. The Benchmark and broad-based index returns do not include any costs of investing. See Management Discussion of Fund Performance for a discussion of performance relative to the Benchmark and broad-based index.
Series A, Advisor Series, Advisor T5 Series, Series T5, Series F, Series FT5 and Series O mutual fund shares have been available for sale to shareholders since April 20, 2015.
Inception dates are not provided for series that have been in existence for more than 10 years.
INDEX DESCRIPTIONSFTSE TMX Canada Universe Bond Index This index is designed as a broad measure of the Canadian investment-grade fixed-income market and includes bonds with maturities of at least one year.S&P/TSX Capped Composite Total Return Index This index is the amended capitalization weighted index measuring the performance of selected securities listed on the Toronto Stock Exchange, with no individual stock exceeding 10% of the overall weight.S&P 500 Total Return Index (CAD) This index is a capitalization-weighted index measuring the Canadian dollar performance of 500 widely held common stocks representing all major industries in the United States. The index gives investors a broad measure of the overall performance of the U.S. stock market.
MSCI Emerging Markets Total Return Net Index (CAD) This index is a broad measure of the Canadian dollar performance of emerging-market equities. As of May 2010, the index consisted of the following 21 emerging-market country indexes: Brazil, Chile, China, Colombia, Czech Republic, Egypt, Hungary, India, Indonesia, South Korea, Malaysia, Mexico, Morocco, Peru, Philippines, Poland, Russia, South Africa, Taiwan, Thailand and Turkey. The net total return index reinvests dividends after the deduction of withholding taxes, using (for international indexes) a tax rate applicable to non-resident institutional investors who do not benefit from double taxation treaties. MSCI Europe Total Return Net Index (CAD) This index is a broad measure of the Canadian dollar performance of major stock markets in Europe. The net total return index reinvests dividends after the deduction of withholding taxes, using (for international indexes) a tax rate applicable to non-resident institutional investors who do not benefit from double taxation treaties.
SUMMARY OF INVESTMENT PORTFOLIO(after consideration of derivative products, if any)As at March 31, 2017
Investment Mix % of Net Asset Value
Income Funds 34.1Canadian Equity Funds 29.3United States Equity Funds 20.5International Equity Funds 15.8Cash/Other 0.3
Top 25 Holdings* % of Net Asset Value
RBC Canadian Equity Income Fund 29.2RBC U.S. Dividend Fund 20.5Phillips, Hager & North Total Return Bond Fund 12.5RBC Emerging Markets Dividend Fund 9.6RBC Global Corporate Bond Fund 8.5RBC Global High Yield Bond Fund 6.5BlueBay Global Monthly Income Bond Fund 6.5RBC European Dividend Fund 6.2Cash & Cash Equivalents 0.5Total 100.0
* The Fund holds fewer than 25 holdings.
The Summary of Investment Portfolio may change due to ongoing portfolio transactions of the Fund and a quarterly update is available at www.rbcgam.com/funds.
The Simplified Prospectus and other information about the underlying funds are available on SEDAR website at www.sedar.com.
46

ANNUAL MANAGEMENT REPORT OF FUND PERFORMANCE
47
CANADIAN EQUITY FUND
RBC CANADIAN DIVIDEND CLASS
March 31, 2017
Portfolio Manager RBC Global Asset Management Inc. (“RBC GAM”)
This annual management report of fund performance (“MRFP”) contains financial highlights but does not contain the complete annual financial statements of the Fund. You can get a copy of the financial statements at your request, and at no cost, by calling 1-800-463-FUND (3863), by writing to us at RBC Global Asset Management Inc., P.O. Box 7500, Station A, Toronto, Ontario M5W 1P9, or by visiting our website at www.rbcgam.com/reports or SEDAR at www.sedar.com. Security holders may also contact us using one of these methods to request a copy of the Fund’s proxy voting policies and procedures, proxy voting disclosure record, or quarterly portfolio disclosure.
The Board of Directors of RBC Corporate Class Inc. approved this annual management report of fund performance on May 11, 2017.
A Note on Forward-looking Statements
This report may contain forward-looking statements about the Fund, its future performance, strategies or prospects, and possible future Fund action. The words “may,” “could,” “should,” “would,” “suspect,” “outlook,” “believe,” “plan,” “anticipate,” “estimate,” “expect,” “intend,” “forecast,” “objective” and similar expressions are intended to identify forward-looking statements.
Forward-looking statements are not guarantees of future performance. Forward-looking statements involve inherent risks and uncertainties, both about the Fund and general economic factors, so it is possible that predictions, forecasts, projections and other forward-looking statements will not be achieved. We caution you not to place undue reliance on these statements as a number of important factors could cause actual events or results to differ materially from those expressed or implied in any forward-looking statement made in relation to the Fund. These factors include, but are not limited to, general economic, political and market factors in Canada, the United States and internationally, interest and foreign exchange rates, global equity and capital markets, business competition, technological changes, changes in laws and regulations, judicial or regulatory judgments, legal proceedings and catastrophic events.
The above list of important factors that may affect future results is not exhaustive. Before making any investment decisions, we encourage you to consider these and other factors carefully. All opinions contained in forward-looking statements are subject to change without notice and are provided in good faith but without legal responsibility.
47

ANNUAL MANAGEMENT REPORT OF FUND PERFORMANCE
March 31, 2017
48
MANAGEMENT DISCUSSION OF FUND PERFORMANCE
Investment Objective and StrategiesThe Fund seeks to achieve long-term total returns consisting of regular dividend income, which benefits from the preferential tax treatment given to dividends from Canadian companies, and modest long-term capital growth.
To achieve its investment objective, the Fund invests most of its assets in the RBC Private Canadian Dividend Pool and/or the RBC Canadian Dividend Fund (the “underlying funds”). The underlying funds invest primarily in common shares with above-average dividend yields and also invest in preferred shares of major Canadian companies. The underlying funds select companies with long-term prospects of growing their dividends and tend to focus on interest-sensitive securities to achieve dividend income, primarily investing in the Financials, Telecommunication Services and Utilities sectors.
RiskThere were no significant changes to the investment objective and strategies that affected the Fund’s overall level of risk during the reporting period. The risks of investing in the Fund and the suitability of the Fund for investors remain as discussed in the Simplified Prospectus.
Results of OperationsThe Fund’s net asset value rose to $137 million as of March 31, 2017, from $118 million as of March 31, 2016. The increase was due to investment returns.
Over the past year, the Fund’s Series A shares gained 15.9%, which underperformed the 18.6% rise in the benchmark. The Fund’s return is after the deduction of fees and expenses, while the benchmark and broad-based index returns do not include any costs of investing. See the Financial Highlights section for the management expense ratios and the Past Performance section for the returns of any other series, which may vary because of differences in management fees and expenses.
During the period, the S&P/TSX Composite Index, Canada’s equity benchmark, outperformed most other global indexes, as heavyweight sectors Financials, Energy and Materials all strengthened. Crude-oil prices recovered from levels that were well below the marginal cost of production, and increased further following OPEC’s announced plans to cut its output. Investors were preoccupied with persistent concerns over the unabated surge in prices for Canadian residential real estate, the failure of manufacturing to take the reins from energy as the driver of Canadian economic growth and expectations that interest-rate increases in Canada are likely to lag the U.S. Financial stocks moved higher in the U.S. on the rise of interest rates and the potential for less regulation. The Canadian Financials sector performed well with Canadian banks gaining 30% over 2016. Shares of lumber and copper producers also performed strongly, benefiting from the rise in the underlying commodities.
The Fund had underweight exposure to Materials stocks, which appreciated during the second half of the period resulting in a drag on the Fund’s returns. Gold stocks as a whole have historically been difficult for dividend investors to own, as the sector has not been a reliable source of dividends.
During the period, the Fund benefited from overweight exposure to the Utilities sector. An overweight position in Brookfield Infrastructure Partners aided returns, as the company has benefited from planned infrastructure spending in numerous areas. The Fund also had underweight exposure to the Health Care sector, which was helped by a lack of exposure to Valeant Pharmaceuticals and Concordia International.
In the Telecommunication Services sector, the Fund benefited from an underweight position in BCE, which faced pressure amid increased capital expenditures and scrutiny of its acquisition of MTS.
Recent DevelopmentsMarket valuations, although elevated in absolute terms, are not inconsistent with a low-interest-rate, low-inflation environment. That said, the portfolio manager believes earnings acceleration will now be a key focus. In the Financials sector, the success of the Canadian banks’ non-domestic businesses will likely be a key differentiator of performance. Concurrently, while OPEC’s plan to cut output is a positive for the Energy sector, the portfolio manager will be watching the U.S. shale sector for signs of re-acceleration as the year progresses. The portfolio manager continues to believe that large companies with long-life reserves and strong balance sheets will deliver attractive levels of free cash as crude-oil prices stabilize.
On December 15, 2016, the Canadian government enacted new tax rules that eliminate the ability of investors to switch among different classes of RBC Corporate Class Funds on a tax-deferred basis. The new rules do not apply to switches between different series of the same fund.
Effective December 1, 2016, Mr. Lloyd R. McGinnis retired and Ms. Élaine Cousineau was appointed as Chair of the Independent Review Committee (the “IRC”). Mr. Charles F. Macfarlane was appointed as Vice Chair of the IRC. Effective January 1, 2017, Ms. Suromitra Sanatani and Ms. Catherine Kloepfer were appointed as members of the IRC.
Effective July 1, 2016, Deloitte LLP resigned and PricewaterhouseCoopers LLP was appointed as auditors of the Fund.
Effective June 30, 2016, management fees were reduced as follows: from 1.00% to 0.85% in respect of Series D mutual fund shares; and from 0.75% to 0.60% in respect of Series F mutual fund shares. Also effective June 30, 2016, Series H mutual fund shares were closed to all investors, and Series I mutual fund shares were re-designated to Series F mutual fund shares.
RBC CANADIAN DIVIDEND CLASS
48

ANNUAL MANAGEMENT REPORT OF FUND PERFORMANCE
March 31, 2017
49
RBC CANADIAN DIVIDEND CLASS
Related-Party TransactionsManager and Portfolio ManagerRBC GAM is an indirect, wholly owned subsidiary of Royal Bank of Canada (“Royal Bank”) and is the manager and portfolio manager of the Fund. RBC GAM is responsible for the Fund’s day-to-day operations, provides investment advice and portfolio management services to the Fund and appoints distributors for the Fund. RBC GAM is paid a management fee by the Fund as compensation for its services. The Fund pays a fixed administration fee to RBC GAM, which, in turn, pays certain operating expenses of the Fund.
Affiliates of RBC GAM that provide services to the Fund in the course of their normal businesses are discussed below.
DistributorsRBC GAM, Royal Mutual Funds Inc., RBC Direct Investing Inc., RBC Dominion Securities Inc. and Phillips, Hager & North Investment Funds Ltd. are the principal distributors of, or distribute certain series of the mutual fund shares of, the Fund. Dealers receive an ongoing commission based on the total value of their clients’ Series A, Advisor Series and Series D mutual fund shares.
CustodianRBC Investor Services Trust (“RBC IS”) is the custodian and holds the assets of the Fund.
RegistrarsRoyal Bank, RBC IS and RBC GAM are the registrars of the Fund and keep records of who owns the mutual fund shares of the Fund.
Other Related-Party TransactionsPursuant to applicable securities legislation, the Fund relied on the standing instructions from the Independent Review Committee with respect to one or more of the following transactions:
Related-Party Trading Activities(a) trades in securities of Royal Bank;
(b) investments in the securities of issuers for which a related-party dealer acted as an underwriter during the distribution of such securities and the 60-day period following the conclusion of such distribution of the underwritten securities to the public;
(c) purchases of equity and debt securities from or sales of equity or debt securities to a related-party dealer, where it acted as principal; and
Inter-Fund Trading(d) purchases or sales of securities of an issuer from or to another
investment fund or managed account managed by RBC GAM.
The applicable standing instructions require that Related-Party Trading Activities and Inter-Fund Trading be conducted in accordance with RBC GAM policy and that RBC GAM advise the Independent Review Committee of a material breach of any standing instruction. RBC GAM policy requires that an investment decision in respect of Related-Party Trading Activities (i) is made free from any influence of Royal Bank or its associates or affiliates and without taking into account any consideration relevant to Royal Bank or its affiliates or associates, (ii) represents the business judgment of the portfolio manager, uninfluenced by considerations other than the best interests of the Fund, (iii) is in compliance with RBC GAM policies and procedures, and (iv) achieves a fair and reasonable result for the Fund. RBC GAM policy requires that an investment decision in respect of Inter-Fund Trading is in the best interests of each Fund.
49
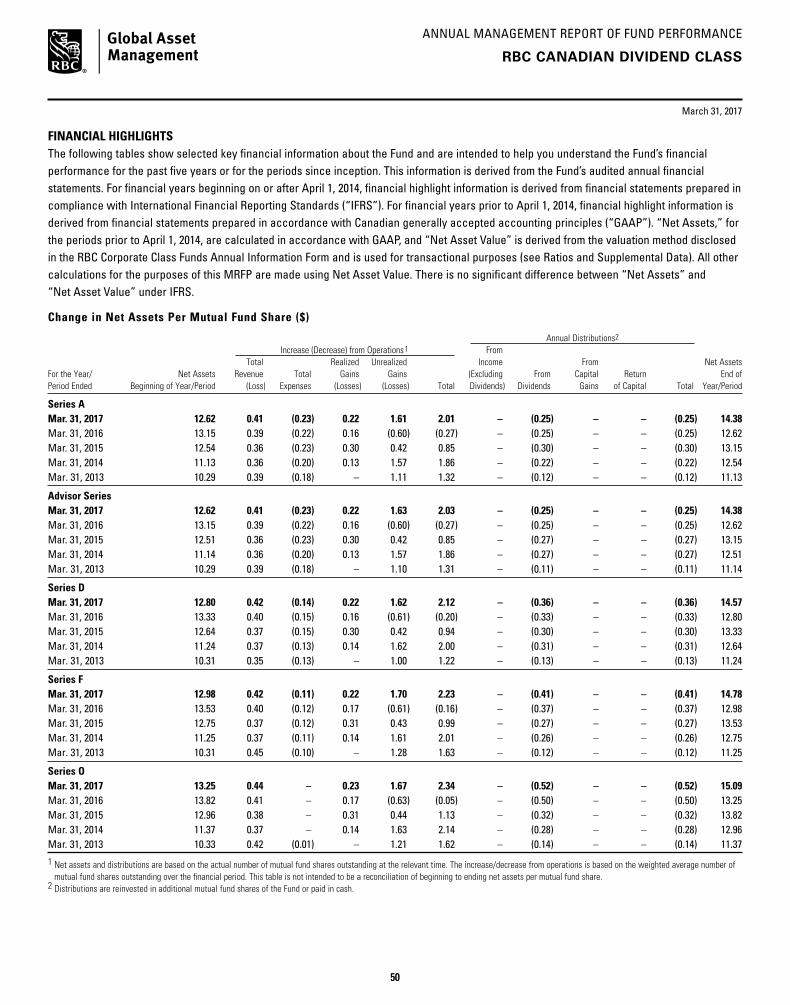
ANNUAL MANAGEMENT REPORT OF FUND PERFORMANCE
March 31, 2017
50
FINANCIAL HIGHLIGHTS The following tables show selected key financial information about the Fund and are intended to help you understand the Fund’s financial performance for the past five years or for the periods since inception. This information is derived from the Fund’s audited annual financial statements. For financial years beginning on or after April 1, 2014, financial highlight information is derived from financial statements prepared in compliance with International Financial Reporting Standards (“IFRS”). For financial years prior to April 1, 2014, financial highlight information is derived from financial statements prepared in accordance with Canadian generally accepted accounting principles (“GAAP”). “Net Assets,” for the periods prior to April 1, 2014, are calculated in accordance with GAAP, and “Net Asset Value” is derived from the valuation method disclosed in the RBC Corporate Class Funds Annual Information Form and is used for transactional purposes (see Ratios and Supplemental Data). All other calculations for the purposes of this MRFP are made using Net Asset Value. There is no significant difference between “Net Assets” and “Net Asset Value” under IFRS.
Change in Net Assets Per Mutual Fund Share ($)
Annual Distributions2
Increase (Decrease) from Operations1 From Total Realized Unrealized Income From Net Assets For the Year/ Net Assets Revenue Total Gains Gains (Excluding From Capital Return End of Period Ended Beginning of Year/Period (Loss) Expenses (Losses) (Losses) Total Dividends) Dividends Gains of Capital Total Year/Period
Series AMar. 31, 2017 12.62 0.41 (0.23) 0.22 1.61 2.01 – (0.25) – – (0.25) 14.38 Mar. 31, 2016 13.15 0.39 (0.22) 0.16 (0.60) (0.27) – (0.25) – – (0.25) 12.62Mar. 31, 2015 12.54 0.36 (0.23) 0.30 0.42 0.85 – (0.30) – – (0.30) 13.15Mar. 31, 2014 11.13 0.36 (0.20) 0.13 1.57 1.86 – (0.22) – – (0.22) 12.54Mar. 31, 2013 10.29 0.39 (0.18) – 1.11 1.32 – (0.12) – – (0.12) 11.13
Advisor SeriesMar. 31, 2017 12.62 0.41 (0.23) 0.22 1.63 2.03 – (0.25) – – (0.25) 14.38Mar. 31, 2016 13.15 0.39 (0.22) 0.16 (0.60) (0.27) – (0.25) – – (0.25) 12.62Mar. 31, 2015 12.51 0.36 (0.23) 0.30 0.42 0.85 – (0.27) – – (0.27) 13.15Mar. 31, 2014 11.14 0.36 (0.20) 0.13 1.57 1.86 – (0.27) – – (0.27) 12.51Mar. 31, 2013 10.29 0.39 (0.18) – 1.10 1.31 – (0.11) – – (0.11) 11.14
Series DMar. 31, 2017 12.80 0.42 (0.14) 0.22 1.62 2.12 – (0.36) – – (0.36) 14.57Mar. 31, 2016 13.33 0.40 (0.15) 0.16 (0.61) (0.20) – (0.33) – – (0.33) 12.80Mar. 31, 2015 12.64 0.37 (0.15) 0.30 0.42 0.94 – (0.30) – – (0.30) 13.33Mar. 31, 2014 11.24 0.37 (0.13) 0.14 1.62 2.00 – (0.31) – – (0.31) 12.64Mar. 31, 2013 10.31 0.35 (0.13) – 1.00 1.22 – (0.13) – – (0.13) 11.24
Series FMar. 31, 2017 12.98 0.42 (0.11) 0.22 1.70 2.23 – (0.41) – – (0.41) 14.78Mar. 31, 2016 13.53 0.40 (0.12) 0.17 (0.61) (0.16) – (0.37) – – (0.37) 12.98Mar. 31, 2015 12.75 0.37 (0.12) 0.31 0.43 0.99 – (0.27) – – (0.27) 13.53Mar. 31, 2014 11.25 0.37 (0.11) 0.14 1.61 2.01 – (0.26) – – (0.26) 12.75Mar. 31, 2013 10.31 0.45 (0.10) – 1.28 1.63 – (0.12) – – (0.12) 11.25
Series OMar. 31, 2017 13.25 0.44 – 0.23 1.67 2.34 – (0.52) – – (0.52) 15.09Mar. 31, 2016 13.82 0.41 – 0.17 (0.63) (0.05) – (0.50) – – (0.50) 13.25Mar. 31, 2015 12.96 0.38 – 0.31 0.44 1.13 – (0.32) – – (0.32) 13.82Mar. 31, 2014 11.37 0.37 – 0.14 1.63 2.14 – (0.28) – – (0.28) 12.96Mar. 31, 2013 10.33 0.42 (0.01) – 1.21 1.62 – (0.14) – – (0.14) 11.37
1 Net assets and distributions are based on the actual number of mutual fund shares outstanding at the relevant time. The increase/decrease from operations is based on the weighted average number of mutual fund shares outstanding over the financial period. This table is not intended to be a reconciliation of beginning to ending net assets per mutual fund share.
2 Distributions are reinvested in additional mutual fund shares of the Fund or paid in cash.
RBC CANADIAN DIVIDEND CLASS
50

ANNUAL MANAGEMENT REPORT OF FUND PERFORMANCE
March 31, 2017
51
RBC CANADIAN DIVIDEND CLASS
FINANCIAL HIGHLIGHTS (cont.)
Ratios and Supplemental Data
Number of Net Asset Value Net Asset Value Mutual Fund Shares Management MER Before Portfolio TradingAs at Per Mutual Fund Share ($) ($000s) Outstanding (000s) Expense Ratio (%)1 Absorption (%)1 Turnover Rate (%)2 Expense Ratio (%)3
Series AMar. 31, 2017 14.38 41 595 2 892 1.77 1.77 10.79 0.03 Mar. 31, 2016 12.62 41 246 3 268 1.79 1.79 18.24 0.05Mar. 31, 2015 13.15 45 127 3 432 1.79 1.80 15.83 0.03Mar. 31, 2014 12.54 34 093 2 719 1.82 1.82 12.67 0.03Mar. 31, 2013 11.13 16 519 1 500 1.80 1.81 2.47 0.05
Advisor SeriesMar. 31, 2017 14.38 10 100 702 1.79 1.79 10.79 0.03Mar. 31, 2016 12.62 7 735 613 1.79 1.79 18.24 0.05Mar. 31, 2015 13.15 7 208 548 1.78 1.79 15.83 0.03Mar. 31, 2014 12.51 4 961 397 1.82 1.82 12.67 0.03Mar. 31, 2013 11.14 2 170 197 1.79 1.80 2.47 0.05
Series DMar. 31, 2017 14.57 17 432 1 197 1.084 1.08 10.79 0.03Mar. 31, 2016 12.80 14 166 1 107 1.21 1.21 18.24 0.05Mar. 31, 2015 13.33 13 551 1 016 1.20 1.21 15.83 0.03 Mar. 31, 2014 12.64 10 711 848 1.20 1.20 12.67 0.03Mar. 31, 2013 11.24 8 163 735 1.23 1.24 2.47 0.05
Series FMar. 31, 2017 14.78 25 917 1 753 0.814 0.81 10.79 0.03Mar. 31, 2016 12.98 7 199 555 0.97 0.97 18.24 0.05Mar. 31, 2015 13.53 5 397 399 0.97 0.98 15.83 0.03 Mar. 31, 2014 12.75 3 461 272 0.98 0.98 12.67 0.03Mar. 31, 2013 11.25 2 326 209 0.97 0.98 2.47 0.05
Series OMar. 31, 2017 15.09 41 768 2 768 0.10 0.10 10.79 0.03Mar. 31, 2016 13.25 33 861 2 555 0.11 0.11 18.24 0.05Mar. 31, 2015 13.82 24 008 1 738 0.10 0.11 15.83 0.03 Mar. 31, 2014 12.96 21 725 1 677 0.11 0.11 12.67 0.03Mar. 31, 2013 11.37 14 967 1 332 0.11 0.12 2.47 0.05
1 The management expense ratio (“MER”) is based on expenses for the stated period, excluding commissions and other portfolio transaction costs, and is expressed as an annualized percentage of the daily average net asset value during the period. RBC GAM may, at its discretion and without notice to shareholders, waive or absorb certain operating expenses. MER includes the waiver or absorption by RBC GAM of certain operating expenses, while the MER before absorption shows the MER prior to operating expenses being waived or absorbed by RBC GAM.
2 The Fund’s portfolio turnover rate gives an indication of the level of activity employed by the portfolio manager. A portfolio turnover rate of 100% is equivalent to the Fund buying and selling all of the securities in its portfolio once in the course of the year. The higher the Fund’s portfolio turnover rate in a year, the greater the trading costs payable by the Fund in the year, and the greater the chance of an investor receiving taxable capital gains in the year. There is not necessarily a relationship between a high turnover rate and the performance of the Fund.
3 The trading expense ratio represents total commissions and other portfolio transaction costs expressed as an annualized percentage of daily average net asset value during the period. The trading expense ratio is not applicable to fixed-income transactions.
4 Effective June 30, 2016, the management fee was changed in respect of certain series of the Fund. If the change to the management fee would have been in effect throughout 2016, the adjusted MER for each series of the Fund would be: Series D – 1.04% and Series F – 0.79%.
51

ANNUAL MANAGEMENT REPORT OF FUND PERFORMANCE
52
March 31, 2017
FINANCIAL HIGHLIGHTS (cont.)
Management Fees RBC GAM is the manager and portfolio manager of the Fund. Management fees of each series of the Fund are calculated at the annual percentages, before GST/HST, of the daily net asset value of each series of the Fund. The breakdown of the services received in consideration of the management fees for each series, as a percentage of the management fees, is as follows:
Breakdown of Services
Management Fees Distribution Other*
Series A 1.50% 67% 33% Advisor Series 1.50% 67% 33% Series D 0.85% 25% 75%Series F 0.60% – 100%
Series O – no management fees are paid by the Fund with respect to Series O mutual fund shares. Series O shareholders pay a negotiated fee directly to RBC GAM for investment-counselling services.* Includes all costs related to management, investment advisory services, general administration
and profit.
PAST PERFORMANCEThe performance information shown assumes that all distributions made by the Fund in the periods shown were reinvested in additional shares of the Fund and would be lower if distributions were not reinvested. The performance information does not take into account sales, redemption, distribution, optional charges or income taxes payable that would have reduced returns or performance. Past performance does not necessarily indicate how the Fund may perform in the future. A fund with more than 10 years of performance history is only permitted to disclose the past 10 years.
Year-by-Year Returns (%) The bar chart indicates the Fund’s performance for each of the years shown, and illustrates how the Fund’s performance has changed from year to year. The bar chart shows, in percentage terms, how much an investment made on the first day of each financial year would have grown or decreased by the end of the financial year.
RBC CANADIAN DIVIDEND CLASS
52
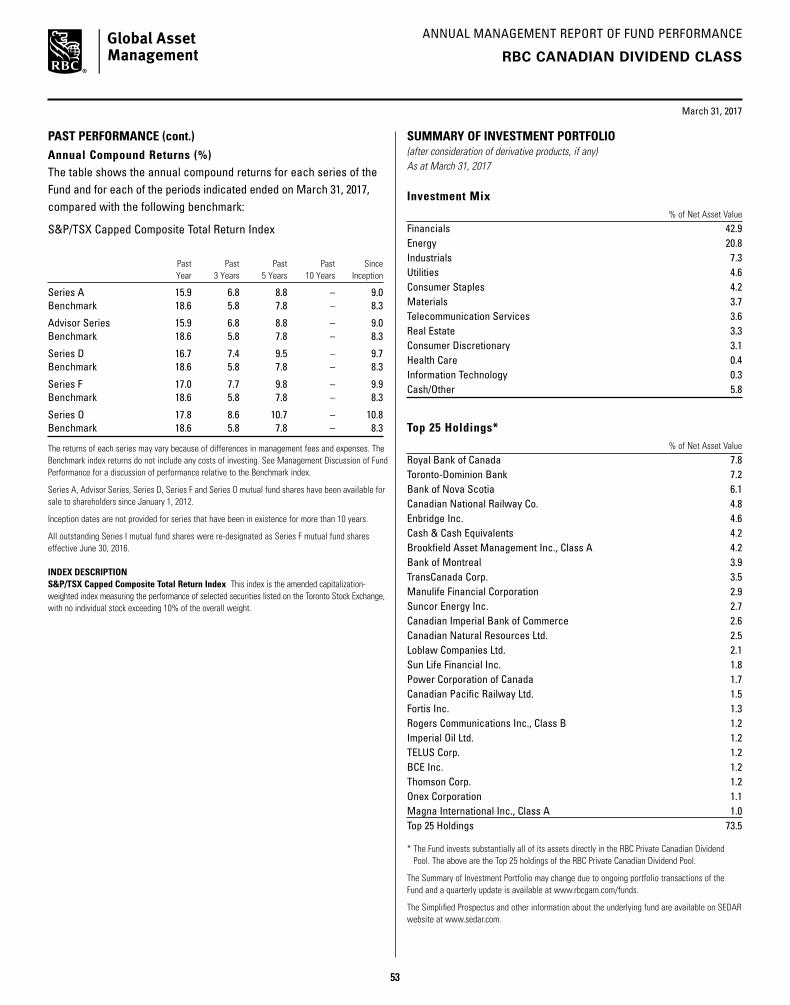
ANNUAL MANAGEMENT REPORT OF FUND PERFORMANCE
March 31, 2017
53
RBC CANADIAN DIVIDEND CLASS
PAST PERFORMANCE (cont.)Annual Compound Returns (%) The table shows the annual compound returns for each series of the Fund and for each of the periods indicated ended on March 31, 2017, compared with the following benchmark:
S&P/TSX Capped Composite Total Return Index
Past Past Past Past Since Year 3 Years 5 Years 10 Years Inception
Series A 15.9 6.8 8.8 – 9.0Benchmark 18.6 5.8 7.8 – 8.3
Advisor Series 15.9 6.8 8.8 – 9.0Benchmark 18.6 5.8 7.8 – 8.3
Series D 16.7 7.4 9.5 – 9.7Benchmark 18.6 5.8 7.8 – 8.3
Series F 17.0 7.7 9.8 – 9.9Benchmark 18.6 5.8 7.8 – 8.3
Series O 17.8 8.6 10.7 – 10.8Benchmark 18.6 5.8 7.8 – 8.3
The returns of each series may vary because of differences in management fees and expenses. The Benchmark index returns do not include any costs of investing. See Management Discussion of Fund Performance for a discussion of performance relative to the Benchmark index.
Series A, Advisor Series, Series D, Series F and Series O mutual fund shares have been available for sale to shareholders since January 1, 2012.
Inception dates are not provided for series that have been in existence for more than 10 years.
All outstanding Series I mutual fund shares were re-designated as Series F mutual fund shares effective June 30, 2016.
INDEX DESCRIPTIONS&P/TSX Capped Composite Total Return Index This index is the amended capitalization-weighted index measuring the performance of selected securities listed on the Toronto Stock Exchange, with no individual stock exceeding 10% of the overall weight.
SUMMARY OF INVESTMENT PORTFOLIO(after consideration of derivative products, if any)As at March 31, 2017
Investment Mix % of Net Asset Value
Financials 42.9Energy 20.8Industrials 7.3Utilities 4.6Consumer Staples 4.2Materials 3.7Telecommunication Services 3.6Real Estate 3.3Consumer Discretionary 3.1Health Care 0.4Information Technology 0.3Cash/Other 5.8
Top 25 Holdings* % of Net Asset Value
Royal Bank of Canada 7.8Toronto-Dominion Bank 7.2Bank of Nova Scotia 6.1Canadian National Railway Co. 4.8Enbridge Inc. 4.6Cash & Cash Equivalents 4.2Brookfield Asset Management Inc., Class A 4.2Bank of Montreal 3.9TransCanada Corp. 3.5Manulife Financial Corporation 2.9Suncor Energy Inc. 2.7Canadian Imperial Bank of Commerce 2.6Canadian Natural Resources Ltd. 2.5Loblaw Companies Ltd. 2.1Sun Life Financial Inc. 1.8Power Corporation of Canada 1.7Canadian Pacific Railway Ltd. 1.5Fortis Inc. 1.3Rogers Communications Inc., Class B 1.2Imperial Oil Ltd. 1.2TELUS Corp. 1.2BCE Inc. 1.2Thomson Corp. 1.2Onex Corporation 1.1Magna International Inc., Class A 1.0Top 25 Holdings 73.5
* The Fund invests substantially all of its assets directly in the RBC Private Canadian Dividend Pool. The above are the Top 25 holdings of the RBC Private Canadian Dividend Pool.
The Summary of Investment Portfolio may change due to ongoing portfolio transactions of the Fund and a quarterly update is available at www.rbcgam.com/funds.
The Simplified Prospectus and other information about the underlying fund are available on SEDAR website at www.sedar.com.
53

ANNUAL MANAGEMENT REPORT OF FUND PERFORMANCE
54
CANADIAN EQUITY FUND
RBC CANADIAN EQUITY CLASS
March 31, 2017
Portfolio Manager RBC Global Asset Management Inc. (“RBC GAM”)
This annual management report of fund performance (“MRFP”) contains financial highlights but does not contain the complete annual financial statements of the Fund. You can get a copy of the financial statements at your request, and at no cost, by calling 1-800-463-FUND (3863), by writing to us at RBC Global Asset Management Inc., P.O. Box 7500, Station A, Toronto, Ontario M5W 1P9, or by visiting our website at www.rbcgam.com/reports or SEDAR at www.sedar.com. Security holders may also contact us using one of these methods to request a copy of the Fund’s proxy voting policies and procedures, proxy voting disclosure record, or quarterly portfolio disclosure.
The Board of Directors of RBC Corporate Class Inc. approved this annual management report of fund performance on May 11, 2017.
A Note on Forward-looking Statements
This report may contain forward-looking statements about the Fund, its future performance, strategies or prospects, and possible future Fund action. The words “may,” “could,” “should,” “would,” “suspect,” “outlook,” “believe,” “plan,” “anticipate,” “estimate,” “expect,” “intend,” “forecast,” “objective” and similar expressions are intended to identify forward-looking statements.
Forward-looking statements are not guarantees of future performance. Forward-looking statements involve inherent risks and uncertainties, both about the Fund and general economic factors, so it is possible that predictions, forecasts, projections and other forward-looking statements will not be achieved. We caution you not to place undue reliance on these statements as a number of important factors could cause actual events or results to differ materially from those expressed or implied in any forward-looking statement made in relation to the Fund. These factors include, but are not limited to, general economic, political and market factors in Canada, the United States and internationally, interest and foreign exchange rates, global equity and capital markets, business competition, technological changes, changes in laws and regulations, judicial or regulatory judgments, legal proceedings and catastrophic events.
The above list of important factors that may affect future results is not exhaustive. Before making any investment decisions, we encourage you to consider these and other factors carefully. All opinions contained in forward-looking statements are subject to change without notice and are provided in good faith but without legal responsibility.
54
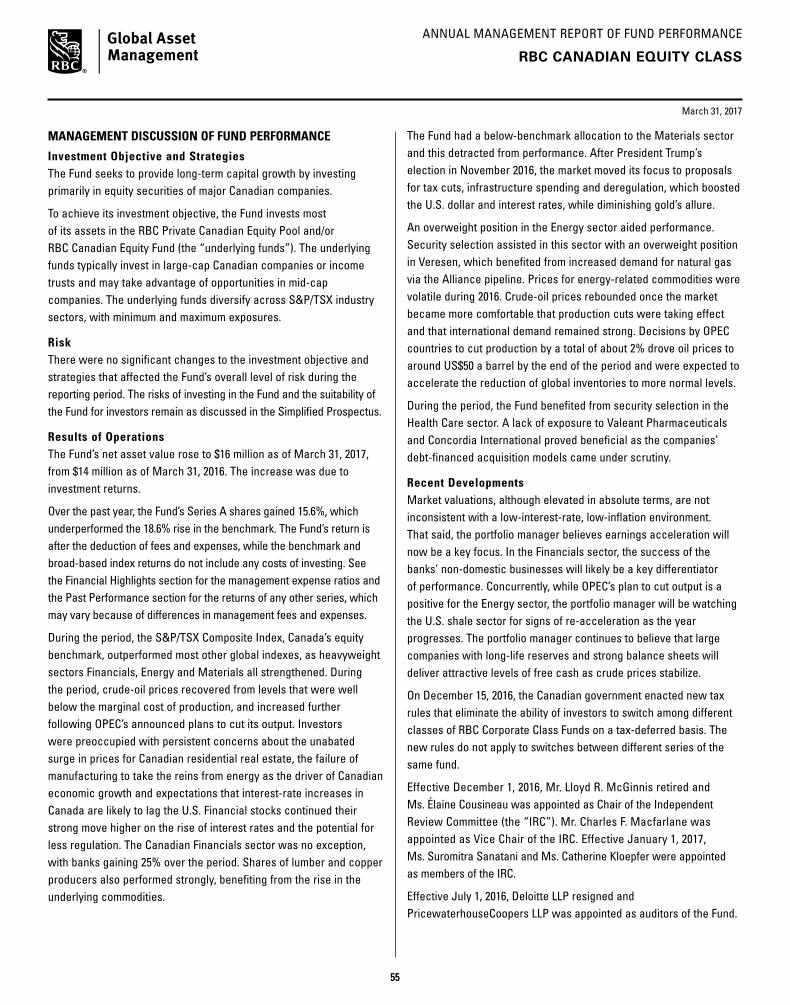
ANNUAL MANAGEMENT REPORT OF FUND PERFORMANCE
March 31, 2017
55
MANAGEMENT DISCUSSION OF FUND PERFORMANCE
Investment Objective and StrategiesThe Fund seeks to provide long-term capital growth by investing primarily in equity securities of major Canadian companies.
To achieve its investment objective, the Fund invests most of its assets in the RBC Private Canadian Equity Pool and/or RBC Canadian Equity Fund (the “underlying funds”). The underlying funds typically invest in large-cap Canadian companies or income trusts and may take advantage of opportunities in mid-cap companies. The underlying funds diversify across S&P/TSX industry sectors, with minimum and maximum exposures.
RiskThere were no significant changes to the investment objective and strategies that affected the Fund’s overall level of risk during the reporting period. The risks of investing in the Fund and the suitability of the Fund for investors remain as discussed in the Simplified Prospectus.
Results of OperationsThe Fund’s net asset value rose to $16 million as of March 31, 2017, from $14 million as of March 31, 2016. The increase was due to investment returns.
Over the past year, the Fund’s Series A shares gained 15.6%, which underperformed the 18.6% rise in the benchmark. The Fund’s return is after the deduction of fees and expenses, while the benchmark and broad-based index returns do not include any costs of investing. See the Financial Highlights section for the management expense ratios and the Past Performance section for the returns of any other series, which may vary because of differences in management fees and expenses.
During the period, the S&P/TSX Composite Index, Canada’s equity benchmark, outperformed most other global indexes, as heavyweight sectors Financials, Energy and Materials all strengthened. During the period, crude-oil prices recovered from levels that were well below the marginal cost of production, and increased further following OPEC’s announced plans to cut its output. Investors were preoccupied with persistent concerns about the unabated surge in prices for Canadian residential real estate, the failure of manufacturing to take the reins from energy as the driver of Canadian economic growth and expectations that interest-rate increases in Canada are likely to lag the U.S. Financial stocks continued their strong move higher on the rise of interest rates and the potential for less regulation. The Canadian Financials sector was no exception, with banks gaining 25% over the period. Shares of lumber and copper producers also performed strongly, benefiting from the rise in the underlying commodities.
The Fund had a below-benchmark allocation to the Materials sector and this detracted from performance. After President Trump’s election in November 2016, the market moved its focus to proposals for tax cuts, infrastructure spending and deregulation, which boosted the U.S. dollar and interest rates, while diminishing gold’s allure.
An overweight position in the Energy sector aided performance. Security selection assisted in this sector with an overweight position in Veresen, which benefited from increased demand for natural gas via the Alliance pipeline. Prices for energy-related commodities were volatile during 2016. Crude-oil prices rebounded once the market became more comfortable that production cuts were taking effect and that international demand remained strong. Decisions by OPEC countries to cut production by a total of about 2% drove oil prices to around US$50 a barrel by the end of the period and were expected to accelerate the reduction of global inventories to more normal levels.
During the period, the Fund benefited from security selection in the Health Care sector. A lack of exposure to Valeant Pharmaceuticals and Concordia International proved beneficial as the companies’ debt-financed acquisition models came under scrutiny.
Recent DevelopmentsMarket valuations, although elevated in absolute terms, are not inconsistent with a low-interest-rate, low-inflation environment. That said, the portfolio manager believes earnings acceleration will now be a key focus. In the Financials sector, the success of the banks’ non-domestic businesses will likely be a key differentiator of performance. Concurrently, while OPEC’s plan to cut output is a positive for the Energy sector, the portfolio manager will be watching the U.S. shale sector for signs of re-acceleration as the year progresses. The portfolio manager continues to believe that large companies with long-life reserves and strong balance sheets will deliver attractive levels of free cash as crude prices stabilize.
On December 15, 2016, the Canadian government enacted new tax rules that eliminate the ability of investors to switch among different classes of RBC Corporate Class Funds on a tax-deferred basis. The new rules do not apply to switches between different series of the same fund.
Effective December 1, 2016, Mr. Lloyd R. McGinnis retired and Ms. Élaine Cousineau was appointed as Chair of the Independent Review Committee (the “IRC”). Mr. Charles F. Macfarlane was appointed as Vice Chair of the IRC. Effective January 1, 2017, Ms. Suromitra Sanatani and Ms. Catherine Kloepfer were appointed as members of the IRC.
Effective July 1, 2016, Deloitte LLP resigned and PricewaterhouseCoopers LLP was appointed as auditors of the Fund.
RBC CANADIAN EQUITY CLASS
55

ANNUAL MANAGEMENT REPORT OF FUND PERFORMANCE
March 31, 2017
56
RBC CANADIAN EQUITY CLASS
Effective June 30, 2016, management fees were reduced as follows: from 1.75% to 1.60% in respect of Series A mutual fund shares and Advisor Series mutual fund shares; from 1.00% to 0.85% in respect of Series D mutual fund shares; and from 0.75% to 0.60% in respect of Series F mutual fund shares. Also effective June 30, 2016, Series H mutual fund shares were closed to all investors, and Series I mutual fund shares were re-designated to Series F mutual fund shares.
Related-Party TransactionsManager and Portfolio ManagerRBC GAM is an indirect, wholly owned subsidiary of Royal Bank of Canada (“Royal Bank”) and is the manager and portfolio manager of the Fund. RBC GAM is responsible for the Fund’s day-to-day operations, provides investment advice and portfolio management services to the Fund and appoints distributors for the Fund. RBC GAM is paid a management fee by the Fund as compensation for its services. The Fund pays a fixed administration fee to RBC GAM, which, in turn, pays certain operating expenses of the Fund.
Affiliates of RBC GAM that provide services to the Fund in the course of their normal businesses are discussed below.
DistributorsRBC GAM, Royal Mutual Funds Inc., RBC Direct Investing Inc., RBC Dominion Securities Inc. and Phillips, Hager & North Investment Funds Ltd. are the principal distributors of, or distribute certain series of the mutual fund shares of, the Fund. Dealers receive an ongoing commission based on the total value of their clients’ Series A, Advisor Series and Series D mutual fund shares.
CustodianRBC Investor Services Trust (“RBC IS”) is the custodian and holds the assets of the Fund.
RegistrarsRoyal Bank, RBC IS and RBC GAM are the registrars of the Fund and keep records of who owns the mutual fund shares of the Fund.
Other Related-Party TransactionsPursuant to applicable securities legislation, the Fund relied on the standing instructions from the Independent Review Committee with respect to one or more of the following transactions:
Related-Party Trading Activities(a) trades in securities of Royal Bank;
(b) investments in the securities of issuers for which a related-party dealer acted as an underwriter during the distribution of such securities and the 60-day period following the conclusion of such distribution of the underwritten securities to the public;
(c) purchases of equity and debt securities from or sales of equity or debt securities to a related-party dealer, where it acted as principal; and
Inter-Fund Trading(d) purchases or sales of securities of an issuer from or to another
investment fund or managed account managed by RBC GAM.
The applicable standing instructions require that Related-Party Trading Activities and Inter-Fund Trading be conducted in accordance with RBC GAM policy and that RBC GAM advise the Independent Review Committee of a material breach of any standing instruction. RBC GAM policy requires that an investment decision in respect of Related-Party Trading Activities (i) is made free from any influence of Royal Bank or its associates or affiliates and without taking into account any consideration relevant to Royal Bank or its affiliates or associates, (ii) represents the business judgment of the portfolio manager, uninfluenced by considerations other than the best interests of the Fund, (iii) is in compliance with RBC GAM policies and procedures, and (iv) achieves a fair and reasonable result for the Fund. RBC GAM policy requires that an investment decision in respect of Inter-Fund Trading is in the best interests of each Fund.
56

ANNUAL MANAGEMENT REPORT OF FUND PERFORMANCE
March 31, 2017
57
RBC CANADIAN EQUITY CLASS
FINANCIAL HIGHLIGHTS The following tables show selected key financial information about the Fund and are intended to help you understand the Fund’s financial performance for the past five years or for the periods since inception. This information is derived from the Fund’s audited annual financial statements. For financial years beginning on or after April 1, 2014, financial highlight information is derived from financial statements prepared in compliance with International Financial Reporting Standards (“IFRS”). For financial years prior to April 1, 2014, financial highlight information is derived from financial statements prepared in accordance with Canadian generally accepted accounting principles (“GAAP”). “Net Assets,” for the periods prior to April 1, 2014, are calculated in accordance with GAAP, and “Net Asset Value” is derived from the valuation method disclosed in the RBC Corporate Class Funds Annual Information Form and is used for transactional purposes (see Ratios and Supplemental Data). All other calculations for the purposes of this MRFP are made using Net Asset Value. There is no significant difference between “Net Assets” and “Net Asset Value” under IFRS.
Change in Net Assets Per Mutual Fund Share ($)
Annual Distributions2
Increase (Decrease) from Operations1 From Total Realized Unrealized Income From Net Assets For the Year/ Net Assets Revenue Total Gains Gains (Excluding From Capital Return End of Period Ended Beginning of Year/Period (Loss) Expenses (Losses) (Losses) Total Dividends) Dividends Gains of Capital Total Year/Period
Series AMar. 31, 2017 11.70 0.35 (0.24) 0.21 1.55 1.87 – (0.20) – – (0.20) 13.34 Mar. 31, 2016 12.70 0.36 (0.24) 0.09 (1.04) (0.83) – (0.22) – – (0.22) 11.70Mar. 31, 2015 12.25 0.29 (0.26) 0.62 – 0.65 – (0.18) – – (0.18) 12.70 Mar. 31, 2014 10.96 0.29 (0.23) 0.45 1.22 1.73 – (0.27) – – (0.27) 12.25Mar. 31, 2013 10.19 0.34 (0.21) 0.02 1.17 1.32 – (0.13) – – (0.13) 10.96
Advisor SeriesMar. 31, 2017 11.71 0.35 (0.24) 0.21 1.50 1.82 – (0.20) – – (0.20) 13.34Mar. 31, 2016 12.70 0.36 (0.24) 0.09 (1.04) (0.83) – (0.22) – – (0.22) 11.71Mar. 31, 2015 12.25 0.28 (0.26) 0.62 – 0.64 – (0.19) – – (0.19) 12.70 Mar. 31, 2014 10.96 0.29 (0.23) 0.45 1.22 1.73 – (0.26) – – (0.26) 12.25Mar. 31, 2013 10.19 0.34 (0.22) 0.02 1.14 1.28 – (0.14) – – (0.14) 10.96
Series DMar. 31, 2017 11.98 0.36 (0.13) 0.22 1.52 1.97 – (0.32) – – (0.32) 13.66Mar. 31, 2016 13.01 0.37 (0.14) 0.10 (1.07) (0.74) – (0.34) – – (0.34) 11.98Mar. 31, 2015 12.43 0.29 (0.15) 0.63 – 0.77 – (0.19) – – (0.19) 13.01 Mar. 31, 2014 11.08 0.30 (0.13) 0.46 1.24 1.87 – (0.32) – – (0.32) 12.43Mar. 31, 2013 10.21 0.31 (0.13) 0.02 1.07 1.27 – (0.14) – – (0.14) 11.08
Series FMar. 31, 2017 12.23 0.37 (0.10) 0.22 1.54 2.03 – (0.37) – – (0.37) 13.94Mar. 31, 2016 13.28 0.38 (0.11) 0.10 (1.10) (0.73) – (0.38) – – (0.38) 12.23Mar. 31, 2015 12.61 0.29 (0.12) 0.63 – 0.80 – (0.14) – – (0.14) 13.28 Mar. 31, 2014 11.11 0.30 (0.11) 0.46 1.25 1.90 – (0.25) – – (0.25) 12.61Mar. 31, 2013 10.22 0.31 (0.10) 0.02 1.07 1.30 – (0.12) – – (0.12) 11.11
Series OMar. 31, 2017 12.46 0.38 (0.01) 0.23 1.64 2.24 – (0.48) – – (0.48) 14.20Mar. 31, 2016 13.53 0.38 – 0.10 (1.12) (0.64) – (0.50) – – (0.50) 12.46Mar. 31, 2015 12.78 0.30 – 0.65 – 0.95 – (0.18) – – (0.18) 13.53 Mar. 31, 2014 11.23 0.30 (0.01) 0.47 1.26 2.02 – (0.30) – – (0.30) 12.78Mar. 31, 2013 10.24 0.38 (0.01) 0.02 1.28 1.67 – (0.13) – – (0.13) 11.23
1 Net assets and distributions are based on the actual number of mutual fund shares outstanding at the relevant time. The increase/decrease from operations is based on the weighted average number of mutual fund shares outstanding over the financial period. This table is not intended to be a reconciliation of beginning to ending net assets per mutual fund share.
2 Distributions are reinvested in additional mutual fund shares of the Fund or paid in cash.
57

ANNUAL MANAGEMENT REPORT OF FUND PERFORMANCE
March 31, 2017
58
RBC CANADIAN EQUITY CLASS
FINANCIAL HIGHLIGHTS (cont.)
Ratios and Supplemental Data
Number of Net Asset Value Net Asset Value Mutual Fund Shares Management MER Before Portfolio TradingAs at Per Mutual Fund Share ($) ($000s) Outstanding (000s) Expense Ratio (%)1 Absorption (%)1 Turnover Rate (%)2 Expense Ratio (%)3
Series AMar. 31, 2017 13.34 1 920 144 1.984 2.00 9.47 0.09Mar. 31, 2016 11.70 2 927 250 2.13 2.15 23.88 0.14 Mar. 31, 2015 12.70 2 878 227 2.12 2.15 17.63 0.16 Mar. 31, 2014 12.25 2 396 196 2.13 2.16 27.42 0.11Mar. 31, 2013 10.96 1 762 163 2.08 2.14 14.41 0.12
Advisor SeriesMar. 31, 2017 13.34 889 67 1.964 1.98 9.47 0.09Mar. 31, 2016 11.71 800 68 2.10 2.12 23.88 0.14 Mar. 31, 2015 12.70 1 083 85 2.09 2.12 17.63 0.16 Mar. 31, 2014 12.25 895 73 2.08 2.11 27.42 0.11Mar. 31, 2013 10.96 566 52 2.11 2.17 14.41 0.12
Series DMar. 31, 2017 13.66 4 720 346 1.064 1.08 9.47 0.09Mar. 31, 2016 11.98 3 858 322 1.20 1.22 23.88 0.14Mar. 31, 2015 13.01 4 053 312 1.19 1.22 17.63 0.16 Mar. 31, 2014 12.43 3 292 265 1.20 1.23 27.42 0.11Mar. 31, 2013 11.08 2 913 266 1.23 1.29 14.41 0.12
Series FMar. 31, 2017 13.94 3 563 256 0.794 0.81 9.47 0.09Mar. 31, 2016 12.23 1 318 108 0.95 0.97 23.88 0.14Mar. 31, 2015 13.28 1 417 107 0.94 0.97 17.63 0.16Mar. 31, 2014 12.61 629 50 0.97 1.00 27.42 0.11Mar. 31, 2013 11.11 375 34 0.96 1.02 14.41 0.12
Series OMar. 31, 2017 14.20 4 500 317 0.10 0.12 9.47 0.09Mar. 31, 2016 12.46 4 692 376 0.11 0.13 23.88 0.14Mar. 31, 2015 13.53 5 319 393 0.10 0.13 17.63 0.16 Mar. 31, 2014 12.78 3 948 309 0.10 0.13 27.42 0.11Mar. 31, 2013 11.23 3 178 286 0.10 0.16 14.41 0.12
1 The management expense ratio (“MER”) is based on expenses for the stated period, excluding commissions and other portfolio transaction costs, and is expressed as an annualized percentage of the daily average net asset value during the period. RBC GAM may, at its discretion and without notice to shareholders, waive or absorb certain operating expenses. MER includes the waiver or absorption by RBC GAM of certain operating expenses, while the MER before absorption shows the MER prior to operating expenses being waived or absorbed by RBC GAM.
2 The Fund’s portfolio turnover rate gives an indication of the level of activity employed by the portfolio manager. A portfolio turnover rate of 100% is equivalent to the Fund buying and selling all of the securities in its portfolio once in the course of the year. The higher the Fund’s portfolio turnover rate in a year, the greater the trading costs payable by the Fund in the year, and the greater the chance of an investor receiving taxable capital gains in the year. There is not necessarily a relationship between a high turnover rate and the performance of the Fund.
3 The trading expense ratio represents total commissions and other portfolio transaction costs expressed as an annualized percentage of daily average net asset value during the period. The trading expense ratio is not applicable to fixed-income transactions.
4 Effective June 30, 2016, the management fee was changed in respect of certain series of the Fund. If the change to the management fee would have been in effect throughout 2016, the adjusted MER for each series of the Fund would be: Series A – 1.94%, Advisor Series – 1.93%, Series D – 1.03% and Series F – 0.78%.
58

ANNUAL MANAGEMENT REPORT OF FUND PERFORMANCE
59
March 31, 2017
FINANCIAL HIGHLIGHTS (cont.)
Management Fees RBC GAM is the manager and portfolio manager of the Fund. Management fees of each series of the Fund are calculated at the annual percentages, before GST/HST, of the daily net asset value of each series of the Fund. The breakdown of the services received in consideration of the management fees for each series, as a percentage of the management fees, is as follows:
Breakdown of Services
Management Fees Distribution Other*
Series A 1.60% 66% 34% Advisor Series 1.60% 66% 34% Series D 0.85% 25% 75%Series F 0.60% – 100%
Series O – no management fees are paid by the Fund with respect to Series O mutual fund shares. Series O shareholders pay a negotiated fee directly to RBC GAM for investment-counselling services.* Includes all costs related to management, investment advisory services, general administration
and profit.
PAST PERFORMANCEThe performance information shown assumes that all distributions made by the Fund in the periods shown were reinvested in additional shares of the Fund and would be lower if distributions were not reinvested. The performance information does not take into account sales, redemption, distribution, optional charges or income taxes payable that would have reduced returns or performance. Past performance does not necessarily indicate how the Fund may perform in the future. A fund with more than 10 years of performance history is only permitted to disclose the past 10 years.
Year-by-Year Returns (%) The bar chart indicates the Fund’s performance for each of the years shown, and illustrates how the Fund’s performance has changed from year to year. The bar chart shows, in percentage terms, how much an investment made on the first day of each financial year would have grown or decreased by the end of the financial year.
RBC CANADIAN EQUITY CLASS
59
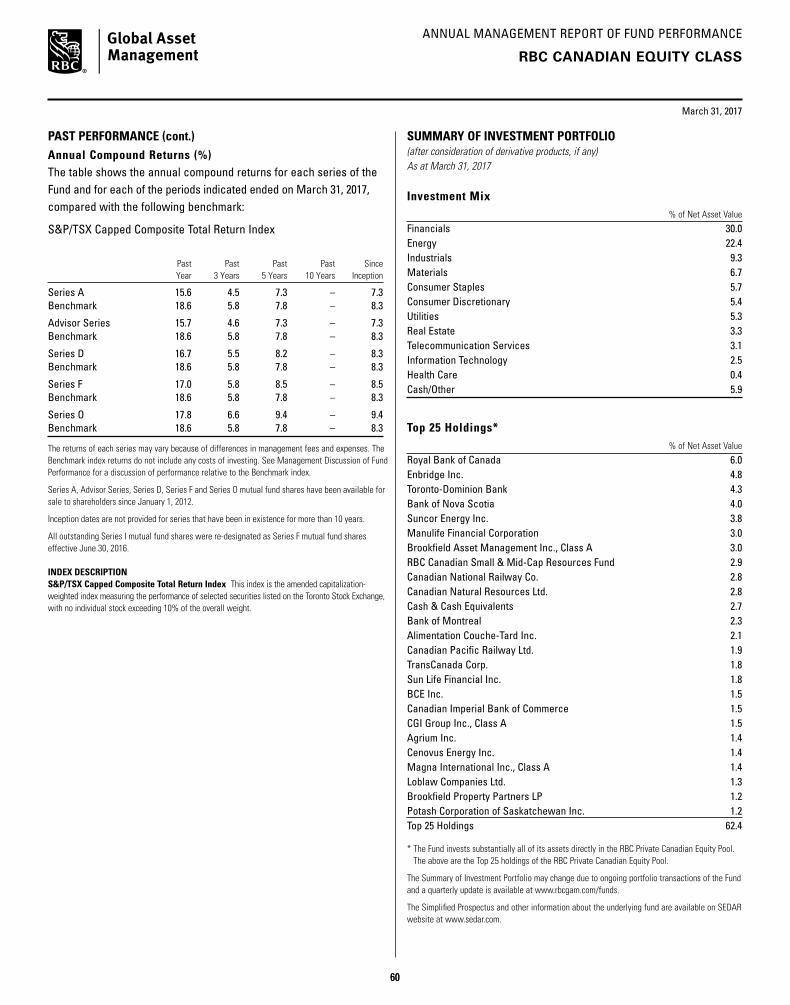
ANNUAL MANAGEMENT REPORT OF FUND PERFORMANCE
March 31, 2017
60
SUMMARY OF INVESTMENT PORTFOLIO(after consideration of derivative products, if any)As at March 31, 2017
Investment Mix % of Net Asset Value
Financials 30.0Energy 22.4Industrials 9.3Materials 6.7Consumer Staples 5.7Consumer Discretionary 5.4Utilities 5.3Real Estate 3.3Telecommunication Services 3.1Information Technology 2.5Health Care 0.4Cash/Other 5.9
Top 25 Holdings* % of Net Asset Value
Royal Bank of Canada 6.0Enbridge Inc. 4.8Toronto-Dominion Bank 4.3Bank of Nova Scotia 4.0Suncor Energy Inc. 3.8Manulife Financial Corporation 3.0Brookfield Asset Management Inc., Class A 3.0RBC Canadian Small & Mid-Cap Resources Fund 2.9Canadian National Railway Co. 2.8Canadian Natural Resources Ltd. 2.8Cash & Cash Equivalents 2.7Bank of Montreal 2.3Alimentation Couche-Tard Inc. 2.1Canadian Pacific Railway Ltd. 1.9TransCanada Corp. 1.8Sun Life Financial Inc. 1.8BCE Inc. 1.5Canadian Imperial Bank of Commerce 1.5CGI Group Inc., Class A 1.5Agrium Inc. 1.4Cenovus Energy Inc. 1.4Magna International Inc., Class A 1.4Loblaw Companies Ltd. 1.3Brookfield Property Partners LP 1.2Potash Corporation of Saskatchewan Inc. 1.2Top 25 Holdings 62.4
* The Fund invests substantially all of its assets directly in the RBC Private Canadian Equity Pool. The above are the Top 25 holdings of the RBC Private Canadian Equity Pool.
The Summary of Investment Portfolio may change due to ongoing portfolio transactions of the Fund and a quarterly update is available at www.rbcgam.com/funds.
The Simplified Prospectus and other information about the underlying fund are available on SEDAR website at www.sedar.com.
RBC CANADIAN EQUITY CLASS
PAST PERFORMANCE (cont.)Annual Compound Returns (%) The table shows the annual compound returns for each series of the Fund and for each of the periods indicated ended on March 31, 2017, compared with the following benchmark:
S&P/TSX Capped Composite Total Return Index
Past Past Past Past Since Year 3 Years 5 Years 10 Years Inception
Series A 15.6 4.5 7.3 – 7.3Benchmark 18.6 5.8 7.8 – 8.3
Advisor Series 15.7 4.6 7.3 – 7.3Benchmark 18.6 5.8 7.8 – 8.3
Series D 16.7 5.5 8.2 – 8.3Benchmark 18.6 5.8 7.8 – 8.3
Series F 17.0 5.8 8.5 – 8.5Benchmark 18.6 5.8 7.8 – 8.3
Series O 17.8 6.6 9.4 – 9.4Benchmark 18.6 5.8 7.8 – 8.3
The returns of each series may vary because of differences in management fees and expenses. The Benchmark index returns do not include any costs of investing. See Management Discussion of Fund Performance for a discussion of performance relative to the Benchmark index.
Series A, Advisor Series, Series D, Series F and Series O mutual fund shares have been available for sale to shareholders since January 1, 2012.
Inception dates are not provided for series that have been in existence for more than 10 years.
All outstanding Series I mutual fund shares were re-designated as Series F mutual fund shares effective June 30, 2016.
INDEX DESCRIPTIONS&P/TSX Capped Composite Total Return Index This index is the amended capitalization-weighted index measuring the performance of selected securities listed on the Toronto Stock Exchange, with no individual stock exceeding 10% of the overall weight.
60
ANNUAL MANAGEMENT REPORT OF FUND PERFORMANCE
61
CANADIAN EQUITY FUND
RBC QUBE LOW VOLATILITY CANADIAN EQUITY CLASS
March 31, 2017
Portfolio Manager RBC Global Asset Management Inc. (“RBC GAM”)
This annual management report of fund performance (“MRFP”) contains financial highlights but does not contain the complete annual financial statements of the Fund. You can get a copy of the financial statements at your request, and at no cost, by calling 1-800-463-FUND (3863), by writing to us at RBC Global Asset Management Inc., P.O. Box 7500, Station A, Toronto, Ontario M5W 1P9, or by visiting our website at www.rbcgam.com/reports or SEDAR at www.sedar.com. Security holders may also contact us using one of these methods to request a copy of the Fund’s proxy voting policies and procedures, proxy voting disclosure record, or quarterly portfolio disclosure.
The Board of Directors of RBC Corporate Class Inc. approved this annual management report of fund performance on May 11, 2017.
A Note on Forward-looking Statements
This report may contain forward-looking statements about the Fund, its future performance, strategies or prospects, and possible future Fund action. The words “may,” “could,” “should,” “would,” “suspect,” “outlook,” “believe,” “plan,” “anticipate,” “estimate,” “expect,” “intend,” “forecast,” “objective” and similar expressions are intended to identify forward-looking statements.
Forward-looking statements are not guarantees of future performance. Forward-looking statements involve inherent risks and uncertainties, both about the Fund and general economic factors, so it is possible that predictions, forecasts, projections and other forward-looking statements will not be achieved. We caution you not to place undue reliance on these statements as a number of important factors could cause actual events or results to differ materially from those expressed or implied in any forward-looking statement made in relation to the Fund. These factors include, but are not limited to, general economic, political and market factors in Canada, the United States and internationally, interest and foreign exchange rates, global equity and capital markets, business competition, technological changes, changes in laws and regulations, judicial or regulatory judgments, legal proceedings and catastrophic events.
The above list of important factors that may affect future results is not exhaustive. Before making any investment decisions, we encourage you to consider these and other factors carefully. All opinions contained in forward-looking statements are subject to change without notice and are provided in good faith but without legal responsibility.
61
ANNUAL MANAGEMENT REPORT OF FUND PERFORMANCE
62
March 31, 2017
MANAGEMENT DISCUSSION OF FUND PERFORMANCE
Investment Objective and StrategiesThe Fund seeks to provide long-term capital growth by investing primarily in equity securities of Canadian companies. The Fund uses a quantitative investment approach and seeks to achieve a reduced level of volatility of returns compared with the broader Canadian equity market.
To achieve its investment objective, the Fund invests most of its assets in the RBC QUBE Low Volatility Canadian Equity Fund (the “underlying fund”). The underlying fund is managed using a quantitative investment model designed to select individual stocks while controlling portfolio-level risk. This involves building a portfolio that maximizes exposure to factors associated with outperformance, while controlling for exposure to risk factors. The portfolio manager of the underlying fund diversifies across industries within the Canadian market.
RiskThere were no significant changes to the investment objective and strategies that affected the Fund’s overall level of risk during the reporting period. The risks of investing in the Fund and the suitability of the Fund for investors remain as discussed in the Simplified Prospectus.
Results of OperationsThe Fund’s net asset value rose to $27 million as of March 31, 2017, from $14 million as of March 31, 2016. The increase was due mainly to net inflows.
Over the past year, the Fund’s Series A shares gained 10.2%, which underperformed the 18.6% rise in the benchmark. The Fund’s return is after the deduction of fees and expenses, while the benchmark and broad-based index returns do not include any costs of investing. See the Financial Highlights section for the management expense ratios and the Past Performance section for the returns of any other series, which may vary because of differences in management fees and expenses.
The Canadian equity market, as measured by the S&P/TSX Capped Composite Index, generated strong returns over the year, supported by strength in the Financials sector, which benefited from rising interest rates. A recovery in the resource sectors was helped by improving commodity prices.
In the Energy sector, positions in Imperial Oil and Peyto Exploration held back the Fund’s returns. The Consumer Staples sector also weighed heavily on performance, with a position in Metro Inc. holding back returns over the year.
In the Financials sector, the Fund’s overweight position in Bank of Nova Scotia and Royal Bank of Canada added significantly to returns. The Industrials sector also aided performance, with a large contribution from a holding in CAE Inc.
Recent DevelopmentsThe economic outlook has improved globally, in the view of the portfolio manager. Positive economic data has supported heightened consumer and business confidence, and investors have focused on the potential for a shift from monetary stimulus to fiscal stimulus. However, central banks other than the U.S. Federal Reserve are continuing to rely on monetary stimulus until there is evidence that fiscal spending is ready to take over.
On December 15, 2016, the Canadian government enacted new tax rules that eliminate the ability of investors to switch among different classes of RBC Corporate Class Funds on a tax-deferred basis. The new rules do not apply to switches between different series of the same fund.
Effective December 1, 2016, Mr. Lloyd R. McGinnis retired and Ms. Élaine Cousineau was appointed as Chair of the Independent Review Committee (the “IRC”). Mr. Charles F. Macfarlane was appointed as Vice Chair of the IRC. Effective January 1, 2017, Ms. Suromitra Sanatani and Ms. Catherine Kloepfer were appointed as members of the IRC.
Effective July 1, 2016, Deloitte LLP resigned and PricewaterhouseCoopers LLP was appointed as auditors of the Fund.
Effective June 30, 2016, management fees were reduced as follows: from 1.75% to 1.60% in respect of Series A mutual fund shares and Advisor Series mutual fund shares; from 1.00% to 0.85% in respect of Series D mutual fund shares; and from 0.75% to 0.60% in respect of Series F mutual fund shares. Also effective June 30, 2016, Series H mutual fund shares and Series I mutual fund shares were closed to all investors.
Related-Party TransactionsManager and Portfolio ManagerRBC GAM is an indirect, wholly owned subsidiary of Royal Bank of Canada (“Royal Bank”) and is the manager and portfolio manager of the Fund. RBC GAM is responsible for the Fund’s day-to-day operations, provides investment advice and portfolio management services to the Fund and appoints distributors for the Fund. RBC GAM is paid a management fee by the Fund as compensation for its services. The Fund pays a fixed administration fee to RBC GAM, which, in turn, pays certain operating expenses of the Fund.
Affiliates of RBC GAM that provide services to the Fund in the course of their normal businesses are discussed below.
RBC QUBE LOW VOLATILITY CANADIAN EQUITY CLASS
62
ANNUAL MANAGEMENT REPORT OF FUND PERFORMANCE
63
March 31, 2017
RBC QUBE LOW VOLATILITY CANADIAN EQUITY CLASS
DistributorsRBC GAM, Royal Mutual Funds Inc., RBC Direct Investing Inc., RBC Dominion Securities Inc. and Phillips, Hager & North Investment Funds Ltd. are the principal distributors of, or distribute certain series of the mutual fund shares of, the Fund. Dealers receive an ongoing commission based on the total value of their clients’ Series A, Advisor Series and Series D mutual fund shares.
CustodianRBC Investor Services Trust (“RBC IS”) is the custodian and holds the assets of the Fund.
RegistrarsRoyal Bank, RBC IS and RBC GAM are the registrars of the Fund and keep records of who owns the mutual fund shares of the Fund.
Other Related-Party TransactionsPursuant to applicable securities legislation, the Fund relied on the standing instructions from the Independent Review Committee with respect to one or more of the following transactions:
Related-Party Trading Activities(a) trades in securities of Royal Bank;
(b) investments in the securities of issuers for which a related-party dealer acted as an underwriter during the distribution of such securities and the 60-day period following the conclusion of such distribution of the underwritten securities to the public;
(c) purchases of equity and debt securities from or sales of equity or debt securities to a related-party dealer, where it acted as principal; and
Inter-Fund Trading(d) purchases or sales of securities of an issuer from or to another
investment fund or managed account managed by RBC GAM.
The applicable standing instructions require that Related-Party Trading Activities and Inter-Fund Trading be conducted in accordance with RBC GAM policy and that RBC GAM advise the Independent Review Committee of a material breach of any standing instruction. RBC GAM policy requires that an investment decision in respect of Related-Party Trading Activities (i) is made free from any influence of Royal Bank or its associates or affiliates and without taking into account any consideration relevant to Royal Bank or its affiliates or associates, (ii) represents the business judgment of the portfolio manager, uninfluenced by considerations other than the best interests of the Fund, (iii) is in compliance with RBC GAM policies and procedures, and (iv) achieves a fair and reasonable result for the Fund. RBC GAM policy requires that an investment decision in respect of Inter-Fund Trading is in the best interests of each Fund.
63

ANNUAL MANAGEMENT REPORT OF FUND PERFORMANCE
March 31, 2017
64
RBC QUBE LOW VOLATILITY CANADIAN EQUITY CLASS
FINANCIAL HIGHLIGHTS The following tables show selected key financial information about the Fund and are intended to help you understand the Fund’s financial performance for the past five years or for the periods since inception. This information is derived from the Fund’s audited annual financial statements. For financial years beginning on or after April 1, 2014, financial highlight information is derived from financial statements prepared in compliance with International Financial Reporting Standards (“IFRS”). For financial years prior to April 1, 2014, financial highlight information is derived from financial statements prepared in accordance with Canadian generally accepted accounting principles (“GAAP”). “Net Assets,” for the periods prior to April 1, 2014, are calculated in accordance with GAAP, and “Net Asset Value” is derived from the valuation method disclosed in the RBC Corporate Class Funds Annual Information Form and is used for transactional purposes (see Ratios and Supplemental Data). All other calculations for the purposes of this MRFP are made using Net Asset Value. There is no significant difference between “Net Assets” and “Net Asset Value” under IFRS.
Change in Net Assets Per Mutual Fund Share ($)
Annual Distributions2
Increase (Decrease) from Operations1 From Total Realized Unrealized Income From Net Assets For the Year/ Net Assets Revenue Total Gains Gains (Excluding From Capital Return End of Period Ended Beginning of Year/Period (Loss) Expenses (Losses) (Losses) Total Dividends) Dividends Gains of Capital Total Year/Period
Series AMar. 31, 2017 10.38 0.41 (0.21) 0.49 0.38 1.07 – (0.17) – – (0.17) 11.26 Mar. 31, 2016 10.19 0.51 (0.21) 0.31 1.51 2.12 – – – – – 10.38Mar. 31, 20153 10.00† – (0.04) – 0.11 0.07 – – – – – 10.19
Advisor SeriesMar. 31, 2017 10.39 0.38 (0.20) 0.46 0.47 1.11 – (0.17) – – (0.17) 11.29Mar. 31, 2016 10.20 0.49 (0.19) 0.30 1.47 2.07 – – – – – 10.39Mar. 31, 20153 10.00† – (0.04) – 0.15 0.11 – – – – – 10.20
Series DMar. 31, 2017 10.42 0.41 (0.11) 0.50 0.37 1.17 – (0.27) – – (0.27) 11.31Mar. 31, 2016 10.21 0.41 (0.12) 0.25 1.23 1.77 – (0.07) – – (0.07) 10.42Mar. 31, 20153 10.00† – (0.02) – 0.10 0.08 – – – – – 10.21
Series FMar. 31, 2017 10.43 0.37 (0.09) 0.45 0.46 1.19 – (0.28) – – (0.28) 11.34Mar. 31, 2016 10.22 0.30 (0.09) 0.19 0.91 1.31 – (0.09) – – (0.09) 10.43Mar. 31, 20153 10.00† – (0.02) – 0.09 0.07 – – – – – 10.22
Series OMar. 31, 2017 10.45 0.41 – 0.50 0.40 1.31 – (0.36) – – (0.36) 11.36Mar. 31, 2016 10.23 0.26 – 0.16 0.78 1.20 – (0.18) – – (0.18) 10.45Mar. 31, 20153 10.00† – – – 0.15 0.15 – – – – – 10.23
1 Net assets and distributions are based on the actual number of mutual fund shares outstanding at the relevant time. The increase/decrease from operations is based on the weighted average number of mutual fund shares outstanding over the financial period. This table is not intended to be a reconciliation of beginning to ending net assets per mutual fund share.
2 Distributions are reinvested in additional mutual fund shares of the Fund or paid in cash.3 From October 16, 2014.† Initial offering net asset value per mutual fund share.
64
ANNUAL MANAGEMENT REPORT OF FUND PERFORMANCE
March 31, 2017
65
RBC QUBE LOW VOLATILITY CANADIAN EQUITY CLASS
FINANCIAL HIGHLIGHTS (cont.)
Ratios and Supplemental Data
Number of Net Asset Value Net Asset Value Mutual Fund Shares Management MER Before Portfolio TradingAs at Per Mutual Fund Share ($) ($000s) Outstanding (000s) Expense Ratio (%)1 Absorption (%)1 Turnover Rate (%)2 Expense Ratio (%)3
Series AMar. 31, 2017 11.26 3 754 333 1.944 1.95 18.99 0.06Mar. 31, 2016 10.38 2 361 228 2.10 2.17 29.75 0.04Mar. 31, 20155 10.19 1 193 117 2.10 2.10 – 0.03
Advisor SeriesMar. 31, 2017 11.29 1 859 165 1.864 1.87 18.99 0.06Mar. 31, 2016 10.39 304 29 1.97 2.04 29.75 0.04Mar. 31, 20155 10.20 1 – 2.10 2.10 – 0.03
Series DMar. 31, 2017 11.31 2 958 261 1.054 1.06 18.99 0.06Mar. 31, 2016 10.42 2 021 194 1.20 1.27 29.75 0.04Mar. 31, 20155 10.21 82 8 1.25 1.25 – 0.03
Series FMar. 31, 2017 11.34 6 229 549 0.804 0.81 18.99 0.06Mar. 31, 2016 10.43 449 43 0.94 1.01 29.75 0.04Mar. 31, 20155 10.22 31 3 0.97 0.97 – 0.03
Series OMar. 31, 2017 11.36 11 925 1 049 0.06 0.07 18.99 0.06Mar. 31, 2016 10.45 8 064 772 0.05 0.12 29.75 0.04Mar. 31, 20155 10.23 147 14 0.05 0.05 – 0.03
1 The management expense ratio (“MER”) is based on expenses for the stated period, excluding commissions and other portfolio transaction costs, and is expressed as an annualized percentage of the daily average net asset value during the period. RBC GAM may, at its discretion and without notice to shareholders, waive or absorb certain operating expenses. MER includes the waiver or absorption by RBC GAM of certain operating expenses, while the MER before absorption shows the MER prior to operating expenses being waived or absorbed by RBC GAM.
2 The Fund’s portfolio turnover rate gives an indication of the level of activity employed by the portfolio manager. A portfolio turnover rate of 100% is equivalent to the Fund buying and selling all of the securities in its portfolio once in the course of the year. The higher the Fund’s portfolio turnover rate in a year, the greater the trading costs payable by the Fund in the year, and the greater the chance of an investor receiving taxable capital gains in the year. There is not necessarily a relationship between a high turnover rate and the performance of the Fund.
3 The trading expense ratio represents total commissions and other portfolio transaction costs expressed as an annualized percentage of daily average net asset value during the period. The trading expense ratio is not applicable to fixed-income transactions.
4 Effective June 30, 2016, the management fee was changed in respect of certain series of the Fund. If the change to the management fee would have been in effect throughout 2016, the adjusted MER for each series of the Fund would be: Series A – 1.91%, Advisor Series – 1.82%, Series D – 1.02% and Series F – 0.78%.
5 From October 16, 2014.
Management Fees RBC GAM is the manager and portfolio manager of the Fund. Management fees of each series of the Fund are calculated at the annual percentages, before GST/HST, of the daily net asset value of each series of the Fund. The breakdown of the services received in consideration of the management fees for each series, as a percentage of the management fees, is as follows:
Breakdown of Services
Management Fees Distribution Other*
Series A 1.60% 57% 43%Advisor Series 1.60% 57% 43%Series D 0.85% 25% 75%Series F 0.60% – 100%
Series O – no management fees are paid by the Fund with respect to Series O mutual fund shares. Series O shareholders pay a negotiated fee directly to RBC GAM for investment-counselling services.* Includes all costs related to management, investment advisory services, general administration
and profit.
65

ANNUAL MANAGEMENT REPORT OF FUND PERFORMANCE
66
March 31, 2017
RBC QUBE LOW VOLATILITY CANADIAN EQUITY CLASS
Annual Compound Returns (%) The table shows the annual compound returns for each series of the Fund and for each of the periods indicated ended on March 31, 2017, compared with the following benchmark:
S&P/TSX Capped Composite Total Return Index
Past Past Past Past Since Year 3 Years 5 Years 10 Years Inception
Series A 10.2 – – – 6.3Benchmark 18.6 – – – 5.8
Advisor Series 10.2 – – – 6.4Benchmark 18.6 – – – 5.8
Series D 11.2 – – – 7.3Benchmark 18.6 – – – 5.8
Series F 11.4 – – – 7.5Benchmark 18.6 – – – 5.8
Series O 12.2 – – – 8.4Benchmark 18.6 – – – 5.8
The returns of each series may vary because of differences in management fees and expenses. The Benchmark index returns do not include any costs of investing. See Management Discussion of Fund Performance for a discussion of performance relative to the Benchmark index.
Series A, Advisor Series, Series D, Series F and Series O mutual fund shares have been available for sale to shareholders since January 26, 2015.
Inception dates are not provided for series that have been in existence for more than 10 years.
INDEX DESCRIPTIONS&P/TSX Capped Composite Total Return Index This index is the amended capitalization- weighted index measuring the performance of selected securities listed on the Toronto Stock Exchange, with no individual stock exceeding 10% of the overall weight.
PAST PERFORMANCEThe performance information shown assumes that all distributions made by the Fund in the periods shown were reinvested in additional shares of the Fund and would be lower if distributions were not reinvested. The performance information does not take into account sales, redemption, distribution, optional charges or income taxes payable that would have reduced returns or performance. Past performance does not necessarily indicate how the Fund may perform in the future. A fund with more than 10 years of performance history is only permitted to disclose the past 10 years.
Year-by-Year Returns (%) The bar chart indicates the Fund’s performance for each of the years shown, and illustrates how the Fund’s performance has changed from year to year. The bar chart shows, in percentage terms, how much an investment made on the first day of each financial year would have grown or decreased by the end of the financial year.
66

ANNUAL MANAGEMENT REPORT OF FUND PERFORMANCE
67
March 31, 2017
RBC QUBE LOW VOLATILITY CANADIAN EQUITY CLASS
SUMMARY OF INVESTMENT PORTFOLIO(after consideration of derivative products, if any)As at March 31, 2017
Investment Mix % of Net Asset Value
Financials 28.9Utilities 13.4Industrials 13.0Energy 9.9Real Estate 9.9Telecommunication Services 9.4Consumer Staples 7.7Consumer Discretionary 4.5Materials 2.1Health Care 0.7Cash/Other 0.5
Top 25 Holdings* % of Net Asset Value
Royal Bank of Canada 4.9Bank of Nova Scotia 4.9Bank of Montreal 4.8Toronto-Dominion Bank 4.7Canadian National Railway Co. 4.0BCE Inc. 4.0CAE Inc. 4.0Intact Financial Corp. 4.0TELUS Corp. 4.0Imperial Oil Ltd. 3.9Fortis Inc. 3.4George Weston Ltd. 3.3RioCan Real Estate Investment Trust 3.2Hydro One Ltd. 3.0Waste Connections Inc. 2.9Emera Inc. 2.4Shaw Communications Inc., Class B 2.3Keyera Corp. 2.2Alimentation Couche-Tard Inc. 2.2Power Financial Corp. 2.1Peyto Exploration & Development Corp. 2.1H&R Real Estate Investment Trust 2.0Canadian Imperial Bank of Commerce 1.9Cineplex Inc. 1.9Toromont Industries Ltd. 1.7Top 25 Holdings 79.8
* The Fund invests substantially all of its assets directly in the RBC QUBE Low Volatility Canadian Equity Fund. The above are the Top 25 holdings of the RBC QUBE Low Volatility Canadian Equity Fund.
The Summary of Investment Portfolio may change due to ongoing portfolio transactions of the Fund and a quarterly update is available at www.rbcgam.com/funds.
The Simplified Prospectus and other information about the underlying fund are available on SEDAR website at www.sedar.com.
67
ANNUAL MANAGEMENT REPORT OF FUND PERFORMANCE
68
CANADIAN EQUITY FUND
PHILLIPS, HAGER & NORTH CANADIAN EQUITY VALUE CLASS
March 31, 2017
Portfolio Manager RBC Global Asset Management Inc. (“RBC GAM”)
This annual management report of fund performance (“MRFP”) contains financial highlights but does not contain the complete annual financial statements of the Fund. You can get a copy of the financial statements at your request, and at no cost, by calling 1-800-463-FUND (3863), by writing to us at RBC Global Asset Management Inc., P.O. Box 7500, Station A, Toronto, Ontario M5W 1P9, or by visiting our website at www.rbcgam.com/reports or SEDAR at www.sedar.com. Security holders may also contact us using one of these methods to request a copy of the Fund’s proxy voting policies and procedures, proxy voting disclosure record, or quarterly portfolio disclosure.
The Board of Directors of RBC Corporate Class Inc. approved this annual management report of fund performance on May 11, 2017.
A Note on Forward-looking Statements
This report may contain forward-looking statements about the Fund, its future performance, strategies or prospects, and possible future Fund action. The words “may,” “could,” “should,” “would,” “suspect,” “outlook,” “believe,” “plan,” “anticipate,” “estimate,” “expect,” “intend,” “forecast,” “objective” and similar expressions are intended to identify forward-looking statements.
Forward-looking statements are not guarantees of future performance. Forward-looking statements involve inherent risks and uncertainties, both about the Fund and general economic factors, so it is possible that predictions, forecasts, projections and other forward-looking statements will not be achieved. We caution you not to place undue reliance on these statements as a number of important factors could cause actual events or results to differ materially from those expressed or implied in any forward-looking statement made in relation to the Fund. These factors include, but are not limited to, general economic, political and market factors in Canada, the United States and internationally, interest and foreign exchange rates, global equity and capital markets, business competition, technological changes, changes in laws and regulations, judicial or regulatory judgments, legal proceedings and catastrophic events.
The above list of important factors that may affect future results is not exhaustive. Before making any investment decisions, we encourage you to consider these and other factors carefully. All opinions contained in forward-looking statements are subject to change without notice and are provided in good faith but without legal responsibility.
68

ANNUAL MANAGEMENT REPORT OF FUND PERFORMANCE
69
March 31, 2017
MANAGEMENT DISCUSSION OF FUND PERFORMANCE
Investment Objective and StrategiesThe Fund seeks to provide long-term capital growth by investing in equity securities of Canadian companies.
To achieve its investment objective, the Fund invests most of its assets in the Phillips, Hager & North Canadian Equity Value Fund (the “underlying fund”). The underlying fund invests primarily in equities of Canadian companies priced below the portfolio manager’s assessment of their true value and offering long-term opportunities for growth.
RiskThere were no significant changes to the investment objective and strategies that affected the Fund’s overall level of risk during the reporting period. The risks of investing in the Fund and the suitability of the Fund for investors remain as discussed in the Simplified Prospectus.
Results of OperationsThe Fund’s net asset value rose to $4 million as of March 31, 2017, from $3 million as of March 31, 2016. The increase was due to a mix of net inflows and investment returns.
Over the past year, the Fund’s Series A shares gained 15.3%, which underperformed the 18.6% rise in the benchmark. The Fund’s return is after the deduction of fees and expenses, while the benchmark and broad-based index returns do not include any costs of investing. See the Financial Highlights section for the management expense ratios and the Past Performance section for the returns of any other series, which may vary because of differences in management fees and expenses.
During the period, the S&P/TSX Composite Index, Canada’s equity benchmark, outperformed most other global indexes, as heavyweight sectors Financials, Energy and Materials all strengthened. Crude-oil prices recovered from levels that were well below the marginal cost of production, and increased further following OPEC’s announced plans to cut its output. Investors were preoccupied with persistent concerns over the unabated surge in prices for Canadian residential real estate, the failure of manufacturing to take the reins from energy as the driver of Canadian economic growth and expectations that interest-rate increases in Canada are likely to lag the U.S. Financials stocks moved higher in the U.S. on the rise of interest rates and the potential for less regulation. The Canadian Financials sector performed well with Canadian banks gaining 30% over 2016. Shares of lumber and copper producers also performed strongly, benefiting from the rise in the underlying commodities.
The Fund had underweight exposure to more cyclical Materials stocks, which appreciated during the second half of the period, resulting in a drag on returns.
During the period, the Fund benefited from an overweight exposure to the Consumer Staples sector. An underweight position in Metro Inc. benefited returns as inflation pressure from food prices subsided. The Fund also benefited from security selection in the Health Care sector. A lack of exposure to Valeant Pharmaceuticals and Concordia International proved beneficial as the companies struggled under greater regulatory scrutiny and higher debt levels.
Recent DevelopmentsMarket valuations, although elevated in absolute terms, are not inconsistent with a low-interest-rate, low-inflation environment. That said, the portfolio manager believes earnings acceleration will now be a key focus. In the Financials sector, the success of the Canadian banks’ non-domestic businesses will likely be a key differentiator of performance. Concurrently, while OPEC’s plan to cut output is a positive for the Energy sector, the portfolio manager will be watching the U.S. shale sector for signs of re-acceleration as the year progresses. The portfolio manager continues to believe that large companies with long-life reserves and strong balance sheets will deliver attractive levels of free cash as crude prices stabilize.
On December 15, 2016, the Canadian government enacted new tax rules that eliminate the ability of investors to switch among different classes of RBC Corporate Class Funds on a tax-deferred basis. The new rules do not apply to switches between different series of the same fund.
Effective December 1, 2016, Mr. Lloyd R. McGinnis retired and Ms. Élaine Cousineau was appointed as Chair of the Independent Review Committee (the “IRC”). Mr. Charles F. Macfarlane was appointed as Vice Chair of the IRC. Effective January 1, 2017, Ms. Suromitra Sanatani and Ms. Catherine Kloepfer were appointed as members of the IRC.
Effective July 1, 2016, Deloitte LLP resigned and PricewaterhouseCoopers LLP was appointed as auditors of the Fund.
Effective June 30, 2016, management fees were reduced as follows: from 1.75% to 1.60% in respect of Series A mutual fund shares and Advisor Series mutual fund shares; from 1.00% to 0.85% in respect of Series D mutual fund shares; and from 0.75% to 0.60% in respect of Series F mutual fund shares. Also effective June 30, 2016, Series H mutual fund shares and Series I mutual fund shares were closed to all investors.
PHILLIPS, HAGER & NORTH CANADIAN EQUITY VALUE CLASS
69

ANNUAL MANAGEMENT REPORT OF FUND PERFORMANCE
70
March 31, 2017
PHILLIPS, HAGER & NORTH CANADIAN EQUITY VALUE CLASS
Related-Party TransactionsManager and Portfolio ManagerRBC GAM is an indirect, wholly owned subsidiary of Royal Bank of Canada (“Royal Bank”) and is the manager and portfolio manager of the Fund. RBC GAM is responsible for the Fund’s day-to-day operations, provides investment advice and portfolio management services to the Fund and appoints distributors for the Fund. RBC GAM is paid a management fee by the Fund as compensation for its services. The Fund pays a fixed administration fee to RBC GAM, which, in turn, pays certain operating expenses of the Fund.
Affiliates of RBC GAM that provide services to the Fund in the course of their normal businesses are discussed below.
DistributorsRBC GAM, Royal Mutual Funds Inc., RBC Direct Investing Inc., RBC Dominion Securities Inc. and Phillips, Hager & North Investment Funds Ltd. are the principal distributors of, or distribute certain series of the mutual fund shares of, the Fund. Dealers receive an ongoing commission based on the total value of their clients’ Series A, Advisor Series and Series D mutual fund shares.
CustodianRBC Investor Services Trust (“RBC IS”) is the custodian and holds the assets of the Fund.
RegistrarsRoyal Bank, RBC IS and RBC GAM are the registrars of the Fund and keep records of who owns the mutual fund shares of the Fund.
Other Related-Party TransactionsPursuant to applicable securities legislation, the Fund relied on the standing instructions from the Independent Review Committee with respect to one or more of the following transactions:
Related-Party Trading Activities(a) trades in securities of Royal Bank;
(b) investments in the securities of issuers for which a related-party dealer acted as an underwriter during the distribution of such securities and the 60-day period following the conclusion of such distribution of the underwritten securities to the public;
(c) purchases of equity and debt securities from or sales of equity or debt securities to a related-party dealer, where it acted as principal; and
Inter-Fund Trading(d) purchases or sales of securities of an issuer from or to another
investment fund or managed account managed by RBC GAM.
The applicable standing instructions require that Related-Party Trading Activities and Inter-Fund Trading be conducted in accordance with RBC GAM policy and that RBC GAM advise the Independent Review Committee of a material breach of any standing instruction. RBC GAM policy requires that an investment decision in respect of Related-Party Trading Activities (i) is made free from any influence of Royal Bank or its associates or affiliates and without taking into account any consideration relevant to Royal Bank or its affiliates or associates, (ii) represents the business judgment of the portfolio manager, uninfluenced by considerations other than the best interests of the Fund, (iii) is in compliance with RBC GAM policies and procedures, and (iv) achieves a fair and reasonable result for the Fund. RBC GAM policy requires that an investment decision in respect of Inter-Fund Trading is in the best interests of each Fund.
70

ANNUAL MANAGEMENT REPORT OF FUND PERFORMANCE
March 31, 2017
71
PHILLIPS, HAGER & NORTH CANADIAN EQUITY VALUE CLASS
FINANCIAL HIGHLIGHTS The following tables show selected key financial information about the Fund and are intended to help you understand the Fund’s financial performance for the past five years or for the periods since inception. This information is derived from the Fund’s audited annual financial statements. For financial years beginning on or after April 1, 2014, financial highlight information is derived from financial statements prepared in compliance with International Financial Reporting Standards (“IFRS”). For financial years prior to April 1, 2014, financial highlight information is derived from financial statements prepared in accordance with Canadian generally accepted accounting principles (“GAAP”). “Net Assets,” for the periods prior to April 1, 2014, are calculated in accordance with GAAP, and “Net Asset Value” is derived from the valuation method disclosed in the RBC Corporate Class Funds Annual Information Form and is used for transactional purposes (see Ratios and Supplemental Data). All other calculations for the purposes of this MRFP are made using Net Asset Value. There is no significant difference between “Net Assets” and “Net Asset Value” under IFRS.
Change in Net Assets Per Mutual Fund Share ($)
Annual Distributions2
Increase (Decrease) from Operations1 From Total Realized Unrealized Income From Net Assets For the Year/ Net Assets Revenue Total Gains Gains (Excluding From Capital Return End of Period Ended Beginning of Year/Period (Loss) Expenses (Losses) (Losses) Total Dividends) Dividends Gains of Capital Total Year/Period
Series AMar. 31, 2017 9.61 0.29 (0.20) 0.12 1.15 1.36 – (0.16) – – (0.16) 10.92 Mar. 31, 2016 10.07 0.30 (0.20) 0.26 (0.39) (0.03) – (0.11) – – (0.11) 9.61Mar. 31, 20153 10.00† – (0.04) – (0.07) (0.11) – – – – – 10.07
Advisor SeriesMar. 31, 2017 9.62 0.29 (0.20) 0.12 1.31 1.52 – (0.16) – – (0.16) 10.93Mar. 31, 2016 10.07 0.22 (0.18) 0.19 (0.29) (0.06) – (0.12) – – (0.12) 9.62 Mar. 31, 20153 10.00† – (0.04) – (0.11) (0.15) – – – – – 10.07
Series DMar. 31, 2017 9.63 0.29 (0.11) 0.12 1.26 1.56 – (0.27) – – (0.27) 10.92Mar. 31, 2016 10.08 0.28 (0.11) 0.24 (0.36) 0.05 – (0.19) – – (0.19) 9.63Mar. 31, 20153 10.00† – (0.02) – (0.06) (0.08) – – – – – 10.08
Series FMar. 31, 2017 9.64 0.28 (0.08) 0.12 1.05 1.37 – (0.32) – – (0.32) 10.91Mar. 31, 2016 10.09 0.28 (0.08) 0.24 (0.36) 0.08 – (0.22) – – (0.22) 9.64Mar. 31, 20153 10.00† – (0.01) – (0.11) (0.12) – – – – – 10.09
Series OMar. 31, 2017 9.65 0.30 – 0.12 1.26 1.68 – (0.34) – – (0.34) 10.99Mar. 31, 2016 10.10 0.41 – 0.35 (0.53) 0.23 – (0.31) – – (0.31) 9.65Mar. 31, 20153 10.00† – – – (0.11) (0.11) – – – – – 10.10
1 Net assets and distributions are based on the actual number of mutual fund shares outstanding at the relevant time. The increase/decrease from operations is based on the weighted average number of mutual fund shares outstanding over the financial period. This table is not intended to be a reconciliation of beginning to ending net assets per mutual fund share.
2 Distributions are reinvested in additional mutual fund shares of the Fund or paid in cash.3 From October 16, 2014.† Initial offering net asset value per mutual fund share.
71
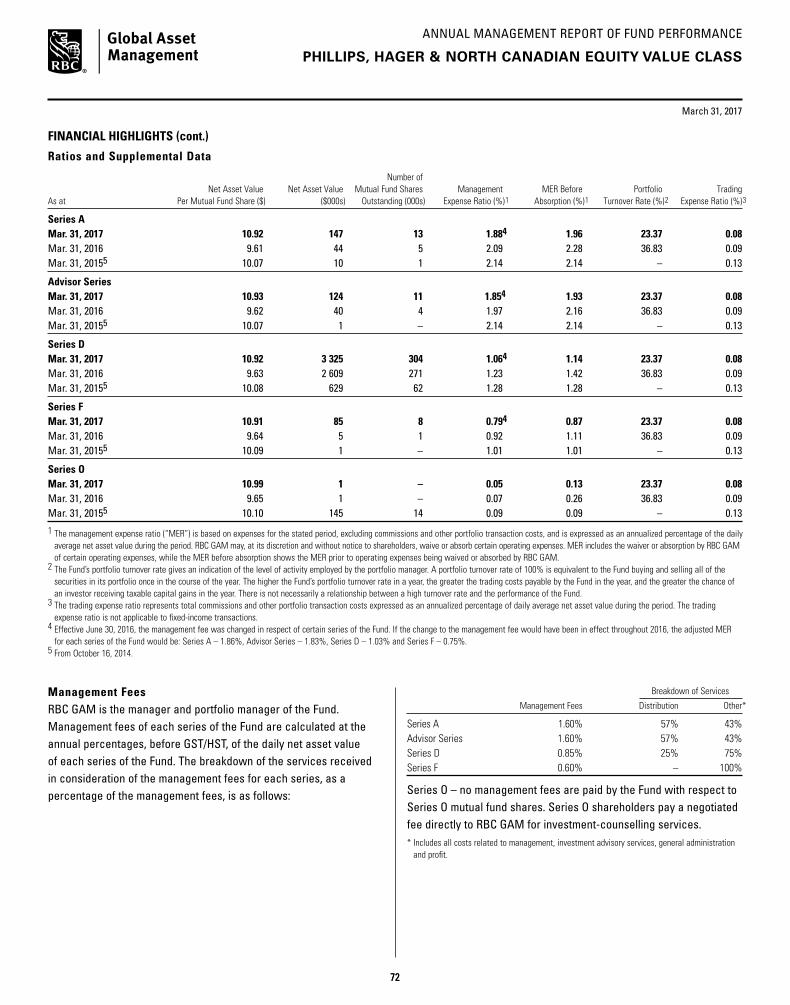
ANNUAL MANAGEMENT REPORT OF FUND PERFORMANCE
March 31, 2017
72
PHILLIPS, HAGER & NORTH CANADIAN EQUITY VALUE CLASS
FINANCIAL HIGHLIGHTS (cont.)
Ratios and Supplemental Data
Number of Net Asset Value Net Asset Value Mutual Fund Shares Management MER Before Portfolio TradingAs at Per Mutual Fund Share ($) ($000s) Outstanding (000s) Expense Ratio (%)1 Absorption (%)1 Turnover Rate (%)2 Expense Ratio (%)3
Series AMar. 31, 2017 10.92 147 13 1.884 1.96 23.37 0.08Mar. 31, 2016 9.61 44 5 2.09 2.28 36.83 0.09Mar. 31, 20155 10.07 10 1 2.14 2.14 – 0.13
Advisor SeriesMar. 31, 2017 10.93 124 11 1.854 1.93 23.37 0.08Mar. 31, 2016 9.62 40 4 1.97 2.16 36.83 0.09Mar. 31, 20155 10.07 1 – 2.14 2.14 – 0.13
Series DMar. 31, 2017 10.92 3 325 304 1.064 1.14 23.37 0.08Mar. 31, 2016 9.63 2 609 271 1.23 1.42 36.83 0.09Mar. 31, 20155 10.08 629 62 1.28 1.28 – 0.13
Series FMar. 31, 2017 10.91 85 8 0.794 0.87 23.37 0.08Mar. 31, 2016 9.64 5 1 0.92 1.11 36.83 0.09Mar. 31, 20155 10.09 1 – 1.01 1.01 – 0.13
Series OMar. 31, 2017 10.99 1 – 0.05 0.13 23.37 0.08Mar. 31, 2016 9.65 1 – 0.07 0.26 36.83 0.09Mar. 31, 20155 10.10 145 14 0.09 0.09 – 0.13
1 The management expense ratio (“MER”) is based on expenses for the stated period, excluding commissions and other portfolio transaction costs, and is expressed as an annualized percentage of the daily average net asset value during the period. RBC GAM may, at its discretion and without notice to shareholders, waive or absorb certain operating expenses. MER includes the waiver or absorption by RBC GAM of certain operating expenses, while the MER before absorption shows the MER prior to operating expenses being waived or absorbed by RBC GAM.
2 The Fund’s portfolio turnover rate gives an indication of the level of activity employed by the portfolio manager. A portfolio turnover rate of 100% is equivalent to the Fund buying and selling all of the securities in its portfolio once in the course of the year. The higher the Fund’s portfolio turnover rate in a year, the greater the trading costs payable by the Fund in the year, and the greater the chance of an investor receiving taxable capital gains in the year. There is not necessarily a relationship between a high turnover rate and the performance of the Fund.
3 The trading expense ratio represents total commissions and other portfolio transaction costs expressed as an annualized percentage of daily average net asset value during the period. The trading expense ratio is not applicable to fixed-income transactions.
4 Effective June 30, 2016, the management fee was changed in respect of certain series of the Fund. If the change to the management fee would have been in effect throughout 2016, the adjusted MER for each series of the Fund would be: Series A – 1.86%, Advisor Series – 1.83%, Series D – 1.03% and Series F – 0.75%.
5 From October 16, 2014.
Management Fees RBC GAM is the manager and portfolio manager of the Fund. Management fees of each series of the Fund are calculated at the annual percentages, before GST/HST, of the daily net asset value of each series of the Fund. The breakdown of the services received in consideration of the management fees for each series, as a percentage of the management fees, is as follows:
Breakdown of Services
Management Fees Distribution Other*
Series A 1.60% 57% 43%Advisor Series 1.60% 57% 43%Series D 0.85% 25% 75%Series F 0.60% – 100%
Series O – no management fees are paid by the Fund with respect to Series O mutual fund shares. Series O shareholders pay a negotiated fee directly to RBC GAM for investment-counselling services.* Includes all costs related to management, investment advisory services, general administration
and profit.
72
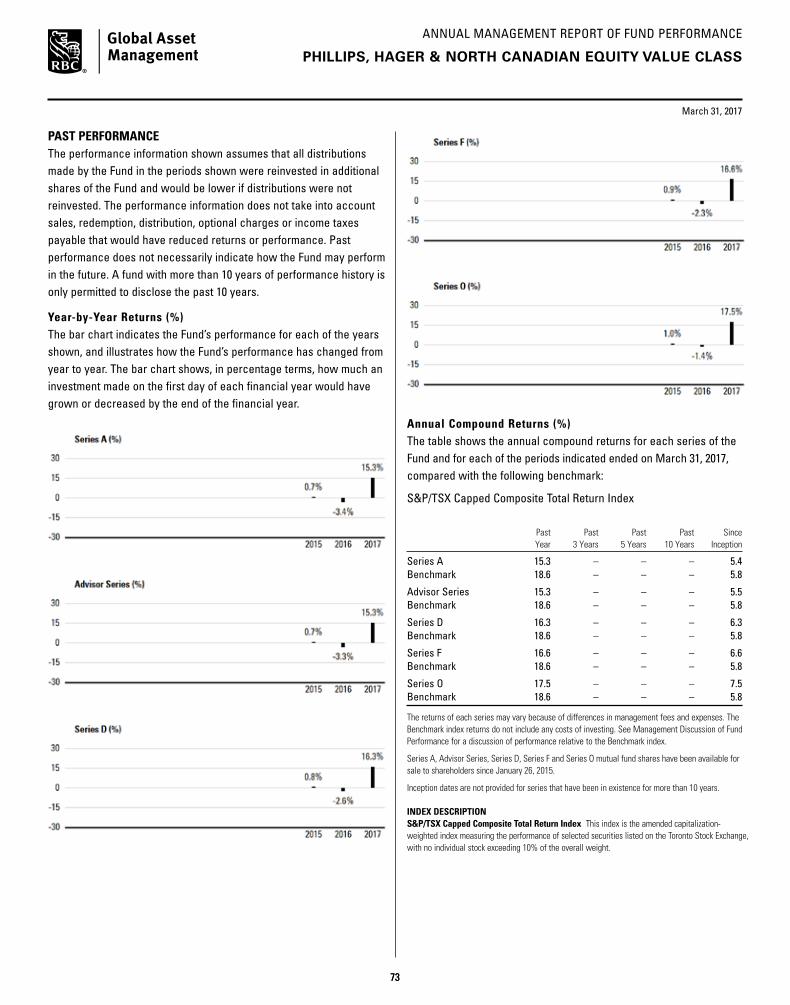
ANNUAL MANAGEMENT REPORT OF FUND PERFORMANCE
73
March 31, 2017
PHILLIPS, HAGER & NORTH CANADIAN EQUITY VALUE CLASS
Annual Compound Returns (%) The table shows the annual compound returns for each series of the Fund and for each of the periods indicated ended on March 31, 2017, compared with the following benchmark:
S&P/TSX Capped Composite Total Return Index
Past Past Past Past Since Year 3 Years 5 Years 10 Years Inception
Series A 15.3 – – – 5.4Benchmark 18.6 – – – 5.8
Advisor Series 15.3 – – – 5.5Benchmark 18.6 – – – 5.8
Series D 16.3 – – – 6.3Benchmark 18.6 – – – 5.8
Series F 16.6 – – – 6.6Benchmark 18.6 – – – 5.8
Series O 17.5 – – – 7.5Benchmark 18.6 – – – 5.8
The returns of each series may vary because of differences in management fees and expenses. The Benchmark index returns do not include any costs of investing. See Management Discussion of Fund Performance for a discussion of performance relative to the Benchmark index.
Series A, Advisor Series, Series D, Series F and Series O mutual fund shares have been available for sale to shareholders since January 26, 2015.
Inception dates are not provided for series that have been in existence for more than 10 years.
INDEX DESCRIPTIONS&P/TSX Capped Composite Total Return Index This index is the amended capitalization- weighted index measuring the performance of selected securities listed on the Toronto Stock Exchange, with no individual stock exceeding 10% of the overall weight.
PAST PERFORMANCEThe performance information shown assumes that all distributions made by the Fund in the periods shown were reinvested in additional shares of the Fund and would be lower if distributions were not reinvested. The performance information does not take into account sales, redemption, distribution, optional charges or income taxes payable that would have reduced returns or performance. Past performance does not necessarily indicate how the Fund may perform in the future. A fund with more than 10 years of performance history is only permitted to disclose the past 10 years.
Year-by-Year Returns (%) The bar chart indicates the Fund’s performance for each of the years shown, and illustrates how the Fund’s performance has changed from year to year. The bar chart shows, in percentage terms, how much an investment made on the first day of each financial year would have grown or decreased by the end of the financial year.
73

ANNUAL MANAGEMENT REPORT OF FUND PERFORMANCE
74
March 31, 2017
SUMMARY OF INVESTMENT PORTFOLIO(after consideration of derivative products, if any)As at March 31, 2017
Investment Mix % of Net Asset Value
Financials 37.7Energy 21.9Materials 9.2Industrials 8.6Consumer Discretionary 4.5Consumer Staples 4.5Telecommunication Services 3.2Utilities 2.6Information Technology 2.4Real Estate 2.1Health Care 0.5Cash/Other 2.8
Top 25 Holdings* % of Net Asset Value
Royal Bank of Canada 6.8Toronto-Dominion Bank 6.5Bank of Nova Scotia 4.8Enbridge Inc. 4.6Canadian National Railway Co. 4.1Suncor Energy Inc. 3.8Bank of Montreal 3.6TransCanada Corp. 3.1Canadian Natural Resources Ltd. 3.1Brookfield Asset Management Inc., Class A 3.0Cash & Cash Equivalents 2.6Manulife Financial Corporation 2.5Canadian Imperial Bank of Commerce 2.2Loblaw Companies Ltd. 1.9BCE Inc. 1.9Barrick Gold Corp. 1.7Power Corporation of Canada 1.6Waste Connections Inc. 1.5Sun Life Financial Inc. 1.5Canadian Pacific Railway Ltd. 1.4CGI Group Inc., Class A 1.3Alimentation Couche-Tard Inc. 1.3Potash Corporation of Saskatchewan Inc. 1.2Agrium Inc. 1.1Shaw Communications Inc., Class B 1.0Top 25 Holdings 68.1
* The Fund invests substantially all of its assets directly in the Phillips, Hager & North Canadian Equity Value Fund. The above are the Top 25 holdings of the Phillips, Hager & North Canadian Equity Value Fund.
The Summary of Investment Portfolio may change due to ongoing portfolio transactions of the Fund and a quarterly update is available at www.rbcgam.com/funds.
The Simplified Prospectus and other information about the underlying fund are available on SEDAR website at www.sedar.com.
PHILLIPS, HAGER & NORTH CANADIAN EQUITY VALUE CLASS
74
ANNUAL MANAGEMENT REPORT OF FUND PERFORMANCE
75
CANADIAN EQUITY FUND
RBC CANADIAN EQUITY INCOME CLASS
March 31, 2017
Portfolio Manager RBC Global Asset Management Inc. (“RBC GAM”)
This annual management report of fund performance (“MRFP”) contains financial highlights but does not contain the complete annual financial statements of the Fund. You can get a copy of the financial statements at your request, and at no cost, by calling 1-800-463-FUND (3863), by writing to us at RBC Global Asset Management Inc., P.O. Box 7500, Station A, Toronto, Ontario M5W 1P9, or by visiting our website at www.rbcgam.com/reports or SEDAR at www.sedar.com. Security holders may also contact us using one of these methods to request a copy of the Fund’s proxy voting policies and procedures, proxy voting disclosure record, or quarterly portfolio disclosure.
The Board of Directors of RBC Corporate Class Inc. approved this annual management report of fund performance on May 11, 2017.
A Note on Forward-looking Statements
This report may contain forward-looking statements about the Fund, its future performance, strategies or prospects, and possible future Fund action. The words “may,” “could,” “should,” “would,” “suspect,” “outlook,” “believe,” “plan,” “anticipate,” “estimate,” “expect,” “intend,” “forecast,” “objective” and similar expressions are intended to identify forward-looking statements.
Forward-looking statements are not guarantees of future performance. Forward-looking statements involve inherent risks and uncertainties, both about the Fund and general economic factors, so it is possible that predictions, forecasts, projections and other forward-looking statements will not be achieved. We caution you not to place undue reliance on these statements as a number of important factors could cause actual events or results to differ materially from those expressed or implied in any forward-looking statement made in relation to the Fund. These factors include, but are not limited to, general economic, political and market factors in Canada, the United States and internationally, interest and foreign exchange rates, global equity and capital markets, business competition, technological changes, changes in laws and regulations, judicial or regulatory judgments, legal proceedings and catastrophic events.
The above list of important factors that may affect future results is not exhaustive. Before making any investment decisions, we encourage you to consider these and other factors carefully. All opinions contained in forward-looking statements are subject to change without notice and are provided in good faith but without legal responsibility.
75

ANNUAL MANAGEMENT REPORT OF FUND PERFORMANCE
March 31, 2017
76
MANAGEMENT DISCUSSION OF FUND PERFORMANCE
Investment Objective and StrategiesThe Fund seeks to provide long-term capital growth by investing primarily in a diversified portfolio of Canadian securities including, but not limited to, common and preferred shares of Canadian companies that pay dividends, real estate investment trusts and income trusts.
To achieve its investment objective, the Fund invests most of its assets in the RBC Canadian Equity Income Fund (the “underlying fund”). The underlying fund invests primarily in a diversified portfolio of Canadian equity securities including common and preferred shares, real estate investment trusts and income trusts. The underlying fund may also invest in fixed-income securities, such as government and corporate bonds, debentures and notes.
RiskThere were no significant changes to the investment objective and strategies that affected the Fund’s overall level of risk during the reporting period. The risks of investing in the Fund and the suitability of the Fund for investors remain as discussed in the Simplified Prospectus.
Results of OperationsThe Fund’s net asset value rose to $194 million as of March 31, 2017, from $182 million as of March 31, 2016. The increase was due to investment returns.
Over the past year, the Fund’s Series A shares gained 17.6%, which underperformed the 18.6% rise in the benchmark. The Fund’s return is after the deduction of fees and expenses, while the benchmark and broad-based index returns do not include any costs of investing. See the Financial Highlights section for the management expense ratios and the Past Performance section for the returns of any other series, which may vary because of differences in management fees and expenses.
During the period, the S&P/TSX Composite Index, Canada’s equity benchmark, outperformed most other global indexes, as heavyweight sectors Financials, Energy and Materials all strengthened. During the period, crude-oil prices recovered from levels that were well below the marginal cost of production, and increased further following OPEC’s announced plans to cut its output. Investors were preoccupied with persistent concerns about the unabated surge in prices for Canadian residential real estate, the failure of manufacturing to take the reins from energy as the driver of Canadian economic growth and expectations that interest-rate increases in Canada are likely to lag the U.S. Financial stocks continued their strong move higher on the rise of interest rates and the potential for less regulation. The Canadian Financials sector was no exception, with Canadian banks gaining 25% over the period. Shares of lumber and copper producers also performed strongly, benefiting from the rise in the underlying commodities.
The Fund had a below-benchmark allocation to the Materials sector and this detracted from performance. Precious-metals prices began 2016 with sharp rallies, offering a safe haven as weak oil prices and concern about the sustainability of economic growth led to one of the worst starts ever for the U.S. stock market. President Trump’s proposals for tax cuts, infrastructure spending and deregulation boosted the U.S. dollar and bond yields, diminishing gold’s allure. The December and March interest rate hikes by the U.S. Federal Reserve, coupled with expectations that it will continue to raise rates in 2017, further pressured precious metal prices.
An overweight position in Energy aided the Fund’s performance. Prices for energy-related commodities were volatile during the period. Crude-oil benchmark prices rebounded once the market became more comfortable that production cuts were taking effect and that international demand remained strong. Decisions by OPEC countries to cut production by a total of about 2% drove oil prices around US$50 a barrel by the end of the period and were expected to accelerate the reduction of global inventories to more normal levels.
Recent DevelopmentsMarket valuations, although elevated in absolute terms, are not inconsistent with a low-interest-rate, low-inflation environment. That said, the portfolio manager believes earnings acceleration will now be a key focus. In the Financials sector, the success of the banks’ non-domestic businesses will likely be a key differentiator of performance. Concurrently, while OPEC’s plan to cut output is a positive for the Energy sector, the portfolio manager will be watching the U.S. shale sector for signs of re-acceleration as the year progresses. The portfolio manager continues to believe that large companies with long-life reserves and strong balance sheets will deliver attractive levels of free cash as crude prices rally.
On December 15, 2016, the Canadian government enacted new tax rules that eliminate the ability of investors to switch among different classes of RBC Corporate Class Funds on a tax-deferred basis. The new rules do not apply to switches between different series of the same fund.
Effective December 1, 2016, Mr. Lloyd R. McGinnis retired and Ms. Élaine Cousineau was appointed as Chair of the Independent Review Committee (the “IRC”). Mr. Charles F. Macfarlane was appointed as Vice Chair of the IRC. Effective January 1, 2017, Ms. Suromitra Sanatani and Ms. Catherine Kloepfer were appointed as members of the IRC.
Effective July 1, 2016, Deloitte LLP resigned and PricewaterhouseCoopers LLP was appointed as auditors of the Fund.
RBC CANADIAN EQUITY INCOME CLASS
76

ANNUAL MANAGEMENT REPORT OF FUND PERFORMANCE
March 31, 2017
77
RBC CANADIAN EQUITY INCOME CLASS
Effective June 30, 2016, management fees were reduced as follows: from 1.75% to 1.60% in respect of Series A mutual fund shares, Advisor Series mutual fund shares, Advisor T5 Series mutual fund shares and Series T5 mutual fund shares; from 1.00% to 0.85% in respect of Series D mutual fund shares; and from 0.75% to 0.60% in respect of Series F mutual fund shares and Series FT5 mutual fund shares. Also effective June 30, 2016, Series H mutual fund shares were re-designated to Series A mutual fund shares and Series I mutual fund shares were re-designated to Series F mutual fund shares.
Related-Party TransactionsManager and Portfolio ManagerRBC GAM is an indirect, wholly owned subsidiary of Royal Bank of Canada (“Royal Bank”) and is the manager and portfolio manager of the Fund. RBC GAM is responsible for the Fund’s day-to-day operations, provides investment advice and portfolio management services to the Fund and appoints distributors for the Fund. RBC GAM is paid a management fee by the Fund as compensation for its services. The Fund pays a fixed administration fee to RBC GAM, which, in turn, pays certain operating expenses of the Fund.
Affiliates of RBC GAM that provide services to the Fund in the course of their normal businesses are discussed below.
DistributorsRBC GAM, Royal Mutual Funds Inc., RBC Direct Investing Inc., RBC Dominion Securities Inc. and Phillips, Hager & North Investment Funds Ltd. are the principal distributors of, or distribute certain series of the mutual fund shares of, the Fund. Dealers receive an ongoing commission based on the total value of their clients’ Series A, Advisor Series, Advisor T5 Series, Series T5 and Series D mutual fund shares.
CustodianRBC Investor Services Trust (“RBC IS”) is the custodian and holds the assets of the Fund.
RegistrarsRoyal Bank, RBC IS and RBC GAM are the registrars of the Fund and keep records of who owns the mutual fund shares of the Fund.
Other Related-Party TransactionsPursuant to applicable securities legislation, the Fund relied on the standing instructions from the Independent Review Committee with respect to one or more of the following transactions:
Related-Party Trading Activities(a) trades in securities of Royal Bank;
(b) investments in the securities of issuers for which a related-party dealer acted as an underwriter during the distribution of such securities and the 60-day period following the conclusion of such distribution of the underwritten securities to the public;
(c) purchases of equity and debt securities from or sales of equity or debt securities to a related-party dealer, where it acted as principal; and
Inter-Fund Trading(d) purchases or sales of securities of an issuer from or to another
investment fund or managed account managed by RBC GAM.
The applicable standing instructions require that Related-Party Trading Activities and Inter-Fund Trading be conducted in accordance with RBC GAM policy and that RBC GAM advise the Independent Review Committee of a material breach of any standing instruction. RBC GAM policy requires that an investment decision in respect of Related-Party Trading Activities (i) is made free from any influence of Royal Bank or its associates or affiliates and without taking into account any consideration relevant to Royal Bank or its affiliates or associates, (ii) represents the business judgment of the portfolio manager, uninfluenced by considerations other than the best interests of the Fund, (iii) is in compliance with RBC GAM policies and procedures, and (iv) achieves a fair and reasonable result for the Fund. RBC GAM policy requires that an investment decision in respect of Inter-Fund Trading is in the best interests of each Fund.
77
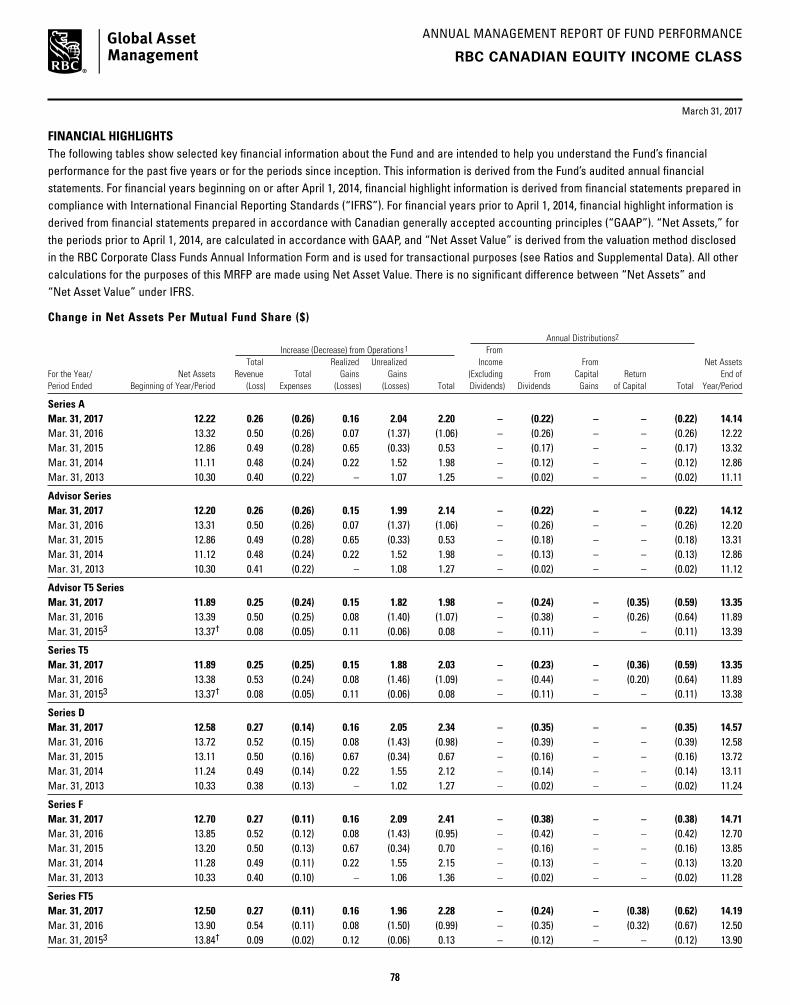
ANNUAL MANAGEMENT REPORT OF FUND PERFORMANCE
March 31, 2017
78
FINANCIAL HIGHLIGHTS The following tables show selected key financial information about the Fund and are intended to help you understand the Fund’s financial performance for the past five years or for the periods since inception. This information is derived from the Fund’s audited annual financial statements. For financial years beginning on or after April 1, 2014, financial highlight information is derived from financial statements prepared in compliance with International Financial Reporting Standards (“IFRS”). For financial years prior to April 1, 2014, financial highlight information is derived from financial statements prepared in accordance with Canadian generally accepted accounting principles (“GAAP”). “Net Assets,” for the periods prior to April 1, 2014, are calculated in accordance with GAAP, and “Net Asset Value” is derived from the valuation method disclosed in the RBC Corporate Class Funds Annual Information Form and is used for transactional purposes (see Ratios and Supplemental Data). All other calculations for the purposes of this MRFP are made using Net Asset Value. There is no significant difference between “Net Assets” and “Net Asset Value” under IFRS.
Change in Net Assets Per Mutual Fund Share ($)
Annual Distributions2
Increase (Decrease) from Operations1 From Total Realized Unrealized Income From Net Assets For the Year/ Net Assets Revenue Total Gains Gains (Excluding From Capital Return End of Period Ended Beginning of Year/Period (Loss) Expenses (Losses) (Losses) Total Dividends) Dividends Gains of Capital Total Year/Period
Series AMar. 31, 2017 12.22 0.26 (0.26) 0.16 2.04 2.20 – (0.22) – – (0.22) 14.14 Mar. 31, 2016 13.32 0.50 (0.26) 0.07 (1.37) (1.06) – (0.26) – – (0.26) 12.22Mar. 31, 2015 12.86 0.49 (0.28) 0.65 (0.33) 0.53 – (0.17) – – (0.17) 13.32 Mar. 31, 2014 11.11 0.48 (0.24) 0.22 1.52 1.98 – (0.12) – – (0.12) 12.86Mar. 31, 2013 10.30 0.40 (0.22) – 1.07 1.25 – (0.02) – – (0.02) 11.11
Advisor SeriesMar. 31, 2017 12.20 0.26 (0.26) 0.15 1.99 2.14 – (0.22) – – (0.22) 14.12Mar. 31, 2016 13.31 0.50 (0.26) 0.07 (1.37) (1.06) – (0.26) – – (0.26) 12.20Mar. 31, 2015 12.86 0.49 (0.28) 0.65 (0.33) 0.53 – (0.18) – – (0.18) 13.31 Mar. 31, 2014 11.12 0.48 (0.24) 0.22 1.52 1.98 – (0.13) – – (0.13) 12.86Mar. 31, 2013 10.30 0.41 (0.22) – 1.08 1.27 – (0.02) – – (0.02) 11.12
Advisor T5 SeriesMar. 31, 2017 11.89 0.25 (0.24) 0.15 1.82 1.98 – (0.24) – (0.35) (0.59) 13.35Mar. 31, 2016 13.39 0.50 (0.25) 0.08 (1.40) (1.07) – (0.38) – (0.26) (0.64) 11.89Mar. 31, 20153 13.37† 0.08 (0.05) 0.11 (0.06) 0.08 – (0.11) – – (0.11) 13.39
Series T5Mar. 31, 2017 11.89 0.25 (0.25) 0.15 1.88 2.03 – (0.23) – (0.36) (0.59) 13.35Mar. 31, 2016 13.38 0.53 (0.24) 0.08 (1.46) (1.09) – (0.44) – (0.20) (0.64) 11.89Mar. 31, 20153 13.37† 0.08 (0.05) 0.11 (0.06) 0.08 – (0.11) – – (0.11) 13.38
Series DMar. 31, 2017 12.58 0.27 (0.14) 0.16 2.05 2.34 – (0.35) – – (0.35) 14.57Mar. 31, 2016 13.72 0.52 (0.15) 0.08 (1.43) (0.98) – (0.39) – – (0.39) 12.58Mar. 31, 2015 13.11 0.50 (0.16) 0.67 (0.34) 0.67 – (0.16) – – (0.16) 13.72Mar. 31, 2014 11.24 0.49 (0.14) 0.22 1.55 2.12 – (0.14) – – (0.14) 13.11Mar. 31, 2013 10.33 0.38 (0.13) – 1.02 1.27 – (0.02) – – (0.02) 11.24
Series FMar. 31, 2017 12.70 0.27 (0.11) 0.16 2.09 2.41 – (0.38) – – (0.38) 14.71Mar. 31, 2016 13.85 0.52 (0.12) 0.08 (1.43) (0.95) – (0.42) – – (0.42) 12.70Mar. 31, 2015 13.20 0.50 (0.13) 0.67 (0.34) 0.70 – (0.16) – – (0.16) 13.85 Mar. 31, 2014 11.28 0.49 (0.11) 0.22 1.55 2.15 – (0.13) – – (0.13) 13.20Mar. 31, 2013 10.33 0.40 (0.10) – 1.06 1.36 – (0.02) – – (0.02) 11.28
Series FT5Mar. 31, 2017 12.50 0.27 (0.11) 0.16 1.96 2.28 – (0.24) – (0.38) (0.62) 14.19Mar. 31, 2016 13.90 0.54 (0.11) 0.08 (1.50) (0.99) – (0.35) – (0.32) (0.67) 12.50Mar. 31, 20153 13.84† 0.09 (0.02) 0.12 (0.06) 0.13 – (0.12) – – (0.12) 13.90
RBC CANADIAN EQUITY INCOME CLASS
78

ANNUAL MANAGEMENT REPORT OF FUND PERFORMANCE
March 31, 2017
79
RBC CANADIAN EQUITY INCOME CLASS
FINANCIAL HIGHLIGHTS (cont.)
Change in Net Assets Per Mutual Fund Share ($) (cont.)
Annual Distributions2
Increase (Decrease) from Operations1 From Total Realized Unrealized Income From Net Assets For the Year/ Net Assets Revenue Total Gains Gains (Excluding From Capital Return End of Period Ended Beginning of Year/Period (Loss) Expenses (Losses) (Losses) Total Dividends) Dividends Gains of Capital Total Year/Period
Series OMar. 31, 2017 12.93 0.28 – 0.17 2.11 2.56 – (0.52) – – (0.52) 14.97Mar. 31, 2016 14.12 0.54 – 0.08 (1.49) (0.87) – (0.55) – – (0.55) 12.93Mar. 31, 2015 13.48 0.52 – 0.70 (0.35) 0.87 – (0.31) – – (0.31) 14.12Mar. 31, 2014 11.40 0.49 – 0.22 1.57 2.28 – (0.12) – – (0.12) 13.48Mar. 31, 2013 10.36 0.45 – 0.01 1.19 1.65 – (0.02) – – (0.02) 11.40
1 Net assets and distributions are based on the actual number of mutual fund shares outstanding at the relevant time. The increase/decrease from operations is based on the weighted average number of mutual fund shares outstanding over the financial period. This table is not intended to be a reconciliation of beginning to ending net assets per mutual fund share.
2 Distributions are reinvested in additional mutual fund shares of the Fund or paid in cash.3 From October 16, 2014.† Initial offering net asset value per mutual fund share.
Ratios and Supplemental Data
Number of Net Asset Value Net Asset Value Mutual Fund Shares Management MER Before Portfolio TradingAs at Per Mutual Fund Share ($) ($000s) Outstanding (000s) Expense Ratio (%)1 Absorption (%)1 Turnover Rate (%)2 Expense Ratio (%)3
Series AMar. 31, 2017 14.14 47 493 3 359 1.964 1.96 2.73 0.13Mar. 31, 2016 12.22 39 064 3 198 2.10 2.10 3.58 0.14Mar. 31, 2015 13.32 57 773 4 337 2.10 2.11 7.35 0.16 Mar. 31, 2014 12.86 46 956 3 651 2.11 2.11 9.03 0.21Mar. 31, 2013 11.11 30 397 2 741 2.12 2.12 3.33 0.38
Advisor SeriesMar. 31, 2017 14.12 45 406 3 215 1.984 1.98 2.73 0.13Mar. 31, 2016 12.20 48 330 3 960 2.11 2.11 3.58 0.14Mar. 31, 2015 13.31 73 116 5 493 2.10 2.11 7.35 0.16 Mar. 31, 2014 12.86 66 114 5 143 2.11 2.11 9.03 0.21Mar. 31, 2013 11.12 50 675 4 567 2.11 2.11 3.33 0.38
Advisor T5 SeriesMar. 31, 2017 13.35 1 614 121 1.934 1.93 2.73 0.13Mar. 31, 2016 11.89 645 54 2.13 2.13 3.58 0.14Mar. 31, 20155 13.39 50 4 2.15 2.16 7.35 0.16
Series T5Mar. 31, 2017 13.35 1 399 105 1.964 1.96 2.73 0.13Mar. 31, 2016 11.89 907 76 2.08 2.08 3.58 0.14Mar. 31, 20155 13.38 140 10 2.15 2.16 7.35 0.16
Series DMar. 31, 2017 14.57 18 394 1 263 1.074 1.07 2.73 0.13Mar. 31, 2016 12.58 16 637 1 323 1.20 1.20 3.58 0.14Mar. 31, 2015 13.72 17 374 1 266 1.20 1.21 7.35 0.16 Mar. 31, 2014 13.11 12 626 963 1.20 1.20 9.03 0.21Mar. 31, 2013 11.24 9 685 863 1.24 1.24 3.33 0.38
79
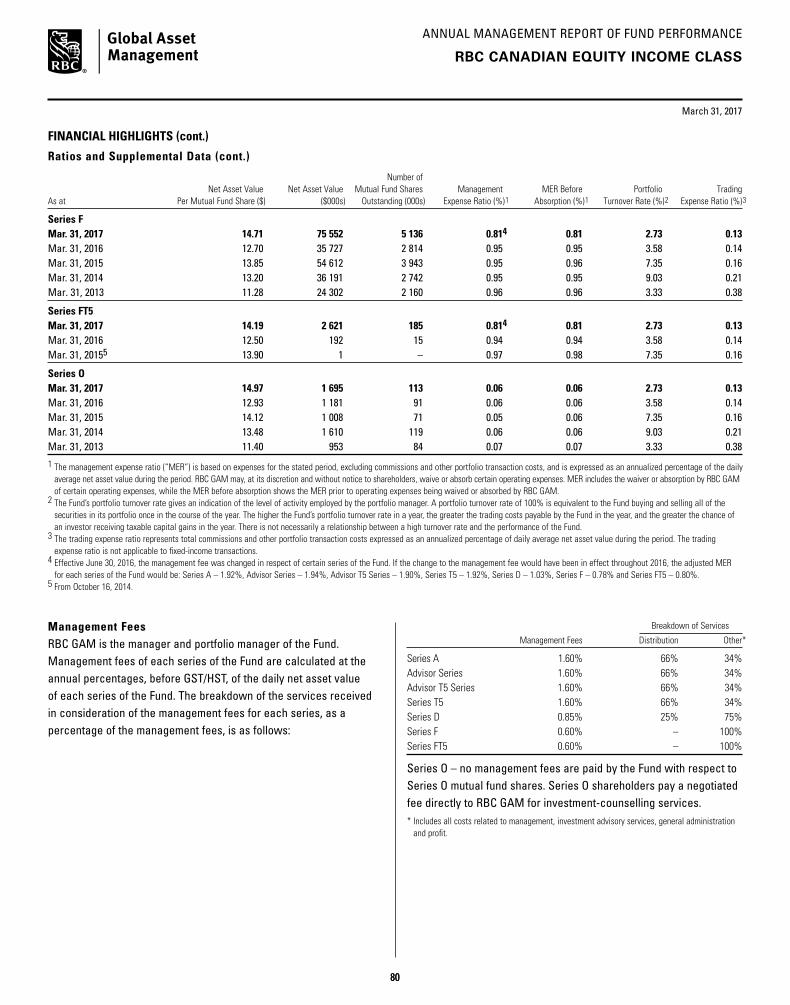
ANNUAL MANAGEMENT REPORT OF FUND PERFORMANCE
March 31, 2017
80
RBC CANADIAN EQUITY INCOME CLASS
FINANCIAL HIGHLIGHTS (cont.)
Ratios and Supplemental Data (cont.)
Number of Net Asset Value Net Asset Value Mutual Fund Shares Management MER Before Portfolio TradingAs at Per Mutual Fund Share ($) ($000s) Outstanding (000s) Expense Ratio (%)1 Absorption (%)1 Turnover Rate (%)2 Expense Ratio (%)3
Series FMar. 31, 2017 14.71 75 552 5 136 0.814 0.81 2.73 0.13Mar. 31, 2016 12.70 35 727 2 814 0.95 0.95 3.58 0.14Mar. 31, 2015 13.85 54 612 3 943 0.95 0.96 7.35 0.16 Mar. 31, 2014 13.20 36 191 2 742 0.95 0.95 9.03 0.21Mar. 31, 2013 11.28 24 302 2 160 0.96 0.96 3.33 0.38
Series FT5Mar. 31, 2017 14.19 2 621 185 0.814 0.81 2.73 0.13Mar. 31, 2016 12.50 192 15 0.94 0.94 3.58 0.14Mar. 31, 20155 13.90 1 – 0.97 0.98 7.35 0.16
Series OMar. 31, 2017 14.97 1 695 113 0.06 0.06 2.73 0.13Mar. 31, 2016 12.93 1 181 91 0.06 0.06 3.58 0.14Mar. 31, 2015 14.12 1 008 71 0.05 0.06 7.35 0.16 Mar. 31, 2014 13.48 1 610 119 0.06 0.06 9.03 0.21Mar. 31, 2013 11.40 953 84 0.07 0.07 3.33 0.38
1 The management expense ratio (“MER”) is based on expenses for the stated period, excluding commissions and other portfolio transaction costs, and is expressed as an annualized percentage of the daily average net asset value during the period. RBC GAM may, at its discretion and without notice to shareholders, waive or absorb certain operating expenses. MER includes the waiver or absorption by RBC GAM of certain operating expenses, while the MER before absorption shows the MER prior to operating expenses being waived or absorbed by RBC GAM.
2 The Fund’s portfolio turnover rate gives an indication of the level of activity employed by the portfolio manager. A portfolio turnover rate of 100% is equivalent to the Fund buying and selling all of the securities in its portfolio once in the course of the year. The higher the Fund’s portfolio turnover rate in a year, the greater the trading costs payable by the Fund in the year, and the greater the chance of an investor receiving taxable capital gains in the year. There is not necessarily a relationship between a high turnover rate and the performance of the Fund.
3 The trading expense ratio represents total commissions and other portfolio transaction costs expressed as an annualized percentage of daily average net asset value during the period. The trading expense ratio is not applicable to fixed-income transactions.
4 Effective June 30, 2016, the management fee was changed in respect of certain series of the Fund. If the change to the management fee would have been in effect throughout 2016, the adjusted MER for each series of the Fund would be: Series A – 1.92%, Advisor Series – 1.94%, Advisor T5 Series – 1.90%, Series T5 – 1.92%, Series D – 1.03%, Series F – 0.78% and Series FT5 – 0.80%.
5 From October 16, 2014.
Management Fees RBC GAM is the manager and portfolio manager of the Fund. Management fees of each series of the Fund are calculated at the annual percentages, before GST/HST, of the daily net asset value of each series of the Fund. The breakdown of the services received in consideration of the management fees for each series, as a percentage of the management fees, is as follows:
Breakdown of Services
Management Fees Distribution Other*
Series A 1.60% 66% 34% Advisor Series 1.60% 66% 34% Advisor T5 Series 1.60% 66% 34%Series T5 1.60% 66% 34%Series D 0.85% 25% 75%Series F 0.60% – 100% Series FT5 0.60% – 100%
Series O – no management fees are paid by the Fund with respect to Series O mutual fund shares. Series O shareholders pay a negotiated fee directly to RBC GAM for investment-counselling services.* Includes all costs related to management, investment advisory services, general administration
and profit.
80
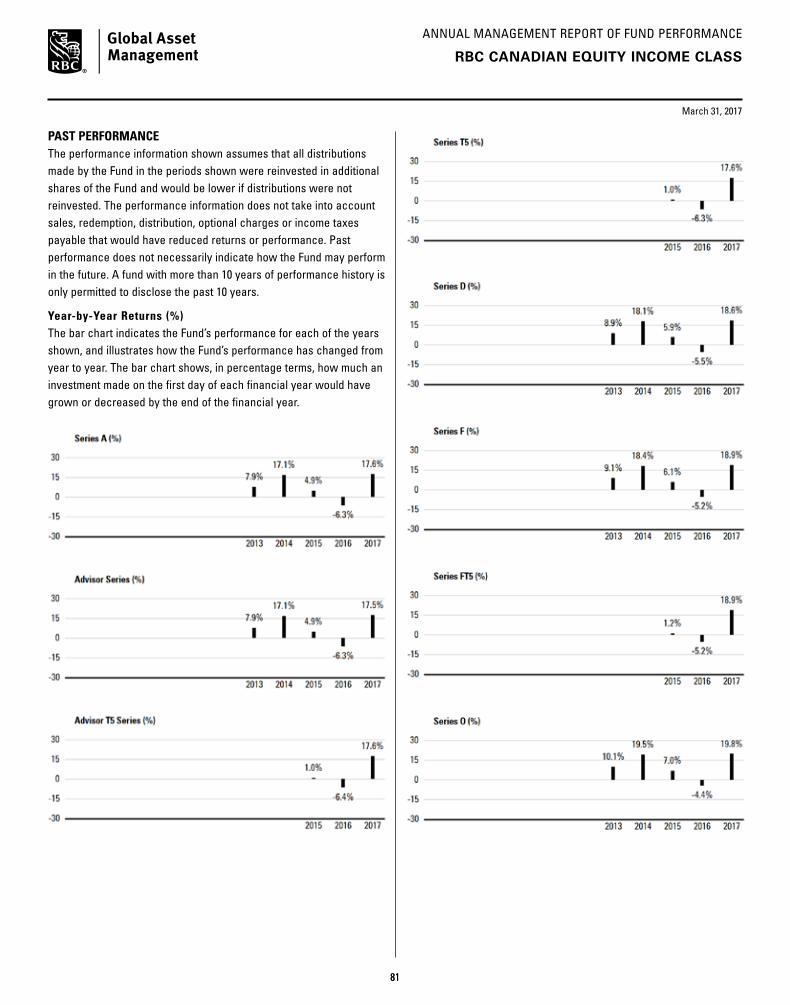
ANNUAL MANAGEMENT REPORT OF FUND PERFORMANCE
March 31, 2017
81
PAST PERFORMANCEThe performance information shown assumes that all distributions made by the Fund in the periods shown were reinvested in additional shares of the Fund and would be lower if distributions were not reinvested. The performance information does not take into account sales, redemption, distribution, optional charges or income taxes payable that would have reduced returns or performance. Past performance does not necessarily indicate how the Fund may perform in the future. A fund with more than 10 years of performance history is only permitted to disclose the past 10 years.
Year-by-Year Returns (%) The bar chart indicates the Fund’s performance for each of the years shown, and illustrates how the Fund’s performance has changed from year to year. The bar chart shows, in percentage terms, how much an investment made on the first day of each financial year would have grown or decreased by the end of the financial year.
RBC CANADIAN EQUITY INCOME CLASS
81
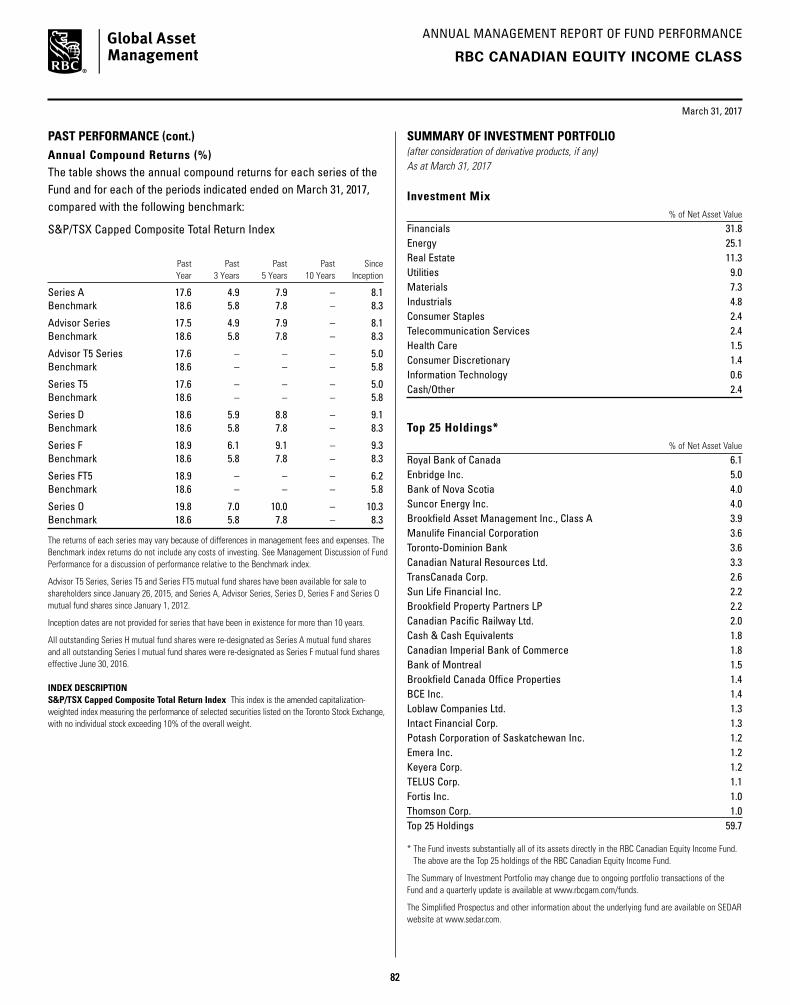
ANNUAL MANAGEMENT REPORT OF FUND PERFORMANCE
March 31, 2017
82
PAST PERFORMANCE (cont.)Annual Compound Returns (%) The table shows the annual compound returns for each series of the Fund and for each of the periods indicated ended on March 31, 2017, compared with the following benchmark:
S&P/TSX Capped Composite Total Return Index
Past Past Past Past Since Year 3 Years 5 Years 10 Years Inception
Series A 17.6 4.9 7.9 – 8.1Benchmark 18.6 5.8 7.8 – 8.3
Advisor Series 17.5 4.9 7.9 – 8.1Benchmark 18.6 5.8 7.8 – 8.3
Advisor T5 Series 17.6 – – – 5.0Benchmark 18.6 – – – 5.8
Series T5 17.6 – – – 5.0Benchmark 18.6 – – – 5.8
Series D 18.6 5.9 8.8 – 9.1Benchmark 18.6 5.8 7.8 – 8.3
Series F 18.9 6.1 9.1 – 9.3Benchmark 18.6 5.8 7.8 – 8.3
Series FT5 18.9 – – – 6.2Benchmark 18.6 – – – 5.8
Series O 19.8 7.0 10.0 – 10.3Benchmark 18.6 5.8 7.8 – 8.3
The returns of each series may vary because of differences in management fees and expenses. The Benchmark index returns do not include any costs of investing. See Management Discussion of Fund Performance for a discussion of performance relative to the Benchmark index.
Advisor T5 Series, Series T5 and Series FT5 mutual fund shares have been available for sale to shareholders since January 26, 2015, and Series A, Advisor Series, Series D, Series F and Series O mutual fund shares since January 1, 2012.
Inception dates are not provided for series that have been in existence for more than 10 years.
All outstanding Series H mutual fund shares were re-designated as Series A mutual fund shares and all outstanding Series I mutual fund shares were re-designated as Series F mutual fund shares effective June 30, 2016.
INDEX DESCRIPTIONS&P/TSX Capped Composite Total Return Index This index is the amended capitalization-weighted index measuring the performance of selected securities listed on the Toronto Stock Exchange, with no individual stock exceeding 10% of the overall weight.
RBC CANADIAN EQUITY INCOME CLASS
SUMMARY OF INVESTMENT PORTFOLIO(after consideration of derivative products, if any)As at March 31, 2017
Investment Mix % of Net Asset Value
Financials 31.8Energy 25.1Real Estate 11.3Utilities 9.0Materials 7.3Industrials 4.8Consumer Staples 2.4Telecommunication Services 2.4Health Care 1.5Consumer Discretionary 1.4Information Technology 0.6Cash/Other 2.4
Top 25 Holdings* % of Net Asset Value
Royal Bank of Canada 6.1Enbridge Inc. 5.0Bank of Nova Scotia 4.0Suncor Energy Inc. 4.0Brookfield Asset Management Inc., Class A 3.9Manulife Financial Corporation 3.6Toronto-Dominion Bank 3.6Canadian Natural Resources Ltd. 3.3TransCanada Corp. 2.6Sun Life Financial Inc. 2.2Brookfield Property Partners LP 2.2Canadian Pacific Railway Ltd. 2.0Cash & Cash Equivalents 1.8Canadian Imperial Bank of Commerce 1.8Bank of Montreal 1.5Brookfield Canada Office Properties 1.4BCE Inc. 1.4Loblaw Companies Ltd. 1.3Intact Financial Corp. 1.3Potash Corporation of Saskatchewan Inc. 1.2Emera Inc. 1.2Keyera Corp. 1.2TELUS Corp. 1.1Fortis Inc. 1.0Thomson Corp. 1.0Top 25 Holdings 59.7
* The Fund invests substantially all of its assets directly in the RBC Canadian Equity Income Fund. The above are the Top 25 holdings of the RBC Canadian Equity Income Fund.
The Summary of Investment Portfolio may change due to ongoing portfolio transactions of the Fund and a quarterly update is available at www.rbcgam.com/funds.
The Simplified Prospectus and other information about the underlying fund are available on SEDAR website at www.sedar.com.
82

ANNUAL MANAGEMENT REPORT OF FUND PERFORMANCE
83
CANADIAN EQUITY FUND
RBC CANADIAN MID-CAP EQUITY CLASS
March 31, 2017
Portfolio Manager RBC Global Asset Management Inc. (“RBC GAM”)
This annual management report of fund performance (“MRFP”) contains financial highlights but does not contain the complete annual financial statements of the Fund. You can get a copy of the financial statements at your request, and at no cost, by calling 1-800-463-FUND (3863), by writing to us at RBC Global Asset Management Inc., P.O. Box 7500, Station A, Toronto, Ontario M5W 1P9, or by visiting our website at www.rbcgam.com/reports or SEDAR at www.sedar.com. Security holders may also contact us using one of these methods to request a copy of the Fund’s proxy voting policies and procedures, proxy voting disclosure record, or quarterly portfolio disclosure.
The Board of Directors of RBC Corporate Class Inc. approved this annual management report of fund performance on May 11, 2017.
A Note on Forward-looking Statements
This report may contain forward-looking statements about the Fund, its future performance, strategies or prospects, and possible future Fund action. The words “may,” “could,” “should,” “would,” “suspect,” “outlook,” “believe,” “plan,” “anticipate,” “estimate,” “expect,” “intend,” “forecast,” “objective” and similar expressions are intended to identify forward-looking statements.
Forward-looking statements are not guarantees of future performance. Forward-looking statements involve inherent risks and uncertainties, both about the Fund and general economic factors, so it is possible that predictions, forecasts, projections and other forward-looking statements will not be achieved. We caution you not to place undue reliance on these statements as a number of important factors could cause actual events or results to differ materially from those expressed or implied in any forward-looking statement made in relation to the Fund. These factors include, but are not limited to, general economic, political and market factors in Canada, the United States and internationally, interest and foreign exchange rates, global equity and capital markets, business competition, technological changes, changes in laws and regulations, judicial or regulatory judgments, legal proceedings and catastrophic events.
The above list of important factors that may affect future results is not exhaustive. Before making any investment decisions, we encourage you to consider these and other factors carefully. All opinions contained in forward-looking statements are subject to change without notice and are provided in good faith but without legal responsibility.
83
ANNUAL MANAGEMENT REPORT OF FUND PERFORMANCE
March 31, 2017
84
MANAGEMENT DISCUSSION OF FUND PERFORMANCE
Investment Objective and StrategiesThe Fund seeks to provide long-term capital growth by investing primarily in equity securities of mid-sized Canadian companies that offer above-average prospects for growth and may also invest in smaller capitalization companies that have adequate liquidity.
To achieve its investment objective, the Fund invests most of its assets in the RBC Private Canadian Mid-Cap Equity Pool (the “underlying fund”). The underlying fund focuses on companies with a history of high growth in sales and earnings, with above-average prospects for continued growth. The underlying fund invests in companies with strong management, focused business models and a competitive advantage. The underlying fund typically invests across major industry sectors within minimum and maximum exposures for each sector.
RiskThere were no significant changes to the investment objective and strategies that affected the Fund’s overall level of risk during the reporting period. The risks of investing in the Fund and the suitability of the Fund for investors remain as discussed in the Simplified Prospectus.
Results of OperationsThe Fund’s net asset value rose to $11 million as of March 31, 2017, from $8 million as of March 31, 2016. The increase was due mainly to investment returns.
Over the past year, the Fund’s Series A shares gained 22.6%, which outperformed the 19.4% rise in the benchmark. The Fund’s return is after the deduction of fees and expenses, while the benchmark and broad-based index returns do not include any costs of investing. See the Financial Highlights section for the management expense ratios and the Past Performance section for the returns of any other series, which may vary because of differences in management fees and expenses.
During the period, crude-oil prices recovered from levels that were well below the marginal cost of production, and increased further following OPEC’s announced plans to cut its output. Investors were preoccupied with persistent concerns about the unabated surge in prices for Canadian residential real estate, the failure of manufacturing to take the reins from energy as the driver of Canadian economic growth and expectations that interest-rate increases in Canada are likely to lag the U.S.
Canadian mid-cap stocks outperformed their larger-cap peers during the period. In the Fund, positive relative performance in the Materials, Health Care and Information Technology sectors was offset by weaker relative performance in the Telecommunication Services and Utilities sectors.
In the Materials sector, an overweight position in Endeavour Mining aided the Fund’s performance, with the shares gaining as the company develops two new mines. A reduction in the position in First Majestic Silver also benefited the Fund’s performance as the stock struggled during the second half of the period.
In the Energy sector, an overweight position in Seven Generations positively contributed to performance, as the company made attractive acquisitions throughout the period.
Underweight exposure to the Industrials sector proved beneficial to the Fund during the period. A lack of exposure to MacDonald, Dettwiler and Associates aided returns as investor concerns regarding the health of the satellite industry weighed on the shares.
In the Consumer Discretionary sector, an overweight position in Linamar, an auto-components supplier, hindered returns as investor concerns about the current stage of the auto cycle and the potential for a U.S. border tax were reflected in the stock’s performance. As well, a lack of exposure to Amaya hindered returns.
Recent DevelopmentsMarket valuations, although elevated in absolute terms, are not inconsistent with a low-interest-rate, low-inflation environment. That said, the portfolio manager believes earnings acceleration will now be a key focus. While OPEC’s plan to cut output is a positive for the Energy sector, the portfolio manager will be watching the U.S. shale industry for signs of re-acceleration as the year progresses. The portfolio manager continues to believe that companies with long-life reserves and strong balance sheets will deliver attractive levels of free cash as crude prices rally.
On December 15, 2016, the Canadian government enacted new tax rules that eliminate the ability of investors to switch among different classes of RBC Corporate Class Funds on a tax-deferred basis. The new rules do not apply to switches between different series of the same fund.
Effective December 1, 2016, Mr. Lloyd R. McGinnis retired and Ms. Élaine Cousineau was appointed as Chair of the Independent Review Committee (the “IRC”). Mr. Charles F. Macfarlane was appointed as Vice Chair of the IRC. Effective January 1, 2017, Ms. Suromitra Sanatani and Ms. Catherine Kloepfer were appointed as members of the IRC.
Effective July 1, 2016, Deloitte LLP resigned and PricewaterhouseCoopers LLP was appointed as auditors of the Fund.
Effective June 30, 2016, Series H mutual fund shares and Series I mutual fund shares were closed to all investors.
RBC CANADIAN MID-CAP EQUITY CLASS
84

ANNUAL MANAGEMENT REPORT OF FUND PERFORMANCE
March 31, 2017
85
RBC CANADIAN MID-CAP EQUITY CLASS
Related-Party TransactionsManager and Portfolio ManagerRBC GAM is an indirect, wholly owned subsidiary of Royal Bank of Canada (“Royal Bank”) and is the manager and portfolio manager of the Fund. RBC GAM is responsible for the Fund’s day-to-day operations, provides investment advice and portfolio management services to the Fund and appoints distributors for the Fund. RBC GAM is paid a management fee by the Fund as compensation for its services. The Fund pays a fixed administration fee to RBC GAM, which, in turn, pays certain operating expenses of the Fund.
Affiliates of RBC GAM that provide services to the Fund in the course of their normal businesses are discussed below.
DistributorsRBC GAM, Royal Mutual Funds Inc., RBC Direct Investing Inc., RBC Dominion Securities Inc. and Phillips, Hager & North Investment Funds Ltd. are the principal distributors of, or distribute certain series of the mutual fund shares of, the Fund. Dealers receive an ongoing commission based on the total value of their clients’ Series A, Advisor Series and Series D mutual fund shares.
CustodianRBC Investor Services Trust (“RBC IS”) is the custodian and holds the assets of the Fund.
RegistrarsRoyal Bank, RBC IS and RBC GAM are the registrars of the Fund and keep records of who owns the mutual fund shares of the Fund.
Other Related-Party TransactionsPursuant to applicable securities legislation, the Fund relied on the standing instructions from the Independent Review Committee with respect to one or more of the following transactions:
Related-Party Trading Activities(a) trades in securities of Royal Bank;
(b) investments in the securities of issuers for which a related-party dealer acted as an underwriter during the distribution of such securities and the 60-day period following the conclusion of such distribution of the underwritten securities to the public;
(c) purchases of equity and debt securities from or sales of equity or debt securities to a related-party dealer, where it acted as principal; and
Inter-Fund Trading(d) purchases or sales of securities of an issuer from or to another
investment fund or managed account managed by RBC GAM.
The applicable standing instructions require that Related-Party Trading Activities and Inter-Fund Trading be conducted in accordance with RBC GAM policy and that RBC GAM advise the Independent Review Committee of a material breach of any standing instruction. RBC GAM policy requires that an investment decision in respect of Related-Party Trading Activities (i) is made free from any influence of Royal Bank or its associates or affiliates and without taking into account any consideration relevant to Royal Bank or its affiliates or associates, (ii) represents the business judgment of the portfolio manager, uninfluenced by considerations other than the best interests of the Fund, (iii) is in compliance with RBC GAM policies and procedures, and (iv) achieves a fair and reasonable result for the Fund. RBC GAM policy requires that an investment decision in respect of Inter-Fund Trading is in the best interests of each Fund.
85

ANNUAL MANAGEMENT REPORT OF FUND PERFORMANCE
March 31, 2017
86
FINANCIAL HIGHLIGHTS The following tables show selected key financial information about the Fund and are intended to help you understand the Fund’s financial performance for the past five years or for the periods since inception. This information is derived from the Fund’s audited annual financial statements. For financial years beginning on or after April 1, 2014, financial highlight information is derived from financial statements prepared in compliance with International Financial Reporting Standards (“IFRS”). For financial years prior to April 1, 2014, financial highlight information is derived from financial statements prepared in accordance with Canadian generally accepted accounting principles (“GAAP”). “Net Assets,” for the periods prior to April 1, 2014, are calculated in accordance with GAAP, and “Net Asset Value” is derived from the valuation method disclosed in the RBC Corporate Class Funds Annual Information Form and is used for transactional purposes (see Ratios and Supplemental Data). All other calculations for the purposes of this MRFP are made using Net Asset Value. There is no significant difference between “Net Assets” and “Net Asset Value” under IFRS.
Change in Net Assets Per Mutual Fund Share ($)
Annual Distributions2
Increase (Decrease) from Operations1 From Total Realized Unrealized Income From Net Assets For the Year/ Net Assets Revenue Total Gains Gains (Excluding From Capital Return End of Period Ended Beginning of Year/Period (Loss) Expenses (Losses) (Losses) Total Dividends) Dividends Gains of Capital Total Year/Period
Series AMar. 31, 2017 10.60 0.21 (0.25) 0.37 1.92 2.25 – (0.09) – – (0.09) 12.92 Mar. 31, 2016 11.76 0.28 (0.22) (0.25) (0.88) (1.07) – (0.10) – – (0.10) 10.60Mar. 31, 2015 11.98 0.25 (0.25) 1.07 (1.14) (0.07) – (0.21) – – (0.21) 11.76 Mar. 31, 2014 10.62 0.25 (0.23) 0.29 1.38 1.69 – (0.16) – – (0.16) 11.98Mar. 31, 2013 9.83 0.23 (0.21) 0.05 0.91 0.98 – (0.10) – – (0.10) 10.62
Advisor SeriesMar. 31, 2017 10.83 0.21 (0.26) 0.37 1.26 1.58 – (0.09) – – (0.09) 13.19Mar. 31, 2016 12.01 0.29 (0.22) (0.25) (0.90) (1.08) – (0.11) – – (0.11) 10.83Mar. 31, 2015 12.18 0.25 (0.24) 1.08 (1.14) (0.05) – (0.17) – – (0.17) 12.01 Mar. 31, 2014 10.66 0.24 (0.22) 0.29 1.36 1.67 – (0.09) – – (0.09) 12.18Mar. 31, 2013 9.83 0.22 (0.19) 0.05 0.90 0.98 – (0.04) – – (0.04) 10.66
Series DMar. 31, 2017 10.97 0.22 (0.15) 0.38 1.48 1.93 – (0.10) – – (0.10) 13.47Mar. 31, 2016 12.17 0.30 (0.13) (0.26) (0.92) (1.01) – (0.20) – – (0.20) 10.97Mar. 31, 2015 12.38 0.25 (0.15) 1.11 (1.18) 0.03 – (0.29) – – (0.29) 12.17Mar. 31, 2014 10.74 0.23 (0.14) 0.27 1.27 1.63 – (0.04) – – (0.04) 12.38Mar. 31, 2013 9.85 0.21 (0.13) 0.05 0.85 0.98 – (0.07) – – (0.07) 10.74
Series FMar. 31, 2017 10.94 0.22 (0.12) 0.38 1.80 2.28 – (0.15) – – (0.15) 13.42Mar. 31, 2016 12.14 0.30 (0.10) (0.26) (0.92) (0.98) – (0.23) – – (0.23) 10.94Mar. 31, 2015 12.30 0.25 (0.11) 1.11 (1.18) 0.07 – (0.29) – – (0.29) 12.14 Mar. 31, 2014 10.78 0.26 (0.10) 0.30 1.43 1.89 – (0.20) – – (0.20) 12.30Mar. 31, 2013 9.86 0.20 (0.10) 0.05 0.81 0.96 – (0.07) – – (0.07) 10.78
Series OMar. 31, 2017 11.30 0.23 (0.01) 0.40 2.24 2.86 – (0.20) – – (0.20) 13.95Mar. 31, 2016 12.54 0.31 – (0.27) (0.95) (0.91) – (0.34) – – (0.34) 11.30Mar. 31, 2015 12.51 0.26 – 1.13 (1.20) 0.19 – (0.21) – – (0.21) 12.54Mar. 31, 2014 10.88 0.25 (0.01) 0.30 1.43 1.97 – (0.19) – – (0.19) 12.51Mar. 31, 2013 9.87 0.24 (0.01) 0.06 0.95 1.24 – (0.09) – – (0.09) 10.88
1 Net assets and distributions are based on the actual number of mutual fund shares outstanding at the relevant time. The increase/decrease from operations is based on the weighted average number of mutual fund shares outstanding over the financial period. This table is not intended to be a reconciliation of beginning to ending net assets per mutual fund share.
2 Distributions are reinvested in additional mutual fund shares of the Fund or paid in cash.
RBC CANADIAN MID-CAP EQUITY CLASS
86
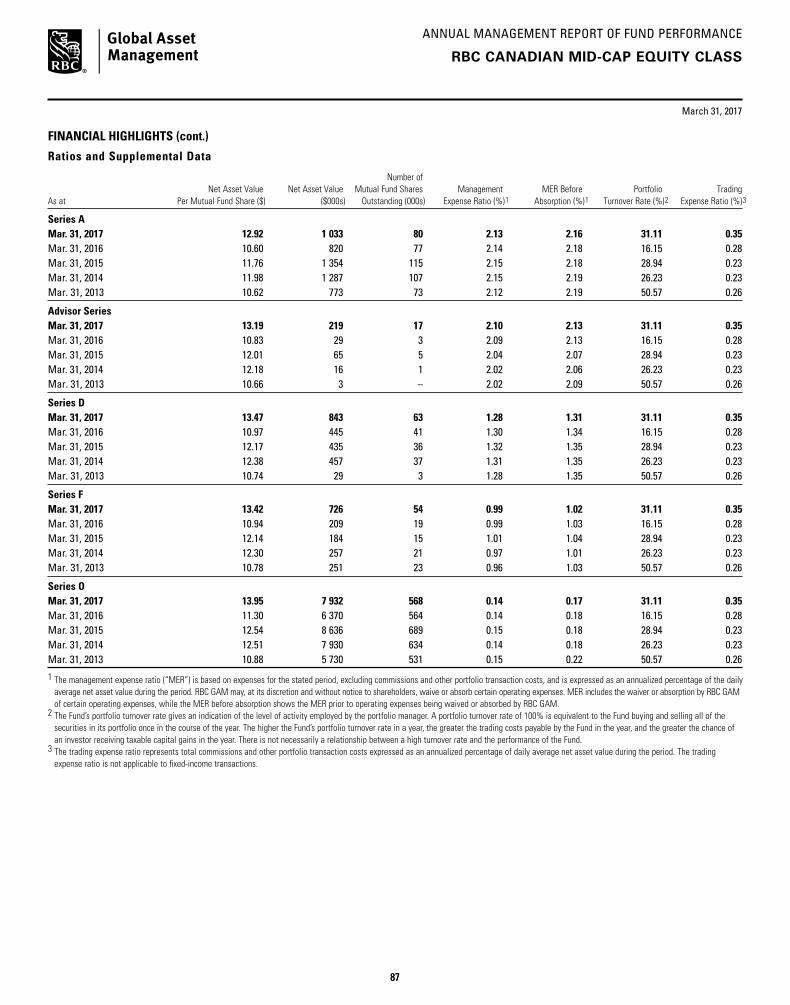
ANNUAL MANAGEMENT REPORT OF FUND PERFORMANCE
March 31, 2017
87
RBC CANADIAN MID-CAP EQUITY CLASS
FINANCIAL HIGHLIGHTS (cont.)
Ratios and Supplemental Data
Number of Net Asset Value Net Asset Value Mutual Fund Shares Management MER Before Portfolio TradingAs at Per Mutual Fund Share ($) ($000s) Outstanding (000s) Expense Ratio (%)1 Absorption (%)1 Turnover Rate (%)2 Expense Ratio (%)3
Series AMar. 31, 2017 12.92 1 033 80 2.13 2.16 31.11 0.35 Mar. 31, 2016 10.60 820 77 2.14 2.18 16.15 0.28 Mar. 31, 2015 11.76 1 354 115 2.15 2.18 28.94 0.23 Mar. 31, 2014 11.98 1 287 107 2.15 2.19 26.23 0.23Mar. 31, 2013 10.62 773 73 2.12 2.19 50.57 0.26
Advisor SeriesMar. 31, 2017 13.19 219 17 2.10 2.13 31.11 0.35Mar. 31, 2016 10.83 29 3 2.09 2.13 16.15 0.28 Mar. 31, 2015 12.01 65 5 2.04 2.07 28.94 0.23 Mar. 31, 2014 12.18 16 1 2.02 2.06 26.23 0.23Mar. 31, 2013 10.66 3 – 2.02 2.09 50.57 0.26
Series DMar. 31, 2017 13.47 843 63 1.28 1.31 31.11 0.35Mar. 31, 2016 10.97 445 41 1.30 1.34 16.15 0.28 Mar. 31, 2015 12.17 435 36 1.32 1.35 28.94 0.23 Mar. 31, 2014 12.38 457 37 1.31 1.35 26.23 0.23Mar. 31, 2013 10.74 29 3 1.28 1.35 50.57 0.26
Series FMar. 31, 2017 13.42 726 54 0.99 1.02 31.11 0.35Mar. 31, 2016 10.94 209 19 0.99 1.03 16.15 0.28 Mar. 31, 2015 12.14 184 15 1.01 1.04 28.94 0.23 Mar. 31, 2014 12.30 257 21 0.97 1.01 26.23 0.23Mar. 31, 2013 10.78 251 23 0.96 1.03 50.57 0.26
Series OMar. 31, 2017 13.95 7 932 568 0.14 0.17 31.11 0.35Mar. 31, 2016 11.30 6 370 564 0.14 0.18 16.15 0.28Mar. 31, 2015 12.54 8 636 689 0.15 0.18 28.94 0.23 Mar. 31, 2014 12.51 7 930 634 0.14 0.18 26.23 0.23Mar. 31, 2013 10.88 5 730 531 0.15 0.22 50.57 0.26
1 The management expense ratio (“MER”) is based on expenses for the stated period, excluding commissions and other portfolio transaction costs, and is expressed as an annualized percentage of the daily average net asset value during the period. RBC GAM may, at its discretion and without notice to shareholders, waive or absorb certain operating expenses. MER includes the waiver or absorption by RBC GAM of certain operating expenses, while the MER before absorption shows the MER prior to operating expenses being waived or absorbed by RBC GAM.
2 The Fund’s portfolio turnover rate gives an indication of the level of activity employed by the portfolio manager. A portfolio turnover rate of 100% is equivalent to the Fund buying and selling all of the securities in its portfolio once in the course of the year. The higher the Fund’s portfolio turnover rate in a year, the greater the trading costs payable by the Fund in the year, and the greater the chance of an investor receiving taxable capital gains in the year. There is not necessarily a relationship between a high turnover rate and the performance of the Fund.
3 The trading expense ratio represents total commissions and other portfolio transaction costs expressed as an annualized percentage of daily average net asset value during the period. The trading expense ratio is not applicable to fixed-income transactions.
87

ANNUAL MANAGEMENT REPORT OF FUND PERFORMANCE
88
March 31, 2017
FINANCIAL HIGHLIGHTS (cont.)
Management Fees RBC GAM is the manager and portfolio manager of the Fund. Management fees of each series of the Fund are calculated at the annual percentages, before GST/HST, of the daily net asset value of each series of the Fund. The breakdown of the services received in consideration of the management fees for each series, as a percentage of the management fees, is as follows:
Breakdown of Services
Management Fees Distribution Other*
Series A 1.75% 66% 34% Advisor Series 1.75% 66% 34% Series D 1.00% 25% 75%Series F 0.75% – 100%
Series O – no management fees are paid by the Fund with respect to Series O mutual fund shares. Series O shareholders pay a negotiated fee directly to RBC GAM for investment-counselling services.* Includes all costs related to management, investment advisory services, general administration
and profit.
PAST PERFORMANCEThe performance information shown assumes that all distributions made by the Fund in the periods shown were reinvested in additional shares of the Fund and would be lower if distributions were not reinvested. The performance information does not take into account sales, redemption, distribution, optional charges or income taxes payable that would have reduced returns or performance. Past performance does not necessarily indicate how the Fund may perform in the future. A fund with more than 10 years of performance history is only permitted to disclose the past 10 years.
Year-by-Year Returns (%) The bar chart indicates the Fund’s performance for each of the years shown, and illustrates how the Fund’s performance has changed from year to year. The bar chart shows, in percentage terms, how much an investment made on the first day of each financial year would have grown or decreased by the end of the financial year.
RBC CANADIAN MID-CAP EQUITY CLASS
88

ANNUAL MANAGEMENT REPORT OF FUND PERFORMANCE
March 31, 2017
89
PAST PERFORMANCE (cont.)Annual Compound Returns (%) The table shows the annual compound returns for each series of the Fund and for each of the periods indicated ended on March 31, 2017, compared with the following benchmark:
S&P/TSX MidCap Index
Past Past Past Past Since Year 3 Years 5 Years 10 Years Inception
Series A 22.6 3.7 6.8 – 6.1Benchmark 19.4 1.6 5.0 – 5.2
Advisor Series 22.7 3.8 7.0 – 6.3Benchmark 19.4 1.6 5.0 – 5.2
Series D 23.7 4.6 7.7 – 7.0Benchmark 19.4 1.6 5.0 – 5.2
Series F 24.0 4.9 8.0 – 7.4Benchmark 19.4 1.6 5.0 – 5.2
Series O 25.2 5.8 9.0 – 8.3Benchmark 19.4 1.6 5.0 – 5.2
The returns of each series may vary because of differences in management fees and expenses. The Benchmark index returns do not include any costs of investing. See Management Discussion of Fund Performance for a discussion of performance relative to the Benchmark index.
Series A, Advisor Series, Series D, Series F and Series O mutual fund shares have been available for sale to shareholders since January 1, 2012.
Inception dates are not provided for series that have been in existence for more than 10 years.
INDEX DESCRIPTIONS&P/TSX MidCap Index This is an index of mid-sized Canadian companies, with weights adjusted across economic sectors.
RBC CANADIAN MID-CAP EQUITY CLASS
SUMMARY OF INVESTMENT PORTFOLIO(after consideration of derivative products, if any)As at March 31, 2017
Investment Mix % of Net Asset Value
Materials 23.2Energy 20.5Real Estate 12.3Industrials 11.7Utilities 7.3Financials 5.0Consumer Discretionary 4.7Consumer Staples 4.4Information Technology 3.8Health Care 2.1Telecommunication Services 0.4Cash/Other 4.6
Top 25 Holdings* % of Net Asset Value
Cash & Cash Equivalents 4.0Canadian Utilities Ltd., Class A 2.7Endeavour Mining Corp. 2.5B2Gold Corp. 2.4Lundin Mining Corp. 2.2Brookfield Property Partners LP 2.2Parex Resources Inc. 2.1CCL Industries, Class B 2.0OceanaGold Corp. 2.0George Weston Ltd. 1.9H&R Real Estate Investment Trust 1.8CAE Inc. 1.8Canadian Apartment Properties Real Estate Investment Trust 1.7Industrial Alliance Insurance & Financial Services Inc. 1.7Torex Gold Resources Inc. 1.6Methanex Corp. 1.6Brookfield Renewable Partners LP 1.6Veresen Inc. 1.6Interfor Corp. 1.6Hydro One Ltd. 1.6Smart Real Estate Investment Trust 1.5Algonquin Power & Utilities Corp. 1.5Birchcliff Energy Ltd. 1.5Canadian Real Estate Investment Trust 1.5BlackBerry Ltd. 1.4Top 25 Holdings 48.0
* The Fund invests substantially all of its assets directly in the RBC Private Canadian Mid-Cap Equity Pool. The above are the Top 25 holdings of the RBC Private Canadian Mid-Cap Equity Pool.
The Summary of Investment Portfolio may change due to ongoing portfolio transactions of the Fund and a quarterly update is available at www.rbcgam.com/funds.
The Simplified Prospectus and other information about the underlying fund are available on SEDAR website at www.sedar.com.
89

ANNUAL MANAGEMENT REPORT OF FUND PERFORMANCE
90
NORTH AMERICAN EQUITY FUND
RBC NORTH AMERICAN VALUE CLASS
March 31, 2017
Portfolio Manager RBC Global Asset Management Inc. (“RBC GAM”)
This annual management report of fund performance (“MRFP”) contains financial highlights but does not contain the complete annual financial statements of the Fund. You can get a copy of the financial statements at your request, and at no cost, by calling 1-800-463-FUND (3863), by writing to us at RBC Global Asset Management Inc., P.O. Box 7500, Station A, Toronto, Ontario M5W 1P9, or by visiting our website at www.rbcgam.com/reports or SEDAR at www.sedar.com. Security holders may also contact us using one of these methods to request a copy of the Fund’s proxy voting policies and procedures, proxy voting disclosure record, or quarterly portfolio disclosure.
The Board of Directors of RBC Corporate Class Inc. approved this annual management report of fund performance on May 11, 2017.
A Note on Forward-looking Statements
This report may contain forward-looking statements about the Fund, its future performance, strategies or prospects, and possible future Fund action. The words “may,” “could,” “should,” “would,” “suspect,” “outlook,” “believe,” “plan,” “anticipate,” “estimate,” “expect,” “intend,” “forecast,” “objective” and similar expressions are intended to identify forward-looking statements.
Forward-looking statements are not guarantees of future performance. Forward-looking statements involve inherent risks and uncertainties, both about the Fund and general economic factors, so it is possible that predictions, forecasts, projections and other forward-looking statements will not be achieved. We caution you not to place undue reliance on these statements as a number of important factors could cause actual events or results to differ materially from those expressed or implied in any forward-looking statement made in relation to the Fund. These factors include, but are not limited to, general economic, political and market factors in Canada, the United States and internationally, interest and foreign exchange rates, global equity and capital markets, business competition, technological changes, changes in laws and regulations, judicial or regulatory judgments, legal proceedings and catastrophic events.
The above list of important factors that may affect future results is not exhaustive. Before making any investment decisions, we encourage you to consider these and other factors carefully. All opinions contained in forward-looking statements are subject to change without notice and are provided in good faith but without legal responsibility.
90
ANNUAL MANAGEMENT REPORT OF FUND PERFORMANCE
March 31, 2017
91
MANAGEMENT DISCUSSION OF FUND PERFORMANCE
Investment Objective and StrategiesThe Fund seeks to provide long-term capital growth by investing in equity securities of Canadian and/or U.S. companies priced below their true value and offering long-term opportunities for growth.
To achieve its investment objective, the Fund invests most of its assets in the RBC North American Value Fund (the “underlying fund”). The underlying fund identifies quality companies that are undervalued based on criteria such as assets, earnings and cash flow. The approach provides for a lower level of volatility than a portfolio of growth companies. The underlying fund may also invest in income trusts.
RiskThere were no significant changes to the investment objective and strategies that affected the Fund’s overall level of risk during the reporting period. The risks of investing in the Fund and the suitability of the Fund for investors remain as discussed in the Simplified Prospectus.
Results of OperationsThe Fund’s net asset value rose to $192 million as of March 31, 2017, from $185 million as of March 31, 2016. The increase was due to investment returns.
Over the past year, the Fund’s Series A shares gained 14.4%, which underperformed the 20.0% rise in the S&P 500 Total Return Index in Canadian dollars. The shares underperformed the 18.6% rise in the S&P/TSX Capped Composite Total Return Index. The Fund’s return is after the deduction of fees and expenses, while the benchmark and broad-based index returns do not include any costs of investing. See the Financial Highlights section for the management expense ratios and the Past Performance section for the returns of any other series, which may vary because of differences in management fees and expenses.
During the period, the S&P/TSX Composite Index, Canada’s equity benchmark, outperformed most other global indexes, as heavyweight sectors Financials, Energy and Materials all strengthened. Crude-oil prices recovered from levels that were well below the marginal cost of production, and increased further following OPEC’s announced plans to cut its output. Investors were preoccupied with persistent concerns over the unabated surge in prices for Canadian residential real estate, the failure of manufacturing to take the reins from energy as the driver of Canadian economic growth and expectations that interest-rate increases in Canada are likely to lag the U.S. Financials stocks moved higher in the U.S. on the rise of interest rates and the potential for less regulation. The Canadian Financials sector performed well with Canadian banks gaining 30% over 2016. Shares of lumber and copper producers also performed strongly, benefiting from the rise in the underlying commodities.
The S&P 500 also performed well during the period. This strong performance was driven by a recovery in commodity prices, improvement in most global economies, and optimism that President Trump’s fiscal-spending policies and vow to cut taxes could improve consumer and corporate confidence. Earnings growth improved during the period as the negative effects of the strong U.S. dollar subsided, along with the improvement and stabilization of oil prices. The start of 2017 has been highlighted by strength in growth over value and a general reversal in sector performance, as the Information Technology and Consumer Discretionary sectors led the way and the Energy and Telecommunication Services sectors lagged the index.
The Fund benefited from security selection in the Canadian Health Care sector. A lack of exposure to Valeant Pharmaceuticals and Concordia International proved beneficial as the companies struggled under greater regulatory scrutiny and higher debt levels.
Offsetting this, the Fund underperformed in the Industrials sector. In the U.S. Industrials sector, a position in Nielsen detracted from performance. The company reported disappointing results as well as lower forward guidance based on an unexpectedly weak business line. However, the portfolio manager believes the core Nielsen story remains intact.
Recent DevelopmentsMarket valuations, although elevated in absolute terms, are not inconsistent with a low-interest-rate, low-inflation environment. That said, the portfolio manager believes that earnings acceleration will now be a key focus. In the Financials sector, the success of the Canadian banks’ non-domestic businesses will likely be a key differentiator of performance. Concurrently, while OPEC’s plan to cut output is a positive for the Energy sector, the portfolio manager will be watching the U.S. shale sector for signs of re-acceleration as the year progresses. The portfolio manager continues to believe that large companies with long-life reserves and strong balance sheets will deliver attractive levels of free cash as crude prices stabilize.
On December 15, 2016, the Canadian government enacted new tax rules that eliminate the ability of investors to switch among different classes of RBC Corporate Class Funds on a tax-deferred basis. The new rules do not apply to switches between different series of the same fund.
Effective December 1, 2016, Mr. Lloyd R. McGinnis retired and Ms. Élaine Cousineau was appointed as Chair of the Independent Review Committee (the “IRC”). Mr. Charles F. Macfarlane was appointed as Vice Chair of the IRC. Effective January 1, 2017, Ms. Suromitra Sanatani and Ms. Catherine Kloepfer were appointed as members of the IRC.
RBC NORTH AMERICAN VALUE CLASS
91

ANNUAL MANAGEMENT REPORT OF FUND PERFORMANCE
March 31, 2017
92
RBC NORTH AMERICAN VALUE CLASS
Effective July 1, 2016, Deloitte LLP resigned and PricewaterhouseCoopers LLP was appointed as auditors of the Fund.
Effective June 30, 2016, management fees were reduced as follows: from 1.75% to 1.60% in respect of Series A mutual fund shares and Advisor Series mutual fund shares; from 1.00% to 0.85% in respect of Series D mutual fund shares; and from 0.75% to 0.60% in respect of Series F mutual fund shares. Also effective June 30, 2016, Series H mutual fund shares were re-designated to Series A mutual fund shares and Series I mutual fund shares were re-designated to Series F mutual fund shares.
Related-Party TransactionsManager and Portfolio ManagerRBC GAM is an indirect, wholly owned subsidiary of Royal Bank of Canada (“Royal Bank”) and is the manager and portfolio manager of the Fund. RBC GAM is responsible for the Fund’s day-to-day operations, provides investment advice and portfolio management services to the Fund and appoints distributors for the Fund. RBC GAM is paid a management fee by the Fund as compensation for its services. The Fund pays a fixed administration fee to RBC GAM, which, in turn, pays certain operating expenses of the Fund.
Affiliates of RBC GAM that provide services to the Fund in the course of their normal businesses are discussed below.
DistributorsRBC GAM, Royal Mutual Funds Inc., RBC Direct Investing Inc., RBC Dominion Securities Inc. and Phillips, Hager & North Investment Funds Ltd. are the principal distributors of, or distribute certain series of the mutual fund shares of, the Fund. Dealers receive an ongoing commission based on the total value of their clients’ Series A, Advisor Series and Series D mutual fund shares.
CustodianRBC Investor Services Trust (“RBC IS”) is the custodian and holds the assets of the Fund.
RegistrarsRoyal Bank, RBC IS and RBC GAM are the registrars of the Fund and keep records of who owns the mutual fund shares of the Fund.
Other Related-Party TransactionsPursuant to applicable securities legislation, the Fund relied on the standing instructions from the Independent Review Committee with respect to one or more of the following transactions:
Related-Party Trading Activities(a) trades in securities of Royal Bank;
(b) investments in the securities of issuers for which a related-party dealer acted as an underwriter during the distribution of such securities and the 60-day period following the conclusion of such distribution of the underwritten securities to the public;
(c) purchases of equity and debt securities from or sales of equity or debt securities to a related-party dealer, where it acted as principal; and
Inter-Fund Trading(d) purchases or sales of securities of an issuer from or to another
investment fund or managed account managed by RBC GAM.
The applicable standing instructions require that Related-Party Trading Activities and Inter-Fund Trading be conducted in accordance with RBC GAM policy and that RBC GAM advise the Independent Review Committee of a material breach of any standing instruction. RBC GAM policy requires that an investment decision in respect of Related-Party Trading Activities (i) is made free from any influence of Royal Bank or its associates or affiliates and without taking into account any consideration relevant to Royal Bank or its affiliates or associates, (ii) represents the business judgment of the portfolio manager, uninfluenced by considerations other than the best interests of the Fund, (iii) is in compliance with RBC GAM policies and procedures, and (iv) achieves a fair and reasonable result for the Fund. RBC GAM policy requires that an investment decision in respect of Inter-Fund Trading is in the best interests of each Fund.
92

ANNUAL MANAGEMENT REPORT OF FUND PERFORMANCE
March 31, 2017
93
RBC NORTH AMERICAN VALUE CLASS
FINANCIAL HIGHLIGHTS The following tables show selected key financial information about the Fund and are intended to help you understand the Fund’s financial performance for the past five years or for the periods since inception. This information is derived from the Fund’s audited annual financial statements. For financial years beginning on or after April 1, 2014, financial highlight information is derived from financial statements prepared in compliance with International Financial Reporting Standards (“IFRS”). For financial years prior to April 1, 2014, financial highlight information is derived from financial statements prepared in accordance with Canadian generally accepted accounting principles (“GAAP”). “Net Assets,” for the periods prior to April 1, 2014, are calculated in accordance with GAAP, and “Net Asset Value” is derived from the valuation method disclosed in the RBC Corporate Class Funds Annual Information Form and is used for transactional purposes (see Ratios and Supplemental Data). All other calculations for the purposes of this MRFP are made using Net Asset Value. There is no significant difference between “Net Assets” and “Net Asset Value” under IFRS.
Change in Net Assets Per Mutual Fund Share ($)
Annual Distributions2
Increase (Decrease) from Operations1 From Total Realized Unrealized Income From Net Assets For the Year/ Net Assets Revenue Total Gains Gains (Excluding From Capital Return End of Period Ended Beginning of Year/Period (Loss) Expenses (Losses) (Losses) Total Dividends) Dividends Gains of Capital Total Year/Period
Series AMar. 31, 2017 14.64 0.32 (0.31) 0.60 1.65 2.26 – (0.25) – – (0.25) 16.50 Mar. 31, 2016 15.32 0.33 (0.31) 0.43 (0.91) (0.46) – (0.29) – – (0.29) 14.64Mar. 31, 2015 13.67 – (0.30) 0.79 1.19 1.68 – – – – – 15.32 Mar. 31, 2014 11.60 – (0.26) 0.85 1.78 2.37 – – (0.11) – (0.11) 13.67Mar. 31, 2013 10.46 0.14 (0.23) 0.51 1.47 1.89 – (0.07) – – (0.07) 11.60
Advisor SeriesMar. 31, 2017 14.63 0.32 (0.31) 0.59 1.48 2.08 – (0.24) – – (0.24) 16.49Mar. 31, 2016 15.32 0.33 (0.31) 0.43 (0.91) (0.46) – (0.29) – – (0.29) 14.63Mar. 31, 2015 13.67 – (0.31) 0.79 1.19 1.67 – – – – – 15.32 Mar. 31, 2014 11.60 – (0.27) 0.86 1.78 2.37 – – (0.11) – (0.11) 13.67Mar. 31, 2013 10.46 0.14 (0.23) 0.51 1.47 1.89 – (0.07) – – (0.07) 11.60
Series DMar. 31, 2017 15.06 0.33 (0.17) 0.61 1.50 2.27 – (0.41) – – (0.41) 16.97Mar. 31, 2016 15.77 0.34 (0.18) 0.45 (0.94) (0.33) – (0.44) – – (0.44) 15.06Mar. 31, 2015 13.94 – (0.18) 0.81 1.21 1.84 – – – – – 15.77 Mar. 31, 2014 11.72 – (0.15) 0.86 1.79 2.50 – – (0.11) – (0.11) 13.94Mar. 31, 2013 10.48 0.13 (0.14) 0.47 1.36 1.82 – (0.07) – – (0.07) 11.72
Series FMar. 31, 2017 15.18 0.33 (0.13) 0.63 1.74 2.57 – (0.46) – – (0.46) 17.10Mar. 31, 2016 15.89 0.34 (0.14) 0.45 (0.95) (0.30) – (0.48) – – (0.48) 15.18Mar. 31, 2015 14.02 – (0.14) 0.81 1.22 1.89 – – – – – 15.89 Mar. 31, 2014 11.76 – (0.12) 0.88 1.83 2.59 – – (0.11) – (0.11) 14.02Mar. 31, 2013 10.49 0.14 (0.10) 0.50 1.45 1.99 – (0.08) – – (0.08) 11.76
Series OMar. 31, 2017 15.62 0.34 (0.01) 0.64 1.55 2.52 – (0.62) – – (0.62) 17.60Mar. 31, 2016 16.36 0.35 (0.01) 0.47 (0.98) (0.17) – (0.64) – – (0.64) 15.62Mar. 31, 2015 14.30 – – 0.84 1.26 2.10 – – – – – 16.36 Mar. 31, 2014 11.90 – – 0.66 1.37 2.03 – – (0.11) – (0.11) 14.30Mar. 31, 2013 10.51 0.23 (0.01) 0.84 2.43 3.49 – (0.09) – – (0.09) 11.90
1 Net assets and distributions are based on the actual number of mutual fund shares outstanding at the relevant time. The increase/decrease from operations is based on the weighted average number of mutual fund shares outstanding over the financial period. This table is not intended to be a reconciliation of beginning to ending net assets per mutual fund share.
2 Distributions are reinvested in additional mutual fund shares of the Fund or paid in cash.
93
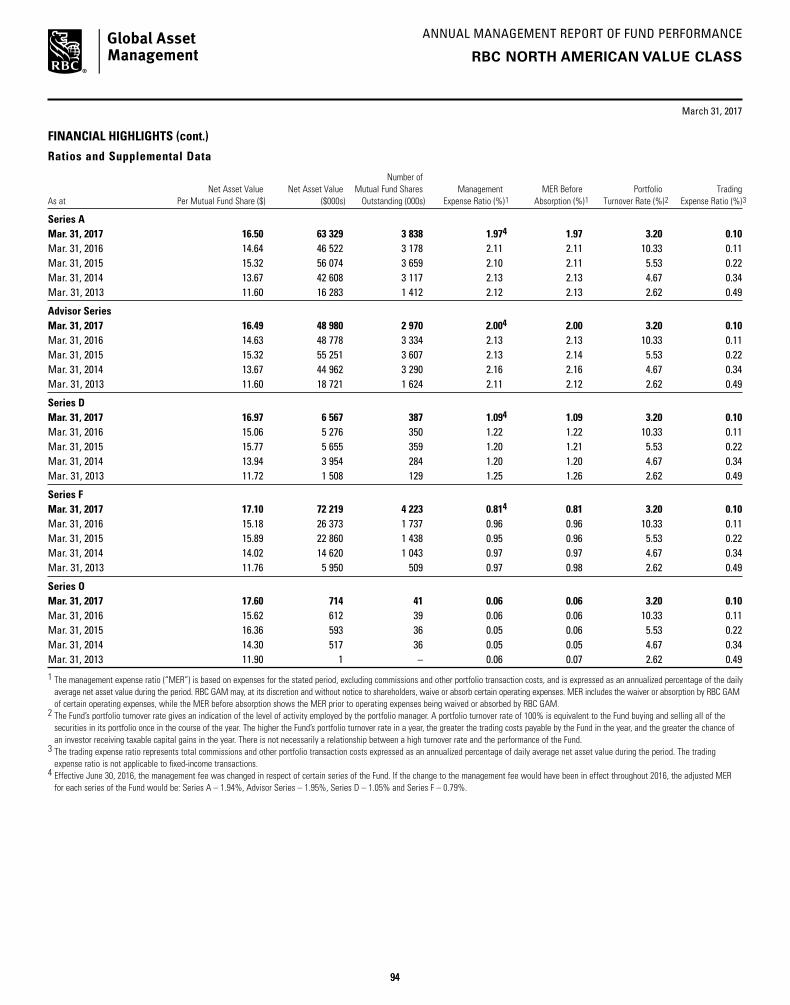
ANNUAL MANAGEMENT REPORT OF FUND PERFORMANCE
March 31, 2017
94
RBC NORTH AMERICAN VALUE CLASS
FINANCIAL HIGHLIGHTS (cont.)
Ratios and Supplemental Data
Number of Net Asset Value Net Asset Value Mutual Fund Shares Management MER Before Portfolio TradingAs at Per Mutual Fund Share ($) ($000s) Outstanding (000s) Expense Ratio (%)1 Absorption (%)1 Turnover Rate (%)2 Expense Ratio (%)3
Series AMar. 31, 2017 16.50 63 329 3 838 1.974 1.97 3.20 0.10Mar. 31, 2016 14.64 46 522 3 178 2.11 2.11 10.33 0.11Mar. 31, 2015 15.32 56 074 3 659 2.10 2.11 5.53 0.22 Mar. 31, 2014 13.67 42 608 3 117 2.13 2.13 4.67 0.34Mar. 31, 2013 11.60 16 283 1 412 2.12 2.13 2.62 0.49
Advisor SeriesMar. 31, 2017 16.49 48 980 2 970 2.004 2.00 3.20 0.10Mar. 31, 2016 14.63 48 778 3 334 2.13 2.13 10.33 0.11Mar. 31, 2015 15.32 55 251 3 607 2.13 2.14 5.53 0.22 Mar. 31, 2014 13.67 44 962 3 290 2.16 2.16 4.67 0.34Mar. 31, 2013 11.60 18 721 1 624 2.11 2.12 2.62 0.49
Series DMar. 31, 2017 16.97 6 567 387 1.094 1.09 3.20 0.10Mar. 31, 2016 15.06 5 276 350 1.22 1.22 10.33 0.11Mar. 31, 2015 15.77 5 655 359 1.20 1.21 5.53 0.22 Mar. 31, 2014 13.94 3 954 284 1.20 1.20 4.67 0.34Mar. 31, 2013 11.72 1 508 129 1.25 1.26 2.62 0.49
Series FMar. 31, 2017 17.10 72 219 4 223 0.814 0.81 3.20 0.10Mar. 31, 2016 15.18 26 373 1 737 0.96 0.96 10.33 0.11Mar. 31, 2015 15.89 22 860 1 438 0.95 0.96 5.53 0.22 Mar. 31, 2014 14.02 14 620 1 043 0.97 0.97 4.67 0.34Mar. 31, 2013 11.76 5 950 509 0.97 0.98 2.62 0.49
Series OMar. 31, 2017 17.60 714 41 0.06 0.06 3.20 0.10Mar. 31, 2016 15.62 612 39 0.06 0.06 10.33 0.11Mar. 31, 2015 16.36 593 36 0.05 0.06 5.53 0.22 Mar. 31, 2014 14.30 517 36 0.05 0.05 4.67 0.34Mar. 31, 2013 11.90 1 – 0.06 0.07 2.62 0.49
1 The management expense ratio (“MER”) is based on expenses for the stated period, excluding commissions and other portfolio transaction costs, and is expressed as an annualized percentage of the daily average net asset value during the period. RBC GAM may, at its discretion and without notice to shareholders, waive or absorb certain operating expenses. MER includes the waiver or absorption by RBC GAM of certain operating expenses, while the MER before absorption shows the MER prior to operating expenses being waived or absorbed by RBC GAM.
2 The Fund’s portfolio turnover rate gives an indication of the level of activity employed by the portfolio manager. A portfolio turnover rate of 100% is equivalent to the Fund buying and selling all of the securities in its portfolio once in the course of the year. The higher the Fund’s portfolio turnover rate in a year, the greater the trading costs payable by the Fund in the year, and the greater the chance of an investor receiving taxable capital gains in the year. There is not necessarily a relationship between a high turnover rate and the performance of the Fund.
3 The trading expense ratio represents total commissions and other portfolio transaction costs expressed as an annualized percentage of daily average net asset value during the period. The trading expense ratio is not applicable to fixed-income transactions.
4 Effective June 30, 2016, the management fee was changed in respect of certain series of the Fund. If the change to the management fee would have been in effect throughout 2016, the adjusted MER for each series of the Fund would be: Series A – 1.94%, Advisor Series – 1.95%, Series D – 1.05% and Series F – 0.79%.
94

ANNUAL MANAGEMENT REPORT OF FUND PERFORMANCE
95
March 31, 2017
FINANCIAL HIGHLIGHTS (cont.)
Management Fees RBC GAM is the manager and portfolio manager of the Fund. Management fees of each series of the Fund are calculated at the annual percentages, before GST/HST, of the daily net asset value of each series of the Fund. The breakdown of the services received in consideration of the management fees for each series, as a percentage of the management fees, is as follows:
Breakdown of Services
Management Fees Distribution Other*
Series A 1.60% 66% 34% Advisor Series 1.60% 66% 34% Series D 0.85% 25% 75%Series F 0.60% – 100%
Series O – no management fees are paid by the Fund with respect to Series O mutual fund shares. Series O shareholders pay a negotiated fee directly to RBC GAM for investment-counselling services.* Includes all costs related to management, investment advisory services, general administration
and profit.
PAST PERFORMANCEThe performance information shown assumes that all distributions made by the Fund in the periods shown were reinvested in additional shares of the Fund and would be lower if distributions were not reinvested. The performance information does not take into account sales, redemption, distribution, optional charges or income taxes payable that would have reduced returns or performance. Past performance does not necessarily indicate how the Fund may perform in the future. A fund with more than 10 years of performance history is only permitted to disclose the past 10 years.
Year-by-Year Returns (%) The bar chart indicates the Fund’s performance for each of the years shown, and illustrates how the Fund’s performance has changed from year to year. The bar chart shows, in percentage terms, how much an investment made on the first day of each financial year would have grown or decreased by the end of the financial year.
RBC NORTH AMERICAN VALUE CLASS
95

ANNUAL MANAGEMENT REPORT OF FUND PERFORMANCE
March 31, 2017
96
RBC NORTH AMERICAN VALUE CLASS
PAST PERFORMANCE (cont.)Annual Compound Returns (%) The table shows the annual compound returns for each series of the Fund and for each of the periods indicated ended on March 31, 2017, compared with the following benchmarks:
Benchmark 1 – S&P 500 Total Return Index (CAD)Benchmark 2 – S&P/TSX Capped Composite Total Return Index
Past Past Past Past Since Year 3 Years 5 Years 10 Years Inception
Series A 14.4 7.7 10.6 – 11.1Benchmark 1 20.0 17.4 20.0 – 21.2Benchmark 2 18.6 5.8 7.8 – 8.3
Advisor Series 14.4 7.7 10.6 – 11.0Benchmark 1 20.0 17.4 20.0 – 21.2Benchmark 2 18.6 5.8 7.8 – 8.3
Series D 15.4 8.7 11.6 – 12.1Benchmark 1 20.0 17.4 20.0 – 21.2Benchmark 2 18.6 5.8 7.8 – 8.3
Series F 15.7 8.9 11.9 – 12.3Benchmark 1 20.0 17.4 20.0 – 21.2Benchmark 2 18.6 5.8 7.8 – 8.3
Series O 16.6 9.9 12.9 – 13.3Benchmark 1 20.0 17.4 20.0 – 21.2Benchmark 2 18.6 5.8 7.8 – 8.3
The returns of each series may vary because of differences in management fees and expenses. The Benchmark index returns do not include any costs of investing. See Management Discussion of Fund Performance for a discussion of performance relative to the Benchmark indexes.
Series A, Advisor Series, Series D, Series F and Series O mutual fund shares have been available for sale to shareholders since January 1, 2012.
Inception dates are not provided for series that have been in existence for more than 10 years.
All outstanding Series H mutual fund shares were re-designated as Series A mutual fund shares and all outstanding Series I mutual fund shares were re-designated as Series F mutual fund shares effective June 30, 2016.
INDEX DESCRIPTIONSS&P 500 Total Return Index (CAD) This index is a capitalization-weighted index measuring the Canadian dollar performance of 500 widely held common stocks representing all major industries in the United States. The index gives investors a broad measure of the overall performance of the U.S. stock market.S&P/TSX Capped Composite Total Return Index This index is the amended capitalization-weighted index measuring the performance of selected securities listed on the Toronto Stock Exchange, with no individual stock exceeding 10% of the overall weight.
SUMMARY OF INVESTMENT PORTFOLIO(after consideration of derivative products, if any)As at March 31, 2017
Investment Mix – Sectors % of Net Asset Value
Financials 29.3Energy 14.1Information Technology 10.4Industrials 8.8Consumer Discretionary 7.4Health Care 5.8Consumer Staples 5.1Materials 5.1Telecommunication Services 3.1Real Estate 1.4Utilities 1.0Cash/Other 8.5
Investment Mix – Countries/Regions % of Net Asset Value
Canada 55.8United States 35.5Cash/Other 8.7
96
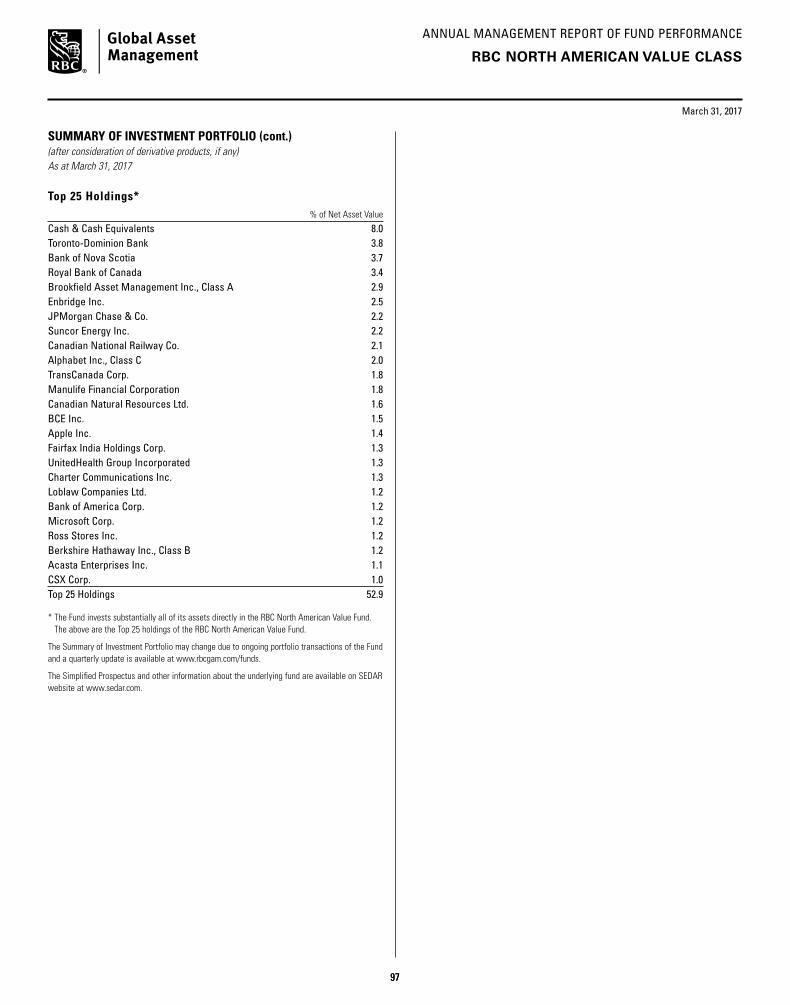
ANNUAL MANAGEMENT REPORT OF FUND PERFORMANCE
March 31, 2017
97
RBC NORTH AMERICAN VALUE CLASS
SUMMARY OF INVESTMENT PORTFOLIO (cont.)(after consideration of derivative products, if any)As at March 31, 2017
Top 25 Holdings* % of Net Asset Value
Cash & Cash Equivalents 8.0Toronto-Dominion Bank 3.8Bank of Nova Scotia 3.7Royal Bank of Canada 3.4Brookfield Asset Management Inc., Class A 2.9Enbridge Inc. 2.5JPMorgan Chase & Co. 2.2Suncor Energy Inc. 2.2Canadian National Railway Co. 2.1Alphabet Inc., Class C 2.0TransCanada Corp. 1.8Manulife Financial Corporation 1.8Canadian Natural Resources Ltd. 1.6BCE Inc. 1.5Apple Inc. 1.4Fairfax India Holdings Corp. 1.3UnitedHealth Group Incorporated 1.3Charter Communications Inc. 1.3Loblaw Companies Ltd. 1.2Bank of America Corp. 1.2Microsoft Corp. 1.2Ross Stores Inc. 1.2Berkshire Hathaway Inc., Class B 1.2Acasta Enterprises Inc. 1.1CSX Corp. 1.0Top 25 Holdings 52.9
* The Fund invests substantially all of its assets directly in the RBC North American Value Fund. The above are the Top 25 holdings of the RBC North American Value Fund.
The Summary of Investment Portfolio may change due to ongoing portfolio transactions of the Fund and a quarterly update is available at www.rbcgam.com/funds.
The Simplified Prospectus and other information about the underlying fund are available on SEDAR website at www.sedar.com.
97

ANNUAL MANAGEMENT REPORT OF FUND PERFORMANCE
98
U.S. EQUITY FUND
RBC U.S. DIVIDEND CLASS
March 31, 2017
Portfolio Manager RBC Global Asset Management Inc. (“RBC GAM”)
This annual management report of fund performance (“MRFP”) contains financial highlights but does not contain the complete annual financial statements of the Fund. You can get a copy of the financial statements at your request, and at no cost, by calling 1-800-463-FUND (3863), by writing to us at RBC Global Asset Management Inc., P.O. Box 7500, Station A, Toronto, Ontario M5W 1P9, or by visiting our website at www.rbcgam.com/reports or SEDAR at www.sedar.com. Security holders may also contact us using one of these methods to request a copy of the Fund’s proxy voting policies and procedures, proxy voting disclosure record, or quarterly portfolio disclosure.
The Board of Directors of RBC Corporate Class Inc. approved this annual management report of fund performance on May 11, 2017.
A Note on Forward-looking Statements
This report may contain forward-looking statements about the Fund, its future performance, strategies or prospects, and possible future Fund action. The words “may,” “could,” “should,” “would,” “suspect,” “outlook,” “believe,” “plan,” “anticipate,” “estimate,” “expect,” “intend,” “forecast,” “objective” and similar expressions are intended to identify forward-looking statements.
Forward-looking statements are not guarantees of future performance. Forward-looking statements involve inherent risks and uncertainties, both about the Fund and general economic factors, so it is possible that predictions, forecasts, projections and other forward-looking statements will not be achieved. We caution you not to place undue reliance on these statements as a number of important factors could cause actual events or results to differ materially from those expressed or implied in any forward-looking statement made in relation to the Fund. These factors include, but are not limited to, general economic, political and market factors in Canada, the United States and internationally, interest and foreign exchange rates, global equity and capital markets, business competition, technological changes, changes in laws and regulations, judicial or regulatory judgments, legal proceedings and catastrophic events.
The above list of important factors that may affect future results is not exhaustive. Before making any investment decisions, we encourage you to consider these and other factors carefully. All opinions contained in forward-looking statements are subject to change without notice and are provided in good faith but without legal responsibility.
98

ANNUAL MANAGEMENT REPORT OF FUND PERFORMANCE
March 31, 2017
99
MANAGEMENT DISCUSSION OF FUND PERFORMANCE
Investment Objective and StrategiesThe Fund seeks to provide long-term capital growth and regular dividend income by investing primarily in common and preferred shares of major U.S. companies with above-average dividend yields in order to provide targeted exposure to opportunities in U.S. equity markets. Stocks that qualify as investments will generally carry above-average dividend yields and offer the potential for increased payouts.
To achieve its investment objective, the Fund invests most of its assets in the RBC U.S. Dividend Fund (the “underlying fund”). The underlying fund invests in companies with long-term prospects of growing their dividends or which have the potential for such special events as stock buybacks, takeovers and special dividends. The underlying fund may also invest in government bonds, corporate bonds and treasury bills.
RiskThere were no significant changes to the investment objective and strategies that affected the Fund’s overall level of risk during the reporting period. The risks of investing in the Fund and the suitability of the Fund for investors remain as discussed in the Simplified Prospectus.
Results of OperationsThe Fund’s net asset value rose to $122 million as of March 31, 2017, from $111 million as of March 31, 2016. The change was due to investment returns.
Over the past year, the Fund’s Series A shares gained 17.4%, which underperformed the 20.0% rise in the benchmark. The Fund’s return is after the deduction of fees and expenses, while the benchmark and broad-based index returns do not include any costs of investing. See the Financial Highlights section for the management expense ratios and the Past Performance section for the returns of any other series, which may vary because of differences in management fees and expenses.
The S&P 500 generated above-average returns over the past 12 months, rising about 20%. Market returns were driven by a recovery in commodity prices, improvement in most global economies and a rebound in corporate earnings. Some of the performance was attributable to optimism that President Trump will succeed in gaining legislative support for his plan to boost government spending and cut taxes, both of which would likely support economic growth.
The Financials and Information Technology sectors were the best-performing sectors in the Fund year with notable help from the Industrials and Materials sectors, which benefited from higher commodity prices. Dow Chemical led the way in the Materials sector following its agreement to merge with DuPont, and transportation companies Boeing and Union Pacific Railway led Industrials. An
underweight position in the Consumer Discretionary sector also aided the Fund’s returns, as did stock selection in the Financials, Health Care and Consumer Staples sectors.
In the Financials sector, bank profitability improved as the amount charged by banks on loans rose more than the rate they paid for funds.
Performance was hurt by the Fund’s overweight position in the Health Care sector, where concern that companies could be forced to freeze or lower drug prices had a negative impact on Pfizer and Cardinal Health. The concerns about drug pricing hurt the Fund’s position in CVS, the No. 2 drugstore chain. The Fund was also hurt by its positions in biotechnology company Gilead and by medical-device maker Medtronic.
Regions Financial and KeyCorp were standouts. In the Health Care sector, leading health insurer UnitedHealth and pharmaceuticals makers Merck and Johnson & Johnson generated solid returns thanks to exceptional cash flows and aggressive buyback programs. Cigarette makers Philip Morris and Altria led the way in the Consumer Staples sector amid consistent high-single-digit earnings growth, high dividend yields and significant buybacks. Other notable performers included Time Warner, which received a takeover bid from AT&T; media company Comcast; and technology companies Apple, Microsoft and Texas Instruments.
Recent DevelopmentsIn the portfolio manager’s opinion, recent economic data suggests the global economic growth is reaccelerating, slowly and from a low level. Earnings growth turned positive in the third quarter and the portfolio manager expects profit improvements to drive markets somewhat higher in 2017. However, the stock market could come under pressure if further strengthening of the U.S. dollar or implementation of protectionist trade policies called for by Trump have a negative impact on the outlook for earnings.
On December 15, 2016, the Canadian government enacted new tax rules that eliminate the ability of investors to switch among different classes of RBC Corporate Class Funds on a tax-deferred basis. The new rules do not apply to switches between different series of the same fund.
Effective December 1, 2016, Mr. Lloyd R. McGinnis retired and Ms. Élaine Cousineau was appointed as Chair of the Independent Review Committee (the “IRC”). Mr. Charles F. Macfarlane was appointed as Vice Chair of the IRC. Effective January 1, 2017, Ms. Suromitra Sanatani and Ms. Catherine Kloepfer were appointed as members of the IRC.
RBC U.S. DIVIDEND CLASS
99

ANNUAL MANAGEMENT REPORT OF FUND PERFORMANCE
March 31, 2017
100
RBC U.S. DIVIDEND CLASS
Effective July 1, 2016, Deloitte LLP resigned and PricewaterhouseCoopers LLP was appointed as auditors of the Fund.
Effective June 30, 2016, management fees were reduced as follows: from 1.75% to 1.60% in respect of Series A mutual fund shares and Advisor Series mutual fund shares; from 1.00% to 0.85% in respect of Series D mutual fund shares; and from 0.75% to 0.60% in respect of Series F mutual fund shares. Also effective June 30, 2016, Series H mutual fund shares were re-designated to Series A mutual fund shares and Series I mutual fund shares were re-designated to Series F mutual fund shares.
Related-Party TransactionsManager and Portfolio ManagerRBC GAM is an indirect, wholly owned subsidiary of Royal Bank of Canada (“Royal Bank”) and is the manager and portfolio manager of the Fund. RBC GAM is responsible for the Fund’s day-to-day operations, provides investment advice and portfolio management services to the Fund and appoints distributors for the Fund. RBC GAM is paid a management fee by the Fund as compensation for its services. The Fund pays a fixed administration fee to RBC GAM, which, in turn, pays certain operating expenses of the Fund.
Affiliates of RBC GAM that provide services to the Fund in the course of their normal businesses are discussed below.
DistributorsRBC GAM, Royal Mutual Funds Inc., RBC Direct Investing Inc., RBC Dominion Securities Inc. and Phillips, Hager & North Investment Funds Ltd. are the principal distributors of, or distribute certain series of the mutual fund shares of, the Fund. Dealers receive an ongoing commission based on the total value of their clients’ Series A, Advisor Series and Series D mutual fund shares.
CustodianRBC Investor Services Trust (“RBC IS”) is the custodian and holds the assets of the Fund.
RegistrarsRoyal Bank, RBC IS and RBC GAM are the registrars of the Fund and keep records of who owns the mutual fund shares of the Fund.
Other Related-Party TransactionsPursuant to applicable securities legislation, the Fund relied on the standing instructions from the Independent Review Committee with respect to one or more of the following transactions:
Related-Party Trading Activities(a) trades in securities of Royal Bank;
(b) investments in the securities of issuers for which a related-party dealer acted as an underwriter during the distribution of such securities and the 60-day period following the conclusion of such distribution of the underwritten securities to the public;
(c) purchases of equity and debt securities from or sales of equity or debt securities to a related-party dealer, where it acted as principal; and
Inter-Fund Trading(d) purchases or sales of securities of an issuer from or to another
investment fund or managed account managed by RBC GAM.
The applicable standing instructions require that Related-Party Trading Activities and Inter-Fund Trading be conducted in accordance with RBC GAM policy and that RBC GAM advise the Independent Review Committee of a material breach of any standing instruction. RBC GAM policy requires that an investment decision in respect of Related-Party Trading Activities (i) is made free from any influence of Royal Bank or its associates or affiliates and without taking into account any consideration relevant to Royal Bank or its affiliates or associates, (ii) represents the business judgment of the portfolio manager, uninfluenced by considerations other than the best interests of the Fund, (iii) is in compliance with RBC GAM policies and procedures, and (iv) achieves a fair and reasonable result for the Fund. RBC GAM policy requires that an investment decision in respect of Inter-Fund Trading is in the best interests of each Fund.
100

ANNUAL MANAGEMENT REPORT OF FUND PERFORMANCE
March 31, 2017
101
FINANCIAL HIGHLIGHTS The following tables show selected key financial information about the Fund and are intended to help you understand the Fund’s financial performance for the past five years or for the periods since inception. This information is derived from the Fund’s audited annual financial statements. For financial years beginning on or after April 1, 2014, financial highlight information is derived from financial statements prepared in compliance with International Financial Reporting Standards (“IFRS”). For financial years prior to April 1, 2014, financial highlight information is derived from financial statements prepared in accordance with Canadian generally accepted accounting principles (“GAAP”). “Net Assets,” for the periods prior to April 1, 2014, are calculated in accordance with GAAP, and “Net Asset Value” is derived from the valuation method disclosed in the RBC Corporate Class Funds Annual Information Form and is used for transactional purposes (see Ratios and Supplemental Data). All other calculations for the purposes of this MRFP are made using Net Asset Value. There is no significant difference between “Net Assets” and “Net Asset Value” under IFRS.
Change in Net Assets Per Mutual Fund Share ($)
Annual Distributions2
Increase (Decrease) from Operations1 From Total Realized Unrealized Income From Net Assets For the Year/ Net Assets Revenue Total Gains Gains (Excluding From Capital Return End of Period Ended Beginning of Year/Period (Loss) Expenses (Losses) (Losses) Total Dividends) Dividends Gains of Capital Total Year/Period
Series AMar. 31, 2017 17.51 0.43 (0.37) 0.54 2.40 3.00 – – – – – 20.54 Mar. 31, 2016 17.33 0.38 (0.37) 1.11 (0.98) 0.14 – – – – – 17.51Mar. 31, 2015 13.92 0.36 (0.32) 1.74 1.85 3.63 – – – – – 17.33 Mar. 31, 2014 10.90 0.28 (0.25) 0.58 2.48 3.09 – – – – – 13.92Mar. 31, 20133 10.00† 0.13 (0.09) – 1.40 1.44 – – – – – 10.90
Advisor SeriesMar. 31, 2017 17.51 0.43 (0.36) 0.54 2.37 2.98 – – – – – 20.56Mar. 31, 2016 17.33 0.37 (0.36) 1.11 (0.98) 0.14 – – – – – 17.51Mar. 31, 2015 13.92 0.36 (0.31) 1.75 1.87 3.67 – – – – – 17.33 Mar. 31, 2014 10.90 0.27 (0.26) 0.57 2.46 3.04 – – – – – 13.92Mar. 31, 20133 10.00† 0.09 (0.09) – 0.97 0.97 – – – – – 10.90
Series DMar. 31, 2017 18.06 0.45 (0.20) 0.56 2.48 3.29 – – – – – 21.39Mar. 31, 2016 17.71 0.39 (0.21) 1.14 (1.01) 0.31 – – – – – 18.06Mar. 31, 2015 14.10 0.37 (0.18) 1.78 1.89 3.86 – – – – – 17.71 Mar. 31, 2014 10.94 0.28 (0.14) 0.59 2.55 3.28 – – – – – 14.10Mar. 31, 20133 10.00† 0.09 (0.06) – 0.93 0.96 – – – – – 10.94
Series FMar. 31, 2017 18.20 0.45 (0.15) 0.57 2.82 3.69 – – – – – 21.61Mar. 31, 2016 17.81 0.39 (0.17) 1.15 (1.01) 0.36 – – – – – 18.20Mar. 31, 2015 14.14 0.37 (0.14) 1.79 1.91 3.93 – – – – – 17.81 Mar. 31, 2014 10.96 0.28 (0.12) 0.59 2.53 3.28 – – – – – 14.14Mar. 31, 20133 10.00† 0.08 (0.05) – 0.89 0.92 – – – – – 10.96
1 Net assets and distributions are based on the actual number of mutual fund shares outstanding at the relevant time. The increase/decrease from operations is based on the weighted average number of mutual fund shares outstanding over the financial period. This table is not intended to be a reconciliation of beginning to ending net assets per mutual fund share.
2 Distributions are reinvested in additional mutual fund shares of the Fund or paid in cash.3 From October 31, 2012.† Initial offering net asset value per mutual fund share.
RBC U.S. DIVIDEND CLASS
101
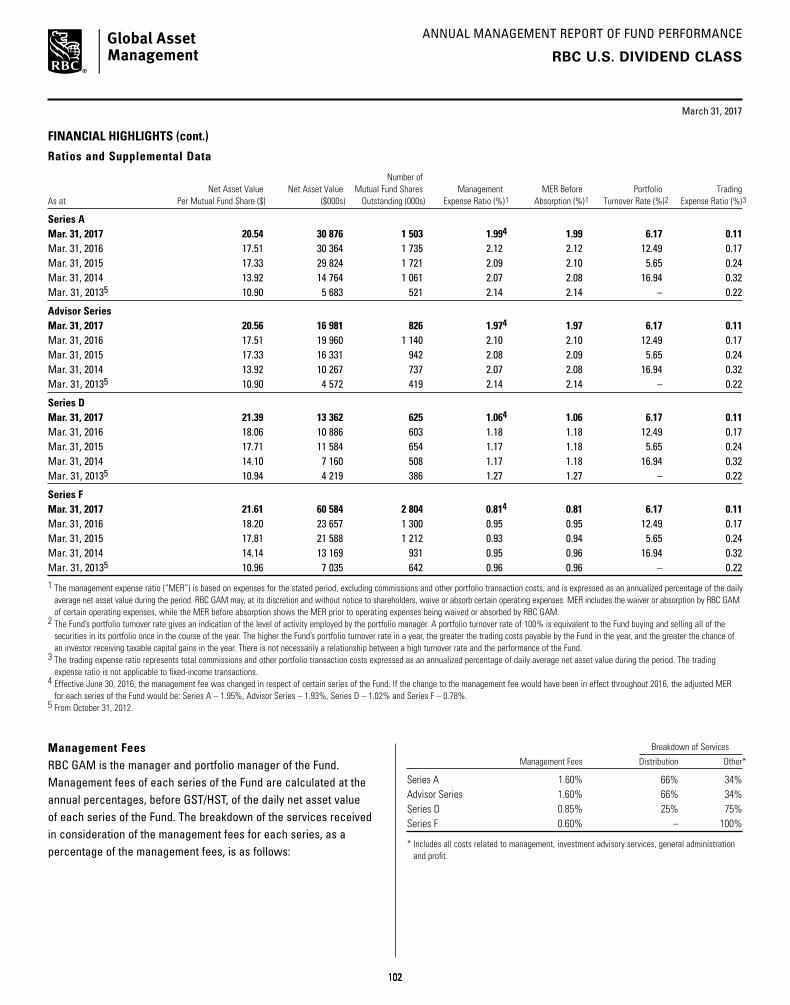
ANNUAL MANAGEMENT REPORT OF FUND PERFORMANCE
March 31, 2017
102
FINANCIAL HIGHLIGHTS (cont.)
Ratios and Supplemental Data
Number of Net Asset Value Net Asset Value Mutual Fund Shares Management MER Before Portfolio TradingAs at Per Mutual Fund Share ($) ($000s) Outstanding (000s) Expense Ratio (%)1 Absorption (%)1 Turnover Rate (%)2 Expense Ratio (%)3
Series AMar. 31, 2017 20.54 30 876 1 503 1.994 1.99 6.17 0.11Mar. 31, 2016 17.51 30 364 1 735 2.12 2.12 12.49 0.17Mar. 31, 2015 17.33 29 824 1 721 2.09 2.10 5.65 0.24Mar. 31, 2014 13.92 14 764 1 061 2.07 2.08 16.94 0.32Mar. 31, 20135 10.90 5 683 521 2.14 2.14 – 0.22
Advisor SeriesMar. 31, 2017 20.56 16 981 826 1.974 1.97 6.17 0.11Mar. 31, 2016 17.51 19 960 1 140 2.10 2.10 12.49 0.17Mar. 31, 2015 17.33 16 331 942 2.08 2.09 5.65 0.24 Mar. 31, 2014 13.92 10 267 737 2.07 2.08 16.94 0.32Mar. 31, 20135 10.90 4 572 419 2.14 2.14 – 0.22
Series DMar. 31, 2017 21.39 13 362 625 1.064 1.06 6.17 0.11Mar. 31, 2016 18.06 10 886 603 1.18 1.18 12.49 0.17Mar. 31, 2015 17.71 11 584 654 1.17 1.18 5.65 0.24Mar. 31, 2014 14.10 7 160 508 1.17 1.18 16.94 0.32Mar. 31, 20135 10.94 4 219 386 1.27 1.27 – 0.22
Series FMar. 31, 2017 21.61 60 584 2 804 0.814 0.81 6.17 0.11Mar. 31, 2016 18.20 23 657 1 300 0.95 0.95 12.49 0.17Mar. 31, 2015 17.81 21 588 1 212 0.93 0.94 5.65 0.24 Mar. 31, 2014 14.14 13 169 931 0.95 0.96 16.94 0.32Mar. 31, 20135 10.96 7 035 642 0.96 0.96 – 0.22
1 The management expense ratio (“MER”) is based on expenses for the stated period, excluding commissions and other portfolio transaction costs, and is expressed as an annualized percentage of the daily average net asset value during the period. RBC GAM may, at its discretion and without notice to shareholders, waive or absorb certain operating expenses. MER includes the waiver or absorption by RBC GAM of certain operating expenses, while the MER before absorption shows the MER prior to operating expenses being waived or absorbed by RBC GAM.
2 The Fund’s portfolio turnover rate gives an indication of the level of activity employed by the portfolio manager. A portfolio turnover rate of 100% is equivalent to the Fund buying and selling all of the securities in its portfolio once in the course of the year. The higher the Fund’s portfolio turnover rate in a year, the greater the trading costs payable by the Fund in the year, and the greater the chance of an investor receiving taxable capital gains in the year. There is not necessarily a relationship between a high turnover rate and the performance of the Fund.
3 The trading expense ratio represents total commissions and other portfolio transaction costs expressed as an annualized percentage of daily average net asset value during the period. The trading expense ratio is not applicable to fixed-income transactions.
4 Effective June 30, 2016, the management fee was changed in respect of certain series of the Fund. If the change to the management fee would have been in effect throughout 2016, the adjusted MER for each series of the Fund would be: Series A – 1.95%, Advisor Series – 1.93%, Series D – 1.02% and Series F – 0.78%.
5 From October 31, 2012.
RBC U.S. DIVIDEND CLASS
Management Fees RBC GAM is the manager and portfolio manager of the Fund. Management fees of each series of the Fund are calculated at the annual percentages, before GST/HST, of the daily net asset value of each series of the Fund. The breakdown of the services received in consideration of the management fees for each series, as a percentage of the management fees, is as follows:
Breakdown of Services
Management Fees Distribution Other*
Series A 1.60% 66% 34%Advisor Series 1.60% 66% 34%Series D 0.85% 25% 75%Series F 0.60% – 100%
* Includes all costs related to management, investment advisory services, general administration and profit.
102
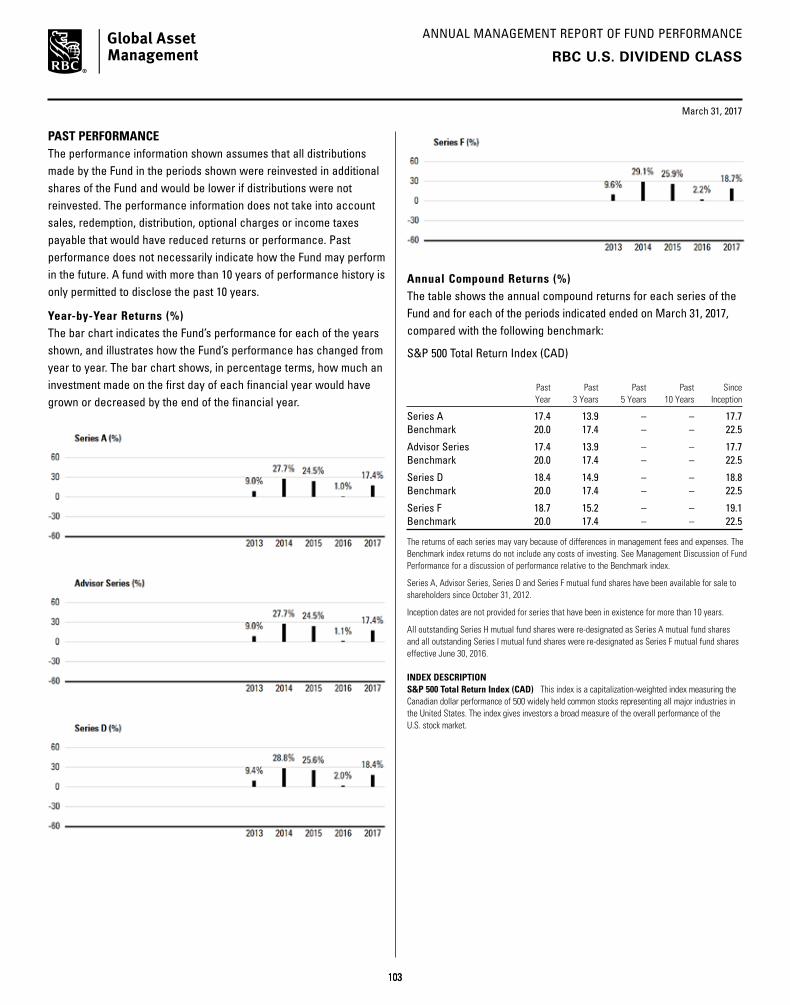
ANNUAL MANAGEMENT REPORT OF FUND PERFORMANCE
March 31, 2017
103
PAST PERFORMANCEThe performance information shown assumes that all distributions made by the Fund in the periods shown were reinvested in additional shares of the Fund and would be lower if distributions were not reinvested. The performance information does not take into account sales, redemption, distribution, optional charges or income taxes payable that would have reduced returns or performance. Past performance does not necessarily indicate how the Fund may perform in the future. A fund with more than 10 years of performance history is only permitted to disclose the past 10 years.
Year-by-Year Returns (%) The bar chart indicates the Fund’s performance for each of the years shown, and illustrates how the Fund’s performance has changed from year to year. The bar chart shows, in percentage terms, how much an investment made on the first day of each financial year would have grown or decreased by the end of the financial year.
RBC U.S. DIVIDEND CLASS
Annual Compound Returns (%) The table shows the annual compound returns for each series of the Fund and for each of the periods indicated ended on March 31, 2017, compared with the following benchmark:
S&P 500 Total Return Index (CAD)
Past Past Past Past Since Year 3 Years 5 Years 10 Years Inception
Series A 17.4 13.9 – – 17.7Benchmark 20.0 17.4 – – 22.5
Advisor Series 17.4 13.9 – – 17.7Benchmark 20.0 17.4 – – 22.5
Series D 18.4 14.9 – – 18.8Benchmark 20.0 17.4 – – 22.5
Series F 18.7 15.2 – – 19.1Benchmark 20.0 17.4 – – 22.5
The returns of each series may vary because of differences in management fees and expenses. The Benchmark index returns do not include any costs of investing. See Management Discussion of Fund Performance for a discussion of performance relative to the Benchmark index.
Series A, Advisor Series, Series D and Series F mutual fund shares have been available for sale to shareholders since October 31, 2012.
Inception dates are not provided for series that have been in existence for more than 10 years.
All outstanding Series H mutual fund shares were re-designated as Series A mutual fund shares and all outstanding Series I mutual fund shares were re-designated as Series F mutual fund shares effective June 30, 2016.
INDEX DESCRIPTIONS&P 500 Total Return Index (CAD) This index is a capitalization-weighted index measuring the Canadian dollar performance of 500 widely held common stocks representing all major industries in the United States. The index gives investors a broad measure of the overall performance of the U.S. stock market.
103

ANNUAL MANAGEMENT REPORT OF FUND PERFORMANCE
March 31, 2017
104
RBC U.S. DIVIDEND CLASS
SUMMARY OF INVESTMENT PORTFOLIO(after consideration of derivative products, if any)As at March 31, 2017
Investment Mix % of Net Asset Value
Information Technology 17.1Financials 16.8Health Care 14.8Consumer Staples 13.2Industrials 11.1Consumer Discretionary 9.9Energy 6.6Utilities 3.5Materials 2.8Telecommunication Services 2.4Real Estate 0.5Cash/Other 1.3
Top 25 Holdings* % of Net Asset Value
Apple Inc. 3.9JPMorgan Chase & Co. 3.3Microsoft Corp. 3.2Johnson & Johnson 3.0Philip Morris International Inc. 2.8Pfizer Inc. 2.7Altria Group Inc. 2.7Bank of America Corp. 2.6PepsiCo Inc. 2.5CVS Health Corp. 2.5Merck & Co. Inc. 2.4Chevron Corp. 2.3Cardinal Health Inc. 1.9Broadcom Ltd. 1.8McDonald’s Corp. 1.7Boeing Co. 1.7UnitedHealth Group Incorporated 1.6Cisco Systems Inc. 1.6Comcast Corp., Class A 1.5Delphi Automotive Plc. 1.5Raytheon Company 1.5Dow Chemical Company 1.4Microchip Technology Inc. 1.4TJX Companies Inc. 1.4LyondellBasell Industries N.V. 1.4Top 25 Holdings 54.3
* The Fund invests substantially all of its assets directly in the RBC U.S. Dividend Fund. The above are the Top 25 holdings of the RBC U.S. Dividend Fund.
The Summary of Investment Portfolio may change due to ongoing portfolio transactions of the Fund and a quarterly update is available at www.rbcgam.com/funds.
The Simplified Prospectus and other information about the underlying fund are available on SEDAR website at www.sedar.com.
104

ANNUAL MANAGEMENT REPORT OF FUND PERFORMANCE
105
U.S. EQUITY FUND
RBC U.S. EQUITY CLASS
March 31, 2017
Portfolio Manager RBC Global Asset Management Inc. (“RBC GAM”)
This annual management report of fund performance (“MRFP”) contains financial highlights but does not contain the complete annual financial statements of the Fund. You can get a copy of the financial statements at your request, and at no cost, by calling 1-800-463-FUND (3863), by writing to us at RBC Global Asset Management Inc., P.O. Box 7500, Station A, Toronto, Ontario M5W 1P9, or by visiting our website at www.rbcgam.com/reports or SEDAR at www.sedar.com. Security holders may also contact us using one of these methods to request a copy of the Fund’s proxy voting policies and procedures, proxy voting disclosure record, or quarterly portfolio disclosure.
The Board of Directors of RBC Corporate Class Inc. approved this annual management report of fund performance on May 11, 2017.
A Note on Forward-looking Statements
This report may contain forward-looking statements about the Fund, its future performance, strategies or prospects, and possible future Fund action. The words “may,” “could,” “should,” “would,” “suspect,” “outlook,” “believe,” “plan,” “anticipate,” “estimate,” “expect,” “intend,” “forecast,” “objective” and similar expressions are intended to identify forward-looking statements.
Forward-looking statements are not guarantees of future performance. Forward-looking statements involve inherent risks and uncertainties, both about the Fund and general economic factors, so it is possible that predictions, forecasts, projections and other forward-looking statements will not be achieved. We caution you not to place undue reliance on these statements as a number of important factors could cause actual events or results to differ materially from those expressed or implied in any forward-looking statement made in relation to the Fund. These factors include, but are not limited to, general economic, political and market factors in Canada, the United States and internationally, interest and foreign exchange rates, global equity and capital markets, business competition, technological changes, changes in laws and regulations, judicial or regulatory judgments, legal proceedings and catastrophic events.
The above list of important factors that may affect future results is not exhaustive. Before making any investment decisions, we encourage you to consider these and other factors carefully. All opinions contained in forward-looking statements are subject to change without notice and are provided in good faith but without legal responsibility.
105

ANNUAL MANAGEMENT REPORT OF FUND PERFORMANCE
March 31, 2017
106
MANAGEMENT DISCUSSION OF FUND PERFORMANCE
Investment Objective and StrategiesThe Fund seeks to provide long-term capital growth by investing primarily in equity securities of major U.S. companies.
To achieve its investment objective, the Fund invests most of its assets in the RBC U.S. Equity Fund (the “underlying fund”). The underlying fund diversifies across industries and invests in companies with strong management, focused business models and the potential for growth in earnings and cash flow.
RiskThere were no significant changes to the investment objective and strategies that affected the Fund’s overall level of risk during the reporting period. The risks of investing in the Fund and the suitability of the Fund for investors remain as discussed in the Simplified Prospectus.
Results of OperationsThe Fund’s net asset value rose to $28 million as of March 31, 2017, from $25 million as of March 31, 2016. The increase was due to investment returns.
Over the past year, the Fund’s Series A shares gained 16.4%, which underperformed the 20.0% rise in the benchmark. The Fund’s return is after the deduction of fees and expenses, while the benchmark and broad-based index returns do not include any costs of investing. See the Financial Highlights section for the management expense ratios and the Past Performance section for the returns of any other series, which may vary because of differences in management fees and expenses.
The S&P 500 generated above-average returns over the past 12 months, rising about 20%. Market returns were driven by a recovery in commodity prices, improvement in most global economies and a rebound in corporate earnings. Some of the performance was attributable to optimism that President Trump will succeed in gaining legislative support for his plan to boost government spending and cut taxes, both of which would likely support economic growth.
Performance was hurt by the Fund’s underweight positions in the Industrials and Financials sectors. Stock selection in the Consumer Discretionary sector hurt performance as bricks-and-mortar retailers Nordstrom and Dollar General continued to face fierce competition from internet retailers. The Fund was also hurt by its positions in Blackstone, which manages alternative investments, and credit-card company Synchrony Financial.
The Energy and Health Care sectors were the best-performing sectors in the Fund with notable help from Materials, a sector that benefited from higher commodity prices in response to improving economic activity. Dow Chemical led the way in the Materials sector following its agreement to merge with DuPont, and an underweight
position in the Consumer Staples sector also aided returns. Strong stock selection in the Energy, Materials and Consumer Discretionary sectors also contributed to returns. An underweight position in the Energy sector was a positive, as was lower-than-benchmark exposure to ExxonMobil. In the Financials sector, bank profitability improved as the amount charged by banks on loans rose more than the rate they paid for funds. Bank of America, Goldman Sachs and Lincoln National were standouts. In the Materials sector, steelmaker Steel Dynamics generated outsized returns as economic activity picked up. Other notable performers in the portfolio included the technology companies Apple, Microsoft and Texas Instruments.
Recent DevelopmentsIn the portfolio manager’s opinion, recent economic data suggests global economy growth is reaccelerating, slowly and from a low level. Earnings growth turned positive in the third quarter and the portfolio manager expects profit improvements to drive markets somewhat higher in 2017. However, the stock market could come under pressure if further strengthening of the U.S. dollar or implementation of protectionist trade policies called for by Trump have a negative impact on the outlook for earnings.
On December 15, 2016, the Canadian government enacted new tax rules that eliminate the ability of investors to switch among different classes of RBC Corporate Class Funds on a tax-deferred basis. The new rules do not apply to switches between different series of the same fund.
Effective December 1, 2016, Mr. Lloyd R. McGinnis retired and Ms. Élaine Cousineau was appointed as Chair of the Independent Review Committee (the “IRC”). Mr. Charles F. Macfarlane was appointed as Vice Chair of the IRC. Effective January 1, 2017, Ms. Suromitra Sanatani and Ms. Catherine Kloepfer were appointed as members of the IRC.
Effective July 1, 2016, Deloitte LLP resigned and PricewaterhouseCoopers LLP was appointed as auditors of the Fund.
Effective June 30, 2016, management fees were reduced as follows: from 1.75% to 1.60% in respect of Series A mutual fund shares and Advisor Series mutual fund shares; from 1.00% to 0.85% in respect of Series D mutual fund shares; and from 0.75% to 0.60% in respect of Series F mutual fund shares. Also effective June 30, 2016, Series H mutual fund shares were closed to all investors, and Series I mutual fund shares were re-designated to Series F mutual fund shares.
RBC U.S. EQUITY CLASS
106
ANNUAL MANAGEMENT REPORT OF FUND PERFORMANCE
March 31, 2017
107
RBC U.S. EQUITY CLASS
Related-Party TransactionsManager and Portfolio ManagerRBC GAM is an indirect, wholly owned subsidiary of Royal Bank of Canada (“Royal Bank”) and is the manager and portfolio manager of the Fund. RBC GAM is responsible for the Fund’s day-to-day operations, provides investment advice and portfolio management services to the Fund and appoints distributors for the Fund. RBC GAM is paid a management fee by the Fund as compensation for its services. The Fund pays a fixed administration fee to RBC GAM, which, in turn, pays certain operating expenses of the Fund.
Affiliates of RBC GAM that provide services to the Fund in the course of their normal businesses are discussed below.
DistributorsRBC GAM, Royal Mutual Funds Inc., RBC Direct Investing Inc., RBC Dominion Securities Inc. and Phillips, Hager & North Investment Funds Ltd. are the principal distributors of, or distribute certain series of the mutual fund shares of, the Fund. Dealers receive an ongoing commission based on the total value of their clients’ Series A, Advisor Series and Series D mutual fund shares.
CustodianRBC Investor Services Trust (“RBC IS”) is the custodian and holds the assets of the Fund.
RegistrarsRoyal Bank, RBC IS and RBC GAM are the registrars of the Fund and keep records of who owns the mutual fund shares of the Fund.
Other Related-Party TransactionsPursuant to applicable securities legislation, the Fund relied on the standing instructions from the Independent Review Committee with respect to one or more of the following transactions:
Related-Party Trading Activities(a) trades in securities of Royal Bank;
(b) investments in the securities of issuers for which a related-party dealer acted as an underwriter during the distribution of such securities and the 60-day period following the conclusion of such distribution of the underwritten securities to the public;
(c) purchases of equity and debt securities from or sales of equity or debt securities to a related-party dealer, where it acted as principal; and
Inter-Fund Trading(d) purchases or sales of securities of an issuer from or to another
investment fund or managed account managed by RBC GAM.
The applicable standing instructions require that Related-Party Trading Activities and Inter-Fund Trading be conducted in accordance with RBC GAM policy and that RBC GAM advise the Independent Review Committee of a material breach of any standing instruction. RBC GAM policy requires that an investment decision in respect of Related-Party Trading Activities (i) is made free from any influence of Royal Bank or its associates or affiliates and without taking into account any consideration relevant to Royal Bank or its affiliates or associates, (ii) represents the business judgment of the portfolio manager, uninfluenced by considerations other than the best interests of the Fund, (iii) is in compliance with RBC GAM policies and procedures, and (iv) achieves a fair and reasonable result for the Fund. RBC GAM policy requires that an investment decision in respect of Inter-Fund Trading is in the best interests of each Fund.
107

ANNUAL MANAGEMENT REPORT OF FUND PERFORMANCE
March 31, 2017
108
RBC U.S. EQUITY CLASS
FINANCIAL HIGHLIGHTS The following tables show selected key financial information about the Fund and are intended to help you understand the Fund’s financial performance for the past five years or for the periods since inception. This information is derived from the Fund’s audited annual financial statements. For financial years beginning on or after April 1, 2014, financial highlight information is derived from financial statements prepared in compliance with International Financial Reporting Standards (“IFRS”). For financial years prior to April 1, 2014, financial highlight information is derived from financial statements prepared in accordance with Canadian generally accepted accounting principles (“GAAP”). “Net Assets,” for the periods prior to April 1, 2014, are calculated in accordance with GAAP, and “Net Asset Value” is derived from the valuation method disclosed in the RBC Corporate Class Funds Annual Information Form and is used for transactional purposes (see Ratios and Supplemental Data). All other calculations for the purposes of this MRFP are made using Net Asset Value. There is no significant difference between “Net Assets” and “Net Asset Value” under IFRS.
Change in Net Assets Per Mutual Fund Share ($)
Annual Distributions2
Increase (Decrease) from Operations1 From Total Realized Unrealized Income From Net Assets For the Year/ Net Assets Revenue Total Gains Gains (Excluding From Capital Return End of Period Ended Beginning of Year/Period (Loss) Expenses (Losses) (Losses) Total Dividends) Dividends Gains of Capital Total Year/Period
Series AMar. 31, 2017 17.97 0.29 (0.38) 0.58 2.36 2.85 – – – – – 20.92 Mar. 31, 2016 18.16 0.31 (0.38) 1.87 (1.96) (0.16) – – – – – 17.97Mar. 31, 2015 14.90 0.26 (0.34) 0.68 2.83 3.43 – – – – – 18.16Mar. 31, 2014 11.83 0.23 (0.28) 0.47 2.70 3.12 – – – – – 14.90Mar. 31, 2013 10.73 0.26 (0.23) 0.02 1.57 1.62 – – – – – 11.83
Advisor SeriesMar. 31, 2017 17.99 0.29 (0.38) 0.58 2.54 3.03 – – – – – 20.94Mar. 31, 2016 18.17 0.31 (0.38) 1.88 (1.97) (0.16) – – – – – 17.99Mar. 31, 2015 14.90 0.26 (0.33) 0.69 2.87 3.49 – – – – – 18.17Mar. 31, 2014 11.83 0.23 (0.28) 0.47 2.71 3.13 – – – – – 14.90Mar. 31, 2013 10.72 0.26 (0.23) 0.02 1.56 1.61 – – – – – 11.83
Series DMar. 31, 2017 18.71 0.30 (0.20) 0.60 2.54 3.24 – – – – – 21.99Mar. 31, 2016 18.72 0.32 (0.21) 1.94 (2.03) 0.02 – – – – – 18.71Mar. 31, 2015 15.21 0.27 (0.18) 0.71 2.92 3.72 – – – – – 18.72Mar. 31, 2014 11.96 0.24 (0.15) 0.48 2.75 3.32 – – – – – 15.21Mar. 31, 2013 10.75 0.25 (0.13) 0.02 1.53 1.67 – – – – – 11.96
Series FMar. 31, 2017 18.90 0.31 (0.16) 0.62 2.88 3.65 – – – – – 22.26Mar. 31, 2016 18.87 0.32 (0.17) 1.96 (2.05) 0.06 – – – – – 18.90Mar. 31, 2015 15.30 0.27 (0.15) 0.71 2.94 3.77 – – – – – 18.87Mar. 31, 2014 12.00 0.24 (0.13) 0.48 2.75 3.34 – – – – – 15.30Mar. 31, 2013 10.75 0.26 (0.10) 0.02 1.57 1.75 – – – – – 12.00
Series OMar. 31, 2017 19.60 0.32 (0.01) 0.64 2.71 3.66 – – – – – 23.26Mar. 31, 2016 19.40 0.33 (0.01) 2.01 (2.10) 0.23 – – – – – 19.60Mar. 31, 2015 15.60 0.27 (0.01) 0.72 2.99 3.97 – – – – – 19.40 Mar. 31, 2014 12.13 0.24 (0.01) 0.49 2.80 3.52 – – – – – 15.60Mar. 31, 2013 10.78 0.29 (0.01) 0.02 1.73 2.03 – – – – – 12.13
1 Net assets and distributions are based on the actual number of mutual fund shares outstanding at the relevant time. The increase/decrease from operations is based on the weighted average number of mutual fund shares outstanding over the financial period. This table is not intended to be a reconciliation of beginning to ending net assets per mutual fund share.
2 Distributions are reinvested in additional mutual fund shares of the Fund or paid in cash.
108
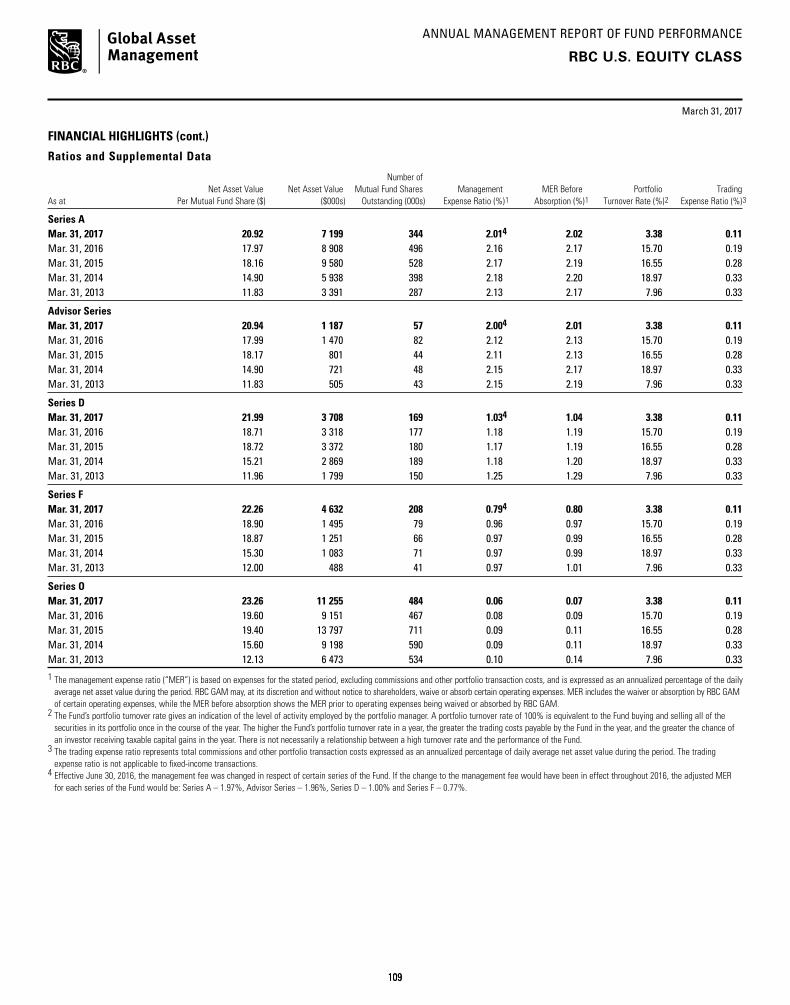
ANNUAL MANAGEMENT REPORT OF FUND PERFORMANCE
March 31, 2017
109
RBC U.S. EQUITY CLASS
FINANCIAL HIGHLIGHTS (cont.)
Ratios and Supplemental Data
Number of Net Asset Value Net Asset Value Mutual Fund Shares Management MER Before Portfolio TradingAs at Per Mutual Fund Share ($) ($000s) Outstanding (000s) Expense Ratio (%)1 Absorption (%)1 Turnover Rate (%)2 Expense Ratio (%)3
Series AMar. 31, 2017 20.92 7 199 344 2.014 2.02 3.38 0.11Mar. 31, 2016 17.97 8 908 496 2.16 2.17 15.70 0.19Mar. 31, 2015 18.16 9 580 528 2.17 2.19 16.55 0.28 Mar. 31, 2014 14.90 5 938 398 2.18 2.20 18.97 0.33Mar. 31, 2013 11.83 3 391 287 2.13 2.17 7.96 0.33
Advisor SeriesMar. 31, 2017 20.94 1 187 57 2.004 2.01 3.38 0.11Mar. 31, 2016 17.99 1 470 82 2.12 2.13 15.70 0.19Mar. 31, 2015 18.17 801 44 2.11 2.13 16.55 0.28 Mar. 31, 2014 14.90 721 48 2.15 2.17 18.97 0.33Mar. 31, 2013 11.83 505 43 2.15 2.19 7.96 0.33
Series DMar. 31, 2017 21.99 3 708 169 1.034 1.04 3.38 0.11Mar. 31, 2016 18.71 3 318 177 1.18 1.19 15.70 0.19Mar. 31, 2015 18.72 3 372 180 1.17 1.19 16.55 0.28 Mar. 31, 2014 15.21 2 869 189 1.18 1.20 18.97 0.33Mar. 31, 2013 11.96 1 799 150 1.25 1.29 7.96 0.33
Series FMar. 31, 2017 22.26 4 632 208 0.794 0.80 3.38 0.11Mar. 31, 2016 18.90 1 495 79 0.96 0.97 15.70 0.19Mar. 31, 2015 18.87 1 251 66 0.97 0.99 16.55 0.28 Mar. 31, 2014 15.30 1 083 71 0.97 0.99 18.97 0.33Mar. 31, 2013 12.00 488 41 0.97 1.01 7.96 0.33
Series OMar. 31, 2017 23.26 11 255 484 0.06 0.07 3.38 0.11Mar. 31, 2016 19.60 9 151 467 0.08 0.09 15.70 0.19Mar. 31, 2015 19.40 13 797 711 0.09 0.11 16.55 0.28 Mar. 31, 2014 15.60 9 198 590 0.09 0.11 18.97 0.33Mar. 31, 2013 12.13 6 473 534 0.10 0.14 7.96 0.33
1 The management expense ratio (“MER”) is based on expenses for the stated period, excluding commissions and other portfolio transaction costs, and is expressed as an annualized percentage of the daily average net asset value during the period. RBC GAM may, at its discretion and without notice to shareholders, waive or absorb certain operating expenses. MER includes the waiver or absorption by RBC GAM of certain operating expenses, while the MER before absorption shows the MER prior to operating expenses being waived or absorbed by RBC GAM.
2 The Fund’s portfolio turnover rate gives an indication of the level of activity employed by the portfolio manager. A portfolio turnover rate of 100% is equivalent to the Fund buying and selling all of the securities in its portfolio once in the course of the year. The higher the Fund’s portfolio turnover rate in a year, the greater the trading costs payable by the Fund in the year, and the greater the chance of an investor receiving taxable capital gains in the year. There is not necessarily a relationship between a high turnover rate and the performance of the Fund.
3 The trading expense ratio represents total commissions and other portfolio transaction costs expressed as an annualized percentage of daily average net asset value during the period. The trading expense ratio is not applicable to fixed-income transactions.
4 Effective June 30, 2016, the management fee was changed in respect of certain series of the Fund. If the change to the management fee would have been in effect throughout 2016, the adjusted MER for each series of the Fund would be: Series A – 1.97%, Advisor Series – 1.96%, Series D – 1.00% and Series F – 0.77%.
109
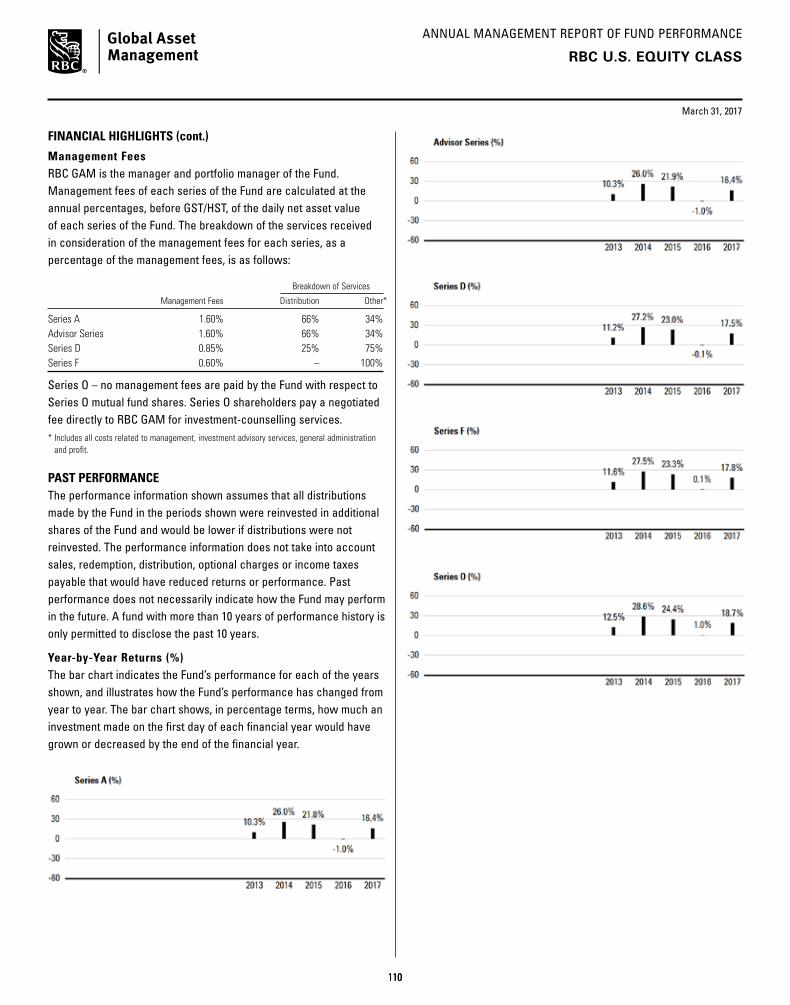
ANNUAL MANAGEMENT REPORT OF FUND PERFORMANCE
110
March 31, 2017
FINANCIAL HIGHLIGHTS (cont.)
Management Fees RBC GAM is the manager and portfolio manager of the Fund. Management fees of each series of the Fund are calculated at the annual percentages, before GST/HST, of the daily net asset value of each series of the Fund. The breakdown of the services received in consideration of the management fees for each series, as a percentage of the management fees, is as follows:
Breakdown of Services
Management Fees Distribution Other*
Series A 1.60% 66% 34% Advisor Series 1.60% 66% 34% Series D 0.85% 25% 75%Series F 0.60% – 100%
Series O – no management fees are paid by the Fund with respect to Series O mutual fund shares. Series O shareholders pay a negotiated fee directly to RBC GAM for investment-counselling services.* Includes all costs related to management, investment advisory services, general administration
and profit.
PAST PERFORMANCEThe performance information shown assumes that all distributions made by the Fund in the periods shown were reinvested in additional shares of the Fund and would be lower if distributions were not reinvested. The performance information does not take into account sales, redemption, distribution, optional charges or income taxes payable that would have reduced returns or performance. Past performance does not necessarily indicate how the Fund may perform in the future. A fund with more than 10 years of performance history is only permitted to disclose the past 10 years.
Year-by-Year Returns (%) The bar chart indicates the Fund’s performance for each of the years shown, and illustrates how the Fund’s performance has changed from year to year. The bar chart shows, in percentage terms, how much an investment made on the first day of each financial year would have grown or decreased by the end of the financial year.
RBC U.S. EQUITY CLASS
110
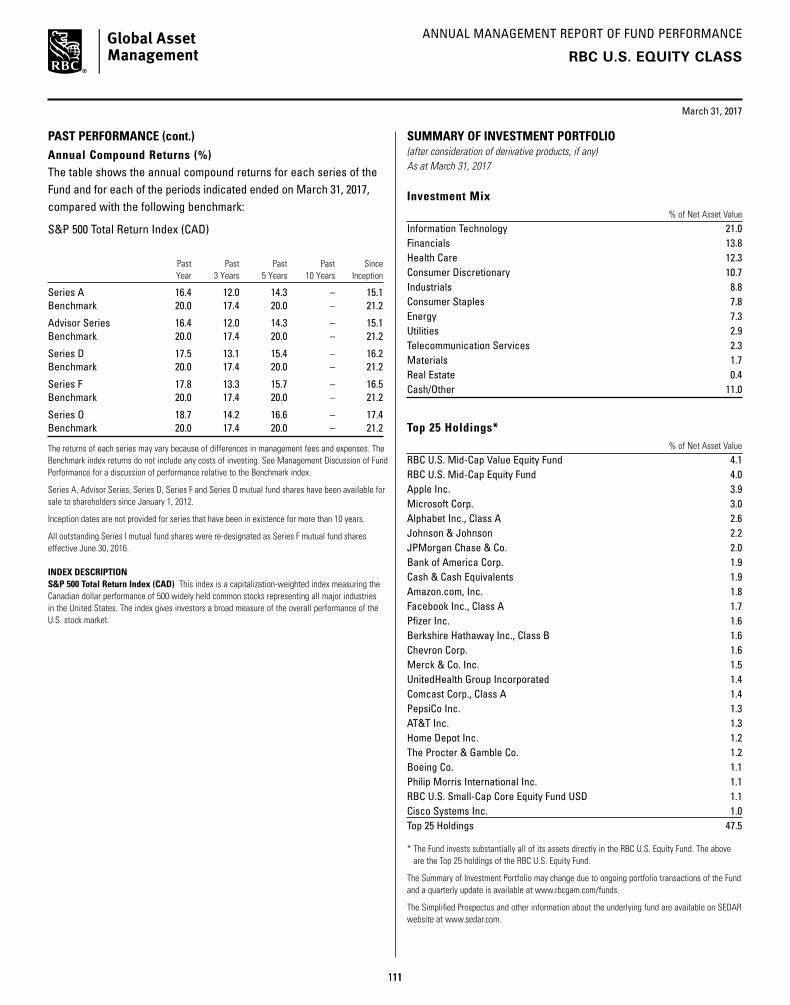
ANNUAL MANAGEMENT REPORT OF FUND PERFORMANCE
March 31, 2017
111
RBC U.S. EQUITY CLASS
PAST PERFORMANCE (cont.)Annual Compound Returns (%) The table shows the annual compound returns for each series of the Fund and for each of the periods indicated ended on March 31, 2017, compared with the following benchmark:
S&P 500 Total Return Index (CAD)
Past Past Past Past Since Year 3 Years 5 Years 10 Years Inception
Series A 16.4 12.0 14.3 – 15.1Benchmark 20.0 17.4 20.0 – 21.2
Advisor Series 16.4 12.0 14.3 – 15.1Benchmark 20.0 17.4 20.0 – 21.2
Series D 17.5 13.1 15.4 – 16.2Benchmark 20.0 17.4 20.0 – 21.2
Series F 17.8 13.3 15.7 – 16.5Benchmark 20.0 17.4 20.0 – 21.2
Series O 18.7 14.2 16.6 – 17.4Benchmark 20.0 17.4 20.0 – 21.2
The returns of each series may vary because of differences in management fees and expenses. The Benchmark index returns do not include any costs of investing. See Management Discussion of Fund Performance for a discussion of performance relative to the Benchmark index.
Series A, Advisor Series, Series D, Series F and Series O mutual fund shares have been available for sale to shareholders since January 1, 2012.
Inception dates are not provided for series that have been in existence for more than 10 years.
All outstanding Series I mutual fund shares were re-designated as Series F mutual fund shares effective June 30, 2016.
INDEX DESCRIPTIONS&P 500 Total Return Index (CAD) This index is a capitalization-weighted index measuring the Canadian dollar performance of 500 widely held common stocks representing all major industries in the United States. The index gives investors a broad measure of the overall performance of the U.S. stock market.
SUMMARY OF INVESTMENT PORTFOLIO(after consideration of derivative products, if any)As at March 31, 2017
Investment Mix % of Net Asset Value
Information Technology 21.0Financials 13.8Health Care 12.3Consumer Discretionary 10.7Industrials 8.8Consumer Staples 7.8Energy 7.3Utilities 2.9Telecommunication Services 2.3Materials 1.7Real Estate 0.4Cash/Other 11.0
Top 25 Holdings* % of Net Asset Value
RBC U.S. Mid-Cap Value Equity Fund 4.1RBC U.S. Mid-Cap Equity Fund 4.0Apple Inc. 3.9Microsoft Corp. 3.0Alphabet Inc., Class A 2.6Johnson & Johnson 2.2JPMorgan Chase & Co. 2.0Bank of America Corp. 1.9Cash & Cash Equivalents 1.9Amazon.com, Inc. 1.8Facebook Inc., Class A 1.7Pfizer Inc. 1.6Berkshire Hathaway Inc., Class B 1.6Chevron Corp. 1.6Merck & Co. Inc. 1.5UnitedHealth Group Incorporated 1.4Comcast Corp., Class A 1.4PepsiCo Inc. 1.3AT&T Inc. 1.3Home Depot Inc. 1.2The Procter & Gamble Co. 1.2Boeing Co. 1.1Philip Morris International Inc. 1.1RBC U.S. Small-Cap Core Equity Fund USD 1.1Cisco Systems Inc. 1.0Top 25 Holdings 47.5
* The Fund invests substantially all of its assets directly in the RBC U.S. Equity Fund. The above are the Top 25 holdings of the RBC U.S. Equity Fund.
The Summary of Investment Portfolio may change due to ongoing portfolio transactions of the Fund and a quarterly update is available at www.rbcgam.com/funds.
The Simplified Prospectus and other information about the underlying fund are available on SEDAR website at www.sedar.com.
111

ANNUAL MANAGEMENT REPORT OF FUND PERFORMANCE
112
U.S. EQUITY FUND
RBC QUBE LOW VOLATILITY U.S. EQUITY CLASS
March 31, 2017
Portfolio Manager RBC Global Asset Management Inc. (“RBC GAM”)
This annual management report of fund performance (“MRFP”) contains financial highlights but does not contain the complete annual financial statements of the Fund. You can get a copy of the financial statements at your request, and at no cost, by calling 1-800-463-FUND (3863), by writing to us at RBC Global Asset Management Inc., P.O. Box 7500, Station A, Toronto, Ontario M5W 1P9, or by visiting our website at www.rbcgam.com/reports or SEDAR at www.sedar.com. Security holders may also contact us using one of these methods to request a copy of the Fund’s proxy voting policies and procedures, proxy voting disclosure record, or quarterly portfolio disclosure.
The Board of Directors of RBC Corporate Class Inc. approved this annual management report of fund performance on May 11, 2017.
A Note on Forward-looking Statements
This report may contain forward-looking statements about the Fund, its future performance, strategies or prospects, and possible future Fund action. The words “may,” “could,” “should,” “would,” “suspect,” “outlook,” “believe,” “plan,” “anticipate,” “estimate,” “expect,” “intend,” “forecast,” “objective” and similar expressions are intended to identify forward-looking statements.
Forward-looking statements are not guarantees of future performance. Forward-looking statements involve inherent risks and uncertainties, both about the Fund and general economic factors, so it is possible that predictions, forecasts, projections and other forward-looking statements will not be achieved. We caution you not to place undue reliance on these statements as a number of important factors could cause actual events or results to differ materially from those expressed or implied in any forward-looking statement made in relation to the Fund. These factors include, but are not limited to, general economic, political and market factors in Canada, the United States and internationally, interest and foreign exchange rates, global equity and capital markets, business competition, technological changes, changes in laws and regulations, judicial or regulatory judgments, legal proceedings and catastrophic events.
The above list of important factors that may affect future results is not exhaustive. Before making any investment decisions, we encourage you to consider these and other factors carefully. All opinions contained in forward-looking statements are subject to change without notice and are provided in good faith but without legal responsibility.
112

ANNUAL MANAGEMENT REPORT OF FUND PERFORMANCE
113
March 31, 2017
MANAGEMENT DISCUSSION OF FUND PERFORMANCE
Investment Objective and StrategiesThe Fund seeks to provide long-term capital growth by investing primarily in equity securities of U.S. companies. The Fund uses a quantitative approach and seeks to achieve a reduced level of volatility of returns compared with the broader U.S. equity market.
To achieve its investment objective, the Fund invests most of its assets in the RBC QUBE Low Volatility U.S. Equity Fund (the “underlying fund”). The underlying fund is managed using a quantitative investment model designed to select individual stocks while controlling portfolio-level risk. This involves building a portfolio that maximizes exposure to factors associated with outperformance, while controlling for exposure to risk factors. The portfolio manager of the underlying fund will diversify across industries within the U.S. equity market.
RiskThere were no significant changes to the investment objective and strategies that affected the Fund’s overall level of risk during the reporting period. The risks of investing in the Fund and the suitability of the Fund for investors remain as discussed in the Simplified Prospectus.
Results of OperationsThe Fund’s net asset value rose to $35 million as of March 31, 2017, from $14 million as of March 31, 2016. The increase was due to mainly to net inflows.
Over the past year, the Fund’s Series A shares gained 13.4%, which underperformed the 20.0% rise in the benchmark. The Fund’s return is after the deduction of fees and expenses, while the benchmark and broad-based index returns do not include any costs of investing. See the Financial Highlights section for the management expense ratios and the Past Performance section for the returns of any other series, which may vary because of differences in management fees and expenses.
The election of Donald Trump in November as U.S. president led to optimism that he would be able to enact tax cuts, fiscal spending and economic deregulation, and market gains accelerated after his victory.
Within the Fund, stocks in the Materials sector posted robust results as commodity prices continued to climb. Newmont Mining and Royal Gold were among the biggest gainers in the Fund’s portfolio. The Financials sector was another area of strength for the Fund, as bank stocks benefited given prospects for higher interest rates. PNC Financial Services, American Financial Group and U.S. Bancorp contributed to the Fund’s performance.
Returns were hurt by positions in Telecommunication Services. Allocations to Comtech Telecommunications and Verizon detracted from performance. The Consumer Discretionary sector also weighed heavily on performance, with a position in AutoZone holding back returns.
Recent DevelopmentsThe economic outlook has improved globally, in the view of the portfolio manager. Positive economic data has supported heightened consumer and business confidence, and investors have focused on the potential for a shift from monetary stimulus to fiscal stimulus. However, central banks other than the U.S. Federal Reserve are continuing to rely on monetary stimulus until there is evidence that fiscal spending is ready to take over.
On December 15, 2016, the Canadian government enacted new tax rules that eliminate the ability of investors to switch among different classes of RBC Corporate Class Funds on a tax-deferred basis. The new rules do not apply to switches between different series of the same fund.
Effective December 1, 2016, Mr. Lloyd R. McGinnis retired and Ms. Élaine Cousineau was appointed as Chair of the Independent Review Committee (the “IRC”). Mr. Charles F. Macfarlane was appointed as Vice Chair of the IRC. Effective January 1, 2017, Ms. Suromitra Sanatani and Ms. Catherine Kloepfer were appointed as members of the IRC.
Effective July 1, 2016, Deloitte LLP resigned and PricewaterhouseCoopers LLP was appointed as auditors of the Fund.
Effective June 30, 2016, management fees were reduced as follows: from 1.75% to 1.60% in respect of Series A mutual fund shares and Advisor Series mutual fund shares; from 1.00% to 0.85% in respect of Series D mutual fund shares; and from 0.75% to 0.60% in respect of Series F mutual fund shares. Also effective June 30, 2016, Series H mutual fund shares were re-designated to Series A mutual fund shares, and Series I mutual fund shares were closed to all investors.
Related-Party TransactionsManager and Portfolio ManagerRBC GAM is an indirect, wholly owned subsidiary of Royal Bank of Canada (“Royal Bank”) and is the manager and portfolio manager of the Fund. RBC GAM is responsible for the Fund’s day-to-day operations, provides investment advice and portfolio management services to the Fund and appoints distributors for the Fund. RBC GAM is paid a management fee by the Fund as compensation for its services. The Fund pays a fixed administration fee to RBC GAM, which, in turn, pays certain operating expenses of the Fund.
Affiliates of RBC GAM that provide services to the Fund in the course of their normal businesses are discussed below.
RBC QUBE LOW VOLATILITY U.S. EQUITY CLASS
113

ANNUAL MANAGEMENT REPORT OF FUND PERFORMANCE
114
March 31, 2017
RBC QUBE LOW VOLATILITY U.S. EQUITY CLASS
DistributorsRBC GAM, Royal Mutual Funds Inc., RBC Direct Investing Inc., RBC Dominion Securities Inc. and Phillips, Hager & North Investment Funds Ltd. are the principal distributors of, or distribute certain series of the mutual fund shares of, the Fund. Dealers receive an ongoing commission based on the total value of their clients’ Series A, Advisor Series and Series D mutual fund shares.
CustodianRBC Investor Services Trust (“RBC IS”) is the custodian and holds the assets of the Fund.
RegistrarsRoyal Bank, RBC IS and RBC GAM are the registrars of the Fund and keep records of who owns the mutual fund shares of the Fund.
Other Related-Party TransactionsPursuant to applicable securities legislation, the Fund relied on the standing instructions from the Independent Review Committee with respect to one or more of the following transactions:
Related-Party Trading Activities(a) trades in securities of Royal Bank;
(b) investments in the securities of issuers for which a related-party dealer acted as an underwriter during the distribution of such securities and the 60-day period following the conclusion of such distribution of the underwritten securities to the public;
(c) purchases of equity and debt securities from or sales of equity or debt securities to a related-party dealer, where it acted as principal; and
Inter-Fund Trading(d) purchases or sales of securities of an issuer from or to another
investment fund or managed account managed by RBC GAM.
The applicable standing instructions require that Related-Party Trading Activities and Inter-Fund Trading be conducted in accordance with RBC GAM policy and that RBC GAM advise the Independent Review Committee of a material breach of any standing instruction. RBC GAM policy requires that an investment decision in respect of Related-Party Trading Activities (i) is made free from any influence of Royal Bank or its associates or affiliates and without taking into account any consideration relevant to Royal Bank or its affiliates or associates, (ii) represents the business judgment of the portfolio manager, uninfluenced by considerations other than the best interests of the Fund, (iii) is in compliance with RBC GAM policies and procedures, and (iv) achieves a fair and reasonable result for the Fund. RBC GAM policy requires that an investment decision in respect of Inter-Fund Trading is in the best interests of each Fund.
114

ANNUAL MANAGEMENT REPORT OF FUND PERFORMANCE
March 31, 2017
115
RBC QUBE LOW VOLATILITY U.S. EQUITY CLASS
FINANCIAL HIGHLIGHTS The following tables show selected key financial information about the Fund and are intended to help you understand the Fund’s financial performance for the past five years or for the periods since inception. This information is derived from the Fund’s audited annual financial statements. For financial years beginning on or after April 1, 2014, financial highlight information is derived from financial statements prepared in compliance with International Financial Reporting Standards (“IFRS”). For financial years prior to April 1, 2014, financial highlight information is derived from financial statements prepared in accordance with Canadian generally accepted accounting principles (“GAAP”). “Net Assets,” for the periods prior to April 1, 2014, are calculated in accordance with GAAP, and “Net Asset Value” is derived from the valuation method disclosed in the RBC Corporate Class Funds Annual Information Form and is used for transactional purposes (see Ratios and Supplemental Data). All other calculations for the purposes of this MRFP are made using Net Asset Value. There is no significant difference between “Net Assets” and “Net Asset Value” under IFRS.
Change in Net Assets Per Mutual Fund Share ($)
Annual Distributions2
Increase (Decrease) from Operations1 From Total Realized Unrealized Income From Net Assets For the Year/ Net Assets Revenue Total Gains Gains (Excluding From Capital Return End of Period Ended Beginning of Year/Period (Loss) Expenses (Losses) (Losses) Total Dividends) Dividends Gains of Capital Total Year/Period
Series AMar. 31, 2017 10.84 0.28 (0.21) 0.43 0.87 1.37 – – – – – 12.29 Mar. 31, 2016 9.93 0.19 (0.21) 0.12 0.87 0.97 – – – – – 10.84Mar. 31, 20153 10.00† – (0.04) 0.01 0.11 0.08 – – – – – 9.93
Advisor SeriesMar. 31, 2017 10.84 0.27 (0.21) 0.41 1.01 1.48 – – – – – 12.30Mar. 31, 2016 9.94 0.17 (0.21) 0.11 0.77 0.84 – – – – – 10.84Mar. 31, 20153 10.00† – (0.04) 0.02 0.22 0.20 – – – – – 9.94
Series DMar. 31, 2017 10.94 0.29 (0.12) 0.45 1.01 1.63 – – – – – 12.52Mar. 31, 2016 9.95 0.19 (0.13) 0.12 0.84 1.02 – – – – – 10.94Mar. 31, 20153 10.00† – (0.02) 0.01 0.11 0.10 – – – – – 9.95
Series FMar. 31, 2017 10.98 0.27 (0.09) 0.42 1.39 1.99 – – – – – 12.59Mar. 31, 2016 9.95 0.16 (0.10) 0.10 0.73 0.89 – – – – – 10.98Mar. 31, 20153 10.00† – (0.02) 0.01 0.08 0.07 – – – – – 9.95
Series OMar. 31, 2017 11.10 0.25 – 0.39 1.27 1.91 – – – – – 12.82Mar. 31, 2016 9.97 0.24 – 0.15 1.07 1.46 – – – – – 11.10Mar. 31, 20153 10.00† – – 0.02 0.17 0.19 – – – – – 9.97
1 Net assets and distributions are based on the actual number of mutual fund shares outstanding at the relevant time. The increase/decrease from operations is based on the weighted average number of mutual fund shares outstanding over the financial period. This table is not intended to be a reconciliation of beginning to ending net assets per mutual fund share.
2 Distributions are reinvested in additional mutual fund shares of the Fund or paid in cash.3 From October 16, 2014.† Initial offering net asset value per mutual fund share.
115

ANNUAL MANAGEMENT REPORT OF FUND PERFORMANCE
March 31, 2017
116
RBC QUBE LOW VOLATILITY U.S. EQUITY CLASS
FINANCIAL HIGHLIGHTS (cont.)
Ratios and Supplemental Data
Number of Net Asset Value Net Asset Value Mutual Fund Shares Management MER Before Portfolio TradingAs at Per Mutual Fund Share ($) ($000s) Outstanding (000s) Expense Ratio (%)1 Absorption (%)1 Turnover Rate (%)2 Expense Ratio (%)3
Series AMar. 31, 2017 12.29 9 980 812 1.904 1.91 23.85 0.02Mar. 31, 2016 10.84 5 559 513 2.06 2.11 42.68 0.02Mar. 31, 20155 9.93 1 534 154 2.10 2.10 6.95 0.02
Advisor SeriesMar. 31, 2017 12.30 2 741 223 1.894 1.90 23.85 0.02Mar. 31, 2016 10.84 774 71 2.03 2.08 42.68 0.02Mar. 31, 20155 9.94 1 – 2.10 2.10 6.95 0.02
Series DMar. 31, 2017 12.52 2 772 221 1.094 1.10 23.85 0.02Mar. 31, 2016 10.94 2 796 256 1.22 1.27 42.68 0.02Mar. 31, 20155 9.95 499 50 1.24 1.24 6.95 0.02
Series FMar. 31, 2017 12.59 14 610 1 160 0.794 0.80 23.85 0.02Mar. 31, 2016 10.98 2 692 245 0.93 0.98 42.68 0.02Mar. 31, 20155 9.95 187 19 0.97 0.97 6.95 0.02
Series OMar. 31, 2017 12.82 4 599 359 0.05 0.06 23.85 0.02Mar. 31, 2016 11.10 208 19 0.05 0.10 42.68 0.02Mar. 31, 20155 9.97 285 29 0.05 0.05 6.95 0.02
1 The management expense ratio (“MER”) is based on expenses for the stated period, excluding commissions and other portfolio transaction costs, and is expressed as an annualized percentage of the daily average net asset value during the period. RBC GAM may, at its discretion and without notice to shareholders, waive or absorb certain operating expenses. MER includes the waiver or absorption by RBC GAM of certain operating expenses, while the MER before absorption shows the MER prior to operating expenses being waived or absorbed by RBC GAM.
2 The Fund’s portfolio turnover rate gives an indication of the level of activity employed by the portfolio manager. A portfolio turnover rate of 100% is equivalent to the Fund buying and selling all of the securities in its portfolio once in the course of the year. The higher the Fund’s portfolio turnover rate in a year, the greater the trading costs payable by the Fund in the year, and the greater the chance of an investor receiving taxable capital gains in the year. There is not necessarily a relationship between a high turnover rate and the performance of the Fund.
3 The trading expense ratio represents total commissions and other portfolio transaction costs expressed as an annualized percentage of daily average net asset value during the period. The trading expense ratio is not applicable to fixed-income transactions.
4 Effective June 30, 2016, the management fee was changed in respect of certain series of the Fund. If the change to the management fee would have been in effect throughout 2016, the adjusted MER for each series of the Fund would be: Series A – 1.87%, Advisor Series – 1.87%, Series D – 1.05% and Series F – 0.77%.
5 From October 16, 2014.
Management Fees RBC GAM is the manager and portfolio manager of the Fund. Management fees of each series of the Fund are calculated at the annual percentages, before GST/HST, of the daily net asset value of each series of the Fund. The breakdown of the services received in consideration of the management fees for each series, as a percentage of the management fees, is as follows:
Breakdown of Services
Management Fees Distribution Other*
Series A 1.60% 57% 43%Advisor Series 1.60% 57% 43%Series D 0.85% 25% 75%Series F 0.60% – 100%
Series O – no management fees are paid by the Fund with respect to Series O mutual fund shares. Series O shareholders pay a negotiated fee directly to RBC GAM for investment-counselling services.* Includes all costs related to management, investment advisory services, general administration
and profit.
116
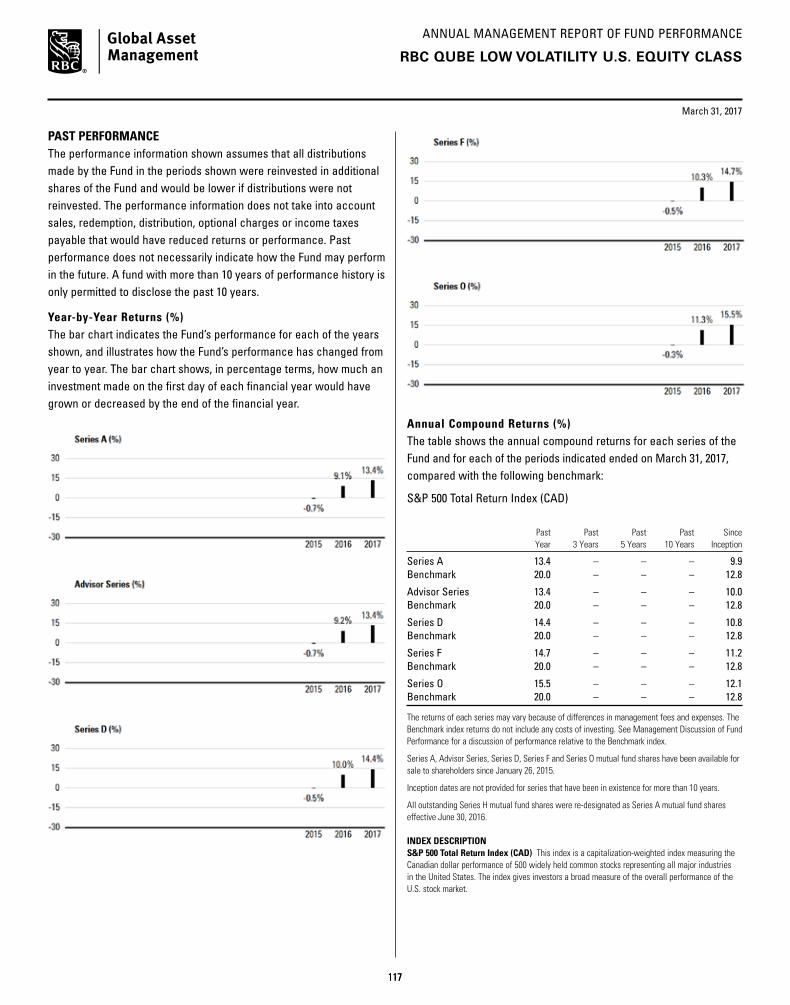
ANNUAL MANAGEMENT REPORT OF FUND PERFORMANCE
117
March 31, 2017
Annual Compound Returns (%) The table shows the annual compound returns for each series of the Fund and for each of the periods indicated ended on March 31, 2017, compared with the following benchmark:
S&P 500 Total Return Index (CAD)
Past Past Past Past Since Year 3 Years 5 Years 10 Years Inception
Series A 13.4 – – – 9.9Benchmark 20.0 – – – 12.8
Advisor Series 13.4 – – – 10.0Benchmark 20.0 – – – 12.8
Series D 14.4 – – – 10.8Benchmark 20.0 – – – 12.8
Series F 14.7 – – – 11.2Benchmark 20.0 – – – 12.8
Series O 15.5 – – – 12.1Benchmark 20.0 – – – 12.8
The returns of each series may vary because of differences in management fees and expenses. The Benchmark index returns do not include any costs of investing. See Management Discussion of Fund Performance for a discussion of performance relative to the Benchmark index.
Series A, Advisor Series, Series D, Series F and Series O mutual fund shares have been available for sale to shareholders since January 26, 2015.
Inception dates are not provided for series that have been in existence for more than 10 years.
All outstanding Series H mutual fund shares were re-designated as Series A mutual fund shares effective June 30, 2016.
INDEX DESCRIPTIONS&P 500 Total Return Index (CAD) This index is a capitalization-weighted index measuring the Canadian dollar performance of 500 widely held common stocks representing all major industries in the United States. The index gives investors a broad measure of the overall performance of the U.S. stock market.
PAST PERFORMANCEThe performance information shown assumes that all distributions made by the Fund in the periods shown were reinvested in additional shares of the Fund and would be lower if distributions were not reinvested. The performance information does not take into account sales, redemption, distribution, optional charges or income taxes payable that would have reduced returns or performance. Past performance does not necessarily indicate how the Fund may perform in the future. A fund with more than 10 years of performance history is only permitted to disclose the past 10 years.
Year-by-Year Returns (%) The bar chart indicates the Fund’s performance for each of the years shown, and illustrates how the Fund’s performance has changed from year to year. The bar chart shows, in percentage terms, how much an investment made on the first day of each financial year would have grown or decreased by the end of the financial year.
RBC QUBE LOW VOLATILITY U.S. EQUITY CLASS
117

ANNUAL MANAGEMENT REPORT OF FUND PERFORMANCE
118
March 31, 2017
RBC QUBE LOW VOLATILITY U.S. EQUITY CLASS
SUMMARY OF INVESTMENT PORTFOLIO(after consideration of derivative products, if any)As at March 31, 2017
Investment Mix % of Net Asset Value
Information Technology 20.2Utilities 18.0Consumer Staples 13.9Financials 13.7Industrials 10.4Consumer Discretionary 7.3Health Care 7.3Real Estate 3.8Telecommunication Services 3.1Energy 1.8Materials 0.3Cash/Other 0.2
Top 25 Holdings* % of Net Asset Value
Xcel Energy Inc. 3.0PepsiCo Inc. 3.0Republic Services Inc. 3.0Johnson & Johnson 3.0The Coca-Cola Co. 3.0Alphabet Inc., Class C 3.0U.S. Bancorp 2.9DTE Energy Company 2.8TJX Companies Inc. 2.7PNC Bank Corp. 2.6Consolidated Edison Inc. 2.63M Co. 2.6American Electric Power 2.5Berkshire Hathaway Inc., Class B 2.4Home Depot Inc. 2.3Intel Corp. 2.3Honeywell International Inc. 2.1Atmos Energy Corp. 2.0Wells Fargo & Company 2.0Fiserv Inc. 1.9Philip Morris International Inc. 1.8American Financial Group Inc. 1.8Cisco Systems Inc. 1.8Exxon Mobil Corp. 1.7Public Service Enterprise Group 1.7Top 25 Holdings 60.5
* The Fund invests substantially all of its assets directly in the RBC QUBE Low Volatility U.S. Equity Fund. The above are the Top 25 holdings of the RBC QUBE Low Volatility U.S. Equity Fund.
The Summary of Investment Portfolio may change due to ongoing portfolio transactions of the Fund and a quarterly update is available at www.rbcgam.com/funds.
The Simplified Prospectus and other information about the underlying fund are available on SEDAR website at www.sedar.com.
118

ANNUAL MANAGEMENT REPORT OF FUND PERFORMANCE
119
U.S. EQUITY FUND
RBC U.S. EQUITY VALUE CLASS
March 31, 2017
Portfolio Manager RBC Global Asset Management Inc. (“RBC GAM”)
This annual management report of fund performance (“MRFP”) contains financial highlights but does not contain the complete annual financial statements of the Fund. You can get a copy of the financial statements at your request, and at no cost, by calling 1-800-463-FUND (3863), by writing to us at RBC Global Asset Management Inc., P.O. Box 7500, Station A, Toronto, Ontario M5W 1P9, or by visiting our website at www.rbcgam.com/reports or SEDAR at www.sedar.com. Security holders may also contact us using one of these methods to request a copy of the Fund’s proxy voting policies and procedures, proxy voting disclosure record, or quarterly portfolio disclosure.
The Board of Directors of RBC Corporate Class Inc. approved this annual management report of fund performance on May 11, 2017.
A Note on Forward-looking Statements
This report may contain forward-looking statements about the Fund, its future performance, strategies or prospects, and possible future Fund action. The words “may,” “could,” “should,” “would,” “suspect,” “outlook,” “believe,” “plan,” “anticipate,” “estimate,” “expect,” “intend,” “forecast,” “objective” and similar expressions are intended to identify forward-looking statements.
Forward-looking statements are not guarantees of future performance. Forward-looking statements involve inherent risks and uncertainties, both about the Fund and general economic factors, so it is possible that predictions, forecasts, projections and other forward-looking statements will not be achieved. We caution you not to place undue reliance on these statements as a number of important factors could cause actual events or results to differ materially from those expressed or implied in any forward-looking statement made in relation to the Fund. These factors include, but are not limited to, general economic, political and market factors in Canada, the United States and internationally, interest and foreign exchange rates, global equity and capital markets, business competition, technological changes, changes in laws and regulations, judicial or regulatory judgments, legal proceedings and catastrophic events.
The above list of important factors that may affect future results is not exhaustive. Before making any investment decisions, we encourage you to consider these and other factors carefully. All opinions contained in forward-looking statements are subject to change without notice and are provided in good faith but without legal responsibility.
119

ANNUAL MANAGEMENT REPORT OF FUND PERFORMANCE
March 31, 2017
120
MANAGEMENT DISCUSSION OF FUND PERFORMANCE
Investment Objective and StrategiesThe Fund seeks to provide long-term capital growth by investing primarily in equity securities of U.S. companies in order to provide broad exposure to economic growth through the U.S. stock market.
To achieve its investment objective, the Fund invests most of its assets in the RBC U.S. Equity Value Fund (the “underlying fund”). The underlying fund diversifies across industries and selects companies with strong management, focused business models and the potential for growth in earnings and cash flow.
RiskThere were no significant changes to the investment objective and strategies that affected the Fund’s overall level of risk during the reporting period. The risks of investing in the Fund and the suitability of the Fund for investors remain as discussed in the Simplified Prospectus.
Results of OperationsThe Fund’s net asset value rose to $725,000 as of March 31, 2017, from $688,000 as of March 31, 2016. The increase was due to investment returns.
Over the past year, the Fund’s Series A shares gained 15.9%, which underperformed the 20.0% rise in the benchmark. The Fund’s return is after the deduction of fees and expenses, while the benchmark and broad-based index returns do not include any costs of investing. See the Financial Highlights section for the management expense ratios and the Past Performance section for the returns of any other series, which may vary because of differences in management fees and expenses.
The S&P 500 performed well during the period. This strong performance was driven by a recovery in commodity prices, improvement in most global economies, and optimism that President Trump’s fiscal-spending policies and vow to cut taxes could improve consumer and corporate confidence. Earnings growth improved during the period as the negative effects of the strong U.S. dollar subsided, along with the improvement and stabilization of oil prices.
The start of 2017 was highlighted by strength in growth over value and a general reversal in sector performance, as the Information Technology and Consumer Discretionary sectors led the way and the Energy and Telecommunication Services sectors lagged the index.
The Fund’s underperformance was due primarily to portfolio positioning in the Industrials sector. Underweight exposure to Union Pacific was a negative, as the stock rose on anticipation of improving rail traffic. An overweight position in Rockwell Collins also hindered performance.
Portfolio positioning in the Health Care sector was a positive for the Fund’s performance, with overweight exposure to equipment and supplies companies combined with underweight exposure to biotechnology companies proving beneficial. The drug-pricing debate continued to dominate headlines, negatively impacting biotechnology.
Below-benchmark exposure to the Consumer Discretionary sector held back the Fund’s returns. A lack of exposure to Time Warner was a negative for the Fund’s performance as the stock benefited from the company’s agreement to be purchased by AT&T during the second half of 2016.
Recent DevelopmentsThe portfolio manager remains generally optimistic about prospects for U.S. stocks. The economic backdrop, both globally and in the U.S., has been improving as seen in the global manufacturing purchasing managers’ index at a 2 1/2-year high. If oil prices continue to rise and the yield curve to steepen, earnings estimates for the Energy and Financials sectors will likely be raised, and this dynamic should support the continued rotation from stocks exhibiting stable growth to those considered to represent cyclical value. Nevertheless, the portfolio manager is mindful that higher interest rates and a higher U.S. dollar could emerge as headwinds to the economy and corporate profits. In addition, the market must remain wary of possible protectionist moves by U.S. President Trump, as such measures could ultimately crimp the profitability of many of the market’s largest companies.
On December 15, 2016, the Canadian government enacted new tax rules that eliminate the ability of investors to switch among different classes of RBC Corporate Class Funds on a tax-deferred basis. The new rules do not apply to switches between different series of the same fund.
Effective December 1, 2016, Mr. Lloyd R. McGinnis retired and Ms. Élaine Cousineau was appointed as Chair of the Independent Review Committee (the “IRC”). Mr. Charles F. Macfarlane was appointed as Vice Chair of the IRC. Effective January 1, 2017, Ms. Suromitra Sanatani and Ms. Catherine Kloepfer were appointed as members of the IRC.
Effective July 1, 2016, Deloitte LLP resigned and PricewaterhouseCoopers LLP was appointed as auditors of the Fund.
Effective June 30, 2016, management fees were reduced as follows: from 1.75% to 1.60% in respect of Series A mutual fund shares and Advisor Series mutual fund shares; from 1.00% to 0.85% in respect of Series D mutual fund shares; and from 0.75% to 0.60% in respect of Series F mutual fund shares. Also effective June 30, 2016, Series H mutual fund shares and Series I mutual fund shares were closed to all investors.
RBC U.S. EQUITY VALUE CLASS
120

ANNUAL MANAGEMENT REPORT OF FUND PERFORMANCE
121
March 31, 2017
RBC U.S. EQUITY VALUE CLASS
Related-Party TransactionsManager and Portfolio ManagerRBC GAM is an indirect, wholly owned subsidiary of Royal Bank of Canada (“Royal Bank”) and is the manager and portfolio manager of the Fund. RBC GAM is responsible for the Fund’s day-to-day operations, provides investment advice and portfolio management services to the Fund and appoints distributors for the Fund. RBC GAM is paid a management fee by the Fund as compensation for its services. The Fund pays a fixed administration fee to RBC GAM, which, in turn, pays certain operating expenses of the Fund.
Affiliates of RBC GAM that provide services to the Fund in the course of their normal businesses are discussed below.
DistributorsRBC GAM, Royal Mutual Funds Inc., RBC Direct Investing Inc., RBC Dominion Securities Inc. and Phillips, Hager & North Investment Funds Ltd. are the principal distributors of, or distribute certain series of the mutual fund shares of, the Fund. Dealers receive an ongoing commission based on the total value of their clients’ Series A, Advisor Series and Series D mutual fund shares.
CustodianRBC Investor Services Trust (“RBC IS”) is the custodian and holds the assets of the Fund.
RegistrarsRoyal Bank, RBC IS and RBC GAM are the registrars of the Fund and keep records of who owns the mutual fund shares of the Fund.
Other Related-Party TransactionsPursuant to applicable securities legislation, the Fund relied on the standing instructions from the Independent Review Committee with respect to one or more of the following transactions:
Related-Party Trading Activities(a) trades in securities of Royal Bank;
(b) investments in the securities of issuers for which a related-party dealer acted as an underwriter during the distribution of such securities and the 60-day period following the conclusion of such distribution of the underwritten securities to the public;
(c) purchases of equity and debt securities from or sales of equity or debt securities to a related-party dealer, where it acted as principal; and
Inter-Fund Trading(d) purchases or sales of securities of an issuer from or to another
investment fund or managed account managed by RBC GAM.
The applicable standing instructions require that Related-Party Trading Activities and Inter-Fund Trading be conducted in accordance with RBC GAM policy and that RBC GAM advise the Independent Review Committee of a material breach of any standing instruction. RBC GAM policy requires that an investment decision in respect of Related-Party Trading Activities (i) is made free from any influence of Royal Bank or its associates or affiliates and without taking into account any consideration relevant to Royal Bank or its affiliates or associates, (ii) represents the business judgment of the portfolio manager, uninfluenced by considerations other than the best interests of the Fund, (iii) is in compliance with RBC GAM policies and procedures, and (iv) achieves a fair and reasonable result for the Fund. RBC GAM policy requires that an investment decision in respect of Inter-Fund Trading is in the best interests of each Fund.
121
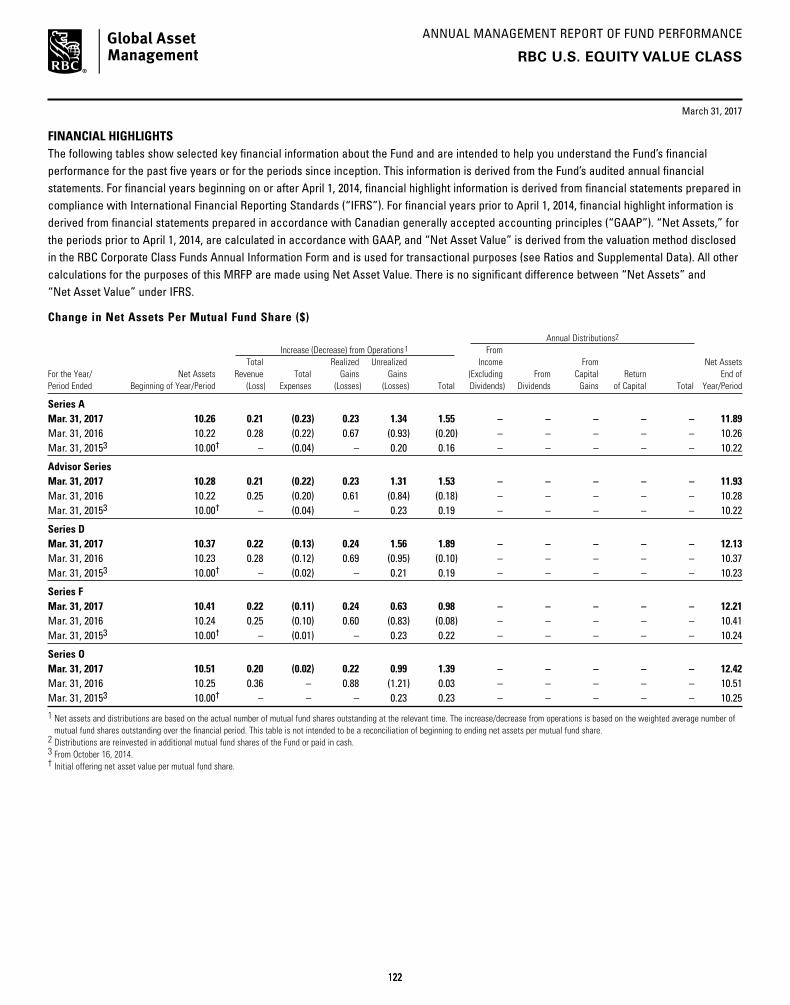
ANNUAL MANAGEMENT REPORT OF FUND PERFORMANCE
March 31, 2017
122
RBC U.S. EQUITY VALUE CLASS
FINANCIAL HIGHLIGHTS The following tables show selected key financial information about the Fund and are intended to help you understand the Fund’s financial performance for the past five years or for the periods since inception. This information is derived from the Fund’s audited annual financial statements. For financial years beginning on or after April 1, 2014, financial highlight information is derived from financial statements prepared in compliance with International Financial Reporting Standards (“IFRS”). For financial years prior to April 1, 2014, financial highlight information is derived from financial statements prepared in accordance with Canadian generally accepted accounting principles (“GAAP”). “Net Assets,” for the periods prior to April 1, 2014, are calculated in accordance with GAAP, and “Net Asset Value” is derived from the valuation method disclosed in the RBC Corporate Class Funds Annual Information Form and is used for transactional purposes (see Ratios and Supplemental Data). All other calculations for the purposes of this MRFP are made using Net Asset Value. There is no significant difference between “Net Assets” and “Net Asset Value” under IFRS.
Change in Net Assets Per Mutual Fund Share ($)
Annual Distributions2
Increase (Decrease) from Operations1 From Total Realized Unrealized Income From Net Assets For the Year/ Net Assets Revenue Total Gains Gains (Excluding From Capital Return End of Period Ended Beginning of Year/Period (Loss) Expenses (Losses) (Losses) Total Dividends) Dividends Gains of Capital Total Year/Period
Series AMar. 31, 2017 10.26 0.21 (0.23) 0.23 1.34 1.55 – – – – – 11.89 Mar. 31, 2016 10.22 0.28 (0.22) 0.67 (0.93) (0.20) – – – – – 10.26Mar. 31, 20153 10.00† – (0.04) – 0.20 0.16 – – – – – 10.22
Advisor SeriesMar. 31, 2017 10.28 0.21 (0.22) 0.23 1.31 1.53 – – – – – 11.93Mar. 31, 2016 10.22 0.25 (0.20) 0.61 (0.84) (0.18) – – – – – 10.28Mar. 31, 20153 10.00† – (0.04) – 0.23 0.19 – – – – – 10.22
Series DMar. 31, 2017 10.37 0.22 (0.13) 0.24 1.56 1.89 – – – – – 12.13Mar. 31, 2016 10.23 0.28 (0.12) 0.69 (0.95) (0.10) – – – – – 10.37Mar. 31, 20153 10.00† – (0.02) – 0.21 0.19 – – – – – 10.23
Series FMar. 31, 2017 10.41 0.22 (0.11) 0.24 0.63 0.98 – – – – – 12.21Mar. 31, 2016 10.24 0.25 (0.10) 0.60 (0.83) (0.08) – – – – – 10.41Mar. 31, 20153 10.00† – (0.01) – 0.23 0.22 – – – – – 10.24
Series OMar. 31, 2017 10.51 0.20 (0.02) 0.22 0.99 1.39 – – – – – 12.42Mar. 31, 2016 10.25 0.36 – 0.88 (1.21) 0.03 – – – – – 10.51Mar. 31, 20153 10.00† – – – 0.23 0.23 – – – – – 10.25
1 Net assets and distributions are based on the actual number of mutual fund shares outstanding at the relevant time. The increase/decrease from operations is based on the weighted average number of mutual fund shares outstanding over the financial period. This table is not intended to be a reconciliation of beginning to ending net assets per mutual fund share.
2 Distributions are reinvested in additional mutual fund shares of the Fund or paid in cash.3 From October 16, 2014.† Initial offering net asset value per mutual fund share.
122

ANNUAL MANAGEMENT REPORT OF FUND PERFORMANCE
March 31, 2017
123
RBC U.S. EQUITY VALUE CLASS
FINANCIAL HIGHLIGHTS (cont.)
Ratios and Supplemental Data
Number of Net Asset Value Net Asset Value Mutual Fund Shares Management MER Before Portfolio TradingAs at Per Mutual Fund Share ($) ($000s) Outstanding (000s) Expense Ratio (%)1 Absorption (%)1 Turnover Rate (%)2 Expense Ratio (%)3
Series AMar. 31, 2017 11.89 292 25 1.964 2.27 64.60 0.07Mar. 31, 2016 10.26 231 22 2.10 2.92 16.21 0.12Mar. 31, 20155 10.22 39 4 2.10 2.10 – 0.14
Advisor SeriesMar. 31, 2017 11.93 34 3 1.874 2.18 64.60 0.07Mar. 31, 2016 10.28 45 4 1.95 2.77 16.21 0.12Mar. 31, 20155 10.22 1 – 2.10 2.10 – 0.14
Series DMar. 31, 2017 12.13 394 33 1.074 1.38 64.60 0.07Mar. 31, 2016 10.37 242 23 1.21 2.03 16.21 0.12Mar. 31, 20155 10.23 37 4 1.23 1.23 – 0.14
Series FMar. 31, 2017 12.21 3 – 0.824 1.13 64.60 0.07Mar. 31, 2016 10.41 17 2 0.93 1.75 16.21 0.12Mar. 31, 20155 10.24 1 – 0.97 0.97 – 0.14
Series OMar. 31, 2017 12.42 1 – 0.06 0.37 64.60 0.07Mar. 31, 2016 10.51 151 14 0.05 0.87 16.21 0.12Mar. 31, 20155 10.25 148 14 0.05 0.05 – 0.14
1 The management expense ratio (“MER”) is based on expenses for the stated period, excluding commissions and other portfolio transaction costs, and is expressed as an annualized percentage of the daily average net asset value during the period. RBC GAM may, at its discretion and without notice to shareholders, waive or absorb certain operating expenses. MER includes the waiver or absorption by RBC GAM of certain operating expenses, while the MER before absorption shows the MER prior to operating expenses being waived or absorbed by RBC GAM.
2 The Fund’s portfolio turnover rate gives an indication of the level of activity employed by the portfolio manager. A portfolio turnover rate of 100% is equivalent to the Fund buying and selling all of the securities in its portfolio once in the course of the year. The higher the Fund’s portfolio turnover rate in a year, the greater the trading costs payable by the Fund in the year, and the greater the chance of an investor receiving taxable capital gains in the year. There is not necessarily a relationship between a high turnover rate and the performance of the Fund.
3 The trading expense ratio represents total commissions and other portfolio transaction costs expressed as an annualized percentage of daily average net asset value during the period. The trading expense ratio is not applicable to fixed-income transactions.
4 Effective June 30, 2016, the management fee was changed in respect of certain series of the Fund. If the change to the management fee would have been in effect throughout 2016, the adjusted MER for each series of the Fund would be: Series A – 1.92%, Advisor Series – 1.83%, Series D – 1.04% and Series F – 0.79%.
5 From October 16, 2014.
Management FeesRBC GAM is the manager and portfolio manager of the Fund. Management fees of each series of the Fund are calculated at the annual percentages, before GST/HST, of the daily net asset value of each series of the Fund. The breakdown of the services received in consideration of the management fees for each series, as a percentage of the management fees, is as follows:
Breakdown of Services
Management Fees Distribution Other*
Series A 1.60% 57% 43%Advisor Series 1.60% 57% 43%Series D 0.85% 25% 75%Series F 0.60% – 100%
Series O – no management fees are paid by the Fund with respect to Series O mutual fund shares. Series O shareholders pay a negotiated fee directly to RBC GAM for investment-counselling services.* Includes all costs related to management, investment advisory services, general administration
and profit.
123
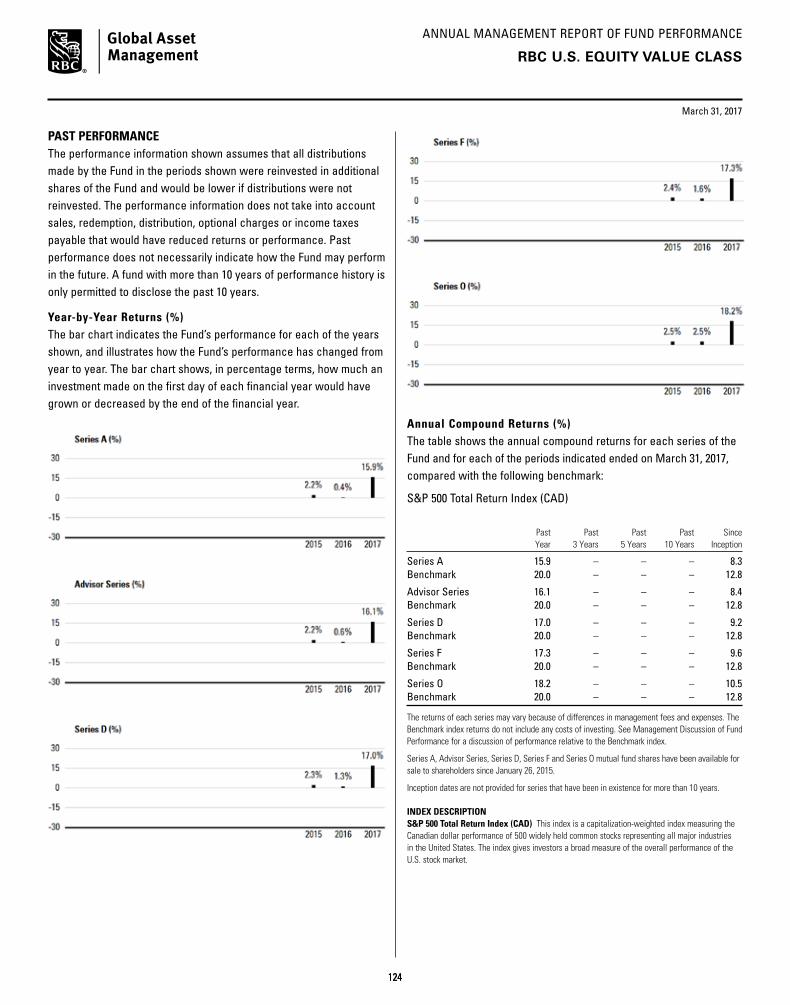
ANNUAL MANAGEMENT REPORT OF FUND PERFORMANCE
124
March 31, 2017
RBC U.S. EQUITY VALUE CLASS
Annual Compound Returns (%) The table shows the annual compound returns for each series of the Fund and for each of the periods indicated ended on March 31, 2017, compared with the following benchmark:
S&P 500 Total Return Index (CAD)
Past Past Past Past Since Year 3 Years 5 Years 10 Years Inception
Series A 15.9 – – – 8.3Benchmark 20.0 – – – 12.8
Advisor Series 16.1 – – – 8.4Benchmark 20.0 – – – 12.8
Series D 17.0 – – – 9.2Benchmark 20.0 – – – 12.8
Series F 17.3 – – – 9.6Benchmark 20.0 – – – 12.8
Series O 18.2 – – – 10.5Benchmark 20.0 – – – 12.8
The returns of each series may vary because of differences in management fees and expenses. The Benchmark index returns do not include any costs of investing. See Management Discussion of Fund Performance for a discussion of performance relative to the Benchmark index.
Series A, Advisor Series, Series D, Series F and Series O mutual fund shares have been available for sale to shareholders since January 26, 2015.
Inception dates are not provided for series that have been in existence for more than 10 years.
INDEX DESCRIPTIONS&P 500 Total Return Index (CAD) This index is a capitalization-weighted index measuring the Canadian dollar performance of 500 widely held common stocks representing all major industries in the United States. The index gives investors a broad measure of the overall performance of the U.S. stock market.
PAST PERFORMANCEThe performance information shown assumes that all distributions made by the Fund in the periods shown were reinvested in additional shares of the Fund and would be lower if distributions were not reinvested. The performance information does not take into account sales, redemption, distribution, optional charges or income taxes payable that would have reduced returns or performance. Past performance does not necessarily indicate how the Fund may perform in the future. A fund with more than 10 years of performance history is only permitted to disclose the past 10 years.
Year-by-Year Returns (%) The bar chart indicates the Fund’s performance for each of the years shown, and illustrates how the Fund’s performance has changed from year to year. The bar chart shows, in percentage terms, how much an investment made on the first day of each financial year would have grown or decreased by the end of the financial year.
124

ANNUAL MANAGEMENT REPORT OF FUND PERFORMANCE
125
March 31, 2017
RBC U.S. EQUITY VALUE CLASS
SUMMARY OF INVESTMENT PORTFOLIO(after consideration of derivative products, if any)As at March 31, 2017
Investment Mix % of Net Asset Value
Information Technology 20.5Financials 14.0Health Care 12.8Industrials 11.4Consumer Discretionary 10.5Consumer Staples 7.9Energy 5.8Real Estate 2.2Materials 2.1Telecommunication Services 2.1Utilities 2.1Cash/Other 8.6
Top 25 Holdings* % of Net Asset Value
Cash & Cash Equivalents 7.9Apple Inc. 3.7Microsoft Corp. 3.0Alphabet Inc., Class A 2.9JPMorgan Chase & Co. 2.1Berkshire Hathaway Inc., Class B 2.0Bank of America Corp. 1.7Pfizer Inc. 1.7Chevron Corp. 1.6Johnson & Johnson 1.5Exxon Mobil Corp. 1.5Facebook Inc., Class A 1.5UnitedHealth Group Incorporated 1.5Comcast Corp., Class A 1.3Cisco Systems Inc. 1.2General Electric Company 1.2Citigroup Inc. 1.2Home Depot Inc. 1.2PepsiCo Inc. 1.1AT&T Inc. 1.1Medtronic Plc. 1.1Eli Lilly & Co. 1.1The Procter & Gamble Co. 1.1iShares Nasdaq Biotechnology Index Fund 1.0Aetna Inc. 0.9Top 25 Holdings 46.1
* The Fund invests substantially all of its assets directly in the RBC U.S. Equity Value Fund. The above are the Top 25 holdings of the RBC U.S. Equity Value Fund.
The Summary of Investment Portfolio may change due to ongoing portfolio transactions of the Fund and a quarterly update is available at www.rbcgam.com/funds.
The Simplified Prospectus and other information about the underlying fund are available on SEDAR website at www.sedar.com.
125

ANNUAL MANAGEMENT REPORT OF FUND PERFORMANCE
126
U.S. EQUITY FUND
PHILLIPS, HAGER & NORTH U.S. MULTI-STYLE ALL-CAP EQUITY CLASS
March 31, 2017
Portfolio Manager RBC Global Asset Management Inc. (“RBC GAM”)
This annual management report of fund performance (“MRFP”) contains financial highlights but does not contain the complete annual financial statements of the Fund. You can get a copy of the financial statements at your request, and at no cost, by calling 1-800-463-FUND (3863), by writing to us at RBC Global Asset Management Inc., P.O. Box 7500, Station A, Toronto, Ontario M5W 1P9, or by visiting our website at www.rbcgam.com/reports or SEDAR at www.sedar.com. Security holders may also contact us using one of these methods to request a copy of the Fund’s proxy voting policies and procedures, proxy voting disclosure record, or quarterly portfolio disclosure.
The Board of Directors of RBC Corporate Class Inc. approved this annual management report of fund performance on May 11, 2017.
A Note on Forward-looking Statements
This report may contain forward-looking statements about the Fund, its future performance, strategies or prospects, and possible future Fund action. The words “may,” “could,” “should,” “would,” “suspect,” “outlook,” “believe,” “plan,” “anticipate,” “estimate,” “expect,” “intend,” “forecast,” “objective” and similar expressions are intended to identify forward-looking statements.
Forward-looking statements are not guarantees of future performance. Forward-looking statements involve inherent risks and uncertainties, both about the Fund and general economic factors, so it is possible that predictions, forecasts, projections and other forward-looking statements will not be achieved. We caution you not to place undue reliance on these statements as a number of important factors could cause actual events or results to differ materially from those expressed or implied in any forward-looking statement made in relation to the Fund. These factors include, but are not limited to, general economic, political and market factors in Canada, the United States and internationally, interest and foreign exchange rates, global equity and capital markets, business competition, technological changes, changes in laws and regulations, judicial or regulatory judgments, legal proceedings and catastrophic events.
The above list of important factors that may affect future results is not exhaustive. Before making any investment decisions, we encourage you to consider these and other factors carefully. All opinions contained in forward-looking statements are subject to change without notice and are provided in good faith but without legal responsibility.
126

ANNUAL MANAGEMENT REPORT OF FUND PERFORMANCE
March 31, 2017
127
MANAGEMENT DISCUSSION OF FUND PERFORMANCE
Investment Objective and StrategiesThe Fund seeks to provide long-term capital growth by investing primarily in a well-diversified portfolio of U.S. equity securities.
To achieve its investment objective, the Fund invests most of its assets in the Phillips, Hager & North U.S. Multi-Style All-Cap Equity Fund (the “underlying fund”). The underlying fund invests in U.S. equity securities with the objective of building a portfolio that encompasses multiple investment styles. The underlying fund’s portfolio will be comprised of the following investment styles, which are managed by RBC GAM’s sub-advisors as separate portfolios within the underlying fund: U.S. Large Cap Growth, U.S. Mid Cap Growth, U.S. Large Cap Value, U.S. Mid Cap Value and U.S. Small Cap Core.
RiskThere were no significant changes to the investment objective and strategies that affected the Fund’s overall level of risk during the reporting period. The risks of investing in the Fund and the suitability of the Fund for investors remain as discussed in the Simplified Prospectus.
Results of OperationsThe Fund’s net asset value fell to $33 million as of March 31, 2017, from $38 million as of March 31, 2016. The decrease was due to net redemptions.
Over the past year, the Fund’s Series A shares gained 17.3%, which underperformed the 20.9% rise in the benchmark. The Fund’s return is after the deduction of fees and expenses, while the benchmark and broad-based index returns do not include any costs of investing. See the Financial Highlights section for the management expense ratios and the Past Performance section for the returns of any other series, which may vary because of differences in management fees and expenses.
U.S. equity markets generated above-average returns over the past 12 months, driven by a recovery in commodity prices, improvement in most global economies and a rebound in corporate earnings. Some of the performance was attributable to optimism that President Trump will succeed in gaining legislative support for his plan to boost government spending and cut taxes, both of which would likely support economic growth. In March, the U.S. Federal Reserve boosted its benchmark interest rate for the second time in three months, reflecting optimism about the expansion.
The Large Cap Value strategy underperformed its benchmark, the Russell Top 200 Value Index, due primarily to poor sector-allocation bets. An overweight position in the Utilities sector and an underweight position in the Financials sector weighed heavily on the portfolio’s performance. Overall stock selection was also a drag on performance. Adverse stock picks within the Consumer Discretionary and Health Care sectors detracted from returns. However, favourable stock selection within the Information Technology and Telecommunication Services sectors had a positive impact on the Fund’s performance.
The QUBE Large Cap Growth sleeve outperformed versus its Russell Large Cap Growth benchmark during the period. Both sector-allocation and security-selection decisions contributed positively to the Fund’s returns. An underweight position in the Consumer Discretionary sector had a negative impact on performance, while an underweight position in the Consumer Staples sector aided returns. From a security-selection standpoint, favourable stock picks within the Health Care and Information Technology sectors bolstered the Fund’s performance.
The QUBE Large Cap Value component underperformed versus its Russell Large Cap Value benchmark, driven largely by adverse sector-allocation bets. However, favourable stock selection, primarily within the Financials sector, aided returns. From a sector-allocation standpoint, a sizeable overweight position within the Consumer Discretionary sector detracted from performance, while a significant underweight position in the Energy sector benefited the portfolio.
Recent DevelopmentsRecent economic data suggests global economic growth is reaccelerating, albeit slowly and from a low level. Leading economic indicators are at their best levels in several years, economic surprises have been overwhelmingly positive and profits continue to recover. The portfolio manager expects profit improvements in the U.S. to continue to drive markets higher in 2017. While there are risks that some of Trump’s protectionist policies could have a negative impact on earnings, the portfolio manager believes that significant gains are also possible if large-scale corporate-tax cuts materialize and the economy accelerates.
On December 15, 2016, the Canadian government enacted new tax rules that eliminate the ability of investors to switch among different classes of RBC Corporate Class Funds on a tax-deferred basis. The new rules do not apply to switches between different series of the same fund.
Effective December 1, 2016, Mr. Lloyd R. McGinnis retired and Ms. Élaine Cousineau was appointed as Chair of the Independent Review Committee (the “IRC”). Mr. Charles F. Macfarlane was appointed as Vice Chair of the IRC. Effective January 1, 2017, Ms. Suromitra Sanatani and Ms. Catherine Kloepfer were appointed as members of the IRC.
PHILLIPS, HAGER & NORTH U.S. MULTI-STYLE ALL-CAP EQUITY CLASS
127

ANNUAL MANAGEMENT REPORT OF FUND PERFORMANCE
March 31, 2017
128
PHILLIPS, HAGER & NORTH U.S. MULTI-STYLE ALL-CAP EQUITY CLASS
Effective July 1, 2016, Deloitte LLP resigned and PricewaterhouseCoopers LLP was appointed as auditors of the Fund.
Effective June 30, 2016, management fees were reduced as follows: from 1.75% to 1.60% in respect of Series A mutual fund shares and Advisor Series mutual fund shares; from 1.00% to 0.85% in respect of Series D mutual fund shares; and from 0.75% to 0.60% in respect of Series F mutual fund shares. Also effective June 30, 2016, Series H mutual fund shares were re-designated to Series A mutual fund shares and Series I mutual fund shares were re-designated to Series F mutual fund shares.
Related-Party TransactionsManager and Portfolio ManagerRBC GAM is an indirect, wholly owned subsidiary of Royal Bank of Canada (“Royal Bank”) and is the manager and portfolio manager of the Fund. RBC GAM is responsible for the Fund’s day-to-day operations, provides investment advice and portfolio management services to the Fund and appoints distributors for the Fund. RBC GAM is paid a management fee by the Fund as compensation for its services. The Fund pays a fixed administration fee to RBC GAM, which, in turn, pays certain operating expenses of the Fund.
Affiliates of RBC GAM that provide services to the Fund in the course of their normal businesses are discussed below.
DistributorsRBC GAM, Royal Mutual Funds Inc., RBC Direct Investing Inc., RBC Dominion Securities Inc. and Phillips, Hager & North Investment Funds Ltd. are the principal distributors of, or distribute certain series of the mutual fund shares of, the Fund. Dealers receive an ongoing commission based on the total value of their clients’ Series A, Advisor Series and Series D mutual fund shares.
CustodianRBC Investor Services Trust (“RBC IS”) is the custodian and holds the assets of the Fund.
RegistrarsRoyal Bank, RBC IS and RBC GAM are the registrars of the Fund and keep records of who owns the mutual fund shares of the Fund.
Other Related-Party TransactionsPursuant to applicable securities legislation, the Fund relied on the standing instructions from the Independent Review Committee with respect to one or more of the following transactions:
Related-Party Trading Activities(a) trades in securities of Royal Bank;
(b) investments in the securities of issuers for which a related-party dealer acted as an underwriter during the distribution of such securities and the 60-day period following the conclusion of such distribution of the underwritten securities to the public;
(c) purchases of equity and debt securities from or sales of equity or debt securities to a related-party dealer, where it acted as principal; and
Inter-Fund Trading(d) purchases or sales of securities of an issuer from or to another
investment fund or managed account managed by RBC GAM.
The applicable standing instructions require that Related-Party Trading Activities and Inter-Fund Trading be conducted in accordance with RBC GAM policy and that RBC GAM advise the Independent Review Committee of a material breach of any standing instruction. RBC GAM policy requires that an investment decision in respect of Related-Party Trading Activities (i) is made free from any influence of Royal Bank or its associates or affiliates and without taking into account any consideration relevant to Royal Bank or its affiliates or associates, (ii) represents the business judgment of the portfolio manager, uninfluenced by considerations other than the best interests of the Fund, (iii) is in compliance with RBC GAM policies and procedures, and (iv) achieves a fair and reasonable result for the Fund. RBC GAM policy requires that an investment decision in respect of Inter-Fund Trading is in the best interests of each Fund.
128

ANNUAL MANAGEMENT REPORT OF FUND PERFORMANCE
March 31, 2017
129
FINANCIAL HIGHLIGHTS The following tables show selected key financial information about the Fund and are intended to help you understand the Fund’s financial performance for the past five years or for the periods since inception. This information is derived from the Fund’s audited annual financial statements. For financial years beginning on or after April 1, 2014, financial highlight information is derived from financial statements prepared in compliance with International Financial Reporting Standards (“IFRS”). For financial years prior to April 1, 2014, financial highlight information is derived from financial statements prepared in accordance with Canadian generally accepted accounting principles (“GAAP”). “Net Assets,” for the periods prior to April 1, 2014, are calculated in accordance with GAAP, and “Net Asset Value” is derived from the valuation method disclosed in the RBC Corporate Class Funds Annual Information Form and is used for transactional purposes (see Ratios and Supplemental Data). All other calculations for the purposes of this MRFP are made using Net Asset Value. There is no significant difference between “Net Assets” and “Net Asset Value” under IFRS.
Change in Net Assets Per Mutual Fund Share ($)
Annual Distributions2
Increase (Decrease) from Operations1 From Total Realized Unrealized Income From Net Assets For the Year/ Net Assets Revenue Total Gains Gains (Excluding From Capital Return End of Period Ended Beginning of Year/Period (Loss) Expenses (Losses) (Losses) Total Dividends) Dividends Gains of Capital Total Year/Period
Series AMar. 31, 2017 18.71 0.30 (0.37) 1.40 1.72 3.05 – – – – – 21.95 Mar. 31, 2016 18.85 0.28 (0.38) 2.16 (2.27) (0.21) – – – – – 18.71Mar. 31, 2015 15.00 0.20 (0.33) 2.28 1.84 3.99 – – – – – 18.85 Mar. 31, 2014 11.87 0.20 (0.27) 1.52 2.02 3.47 – – (0.28) – (0.28) 15.00Mar. 31, 2013 10.66 0.24 (0.22) 0.96 1.30 2.28 – – – – – 11.87
Advisor SeriesMar. 31, 2017 18.73 0.30 (0.37) 1.41 1.58 2.92 – – – – – 21.98Mar. 31, 2016 18.86 0.28 (0.37) 2.17 (2.27) (0.19) – – – – – 18.73Mar. 31, 2015 15.01 0.20 (0.32) 2.28 1.83 3.99 – – – – – 18.86 Mar. 31, 2014 11.87 0.20 (0.26) 1.52 2.02 3.48 – – (0.28) – (0.28) 15.01Mar. 31, 2013 10.66 0.38 (0.22) 1.53 2.06 3.75 – – – – – 11.87
Series DMar. 31, 2017 19.42 0.32 (0.21) 1.48 1.91 3.50 – – – – – 22.98Mar. 31, 2016 19.39 0.28 (0.22) 2.22 (2.34) (0.06) – – – – – 19.42Mar. 31, 2015 15.29 0.20 (0.19) 2.33 1.88 4.22 – – – – – 19.39 Mar. 31, 2014 11.99 0.21 (0.15) 1.55 2.05 3.66 – – (0.28) – (0.28) 15.29Mar. 31, 2013 10.68 0.21 (0.13) 0.85 1.15 2.08 – – – – – 11.99
Series FMar. 31, 2017 19.61 0.33 (0.17) 1.55 2.41 4.12 – – – – – 23.26Mar. 31, 2016 19.54 0.29 (0.18) 2.25 (2.36) – – – – – – 19.61Mar. 31, 2015 15.38 0.20 (0.15) 2.36 1.90 4.31 – – – – – 19.54 Mar. 31, 2014 12.04 0.20 (0.12) 1.53 2.03 3.64 – – (0.28) – (0.28) 15.38Mar. 31, 2013 10.69 0.23 (0.11) 0.93 1.25 2.30 – – – – – 12.04
Series OMar. 31, 2017 20.33 0.32 (0.01) 1.47 1.60 3.38 – – – – – 24.29Mar. 31, 2016 20.08 0.29 (0.01) 2.25 (2.37) 0.16 – – – – – 20.33Mar. 31, 2015 15.66 0.21 (0.01) 2.39 1.92 4.51 – – – – – 20.08 Mar. 31, 2014 12.16 0.20 (0.01) 1.54 2.04 3.77 – – (0.28) – (0.28) 15.66Mar. 31, 2013 10.71 0.33 (0.01) 1.34 1.80 3.46 – – – – – 12.16
1 Net assets and distributions are based on the actual number of mutual fund shares outstanding at the relevant time. The increase/decrease from operations is based on the weighted average number of mutual fund shares outstanding over the financial period. This table is not intended to be a reconciliation of beginning to ending net assets per mutual fund share.
2 Distributions are reinvested in additional mutual fund shares of the Fund or paid in cash.
PHILLIPS, HAGER & NORTH U.S. MULTI-STYLE ALL-CAP EQUITY CLASS
129

ANNUAL MANAGEMENT REPORT OF FUND PERFORMANCE
March 31, 2017
130
FINANCIAL HIGHLIGHTS (cont.)
Ratios and Supplemental Data
Number of Net Asset Value Net Asset Value Mutual Fund Shares Management MER Before Portfolio TradingAs at Per Mutual Fund Share ($) ($000s) Outstanding (000s) Expense Ratio (%)1 Absorption (%)1 Turnover Rate (%)2 Expense Ratio (%)3
Series AMar. 31, 2017 21.95 7 929 361 1.934 1.94 4.97 0.07Mar. 31, 2016 18.71 12 677 678 2.08 2.09 17.46 0.12Mar. 31, 2015 18.85 13 369 709 2.08 2.10 11.56 0.17 Mar. 31, 2014 15.00 8 886 592 2.11 2.12 7.64 0.18Mar. 31, 2013 11.87 4 480 377 2.05 2.10 12.23 0.25
Advisor SeriesMar. 31, 2017 21.98 183 8 1.924 1.93 4.97 0.07Mar. 31, 2016 18.73 269 14 2.04 2.05 17.46 0.12Mar. 31, 2015 18.86 359 19 2.04 2.06 11.56 0.17 Mar. 31, 2014 15.01 224 15 2.04 2.05 7.64 0.18Mar. 31, 2013 11.87 124 10 2.07 2.12 12.23 0.25
Series DMar. 31, 2017 22.98 15 794 687 1.064 1.07 4.97 0.07Mar. 31, 2016 19.42 15 701 809 1.19 1.20 17.46 0.12Mar. 31, 2015 19.39 14 619 754 1.18 1.20 11.56 0.17 Mar. 31, 2014 15.29 9 496 621 1.19 1.20 7.64 0.18Mar. 31, 2013 11.99 5 428 453 1.24 1.29 12.23 0.25
Series FMar. 31, 2017 23.26 6 594 284 0.834 0.84 4.97 0.07Mar. 31, 2016 19.61 2 613 133 0.98 0.99 17.46 0.12Mar. 31, 2015 19.54 2 700 138 0.97 0.99 11.56 0.17 Mar. 31, 2014 15.38 2 615 170 0.95 0.96 7.64 0.18Mar. 31, 2013 12.04 901 75 0.97 1.02 12.23 0.25
Series OMar. 31, 2017 24.29 2 518 104 0.09 0.10 4.97 0.07Mar. 31, 2016 20.33 5 840 287 0.09 0.10 17.46 0.12Mar. 31, 2015 20.08 1 233 61 0.09 0.11 11.56 0.17 Mar. 31, 2014 15.66 557 36 0.09 0.10 7.64 0.18Mar. 31, 2013 12.16 57 5 0.09 0.14 12.23 0.25
1 The management expense ratio (“MER”) is based on expenses for the stated period, excluding commissions and other portfolio transaction costs, and is expressed as an annualized percentage of the daily average net asset value during the period. RBC GAM may, at its discretion and without notice to shareholders, waive or absorb certain operating expenses. MER includes the waiver or absorption by RBC GAM of certain operating expenses, while the MER before absorption shows the MER prior to operating expenses being waived or absorbed by RBC GAM.
2 The Fund’s portfolio turnover rate gives an indication of the level of activity employed by the portfolio manager. A portfolio turnover rate of 100% is equivalent to the Fund buying and selling all of the securities in its portfolio once in the course of the year. The higher the Fund’s portfolio turnover rate in a year, the greater the trading costs payable by the Fund in the year, and the greater the chance of an investor receiving taxable capital gains in the year. There is not necessarily a relationship between a high turnover rate and the performance of the Fund.
3 The trading expense ratio represents total commissions and other portfolio transaction costs expressed as an annualized percentage of daily average net asset value during the period. The trading expense ratio is not applicable to fixed-income transactions.
4 Effective June 30, 2016, the management fee was changed in respect of certain series of the Fund. If the change to the management fee would have been in effect throughout 2016, the adjusted MER for each series of the Fund would be: Series A – 1.89%, Advisor Series – 1.89%, Series D – 1.03% and Series F – 0.81%.
PHILLIPS, HAGER & NORTH U.S. MULTI-STYLE ALL-CAP EQUITY CLASS
130

ANNUAL MANAGEMENT REPORT OF FUND PERFORMANCE
131
March 31, 2017
FINANCIAL HIGHLIGHTS (cont.)
Management Fees RBC GAM is the manager and portfolio manager of the Fund. Management fees of each series of the Fund are calculated at the annual percentages, before GST/HST, of the daily net asset value of each series of the Fund. The breakdown of the services received in consideration of the management fees for each series, as a percentage of the management fees, is as follows:
Breakdown of Services
Management Fees Distribution Other*
Series A 1.60% 57% 43% Advisor Series 1.60% 57% 43% Series D 0.85% 25% 75%Series F 0.60% – 100%
Series O – no management fees are paid by the Fund with respect to Series O mutual fund shares. Series O shareholders pay a negotiated fee directly to RBC GAM for investment-counselling services.* Includes all costs related to management, investment advisory services, general administration
and profit.
PAST PERFORMANCEThe performance information shown assumes that all distributions made by the Fund in the periods shown were reinvested in additional shares of the Fund and would be lower if distributions were not reinvested. The performance information does not take into account sales, redemption, distribution, optional charges or income taxes payable that would have reduced returns or performance. Past performance does not necessarily indicate how the Fund may perform in the future. A fund with more than 10 years of performance history is only permitted to disclose the past 10 years.
Year-by-Year Returns (%) The bar chart indicates the Fund’s performance for each of the years shown, and illustrates how the Fund’s performance has changed from year to year. The bar chart shows, in percentage terms, how much an investment made on the first day of each financial year would have grown or decreased by the end of the financial year.
PHILLIPS, HAGER & NORTH U.S. MULTI-STYLE ALL-CAP EQUITY CLASS
131

ANNUAL MANAGEMENT REPORT OF FUND PERFORMANCE
March 31, 2017
132
SUMMARY OF INVESTMENT PORTFOLIO(after consideration of derivative products, if any)As at March 31, 2017
Investment Mix % of Net Asset Value
Information Technology 22.7Financials 15.2Health Care 13.7Consumer Discretionary 12.3Industrials 10.5Consumer Staples 8.2Energy 5.2Utilities 4.0Materials 2.4Real Estate 2.4Telecommunication Services 2.3Cash/Other 1.1
Top 25 Holdings* % of Net Asset Value
Apple Inc. 2.7Microsoft Corp. 2.3Johnson & Johnson 1.9Amazon.com, Inc. 1.8Cisco Systems Inc. 1.3Bank of America Corp. 1.3Facebook Inc., Class A 1.3International Business Machines 1.2Wal-Mart Stores, Inc. 1.2Exxon Mobil Corp. 1.2JPMorgan Chase & Co. 1.2Citigroup Inc. 1.2Amgen Inc. 1.1Home Depot Inc. 1.1Cash & Cash Equivalents 1.0AT&T Inc. 1.0UnitedHealth Group Incorporated 0.9Verizon Communications Inc. 0.9Alphabet Inc., Class C 0.9Accenture Plc., Class A 0.8Applied Materials Inc. 0.8Boeing Co. 0.8Intel Corp. 0.8The Procter & Gamble Co. 0.7Comcast Corp., Class A 0.7Top 25 Holdings 30.1
* The Fund invests substantially all of its assets directly in the Phillips, Hager & North U.S. Multi-Style All-Cap Equity Fund. The above are the Top 25 holdings of the Phillips, Hager & North U.S. Multi-Style All-Cap Equity Fund.
The Summary of Investment Portfolio may change due to ongoing portfolio transactions of the Fund and a quarterly update is available at www.rbcgam.com/funds.
The Simplified Prospectus and other information about the underlying fund are available on SEDAR website at www.sedar.com.
PAST PERFORMANCE (cont.)Annual Compound Returns (%) The table shows the annual compound returns for each series of the Fund and for each of the periods indicated ended on March 31, 2017, compared with the following benchmark:
Russell 3000 Total Return Index (CAD)
Past Past Past Past Since Year 3 Years 5 Years 10 Years Inception
Series A 17.3 13.5 16.1 – 16.7Benchmark 20.9 16.7 19.9 – 21.1
Advisor Series 17.3 13.6 16.1 – 16.7Benchmark 20.9 16.7 19.9 – 21.1
Series D 18.3 14.5 17.1 – 17.7Benchmark 20.9 16.7 19.9 – 21.1
Series F 18.6 14.8 17.4 – 18.0Benchmark 20.9 16.7 19.9 – 21.1
Series O 19.5 15.7 18.3 – 18.9Benchmark 20.9 16.7 19.9 – 21.1
The returns of each series may vary because of differences in management fees and expenses. The Benchmark index returns do not include any costs of investing. See Management Discussion of Fund Performance for a discussion of performance relative to the Benchmark index.
Series A, Advisor Series, Series D, Series F and Series O mutual fund shares have been available for sale to shareholders since January 1, 2012.
Inception dates are not provided for series that have been in existence for more than 10 years.
All outstanding Series H mutual fund shares were re-designated as Series A mutual fund shares and all outstanding Series I mutual fund shares were re-designated as Series F mutual fund shares effective June 30, 2016.
INDEX DESCRIPTIONRussell 3000 Total Return Index (CAD) This index measures the Canadian dollar performance of the largest 3000 U.S. companies representing approximately 98% of the U.S. equity market. The index provides a broader barometer of the equity market than the S&P 500 Index.
PHILLIPS, HAGER & NORTH U.S. MULTI-STYLE ALL-CAP EQUITY CLASS
132

ANNUAL MANAGEMENT REPORT OF FUND PERFORMANCE
133
U.S. EQUITY FUND
RBC U.S. MID-CAP VALUE EQUITY CLASS
March 31, 2017
Portfolio Manager RBC Global Asset Management Inc. (“RBC GAM”)
This annual management report of fund performance (“MRFP”) contains financial highlights but does not contain the complete annual financial statements of the Fund. You can get a copy of the financial statements at your request, and at no cost, by calling 1-800-463-FUND (3863), by writing to us at RBC Global Asset Management Inc., P.O. Box 7500, Station A, Toronto, Ontario M5W 1P9, or by visiting our website at www.rbcgam.com/reports or SEDAR at www.sedar.com. Security holders may also contact us using one of these methods to request a copy of the Fund’s proxy voting policies and procedures, proxy voting disclosure record, or quarterly portfolio disclosure.
The Board of Directors of RBC Corporate Class Inc. approved this annual management report of fund performance on May 11, 2017.
A Note on Forward-looking Statements
This report may contain forward-looking statements about the Fund, its future performance, strategies or prospects, and possible future Fund action. The words “may,” “could,” “should,” “would,” “suspect,” “outlook,” “believe,” “plan,” “anticipate,” “estimate,” “expect,” “intend,” “forecast,” “objective” and similar expressions are intended to identify forward-looking statements.
Forward-looking statements are not guarantees of future performance. Forward-looking statements involve inherent risks and uncertainties, both about the Fund and general economic factors, so it is possible that predictions, forecasts, projections and other forward-looking statements will not be achieved. We caution you not to place undue reliance on these statements as a number of important factors could cause actual events or results to differ materially from those expressed or implied in any forward-looking statement made in relation to the Fund. These factors include, but are not limited to, general economic, political and market factors in Canada, the United States and internationally, interest and foreign exchange rates, global equity and capital markets, business competition, technological changes, changes in laws and regulations, judicial or regulatory judgments, legal proceedings and catastrophic events.
The above list of important factors that may affect future results is not exhaustive. Before making any investment decisions, we encourage you to consider these and other factors carefully. All opinions contained in forward-looking statements are subject to change without notice and are provided in good faith but without legal responsibility.
133

ANNUAL MANAGEMENT REPORT OF FUND PERFORMANCE
134
March 31, 2017
MANAGEMENT DISCUSSION OF FUND PERFORMANCE
Investment Objective and StrategiesThe Fund seeks to provide long-term capital growth by investing primarily in equity securities of U.S. mid-cap companies that are deemed to be undervalued in order to provide broad exposure to economic growth opportunities in the equity markets.
To achieve its investment objective, the Fund invests most of its assets in the RBC U.S. Mid-Cap Value Equity Fund (the “underlying fund”). The underlying fund’s investment process is based primarily on fundamental research, although the portfolio manager will also consider quantitative and technical factors. Stock selection decisions are ultimately based on an understanding of the company, its business and its outlook. The portfolio manager diversifies the underlying fund across industries in the U.S. market and selects companies based on strong management, focused business models and the potential for future growth in earnings and cash flow.
RiskThere were no significant changes to the investment objective and strategies that affected the Fund’s overall level of risk during the reporting period. The risks of investing in the Fund and the suitability of the Fund for investors remain as discussed in the Simplified Prospectus.
Results of OperationsThe Fund’s net asset value rose to $6 million as of March 31, 2017, from $4 million as of March 31, 2016. The increase was due to a mix of investment returns and net inflows.
Over the past year, the Fund’s Series A shares gained 18.0%, which underperformed the 22.7% rise in the benchmark. The Fund’s return is after the deduction of fees and expenses, while the benchmark and broad-based index returns do not include any costs of investing. See the Financial Highlights section for the management expense ratios and the Past Performance section for the returns of any other series, which may vary because of differences in management fees and expenses.
The Fund’s underperformance was due to the negative impact of stock selection and sector allocation. Relative returns were held back by stock selection in the Health Care and Financials sectors, offset somewhat by the positive impact of stock selection in the Consumer Discretionary sector. Overweight exposure to both the Consumer Discretionary and Health Care sectors had a significant negative impact on relative returns.
Individual stocks that held back returns included Endo International, a pharmaceuticals company that issued a disappointing earnings outlook, and AmTrust Financial, a property and casualty insurer. Stocks that had a positive impact on performance included ILG Inc., a seller of vacation timeshares and holiday packages, after the company acquired a business from Starwood Hotels & Resorts.
Recent DevelopmentsSmall-cap and value stocks, which generally benefit from the kind of pro-growth policies espoused by President Trump, have been underperforming. This shift to large-cap and growth stocks can be partially attributed to the realization that measures implementing deregulation, tax cuts and increased government spending may be harder to pass than had been expected, and may not come to fruition at all. However, stocks continue to rise, indicating that the economy continues to improve without such changes.
On December 15, 2016, the Canadian government enacted new tax rules that eliminate the ability of investors to switch among different classes of RBC Corporate Class Funds on a tax-deferred basis. The new rules do not apply to switches between different series of the same fund.
Effective December 1, 2016, Mr. Lloyd R. McGinnis retired and Ms. Élaine Cousineau was appointed as Chair of the Independent Review Committee (the “IRC”). Mr. Charles F. Macfarlane was appointed as Vice Chair of the IRC. Effective January 1, 2017, Ms. Suromitra Sanatani and Ms. Catherine Kloepfer were appointed as members of the IRC.
Effective July 1, 2016, Deloitte LLP resigned and PricewaterhouseCoopers LLP was appointed as auditors of the Fund.
Effective June 30, 2016, management fees were reduced as follows: from 1.85% to 1.75% in respect of Series A mutual fund shares and Advisor Series mutual fund shares; from 1.10% to 1.00% in respect of Series D mutual fund shares; and from 0.85% to 0.75% in respect of Series F mutual fund shares. Also effective June 30, 2016, Series H mutual fund shares and Series I mutual fund shares were closed to all investors.
Related-Party TransactionsManager and Portfolio ManagerRBC GAM is an indirect, wholly owned subsidiary of Royal Bank of Canada (“Royal Bank”) and is the manager and portfolio manager of the Fund. RBC GAM is responsible for the Fund’s day-to-day operations, provides investment advice and portfolio management services to the Fund and appoints distributors for the Fund. RBC GAM is paid a management fee by the Fund as compensation for its services. The Fund pays a fixed administration fee to RBC GAM, which, in turn, pays certain operating expenses of the Fund.
Affiliates of RBC GAM that provide services to the Fund in the course of their normal businesses are discussed below.
RBC U.S. MID-CAP VALUE EQUITY CLASS
134

ANNUAL MANAGEMENT REPORT OF FUND PERFORMANCE
135
March 31, 2017
RBC U.S. MID-CAP VALUE EQUITY CLASS
DistributorsRBC GAM, Royal Mutual Funds Inc., RBC Direct Investing Inc., RBC Dominion Securities Inc. and Phillips, Hager & North Investment Funds Ltd. are the principal distributors of, or distribute certain series of the mutual fund shares of, the Fund. Dealers receive an ongoing commission based on the total value of their clients’ Series A, Advisor Series and Series D mutual fund shares.
CustodianRBC Investor Services Trust (“RBC IS”) is the custodian and holds the assets of the Fund.
RegistrarsRoyal Bank, RBC IS and RBC GAM are the registrars of the Fund and keep records of who owns the mutual fund shares of the Fund.
Other Related-Party TransactionsPursuant to applicable securities legislation, the Fund relied on the standing instructions from the Independent Review Committee with respect to one or more of the following transactions:
Related-Party Trading Activities(a) trades in securities of Royal Bank;
(b) investments in the securities of issuers for which a related-party dealer acted as an underwriter during the distribution of such securities and the 60-day period following the conclusion of such distribution of the underwritten securities to the public;
(c) purchases of equity and debt securities from or sales of equity or debt securities to a related-party dealer, where it acted as principal; and
Inter-Fund Trading(d) purchases or sales of securities of an issuer from or to another
investment fund or managed account managed by RBC GAM.
The applicable standing instructions require that Related-Party Trading Activities and Inter-Fund Trading be conducted in accordance with RBC GAM policy and that RBC GAM advise the Independent Review Committee of a material breach of any standing instruction. RBC GAM policy requires that an investment decision in respect of Related-Party Trading Activities (i) is made free from any influence of Royal Bank or its associates or affiliates and without taking into account any consideration relevant to Royal Bank or its affiliates or associates, (ii) represents the business judgment of the portfolio manager, uninfluenced by considerations other than the best interests of the Fund, (iii) is in compliance with RBC GAM policies and procedures, and (iv) achieves a fair and reasonable result for the Fund. RBC GAM policy requires that an investment decision in respect of Inter-Fund Trading is in the best interests of each Fund.
135

ANNUAL MANAGEMENT REPORT OF FUND PERFORMANCE
March 31, 2017
136
RBC U.S. MID-CAP VALUE EQUITY CLASS
FINANCIAL HIGHLIGHTS The following tables show selected key financial information about the Fund and are intended to help you understand the Fund’s financial performance for the past five years or for the periods since inception. This information is derived from the Fund’s audited annual financial statements. For financial years beginning on or after April 1, 2014, financial highlight information is derived from financial statements prepared in compliance with International Financial Reporting Standards (“IFRS”). For financial years prior to April 1, 2014, financial highlight information is derived from financial statements prepared in accordance with Canadian generally accepted accounting principles (“GAAP”). “Net Assets,” for the periods prior to April 1, 2014, are calculated in accordance with GAAP, and “Net Asset Value” is derived from the valuation method disclosed in the RBC Corporate Class Funds Annual Information Form and is used for transactional purposes (see Ratios and Supplemental Data). All other calculations for the purposes of this MRFP are made using Net Asset Value. There is no significant difference between “Net Assets” and “Net Asset Value” under IFRS.
Change in Net Assets Per Mutual Fund Share ($)
Annual Distributions2
Increase (Decrease) from Operations1 From Total Realized Unrealized Income From Net Assets For the Year/ Net Assets Revenue Total Gains Gains (Excluding From Capital Return End of Period Ended Beginning of Year/Period (Loss) Expenses (Losses) (Losses) Total Dividends) Dividends Gains of Capital Total Year/Period
Series AMar. 31, 2017 9.78 0.08 (0.22) (0.02) 1.91 1.75 – – – – – 11.54 Mar. 31, 2016 10.61 0.13 (0.22) 0.95 (2.79) (1.93) – – – – – 9.78Mar. 31, 20153 10.00† – (0.04) – 0.54 0.50 – – – – – 10.61
Advisor SeriesMar. 31, 2017 9.79 0.08 (0.22) (0.02) 1.86 1.70 – – – – – 11.56Mar. 31, 2016 10.61 0.14 (0.21) 1.01 (2.95) (2.01) – – – – – 9.79Mar. 31, 20153 10.00† – (0.04) – 0.51 0.47 – – – – – 10.61
Series DMar. 31, 2017 9.88 0.08 (0.14) (0.02) 1.71 1.63 – – – – – 11.76Mar. 31, 2016 10.63 0.16 (0.14) 1.17 (3.43) (2.24) – – – – – 9.88Mar. 31, 20153 10.00† – (0.03) – 0.54 0.51 – – – – – 10.63
Series FMar. 31, 2017 9.91 0.08 (0.11) (0.02) 2.02 1.97 – – – – – 11.83Mar. 31, 2016 10.63 0.09 (0.10) 0.63 (1.84) (1.22) – – – – – 9.91Mar. 31, 20153 10.00† – (0.02) – 0.55 0.53 – – – – – 10.63
Series OMar. 31, 2017 10.03 0.09 – (0.02) 1.98 2.05 – – – – – 12.08Mar. 31, 2016 10.65 0.26 – 1.88 (5.54) (3.40) – – – – – 10.03Mar. 31, 20153 10.00† – – – 0.74 0.74 – – – – – 10.65
1 Net assets and distributions are based on the actual number of mutual fund shares outstanding at the relevant time. The increase/decrease from operations is based on the weighted average number of mutual fund shares outstanding over the financial period. This table is not intended to be a reconciliation of beginning to ending net assets per mutual fund share.
2 Distributions are reinvested in additional mutual fund shares of the Fund or paid in cash.3 From October 16, 2014.† Initial offering net asset value per mutual fund share.
136

ANNUAL MANAGEMENT REPORT OF FUND PERFORMANCE
March 31, 2017
137
RBC U.S. MID-CAP VALUE EQUITY CLASS
FINANCIAL HIGHLIGHTS (cont.)
Ratios and Supplemental Data
Number of Net Asset Value Net Asset Value Mutual Fund Shares Management MER Before Portfolio TradingAs at Per Mutual Fund Share ($) ($000s) Outstanding (000s) Expense Ratio (%)1 Absorption (%)1 Turnover Rate (%)2 Expense Ratio (%)3
Series AMar. 31, 2017 11.54 1 117 97 2.164 2.22 41.39 0.32Mar. 31, 2016 9.78 564 58 2.30 2.41 88.94 0.33Mar. 31, 20155 10.61 43 4 2.30 2.30 – 0.27
Advisor SeriesMar. 31, 2017 11.56 643 56 2.104 2.16 41.39 0.32Mar. 31, 2016 9.79 336 34 2.21 2.32 88.94 0.33Mar. 31, 20155 10.61 57 5 2.30 2.30 – 0.27
Series DMar. 31, 2017 11.76 340 29 1.324 1.38 41.39 0.32Mar. 31, 2016 9.88 129 13 1.42 1.53 88.94 0.33Mar. 31, 20155 10.63 66 6 1.45 1.45 – 0.27
Series FMar. 31, 2017 11.83 3 621 306 1.064 1.12 41.39 0.32Mar. 31, 2016 9.91 2 591 261 1.17 1.28 88.94 0.33Mar. 31, 20155 10.63 42 4 1.17 1.17 – 0.27
Series OMar. 31, 2017 12.08 1 – 0.14 0.20 41.39 0.32Mar. 31, 2016 10.03 1 – 0.14 0.25 88.94 0.33Mar. 31, 20155 10.65 153 14 0.14 0.14 – 0.27
1 The management expense ratio (“MER”) is based on expenses for the stated period, excluding commissions and other portfolio transaction costs, and is expressed as an annualized percentage of the daily average net asset value during the period. RBC GAM may, at its discretion and without notice to shareholders, waive or absorb certain operating expenses. MER includes the waiver or absorption by RBC GAM of certain operating expenses, while the MER before absorption shows the MER prior to operating expenses being waived or absorbed by RBC GAM.
2 The Fund’s portfolio turnover rate gives an indication of the level of activity employed by the portfolio manager. A portfolio turnover rate of 100% is equivalent to the Fund buying and selling all of the securities in its portfolio once in the course of the year. The higher the Fund’s portfolio turnover rate in a year, the greater the trading costs payable by the Fund in the year, and the greater the chance of an investor receiving taxable capital gains in the year. There is not necessarily a relationship between a high turnover rate and the performance of the Fund.
3 The trading expense ratio represents total commissions and other portfolio transaction costs expressed as an annualized percentage of daily average net asset value during the period. The trading expense ratio is not applicable to fixed-income transactions.
4 Effective June 30, 2016, the management fee was changed in respect of certain series of the Fund. If the change to the management fee would have been in effect throughout 2016, the adjusted MER for each series of the Fund would be: Series A – 2.15%, Advisor Series – 2.09%, Series D – 1.31% and Series F – 1.04%.
5 From October 16, 2014.
Management Fees RBC GAM is the manager and portfolio manager of the Fund. Management fees of each series of the Fund are calculated at the annual percentages, before GST/HST, of the daily net asset value of each series of the Fund. The breakdown of the services received in consideration of the management fees for each series, as a percentage of the management fees, is as follows:
Breakdown of Services
Management Fees Distribution Other*
Series A 1.75% 54% 46%Advisor Series 1.75% 54% 46%Series D 1.00% 23% 77%Series F 0.75% – 100%
Series O – no management fees are paid by the Fund with respect to Series O mutual fund shares. Series O shareholders pay a negotiated fee directly to RBC GAM for investment-counselling services.* Includes all costs related to management, investment advisory services, general administration
and profit.
137

ANNUAL MANAGEMENT REPORT OF FUND PERFORMANCE
138
March 31, 2017
RBC U.S. MID-CAP VALUE EQUITY CLASS
Annual Compound Returns (%) The table shows the annual compound returns for each series of the Fund and for each of the periods indicated ended on March 31, 2017, compared with the following benchmark:
Russell Midcap Value Index (CAD)
Past Past Past Past Since Year 3 Years 5 Years 10 Years Inception
Series A 18.0 – – – 6.8Benchmark 22.7 – – – 11.2
Advisor Series 18.1 – – – 6.9Benchmark 22.7 – – – 11.2
Series D 19.0 – – – 7.7Benchmark 22.7 – – – 11.2
Series F 19.4 – – – 8.0Benchmark 22.7 – – – 11.2
Series O 20.5 – – – 9.1Benchmark 22.7 – – – 11.2
The returns of each series may vary because of differences in management fees and expenses. The Benchmark index returns do not include any costs of investing. See Management Discussion of Fund Performance for a discussion of performance relative to the Benchmark index.
Series A, Advisor Series, Series D, Series F and Series O mutual fund shares have been available for sale to shareholders since January 26, 2015.
Inception dates are not provided for series that have been in existence for more than 10 years.
INDEX DESCRIPTIONRussell Midcap Value Index (CAD) This index measures the performance of the mid-cap value segment of the U.S. equity universe.
PAST PERFORMANCEThe performance information shown assumes that all distributions made by the Fund in the periods shown were reinvested in additional shares of the Fund and would be lower if distributions were not reinvested. The performance information does not take into account sales, redemption, distribution, optional charges or income taxes payable that would have reduced returns or performance. Past performance does not necessarily indicate how the Fund may perform in the future. A fund with more than 10 years of performance history is only permitted to disclose the past 10 years.
Year-by-Year Returns (%) The bar chart indicates the Fund’s performance for each of the years shown, and illustrates how the Fund’s performance has changed from year to year. The bar chart shows, in percentage terms, how much an investment made on the first day of each financial year would have grown or decreased by the end of the financial year.
138
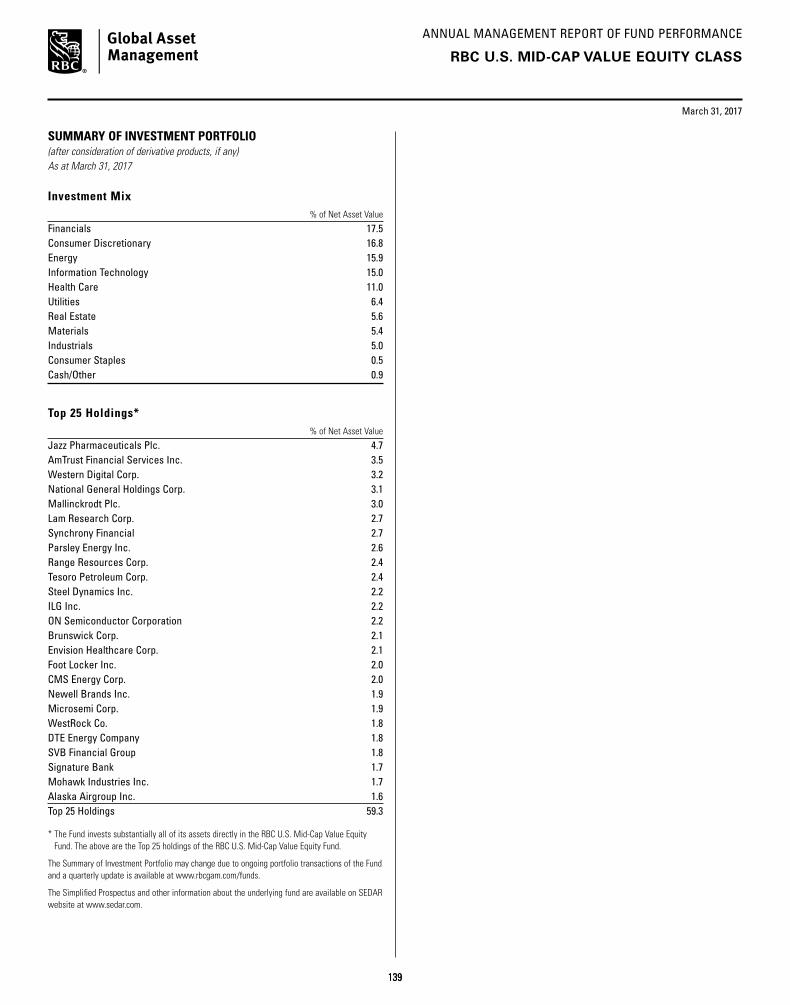
ANNUAL MANAGEMENT REPORT OF FUND PERFORMANCE
139
March 31, 2017
RBC U.S. MID-CAP VALUE EQUITY CLASS
SUMMARY OF INVESTMENT PORTFOLIO(after consideration of derivative products, if any)As at March 31, 2017
Investment Mix % of Net Asset Value
Financials 17.5Consumer Discretionary 16.8Energy 15.9Information Technology 15.0Health Care 11.0Utilities 6.4Real Estate 5.6Materials 5.4Industrials 5.0Consumer Staples 0.5Cash/Other 0.9
Top 25 Holdings* % of Net Asset Value
Jazz Pharmaceuticals Plc. 4.7AmTrust Financial Services Inc. 3.5Western Digital Corp. 3.2National General Holdings Corp. 3.1Mallinckrodt Plc. 3.0Lam Research Corp. 2.7Synchrony Financial 2.7Parsley Energy Inc. 2.6Range Resources Corp. 2.4Tesoro Petroleum Corp. 2.4Steel Dynamics Inc. 2.2ILG Inc. 2.2ON Semiconductor Corporation 2.2Brunswick Corp. 2.1Envision Healthcare Corp. 2.1Foot Locker Inc. 2.0CMS Energy Corp. 2.0Newell Brands Inc. 1.9Microsemi Corp. 1.9WestRock Co. 1.8DTE Energy Company 1.8SVB Financial Group 1.8Signature Bank 1.7Mohawk Industries Inc. 1.7Alaska Airgroup Inc. 1.6Top 25 Holdings 59.3
* The Fund invests substantially all of its assets directly in the RBC U.S. Mid-Cap Value Equity Fund. The above are the Top 25 holdings of the RBC U.S. Mid-Cap Value Equity Fund.
The Summary of Investment Portfolio may change due to ongoing portfolio transactions of the Fund and a quarterly update is available at www.rbcgam.com/funds.
The Simplified Prospectus and other information about the underlying fund are available on SEDAR website at www.sedar.com.
139

ANNUAL MANAGEMENT REPORT OF FUND PERFORMANCE
140
U.S. EQUITY FUND
RBC U.S. SMALL-CAP CORE EQUITY CLASS
March 31, 2017
Portfolio Manager RBC Global Asset Management Inc. (“RBC GAM”)
This annual management report of fund performance (“MRFP”) contains financial highlights but does not contain the complete annual financial statements of the Fund. You can get a copy of the financial statements at your request, and at no cost, by calling 1-800-463-FUND (3863), by writing to us at RBC Global Asset Management Inc., P.O. Box 7500, Station A, Toronto, Ontario M5W 1P9, or by visiting our website at www.rbcgam.com/reports or SEDAR at www.sedar.com. Security holders may also contact us using one of these methods to request a copy of the Fund’s proxy voting policies and procedures, proxy voting disclosure record, or quarterly portfolio disclosure.
The Board of Directors of RBC Corporate Class Inc. approved this annual management report of fund performance on May 11, 2017.
A Note on Forward-looking Statements
This report may contain forward-looking statements about the Fund, its future performance, strategies or prospects, and possible future Fund action. The words “may,” “could,” “should,” “would,” “suspect,” “outlook,” “believe,” “plan,” “anticipate,” “estimate,” “expect,” “intend,” “forecast,” “objective” and similar expressions are intended to identify forward-looking statements.
Forward-looking statements are not guarantees of future performance. Forward-looking statements involve inherent risks and uncertainties, both about the Fund and general economic factors, so it is possible that predictions, forecasts, projections and other forward-looking statements will not be achieved. We caution you not to place undue reliance on these statements as a number of important factors could cause actual events or results to differ materially from those expressed or implied in any forward-looking statement made in relation to the Fund. These factors include, but are not limited to, general economic, political and market factors in Canada, the United States and internationally, interest and foreign exchange rates, global equity and capital markets, business competition, technological changes, changes in laws and regulations, judicial or regulatory judgments, legal proceedings and catastrophic events.
The above list of important factors that may affect future results is not exhaustive. Before making any investment decisions, we encourage you to consider these and other factors carefully. All opinions contained in forward-looking statements are subject to change without notice and are provided in good faith but without legal responsibility.
140

ANNUAL MANAGEMENT REPORT OF FUND PERFORMANCE
141
March 31, 2017
MANAGEMENT DISCUSSION OF FUND PERFORMANCE
Investment Objective and StrategiesThe Fund seeks to provide long-term capital growth by investing primarily in equity securities of U.S. small-cap companies in order to provide broad exposure to economic growth opportunities in the equity markets.
To achieve its investment objective, the Fund invests most of its assets in the RBC U.S. Small-Cap Core Equity Fund (the “underlying fund”). The underlying fund’s investment process is based primarily on fundamental research, although the portfolio manager will also consider quantitative and technical factors. Stock selection decisions are ultimately based on an understanding of the company, its business and its outlook. The portfolio manager diversifies the underlying fund across industries in the U.S. market and selects companies based on strong management, focused business models and the potential for future growth in earnings and cash flow.
RiskThere were no significant changes to the investment objective and strategies that affected the Fund’s overall level of risk during the reporting period. The risks of investing in the Fund and the suitability of the Fund for investors remain as discussed in the Simplified Prospectus.
Results of OperationsThe Fund’s net asset value rose to $2 million as of March 31, 2017, from $788,000 as of March 31, 2016. The increase was due to a mix of net inflows and investment returns.
Over the past year, the Fund’s Series A shares gained 25.6%, which underperformed the 29.2% rise in the benchmark. The Fund’s return is after the deduction of fees and expenses, while the benchmark and broad-based index returns do not include any costs of investing. See the Financial Highlights section for the management expense ratios and the Past Performance section for the returns of any other series, which may vary because of differences in management fees and expenses.
The Fund underperformed its benchmark during the period due to sector-allocation decisions, while stock selection was positive overall. Stock selection had a negative impact on returns in the Information Technology and Financials sectors but was offset by favourable stock selection in the Industrials sector.
Individual stocks that had a negative impact on returns included San Jose, California-based Synaptics, which makes computer-interface products, and AmTrust Financial Services, a property and casualty insurer based in New York. A significant overweight position in the Consumer Discretionary sector and underweight exposure to Information Technology held back returns.
Stocks in the Industrials sector that had a positive impact on the Fund’s performance included Patrick Industries, a manufacturer of components for recreational vehicles and manufactured housing, and Columbus McKinnon, which makes hoisting devices and other components used to move things. The stock rallied after Trump’s election boosted the potential for infrastructure investment.
Recent DevelopmentsInvestors have recently been moving investments away from small-cap and value stocks, which generally benefit from the pro-growth economic policies espoused by President Trump. This shift to large-cap and growth stocks can be partially attributed to the realization that measures implementing deregulation, tax cuts and increased government spending may be harder to pass than had been expected, and may not come to fruition at all. However, stocks continue to rise, indicating that the economy continues to improve without such changes.
On December 15, 2016, the Canadian government enacted new tax rules that eliminate the ability of investors to switch among different classes of RBC Corporate Class Funds on a tax-deferred basis. The new rules do not apply to switches between different series of the same fund.
Effective December 1, 2016, Mr. Lloyd R. McGinnis retired and Ms. Élaine Cousineau was appointed as Chair of the Independent Review Committee (the “IRC”). Mr. Charles F. Macfarlane was appointed as Vice Chair of the IRC. Effective January 1, 2017, Ms. Suromitra Sanatani and Ms. Catherine Kloepfer were appointed as members of the IRC.
Effective July 1, 2016, Deloitte LLP resigned and PricewaterhouseCoopers LLP was appointed as auditors of the Fund.
Effective June 30, 2016, management fees were reduced as follows: from 1.85% to 1.75% in respect of Series A mutual fund shares and Advisor Series mutual fund shares; from 1.10% to 1.00% in respect of Series D mutual fund shares; and from 0.85% to 0.75% in respect of Series F mutual fund shares. Also effective June 30, 2016, Series H mutual fund shares and Series I mutual fund shares were closed to all investors.
RBC U.S. SMALL-CAP CORE EQUITY CLASS
141

ANNUAL MANAGEMENT REPORT OF FUND PERFORMANCE
142
March 31, 2017
RBC U.S. SMALL-CAP CORE EQUITY CLASS
Related-Party TransactionsManager and Portfolio ManagerRBC GAM is an indirect, wholly owned subsidiary of Royal Bank of Canada (“Royal Bank”) and is the manager and portfolio manager of the Fund. RBC GAM is responsible for the Fund’s day-to-day operations, provides investment advice and portfolio management services to the Fund and appoints distributors for the Fund. RBC GAM is paid a management fee by the Fund as compensation for its services. The Fund pays a fixed administration fee to RBC GAM, which, in turn, pays certain operating expenses of the Fund.
Affiliates of RBC GAM that provide services to the Fund in the course of their normal businesses are discussed below.
DistributorsRBC GAM, Royal Mutual Funds Inc., RBC Direct Investing Inc., RBC Dominion Securities Inc. and Phillips, Hager & North Investment Funds Ltd. are the principal distributors of, or distribute certain series of the mutual fund shares of, the Fund. Dealers receive an ongoing commission based on the total value of their clients’ Series A, Advisor Series and Series D mutual fund shares.
CustodianRBC Investor Services Trust (“RBC IS”) is the custodian and holds the assets of the Fund.
RegistrarsRoyal Bank, RBC IS and RBC GAM are the registrars of the Fund and keep records of who owns the mutual fund shares of the Fund.
Other Related-Party TransactionsPursuant to applicable securities legislation, the Fund relied on the standing instructions from the Independent Review Committee with respect to one or more of the following transactions:
Related-Party Trading Activities(a) trades in securities of Royal Bank;
(b) investments in the securities of issuers for which a related-party dealer acted as an underwriter during the distribution of such securities and the 60-day period following the conclusion of such distribution of the underwritten securities to the public;
(c) purchases of equity and debt securities from or sales of equity or debt securities to a related-party dealer, where it acted as principal; and
Inter-Fund Trading(d) purchases or sales of securities of an issuer from or to another
investment fund or managed account managed by RBC GAM.
The applicable standing instructions require that Related-Party Trading Activities and Inter-Fund Trading be conducted in accordance with RBC GAM policy and that RBC GAM advise the Independent Review Committee of a material breach of any standing instruction. RBC GAM policy requires that an investment decision in respect of Related-Party Trading Activities (i) is made free from any influence of Royal Bank or its associates or affiliates and without taking into account any consideration relevant to Royal Bank or its affiliates or associates, (ii) represents the business judgment of the portfolio manager, uninfluenced by considerations other than the best interests of the Fund, (iii) is in compliance with RBC GAM policies and procedures, and (iv) achieves a fair and reasonable result for the Fund. RBC GAM policy requires that an investment decision in respect of Inter-Fund Trading is in the best interests of each Fund.
142

ANNUAL MANAGEMENT REPORT OF FUND PERFORMANCE
March 31, 2017
143
RBC U.S. SMALL-CAP CORE EQUITY CLASS
FINANCIAL HIGHLIGHTS The following tables show selected key financial information about the Fund and are intended to help you understand the Fund’s financial performance for the past five years or for the periods since inception. This information is derived from the Fund’s audited annual financial statements. For financial years beginning on or after April 1, 2014, financial highlight information is derived from financial statements prepared in compliance with International Financial Reporting Standards (“IFRS”). For financial years prior to April 1, 2014, financial highlight information is derived from financial statements prepared in accordance with Canadian generally accepted accounting principles (“GAAP”). “Net Assets,” for the periods prior to April 1, 2014, are calculated in accordance with GAAP, and “Net Asset Value” is derived from the valuation method disclosed in the RBC Corporate Class Funds Annual Information Form and is used for transactional purposes (see Ratios and Supplemental Data). All other calculations for the purposes of this MRFP are made using Net Asset Value. There is no significant difference between “Net Assets” and “Net Asset Value” under IFRS.
Change in Net Assets Per Mutual Fund Share ($)
Annual Distributions2
Increase (Decrease) from Operations1 From Total Realized Unrealized Income From Net Assets For the Year/ Net Assets Revenue Total Gains Gains (Excluding From Capital Return End of Period Ended Beginning of Year/Period (Loss) Expenses (Losses) (Losses) Total Dividends) Dividends Gains of Capital Total Year/Period
Series AMar. 31, 2017 9.74 0.09 (0.24) 1.13 1.34 2.32 – – – – – 12.24 Mar. 31, 2016 10.73 0.13 (0.22) (0.24) (0.82) (1.15) – – – – – 9.74Mar. 31, 20153 10.00† – (0.04) – 0.77 0.73 – – – – – 10.73
Advisor SeriesMar. 31, 2017 9.74 0.09 (0.25) 1.15 1.33 2.32 – – – – – 12.24Mar. 31, 2016 10.73 0.15 (0.22) (0.27) (0.91) (1.25) – – – – – 9.74Mar. 31, 20153 10.00† – (0.04) – 0.64 0.60 – – – – – 10.73
Series DMar. 31, 2017 9.84 0.09 (0.16) 1.15 0.80 1.88 – – – – – 12.46Mar. 31, 2016 10.75 0.14 (0.14) (0.26) (0.87) (1.13) – – – – – 9.84Mar. 31, 20153 10.00† – (0.02) – 0.72 0.70 – – – – – 10.75
Series FMar. 31, 2017 9.89 0.07 (0.12) 0.84 0.49 1.28 – – – – – 12.57Mar. 31, 2016 10.75 0.15 (0.09) (0.27) (0.91) (1.12) – – – – – 9.89Mar. 31, 20153 10.00† – (0.02) – 0.87 0.85 – – – – – 10.75
Series OMar. 31, 2017 9.99 0.10 (0.02) 1.23 2.16 3.47 – – – – – 12.80Mar. 31, 2016 10.77 0.13 – (0.24) (0.81) (0.92) – – – – – 9.99Mar. 31, 20153 10.00† – – – 0.84 0.84 – – – – – 10.77
1 Net assets and distributions are based on the actual number of mutual fund shares outstanding at the relevant time. The increase/decrease from operations is based on the weighted average number of mutual fund shares outstanding over the financial period. This table is not intended to be a reconciliation of beginning to ending net assets per mutual fund share.
2 Distributions are reinvested in additional mutual fund shares of the Fund or paid in cash.3 From October 16, 2014.† Initial offering net asset value per mutual fund share.
143

ANNUAL MANAGEMENT REPORT OF FUND PERFORMANCE
March 31, 2017
144
RBC U.S. SMALL-CAP CORE EQUITY CLASS
FINANCIAL HIGHLIGHTS (cont.)
Ratios and Supplemental Data
Number of Net Asset Value Net Asset Value Mutual Fund Shares Management MER Before Portfolio TradingAs at Per Mutual Fund Share ($) ($000s) Outstanding (000s) Expense Ratio (%)1 Absorption (%)1 Turnover Rate (%)2 Expense Ratio (%)3
Series AMar. 31, 2017 12.24 270 22 2.154 2.37 108.90 0.04Mar. 31, 2016 9.74 109 11 2.29 2.70 42.27 0.06Mar. 31, 20155 10.73 7 1 2.30 2.30 – 0.08
Advisor SeriesMar. 31, 2017 12.24 127 10 2.214 2.43 108.90 0.04Mar. 31, 2016 9.74 91 9 2.27 2.68 42.27 0.06Mar. 31, 20155 10.73 74 7 2.30 2.30 – 0.08
Series DMar. 31, 2017 12.46 276 22 1.324 1.54 108.90 0.04Mar. 31, 2016 9.84 26 3 1.45 1.86 42.27 0.06Mar. 31, 20155 10.75 20 2 1.45 1.45 – 0.08
Series FMar. 31, 2017 12.57 1 085 86 1.024 1.24 108.90 0.04Mar. 31, 2016 9.89 1 – 1.10 1.51 42.27 0.06Mar. 31, 20155 10.75 1 – 1.17 1.17 – 0.08
Series OMar. 31, 2017 12.80 197 15 0.14 0.36 108.90 0.04Mar. 31, 2016 9.99 477 48 0.14 0.55 42.27 0.06Mar. 31, 20155 10.77 214 20 0.14 0.14 – 0.08
1 The management expense ratio (“MER”) is based on expenses for the stated period, excluding commissions and other portfolio transaction costs, and is expressed as an annualized percentage of the daily average net asset value during the period. RBC GAM may, at its discretion and without notice to shareholders, waive or absorb certain operating expenses. MER includes the waiver or absorption by RBC GAM of certain operating expenses, while the MER before absorption shows the MER prior to operating expenses being waived or absorbed by RBC GAM.
2 The Fund’s portfolio turnover rate gives an indication of the level of activity employed by the portfolio manager. A portfolio turnover rate of 100% is equivalent to the Fund buying and selling all of the securities in its portfolio once in the course of the year. The higher the Fund’s portfolio turnover rate in a year, the greater the trading costs payable by the Fund in the year, and the greater the chance of an investor receiving taxable capital gains in the year. There is not necessarily a relationship between a high turnover rate and the performance of the Fund.
3 The trading expense ratio represents total commissions and other portfolio transaction costs expressed as an annualized percentage of daily average net asset value during the period. The trading expense ratio is not applicable to fixed-income transactions.
4 Effective June 30, 2016, the management fee was changed in respect of certain series of the Fund. If the change to the management fee would have been in effect throughout 2016, the adjusted MER for each series of the Fund would be: Series A – 2.14%, Advisor Series – 2.19%, Series D – 1.31% and Series F – 1.01%.
5 From October 16, 2014.
Management Fees RBC GAM is the manager and portfolio manager of the Fund. Management fees of each series of the Fund are calculated at the annual percentages, before GST/HST, of the daily net asset value of each series of the Fund. The breakdown of the services received in consideration of the management fees for each series, as a percentage of the management fees, is as follows:
Breakdown of Services
Management Fees Distribution Other*
Series A 1.75% 54% 46%Advisor Series 1.75% 54% 46%Series D 1.00% 23% 77%Series F 0.75% – 100%
Series O – no management fees are paid by the Fund with respect to Series O mutual fund shares. Series O shareholders pay a negotiated fee directly to RBC GAM for investment-counselling services.* Includes all costs related to management, investment advisory services, general administration
and profit.
144

ANNUAL MANAGEMENT REPORT OF FUND PERFORMANCE
145
March 31, 2017
Annual Compound Returns (%) The table shows the annual compound returns for each series of the Fund and for each of the periods indicated ended on March 31, 2017, compared with the following benchmark:
Russell 2000 Index (CAD)
Past Past Past Past Since Year 3 Years 5 Years 10 Years Inception
Series A 25.6 – – – 9.7Benchmark 29.2 – – – 12.3
Advisor Series 25.6 – – – 9.7Benchmark 29.2 – – – 12.3
Series D 26.7 – – – 10.6Benchmark 29.2 – – – 12.3
Series F 27.1 – – – 11.1Benchmark 29.2 – – – 12.3
Series O 28.2 – – – 12.0Benchmark 29.2 – – – 12.3
The returns of each series may vary because of differences in management fees and expenses. The Benchmark index returns do not include any costs of investing. See Management Discussion of Fund Performance for a discussion of performance relative to the Benchmark index.
Series A, Advisor Series, Series D, Series F and Series O mutual fund shares have been available for sale to shareholders since January 26, 2015.
Inception dates are not provided for series that have been in existence for more than 10 years.
INDEX DESCRIPTIONRussell 2000 Index (CAD) This index measures the Canadian dollar performance of the small-cap segment of the U.S. equity universe and includes 2000 of the smallest securities based on market capitalization.
PAST PERFORMANCEThe performance information shown assumes that all distributions made by the Fund in the periods shown were reinvested in additional shares of the Fund and would be lower if distributions were not reinvested. The performance information does not take into account sales, redemption, distribution, optional charges or income taxes payable that would have reduced returns or performance. Past performance does not necessarily indicate how the Fund may perform in the future. A fund with more than 10 years of performance history is only permitted to disclose the past 10 years.
Year-by-Year Returns (%) The bar chart indicates the Fund’s performance for each of the years shown, and illustrates how the Fund’s performance has changed from year to year. The bar chart shows, in percentage terms, how much an investment made on the first day of each financial year would have grown or decreased by the end of the financial year.
RBC U.S. SMALL-CAP CORE EQUITY CLASS
145

ANNUAL MANAGEMENT REPORT OF FUND PERFORMANCE
146
March 31, 2017
RBC U.S. SMALL-CAP CORE EQUITY CLASS
SUMMARY OF INVESTMENT PORTFOLIO(after consideration of derivative products, if any)As at March 31, 2017
Investment Mix % of Net Asset Value
Industrials 25.3Financials 21.9Consumer Discretionary 16.7Information Technology 13.1Health Care 6.6Materials 4.8Energy 3.6Real Estate 2.2Utilities 1.1Telecommunication Services 0.8Consumer Staples 0.4Cash/Other 3.5
Top 25 Holdings* % of Net Asset Value
Patrick Industries Inc. 4.0Cash & Cash Equivalents 3.5Universal Electronics Inc. 3.2Compass Diversified Holdings 3.1ACCO Brands Corp. 2.7EnerSys 2.7InterDigital Inc. 2.6Grand Canyon Education Inc. 2.6West Pharmaceutical Services Inc. 2.6MKS Instruments Inc. 2.5Amerisafe Inc. 2.2LCI Industries 2.1Tyler Technologies Inc. 2.0AZZ Inc. 1.9United Community Banks Inc. 1.8Insteel Industries Inc. 1.8Columbus McKinnon Corp. 1.8Chemical Financial Corp. 1.7Pacific Premier Bancorp Inc. 1.7Take-Two Interactive Software Inc. 1.7NN Inc. 1.6Texas Capital Bancshares Inc. 1.6Lydall Inc. 1.6Astronics Corp. 1.5The Greenbrier Co. Inc. 1.5Top 25 Holdings 56.0
* The Fund invests substantially all of its assets directly in the RBC U.S. Small-Cap Core Equity Fund. The above are the Top 25 holdings of the RBC U.S. Small-Cap Core Equity Fund.
The Summary of Investment Portfolio may change due to ongoing portfolio transactions of the Fund and a quarterly update is available at www.rbcgam.com/funds.
The Simplified Prospectus and other information about the underlying fund are available on SEDAR website at www.sedar.com.
146

ANNUAL MANAGEMENT REPORT OF FUND PERFORMANCE
147
INTERNATIONAL EQUITY FUND
RBC INTERNATIONAL EQUITY CLASS
March 31, 2017
Portfolio Manager RBC Global Asset Management Inc. (“RBC GAM”)
This annual management report of fund performance (“MRFP”) contains financial highlights but does not contain the complete annual financial statements of the Fund. You can get a copy of the financial statements at your request, and at no cost, by calling 1-800-463-FUND (3863), by writing to us at RBC Global Asset Management Inc., P.O. Box 7500, Station A, Toronto, Ontario M5W 1P9, or by visiting our website at www.rbcgam.com/reports or SEDAR at www.sedar.com. Security holders may also contact us using one of these methods to request a copy of the Fund’s proxy voting policies and procedures, proxy voting disclosure record, or quarterly portfolio disclosure.
The Board of Directors of RBC Corporate Class Inc. approved this annual management report of fund performance on May 11, 2017.
A Note on Forward-looking Statements
This report may contain forward-looking statements about the Fund, its future performance, strategies or prospects, and possible future Fund action. The words “may,” “could,” “should,” “would,” “suspect,” “outlook,” “believe,” “plan,” “anticipate,” “estimate,” “expect,” “intend,” “forecast,” “objective” and similar expressions are intended to identify forward-looking statements.
Forward-looking statements are not guarantees of future performance. Forward-looking statements involve inherent risks and uncertainties, both about the Fund and general economic factors, so it is possible that predictions, forecasts, projections and other forward-looking statements will not be achieved. We caution you not to place undue reliance on these statements as a number of important factors could cause actual events or results to differ materially from those expressed or implied in any forward-looking statement made in relation to the Fund. These factors include, but are not limited to, general economic, political and market factors in Canada, the United States and internationally, interest and foreign exchange rates, global equity and capital markets, business competition, technological changes, changes in laws and regulations, judicial or regulatory judgments, legal proceedings and catastrophic events.
The above list of important factors that may affect future results is not exhaustive. Before making any investment decisions, we encourage you to consider these and other factors carefully. All opinions contained in forward-looking statements are subject to change without notice and are provided in good faith but without legal responsibility.
147

ANNUAL MANAGEMENT REPORT OF FUND PERFORMANCE
148
March 31, 2017
MANAGEMENT DISCUSSION OF FUND PERFORMANCE
Investment Objective and StrategiesThe Fund seeks to provide long-term capital growth by investing in stocks of companies outside of North America in order to provide exposure to economies that may be at different stages of the business cycle or offer growth opportunities unavailable in U.S. and Canadian markets.
To achieve its investment objective, the Fund invests most of its assets in the RBC International Equity Fund (the “underlying fund”). The underlying fund focuses on companies that are primarily in Europe, Australasia and the Far East.
RiskThere were no significant changes to the investment objective and strategies that affected the Fund’s overall level of risk during the reporting period. The risks of investing in the Fund and the suitability of the Fund for investors remain as discussed in the Simplified Prospectus.
Results of OperationsThe Fund’s net asset value rose to $5 million as of March 31, 2017, from $4 million as of March 31, 2016. The increase was due to a mix of investment returns and net inflows.
Over the past year, the Fund’s Series A shares gained 4.8%, which underperformed the 15.1% rise in the benchmark. The Fund’s return is after the deduction of fees and expenses, while the benchmark and broad-based index returns do not include any costs of investing. See the Financial Highlights section for the management expense ratios and the Past Performance section for the returns of any other series, which may vary because of differences in management fees and expenses.
Politics in Europe dominated market discussions in the Eurozone and the U.K. during the period. Britons decided in June to leave the European Union (“Brexit”), and by the end of the period, Prime Minister Theresa May had formally started the two-year negotiating period for removing the U.K. from the single market. Investors also watched France and Italy for signs of populist strength in Europe. In Asia, the sustainability of Chinese economic growth and Japan’s efforts to stoke inflation were among the issues that preoccupied investors.
One of the results of this uncertainty was that the European Central Bank and the Bank of Japan maintained policies conducive to economic growth and faster inflation. Toward the end of the period, however, investors began to consider whether government spending would at least partially replace monetary policy as a more important driver of economic growth, especially following the election in November of Donald Trump as U.S. president.
In Asia, the largest contributor to the Fund’s returns came from holdings in Japan and China, primarily in the Information Technology sector. The top contributor to relative performance in Asia during the period was Japanese telecom operator SoftBank, while Japan Tobacco had a negative impact. In Europe, the stock that contributed the most to returns was ARM Holdings, the British semiconductor and software-design company that was taken over by SoftBank in July. The stock that had the most negative impact on returns was Novo Nordisk, which faces mounting competition in the market for diabetes drugs.
Recent DevelopmentsIn the portfolio manager’s view, investors will continue to pay less attention to politics in Europe as long as the outlook for corporate earnings and economic growth appears to be brightening. While the potential for political disruptions persists, particularly in France and Italy, the portfolio manager will retain a focus on the merits of individual companies.
The portfolio manager is increasingly cautious regarding Asia given the uncertainty surrounding Trump’s trade policy. Countries that have large trade surpluses with the U.S. would have the most to lose, primarily industrial exporters in northern Asia. While the more domestically driven economies of South Asia would theoretically be harmed less, they too would likely be hit by the broad impact of any protectionist policies that emerge. The portfolio manager expects Trump to direct much of his energy to trade policy with China, but there is no guarantee that Japan will escape unscathed.
On December 15, 2016, the Canadian government enacted new tax rules that eliminate the ability of investors to switch among different classes of RBC Corporate Class Funds on a tax-deferred basis. The new rules do not apply to switches between different series of the same fund.
Effective December 1, 2016, Mr. Lloyd R. McGinnis retired and Ms. Élaine Cousineau was appointed as Chair of the Independent Review Committee (the “IRC”). Mr. Charles F. Macfarlane was appointed as Vice Chair of the IRC. Effective January 1, 2017, Ms. Suromitra Sanatani and Ms. Catherine Kloepfer were appointed as members of the IRC.
Effective July 1, 2016, Deloitte LLP resigned and PricewaterhouseCoopers LLP was appointed as auditors of the Fund.
Effective June 30, 2016, management fees were reduced as follows: from 1.85% to 1.75% in respect of Series A mutual fund shares and Advisor Series mutual fund shares. Also effective June 30, 2016, Series H mutual fund shares and Series I mutual fund shares were closed to all investors.
RBC INTERNATIONAL EQUITY CLASS
148
ANNUAL MANAGEMENT REPORT OF FUND PERFORMANCE
149
March 31, 2017
RBC INTERNATIONAL EQUITY CLASS
Related-Party TransactionsManager and Portfolio ManagerRBC GAM is an indirect, wholly owned subsidiary of Royal Bank of Canada (“Royal Bank”) and is the manager and portfolio manager of the Fund. RBC GAM is responsible for the Fund’s day-to-day operations, provides investment advice and portfolio management services to the Fund and appoints distributors for the Fund. RBC GAM is paid a management fee by the Fund as compensation for its services. The Fund pays a fixed administration fee to RBC GAM, which, in turn, pays certain operating expenses of the Fund.
Affiliates of RBC GAM that provide services to the Fund in the course of their normal businesses are discussed below.
DistributorsRBC GAM, Royal Mutual Funds Inc., RBC Direct Investing Inc., RBC Dominion Securities Inc. and Phillips, Hager & North Investment Funds Ltd. are the principal distributors of, or distribute certain series of the mutual fund shares of, the Fund. Dealers receive an ongoing commission based on the total value of their clients’ Series A, Advisor Series and Series D mutual fund shares.
CustodianRBC Investor Services Trust (“RBC IS”) is the custodian and holds the assets of the Fund.
RegistrarsRoyal Bank, RBC IS and RBC GAM are the registrars of the Fund and keep records of who owns the mutual fund shares of the Fund.
Other Related-Party TransactionsPursuant to applicable securities legislation, the Fund relied on the standing instructions from the Independent Review Committee with respect to one or more of the following transactions:
Related-Party Trading Activities(a) trades in securities of Royal Bank;
(b) investments in the securities of issuers for which a related-party dealer acted as an underwriter during the distribution of such securities and the 60-day period following the conclusion of such distribution of the underwritten securities to the public;
(c) purchases of equity and debt securities from or sales of equity or debt securities to a related-party dealer, where it acted as principal; and
Inter-Fund Trading(d) purchases or sales of securities of an issuer from or to another
investment fund or managed account managed by RBC GAM.
The applicable standing instructions require that Related-Party Trading Activities and Inter-Fund Trading be conducted in accordance with RBC GAM policy and that RBC GAM advise the Independent Review Committee of a material breach of any standing instruction. RBC GAM policy requires that an investment decision in respect of Related-Party Trading Activities (i) is made free from any influence of Royal Bank or its associates or affiliates and without taking into account any consideration relevant to Royal Bank or its affiliates or associates, (ii) represents the business judgment of the portfolio manager, uninfluenced by considerations other than the best interests of the Fund, (iii) is in compliance with RBC GAM policies and procedures, and (iv) achieves a fair and reasonable result for the Fund. RBC GAM policy requires that an investment decision in respect of Inter-Fund Trading is in the best interests of each Fund.
149

ANNUAL MANAGEMENT REPORT OF FUND PERFORMANCE
March 31, 2017
150
RBC INTERNATIONAL EQUITY CLASS
FINANCIAL HIGHLIGHTS The following tables show selected key financial information about the Fund and are intended to help you understand the Fund’s financial performance for the past five years or for the periods since inception. This information is derived from the Fund’s audited annual financial statements. For financial years beginning on or after April 1, 2014, financial highlight information is derived from financial statements prepared in compliance with International Financial Reporting Standards (“IFRS”). For financial years prior to April 1, 2014, financial highlight information is derived from financial statements prepared in accordance with Canadian generally accepted accounting principles (“GAAP”). “Net Assets,” for the periods prior to April 1, 2014, are calculated in accordance with GAAP, and “Net Asset Value” is derived from the valuation method disclosed in the RBC Corporate Class Funds Annual Information Form and is used for transactional purposes (see Ratios and Supplemental Data). All other calculations for the purposes of this MRFP are made using Net Asset Value. There is no significant difference between “Net Assets” and “Net Asset Value” under IFRS.
Change in Net Assets Per Mutual Fund Share ($)
Annual Distributions2
Increase (Decrease) from Operations1 From Total Realized Unrealized Income From Net Assets For the Year/ Net Assets Revenue Total Gains Gains (Excluding From Capital Return End of Period Ended Beginning of Year/Period (Loss) Expenses (Losses) (Losses) Total Dividends) Dividends Gains of Capital Total Year/Period
Series AMar. 31, 2017 10.42 0.22 (0.23) (0.04) 0.52 0.47 – – – – – 10.92 Mar. 31, 2016 10.38 0.22 (0.24) 0.04 (0.37) (0.35) – – – – – 10.42Mar. 31, 20153 10.00† – (0.04) – 0.22 0.18 – – – – – 10.38
Advisor SeriesMar. 31, 2017 10.44 0.21 (0.21) (0.04) 1.42 1.38 – – – – – 10.96Mar. 31, 2016 10.39 0.29 (0.23) 0.05 (0.49) (0.38) – – – – – 10.44Mar. 31, 20153 10.00† – (0.04) – 0.34 0.30 – – – – – 10.39
Series DMar. 31, 2017 10.54 0.22 (0.14) (0.04) 0.57 0.61 – – – – – 11.15Mar. 31, 2016 10.40 0.24 (0.14) 0.04 (0.40) (0.26) – – – – – 10.54Mar. 31, 20153 10.00† – (0.02) – 0.18 0.16 – – – – – 10.40
Series FMar. 31, 2017 10.58 0.22 (0.11) (0.04) 1.08 1.15 – – – – – 11.22Mar. 31, 2016 10.41 0.21 (0.11) 0.04 (0.36) (0.22) – – – – – 10.58Mar. 31, 20153 10.00† – (0.01) – 0.34 0.33 – – – – – 10.41
Series OMar. 31, 2017 10.70 0.23 – (0.04) 0.57 0.76 – – – – – 11.46Mar. 31, 2016 10.42 0.38 – 0.07 (0.65) (0.20) – – – – – 10.70Mar. 31, 20153 10.00† – – – 0.34 0.34 – – – – – 10.42
1 Net assets and distributions are based on the actual number of mutual fund shares outstanding at the relevant time. The increase/decrease from operations is based on the weighted average number of mutual fund shares outstanding over the financial period. This table is not intended to be a reconciliation of beginning to ending net assets per mutual fund share.
2 Distributions are reinvested in additional mutual fund shares of the Fund or paid in cash.3 From October 16, 2014.† Initial offering net asset value per mutual fund share.
150

ANNUAL MANAGEMENT REPORT OF FUND PERFORMANCE
March 31, 2017
151
RBC INTERNATIONAL EQUITY CLASS
FINANCIAL HIGHLIGHTS (cont.)
Ratios and Supplemental Data
Number of Net Asset Value Net Asset Value Mutual Fund Shares Management MER Before Portfolio TradingAs at Per Mutual Fund Share ($) ($000s) Outstanding (000s) Expense Ratio (%)1 Absorption (%)1 Turnover Rate (%)2 Expense Ratio (%)3
Series AMar. 31, 2017 10.92 1 307 120 2.164 2.22 35.41 0.26Mar. 31, 2016 10.42 1 086 104 2.26 2.38 18.94 0.28Mar. 31, 20155 10.38 188 18 2.27 2.27 – 0.40
Advisor SeriesMar. 31, 2017 10.96 155 14 2.044 2.10 35.41 0.26Mar. 31, 2016 10.44 13 1 2.13 2.25 18.94 0.28Mar. 31, 20155 10.39 3 – 2.27 2.27 – 0.40
Series DMar. 31, 2017 11.15 1 825 164 1.28 1.34 35.41 0.26Mar. 31, 2016 10.54 2 104 200 1.29 1.41 18.94 0.28Mar. 31, 20155 10.40 363 35 1.30 1.30 – 0.40
Series FMar. 31, 2017 11.22 1 577 141 1.02 1.08 35.41 0.26Mar. 31, 2016 10.58 297 28 1.03 1.15 18.94 0.28Mar. 31, 20155 10.41 49 5 1.02 1.02 – 0.40
Series OMar. 31, 2017 11.46 1 – 0.05 0.11 35.41 0.26Mar. 31, 2016 10.70 1 – 0.05 0.17 18.94 0.28Mar. 31, 20155 10.42 150 14 0.05 0.05 – 0.40
1 The management expense ratio (“MER”) is based on expenses for the stated period, excluding commissions and other portfolio transaction costs, and is expressed as an annualized percentage of the daily average net asset value during the period. RBC GAM may, at its discretion and without notice to shareholders, waive or absorb certain operating expenses. MER includes the waiver or absorption by RBC GAM of certain operating expenses, while the MER before absorption shows the MER prior to operating expenses being waived or absorbed by RBC GAM.
2 The Fund’s portfolio turnover rate gives an indication of the level of activity employed by the portfolio manager. A portfolio turnover rate of 100% is equivalent to the Fund buying and selling all of the securities in its portfolio once in the course of the year. The higher the Fund’s portfolio turnover rate in a year, the greater the trading costs payable by the Fund in the year, and the greater the chance of an investor receiving taxable capital gains in the year. There is not necessarily a relationship between a high turnover rate and the performance of the Fund.
3 The trading expense ratio represents total commissions and other portfolio transaction costs expressed as an annualized percentage of daily average net asset value during the period. The trading expense ratio is not applicable to fixed-income transactions.
4 Effective June 30, 2016, the management fee was changed in respect of certain series of the Fund. If the change to the management fee would have been in effect throughout 2016, the adjusted MER for each series of the Fund would be: Series A – 2.14% and Advisor Series – 2.02%.
5 From October 16, 2014.
Management Fees RBC GAM is the manager and portfolio manager of the Fund. Management fees of each series of the Fund are calculated at the annual percentages, before GST/HST, of the daily net asset value of each series of the Fund. The breakdown of the services received in consideration of the management fees for each series, as a percentage of the management fees, is as follows:
Breakdown of Services
Management Fees Distribution Other*
Series A 1.75% 54% 46%Advisor Series 1.75% 54% 46%Series D 1.00% 25% 75%Series F 0.75% – 100%
Series O – no management fees are paid by the Fund with respect to Series O mutual fund shares. Series O shareholders pay a negotiated fee directly to RBC GAM for investment-counselling services.* Includes all costs related to management, investment advisory services, general administration
and profit.
151

ANNUAL MANAGEMENT REPORT OF FUND PERFORMANCE
152
March 31, 2017
Annual Compound Returns (%) The table shows the annual compound returns for each series of the Fund and for each of the periods indicated ended on March 31, 2017, compared with the following benchmark:
MSCI EAFE Total Return Net Index (CAD)
Past Past Past Past Since Year 3 Years 5 Years 10 Years Inception
Series A 4.8 – – – 4.1Benchmark 15.1 – – – 5.6
Advisor Series 5.0 – – – 4.3Benchmark 15.1 – – – 5.6
Series D 5.8 – – – 5.1Benchmark 15.1 – – – 5.6
Series F 6.0 – – – 5.4Benchmark 15.1 – – – 5.6
Series O 7.1 – – – 6.4Benchmark 15.1 – – – 5.6
The returns of each series may vary because of differences in management fees and expenses. The Benchmark index returns do not include any costs of investing. See Management Discussion of Fund Performance for a discussion of performance relative to the Benchmark index.
Series A, Advisor Series, Series D, Series F and Series O mutual fund shares have been available for sale to shareholders since January 26, 2015.
Inception dates are not provided for series that have been in existence for more than 10 years.
INDEX DESCRIPTIONMSCI EAFE Total Return Net Index (CAD) This index is a broad measure of the Canadian dollar performance of stocks from developed equity markets covering countries in Europe, Australasia and the Far East. The net total return index reinvests dividends after the deduction of withholding taxes, using (for international indexes) a tax rate applicable to non-resident institutional investors who do not benefit from double taxation treaties.
PAST PERFORMANCEThe performance information shown assumes that all distributions made by the Fund in the periods shown were reinvested in additional shares of the Fund and would be lower if distributions were not reinvested. The performance information does not take into account sales, redemption, distribution, optional charges or income taxes payable that would have reduced returns or performance. Past performance does not necessarily indicate how the Fund may perform in the future. A fund with more than 10 years of performance history is only permitted to disclose the past 10 years.
Year-by-Year Returns (%) The bar chart indicates the Fund’s performance for each of the years shown, and illustrates how the Fund’s performance has changed from year to year. The bar chart shows, in percentage terms, how much an investment made on the first day of each financial year would have grown or decreased by the end of the financial year.
RBC INTERNATIONAL EQUITY CLASS
152
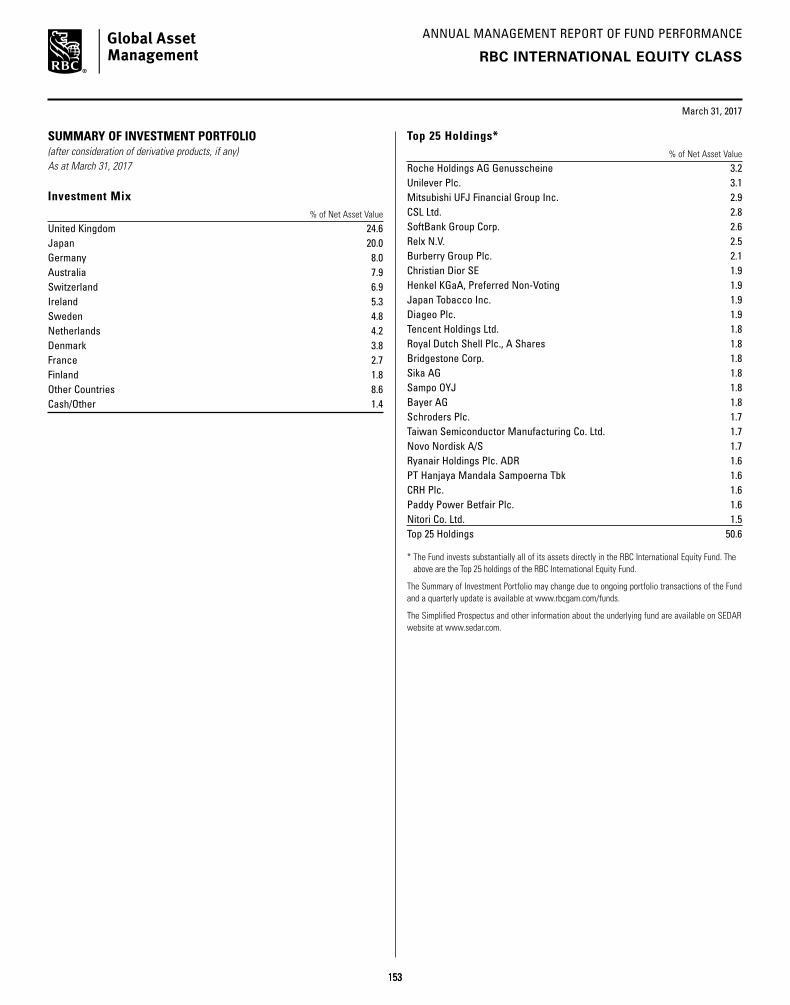
ANNUAL MANAGEMENT REPORT OF FUND PERFORMANCE
153
March 31, 2017
RBC INTERNATIONAL EQUITY CLASS
SUMMARY OF INVESTMENT PORTFOLIO(after consideration of derivative products, if any)As at March 31, 2017
Investment Mix % of Net Asset Value
United Kingdom 24.6Japan 20.0Germany 8.0Australia 7.9Switzerland 6.9Ireland 5.3Sweden 4.8Netherlands 4.2Denmark 3.8France 2.7Finland 1.8Other Countries 8.6Cash/Other 1.4
Top 25 Holdings* % of Net Asset Value
Roche Holdings AG Genusscheine 3.2Unilever Plc. 3.1Mitsubishi UFJ Financial Group Inc. 2.9CSL Ltd. 2.8SoftBank Group Corp. 2.6Relx N.V. 2.5Burberry Group Plc. 2.1Christian Dior SE 1.9Henkel KGaA, Preferred Non-Voting 1.9Japan Tobacco Inc. 1.9Diageo Plc. 1.9Tencent Holdings Ltd. 1.8Royal Dutch Shell Plc., A Shares 1.8Bridgestone Corp. 1.8Sika AG 1.8Sampo OYJ 1.8Bayer AG 1.8Schroders Plc. 1.7Taiwan Semiconductor Manufacturing Co. Ltd. 1.7Novo Nordisk A/S 1.7Ryanair Holdings Plc. ADR 1.6PT Hanjaya Mandala Sampoerna Tbk 1.6CRH Plc. 1.6Paddy Power Betfair Plc. 1.6Nitori Co. Ltd. 1.5Top 25 Holdings 50.6
* The Fund invests substantially all of its assets directly in the RBC International Equity Fund. The above are the Top 25 holdings of the RBC International Equity Fund.
The Summary of Investment Portfolio may change due to ongoing portfolio transactions of the Fund and a quarterly update is available at www.rbcgam.com/funds.
The Simplified Prospectus and other information about the underlying fund are available on SEDAR website at www.sedar.com.
153

ANNUAL MANAGEMENT REPORT OF FUND PERFORMANCE
154
INTERNATIONAL EQUITY FUND
PHILLIPS, HAGER & NORTH OVERSEAS EQUITY CLASS
March 31, 2017
Portfolio Manager RBC Global Asset Management Inc. (“RBC GAM”)
This annual management report of fund performance (“MRFP”) contains financial highlights but does not contain the complete annual financial statements of the Fund. You can get a copy of the financial statements at your request, and at no cost, by calling 1-800-463-FUND (3863), by writing to us at RBC Global Asset Management Inc., P.O. Box 7500, Station A, Toronto, Ontario M5W 1P9, or by visiting our website at www.rbcgam.com/reports or SEDAR at www.sedar.com. Security holders may also contact us using one of these methods to request a copy of the Fund’s proxy voting policies and procedures, proxy voting disclosure record, or quarterly portfolio disclosure.
The Board of Directors of RBC Corporate Class Inc. approved this annual management report of fund performance on May 11, 2017.
A Note on Forward-looking Statements
This report may contain forward-looking statements about the Fund, its future performance, strategies or prospects, and possible future Fund action. The words “may,” “could,” “should,” “would,” “suspect,” “outlook,” “believe,” “plan,” “anticipate,” “estimate,” “expect,” “intend,” “forecast,” “objective” and similar expressions are intended to identify forward-looking statements.
Forward-looking statements are not guarantees of future performance. Forward-looking statements involve inherent risks and uncertainties, both about the Fund and general economic factors, so it is possible that predictions, forecasts, projections and other forward-looking statements will not be achieved. We caution you not to place undue reliance on these statements as a number of important factors could cause actual events or results to differ materially from those expressed or implied in any forward-looking statement made in relation to the Fund. These factors include, but are not limited to, general economic, political and market factors in Canada, the United States and internationally, interest and foreign exchange rates, global equity and capital markets, business competition, technological changes, changes in laws and regulations, judicial or regulatory judgments, legal proceedings and catastrophic events.
The above list of important factors that may affect future results is not exhaustive. Before making any investment decisions, we encourage you to consider these and other factors carefully. All opinions contained in forward-looking statements are subject to change without notice and are provided in good faith but without legal responsibility.
154

ANNUAL MANAGEMENT REPORT OF FUND PERFORMANCE
March 31, 2017
155
MANAGEMENT DISCUSSION OF FUND PERFORMANCE
Investment Objective and StrategiesThe Fund seeks to provide long-term capital growth by investing in a diversified portfolio of common stocks in companies in the world’s largest industrialized countries outside North America, including countries in Europe and the Far East, including Japan and Australia.
To achieve its investment objective, the Fund will invest most of its assets in the Phillips, Hager & North Overseas Equity Fund (the “underlying fund”). The underlying fund invests in companies that are attractively valued, possess sound fundamentals and have a strong market position.
RiskThere were no significant changes to the investment objective and strategies that affected the Fund’s overall level of risk during the reporting period. The risks of investing in the Fund and the suitability of the Fund for investors remain as discussed in the Simplified Prospectus.
Results of OperationsThe Fund’s net asset value was unchanged at $52 million as of March 31, 2017, from a year earlier.
Over the past year, the Fund’s Series A shares gained 6.0%, which underperformed the 15.1% rise in the benchmark. The Fund’s return is after the deduction of fees and expenses, while the benchmark and broad-based index returns do not include any costs of investing. See the Financial Highlights section for the management expense ratios and the Past Performance section for the returns of any other series, which may vary because of differences in management fees and expenses.
Political events had a significant impact on financial markets during the period given the U.K.’s decision in June to leave the European Union (“Brexit”) and the election in November of Donald Trump as U.S. president. The general agreement that Brexit would be negative for U.K. growth over the long term was more than offset by improvement in shorter-term global growth trends and the positive economic impact of a weaker British pound. Trump’s promises of lower taxes, financial reform and infrastructure spending resulted in a rally driven by the Energy, Financials and Materials sectors. Companies in these sectors do not usually fit the Fund’s investment criteria, and their absence was therefore negative for relative performance.
The Fund’s returns were held back most by Danish pharmaceutical company Novo Nordisk, which faces mounting competition in the market for diabetes drugs, and Anglo-Irish bookmaker Paddy Power, which recorded higher-than-expected costs linked to its takeover of rival Betfair. The Fund benefited the most from exposure to Nidec, a Japanese manufacturer of precision motors, and ASML, a Dutch company that supplies equipment used to make semiconductors.
Recent DevelopmentsThe stock market’s strong performance indicates that investors are anticipating good economic news, and there are some signs from the data that this view may be justified, in the opinion of the portfolio manager. While the growth outlook is improving, it is questionable whether such performance can continue. There are some obvious roadblocks ahead, including increasing doubts that the Trump administration will be able to legislate as radically or as quickly as initially thought; the fact that China must still grapple with loose monetary policy and the potential for a property bubble; and European political uncertainty following Brexit and Eurozone elections.
On December 15, 2016, the Canadian government enacted new tax rules that eliminate the ability of investors to switch among different classes of RBC Corporate Class Funds on a tax-deferred basis. The new rules do not apply to switches between different series of the same fund.
Effective December 1, 2016, Mr. Lloyd R. McGinnis retired and Ms. Élaine Cousineau was appointed as Chair of the Independent Review Committee (the “IRC”). Mr. Charles F. Macfarlane was appointed as Vice Chair of the IRC. Effective January 1, 2017, Ms. Suromitra Sanatani and Ms. Catherine Kloepfer were appointed as members of the IRC.
Effective July 1, 2016, Deloitte LLP resigned and PricewaterhouseCoopers LLP was appointed as auditors of the Fund.
Effective June 30, 2016, management fees were reduced as follows: from 1.85% to 1.75% in respect of Series A mutual fund shares and Advisor Series mutual fund shares; from 1.10% to 1.00% in respect of Series D mutual fund shares; and from 0.85% to 0.75% in respect of Series F mutual fund shares. Also effective June 30, 2016, Series H mutual fund shares were re-designated to Series A mutual fund shares and Series I mutual fund shares were re-designated to Series F mutual fund shares.
Related-Party TransactionsManager and Portfolio ManagerRBC GAM is an indirect, wholly owned subsidiary of Royal Bank of Canada (“Royal Bank”) and is the manager and portfolio manager of the Fund. RBC GAM is responsible for the Fund’s day-to-day operations, provides investment advice and portfolio management services to the Fund and appoints distributors for the Fund. RBC GAM is paid a management fee by the Fund as compensation for its services. The Fund pays a fixed administration fee to RBC GAM, which, in turn, pays certain operating expenses of the Fund.
Affiliates of RBC GAM that provide services to the Fund in the course of their normal businesses are discussed below.
PHILLIPS, HAGER & NORTH OVERSEAS EQUITY CLASS
155
ANNUAL MANAGEMENT REPORT OF FUND PERFORMANCE
March 31, 2017
156
PHILLIPS, HAGER & NORTH OVERSEAS EQUITY CLASS
DistributorsRBC GAM, Royal Mutual Funds Inc., RBC Direct Investing Inc., RBC Dominion Securities Inc. and Phillips, Hager & North Investment Funds Ltd. are the principal distributors of, or distribute certain series of the mutual fund shares of, the Fund. Dealers receive an ongoing commission based on the total value of their clients’ Series A, Advisor Series and Series D mutual fund shares.
CustodianRBC Investor Services Trust (“RBC IS”) is the custodian and holds the assets of the Fund.
RegistrarsRoyal Bank, RBC IS and RBC GAM are the registrars of the Fund and keep records of who owns the mutual fund shares of the Fund.
Other Related-Party TransactionsPursuant to applicable securities legislation, the Fund relied on the standing instructions from the Independent Review Committee with respect to one or more of the following transactions:
Related-Party Trading Activities(a) trades in securities of Royal Bank;
(b) investments in the securities of issuers for which a related-party dealer acted as an underwriter during the distribution of such securities and the 60-day period following the conclusion of such distribution of the underwritten securities to the public;
(c) purchases of equity and debt securities from or sales of equity or debt securities to a related-party dealer, where it acted as principal; and
Inter-Fund Trading(d) purchases or sales of securities of an issuer from or to another
investment fund or managed account managed by RBC GAM.
The applicable standing instructions require that Related-Party Trading Activities and Inter-Fund Trading be conducted in accordance with RBC GAM policy and that RBC GAM advise the Independent Review Committee of a material breach of any standing instruction. RBC GAM policy requires that an investment decision in respect of Related-Party Trading Activities (i) is made free from any influence of Royal Bank or its associates or affiliates and without taking into account any consideration relevant to Royal Bank or its affiliates or associates, (ii) represents the business judgment of the portfolio manager, uninfluenced by considerations other than the best interests of the Fund, (iii) is in compliance with RBC GAM policies and procedures, and (iv) achieves a fair and reasonable result for the Fund. RBC GAM policy requires that an investment decision in respect of Inter-Fund Trading is in the best interests of each Fund.
156

ANNUAL MANAGEMENT REPORT OF FUND PERFORMANCE
March 31, 2017
157
PHILLIPS, HAGER & NORTH OVERSEAS EQUITY CLASS
FINANCIAL HIGHLIGHTS The following tables show selected key financial information about the Fund and are intended to help you understand the Fund’s financial performance for the past five years or for the periods since inception. This information is derived from the Fund’s audited annual financial statements. For financial years beginning on or after April 1, 2014, financial highlight information is derived from financial statements prepared in compliance with International Financial Reporting Standards (“IFRS”). For financial years prior to April 1, 2014, financial highlight information is derived from financial statements prepared in accordance with Canadian generally accepted accounting principles (“GAAP”). “Net Assets,” for the periods prior to April 1, 2014, are calculated in accordance with GAAP, and “Net Asset Value” is derived from the valuation method disclosed in the RBC Corporate Class Funds Annual Information Form and is used for transactional purposes (see Ratios and Supplemental Data). All other calculations for the purposes of this MRFP are made using Net Asset Value. There is no significant difference between “Net Assets” and “Net Asset Value” under IFRS.
Change in Net Assets Per Mutual Fund Share ($)
Annual Distributions2
Increase (Decrease) from Operations1 From Total Realized Unrealized Income From Net Assets For the Year/ Net Assets Revenue Total Gains Gains (Excluding From Capital Return End of Period Ended Beginning of Year/Period (Loss) Expenses (Losses) (Losses) Total Dividends) Dividends Gains of Capital Total Year/Period
Series AMar. 31, 2017 16.02 0.46 (0.34) 0.45 0.35 0.92 – – – – – 16.97 Mar. 31, 2016 16.57 0.38 (0.36) 0.26 (0.92) (0.64) – – – – – 16.02Mar. 31, 2015 14.46 0.59 (0.32) 0.32 1.69 2.28 – – – – – 16.57 Mar. 31, 2014 11.47 0.41 (0.29) 0.14 2.73 2.99 – – – – – 14.46Mar. 31, 2013 10.83 0.46 (0.24) (0.02) 0.87 1.07 – – – – – 11.47
Advisor SeriesMar. 31, 2017 16.07 0.46 (0.33) 0.45 0.33 0.91 – – – – – 17.03Mar. 31, 2016 16.61 0.38 (0.35) 0.25 (0.91) (0.63) – – – – – 16.07Mar. 31, 2015 14.48 0.58 (0.31) 0.32 1.68 2.27 – – – – – 16.61 Mar. 31, 2014 11.47 0.42 (0.26) 0.14 2.84 3.14 – – – – – 14.48Mar. 31, 2013 10.83 0.38 (0.25) (0.01) 0.71 0.83 – – – – – 11.47
Series DMar. 31, 2017 16.63 0.48 (0.20) 0.47 0.38 1.13 – – – – – 17.78Mar. 31, 2016 17.05 0.39 (0.22) 0.26 (0.95) (0.52) – – – – – 16.63Mar. 31, 2015 14.74 0.61 (0.19) 0.33 1.75 2.50 – – – – – 17.05 Mar. 31, 2014 11.58 0.42 (0.16) 0.14 2.82 3.22 – – – – – 14.74Mar. 31, 2013 10.85 0.44 (0.15) (0.02) 0.83 1.10 – – – – – 11.58
Series FMar. 31, 2017 16.80 0.49 (0.16) 0.47 0.77 1.57 – – – – – 18.00Mar. 31, 2016 17.18 0.39 (0.18) 0.26 (0.95) (0.48) – – – – – 16.80Mar. 31, 2015 14.83 0.62 (0.16) 0.34 1.77 2.57 – – – – – 17.18 Mar. 31, 2014 11.63 0.43 (0.13) 0.15 2.86 3.31 – – – – – 14.83Mar. 31, 2013 10.86 0.52 (0.12) (0.02) 0.98 1.36 – – – – – 11.63
Series OMar. 31, 2017 17.52 0.51 (0.01) 0.50 0.62 1.62 – – – – – 18.95Mar. 31, 2016 17.74 0.40 (0.01) 0.27 (0.98) (0.32) – – – – – 17.52Mar. 31, 2015 15.16 0.63 (0.01) 0.35 1.81 2.78 – – – – – 17.74 Mar. 31, 2014 11.77 0.43 (0.01) 0.15 2.88 3.45 – – – – – 15.16Mar. 31, 2013 10.89 0.61 (0.01) (0.02) 1.14 1.72 – – – – – 11.77
1 Net assets and distributions are based on the actual number of mutual fund shares outstanding at the relevant time. The increase/decrease from operations is based on the weighted average number of mutual fund shares outstanding over the financial period. This table is not intended to be a reconciliation of beginning to ending net assets per mutual fund share.
2 Distributions are reinvested in additional mutual fund shares of the Fund or paid in cash.
157
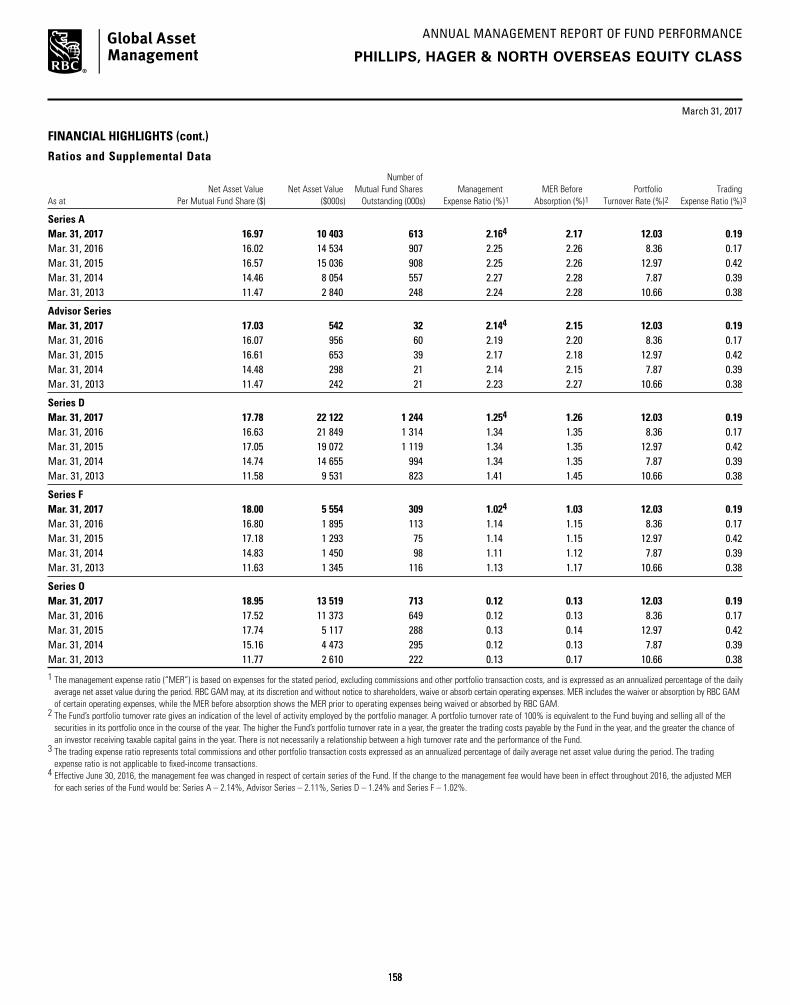
ANNUAL MANAGEMENT REPORT OF FUND PERFORMANCE
March 31, 2017
158
PHILLIPS, HAGER & NORTH OVERSEAS EQUITY CLASS
FINANCIAL HIGHLIGHTS (cont.)
Ratios and Supplemental Data
Number of Net Asset Value Net Asset Value Mutual Fund Shares Management MER Before Portfolio TradingAs at Per Mutual Fund Share ($) ($000s) Outstanding (000s) Expense Ratio (%)1 Absorption (%)1 Turnover Rate (%)2 Expense Ratio (%)3
Series AMar. 31, 2017 16.97 10 403 613 2.164 2.17 12.03 0.19Mar. 31, 2016 16.02 14 534 907 2.25 2.26 8.36 0.17Mar. 31, 2015 16.57 15 036 908 2.25 2.26 12.97 0.42 Mar. 31, 2014 14.46 8 054 557 2.27 2.28 7.87 0.39Mar. 31, 2013 11.47 2 840 248 2.24 2.28 10.66 0.38
Advisor SeriesMar. 31, 2017 17.03 542 32 2.144 2.15 12.03 0.19Mar. 31, 2016 16.07 956 60 2.19 2.20 8.36 0.17Mar. 31, 2015 16.61 653 39 2.17 2.18 12.97 0.42 Mar. 31, 2014 14.48 298 21 2.14 2.15 7.87 0.39Mar. 31, 2013 11.47 242 21 2.23 2.27 10.66 0.38
Series DMar. 31, 2017 17.78 22 122 1 244 1.254 1.26 12.03 0.19Mar. 31, 2016 16.63 21 849 1 314 1.34 1.35 8.36 0.17Mar. 31, 2015 17.05 19 072 1 119 1.34 1.35 12.97 0.42 Mar. 31, 2014 14.74 14 655 994 1.34 1.35 7.87 0.39Mar. 31, 2013 11.58 9 531 823 1.41 1.45 10.66 0.38
Series FMar. 31, 2017 18.00 5 554 309 1.024 1.03 12.03 0.19Mar. 31, 2016 16.80 1 895 113 1.14 1.15 8.36 0.17Mar. 31, 2015 17.18 1 293 75 1.14 1.15 12.97 0.42 Mar. 31, 2014 14.83 1 450 98 1.11 1.12 7.87 0.39Mar. 31, 2013 11.63 1 345 116 1.13 1.17 10.66 0.38
Series OMar. 31, 2017 18.95 13 519 713 0.12 0.13 12.03 0.19Mar. 31, 2016 17.52 11 373 649 0.12 0.13 8.36 0.17Mar. 31, 2015 17.74 5 117 288 0.13 0.14 12.97 0.42 Mar. 31, 2014 15.16 4 473 295 0.12 0.13 7.87 0.39Mar. 31, 2013 11.77 2 610 222 0.13 0.17 10.66 0.38
1 The management expense ratio (“MER”) is based on expenses for the stated period, excluding commissions and other portfolio transaction costs, and is expressed as an annualized percentage of the daily average net asset value during the period. RBC GAM may, at its discretion and without notice to shareholders, waive or absorb certain operating expenses. MER includes the waiver or absorption by RBC GAM of certain operating expenses, while the MER before absorption shows the MER prior to operating expenses being waived or absorbed by RBC GAM.
2 The Fund’s portfolio turnover rate gives an indication of the level of activity employed by the portfolio manager. A portfolio turnover rate of 100% is equivalent to the Fund buying and selling all of the securities in its portfolio once in the course of the year. The higher the Fund’s portfolio turnover rate in a year, the greater the trading costs payable by the Fund in the year, and the greater the chance of an investor receiving taxable capital gains in the year. There is not necessarily a relationship between a high turnover rate and the performance of the Fund.
3 The trading expense ratio represents total commissions and other portfolio transaction costs expressed as an annualized percentage of daily average net asset value during the period. The trading expense ratio is not applicable to fixed-income transactions.
4 Effective June 30, 2016, the management fee was changed in respect of certain series of the Fund. If the change to the management fee would have been in effect throughout 2016, the adjusted MER for each series of the Fund would be: Series A – 2.14%, Advisor Series – 2.11%, Series D – 1.24% and Series F – 1.02%.
158

ANNUAL MANAGEMENT REPORT OF FUND PERFORMANCE
159
March 31, 2017
FINANCIAL HIGHLIGHTS (cont.)
Management Fees RBC GAM is the manager and portfolio manager of the Fund. Management fees of each series of the Fund are calculated at the annual percentages, before GST/HST, of the daily net asset value of each series of the Fund. The breakdown of the services received in consideration of the management fees for each series, as a percentage of the management fees, is as follows:
Breakdown of Services
Management Fees Distribution Other*
Series A 1.75% 54% 46% Advisor Series 1.75% 54% 46% Series D 1.00% 23% 77%Series F 0.75% – 100%
Series O – no management fees are paid by the Fund with respect to Series O mutual fund shares. Series O shareholders pay a negotiated fee directly to RBC GAM for investment-counselling services.* Includes all costs related to management, investment advisory services, general administration
and profit.
PAST PERFORMANCEThe performance information shown assumes that all distributions made by the Fund in the periods shown were reinvested in additional shares of the Fund and would be lower if distributions were not reinvested. The performance information does not take into account sales, redemption, distribution, optional charges or income taxes payable that would have reduced returns or performance. Past performance does not necessarily indicate how the Fund may perform in the future. A fund with more than 10 years of performance history is only permitted to disclose the past 10 years.
Year-by-Year Returns (%) The bar chart indicates the Fund’s performance for each of the years shown, and illustrates how the Fund’s performance has changed from year to year. The bar chart shows, in percentage terms, how much an investment made on the first day of each financial year would have grown or decreased by the end of the financial year.
PHILLIPS, HAGER & NORTH OVERSEAS EQUITY CLASS
159

ANNUAL MANAGEMENT REPORT OF FUND PERFORMANCE
March 31, 2017
160
PHILLIPS, HAGER & NORTH OVERSEAS EQUITY CLASS
PAST PERFORMANCE (cont.)Annual Compound Returns (%) The table shows the annual compound returns for each series of the Fund and for each of the periods indicated ended on March 31, 2017, compared with the following benchmark:
MSCI EAFE Total Return Net Index (CAD)
Past Past Past Past Since Year 3 Years 5 Years 10 Years Inception
Series A 6.0 5.5 9.4 – 10.6Benchmark 15.1 7.0 12.1 – 13.3
Advisor Series 6.0 5.6 9.5 – 10.7Benchmark 15.1 7.0 12.1 – 13.3
Series D 6.9 6.4 10.4 – 11.6Benchmark 15.1 7.0 12.1 – 13.3
Series F 7.1 6.7 10.6 – 11.8Benchmark 15.1 7.0 12.1 – 13.3
Series O 8.1 7.7 11.7 – 12.9Benchmark 15.1 7.0 12.1 – 13.3
The returns of each series may vary because of differences in management fees and expenses. The Benchmark index returns do not include any costs of investing. See Management Discussion of Fund Performance for a discussion of performance relative to the Benchmark index.
Series A, Advisor Series, Series D, Series F and Series O mutual fund shares have been available for sale to shareholders since January 1, 2012.
Inception dates are not provided for series that have been in existence for more than 10 years.
All outstanding Series H mutual fund shares were re-designated as Series A mutual fund shares and all outstanding Series I mutual fund shares were re-designated as Series F mutual fund shares effective June 30, 2016.
INDEX DESCRIPTIONMSCI EAFE Total Return Net Index (CAD) This index is a broad measure of the Canadian dollar performance of stocks from developed equity markets covering countries in Europe, Australasia and the Far East. The net total return index reinvests dividends after the deduction of withholding taxes, using (for international indexes) a tax rate applicable to non-resident institutional investors who do not benefit from double taxation treaties.
SUMMARY OF INVESTMENT PORTFOLIO(after consideration of derivative products, if any)As at March 31, 2017
Investment Mix – Sectors % of Net Asset Value
Financials 22.5Industrials 18.0Consumer Discretionary 16.0Consumer Staples 11.4Information Technology 9.2Health Care 8.2Energy 5.9Materials 4.8Telecommunication Services 2.1Utilities 1.5Cash/Other 0.4
Investment Mix – Countries/Regions % of Net Asset Value
Europe ex. United Kingdom Equities 42.9Japan Equities 19.9Pacific ex. Japan Equities 15.9United Kingdom Equities 12.0India Equities 4.4Middle East & Africa Equities 4.3Cash/Other 0.6
160

ANNUAL MANAGEMENT REPORT OF FUND PERFORMANCE
161
March 31, 2017
PHILLIPS, HAGER & NORTH OVERSEAS EQUITY CLASS
SUMMARY OF INVESTMENT PORTFOLIO (cont.)(after consideration of derivative products, if any)As at March 31, 2017
Top 25 Holdings* % of Net Asset Value
Deutsche Post AG 4.7ASML Holding N.V. 4.6Taiwan Semiconductor Manufacturing Co. Ltd. ADR 4.6Pernod-Ricard S.A. 4.4Naspers Ltd. 4.3Nidec Corp. 4.3InterContinental Hotels Group Plc. 4.2Anheuser-Busch InBev S.A./N.V. 3.8AIA Group Ltd. 3.8Roche Holdings AG Genusscheine 3.7Kubota Corp. 3.2Oil Search Ltd. 3.2UBS Group AG 2.9Oriental Land Co. Ltd. 2.8St James’s Place Plc. 2.8Royal Dutch Shell Plc., B Shares 2.7Paddy Power Betfair Plc. 2.6Astellas Pharma Inc. 2.5ING Groep N.V. 2.5Komatsu Ltd. 2.5Lloyds TSB Group Plc. 2.4Partners Group Holding AG 2.2HDFC Bank Ltd. 2.2HDFC Bank Ltd. ADR 2.2Nippon Telegraph & Telephone Corp. 2.1Top 25 Holdings 81.2
* The Fund invests substantially all of its assets directly in the Phillips, Hager & North Overseas Equity Fund. The above are the Top 25 holdings of the Phillips, Hager & North Overseas Equity Fund.
The Summary of Investment Portfolio may change due to ongoing portfolio transactions of the Fund and a quarterly update is available at www.rbcgam.com/funds.
The Simplified Prospectus and other information about the underlying fund are available on SEDAR website at www.sedar.com.
161

ANNUAL MANAGEMENT REPORT OF FUND PERFORMANCE
162
INTERNATIONAL EQUITY FUND
RBC EUROPEAN EQUITY CLASS
March 31, 2017
Portfolio Manager RBC Global Asset Management Inc. (“RBC GAM”)
This annual management report of fund performance (“MRFP”) contains financial highlights but does not contain the complete annual financial statements of the Fund. You can get a copy of the financial statements at your request, and at no cost, by calling 1-800-463-FUND (3863), by writing to us at RBC Global Asset Management Inc., P.O. Box 7500, Station A, Toronto, Ontario M5W 1P9, or by visiting our website at www.rbcgam.com/reports or SEDAR at www.sedar.com. Security holders may also contact us using one of these methods to request a copy of the Fund’s proxy voting policies and procedures, proxy voting disclosure record, or quarterly portfolio disclosure.
The Board of Directors of RBC Corporate Class Inc. approved this annual management report of fund performance on May 11, 2017.
A Note on Forward-looking Statements
This report may contain forward-looking statements about the Fund, its future performance, strategies or prospects, and possible future Fund action. The words “may,” “could,” “should,” “would,” “suspect,” “outlook,” “believe,” “plan,” “anticipate,” “estimate,” “expect,” “intend,” “forecast,” “objective” and similar expressions are intended to identify forward-looking statements.
Forward-looking statements are not guarantees of future performance. Forward-looking statements involve inherent risks and uncertainties, both about the Fund and general economic factors, so it is possible that predictions, forecasts, projections and other forward-looking statements will not be achieved. We caution you not to place undue reliance on these statements as a number of important factors could cause actual events or results to differ materially from those expressed or implied in any forward-looking statement made in relation to the Fund. These factors include, but are not limited to, general economic, political and market factors in Canada, the United States and internationally, interest and foreign exchange rates, global equity and capital markets, business competition, technological changes, changes in laws and regulations, judicial or regulatory judgments, legal proceedings and catastrophic events.
The above list of important factors that may affect future results is not exhaustive. Before making any investment decisions, we encourage you to consider these and other factors carefully. All opinions contained in forward-looking statements are subject to change without notice and are provided in good faith but without legal responsibility.
162

ANNUAL MANAGEMENT REPORT OF FUND PERFORMANCE
163
March 31, 2017
MANAGEMENT DISCUSSION OF FUND PERFORMANCE
Investment Objective and StrategiesThe Fund seeks to provide long-term capital growth by investing primarily in European stocks in order to provide exposure to growth opportunities in the European economy and diversification benefits beyond North America.
To achieve its investment objective, the Fund invests most of its assets in the RBC European Equity Fund (the “underlying fund”). The portfolio manager of the underlying fund reviews the economic outlook for Europe and then selects stocks based on fundamental, technical and quantitative inputs. The underlying fund is managed to limit risk by spreading investments across different industries. The underlying fund may also invest in debt securities issued or guaranteed by European governments and international agencies.
RiskThere were no significant changes to the investment objective and strategies that affected the Fund’s overall level of risk during the reporting period. The risks of investing in the Fund and the suitability of the Fund for investors remain as discussed in the Simplified Prospectus.
Results of OperationsThe Fund’s net asset value fell to $30 million as of March 31, 2017, from $36 million as of March 31, 2016. The decrease was due to net redemptions.
Over the past year, the Fund’s Series A shares gained 1.0%, which underperformed the 13.2% rise in the benchmark. The Fund’s return is after the deduction of fees and expenses, while the benchmark and broad-based index returns do not include any costs of investing. See the Financial Highlights section for the management expense ratios and the Past Performance section for the returns of any other series, which may vary because of differences in management fees and expenses.
Politics in Europe dominated market discussions in the Eurozone and the U.K. during the period. Britons decided in June to leave the European Union (“Brexit”), and by the end of the period, Prime Minister Theresa May had formally started the two-year negotiating period for removing the U.K. from the single market. In the Netherlands, Dutch voters rejected the bid of a populist politician but investors also watched France for signs of populist strength in Europe. The European Central Bank maintained policies conducive to economic growth and faster inflation. Toward the end of the period, however, investors began to consider whether government spending would at least partially replace monetary policy as a more important driver of economic growth.
The negative impact of the Brexit vote on Europe’s equity markets was short-lived. Continued global growth and the election of Donald Trump as U.S. president late in 2016 were among the factors that extended the stock rally that lasted through the first quarter of 2017. Countries in the European equity benchmark posted gains with the exception of Denmark, which was hurt by the impact of a few large companies including Novo Nordisk.
Materials, Energy and Financials were the best-performing sectors, whereas Utilities, Real Estate and Telecommunication Services lagged, with the latter being the only sector to record an overall loss. The Fund’s underweight position in the Energy sector held back returns the most. On the positive side, a complete lack of holdings in the Real Estate sector aided the Fund’s returns. The stock that contributed the most to returns was ARM Holdings, the British semiconductor and software-design company that was taken over by SoftBank in July. The stock that had the most negative impact on returns was Novo Nordisk, which faces mounting competition in the market for diabetes drugs.
Recent DevelopmentsThe portfolio manager believes the rally in higher-risk companies is likely coming to an end. More generally, companies that benefit from domestic growth present investing opportunities where they have a tradition of stable or improving earnings growth and trade at attractive valuations.
In the view of the portfolio manager, investors will continue to pay less attention to politics as long as the outlook for corporate earnings and economic growth appears to be brightening. While the potential for political disruptions persists, particularly in France and Italy, the portfolio manager will retain a focus on the merits of individual companies.
On December 15, 2016, the Canadian government enacted new tax rules that eliminate the ability of investors to switch among different classes of RBC Corporate Class Funds on a tax-deferred basis. The new rules do not apply to switches between different series of the same fund.
Effective December 1, 2016, Mr. Lloyd R. McGinnis retired and Ms. Élaine Cousineau was appointed as Chair of the Independent Review Committee (the “IRC”). Mr. Charles F. Macfarlane was appointed as Vice Chair of the IRC. Effective January 1, 2017, Ms. Suromitra Sanatani and Ms. Catherine Kloepfer were appointed as members of the IRC.
Effective July 1, 2016, Deloitte LLP resigned and PricewaterhouseCoopers LLP was appointed as auditors of the Fund.
RBC EUROPEAN EQUITY CLASS
163

ANNUAL MANAGEMENT REPORT OF FUND PERFORMANCE
164
March 31, 2017
RBC EUROPEAN EQUITY CLASS
Effective June 30, 2016, management fees were reduced as follows: from 1.85% to 1.75% in respect of Series A mutual fund shares and Advisor Series mutual fund shares. Also effective June 30, 2016, Series H mutual fund shares were closed to all investors, and Series I mutual funds shares were capped and no longer available for purchase by new investors.
Related-Party TransactionsManager and Portfolio ManagerRBC GAM is an indirect, wholly owned subsidiary of Royal Bank of Canada (“Royal Bank”) and is the manager and portfolio manager of the Fund. RBC GAM is responsible for the Fund’s day-to-day operations, provides investment advice and portfolio management services to the Fund and appoints distributors for the Fund. RBC GAM is paid a management fee by the Fund as compensation for its services. The Fund pays a fixed administration fee to RBC GAM, which, in turn, pays certain operating expenses of the Fund.
Affiliates of RBC GAM that provide services to the Fund in the course of their normal businesses are discussed below.
DistributorsRBC GAM, Royal Mutual Funds Inc., RBC Direct Investing Inc., RBC Dominion Securities Inc. and Phillips, Hager & North Investment Funds Ltd. are the principal distributors of, or distribute certain series of the mutual fund shares of, the Fund. Dealers receive an ongoing commission based on the total value of their clients’ Series A, Advisor Series and Series D mutual fund shares.
CustodianRBC Investor Services Trust (“RBC IS”) is the custodian and holds the assets of the Fund.
RegistrarsRoyal Bank, RBC IS and RBC GAM are the registrars of the Fund and keep records of who owns the mutual fund shares of the Fund.
Other Related-Party TransactionsPursuant to applicable securities legislation, the Fund relied on the standing instructions from the Independent Review Committee with respect to one or more of the following transactions:
Related-Party Trading Activities(a) trades in securities of Royal Bank;
(b) investments in the securities of issuers for which a related-party dealer acted as an underwriter during the distribution of such securities and the 60-day period following the conclusion of such distribution of the underwritten securities to the public;
(c) purchases of equity and debt securities from or sales of equity or debt securities to a related-party dealer, where it acted as principal; and
Inter-Fund Trading(d) purchases or sales of securities of an issuer from or to another
investment fund or managed account managed by RBC GAM.
The applicable standing instructions require that Related-Party Trading Activities and Inter-Fund Trading be conducted in accordance with RBC GAM policy and that RBC GAM advise the Independent Review Committee of a material breach of any standing instruction. RBC GAM policy requires that an investment decision in respect of Related-Party Trading Activities (i) is made free from any influence of Royal Bank or its associates or affiliates and without taking into account any consideration relevant to Royal Bank or its affiliates or associates, (ii) represents the business judgment of the portfolio manager, uninfluenced by considerations other than the best interests of the Fund, (iii) is in compliance with RBC GAM policies and procedures, and (iv) achieves a fair and reasonable result for the Fund. RBC GAM policy requires that an investment decision in respect of Inter-Fund Trading is in the best interests of each Fund.
164

ANNUAL MANAGEMENT REPORT OF FUND PERFORMANCE
March 31, 2017
165
RBC EUROPEAN EQUITY CLASS
FINANCIAL HIGHLIGHTS The following tables show selected key financial information about the Fund and are intended to help you understand the Fund’s financial performance for the past five years or for the periods since inception. This information is derived from the Fund’s audited annual financial statements. For financial years beginning on or after April 1, 2014, financial highlight information is derived from financial statements prepared in compliance with International Financial Reporting Standards (“IFRS”). For financial years prior to April 1, 2014, financial highlight information is derived from financial statements prepared in accordance with Canadian generally accepted accounting principles (“GAAP”). “Net Assets,” for the periods prior to April 1, 2014, are calculated in accordance with GAAP, and “Net Asset Value” is derived from the valuation method disclosed in the RBC Corporate Class Funds Annual Information Form and is used for transactional purposes (see Ratios and Supplemental Data). All other calculations for the purposes of this MRFP are made using Net Asset Value. There is no significant difference between “Net Assets” and “Net Asset Value” under IFRS.
Change in Net Assets Per Mutual Fund Share ($)
Annual Distributions2
Increase (Decrease) from Operations1 From Total Realized Unrealized Income From Net Assets For the Year/ Net Assets Revenue Total Gains Gains (Excluding From Capital Return End of Period Ended Beginning of Year/Period (Loss) Expenses (Losses) (Losses) Total Dividends) Dividends Gains of Capital Total Year/Period
Series AMar. 31, 2017 10.42 0.19 (0.22) (0.25) 0.23 (0.05) – – – – – 10.52 Mar. 31, 2016 10.36 0.75 (0.24) (0.15) (1.71) (1.35) – – – – – 10.42Mar. 31, 20153 10.00† – (0.04) – 0.06 0.02 – – – – – 10.36
Advisor SeriesMar. 31, 2017 10.42 0.20 (0.22) (0.27) 0.70 0.41 – – – – – 10.52Mar. 31, 2016 10.37 0.45 (0.24) (0.09) (1.02) (0.90) – – – – – 10.42Mar. 31, 20153 10.00† – (0.04) – 0.10 0.06 – – – – – 10.37
Series DMar. 31, 2017 10.53 0.20 (0.13) (0.26) 0.49 0.30 – – – – – 10.73Mar. 31, 2016 10.38 0.79 (0.14) (0.15) (1.80) (1.30) – – – – – 10.53Mar. 31, 20153 10.00† – (0.02) – 0.08 0.06 – – – – – 10.38
Series FMar. 31, 2017 10.57 0.19 (0.10) (0.26) 0.18 0.01 – – – – – 10.80Mar. 31, 2016 10.39 0.32 (0.11) (0.06) (0.73) (0.58) – – – – – 10.57Mar. 31, 20153 10.00† – (0.02) – 0.08 0.06 – – – – – 10.39
Series IMar. 31, 2017 10.60 0.19 (0.08) (0.26) 0.11 (0.04) – – – – – 10.85Mar. 31, 2016 10.39 0.24 (0.08) (0.05) (0.55) (0.44) – – – – – 10.60Mar. 31, 20153 10.00† – (0.01) – 0.19 0.18 – – – – – 10.39
Series OMar. 31, 2017 10.69 0.20 – (0.27) 0.41 0.34 – – – – – 11.03Mar. 31, 2016 10.40 1.98 (0.01) (0.38) (4.52) (2.93) – – – – – 10.69Mar. 31, 20153 10.00† – – – 0.19 0.19 – – – – – 10.40
1 Net assets and distributions are based on the actual number of mutual fund shares outstanding at the relevant time. The increase/decrease from operations is based on the weighted average number of mutual fund shares outstanding over the financial period. This table is not intended to be a reconciliation of beginning to ending net assets per mutual fund share.
2 Distributions are reinvested in additional mutual fund shares of the Fund or paid in cash.3 From October 16, 2014.† Initial offering net asset value per mutual fund share.
165

ANNUAL MANAGEMENT REPORT OF FUND PERFORMANCE
March 31, 2017
166
RBC EUROPEAN EQUITY CLASS
FINANCIAL HIGHLIGHTS (cont.)
Ratios and Supplemental Data
Number of Net Asset Value Net Asset Value Mutual Fund Shares Management MER Before Portfolio TradingAs at Per Mutual Fund Share ($) ($000s) Outstanding (000s) Expense Ratio (%)1 Absorption (%)1 Turnover Rate (%)2 Expense Ratio (%)3
Series AMar. 31, 2017 10.52 1 666 158 2.154 2.16 33.80 0.27Mar. 31, 2016 10.42 3 437 330 2.24 2.25 13.36 0.18Mar. 31, 20155 10.36 799 77 2.27 2.27 0.46 0.43
Advisor SeriesMar. 31, 2017 10.52 1 816 173 2.154 2.16 33.80 0.27Mar. 31, 2016 10.42 767 74 2.28 2.29 13.36 0.18Mar. 31, 20155 10.37 11 1 2.27 2.27 0.46 0.43
Series DMar. 31, 2017 10.73 420 39 1.27 1.28 33.80 0.27Mar. 31, 2016 10.53 422 40 1.29 1.30 13.36 0.18Mar. 31, 20155 10.38 69 7 1.31 1.31 0.46 0.43
Series FMar. 31, 2017 10.80 10 814 1 001 0.97 0.98 33.80 0.27Mar. 31, 2016 10.57 9 833 930 0.99 1.00 13.36 0.18Mar. 31, 20155 10.39 103 10 1.03 1.03 0.46 0.43
Series IMar. 31, 2017 10.85 15 086 1 390 0.80 0.81 33.80 0.27Mar. 31, 2016 10.60 21 042 1 985 0.78 0.79 13.36 0.18Mar. 31, 20155 10.39 1 – 0.85 0.85 0.46 0.43
Series OMar. 31, 2017 11.03 1 – 0.05 0.06 33.80 0.27Mar. 31, 2016 10.69 1 – 0.03 0.04 13.36 0.18Mar. 31, 20155 10.40 150 14 0.05 0.05 0.46 0.43
1 The management expense ratio (“MER”) is based on expenses for the stated period, excluding commissions and other portfolio transaction costs, and is expressed as an annualized percentage of the daily average net asset value during the period. RBC GAM may, at its discretion and without notice to shareholders, waive or absorb certain operating expenses. MER includes the waiver or absorption by RBC GAM of certain operating expenses, while the MER before absorption shows the MER prior to operating expenses being waived or absorbed by RBC GAM.
2 The Fund’s portfolio turnover rate gives an indication of the level of activity employed by the portfolio manager. A portfolio turnover rate of 100% is equivalent to the Fund buying and selling all of the securities in its portfolio once in the course of the year. The higher the Fund’s portfolio turnover rate in a year, the greater the trading costs payable by the Fund in the year, and the greater the chance of an investor receiving taxable capital gains in the year. There is not necessarily a relationship between a high turnover rate and the performance of the Fund.
3 The trading expense ratio represents total commissions and other portfolio transaction costs expressed as an annualized percentage of daily average net asset value during the period. The trading expense ratio is not applicable to fixed-income transactions.
4 Effective June 30, 2016, the management fee was changed in respect of certain series of the Fund. If the change to the management fee would have been in effect throughout 2016, the adjusted MER for each series of the Fund would be: Series A – 2.12% and Advisor Series – 2.14%.
5 From October 16, 2014.
Management Fees RBC GAM is the manager and portfolio manager of the Fund. Management fees of each series of the Fund are calculated at the annual percentages, before GST/HST, of the daily net asset value of each series of the Fund. The breakdown of the services received in consideration of the management fees for each series, as a percentage of the management fees, is as follows:
Breakdown of Services
Management Fees Distribution Other*
Series A 1.75% 54% 46%Advisor Series 1.75% 54% 46%Series D 1.00% 25% 75%Series F 0.75% – 100%Series I 0.60% – 100%
Series O – no management fees are paid by the Fund with respect to Series O mutual fund shares. Series O shareholders pay a negotiated fee directly to RBC GAM for investment-counselling services.* Includes all costs related to management, investment advisory services, general administration
and profit.
166
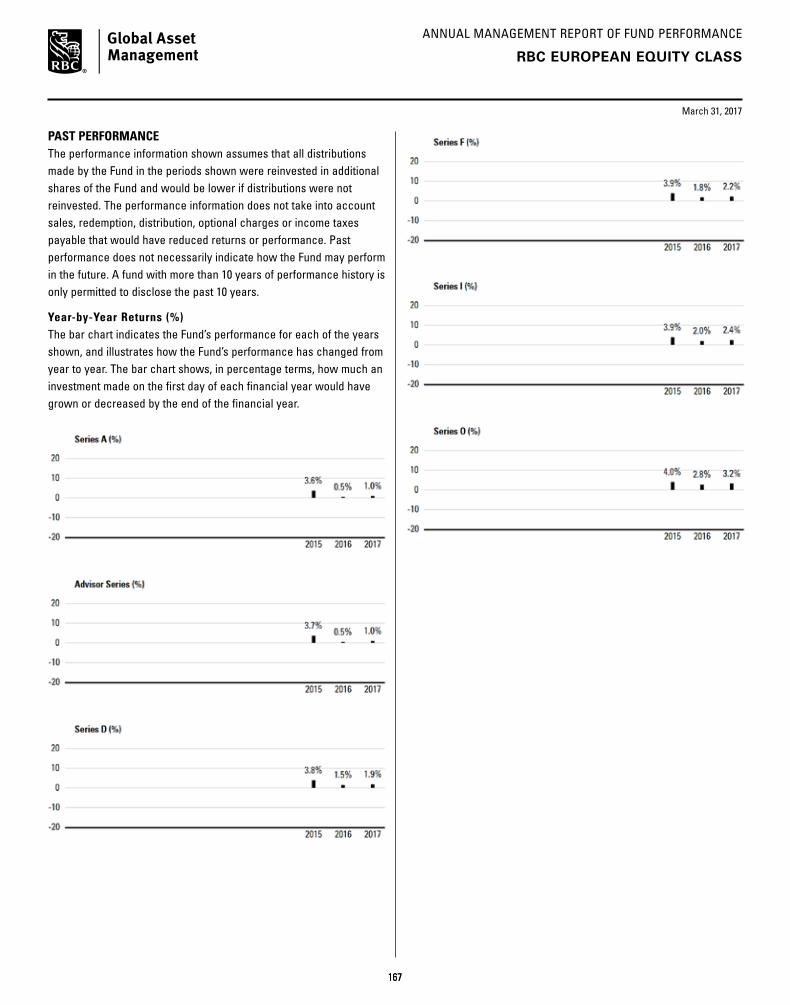
ANNUAL MANAGEMENT REPORT OF FUND PERFORMANCE
167
March 31, 2017
PAST PERFORMANCEThe performance information shown assumes that all distributions made by the Fund in the periods shown were reinvested in additional shares of the Fund and would be lower if distributions were not reinvested. The performance information does not take into account sales, redemption, distribution, optional charges or income taxes payable that would have reduced returns or performance. Past performance does not necessarily indicate how the Fund may perform in the future. A fund with more than 10 years of performance history is only permitted to disclose the past 10 years.
Year-by-Year Returns (%) The bar chart indicates the Fund’s performance for each of the years shown, and illustrates how the Fund’s performance has changed from year to year. The bar chart shows, in percentage terms, how much an investment made on the first day of each financial year would have grown or decreased by the end of the financial year.
RBC EUROPEAN EQUITY CLASS
167

ANNUAL MANAGEMENT REPORT OF FUND PERFORMANCE
168
March 31, 2017
PAST PERFORMANCE (cont.)Annual Compound Returns (%) The table shows the annual compound returns for each series of the Fund and for each of the periods indicated ended on March 31, 2017, compared with the following benchmark:
MSCI Europe Total Return Net Index (CAD)
Past Past Past Past Since Year 3 Years 5 Years 10 Years Inception
Series A 1.0 – – – 2.4Benchmark 13.2 – – – 13.1
Advisor Series 1.0 – – – 2.4Benchmark 13.2 – – – 13.1
Series D 1.9 – – – 3.3Benchmark 13.2 – – – 13.1
Series F 2.2 – – – 3.6Benchmark 13.2 – – – 13.1
Series I 2.4 – – – 3.8Benchmark 13.2 – – – 14.4
Series O 3.2 – – – 4.6Benchmark 13.2 – – – 13.1
The returns of each series may vary because of differences in management fees and expenses. The Benchmark index returns do not include any costs of investing. See Management Discussion of Fund Performance for a discussion of performance relative to the Benchmark index.
Series A, Advisor Series, Series D, Series F, Series I and Series O mutual fund shares have been available for sale to shareholders since January 26, 2015.
Inception dates are not provided for series that have been in existence for more than 10 years.
INDEX DESCRIPTIONMSCI Europe Total Return Net Index (CAD) This index is a broad measure of the Canadian dollar performance of major stock markets in Europe. The net total return index reinvests dividends after the deduction of withholding taxes, using (for international indexes) a tax rate applicable to non-resident institutional investors who do not benefit from double taxation treaties.
SUMMARY OF INVESTMENT PORTFOLIO(after consideration of derivative products, if any)As at March 31, 2017
Investment Mix % of Net Asset Value
United Kingdom 37.4Germany 12.2Switzerland 11.3Ireland 8.7Sweden 7.3Netherlands 6.8Denmark 6.4France 4.5Finland 2.9Italy 2.0Spain 0.2Cash/Other 0.3
Top 25 Holdings* % of Net Asset Value
Roche Holdings AG Genusscheine 5.2Unilever Plc. 4.9Relx N.V. 4.0Burberry Group Plc. 3.5Christian Dior SE 3.1Henkel KGaA, Preferred Non-Voting 3.0Diageo Plc. 3.0Royal Dutch Shell Plc., A Shares 2.9Sampo OYJ 2.9Schroders Plc. 2.8Sika AG 2.8Bayer AG 2.8Ryanair Holdings Plc. ADR 2.6Paddy Power Betfair Plc. 2.6Novo Nordisk A/S 2.6CRH Plc. 2.5Heineken N.V. 2.5Nordbanken Holding AB 2.4London Stock Exchange Group Plc. 2.4SAP SE 2.3Continental AG 2.2British American Tobacco Plc. 2.2Novozymes A/S 2.1Luxottica Group S.p.A. 2.0HSBC Holdings Plc. (U.K. Reg.) 1.9Top 25 Holdings 71.2
* The Fund invests substantially all of its assets directly in the RBC European Equity Fund. The above are the Top 25 holdings of the RBC European Equity Fund.
The Summary of Investment Portfolio may change due to ongoing portfolio transactions of the Fund and a quarterly update is available at www.rbcgam.com/funds.
The Simplified Prospectus and other information about the underlying fund are available on SEDAR website at www.sedar.com.
RBC EUROPEAN EQUITY CLASS
168

ANNUAL MANAGEMENT REPORT OF FUND PERFORMANCE
169
INTERNATIONAL EQUITY FUND
RBC EMERGING MARKETS EQUITY CLASS
March 31, 2017
Portfolio Manager RBC Global Asset Management Inc. (“RBC GAM”)
This annual management report of fund performance (“MRFP”) contains financial highlights but does not contain the complete annual financial statements of the Fund. You can get a copy of the financial statements at your request, and at no cost, by calling 1-800-463-FUND (3863), by writing to us at RBC Global Asset Management Inc., P.O. Box 7500, Station A, Toronto, Ontario M5W 1P9, or by visiting our website at www.rbcgam.com/reports or SEDAR at www.sedar.com. Security holders may also contact us using one of these methods to request a copy of the Fund’s proxy voting policies and procedures, proxy voting disclosure record, or quarterly portfolio disclosure.
The Board of Directors of RBC Corporate Class Inc. approved this annual management report of fund performance on May 11, 2017.
A Note on Forward-looking Statements
This report may contain forward-looking statements about the Fund, its future performance, strategies or prospects, and possible future Fund action. The words “may,” “could,” “should,” “would,” “suspect,” “outlook,” “believe,” “plan,” “anticipate,” “estimate,” “expect,” “intend,” “forecast,” “objective” and similar expressions are intended to identify forward-looking statements.
Forward-looking statements are not guarantees of future performance. Forward-looking statements involve inherent risks and uncertainties, both about the Fund and general economic factors, so it is possible that predictions, forecasts, projections and other forward-looking statements will not be achieved. We caution you not to place undue reliance on these statements as a number of important factors could cause actual events or results to differ materially from those expressed or implied in any forward-looking statement made in relation to the Fund. These factors include, but are not limited to, general economic, political and market factors in Canada, the United States and internationally, interest and foreign exchange rates, global equity and capital markets, business competition, technological changes, changes in laws and regulations, judicial or regulatory judgments, legal proceedings and catastrophic events.
The above list of important factors that may affect future results is not exhaustive. Before making any investment decisions, we encourage you to consider these and other factors carefully. All opinions contained in forward-looking statements are subject to change without notice and are provided in good faith but without legal responsibility.
169

ANNUAL MANAGEMENT REPORT OF FUND PERFORMANCE
March 31, 2017
170
MANAGEMENT DISCUSSION OF FUND PERFORMANCE
Investment Objective and StrategiesThe Fund seeks to provide long-term capital growth by investing primarily in equity securities of companies located in or active in emerging markets.
To achieve its investment objective, the Fund invests most of its assets in the RBC Emerging Markets Equity Fund (the “underlying fund”). The underlying fund invests in securities of companies located or active in emerging-market countries, including, but not limited to: China, Brazil, South Korea, Taiwan, India, South Africa, Russia, Mexico, Israel, Malaysia, Indonesia, Turkey, Chile, Thailand and Poland. The portfolio is diversified by sector and emerging-market country to help reduce risk. Individual stocks are selected based on the intrinsic value of each company, liquidity and overall portfolio risk.
RiskThere were no significant changes to the investment objective and strategies that affected the Fund’s overall level of risk during the reporting period. The risks of investing in the Fund and the suitability of the Fund for investors remain as discussed in the Simplified Prospectus.
Results of OperationsThe Fund’s net asset value rose to $102 million as of March 31, 2017, from $76 million as of March 31, 2016. The increase was due to a mix of investment returns and net inflows.
Over the past year, the Fund’s Series A shares gained 15.2%, which underperformed the 20.9% rise in the benchmark. The Fund’s return is after the deduction of fees and expenses, while the benchmark and broad-based index returns do not include any costs of investing. See the Financial Highlights section for the management expense ratios and the Past Performance section for the returns of any other series, which may vary because of differences in management fees and expenses.
After years of underperformance, emerging markets began the period on a positive note, reflecting an improving outlook for the global economy. However, the election of Donald Trump as U.S. president in November and, to a lesser extent, the U.K.’s decision to leave the EU in June, had a negative impact on emerging markets.
Trump’s victory led to concerns that his administration would seek to impose protectionist trade policies, and many emerging markets depend on exports to the U.S. for a significant portion of their trade. Another negative was the strength of the U.S. dollar versus emerging-market currencies, notably the Mexican peso. By the end of the period, conviction in the administration’s ability to impose trade sanctions had faded, aiding emerging-market equities. The U.S. Federal Reserve also appeared to be somewhat less certain about pressing ahead with interest-rate hikes, further bolstering the performance of emerging-market equities relative to developed markets.
The Fund’s underweight positon in the Energy sector had a significantly negative impact on returns, as did stock selection in the Information Technology sector. At the stock level, Dr. Reddy’s, an Indian pharmaceuticals company, had a notably negative impact on returns amid compliance questions at several manufacturing plants. Antofagasta, a London-based copper producer with mines in Chile, had a positive impact on the Fund’s returns, benefiting from rising metal prices.
Recent DevelopmentsSeveral factors should continue to support emerging-market equity performance over the medium term, in the opinion of the portfolio manager. First, emerging-market currencies are undervalued versus the U.S. dollar, and any appreciation in emerging-market currencies would be positive for emerging-market equities. Second, the earnings outlook for emerging markets relative to developed markets is improving, and relatively fast growth in emerging markets is a positive sign for their stock markets especially given improved productivity and economic reforms. Finally, valuations for emerging markets remain attractive relative to developed markets following the significant underperformance of emerging markets over the past six years.
On December 15, 2016, the Canadian government enacted new tax rules that eliminate the ability of investors to switch among different classes of RBC Corporate Class Funds on a tax-deferred basis. The new rules do not apply to switches between different series of the same fund.
Effective December 1, 2016, Mr. Lloyd R. McGinnis retired and Ms. Élaine Cousineau was appointed as Chair of the Independent Review Committee (the “IRC”). Mr. Charles F. Macfarlane was appointed as Vice Chair of the IRC. Effective January 1, 2017, Ms. Suromitra Sanatani and Ms. Catherine Kloepfer were appointed as members of the IRC.
Effective July 1, 2016, Deloitte LLP resigned and PricewaterhouseCoopers LLP was appointed as auditors of the Fund.
Effective June 30, 2016, Series H mutual fund shares and Series I mutual fund shares were closed to all investors.
Related-Party TransactionsManager and Portfolio ManagerRBC GAM is an indirect, wholly owned subsidiary of Royal Bank of Canada (“Royal Bank”) and is the manager and portfolio manager of the Fund. RBC GAM is responsible for the Fund’s day-to-day operations, provides investment advice and portfolio management services to the Fund and appoints distributors for the Fund. RBC GAM is paid a management fee by the Fund as compensation for its services. The Fund pays a fixed administration fee to RBC GAM, which, in turn, pays certain operating expenses of the Fund.
RBC EMERGING MARKETS EQUITY CLASS
170

ANNUAL MANAGEMENT REPORT OF FUND PERFORMANCE
March 31, 2017
171
RBC EMERGING MARKETS EQUITY CLASS
Affiliates of RBC GAM that provide services to the Fund in the course of their normal businesses are discussed below.
DistributorsRBC GAM, Royal Mutual Funds Inc., RBC Direct Investing Inc., RBC Dominion Securities Inc. and Phillips, Hager & North Investment Funds Ltd. are the principal distributors of, or distribute certain series of the mutual fund shares of, the Fund. Dealers receive an ongoing commission based on the total value of their clients’ Series A, Advisor Series and Series D mutual fund shares.
CustodianRBC Investor Services Trust (“RBC IS”) is the custodian and holds the assets of the Fund.
RegistrarsRoyal Bank, RBC IS and RBC GAM are the registrars of the Fund and keep records of who owns the mutual fund shares of the Fund.
Other Related-Party TransactionsPursuant to applicable securities legislation, the Fund relied on the standing instructions from the Independent Review Committee with respect to one or more of the following transactions:
Related-Party Trading Activities(a) trades in securities of Royal Bank;
(b) investments in the securities of issuers for which a related-party dealer acted as an underwriter during the distribution of such securities and the 60-day period following the conclusion of such distribution of the underwritten securities to the public;
(c) purchases of equity and debt securities from or sales of equity or debt securities to a related-party dealer, where it acted as principal; and
Inter-Fund Trading(d) purchases or sales of securities of an issuer from or to another
investment fund or managed account managed by RBC GAM.
The applicable standing instructions require that Related-Party Trading Activities and Inter-Fund Trading be conducted in accordance with RBC GAM policy and that RBC GAM advise the Independent Review Committee of a material breach of any standing instruction. RBC GAM policy requires that an investment decision in respect of Related-Party Trading Activities (i) is made free from any influence of Royal Bank or its associates or affiliates and without taking into account any consideration relevant to Royal Bank or its affiliates or associates, (ii) represents the business judgment of the portfolio manager, uninfluenced by considerations other than the best interests of the Fund, (iii) is in compliance with RBC GAM policies and procedures, and (iv) achieves a fair and reasonable result for the Fund. RBC GAM policy requires that an investment decision in respect of Inter-Fund Trading is in the best interests of each Fund.
171

ANNUAL MANAGEMENT REPORT OF FUND PERFORMANCE
March 31, 2017
172
FINANCIAL HIGHLIGHTS The following tables show selected key financial information about the Fund and are intended to help you understand the Fund’s financial performance for the past five years or for the periods since inception. This information is derived from the Fund’s audited annual financial statements. For financial years beginning on or after April 1, 2014, financial highlight information is derived from financial statements prepared in compliance with International Financial Reporting Standards (“IFRS”). For financial years prior to April 1, 2014, financial highlight information is derived from financial statements prepared in accordance with Canadian generally accepted accounting principles (“GAAP”). “Net Assets,” for the periods prior to April 1, 2014, are calculated in accordance with GAAP, and “Net Asset Value” is derived from the valuation method disclosed in the RBC Corporate Class Funds Annual Information Form and is used for transactional purposes (see Ratios and Supplemental Data). All other calculations for the purposes of this MRFP are made using Net Asset Value. There is no significant difference between “Net Assets” and “Net Asset Value” under IFRS.
Change in Net Assets Per Mutual Fund Share ($)
Annual Distributions2
Increase (Decrease) from Operations1 From Total Realized Unrealized Income From Net Assets For the Year/ Net Assets Revenue Total Gains Gains (Excluding From Capital Return End of Period Ended Beginning of Year/Period (Loss) Expenses (Losses) (Losses) Total Dividends) Dividends Gains of Capital Total Year/Period
Series AMar. 31, 2017 14.22 0.25 (0.33) 0.21 2.04 2.17 – – – – – 16.38 Mar. 31, 2016 15.52 0.42 (0.32) 0.18 (1.64) (1.36) – – – – – 14.22Mar. 31, 2015 12.61 0.28 (0.30) 0.17 2.79 2.94 – – – – – 15.52 Mar. 31, 2014 11.85 0.27 (0.26) 0.07 0.81 0.89 – – – – – 12.61Mar. 31, 2013 10.79 0.22 (0.24) 0.03 1.46 1.47 – – – – – 11.85
Advisor SeriesMar. 31, 2017 14.22 0.25 (0.33) 0.21 2.25 2.38 – – – – – 16.39Mar. 31, 2016 15.52 0.42 (0.32) 0.18 (1.64) (1.36) – – – – – 14.22Mar. 31, 2015 12.61 0.28 (0.30) 0.17 2.74 2.89 – – – – – 15.52 Mar. 31, 2014 11.86 0.26 (0.26) 0.07 0.80 0.87 – – – – – 12.61Mar. 31, 2013 10.79 0.19 (0.25) 0.02 1.23 1.19 – – – – – 11.86
Series DMar. 31, 2017 14.82 0.26 (0.19) 0.22 2.04 2.33 – – – – – 17.24Mar. 31, 2016 16.03 0.44 (0.19) 0.19 (1.71) (1.27) – – – – – 14.82Mar. 31, 2015 12.89 0.29 (0.17) 0.18 2.87 3.17 – – – – – 16.03 Mar. 31, 2014 12.00 0.28 (0.15) 0.08 0.84 1.05 – – – – – 12.89Mar. 31, 2013 10.81 0.22 (0.14) 0.03 1.43 1.54 – – – – – 12.00
Series FMar. 31, 2017 14.98 0.26 (0.16) 0.22 2.29 2.61 – – – – – 17.47Mar. 31, 2016 16.15 0.44 (0.15) 0.19 (1.70) (1.22) – – – – – 14.98Mar. 31, 2015 12.96 0.29 (0.14) 0.18 2.88 3.21 – – – – – 16.15 Mar. 31, 2014 12.03 0.26 (0.11) 0.07 0.81 1.03 – – – – – 12.96Mar. 31, 2013 10.83 0.23 (0.11) 0.03 1.52 1.67 – – – – – 12.03
Series OMar. 31, 2017 15.56 0.28 (0.01) 0.23 2.17 2.67 – – – – – 18.32Mar. 31, 2016 16.63 0.46 (0.01) 0.20 (1.78) (1.13) – – – – – 15.56Mar. 31, 2015 13.22 0.30 – 0.19 2.98 3.47 – – – – – 16.63 Mar. 31, 2014 12.16 0.28 (0.01) 0.08 0.85 1.20 – – – – – 13.22Mar. 31, 2013 10.84 0.24 (0.01) 0.03 1.58 1.84 – – – – – 12.16
1 Net assets and distributions are based on the actual number of mutual fund shares outstanding at the relevant time. The increase/decrease from operations is based on the weighted average number of mutual fund shares outstanding over the financial period. This table is not intended to be a reconciliation of beginning to ending net assets per mutual fund share.
2 Distributions are reinvested in additional mutual fund shares of the Fund or paid in cash.
RBC EMERGING MARKETS EQUITY CLASS
172

ANNUAL MANAGEMENT REPORT OF FUND PERFORMANCE
March 31, 2017
173
RBC EMERGING MARKETS EQUITY CLASS
FINANCIAL HIGHLIGHTS (cont.)
Ratios and Supplemental Data
Number of Net Asset Value Net Asset Value Mutual Fund Shares Management MER Before Portfolio TradingAs at Per Mutual Fund Share ($) ($000s) Outstanding (000s) Expense Ratio (%)1 Absorption (%)1 Turnover Rate (%)2 Expense Ratio (%)3
Series AMar. 31, 2017 16.38 7 198 439 2.45 2.45 11.05 0.16 Mar. 31, 2016 14.22 8 034 565 2.46 2.47 18.71 0.17Mar. 31, 2015 15.52 8 132 524 2.46 2.47 7.32 0.21Mar. 31, 2014 12.61 4 465 354 2.48 2.49 7.91 0.25Mar. 31, 2013 11.85 3 003 253 2.42 2.44 3.33 0.32
Advisor SeriesMar. 31, 2017 16.39 3 024 184 2.44 2.44 11.05 0.16Mar. 31, 2016 14.22 1 601 113 2.43 2.44 18.71 0.17Mar. 31, 2015 15.52 1 692 109 2.46 2.47 7.32 0.21Mar. 31, 2014 12.61 528 42 2.50 2.51 7.91 0.25Mar. 31, 2013 11.86 221 19 2.44 2.46 3.33 0.32
Series DMar. 31, 2017 17.24 2 279 132 1.50 1.50 11.05 0.16Mar. 31, 2016 14.82 1 630 110 1.51 1.52 18.71 0.17Mar. 31, 2015 16.03 1 703 106 1.50 1.51 7.32 0.21Mar. 31, 2014 12.89 821 64 1.50 1.51 7.91 0.25Mar. 31, 2013 12.00 944 79 1.49 1.51 3.33 0.32
Series FMar. 31, 2017 17.47 61 214 3 503 1.24 1.24 11.05 0.16Mar. 31, 2016 14.98 24 094 1 608 1.23 1.24 18.71 0.17Mar. 31, 2015 16.15 13 274 822 1.23 1.24 7.32 0.21Mar. 31, 2014 12.96 5 446 420 1.22 1.23 7.91 0.25Mar. 31, 2013 12.03 1 411 117 1.24 1.26 3.33 0.32
Series OMar. 31, 2017 18.32 28 470 1 554 0.31 0.31 11.05 0.16Mar. 31, 2016 15.56 31 144 2 001 0.31 0.32 18.71 0.17Mar. 31, 2015 16.63 33 929 2 041 0.31 0.32 7.32 0.21Mar. 31, 2014 13.22 24 555 1 857 0.31 0.32 7.91 0.25Mar. 31, 2013 12.16 20 358 1 674 0.32 0.34 3.33 0.32
1 The management expense ratio (“MER”) is based on expenses for the stated period, excluding commissions and other portfolio transaction costs, and is expressed as an annualized percentage of the daily average net asset value during the period. RBC GAM may, at its discretion and without notice to shareholders, waive or absorb certain operating expenses. MER includes the waiver or absorption by RBC GAM of certain operating expenses, while the MER before absorption shows the MER prior to operating expenses being waived or absorbed by RBC GAM.
2 The Fund’s portfolio turnover rate gives an indication of the level of activity employed by the portfolio manager. A portfolio turnover rate of 100% is equivalent to the Fund buying and selling all of the securities in its portfolio once in the course of the year. The higher the Fund’s portfolio turnover rate in a year, the greater the trading costs payable by the Fund in the year, and the greater the chance of an investor receiving taxable capital gains in the year. There is not necessarily a relationship between a high turnover rate and the performance of the Fund.
3 The trading expense ratio represents total commissions and other portfolio transaction costs expressed as an annualized percentage of daily average net asset value during the period. The trading expense ratio is not applicable to fixed-income transactions.
173

ANNUAL MANAGEMENT REPORT OF FUND PERFORMANCE
174
March 31, 2017
FINANCIAL HIGHLIGHTS (cont.)
Management Fees RBC GAM is the manager and portfolio manager of the Fund. Management fees of each series of the Fund are calculated at the annual percentages, before GST/HST, of the daily net asset value of each series of the Fund. The breakdown of the services received in consideration of the management fees for each series, as a percentage of the management fees, is as follows:
Breakdown of Services
Management Fees Distribution Other*
Series A 1.85% 54% 46% Advisor Series 1.85% 54% 46% Series D 1.00% 25% 75%Series F 0.75% – 100%
Series O – no management fees are paid by the Fund with respect to Series O mutual fund shares. Series O shareholders pay a negotiated fee directly to RBC GAM for investment-counselling services.* Includes all costs related to management, investment advisory services, general administration
and profit.
PAST PERFORMANCEThe performance information shown assumes that all distributions made by the Fund in the periods shown were reinvested in additional shares of the Fund and would be lower if distributions were not reinvested. The performance information does not take into account sales, redemption, distribution, optional charges or income taxes payable that would have reduced returns or performance. Past performance does not necessarily indicate how the Fund may perform in the future. A fund with more than 10 years of performance history is only permitted to disclose the past 10 years.
Year-by-Year Returns (%) The bar chart indicates the Fund’s performance for each of the years shown, and illustrates how the Fund’s performance has changed from year to year. The bar chart shows, in percentage terms, how much an investment made on the first day of each financial year would have grown or decreased by the end of the financial year.
RBC EMERGING MARKETS EQUITY CLASS
174

ANNUAL MANAGEMENT REPORT OF FUND PERFORMANCE
March 31, 2017
175
PAST PERFORMANCE (cont.)Annual Compound Returns (%) The table shows the annual compound returns for each series of the Fund and for each of the periods indicated ended on March 31, 2017, compared with the following benchmark:
MSCI Emerging Markets Total Return Net Index (CAD)
Past Past Past Past Since Year 3 Years 5 Years 10 Years Inception
Series A 15.2 9.1 8.7 – 9.9Benchmark 20.9 7.8 6.8 – 8.8
Advisor Series 15.2 9.1 8.7 – 9.9Benchmark 20.9 7.8 6.8 – 8.8
Series D 16.3 10.2 9.8 – 10.9Benchmark 20.9 7.8 6.8 – 8.8
Series F 16.6 10.5 10.0 – 11.2Benchmark 20.9 7.8 6.8 – 8.8
Series O 17.7 11.5 11.1 – 12.2Benchmark 20.9 7.8 6.8 – 8.8
The returns of each series may vary because of differences in management fees and expenses. The Benchmark index returns do not include any costs of investing. See Management Discussion of Fund Performance for a discussion of performance relative to the Benchmark index.
Series A, Advisor Series, Series D, Series F and Series O mutual fund shares have been available for sale to shareholders since January 1, 2012.
Inception dates are not provided for series that have been in existence for more than 10 years.
INDEX DESCRIPTIONMSCI Emerging Markets Total Return Net Index (CAD) This index is a broad measure of the Canadian dollar performance of emerging-market equities. As of May 2010, the index consisted of the following 21 emerging-market country indexes: Brazil, Chile, China, Colombia, Czech Republic, Egypt, Hungary, India, Indonesia, South Korea, Malaysia, Mexico, Morocco, Peru, Philippines, Poland, Russia, South Africa, Taiwan, Thailand and Turkey. The net total return index reinvests dividends after the deduction of withholding taxes, using (for international indexes) a tax rate applicable to non-resident institutional investors who do not benefit from double taxation treaties.
RBC EMERGING MARKETS EQUITY CLASS
SUMMARY OF INVESTMENT PORTFOLIO(after consideration of derivative products, if any)As at March 31, 2017
Investment Mix % of Net Asset Value
India 13.8China 13.2South Korea 10.9South Africa 10.8Taiwan 9.8Brazil 6.5Hong Kong 5.3Indonesia 3.1Thailand 3.0Philippines 2.9Peru 2.4Turkey 1.8Malaysia 1.4Chile 1.3Mexico 1.3Other Countries 9.9Cash/Other 2.6
175

ANNUAL MANAGEMENT REPORT OF FUND PERFORMANCE
176
March 31, 2017
RBC EMERGING MARKETS EQUITY CLASS
SUMMARY OF INVESTMENT PORTFOLIO (cont.)(after consideration of derivative products, if any)As at March 31, 2017
Top 25 Holdings* % of Net Asset Value
Housing Development Finance Corp. 4.9Samsung Electronics Co. Ltd. 4.8Naspers Ltd. 4.6Taiwan Semiconductor Manufacturing Co. Ltd. 4.2AIA Group Ltd. 3.3Dr. Reddy’s Laboratories Ltd. ADR 3.3Unilever Plc. 3.2Antofagasta Plc. 3.0SM Investments Corp. 2.9Banco Bradesco S.A. ADR 2.9Shinhan Financial Group Co. Ltd. 2.6Cash & Cash Equivalents 2.4Credicorp Ltd. 2.4China Mobile (Hong Kong) Ltd. 2.3Alibaba Group Holding Ltd. ADR 2.3Fuyao Glass Industry Group Co. Ltd. 2.3Delta Electronics Thailand PCL 2.1Mondi Ltd. 2.0Samsonite International S.A. 2.0Clicks Group Ltd. 1.9Standard Foods Corp. 1.9Infosys Technologies Ltd. ADR 1.9ENKA Insaat ve Sanayi A.S. 1.8FirstRand Ltd. 1.7Hangzhou Hikvision Digital Technology Co. Ltd. 1.7Top 25 Holdings 68.4
* The Fund invests substantially all of its assets directly in the RBC Emerging Markets Equity Fund. The above are the Top 25 holdings of the RBC Emerging Markets Equity Fund.
The Summary of Investment Portfolio may change due to ongoing portfolio transactions of the Fund and a quarterly update is available at www.rbcgam.com/funds.
The Simplified Prospectus and other information about the underlying fund are available on SEDAR website at www.sedar.com.
176
ANNUAL MANAGEMENT REPORT OF FUND PERFORMANCE
177
GLOBAL EQUITY FUND
RBC GLOBAL EQUITY CLASS
March 31, 2017
Portfolio Manager RBC Global Asset Management Inc. (“RBC GAM”)
This annual management report of fund performance (“MRFP”) contains financial highlights but does not contain the complete annual financial statements of the Fund. You can get a copy of the financial statements at your request, and at no cost, by calling 1-800-463-FUND (3863), by writing to us at RBC Global Asset Management Inc., P.O. Box 7500, Station A, Toronto, Ontario M5W 1P9, or by visiting our website at www.rbcgam.com/reports or SEDAR at www.sedar.com. Security holders may also contact us using one of these methods to request a copy of the Fund’s proxy voting policies and procedures, proxy voting disclosure record, or quarterly portfolio disclosure.
The Board of Directors of RBC Corporate Class Inc. approved this annual management report of fund performance on May 11, 2017.
A Note on Forward-looking Statements
This report may contain forward-looking statements about the Fund, its future performance, strategies or prospects, and possible future Fund action. The words “may,” “could,” “should,” “would,” “suspect,” “outlook,” “believe,” “plan,” “anticipate,” “estimate,” “expect,” “intend,” “forecast,” “objective” and similar expressions are intended to identify forward-looking statements.
Forward-looking statements are not guarantees of future performance. Forward-looking statements involve inherent risks and uncertainties, both about the Fund and general economic factors, so it is possible that predictions, forecasts, projections and other forward-looking statements will not be achieved. We caution you not to place undue reliance on these statements as a number of important factors could cause actual events or results to differ materially from those expressed or implied in any forward-looking statement made in relation to the Fund. These factors include, but are not limited to, general economic, political and market factors in Canada, the United States and internationally, interest and foreign exchange rates, global equity and capital markets, business competition, technological changes, changes in laws and regulations, judicial or regulatory judgments, legal proceedings and catastrophic events.
The above list of important factors that may affect future results is not exhaustive. Before making any investment decisions, we encourage you to consider these and other factors carefully. All opinions contained in forward-looking statements are subject to change without notice and are provided in good faith but without legal responsibility.
177

ANNUAL MANAGEMENT REPORT OF FUND PERFORMANCE
March 31, 2017
178
MANAGEMENT DISCUSSION OF FUND PERFORMANCE
Investment Objective and StrategiesThe Fund seeks to provide long-term capital growth by investing primarily in equity securities of a diversified mix of companies operating around the world and across a range of sectors.
To achieve its investment objective, the Fund invests most of its assets in the RBC Global Equity Fund (the “underlying fund”). The portfolio manager of the underlying fund uses primarily fundamental research to assess the economic outlook for regions around the world, including expected growth, market valuations and economic trends. The underlying fund may invest in American Depositary Receipts and may invest as much as 10% of its assets in units of other mutual funds managed by RBC GAM or an affiliate.
RiskThere were no significant changes to the investment objective and strategies that affected the Fund’s overall level of risk during the reporting period. The risks of investing in the Fund and the suitability of the Fund for investors remain as discussed in the Simplified Prospectus.
Results of OperationsThe Fund’s net asset value was unchanged at $4 million on March 31, 2017, from a year earlier.
Over the past year, the Fund’s Series A shares gained 13.1%, which underperformed the 18.3% rise in the benchmark. The Fund’s return is after the deduction of fees and expenses, while the benchmark and broad-based index returns do not include any costs of investing. See the Financial Highlights section for the management expense ratios and the Past Performance section for the returns of any other series, which may vary because of differences in management fees and expenses.
Political events had a significant impact on financial markets during the period. especially the U.K.’s decision in June to leave the European Union (“Brexit”) and the election in November of Donald Trump as U.S. president. A general agreement that Brexit would be negative for U.K. growth over the long term was more than offset by improvement in shorter-term global growth trends and the positive economic impact of a weaker British pound. Trump’s promises of lower taxes, financial reform and increased infrastructure spending resulted in a rally driven by the Energy, Financials and Materials sectors. Companies in these sectors do not usually fit the Fund’s investment criteria, and their absence was therefore negative for relative performance.
The Fund’s returns were held back most by Danish pharmaceutical company Novo Nordisk, which faces mounting competition in the market for diabetes drugs, and U.S. cosmetics company Estée Lauder, which lowered earnings forecasts as sales growth slowed. First Republic, a U.S. bank that focuses on wealthy clients, was the biggest positive for returns, and Amazon, the U.S. retailer, was the second-biggest contributor to returns. The Fund sold its stake in Novo Nordisk during the period.
Recent DevelopmentsThe stock market’s strong performance indicates that investors are anticipating good economic news, and there are some signs from the data that this view may be justified, in the opinion of the portfolio manager. While the growth outlook is improving, it is questionable whether such performance can continue. There are some obvious roadblocks ahead, including increasing doubts that the Trump administration will be able to legislate as radically or as quickly as initially thought; the fact that China must still grapple with loose monetary policy and the potential for a property bubble; and European political uncertainty following Brexit and Eurozone elections.
On December 15, 2016, the Canadian government enacted new tax rules that eliminate the ability of investors to switch among different classes of RBC Corporate Class Funds on a tax-deferred basis. The new rules do not apply to switches between different series of the same fund.
Effective December 1, 2016, Mr. Lloyd R. McGinnis retired and Ms. Élaine Cousineau was appointed as Chair of the Independent Review Committee (the “IRC”). Mr. Charles F. Macfarlane was appointed as Vice Chair of the IRC. Effective January 1, 2017, Ms. Suromitra Sanatani and Ms. Catherine Kloepfer were appointed as members of the IRC.
Effective July 1, 2016, Deloitte LLP resigned and PricewaterhouseCoopers LLP was appointed as auditors of the Fund.
Effective June 30, 2016, management fees were reduced as follows: from 1.85% to 1.75% in respect of Series A mutual fund shares and Advisor Series mutual fund shares; from 1.10% to 1.00% in respect of Series D mutual fund shares; and from 0.85% to 0.75% in respect of Series F mutual fund shares. Also effective June 30, 2016, Series H mutual fund shares and Series I mutual fund shares were closed to all investors.
RBC GLOBAL EQUITY CLASS
178

ANNUAL MANAGEMENT REPORT OF FUND PERFORMANCE
179
March 31, 2017
RBC GLOBAL EQUITY CLASS
Related-Party TransactionsManager and Portfolio ManagerRBC GAM is an indirect, wholly owned subsidiary of Royal Bank of Canada (“Royal Bank”) and is the manager and portfolio manager of the Fund. RBC GAM is responsible for the Fund’s day-to-day operations, provides investment advice and portfolio management services to the Fund and appoints distributors for the Fund. RBC GAM is paid a management fee by the Fund as compensation for its services. The Fund pays a fixed administration fee to RBC GAM, which, in turn, pays certain operating expenses of the Fund.
Affiliates of RBC GAM that provide services to the Fund in the course of their normal businesses are discussed below.
DistributorsRBC GAM, Royal Mutual Funds Inc., RBC Direct Investing Inc., RBC Dominion Securities Inc. and Phillips, Hager & North Investment Funds Ltd. are the principal distributors of, or distribute certain series of the mutual fund shares of, the Fund. Dealers receive an ongoing commission based on the total value of their clients’ Series A, Advisor Series and Series D mutual fund shares.
CustodianRBC Investor Services Trust (“RBC IS”) is the custodian and holds the assets of the Fund.
RegistrarsRoyal Bank, RBC IS and RBC GAM are the registrars of the Fund and keep records of who owns the mutual fund shares of the Fund.
Other Related-Party TransactionsPursuant to applicable securities legislation, the Fund relied on the standing instructions from the Independent Review Committee with respect to one or more of the following transactions:
Related-Party Trading Activities(a) trades in securities of Royal Bank;
(b) investments in the securities of issuers for which a related-party dealer acted as an underwriter during the distribution of such securities and the 60-day period following the conclusion of such distribution of the underwritten securities to the public;
(c) purchases of equity and debt securities from or sales of equity or debt securities to a related-party dealer, where it acted as principal; and
Inter-Fund Trading(d) purchases or sales of securities of an issuer from or to another
investment fund or managed account managed by RBC GAM.
The applicable standing instructions require that Related-Party Trading Activities and Inter-Fund Trading be conducted in accordance with RBC GAM policy and that RBC GAM advise the Independent Review Committee of a material breach of any standing instruction. RBC GAM policy requires that an investment decision in respect of Related-Party Trading Activities (i) is made free from any influence of Royal Bank or its associates or affiliates and without taking into account any consideration relevant to Royal Bank or its affiliates or associates, (ii) represents the business judgment of the portfolio manager, uninfluenced by considerations other than the best interests of the Fund, (iii) is in compliance with RBC GAM policies and procedures, and (iv) achieves a fair and reasonable result for the Fund. RBC GAM policy requires that an investment decision in respect of Inter-Fund Trading is in the best interests of each Fund.
179

ANNUAL MANAGEMENT REPORT OF FUND PERFORMANCE
March 31, 2017
180
RBC GLOBAL EQUITY CLASS
FINANCIAL HIGHLIGHTS The following tables show selected key financial information about the Fund and are intended to help you understand the Fund’s financial performance for the past five years or for the periods since inception. This information is derived from the Fund’s audited annual financial statements. For financial years beginning on or after April 1, 2014, financial highlight information is derived from financial statements prepared in compliance with International Financial Reporting Standards (“IFRS”). For financial years prior to April 1, 2014, financial highlight information is derived from financial statements prepared in accordance with Canadian generally accepted accounting principles (“GAAP”). “Net Assets,” for the periods prior to April 1, 2014, are calculated in accordance with GAAP, and “Net Asset Value” is derived from the valuation method disclosed in the RBC Corporate Class Funds Annual Information Form and is used for transactional purposes (see Ratios and Supplemental Data). All other calculations for the purposes of this MRFP are made using Net Asset Value. There is no significant difference between “Net Assets” and “Net Asset Value” under IFRS.
Change in Net Assets Per Mutual Fund Share ($)
Annual Distributions2
Increase (Decrease) from Operations1 From Total Realized Unrealized Income From Net Assets For the Year/ Net Assets Revenue Total Gains Gains (Excluding From Capital Return End of Period Ended Beginning of Year/Period (Loss) Expenses (Losses) (Losses) Total Dividends) Dividends Gains of Capital Total Year/Period
Series AMar. 31, 2017 10.21 0.19 (0.22) 0.05 1.24 1.26 – – – – – 11.54 Mar. 31, 2016 10.24 0.18 (0.22) 0.16 (0.77) (0.65) – – – – – 10.21Mar. 31, 20153 10.00† – (0.04) – 0.22 0.18 – – – – – 10.24
Advisor SeriesMar. 31, 2017 10.20 0.19 (0.23) 0.05 1.31 1.32 – – – – – 11.52Mar. 31, 2016 10.25 0.15 (0.23) 0.14 (0.65) (0.59) – – – – – 10.20Mar. 31, 20153 10.00† – (0.04) – 0.29 0.25 – – – – – 10.25
Series DMar. 31, 2017 10.30 0.19 (0.14) 0.05 1.41 1.51 – – – – – 11.73Mar. 31, 2016 10.26 0.15 (0.15) 0.14 (0.66) (0.52) – – – – – 10.30Mar. 31, 20153 10.00† – (0.03) – 0.19 0.16 – – – – – 10.26
Series FMar. 31, 2017 10.34 0.19 (0.11) 0.05 1.41 1.54 – – – – – 11.80Mar. 31, 2016 10.27 0.13 (0.12) 0.12 (0.56) (0.43) – – – – – 10.34Mar. 31, 20153 10.00† – (0.02) – 0.25 0.23 – – – – – 10.27
Series OMar. 31, 2017 10.46 0.19 – 0.05 1.37 1.61 – – – – – 12.07Mar. 31, 2016 10.28 0.23 – 0.21 (1.00) (0.56) – – – – – 10.46Mar. 31, 20153 10.00† – – – 0.32 0.32 – – – – – 10.28
1 Net assets and distributions are based on the actual number of mutual fund shares outstanding at the relevant time. The increase/decrease from operations is based on the weighted average number of mutual fund shares outstanding over the financial period. This table is not intended to be a reconciliation of beginning to ending net assets per mutual fund share.
2 Distributions are reinvested in additional mutual fund shares of the Fund or paid in cash.3 From October 16, 2014.† Initial offering net asset value per mutual fund share.
180

ANNUAL MANAGEMENT REPORT OF FUND PERFORMANCE
March 31, 2017
181
RBC GLOBAL EQUITY CLASS
FINANCIAL HIGHLIGHTS (cont.)
Ratios and Supplemental Data
Number of Net Asset Value Net Asset Value Mutual Fund Shares Management MER Before Portfolio TradingAs at Per Mutual Fund Share ($) ($000s) Outstanding (000s) Expense Ratio (%)1 Absorption (%)1 Turnover Rate (%)2 Expense Ratio (%)3
Series AMar. 31, 2017 11.54 780 68 2.034 2.10 17.93 0.20Mar. 31, 2016 10.21 743 73 2.14 2.26 27.21 0.25Mar. 31, 20155 10.24 583 57 2.25 2.25 – 0.24
Advisor SeriesMar. 31, 2017 11.52 535 46 2.134 2.20 17.93 0.20Mar. 31, 2016 10.20 513 50 2.26 2.38 27.21 0.25Mar. 31, 20155 10.25 12 1 2.27 2.27 – 0.24
Series DMar. 31, 2017 11.73 775 66 1.294 1.36 17.93 0.20Mar. 31, 2016 10.30 562 55 1.41 1.53 27.21 0.25Mar. 31, 20155 10.26 85 8 1.42 1.42 – 0.24
Series FMar. 31, 2017 11.80 1 772 150 1.034 1.10 17.93 0.20Mar. 31, 2016 10.34 556 54 1.12 1.24 27.21 0.25Mar. 31, 20155 10.27 38 4 1.14 1.14 – 0.24
Series OMar. 31, 2017 12.07 1 – 0.05 0.12 17.93 0.20Mar. 31, 2016 10.46 1 – 0.06 0.18 27.21 0.25Mar. 31, 20155 10.28 148 14 0.05 0.05 – 0.24
1 The management expense ratio (“MER”) is based on expenses for the stated period, excluding commissions and other portfolio transaction costs, and is expressed as an annualized percentage of the daily average net asset value during the period. RBC GAM may, at its discretion and without notice to shareholders, waive or absorb certain operating expenses. MER includes the waiver or absorption by RBC GAM of certain operating expenses, while the MER before absorption shows the MER prior to operating expenses being waived or absorbed by RBC GAM.
2 The Fund’s portfolio turnover rate gives an indication of the level of activity employed by the portfolio manager. A portfolio turnover rate of 100% is equivalent to the Fund buying and selling all of the securities in its portfolio once in the course of the year. The higher the Fund’s portfolio turnover rate in a year, the greater the trading costs payable by the Fund in the year, and the greater the chance of an investor receiving taxable capital gains in the year. There is not necessarily a relationship between a high turnover rate and the performance of the Fund.
3 The trading expense ratio represents total commissions and other portfolio transaction costs expressed as an annualized percentage of daily average net asset value during the period. The trading expense ratio is not applicable to fixed-income transactions.
4 Effective June 30, 2016, the management fee was changed in respect of certain series of the Fund. If the change to the management fee would have been in effect throughout 2016, the adjusted MER for each series of the Fund would be: Series A – 2.01%, Advisor Series – 2.11%, Series D – 1.27% and Series F – 1.02%.
5 From October 16, 2014.
Management Fees RBC GAM is the manager and portfolio manager of the Fund. Management fees of each series of the Fund are calculated at the annual percentages, before GST/HST, of the daily net asset value of each series of the Fund. The breakdown of the services received in consideration of the management fees for each series, as a percentage of the management fees, is as follows:
Breakdown of Services
Management Fees Distribution Other*
Series A 1.75% 54% 46%Advisor Series 1.75% 54% 46%Series D 1.00% 23% 77%Series F 0.75% – 100%
Series O – no management fees are paid by the Fund with respect to Series O mutual fund shares. Series O shareholders pay a negotiated fee directly to RBC GAM for investment-counselling services.* Includes all costs related to management, investment advisory services, general administration
and profit.
181

ANNUAL MANAGEMENT REPORT OF FUND PERFORMANCE
182
March 31, 2017
Annual Compound Returns (%) The table shows the annual compound returns for each series of the Fund and for each of the periods indicated ended on March 31, 2017, compared with the following benchmark:
MSCI World Total Return Net Index (CAD)
Past Past Past Past Since Year 3 Years 5 Years 10 Years Inception
Series A 13.1 – – – 6.8Benchmark 18.3 – – – 9.4
Advisor Series 13.0 – – – 6.7Benchmark 18.3 – – – 9.4
Series D 13.9 – – – 7.6Benchmark 18.3 – – – 9.4
Series F 14.2 – – – 7.9Benchmark 18.3 – – – 9.4
Series O 15.3 – – – 9.0Benchmark 18.3 – – – 9.4
The returns of each series may vary because of differences in management fees and expenses. The Benchmark index returns do not include any costs of investing. See Management Discussion of Fund Performance for a discussion of performance relative to the Benchmark index.
Series A, Advisor Series, Series D, Series F and Series O mutual fund shares have been available for sale to shareholders since January 26, 2015.
Inception dates are not provided for series that have been in existence for more than 10 years.
INDEX DESCRIPTIONMSCI World Total Return Net Index (CAD) This index is the capitalization-weighted index measuring the Canadian dollar performance of selected companies listed on stock exchanges in countries around the world. The net total return index reinvests dividends after the deduction of withholding taxes, using (for international indexes) a tax rate applicable to non-resident institutional investors who do not benefit from double taxation treaties.
PAST PERFORMANCEThe performance information shown assumes that all distributions made by the Fund in the periods shown were reinvested in additional shares of the Fund and would be lower if distributions were not reinvested. The performance information does not take into account sales, redemption, distribution, optional charges or income taxes payable that would have reduced returns or performance. Past performance does not necessarily indicate how the Fund may perform in the future. A fund with more than 10 years of performance history is only permitted to disclose the past 10 years.
Year-by-Year Returns (%) The bar chart indicates the Fund’s performance for each of the years shown, and illustrates how the Fund’s performance has changed from year to year. The bar chart shows, in percentage terms, how much an investment made on the first day of each financial year would have grown or decreased by the end of the financial year.
RBC GLOBAL EQUITY CLASS
182

ANNUAL MANAGEMENT REPORT OF FUND PERFORMANCE
183
March 31, 2017
RBC GLOBAL EQUITY CLASS
SUMMARY OF INVESTMENT PORTFOLIO(after consideration of derivative products, if any)As at March 31, 2017
Investment Mix % of Net Asset Value
United States 57.8Japan 5.9Netherlands 4.3United Kingdom 4.1Switzerland 3.6France 3.5Taiwan 3.2South Africa 2.7India 2.6Germany 2.5Belgium 2.3Other Countries 6.6Cash/Other 0.9
Top 25 Holdings* % of Net Asset Value
UnitedHealth Group Incorporated 3.6Alphabet Inc., Class A 3.5Danaher Corp. 3.3Amazon.com, Inc. 3.3Taiwan Semiconductor Manufacturing Co. Ltd. ADR 3.2EOG Resources Inc. 3.1First Republic Bank 3.1Intuit Inc. 3.1TJX Companies Inc. 3.0Estée Lauder Companies Inc., Class A 3.0Activision Blizzard Inc. 2.9ASML Holding N.V. 2.8Fortive Corp. 2.7Naspers Ltd. 2.7InterContinental Hotels Group Plc. 2.6Gartner Inc. 2.6Deutsche Post AG 2.5Pernod-Ricard S.A. 2.4Blackstone Group LP 2.4SVB Financial Group 2.3Anheuser-Busch InBev S.A./N.V. 2.3Roche Holdings AG Genusscheine 2.3Nidec Corp. 2.1CF Industries Holdings Inc. 1.9Sempra Energy 1.8Top 25 Holdings 68.5
* The Fund invests substantially all of its assets directly in the RBC Global Equity Fund. The above are the Top 25 holdings of the RBC Global Equity Fund.
The Summary of Investment Portfolio may change due to ongoing portfolio transactions of the Fund and a quarterly update is available at www.rbcgam.com/funds.
The Simplified Prospectus and other information about the underlying fund are available on SEDAR website at www.sedar.com.
183
ANNUAL MANAGEMENT REPORT OF FUND PERFORMANCE
184
GLOBAL EQUITY FUND
RBC QUBE LOW VOLATILITY GLOBAL EQUITY CLASS
March 31, 2017
Portfolio Manager RBC Global Asset Management Inc. (“RBC GAM”)
This annual management report of fund performance (“MRFP”) contains financial highlights but does not contain the complete annual financial statements of the Fund. You can get a copy of the financial statements at your request, and at no cost, by calling 1-800-463-FUND (3863), by writing to us at RBC Global Asset Management Inc., P.O. Box 7500, Station A, Toronto, Ontario M5W 1P9, or by visiting our website at www.rbcgam.com/reports or SEDAR at www.sedar.com. Security holders may also contact us using one of these methods to request a copy of the Fund’s proxy voting policies and procedures, proxy voting disclosure record, or quarterly portfolio disclosure.
The Board of Directors of RBC Corporate Class Inc. approved this annual management report of fund performance on May 11, 2017.
A Note on Forward-looking Statements
This report may contain forward-looking statements about the Fund, its future performance, strategies or prospects, and possible future Fund action. The words “may,” “could,” “should,” “would,” “suspect,” “outlook,” “believe,” “plan,” “anticipate,” “estimate,” “expect,” “intend,” “forecast,” “objective” and similar expressions are intended to identify forward-looking statements.
Forward-looking statements are not guarantees of future performance. Forward-looking statements involve inherent risks and uncertainties, both about the Fund and general economic factors, so it is possible that predictions, forecasts, projections and other forward-looking statements will not be achieved. We caution you not to place undue reliance on these statements as a number of important factors could cause actual events or results to differ materially from those expressed or implied in any forward-looking statement made in relation to the Fund. These factors include, but are not limited to, general economic, political and market factors in Canada, the United States and internationally, interest and foreign exchange rates, global equity and capital markets, business competition, technological changes, changes in laws and regulations, judicial or regulatory judgments, legal proceedings and catastrophic events.
The above list of important factors that may affect future results is not exhaustive. Before making any investment decisions, we encourage you to consider these and other factors carefully. All opinions contained in forward-looking statements are subject to change without notice and are provided in good faith but without legal responsibility.
184

ANNUAL MANAGEMENT REPORT OF FUND PERFORMANCE
185
March 31, 2017
MANAGEMENT DISCUSSION OF FUND PERFORMANCE
Investment Objective and StrategiesThe Fund seeks to provide long-term capital growth by investing primarily in equity securities of global companies. The Fund uses a quantitative approach and seeks to achieve a reduced level of volatility of returns compared with the broader global equity market.
To achieve its investment objective, the Fund invests most of its assets in the RBC QUBE Low Volatility Global Equity Fund (the “underlying fund”). The underlying fund is managed using a quantitative investment model designed to select individual stocks while controlling portfolio-level risk. This involves building a portfolio that maximizes exposure to factors associated with outperformance, while controlling for exposure to risk factors. The portfolio manager of the underlying fund will diversify across industries within the global market.
RiskThere were no significant changes to the investment objective and strategies that affected the Fund’s overall level of risk during the reporting period. The risks of investing in the Fund and the suitability of the Fund for investors remain as discussed in the Simplified Prospectus.
Results of OperationsThe Fund’s net asset value rose to $48 million as of March 31, 2017, from $30 million as of March 31, 2016. The increase was due mainly to net inflows.
Over the past year, the Fund’s Series A shares gained 9.1%, which underperformed the 18.3% rise in the benchmark. The Fund’s return is after the deduction of fees and expenses, while the benchmark and broad-based index returns do not include any costs of investing. See the Financial Highlights section for the management expense ratios and the Past Performance section for the returns of any other series, which may vary because of differences in management fees and expenses.
Global stock markets rose in 2016, with the gains accelerating late in the year and into 2017 after Donald Trump won the U.S. presidency. Trump’s election led to optimism that he would be able to enact tax cuts, fiscal spending and economic deregulation.
Holdings in the Financials sector that aided the Fund’s returns included Mizrahi-Tefahot Bank and Toronto-Dominion. Banks were boosted by hopes that rising interest rates would lead to higher profits from lending. The Health Care sector also contributed to the Fund’s returns, as did holdings in pharmaceuticals companies.
Returns were hurt by a lack of exposure to the Information Technology and Consumer Discretionary sectors. Meagre allocations to Apple and Amazon also detracted from performance. The Materials sector also weighed heavily against performance. A position in Randgold Resources was the biggest detractor.
Recent DevelopmentsThe economic outlook has improved globally, in the view of the portfolio manager. Positive economic data has supported heightened consumer and business confidence, and investors have focused on the potential for a shift from monetary stimulus to fiscal stimulus. However, central banks other than the U.S. Federal Reserve are continuing to rely on monetary stimulus until there is evidence that fiscal spending is ready to take over.
On December 15, 2016, the Canadian government enacted new tax rules that eliminate the ability of investors to switch among different classes of RBC Corporate Class Funds on a tax-deferred basis. The new rules do not apply to switches between different series of the same fund.
Effective December 1, 2016, Mr. Lloyd R. McGinnis retired and Ms. Élaine Cousineau was appointed as Chair of the Independent Review Committee (the “IRC”). Mr. Charles F. Macfarlane was appointed as Vice Chair of the IRC. Effective January 1, 2017, Ms. Suromitra Sanatani and Ms. Catherine Kloepfer were appointed as members of the IRC.
Effective July 1, 2016, Deloitte LLP resigned and PricewaterhouseCoopers LLP was appointed as auditors of the Fund.
Effective June 30, 2016, management fees were reduced as follows: from 1.85% to 1.75% in respect of Series A mutual fund shares and Advisor Series mutual fund shares; from 1.10% to 1.00% in respect of Series D mutual fund shares; and from 0.85% to 0.75% in respect of Series F mutual fund shares. Also effective June 30, 2016, Series H mutual fund shares and Series I mutual fund shares were closed to all investors.
Related-Party TransactionsManager and Portfolio ManagerRBC GAM is an indirect, wholly owned subsidiary of Royal Bank of Canada (“Royal Bank”) and is the manager and portfolio manager of the Fund. RBC GAM is responsible for the Fund’s day-to-day operations, provides investment advice and portfolio management services to the Fund and appoints distributors for the Fund. RBC GAM is paid a management fee by the Fund as compensation for its services. The Fund pays a fixed administration fee to RBC GAM, which, in turn, pays certain operating expenses of the Fund.
Affiliates of RBC GAM that provide services to the Fund in the course of their normal businesses are discussed below.
RBC QUBE LOW VOLATILITY GLOBAL EQUITY CLASS
185
ANNUAL MANAGEMENT REPORT OF FUND PERFORMANCE
186
March 31, 2017
RBC QUBE LOW VOLATILITY GLOBAL EQUITY CLASS
DistributorsRBC GAM, Royal Mutual Funds Inc., RBC Direct Investing Inc., RBC Dominion Securities Inc. and Phillips, Hager & North Investment Funds Ltd. are the principal distributors of, or distribute certain series of the mutual fund shares of, the Fund. Dealers receive an ongoing commission based on the total value of their clients’ Series A, Advisor Series and Series D mutual fund shares.
CustodianRBC Investor Services Trust (“RBC IS”) is the custodian and holds the assets of the Fund.
RegistrarsRoyal Bank, RBC IS and RBC GAM are the registrars of the Fund and keep records of who owns the mutual fund shares of the Fund.
Other Related-Party TransactionsPursuant to applicable securities legislation, the Fund relied on the standing instructions from the Independent Review Committee with respect to one or more of the following transactions:
Related-Party Trading Activities(a) trades in securities of Royal Bank;
(b) investments in the securities of issuers for which a related-party dealer acted as an underwriter during the distribution of such securities and the 60-day period following the conclusion of such distribution of the underwritten securities to the public;
(c) purchases of equity and debt securities from or sales of equity or debt securities to a related-party dealer, where it acted as principal; and
Inter-Fund Trading(d) purchases or sales of securities of an issuer from or to another
investment fund or managed account managed by RBC GAM.
The applicable standing instructions require that Related-Party Trading Activities and Inter-Fund Trading be conducted in accordance with RBC GAM policy and that RBC GAM advise the Independent Review Committee of a material breach of any standing instruction. RBC GAM policy requires that an investment decision in respect of Related-Party Trading Activities (i) is made free from any influence of Royal Bank or its associates or affiliates and without taking into account any consideration relevant to Royal Bank or its affiliates or associates, (ii) represents the business judgment of the portfolio manager, uninfluenced by considerations other than the best interests of the Fund, (iii) is in compliance with RBC GAM policies and procedures, and (iv) achieves a fair and reasonable result for the Fund. RBC GAM policy requires that an investment decision in respect of Inter-Fund Trading is in the best interests of each Fund.
186

ANNUAL MANAGEMENT REPORT OF FUND PERFORMANCE
March 31, 2017
187
RBC QUBE LOW VOLATILITY GLOBAL EQUITY CLASS
FINANCIAL HIGHLIGHTS The following tables show selected key financial information about the Fund and are intended to help you understand the Fund’s financial performance for the past five years or for the periods since inception. This information is derived from the Fund’s audited annual financial statements. For financial years beginning on or after April 1, 2014, financial highlight information is derived from financial statements prepared in compliance with International Financial Reporting Standards (“IFRS”). For financial years prior to April 1, 2014, financial highlight information is derived from financial statements prepared in accordance with Canadian generally accepted accounting principles (“GAAP”). “Net Assets,” for the periods prior to April 1, 2014, are calculated in accordance with GAAP, and “Net Asset Value” is derived from the valuation method disclosed in the RBC Corporate Class Funds Annual Information Form and is used for transactional purposes (see Ratios and Supplemental Data). All other calculations for the purposes of this MRFP are made using Net Asset Value. There is no significant difference between “Net Assets” and “Net Asset Value” under IFRS.
Change in Net Assets Per Mutual Fund Share ($)
Annual Distributions2
Increase (Decrease) from Operations1 From Total Realized Unrealized Income From Net Assets For the Year/ Net Assets Revenue Total Gains Gains (Excluding From Capital Return End of Period Ended Beginning of Year/Period (Loss) Expenses (Losses) (Losses) Total Dividends) Dividends Gains of Capital Total Year/Period
Series AMar. 31, 2017 10.78 0.30 (0.23) 0.40 0.46 0.93 – (0.01) – – (0.01) 11.75 Mar. 31, 2016 10.15 0.30 (0.23) 0.29 0.52 0.88 – – – – – 10.78Mar. 31, 20153 10.00† – (0.04) – 0.25 0.21 – – – – – 10.15
Advisor SeriesMar. 31, 2017 10.78 0.29 (0.24) 0.39 0.56 1.00 – (0.01) – – (0.01) 11.74Mar. 31, 2016 10.15 0.25 (0.24) 0.23 0.42 0.66 – – – – – 10.78Mar. 31, 20153 10.00† – (0.04) – 0.18 0.14 – – – – – 10.15
Series DMar. 31, 2017 10.88 0.30 (0.14) 0.40 0.57 1.13 – (0.01) – – (0.01) 11.96Mar. 31, 2016 10.16 0.28 (0.14) 0.26 0.47 0.87 – – – – – 10.88Mar. 31, 20153 10.00† – (0.03) – 0.23 0.20 – – – – – 10.16
Series FMar. 31, 2017 10.91 0.29 (0.11) 0.39 0.66 1.23 – (0.02) – – (0.02) 12.01Mar. 31, 2016 10.17 0.23 (0.12) 0.21 0.38 0.70 – (0.01) – – (0.01) 10.91Mar. 31, 20153 10.00† – (0.02) – 0.26 0.24 – – – – – 10.17
Series OMar. 31, 2017 11.02 0.29 – 0.40 0.76 1.45 – (0.03) – – (0.03) 12.24Mar. 31, 2016 10.19 0.25 – 0.24 0.43 0.92 – (0.04) – – (0.04) 11.02Mar. 31, 20153 10.00† – – – 0.41 0.41 – – – – – 10.19
1 Net assets and distributions are based on the actual number of mutual fund shares outstanding at the relevant time. The increase/decrease from operations is based on the weighted average number of mutual fund shares outstanding over the financial period. This table is not intended to be a reconciliation of beginning to ending net assets per mutual fund share.
2 Distributions are reinvested in additional mutual fund shares of the Fund or paid in cash.3 From October 16, 2014.† Initial offering net asset value per mutual fund share.
187

ANNUAL MANAGEMENT REPORT OF FUND PERFORMANCE
March 31, 2017
188
RBC QUBE LOW VOLATILITY GLOBAL EQUITY CLASS
FINANCIAL HIGHLIGHTS (cont.)
Ratios and Supplemental Data
Number of Net Asset Value Net Asset Value Mutual Fund Shares Management MER Before Portfolio TradingAs at Per Mutual Fund Share ($) ($000s) Outstanding (000s) Expense Ratio (%)1 Absorption (%)1 Turnover Rate (%)2 Expense Ratio (%)3
Series AMar. 31, 2017 11.75 11 396 970 2.084 2.09 32.15 0.07Mar. 31, 2016 10.78 8 967 832 2.18 2.20 24.38 0.08Mar. 31, 20155 10.15 4 141 408 2.27 2.27 – 0.07
Advisor SeriesMar. 31, 2017 11.74 3 065 261 2.144 2.15 32.15 0.07Mar. 31, 2016 10.78 1 483 138 2.25 2.27 24.38 0.08Mar. 31, 20155 10.15 147 14 2.27 2.27 – 0.07
Series DMar. 31, 2017 11.96 7 453 623 1.264 1.27 32.15 0.07Mar. 31, 2016 10.88 4 514 415 1.36 1.38 24.38 0.08Mar. 31, 20155 10.16 629 62 1.41 1.41 – 0.07
Series FMar. 31, 2017 12.01 9 245 770 1.024 1.03 32.15 0.07Mar. 31, 2016 10.91 3 481 319 1.12 1.14 24.38 0.08Mar. 31, 20155 10.17 61 6 1.13 1.13 – 0.07
Series OMar. 31, 2017 12.24 16 649 1 361 0.05 0.06 32.15 0.07Mar. 31, 2016 11.02 6 270 569 0.05 0.07 24.38 0.08Mar. 31, 20155 10.19 411 40 0.05 0.05 – 0.07
1 The management expense ratio (“MER”) is based on expenses for the stated period, excluding commissions and other portfolio transaction costs, and is expressed as an annualized percentage of the daily average net asset value during the period. RBC GAM may, at its discretion and without notice to shareholders, waive or absorb certain operating expenses. MER includes the waiver or absorption by RBC GAM of certain operating expenses, while the MER before absorption shows the MER prior to operating expenses being waived or absorbed by RBC GAM.
2 The Fund’s portfolio turnover rate gives an indication of the level of activity employed by the portfolio manager. A portfolio turnover rate of 100% is equivalent to the Fund buying and selling all of the securities in its portfolio once in the course of the year. The higher the Fund’s portfolio turnover rate in a year, the greater the trading costs payable by the Fund in the year, and the greater the chance of an investor receiving taxable capital gains in the year. There is not necessarily a relationship between a high turnover rate and the performance of the Fund.
3 The trading expense ratio represents total commissions and other portfolio transaction costs expressed as an annualized percentage of daily average net asset value during the period. The trading expense ratio is not applicable to fixed-income transactions.
4 Effective June 30, 2016, the management fee was changed in respect of certain series of the Fund. If the change to the management fee would have been in effect throughout 2016, the adjusted MER for each series of the Fund would be: Series A – 2.06%, Advisor Series – 2.12%, Series D – 1.24% and Series F – 1.00%.
5 From October 16, 2014.
Management Fees RBC GAM is the manager and portfolio manager of the Fund. Management fees of each series of the Fund are calculated at the annual percentages, before GST/HST, of the daily net asset value of each series of the Fund. The breakdown of the services received in consideration of the management fees for each series, as a percentage of the management fees, is as follows:
Breakdown of Services
Management Fees Distribution Other*
Series A 1.75% 54% 46%Advisor Series 1.75% 54% 46%Series D 1.00% 23% 77%Series F 0.75% – 100%
Series O – no management fees are paid by the Fund with respect to Series O mutual fund shares. Series O shareholders pay a negotiated fee directly to RBC GAM for investment-counselling services.* Includes all costs related to management, investment advisory services, general administration
and profit.
188

ANNUAL MANAGEMENT REPORT OF FUND PERFORMANCE
189
March 31, 2017
Annual Compound Returns (%) The table shows the annual compound returns for each series of the Fund and for each of the periods indicated ended on March 31, 2017, compared with the following benchmark:
MSCI World Total Return Net Index (CAD)
Past Past Past Past Since Year 3 Years 5 Years 10 Years Inception
Series A 9.1 – – – 7.7Benchmark 18.3 – – – 9.4
Advisor Series 9.0 – – – 7.7Benchmark 18.3 – – – 9.4
Series D 9.9 – – – 8.6Benchmark 18.3 – – – 9.4
Series F 10.2 – – – 8.9Benchmark 18.3 – – – 9.4
Series O 11.3 – – – 10.0Benchmark 18.3 – – – 9.4
The returns of each series may vary because of differences in management fees and expenses. The Benchmark index returns do not include any costs of investing. See Management Discussion of Fund Performance for a discussion of performance relative to the Benchmark index.
Series A, Advisor Series, Series D, Series F and Series O mutual fund shares have been available for sale to shareholders since January 26, 2015.
Inception dates are not provided for series that have been in existence for more than 10 years.
INDEX DESCRIPTIONMSCI World Total Return Net Index (CAD) This index is the capitalization-weighted index measuring the Canadian dollar performance of selected companies listed on stock exchanges in countries around the world. The net total return index reinvests dividends after the deduction of withholding taxes, using (for international indexes) a tax rate applicable to non-resident institutional investors who do not benefit from double taxation treaties.
PAST PERFORMANCEThe performance information shown assumes that all distributions made by the Fund in the periods shown were reinvested in additional shares of the Fund and would be lower if distributions were not reinvested. The performance information does not take into account sales, redemption, distribution, optional charges or income taxes payable that would have reduced returns or performance. Past performance does not necessarily indicate how the Fund may perform in the future. A fund with more than 10 years of performance history is only permitted to disclose the past 10 years.
Year-by-Year Returns (%) The bar chart indicates the Fund’s performance for each of the years shown, and illustrates how the Fund’s performance has changed from year to year. The bar chart shows, in percentage terms, how much an investment made on the first day of each financial year would have grown or decreased by the end of the financial year.
RBC QUBE LOW VOLATILITY GLOBAL EQUITY CLASS
189

ANNUAL MANAGEMENT REPORT OF FUND PERFORMANCE
190
March 31, 2017
RBC QUBE LOW VOLATILITY GLOBAL EQUITY CLASS
SUMMARY OF INVESTMENT PORTFOLIO(after consideration of derivative products, if any)As at March 31, 2017
Investment Mix % of Net Asset Value
United States 56.2Japan 13.5Canada 7.1Switzerland 4.6Hong Kong 4.3Belgium 3.5Israel 3.5Singapore 1.9United Kingdom 1.5Other Countries 3.6Cash/Other 0.3
Top 25 Holdings* % of Net Asset Value
BCE Inc. 3.0PepsiCo Inc. 3.0Johnson & Johnson 3.0The Procter & Gamble Co. 3.0Republic Services Inc. 3.0The Coca-Cola Co. 2.9Bank of Montreal 2.7Colruyt S.A. 2.7Danaher Corp. 2.5CLP Holdings Ltd. 2.4Consolidated Edison Inc. 2.4Loews Corp. 1.9Xcel Energy Inc. 1.9Philip Morris International Inc. 1.8Mitsubishi Tanabe Pharma Corp. 1.6NTT DoCoMo Inc. 1.6Alphabet Inc., Class C 1.6Comcast Corp., Class A 1.5American Electric Power 1.5Merck & Co. Inc. 1.5Ansys Inc. 1.4Duke Energy Corp. 1.3Mizrahi Tefahot Bank Ltd. 1.3Kuehne + Nagel International AG 1.3Nippon Telegraph & Telephone Corp. 1.3Top 25 Holdings 52.1
* The Fund invests substantially all of its assets directly in the RBC QUBE Low Volatility Global Equity Fund. The above are the Top 25 holdings of the RBC QUBE Low Volatility Global Equity Fund.
The Summary of Investment Portfolio may change due to ongoing portfolio transactions of the Fund and a quarterly update is available at www.rbcgam.com/funds.
The Simplified Prospectus and other information about the underlying fund are available on SEDAR website at www.sedar.com.
190
ANNUAL MANAGEMENT REPORT OF FUND PERFORMANCE
191
GLOBAL EQUITY FUND
RBC GLOBAL RESOURCES CLASS
March 31, 2017
Portfolio Manager RBC Global Asset Management Inc. (“RBC GAM”)
This annual management report of fund performance (“MRFP”) contains financial highlights but does not contain the complete annual financial statements of the Fund. You can get a copy of the financial statements at your request, and at no cost, by calling 1-800-463-FUND (3863), by writing to us at RBC Global Asset Management Inc., P.O. Box 7500, Station A, Toronto, Ontario M5W 1P9, or by visiting our website at www.rbcgam.com/reports or SEDAR at www.sedar.com. Security holders may also contact us using one of these methods to request a copy of the Fund’s proxy voting policies and procedures, proxy voting disclosure record, or quarterly portfolio disclosure.
The Board of Directors of RBC Corporate Class Inc. approved this annual management report of fund performance on May 11, 2017.
A Note on Forward-looking Statements
This report may contain forward-looking statements about the Fund, its future performance, strategies or prospects, and possible future Fund action. The words “may,” “could,” “should,” “would,” “suspect,” “outlook,” “believe,” “plan,” “anticipate,” “estimate,” “expect,” “intend,” “forecast,” “objective” and similar expressions are intended to identify forward-looking statements.
Forward-looking statements are not guarantees of future performance. Forward-looking statements involve inherent risks and uncertainties, both about the Fund and general economic factors, so it is possible that predictions, forecasts, projections and other forward-looking statements will not be achieved. We caution you not to place undue reliance on these statements as a number of important factors could cause actual events or results to differ materially from those expressed or implied in any forward-looking statement made in relation to the Fund. These factors include, but are not limited to, general economic, political and market factors in Canada, the United States and internationally, interest and foreign exchange rates, global equity and capital markets, business competition, technological changes, changes in laws and regulations, judicial or regulatory judgments, legal proceedings and catastrophic events.
The above list of important factors that may affect future results is not exhaustive. Before making any investment decisions, we encourage you to consider these and other factors carefully. All opinions contained in forward-looking statements are subject to change without notice and are provided in good faith but without legal responsibility.
191
ANNUAL MANAGEMENT REPORT OF FUND PERFORMANCE
March 31, 2017
192
MANAGEMENT DISCUSSION OF FUND PERFORMANCE
Investment Objective and StrategiesThe Fund seeks to provide long-term capital growth by investing in equity securities of companies around the world in any or all of the Energy, Materials, Industrials and Utilities sectors.
To achieve its investment objective, the Fund invests most of its assets in the RBC Global Resources Fund (the “underlying fund”). The underlying fund pursues global companies with a leading market position, high and sustainable profitability, sound finances and attractive valuations relative to peers and the market. The Fund will focus on mid- to large-cap stocks, but will also invest in smaller companies.
RiskThere were no significant changes to the investment objective and strategies that affected the Fund’s overall level of risk during the reporting period. The risks of investing in the Fund and the suitability of the Fund for investors remain as discussed in the Simplified Prospectus.
Results of OperationsThe Fund’s net asset value was unchanged at $3 million as of March 31, 2017, from a year earlier.
Over the past year, the Fund’s Series A shares gained 24.3%, which outperformed the 22.1% rise in the benchmark. The broad-based index rose 18.3%. The Fund’s return is after the deduction of fees and expenses, while the benchmark and broad-based index returns do not include any costs of investing. See the Financial Highlights section for the management expense ratios and the Past Performance section for the returns of any other series, which may vary because of differences in management fees and expenses.
Prices for energy-related commodities were generally strong during the 12-month period after having fallen to their lowest in a decade in the first quarter of 2016. The rebound strengthened as investors became more comfortable that global production cuts would reduce supply and that international demand would remain robust. Decisions by both OPEC and non-OPEC countries to cut production by a total of about 2% drove the price of crude to over US$50 per barrel by the end of 2016. U.S. natural-gas prices also recovered during the period as demand increased and inventories declined, and cold weather in some markets stimulated demand. Precious-metals prices were volatile, but generally ended the period just slightly higher than where they had started. Initially, President Trump’s proposals for tax cuts, infrastructure spending and deregulation boosted the U.S. dollar and bond yields and diminished gold’s allure, but prices recovered in 2017 as the market became skeptical that the policies would be implemented in their intended forms. Prices of industrial metals rose significantly during the period, with copper and zinc rising 25% and 50%, respectively, as supply/demand balances tightened.
Overweight positions that contributed to relative returns included base-metal companies Ivanhoe Mines, Teck Resources and Rio Tinto, which benefited from strong commodity prices, and energy companies including Continental Resources and Seven Generations Energy. A significant underweight position in ExxonMobil, also aided relative return as the stock underperformed.
Recent DevelopmentsOPEC officials will meet in May to determine whether to extend the production-cut agreement for a second six-month period if needed to keep supply in balance with demand. An extension would have the potential to drive oil prices higher, thereby boosting U.S. exploration and production budgets.
While demand for zinc continues to exceed supply, some investors are concerned that prices could decline if producers respond next year by increasing output. Copper markets are relatively balanced with disruptions offsetting supply coming into the market in the near term. Copper prices could strengthen in the near term, as production declines and global demand growth continues. We expect mergers and acquisitions among agricultural companies that deal in fertilizer, crop protection and seeds as companies seek to boost share and profit margins.
Precious-metals reserves and spending on exploration are in decline, which could lead to increased merger and acquisition activity in 2017. The Fund holds junior mining companies with attractive assets and is positioned to take advantage of this trend as larger companies compete to bolster reserves.
On December 15, 2016, the Canadian government enacted new tax rules that eliminate the ability of investors to switch among different classes of RBC Corporate Class Funds on a tax-deferred basis. The new rules do not apply to switches between different series of the same fund.
Effective December 1, 2016, Mr. Lloyd R. McGinnis retired and Ms. Élaine Cousineau was appointed as Chair of the Independent Review Committee (the “IRC”). Mr. Charles F. Macfarlane was appointed as Vice Chair of the IRC. Effective January 1, 2017, Ms. Suromitra Sanatani and Ms. Catherine Kloepfer were appointed as members of the IRC.
Effective July 1, 2016, Deloitte LLP resigned and PricewaterhouseCoopers LLP was appointed as auditors of the Fund.
Effective June 30, 2016, management fees were reduced as follows: from 1.85% to 1.75% in respect of Series A mutual fund shares and Advisor Series mutual fund shares. Also effective June 30, 2016, Series H mutual fund shares and Series I mutual fund shares were closed to all investors.
RBC GLOBAL RESOURCES CLASS
192
ANNUAL MANAGEMENT REPORT OF FUND PERFORMANCE
March 31, 2017
193
RBC GLOBAL RESOURCES CLASS
Related-Party TransactionsManager and Portfolio ManagerRBC GAM is an indirect, wholly owned subsidiary of Royal Bank of Canada (“Royal Bank”) and is the manager and portfolio manager of the Fund. RBC GAM is responsible for the Fund’s day-to-day operations, provides investment advice and portfolio management services to the Fund and appoints distributors for the Fund. RBC GAM is paid a management fee by the Fund as compensation for its services. The Fund pays a fixed administration fee to RBC GAM, which, in turn, pays certain operating expenses of the Fund.
Affiliates of RBC GAM that provide services to the Fund in the course of their normal businesses are discussed below.
DistributorsRBC GAM, Royal Mutual Funds Inc., RBC Direct Investing Inc., RBC Dominion Securities Inc. and Phillips, Hager & North Investment Funds Ltd. are the principal distributors of, or distribute certain series of the mutual fund shares of, the Fund. Dealers receive an ongoing commission based on the total value of their clients’ Series A, Advisor Series and Series D mutual fund shares.
CustodianRBC Investor Services Trust (“RBC IS”) is the custodian and holds the assets of the Fund.
RegistrarsRoyal Bank, RBC IS and RBC GAM are the registrars of the Fund and keep records of who owns the mutual fund shares of the Fund.
Other Related-Party TransactionsPursuant to applicable securities legislation, the Fund relied on the standing instructions from the Independent Review Committee with respect to one or more of the following transactions:
Related-Party Trading Activities(a) trades in securities of Royal Bank;
(b) investments in the securities of issuers for which a related-party dealer acted as an underwriter during the distribution of such securities and the 60-day period following the conclusion of such distribution of the underwritten securities to the public;
(c) purchases of equity and debt securities from or sales of equity or debt securities to a related-party dealer, where it acted as principal; and
Inter-Fund Trading(d) purchases or sales of securities of an issuer from or to another
investment fund or managed account managed by RBC GAM.
The applicable standing instructions require that Related-Party Trading Activities and Inter-Fund Trading be conducted in accordance with RBC GAM policy and that RBC GAM advise the Independent Review Committee of a material breach of any standing instruction. RBC GAM policy requires that an investment decision in respect of Related-Party Trading Activities (i) is made free from any influence of Royal Bank or its associates or affiliates and without taking into account any consideration relevant to Royal Bank or its affiliates or associates, (ii) represents the business judgment of the portfolio manager, uninfluenced by considerations other than the best interests of the Fund, (iii) is in compliance with RBC GAM policies and procedures, and (iv) achieves a fair and reasonable result for the Fund. RBC GAM policy requires that an investment decision in respect of Inter-Fund Trading is in the best interests of each Fund.
193

ANNUAL MANAGEMENT REPORT OF FUND PERFORMANCE
March 31, 2017
194
RBC GLOBAL RESOURCES CLASS
FINANCIAL HIGHLIGHTS The following tables show selected key financial information about the Fund and are intended to help you understand the Fund’s financial performance for the past five years or for the periods since inception. This information is derived from the Fund’s audited annual financial statements. For financial years beginning on or after April 1, 2014, financial highlight information is derived from financial statements prepared in compliance with International Financial Reporting Standards (“IFRS”). For financial years prior to April 1, 2014, financial highlight information is derived from financial statements prepared in accordance with Canadian generally accepted accounting principles (“GAAP”). “Net Assets,” for the periods prior to April 1, 2014, are calculated in accordance with GAAP, and “Net Asset Value” is derived from the valuation method disclosed in the RBC Corporate Class Funds Annual Information Form and is used for transactional purposes (see Ratios and Supplemental Data). All other calculations for the purposes of this MRFP are made using Net Asset Value. There is no significant difference between “Net Assets” and “Net Asset Value” under IFRS.
Change in Net Assets Per Mutual Fund Share ($)
Annual Distributions2
Increase (Decrease) from Operations1 From Total Realized Unrealized Income From Net Assets For the Year/ Net Assets Revenue Total Gains Gains (Excluding From Capital Return End of Period Ended Beginning of Year/Period (Loss) Expenses (Losses) (Losses) Total Dividends) Dividends Gains of Capital Total Year/Period
Series AMar. 31, 2017 8.03 – (0.21) 0.44 1.94 2.17 – – – – – 9.98 Mar. 31, 2016 9.24 – (0.19) (0.23) (0.82) (1.24) – – – – – 8.03Mar. 31, 2015 10.02 – (0.22) 0.24 (0.49) (0.47) – – – – – 9.24 Mar. 31, 2014 8.88 – (0.22) 0.01 1.46 1.25 – – – – – 10.02Mar. 31, 2013 9.67 – (0.22) (0.66) 0.05 (0.83) – – – – – 8.88
Advisor SeriesMar. 31, 2017 8.04 – (0.21) 0.44 1.98 2.21 – – – – – 10.00Mar. 31, 2016 9.25 – (0.18) (0.23) (0.82) (1.23) – – – – – 8.04Mar. 31, 2015 10.02 – (0.21) 0.23 (0.47) (0.45) – – – – – 9.25 Mar. 31, 2014 8.88 – (0.23) 0.01 1.43 1.21 – – – – – 10.02Mar. 31, 2013 9.67 – (0.22) (0.70) 0.05 (0.87) – – – – – 8.88
Series DMar. 31, 2017 8.38 – (0.13) 0.46 1.35 1.68 – – – – – 10.51Mar. 31, 2016 9.55 – (0.11) (0.24) (0.85) (1.20) – – – – – 8.38Mar. 31, 2015 10.25 – (0.12) 0.24 (0.50) (0.38) – – – – – 9.55 Mar. 31, 2014 8.99 – (0.13) 0.01 1.49 1.37 – – – – – 10.25Mar. 31, 2013 9.70 – (0.14) (0.66) 0.05 (0.75) – – – – – 8.99
Series FMar. 31, 2017 8.49 – (0.10) 0.47 1.80 2.17 – – – – – 10.69Mar. 31, 2016 9.64 – (0.08) (0.24) (0.85) (1.17) – – – – – 8.49Mar. 31, 2015 10.32 – (0.09) 0.25 (0.51) (0.35) – – – – – 9.64 Mar. 31, 2014 9.02 – (0.11) 0.01 1.44 1.34 – – – – – 10.32Mar. 31, 2013 9.70 – (0.10) (0.52) 0.04 (0.58) – – – – – 9.02
Series OMar. 31, 2017 8.82 – (0.01) 0.43 3.76 4.18 – – – – – 11.21Mar. 31, 2016 9.93 – – (0.25) (0.90) (1.15) – – – – – 8.82Mar. 31, 2015 10.53 – – 0.25 (0.52) (0.27) – – – – – 9.93 Mar. 31, 2014 9.12 – (0.03) 0.01 1.53 1.51 – – – – – 10.53Mar. 31, 2013 9.72 – (0.03) (0.65) 0.05 (0.63) – – – – – 9.12
1 Net assets and distributions are based on the actual number of mutual fund shares outstanding at the relevant time. The increase/decrease from operations is based on the weighted average number of mutual fund shares outstanding over the financial period. This table is not intended to be a reconciliation of beginning to ending net assets per mutual fund share.
2 Distributions are reinvested in additional mutual fund shares of the Fund or paid in cash.
194

ANNUAL MANAGEMENT REPORT OF FUND PERFORMANCE
March 31, 2017
195
RBC GLOBAL RESOURCES CLASS
FINANCIAL HIGHLIGHTS (cont.)
Ratios and Supplemental Data
Number of Net Asset Value Net Asset Value Mutual Fund Shares Management MER Before Portfolio TradingAs at Per Mutual Fund Share ($) ($000s) Outstanding (000s) Expense Ratio (%)1 Absorption (%)1 Turnover Rate (%)2 Expense Ratio (%)3
Series AMar. 31, 2017 9.98 911 91 2.214 2.29 29.97 0.31Mar. 31, 2016 8.03 1 085 135 2.28 2.40 29.44 0.28Mar. 31, 2015 9.24 1 243 135 2.26 2.45 22.22 0.22 Mar. 31, 2014 10.02 671 67 2.26 2.49 26.76 0.30Mar. 31, 2013 8.88 461 52 2.25 2.48 97.50 0.32
Advisor SeriesMar. 31, 2017 10.00 261 26 2.204 2.28 29.97 0.31Mar. 31, 2016 8.04 272 34 2.24 2.36 29.44 0.28Mar. 31, 2015 9.25 201 22 2.19 2.38 22.22 0.22 Mar. 31, 2014 10.02 79 8 2.28 2.51 26.76 0.30Mar. 31, 2013 8.88 37 4 2.23 2.46 97.50 0.32
Series DMar. 31, 2017 10.51 846 80 1.28 1.36 29.97 0.31Mar. 31, 2016 8.38 526 63 1.30 1.42 29.44 0.28Mar. 31, 2015 9.55 296 31 1.27 1.46 22.22 0.22 Mar. 31, 2014 10.25 149 15 1.26 1.49 26.76 0.30Mar. 31, 2013 8.99 98 11 1.29 1.52 97.50 0.32
Series FMar. 31, 2017 10.69 851 80 0.99 1.07 29.97 0.31Mar. 31, 2016 8.49 510 60 0.97 1.09 29.44 0.28Mar. 31, 2015 9.64 133 14 0.95 1.14 22.22 0.22 Mar. 31, 2014 10.32 62 6 0.96 1.19 26.76 0.30Mar. 31, 2013 9.02 15 2 0.98 1.21 97.50 0.32
Series OMar. 31, 2017 11.21 1 – 0.05 0.13 29.97 0.31Mar. 31, 2016 8.82 145 16 0.06 0.18 29.44 0.28Mar. 31, 2015 9.93 416 42 0.05 0.24 22.22 0.22 Mar. 31, 2014 10.53 327 31 0.05 0.28 26.76 0.30Mar. 31, 2013 9.12 315 35 0.06 0.29 97.50 0.32
1 The management expense ratio (“MER”) is based on expenses for the stated period, excluding commissions and other portfolio transaction costs, and is expressed as an annualized percentage of the daily average net asset value during the period. RBC GAM may, at its discretion and without notice to shareholders, waive or absorb certain operating expenses. MER includes the waiver or absorption by RBC GAM of certain operating expenses, while the MER before absorption shows the MER prior to operating expenses being waived or absorbed by RBC GAM.
2 The Fund’s portfolio turnover rate gives an indication of the level of activity employed by the portfolio manager. A portfolio turnover rate of 100% is equivalent to the Fund buying and selling all of the securities in its portfolio once in the course of the year. The higher the Fund’s portfolio turnover rate in a year, the greater the trading costs payable by the Fund in the year, and the greater the chance of an investor receiving taxable capital gains in the year. There is not necessarily a relationship between a high turnover rate and the performance of the Fund.
3 The trading expense ratio represents total commissions and other portfolio transaction costs expressed as an annualized percentage of daily average net asset value during the period. The trading expense ratio is not applicable to fixed-income transactions.
4 Effective June 30, 2016, the management fee was changed in respect of certain series of the Fund. If the change to the management fee would have been in effect throughout 2016, the adjusted MER for each series of the Fund would be: Series A – 2.19% and Advisor Series – 2.17%.
195

ANNUAL MANAGEMENT REPORT OF FUND PERFORMANCE
196
March 31, 2017
FINANCIAL HIGHLIGHTS (cont.)
Management Fees RBC GAM is the manager and portfolio manager of the Fund. Management fees of each series of the Fund are calculated at the annual percentages, before GST/HST, of the daily net asset value of each series of the Fund. The breakdown of the services received in consideration of the management fees for each series, as a percentage of the management fees, is as follows:
Breakdown of Services
Management Fees Distribution Other*
Series A 1.75% 62% 38% Advisor Series 1.75% 62% 38% Series D 1.00% 25% 75%Series F 0.75% – 100%
Series O – no management fees are paid by the Fund with respect to Series O mutual fund shares. Series O shareholders pay a negotiated fee directly to RBC GAM for investment-counselling services.* Includes all costs related to management, investment advisory services, general administration
and profit.
PAST PERFORMANCEThe performance information shown assumes that all distributions made by the Fund in the periods shown were reinvested in additional shares of the Fund and would be lower if distributions were not reinvested. The performance information does not take into account sales, redemption, distribution, optional charges or income taxes payable that would have reduced returns or performance. Past performance does not necessarily indicate how the Fund may perform in the future. A fund with more than 10 years of performance history is only permitted to disclose the past 10 years.
Year-by-Year Returns (%) The bar chart indicates the Fund’s performance for each of the years shown, and illustrates how the Fund’s performance has changed from year to year. The bar chart shows, in percentage terms, how much an investment made on the first day of each financial year would have grown or decreased by the end of the financial year.
RBC GLOBAL RESOURCES CLASS
196

ANNUAL MANAGEMENT REPORT OF FUND PERFORMANCE
March 31, 2017
197
RBC GLOBAL RESOURCES CLASS
PAST PERFORMANCE (cont.)Annual Compound Returns (%) The table shows the annual compound returns for each series of the Fund and for each of the periods indicated ended on March 31, 2017, compared with the following benchmarks:
The blended benchmark (the “Benchmark”) is composed of:
65% MSCI World Index – Energy (CAD) 35% MSCI World Index – Materials (CAD)
The broad-based index is the MSCI World Total Return Net Index (CAD).
Past Past Past Past Since Year 3 Years 5 Years 10 Years Inception
Series A 24.3 -0.1 0.6 – 0.0Benchmark 22.1 2.3 6.2 – 6.7Broad-based index 18.3 12.4 15.9 – 17.1
Advisor Series 24.3 -0.1 0.7 – 0.0Benchmark 22.1 2.3 6.2 – 6.7Broad-based index 18.3 12.4 15.9 – 17.1
Series D 25.5 0.8 1.6 – 1.0Benchmark 22.1 2.3 6.2 – 6.7Broad-based index 18.3 12.4 15.9 – 17.1
Series F 25.9 1.2 2.0 – 1.3Benchmark 22.1 2.3 6.2 – 6.7Broad-based index 18.3 12.4 15.9 – 17.1
Series O 27.1 2.1 2.9 – 2.2Benchmark 22.1 2.3 6.2 – 6.7Broad-based index 18.3 12.4 15.9 – 17.1
The returns of each series may vary because of differences in management fees and expenses. The Benchmark and broad-based index returns do not include any costs of investing. See Management Discussion of Fund Performance for a discussion of performance relative to the Benchmark and broad-based index.
Series A, Advisor Series, Series D, Series F and Series O mutual fund shares have been available for sale to shareholders since January 1, 2012.
Inception dates are not provided for series that have been in existence for more than 10 years.
INDEX DESCRIPTIONSMSCI World Index – Energy (CAD) This sub-index is a measure of the Canadian dollar performance of the stocks in the Energy sector in the MSCI World Index.MSCI World Index – Materials (CAD) This sub-index is a measure of the Canadian dollar performance of stocks in the Materials sector in the MSCI World Index.MSCI World Total Return Net Index (CAD) This index is the capitalization-weighted index measuring the Canadian dollar performance of selected companies listed on stock exchanges in countries around the world. The net total return index reinvests dividends after the deduction of withholding taxes, using (for international indexes) a tax rate applicable to non-resident institutional investors who do not benefit from double taxation treaties.
SUMMARY OF INVESTMENT PORTFOLIO(after consideration of derivative products, if any)As at March 31, 2017
Investment Mix – Sectors % of Net Asset Value
Oil, Gas and Consumable Fuels 40.1Metals and Mining 28.7Energy Equipment and Services 10.5Chemicals 7.6Paper and Forest Products 5.5Construction Materials 3.8Containers and Packaging 2.1Cash/Other 1.7
Investment Mix – Countries/Regions % of Net Asset Value
United States 43.1Canada 36.5United Kingdom 7.3Other Countries 11.4Cash/Other 1.7
197

ANNUAL MANAGEMENT REPORT OF FUND PERFORMANCE
198
March 31, 2017
RBC GLOBAL RESOURCES CLASS
SUMMARY OF INVESTMENT PORTFOLIO (cont.)(after consideration of derivative products, if any)As at March 31, 2017
Top 25 Holdings* % of Net Asset Value
Rio Tinto Plc. 4.8BHP Billiton Plc. 3.4Concho Resources Inc. 3.4Parex Resources Inc. 3.3EOG Resources Inc. 3.2Anadarko Petroleum Corp. 3.1Pioneer Natural Resources Co. 3.0Halliburton Co. 3.0Cimarex Energy Co. 2.9HeidelbergCement AG 2.7Dow Chemical Company 2.5Diamondback Energy Inc. 2.2Baker Hughes Inc. 2.0Interfor Corp. 2.0Laredo Petroleum Inc. 1.9Patterson-UTI Energy Inc. 1.9First Quantum Minerals Ltd. 1.8Cash & Cash Equivalents 1.8Devon Energy Corporation 1.7Seven Generations Energy Ltd. 1.7Canadian Natural Resources Ltd. 1.6Kirkland Lake Gold Ltd. 1.5Continental Resources Inc. 1.5Akzo Nobel N.V. 1.5US Silica Holdings Inc. 1.5Top 25 Holdings 59.9
* The Fund invests substantially all of its assets directly in the RBC Global Resources Fund. The above are the Top 25 holdings of the RBC Global Resources Fund.
The Summary of Investment Portfolio may change due to ongoing portfolio transactions of the Fund and a quarterly update is available at www.rbcgam.com/funds.
The Simplified Prospectus and other information about the underlying fund are available on SEDAR website at www.sedar.com.
198

The accompanying financial statements have been prepared by RBC Global Asset Management Inc. (“RBC GAM”) as manager of the
RBC Corporate Class Funds (the “Funds”) and approved by the Board of Directors of RBC Corporate Class Inc. We are responsible for the
information contained within the financial statements.
We have maintained appropriate procedures and controls to ensure that timely and reliable financial information is produced. The financial
statements have been prepared in compliance with International Financial Reporting Standards (“IFRS”) (and they include certain amounts that are
based on estimates and judgments). The significant accounting policies, which we believe are appropriate for the Funds, are described in Note 3
to the financial statements.
PricewaterhouseCoopers LLP, Chartered Professional Accountants, Licensed Public Accountants, have performed an independent audit of the
financial statements in accordance with IFRS. Their report is set out on the next page.
Damon G. Williams, FSA, FCIA, CFA Frank Lippa, CPA, CAChief Executive Officer Chief Financial Officer and Chief Operating OfficerRBC Global Asset Management Inc. RBC Global Asset Management Inc.
May 11, 2017
MANAGEMENT’S RESPONSIBILITY FOR FINANCIAL REPORTING
199

We have audited the accompanying financial statements of each of
the Funds, which comprise the statement of financial position as at
March 31, 2017 and the statements of comprehensive income, cash
flows and changes in net assets attributable to holders of mutual
fund shares for the periods indicated in note 2, and the related notes,
which comprise a summary of significant accounting policies and
other explanatory information.
Management’s responsibility for the financial statementsManagement is responsible for the preparation and fair presentation
of the financial statements of each of the Funds in accordance
with International Financial Reporting Standards, and for such
internal control as management determines is necessary to enable
the preparation of financial statements that are free from material
misstatement, whether due to fraud or error.
Auditor’s responsibilityOur responsibility is to express an opinion on the financial statements
of each of the Funds based on our audit. We conducted our audit in
accordance with Canadian generally accepted auditing standards.
Those standards require that we comply with ethical requirements
and plan and perform the audit to obtain reasonable assurance about
whether the financial statements are free from material misstatement.
An audit involves performing procedures to obtain audit evidence
about the amounts and disclosures in the financial statements. The
procedures selected depend on the auditor’s judgment, including
the assessment of the risks of material misstatement of the financial
statements, whether due to fraud or error. In making those risk
assessments, the auditor considers internal control relevant to the
entity’s preparation and fair presentation of the financial statements
in order to design audit procedures that are appropriate in the
circumstances, but not for the purpose of expressing an opinion on
the effectiveness of the entity’s internal control. An audit also includes
evaluating the appropriateness of accounting policies used and the
reasonableness of accounting estimates made by management, as well
as evaluating the overall presentation of the financial statements.
We believe that the audit evidence we have obtained is sufficient and
appropriate to provide a basis for our audit opinion.
OpinionIn our opinion, the financial statements of each of the Funds present
fairly, in all material respects, the financial position of each of the
Funds as at March 31, 2017 and the financial performance and cash
flows of each of the Funds for the periods indicated in note 2, in
accordance with International Financial Reporting Standards.
Other matterThe financial statements of each of the Funds as at March 31, 2016
and for the periods indicated in note 2, as applicable, were audited
by another auditor who expressed an unmodified opinion on those
statements on May 13, 2016.
Chartered Professional Accountants, Licensed Public Accountants
Toronto, Ontario May 11, 2017
INDEPENDENT AUDITOR’S REPORT
To the Shareholders of the following classes of RBC Corporate Class Inc.:
RBC Short Term Income ClassRBC $U.S. Short Term Income ClassBlueBay Global Convertible Bond Class (Canada)BlueBay $U.S. Global Convertible Bond Class (Canada)Phillips, Hager & North Monthly Income ClassRBC Balanced Growth & Income Class RBC Canadian Dividend ClassRBC Canadian Equity ClassRBC QUBE Low Volatility Canadian Equity ClassPhillips, Hager & North Canadian Equity Value Class
RBC Canadian Equity Income ClassRBC Canadian Mid-Cap Equity ClassRBC North American Value ClassRBC U.S. Dividend ClassRBC U.S. Equity ClassRBC QUBE Low Volatility U.S. Equity ClassRBC U.S. Equity Value Class Phillips, Hager & North U.S. Multi-Style All-Cap Equity ClassRBC U.S. Mid-Cap Value Equity ClassRBC U.S. Small-Cap Core Equity Class RBC International Equity Class
Phillips, Hager & North Overseas Equity ClassRBC European Equity Class RBC Emerging Markets Equity ClassRBC Global Equity ClassRBC QUBE Low Volatility Global Equity Class RBC Global Resources Class(collectively referred to as the “Funds”)
200
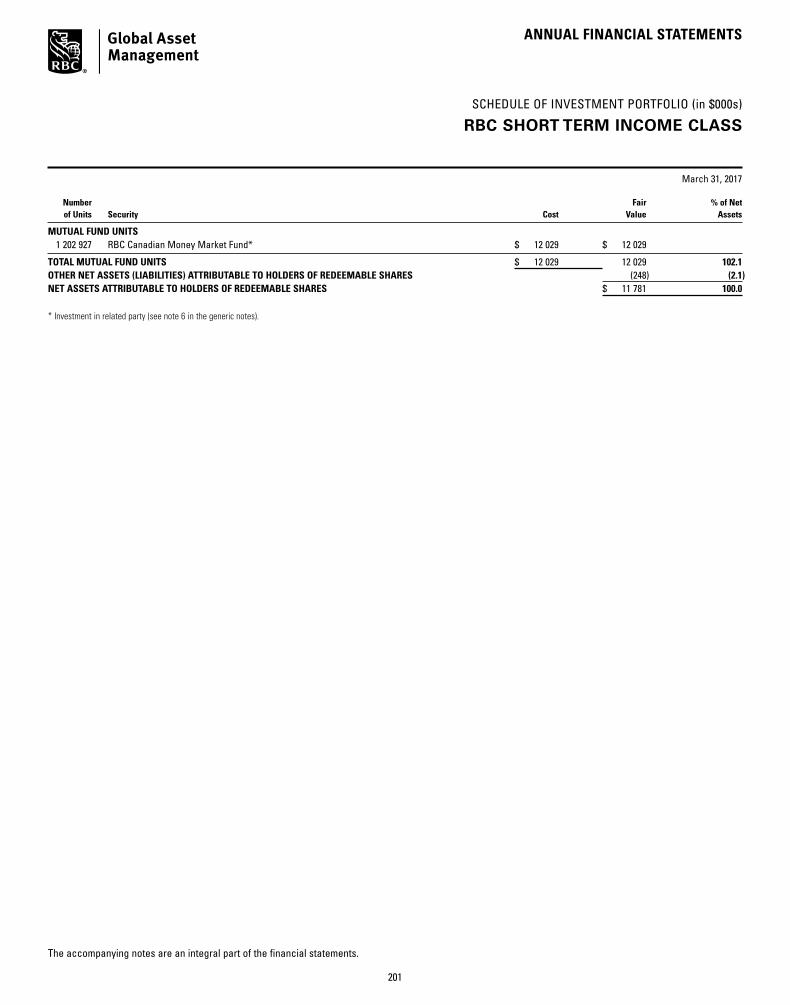
SCHEDULE OF INVESTMENT PORTFOLIO (in $000s)
ANNUAL FINANCIAL STATEMENTS
March 31, 2017
The accompanying notes are an integral part of the financial statements.
RBC SHORT TERM INCOME CLASS
Number Fair % of Net of Units Security Cost Value Assets
MUTUAL FUND UNITS 1 202 927 RBC Canadian Money Market Fund* $ 12 029 $ 12 029
TOTAL MUTUAL FUND UNITS $ 12 029 12 029 102.1OTHER NET ASSETS (LIABILITIES) ATTRIBUTABLE TO HOLDERS OF REDEEMABLE SHARES (248) (2.1)NET ASSETS ATTRIBUTABLE TO HOLDERS OF REDEEMABLE SHARES $ 11 781 100.0
* Investment in related party (see note 6 in the generic notes).
201

FINANCIAL STATEMENTS
The accompanying notes are an integral part of these financial statements.
RBC SHORT TERM INCOME CLASS
Statements of Financial Position (in $000s except per mutual fund share amounts)
(see note 2 in the generic notes)March 31
2017March 31
2016
ASSETSInvestments at fair value $ 12 029 $ 40 453 Cash 63 –Due from investment dealers – 35 Subscriptions receivable 1 4 TOTAL ASSETS 12 093 40 492 LIABILITIESBank overdraft – 25 Due to investment dealers 60 –Redemptions payable 246 28 Accounts payable and accrued expenses 6 17 TOTAL LIABILITIES EXCLUDING NET ASSETS ATTRIBUTABLE TO HOLDERS OF REDEEMABLE MUTUAL FUND SHARES 312 70 NET ASSETS ATTRIBUTABLE TO HOLDERS OF REDEEMABLE MUTUAL FUND SHARES (“NAV”) $ 11 781 $ 40 422
Investments at cost $ 12 029 $ 40 453
NAV SERIES A $ 5 796 $ 10 973 ADVISOR SERIES $ 518 $ 936 SERIES H $ – $ 19 773 SERIES D $ 2 064 $ 2 100 SERIES F $ 2 826 $ 2 683 SERIES I $ – $ 792 SERIES O $ 577 $ 3 165 NAV PER MUTUAL FUND SHARE SERIES A $ 10.26 $ 10.22 ADVISOR SERIES $ 10.23 $ 10.20 SERIES H $ – $ 10.26 SERIES D $ 10.26 $ 10.22 SERIES F $ 10.28 $ 10.24 SERIES I $ – $ 10.28 SERIES O $ 10.56 $ 10.46
Statements of Comprehensive Income (in $000s except per mutual fund share amounts)
For the periods ended March 31 (see note 2 in the generic notes) 2017 2016INCOME (see note 3 in the generic notes)Other income received from underlying funds $ 192 $ 292 TOTAL INCOME (LOSS) 192 292 EXPENSES (see notes – Fund Specific Information)Management fees 87 124 Administration fees 12 15 Board of Directors fees 3 4 Independent Review Committee costs 2 3 GST/HST 9 14 Expenses reimbursed by manager (4) (4)TOTAL EXPENSES 109 156 INCREASE (DECREASE) IN NAV $ 83 $ 136 INCREASE (DECREASE) IN NAV SERIES A $ 31 $ 31 ADVISOR SERIES $ 4 $ 4 SERIES H $ 16 $ 39 SERIES D $ 7 $ 8 SERIES F $ 12 $ 9 SERIES I $ 1 $ 3 SERIES O $ 12 $ 42 INCREASE (DECREASE) IN NAV PER MUTUAL FUND SHARE SERIES A $ 0.03 $ 0.03 ADVISOR SERIES $ 0.03 $ 0.02 SERIES H $ 0.01 $ 0.03 SERIES D $ 0.04 $ 0.03 SERIES F $ 0.04 $ 0.03 SERIES I $ 0.01 $ 0.05 SERIES O $ 0.09 $ 0.10
202

FINANCIAL STATEMENTS
The accompanying notes are an integral part of these financial statements.
RBC SHORT TERM INCOME CLASS
Statements of Cash Flow (in $000s)
For the periods ended March 31 (see note 2 in the generic notes) 2017
2016
CASH FLOWS FROM OPERATING ACTIVITIESIncrease (decrease) in NAV $ 83 $ 136 ADJUSTMENTS TO RECONCILE NET CASH PROVIDED BY (USED IN) OPERATIONSInterest for distribution purposes – – Net realized loss (gain) on investments – – Change in unrealized loss (gain) on investments – – (Increase) decrease in accrued receivables – – Increase (decrease) in accrued payables (11) 5 Cost of investments purchased (6 057) (38 237)Proceeds on sales of investments 34 576 29 186 NET CASH PROVIDED BY (USED IN) OPERATING ACTIVITIES 28 591 (8 910)CASH FLOWS FROM FINANCING ACTIVITIESProceeds from issue of redeemable mutual fund shares 9 531 44 613 Cash paid on redemption of redeemable mutual fund shares (38 034) (35 751)Distributions paid to holders of redeemable mutual fund shares – – NET CASH PROVIDED BY (USED IN) FINANCING ACTIVITIES $ (28 503) $ 8 862 Net increase (decrease) in cash for the period 88 (48)Cash (bank overdraft), beginning of period (25) 23 CASH (BANK OVERDRAFT), END OF PERIOD $ 63 $ (25)
Interest received (paid) $ – $ – Dividends received, net of withholding taxes $ – $ –
Cash consists of cash and futures contracts margin receivable/payable, as applicable.
203

FINANCIAL STATEMENTS
The accompanying notes are an integral part of these financial statements.
RBC SHORT TERM INCOME CLASS
Statements of Changes in NAV (in $000s)
For the periods ended March 31 (see note 2 in the generic notes)
Series A Advisor Series Series H Series D2017 2016 2017 2016 2017 2016 2017 2016
NAV AT BEGINNING OF PERIOD $ 10 973 $ 10 813 $ 936 $ 1 791 $ 19 773 $ 6 273 $ 2 100 $ 1 963 INCREASE (DECREASE) IN NAV 31 31 4 4 16 39 7 8 Early redemption fees – – – – – – – – Proceeds from redeemable mutual fund shares issued 2 834 8 127 1 804 507 – 20 920 1 406 3 464 Reinvestments of distributions to holders of redeemable mutual fund shares – – – – – – – – Redemption of redeemable mutual fund shares (8 042) (7 998) (2 226) (1 366) (19 789) (7 459) (1 449) (3 335)NET INCREASE (DECREASE) FROM REDEEMABLE MUTUAL FUND SHARE TRANSACTIONS (5 208) 129 (422) (859) (19 789) 13 461 (43) 129 Distributions from net income – – – – – – – – Distributions from net gains – – – – – – – – Distributions from capital – – – – – – – – TOTAL DISTRIBUTIONS TO HOLDERS OF REDEEMABLE MUTUAL FUND SHARES – – – – – – – – NET INCREASE (DECREASE) IN NAV (5 177) 160 (418) (855) (19 773) 13 500 (36) 137 NAV AT END OF PERIOD $ 5 796 $ 10 973 $ 518 $ 936 $ – $ 19 773 $ 2 064 $ 2 100
For the periods ended March 31 (see note 2 in the generic notes)
Series F Series I Series O Total2017 2016 2017 2016 2017 2016 2017 2016
NAV AT BEGINNING OF PERIOD $ 2 683 $ 1 499 $ 792 $ 461 $ 3 165 $ 8 655 $ 40 422 $ 31 455 INCREASE (DECREASE) IN NAV 12 9 1 3 12 42 83 136 Early redemption fees – – – – – – – – Proceeds from redeemable mutual fund shares issued 2 667 5 746 – 2 105 817 3 739 9 528 44 608 Reinvestments of distributions to holders of redeemable mutual fund shares – – – – – – – – Redemption of redeemable mutual fund shares (2 536) (4 571) (793) (1 777) (3 417) (9 271) (38 252) (35 777)NET INCREASE (DECREASE) FROM REDEEMABLE MUTUAL FUND SHARE TRANSACTIONS 131 1 175 (793) 328 (2 600) (5 532) (28 724) 8 831 Distributions from net income – – – – – – – – Distributions from net gains – – – – – – – – Distributions from capital – – – – – – – – TOTAL DISTRIBUTIONS TO HOLDERS OF REDEEMABLE MUTUAL FUND SHARES – – – – – – – – NET INCREASE (DECREASE) IN NAV 143 1 184 (792) 331 (2 588) (5 490) (28 641) 8 967 NAV AT END OF PERIOD $ 2 826 $ 2 683 $ – $ 792 $ 577 $ 3 165 $ 11 781 $ 40 422
204

NOTES TO FINANCIAL STATEMENTS – FUND SPECIFIC INFORMATION
Please see the generic notes at the back of the financial statements.
March 31, 2017
RBC SHORT TERM INCOME CLASS
General information (see note 1 in the generic notes)
The investment objective of the Fund is to provide current
income and liquidity consistent with short-term money
market rates, and to preserve the value of an investment.
Financial instrument risk and capital management (see note 4 in the generic notes)
The Fund invests in the RBC Canadian Money Market Fund.
The Fund’s exposure to financial instrument risk is based on
the underlying mutual fund asset mix.
Credit risk (%)
The table below summarizes the RBC Canadian Money
Market Fund’s exposure to credit risk grouped by credit
ratings as at:
RatingMarch 31
2017March 31
2016
R-1 (H) 73.6 99.5R-1 (M) 18.6 0.1R-1 (L) 7.8 0.4Total 100.0 100.0
Concentration risk (%)
The table below summarizes the Fund’s investment portfolio
(after consideration of derivative products, if any) as at:
Investment mixMarch 31
2017March 31
2016
Commercial Paper 60.4 64.8Bankers Acceptances and Bank Obligations 33.2 30.1Provincial Obligations 6.3 5.0Cash/Other 0.1 0.1Total 100.0 100.0
Interest rate risk (%)
The table below summarizes the RBC Canadian Money
Market Fund’s exposure to interest rate risk by remaining
term to maturity as at:
Term to maturityMarch 31
2017March 31
2016
0 – 1 month 38.2 41.71 – 3 months 39.1 28.33 – 6 months 15.2 25.76 – 12 months 7.5 4.3Total 100.0 100.0
Due to the short-term nature of the Fund’s investments, the
Fund has minimal sensitivity to changes in interest rates.
Fair value hierarchy ($000s except % amounts) (see note 3 in the generic notes)
The following is a summary of the inputs used as of
March 31, 2017 and 2016.
March 31, 2017 Level 1 Level 2 Level 3 Total
Equities – – – – Mutual fund units 12 029 – – 12 029 Fixed-income and debt securities – – – – Short-term investments – – – – Derivatives – assets – – – – Derivatives – liabilities – – – – Total financial instruments 12 029 – – 12 029 % of total portfolio 100.0 – – 100.0
March 31, 2016 Level 1 Level 2 Level 3 Total
Equities – – – – Mutual fund units 40 453 – – 40 453 Fixed-income and debt securities – – – – Short-term investments – – – – Derivatives – assets – – – – Derivatives – liabilities – – – – Total financial instruments 40 453 – – 40 453% of total portfolio 100.0 – – 100.0
For the periods ended March 31, 2017 and 2016, there were
no transfers of financial instruments between Level 1, Level 2
and Level 3.
Management fees and operating expenses (see note 6 in the generic notes)
Management fees and administration fees of each series
of the Fund are payable to RBC GAM and calculated at the
following annual percentages, before GST/HST, of the daily
net asset value of each series of the Fund.
Management fees Operating expenses
Series A up to 0.75% 0.08%Advisor Series up to 0.75% 0.08%Series D up to 0.60% 0.03%Series F up to 0.50% 0.03%Series O n/a* 0.02%
* Series O shareholders pay a negotiated management fee directly to RBC GAM for investment-counselling services.
205

NOTES TO FINANCIAL STATEMENTS – FUND SPECIFIC INFORMATION
Please see the generic notes at the back of the financial statements.
March 31, 2017
Investments by related parties ($000s except mutual fund share amounts)
Royal Bank of Canada, or one of its subsidiaries, held the
following investments in the Fund as at:
March 31 2017
March 31 2016
Mutual fund shares held Series A 50 50 Advisor Series 50 50 Series H – 100 Series D 50 50 Series F 50 50 Series I – 100Value of all mutual fund shares 2 4
Underlying mutual fund ownership interest (%)
The table below summarizes the Fund’s interest in the
underlying mutual fund as a percentage of NAV, and the
Fund’s ownership interest as a percentage of the net assets of
the underlying fund (“Ownership”). The underlying fund is
established and conducts business in Canada, and has an
associate relationship to the Fund.
March 31 2017
March 31 2016
NAV Ownership NAV Ownership
RBC Canadian Money Market Fund 102.1 0.7 100.1 2.3
Taxes ($000s) (see note 5 in the generic notes)
The Fund had no capital or non-capital losses as at
March 31, 2017.
Redeemable mutual fund shares (000s)
There is no limitation on the number of mutual fund shares
available for issue. Mutual fund shares are purchased and
redeemed at the NAV per mutual fund share.
For the periods ended March 31 (see note 2 in the generic notes) 2017 2016
Series A Opening mutual fund shares 1 074 1 061Issued number of mutual fund shares 276 796Reinvested number of mutual fund shares – –Redeemed number of mutual fund shares (785) (783)Ending number of mutual fund shares 565 1 074
Advisor SeriesOpening mutual fund shares 92 176Issued number of mutual fund shares 177 50Reinvested number of mutual fund shares – –Redeemed number of mutual fund shares (218) (134)Ending number of mutual fund shares 51 92
For the periods ended March 31 (see note 2 in the generic notes) 2017 2016
Series DOpening mutual fund shares 205 193Issued number of mutual fund shares 138 339Reinvested number of mutual fund shares – –Redeemed number of mutual fund shares (142) (327)Ending number of mutual fund shares 201 205
Series FOpening mutual fund shares 262 147Issued number of mutual fund shares 260 562Reinvested number of mutual fund shares – –Redeemed number of mutual fund shares (247) (447)Ending number of mutual fund shares 275 262
Series OOpening mutual fund shares 302 834Issued number of mutual fund shares 78 358Reinvested number of mutual fund shares – –Redeemed number of mutual fund shares (325) (890)Ending number of mutual fund shares 55 302
RBC SHORT TERM INCOME CLASS
206

ANNUAL FINANCIAL STATEMENTS
March 31, 2017
The accompanying notes are an integral part of the financial statements.
SCHEDULE OF INVESTMENT PORTFOLIO (in USD000s)
RBC $U.S. SHORT TERM INCOME CLASS
Number Fair % of Net of Units Security Cost Value Assets
MUTUAL FUND UNITS 28 010 RBC $U.S. Money Market Fund* $ 280 $ 280
TOTAL MUTUAL FUND UNITS $ 280 280 99.6OTHER NET ASSETS ATTRIBUTABLE TO HOLDERS OF REDEEMABLE SHARES 1 0.4NET ASSETS ATTRIBUTABLE TO HOLDERS OF REDEEMABLE SHARES $ 281 100.0
* Investment in related party (see note 6 in the generic notes).
207

FINANCIAL STATEMENTS
The accompanying notes are an integral part of these financial statements.
RBC $U.S. SHORT TERM INCOME CLASS(IN U.S. DOLLARS)
Statements of Financial Position (in $000s except per mutual fund share amounts)
(see note 2 in the generic notes)March 31
2017March 31
2016
ASSETSInvestments at fair value $ 280 $ 150 Cash 1 –TOTAL ASSETS 281 150 NET ASSETS ATTRIBUTABLE TO HOLDERS OF REDEEMABLE MUTUAL FUND SHARES (“NAV”) $ 281 $ 150
Investments at cost $ 280 $ 150
NAV SERIES A $ 72 $ 1 SERIES D $ 2 $ 1 SERIES F $ 59 $ 1 SERIES O $ 148 $ 147 NAV PER MUTUAL FUND SHARE SERIES A $ 10.08 $ 10.01 SERIES D $ 10.08 $ 10.01 SERIES F $ 10.08 $ 10.01 SERIES O $ 10.09 $ 10.01
Statements of Comprehensive Income (in $000s except per mutual fund share amounts)
For the periods ended March 31 (see note 2 in the generic notes) 2017 2016
INCOME (see note 3 in the generic notes)Other income received from underlying funds $ 2 $ –TOTAL INCOME (LOSS) 2 –EXPENSES (see notes – Fund Specific Information)Independent Review Committee costs 2 –Expenses reimbursed by manager (2) –TOTAL EXPENSES – –INCREASE (DECREASE) IN NAV $ 2 $ –INCREASE (DECREASE) IN NAV SERIES A $ – $ – SERIES D $ – $ – SERIES F $ 1 $ – SERIES O $ 1 $ –INCREASE (DECREASE) IN NAV PER MUTUAL FUND SHARE SERIES A $ 0.08 $ 0.01 SERIES D $ 0.07 $ 0.01 SERIES F $ 0.08 $ 0.01 SERIES O $ 0.08 $ 0.01
208

FINANCIAL STATEMENTS
The accompanying notes are an integral part of these financial statements.
RBC $U.S. SHORT TERM INCOME CLASS(IN U.S. DOLLARS)
Statements of Cash Flow (in $000s)
For the periods ended March 31 (see note 2 in the generic notes) 2017 2016
CASH FLOWS FROM OPERATING ACTIVITIESIncrease (decrease) in NAV $ 2 $ – ADJUSTMENTS TO RECONCILE NET CASH PROVIDED BY (USED IN) OPERATIONSInterest for distribution purposes – – Net realized loss (gain) on investments – – Change in unrealized loss (gain) on investments – – (Increase) decrease in accrued receivables – – Increase (decrease) in accrued payables – – Cost of investments purchased (211) (150)Proceeds on sales of investments 81 – NET CASH PROVIDED BY (USED IN) OPERATING ACTIVITIES (128) (150)CASH FLOWS FROM FINANCING ACTIVITIESProceeds from issue of redeemable mutual fund shares 209 150 Cash paid on redemption of redeemable mutual fund shares (80) – Distributions paid to holders of redeemable mutual fund shares – – NET CASH PROVIDED BY (USED IN) FINANCING ACTIVITIES $ 129 $ 150 Net increase (decrease) in cash for the period 1 – Cash (bank overdraft), beginning of period – – CASH (BANK OVERDRAFT), END OF PERIOD $ 1 $ –
Interest received (paid) $ – $ – Dividends received, net of withholding taxes $ – $ –
Cash consists of cash and futures contracts margin receivable/payable, as applicable.
209
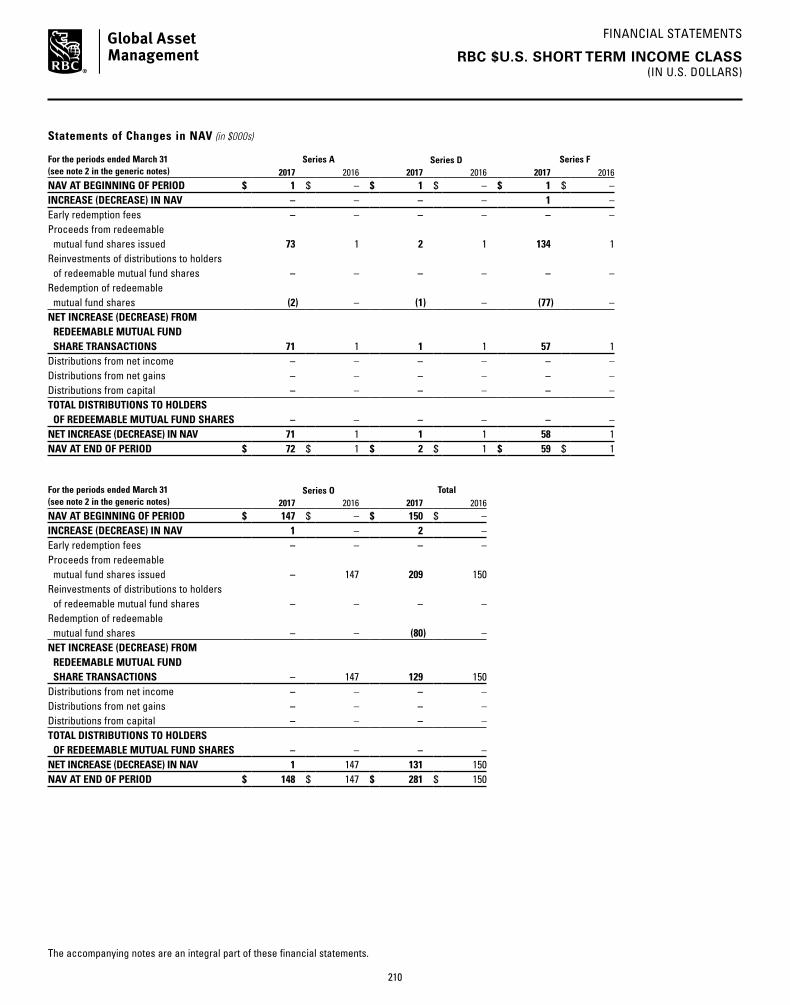
FINANCIAL STATEMENTS
The accompanying notes are an integral part of these financial statements.
RBC $U.S. SHORT TERM INCOME CLASS(IN U.S. DOLLARS)
Statements of Changes in NAV (in $000s)
For the periods ended March 31 (see note 2 in the generic notes)
Series A Series D Series F2017 2016 2017 2016 2017 2016
NAV AT BEGINNING OF PERIOD $ 1 $ – $ 1 $ – $ 1 $ – INCREASE (DECREASE) IN NAV – – – – 1 – Early redemption fees – – – – – – Proceeds from redeemable mutual fund shares issued 73 1 2 1 134 1 Reinvestments of distributions to holders of redeemable mutual fund shares – – – – – – Redemption of redeemable mutual fund shares (2) – (1) – (77) – NET INCREASE (DECREASE) FROM REDEEMABLE MUTUAL FUND SHARE TRANSACTIONS 71 1 1 1 57 1 Distributions from net income – – – – – – Distributions from net gains – – – – – – Distributions from capital – – – – – – TOTAL DISTRIBUTIONS TO HOLDERS OF REDEEMABLE MUTUAL FUND SHARES – – – – – – NET INCREASE (DECREASE) IN NAV 71 1 1 1 58 1 NAV AT END OF PERIOD $ 72 $ 1 $ 2 $ 1 $ 59 $ 1
For the periods ended March 31 (see note 2 in the generic notes)
Series O Total2017 2016 2017 2016
NAV AT BEGINNING OF PERIOD $ 147 $ – $ 150 $ – INCREASE (DECREASE) IN NAV 1 – 2 – Early redemption fees – – – – Proceeds from redeemable mutual fund shares issued – 147 209 150 Reinvestments of distributions to holders of redeemable mutual fund shares – – – – Redemption of redeemable mutual fund shares – – (80) – NET INCREASE (DECREASE) FROM REDEEMABLE MUTUAL FUND SHARE TRANSACTIONS – 147 129 150 Distributions from net income – – – – Distributions from net gains – – – – Distributions from capital – – – – TOTAL DISTRIBUTIONS TO HOLDERS OF REDEEMABLE MUTUAL FUND SHARES – – – – NET INCREASE (DECREASE) IN NAV 1 147 131 150 NAV AT END OF PERIOD $ 148 $ 147 $ 281 $ 150
210

NOTES TO FINANCIAL STATEMENTS – FUND SPECIFIC INFORMATION
Please see the generic notes at the back of the financial statements.
March 31, 2017
RBC $U.S. SHORT TERM INCOME CLASS
General information (see note 1 in the generic notes)
The investment objective of the Fund is to provide current
income and liquidity consistent with short-term U.S. money
market rates, to preserve the value of an investment, and to
generate U.S. dollar returns, thereby providing investors with
potential for currency diversification.
The Fund was started in October 2015.
Financial instrument risk and capital management (see note 4 in the generic notes)
The Fund invests in the RBC $U.S. Money Market Fund. The
Fund’s exposure to financial instrument risk is based on the
underlying mutual fund asset mix.
Credit risk (%)
The table below summarizes the RBC $U.S. Money Market
Fund’s exposure to credit risk grouped by credit ratings as at:
RatingMarch 31
2017March 31
2016
R-1 (H) 73.6 100.0R-1 (M) 20.3 –R-1 (L) 6.1 –Total 100.0 100.0
Concentration risk (%)
The table below summarizes the Fund’s investment portfolio
(after consideration of derivative products, if any) as at:
Investment mixMarch 31
2017March 31
2016
Commercial Paper 78.6 67.0Provincial Obligations 14.7 19.3Bankers Acceptances and Bank Obligations 6.6 13.5Cash/Other 0.1 0.2Total 100.0 100.0
Interest rate risk (%)
The table below summarizes the RBC $U.S. Money Market
Fund’s exposure to interest rate risk by remaining term to
maturity as at:
Term to maturityMarch 31
2017March 31
2016
0 – 1 month 27.9 35.31 – 3 months 60.7 32.83 – 6 months 11.4 28.36 – 12 months – 3.6 Total 100.0 100.0
Due to the short-term nature of the Fund’s investments, the
Fund has minimal sensitivity to changes in interest rates.
Fair value hierarchy (USD000s except % amounts) (see note 3 in the generic notes)
The following is a summary of the inputs used as of
March 31, 2017 and 2016.
March 31, 2017 Level 1 Level 2 Level 3 Total
Equities – – – – Mutual fund units 280 – – 280Fixed-income and debt securities – – – – Short-term investments – – – – Derivatives – assets – – – – Derivatives – liabilities – – – – Total financial instruments 280 – – 280% of total portfolio 100.0 – – 100.0
March 31, 2016 Level 1 Level 2 Level 3 Total
Equities – – – – Mutual fund units 150 – – 150 Fixed-income and debt securities – – – – Short-term investments – – – – Derivatives – assets – – – – Derivatives – liabilities – – – – Total financial instruments 150 – – 150 % of total portfolio 100.0 – – 100.0
For the periods ended March 31, 2017 and 2016, there were
no transfers of financial instruments between Level 1, Level 2
and Level 3.
Management fees and operating expenses (see note 6 in the generic notes)
Management fees and administration fees of each series
of the Fund are payable to RBC GAM and calculated at the
following annual percentages, before GST/HST, of the daily
net asset value of each series of the Fund.
Management fees Operating expenses
Series A up to 0.85% 0.03%Series D up to 0.60% 0.03%Series F up to 0.50% 0.03%Series O n/a* 0.02%
* Series O shareholders pay a negotiated management fee directly to RBC GAM for investment-counselling services.
211

NOTES TO FINANCIAL STATEMENTS – FUND SPECIFIC INFORMATION
Please see the generic notes at the back of the financial statements.
March 31, 2017
Investments by related parties (USD000s except mutual fund share amounts)
Royal Bank of Canada, or one of its subsidiaries, held the
following investments in the Fund as at:
March 31 2017
March 31 2016
Mutual fund shares held Series A 100 100 Series D 100 100 Series F 100 100 Series O 14 700 14 700 Value of all mutual fund shares 151 150
Underlying mutual fund ownership interest (%)
The table below summarizes the Fund’s interest in the
underlying mutual fund as a percentage of NAV, and the
Fund’s ownership interest as a percentage of the net assets of
the underlying fund (“Ownership”). The underlying fund is
established and conducts business in Canada, and has an
associate relationship to the Fund.
March 31 2017
March 31 2016
NAV Ownership NAV Ownership
RBC $U.S. Money Market Fund 99.6 0.2 100.0 0.1
Taxes (CAD000s) (see note 5 in the generic notes)
The Fund prepares its financial statements in U.S. dollars
but is taxable on its income and net realized capital gains
(including gains from foreign exchange movements)
calculated on a Canadian dollar basis.
The Fund had no capital or non-capital losses as at
March 31, 2017.
Redeemable mutual fund shares (000s)
There is no limitation on the number of mutual fund shares
available for issue. Mutual fund shares are purchased and
redeemed at the NAV per mutual fund share.
For the periods ended March 31 (see note 2 in the generic notes) 2017 2016
Series A Opening mutual fund shares – – Issued number of mutual fund shares 7 – Reinvested number of mutual fund shares – – Redeemed number of mutual fund shares – – Ending number of mutual fund shares 7 –
For the periods ended March 31 (see note 2 in the generic notes) 2017 2016
Series DOpening mutual fund shares – – Issued number of mutual fund shares – – Reinvested number of mutual fund shares – – Redeemed number of mutual fund shares – – Ending number of mutual fund shares – –
Series FOpening mutual fund shares – – Issued number of mutual fund shares 14 – Reinvested number of mutual fund shares – – Redeemed number of mutual fund shares (8) – Ending number of mutual fund shares 6 –
Series OOpening mutual fund shares 15 – Issued number of mutual fund shares – 15 Reinvested number of mutual fund shares – – Redeemed number of mutual fund shares – – Ending number of mutual fund shares 15 15
RBC $U.S. SHORT TERM INCOME CLASS
212

SCHEDULE OF INVESTMENT PORTFOLIO (in $000s)
ANNUAL FINANCIAL STATEMENTS
March 31, 2017
The accompanying notes are an integral part of the financial statements.
BLUEBAY GLOBAL CONVERTIBLE BOND CLASS (CANADA)
Number Fair % of Net of Units Security Cost Value Assets
MUTUAL FUND UNITS 7 993 136 BlueBay Global Convertible Bond Fund (Canada)* $ 95 675 $ 101 174
TOTAL MUTUAL FUND UNITS $ 95 675 101 174 100.3OTHER NET ASSETS (LIABILITIES) ATTRIBUTABLE TO HOLDERS OF REDEEMABLE SHARES (262) (0.3)NET ASSETS ATTRIBUTABLE TO HOLDERS OF REDEEMABLE SHARES $ 100 912 100.0
* Investment in related party (see note 6 in the generic notes).
213

FINANCIAL STATEMENTS
The accompanying notes are an integral part of these financial statements.
BLUEBAY GLOBAL CONVERTIBLE BOND CLASS (CANADA)
Statements of Financial Position (in $000s except per mutual fund share amounts)
(see note 2 in the generic notes)March 31
2017March 31
2016
ASSETSInvestments at fair value $ 101 174 $ 151 089 Cash – 5 Due from investment dealers 350 75 Subscriptions receivable 1 1 107 TOTAL ASSETS 101 525 152 276 LIABILITIESBank overdraft 26 –Due to investment dealers – 140 Redemptions payable 426 1 047 Distributions payable 46 75 Accounts payable and accrued expenses 115 178 TOTAL LIABILITIES EXCLUDING NET ASSETS ATTRIBUTABLE TO HOLDERS OF REDEEMABLE MUTUAL FUND SHARES 613 1 440 NET ASSETS ATTRIBUTABLE TO HOLDERS OF REDEEMABLE MUTUAL FUND SHARES (“NAV”) $ 100 912 $ 150 836
Investments at cost $ 95 675 $ 151 876
NAV SERIES A $ 6 521 $ 11 757 ADVISOR SERIES $ 20 986 $ 33 418 ADVISOR T5 SERIES $ 1 581 $ 2 271 SERIES T5 $ 606 $ 1 584 SERIES H $ 11 953 $ 16 461 SERIES D $ 2 449 $ 2 735 SERIES F $ 35 252 $ 50 665 SERIES FT5 $ 10 478 $ 16 320 SERIES I $ 10 824 $ 15 351 SERIES O $ 262 $ 274 NAV PER MUTUAL FUND SHARE SERIES A $ 10.94 $ 10.29 ADVISOR SERIES $ 10.94 $ 10.29 ADVISOR T5 SERIES $ 9.42 $ 9.33 SERIES T5 $ 9.42 $ 9.33 SERIES H $ 11.03 $ 10.35 SERIES D $ 11.19 $ 10.45 SERIES F $ 11.24 $ 10.48 SERIES FT5 $ 9.67 $ 9.50 SERIES I $ 11.33 $ 10.55 SERIES O $ 11.62 $ 10.74
Statements of Comprehensive Income (in $000s except per mutual fund share amounts)
For the periods ended March 31 (see note 2 in the generic notes) 2017 2016INCOME (see note 3 in the generic notes)Interest for distribution purposes $ (12) $ (5)Other income received from underlying funds 229 896 Capital gains received from underlying funds 1 731 –Net realized gain (loss) on investments 1 427 (202)Change in unrealized gain (loss) on investments 6 286 (7 855)TOTAL INCOME (LOSS) 9 661 (7 166)EXPENSES (see notes – Fund Specific Information)Management fees 1 467 1 907 Administration fees 25 32 Board of Directors fees 15 18 Independent Review Committee costs 2 3 GST/HST 165 216 Expenses reimbursed by manager (5) (6)TOTAL EXPENSES 1 669 2 170 INCREASE (DECREASE) IN NAV $ 7 992 $ (9 336)INCREASE (DECREASE) IN NAV SERIES A $ 517 $ (714) ADVISOR SERIES $ 1 546 $ (2 364) ADVISOR T5 SERIES $ 117 $ (158) SERIES T5 $ 32 $ (104) SERIES H $ 923 $ (1 035) SERIES D $ 170 $ (138) SERIES F $ 2 719 $ (2 741) SERIES FT5 $ 948 $ (745) SERIES I $ 999 $ (1 319) SERIES O $ 21 $ (18)INCREASE (DECREASE) IN NAV PER MUTUAL FUND SHARE SERIES A $ 0.65 $ (0.70) ADVISOR SERIES $ 0.63 $ (0.71) ADVISOR T5 SERIES $ 0.56 $ (0.65) SERIES T5 $ 0.42 $ (0.64) SERIES H $ 0.64 $ (0.68) SERIES D $ 0.73 $ (0.63) SERIES F $ 0.70 $ (0.62) SERIES FT5 $ 0.63 $ (0.57) SERIES I $ 0.78 $ (0.60) SERIES O $ 0.86 $ (0.51)
214

FINANCIAL STATEMENTS
The accompanying notes are an integral part of these financial statements.
BLUEBAY GLOBAL CONVERTIBLE BOND CLASS (CANADA)
Statements of Cash Flow (in $000s)
For the periods ended March 31 (see note 2 in the generic notes) 2017
2016
CASH FLOWS FROM OPERATING ACTIVITIESIncrease (decrease) in NAV $ 7 992 $ (9 336)ADJUSTMENTS TO RECONCILE NET CASH PROVIDED BY (USED IN) OPERATIONSInterest for distribution purposes – – Net realized loss (gain) on investments (1 427) 202 Change in unrealized loss (gain) on investments (6 286) 7 855 (Increase) decrease in accrued receivables – – Increase (decrease) in accrued payables (63) 17 Cost of investments purchased (5 435) (53 323)Proceeds on sales of investments 62 648 24 214 NET CASH PROVIDED BY (USED IN) OPERATING ACTIVITIES 57 429 (30 371)CASH FLOWS FROM FINANCING ACTIVITIESProceeds from issue of redeemable mutual fund shares 29 253 87 760 Cash paid on redemption of redeemable mutual fund shares (85 909) (57 513)Distributions paid to holders of redeemable mutual fund shares (804) (599)NET CASH PROVIDED BY (USED IN) FINANCING ACTIVITIES $ (57 460) $ 29 648 Net increase (decrease) in cash for the period (31) (723)Cash (bank overdraft), beginning of period 5 728 CASH (BANK OVERDRAFT), END OF PERIOD $ (26) $ 5
Interest received (paid) $ (12) $ (5)Dividends received, net of withholding taxes $ – $ –
Cash consists of cash and futures contracts margin receivable/payable, as applicable.
215

FINANCIAL STATEMENTS
The accompanying notes are an integral part of these financial statements.
BLUEBAY GLOBAL CONVERTIBLE BOND CLASS (CANADA)
Statements of Changes in NAV (in $000s)
For the periods ended March 31 (see note 2 in the generic notes)
Series A Advisor Series Advisor T5 Series Series T52017 2016 2017 2016 2017 2016 2017 2016
NAV AT BEGINNING OF PERIOD $ 11 757 $ 10 889 $ 33 418 $ 34 614 $ 2 271 $ 2 128 $ 1 584 $ 559 INCREASE (DECREASE) IN NAV 517 (714) 1 546 (2 364) 117 (158) 32 (104)Early redemption fees – – – – – – – – Proceeds from redeemable mutual fund shares issued 1 999 4 376 1 598 12 208 303 1 256 92 1 498 Reinvestments of distributions to holders of redeemable mutual fund shares – – – – 24 18 13 39 Redemption of redeemable mutual fund shares (7 752) (2 794) (15 576) (11 040) (1 034) (851) (1 079) (341)NET INCREASE (DECREASE) FROM REDEEMABLE MUTUAL FUND SHARE TRANSACTIONS (5 753) 1 582 (13 978) 1 168 (707) 423 (974) 1 196 Distributions from net income – – – – – – – – Distributions from net gains – – – – – – – – Distributions from capital – – – – (100) (122) (36) (67)TOTAL DISTRIBUTIONS TO HOLDERS OF REDEEMABLE MUTUAL FUND SHARES – – – – (100) (122) (36) (67)NET INCREASE (DECREASE) IN NAV (5 236) 868 (12 432) (1 196) (690) 143 (978) 1 025 NAV AT END OF PERIOD $ 6 521 $ 11 757 $ 20 986 $ 33 418 $ 1 581 $ 2 271 $ 606 $ 1 584
For the periods ended March 31 (see note 2 in the generic notes)
Series H Series D Series F Series FT52017 2016 2017 2016 2017 2016 2017 2016
NAV AT BEGINNING OF PERIOD $ 16 461 $ 18 325 $ 2 735 $ 1 928 $ 50 665 $ 39 169 $ 16 320 $ 7 436 INCREASE (DECREASE) IN NAV 923 (1 035) 170 (138) 2 719 (2 741) 948 (745)Early redemption fees – – – – – – – – Proceeds from redeemable mutual fund shares issued 2 618 3 164 229 1 352 12 906 34 176 6 818 16 863 Reinvestments of distributions to holders of redeemable mutual fund shares – – – – – – 53 89 Redemption of redeemable mutual fund shares (8 049) (3 993) (685) (407) (31 038) (19 939) (12 932) (6 724)NET INCREASE (DECREASE) FROM REDEEMABLE MUTUAL FUND SHARE TRANSACTIONS (5 431) (829) (456) 945 (18 132) 14 237 (6 061) 10 228 Distributions from net income – – – – – – – – Distributions from net gains – – – – – – – – Distributions from capital – – – – – – (729) (599)TOTAL DISTRIBUTIONS TO HOLDERS OF REDEEMABLE MUTUAL FUND SHARES – – – – – – (729) (599)NET INCREASE (DECREASE) IN NAV (4 508) (1 864) (286) 807 (15 413) 11 496 (5 842) 8 884 NAV AT END OF PERIOD $ 11 953 $ 16 461 $ 2 449 $ 2 735 $ 35 252 $ 50 665 $ 10 478 $ 16 320
216

FINANCIAL STATEMENTS
The accompanying notes are an integral part of these financial statements.
BLUEBAY GLOBAL CONVERTIBLE BOND CLASS (CANADA)
Statements of Changes in NAV (cont.) (in $000s)
For the periods ended March 31 (see note 2 in the generic notes)
Series I Series O Total2017 2016 2017 2016 2017 2016
NAV AT BEGINNING OF PERIOD $ 15 351 $ 16 443 $ 274 $ 147 $ 150 836 $ 131 638 INCREASE (DECREASE) IN NAV 999 (1 319) 21 (18) 7 992 (9 336)Early redemption fees – – – – – – Proceeds from redeemable mutual fund shares issued 1 486 12 131 98 265 28 147 87 289 Reinvestments of distributions to holders of redeemable mutual fund shares – – – – 90 146 Redemption of redeemable mutual fund shares (7 012) (11 904) (131) (120) (85 288) (58 113)NET INCREASE (DECREASE) FROM REDEEMABLE MUTUAL FUND SHARE TRANSACTIONS (5 526) 227 (33) 145 (57 051) 29 322 Distributions from net income – – – – – – Distributions from net gains – – – – – – Distributions from capital – – – – (865) (788)TOTAL DISTRIBUTIONS TO HOLDERS OF REDEEMABLE MUTUAL FUND SHARES – – – – (865) (788)NET INCREASE (DECREASE) IN NAV (4 527) (1 092) (12) 127 (49 924) 19 198 NAV AT END OF PERIOD $ 10 824 $ 15 351 $ 262 $ 274 $ 100 912 $ 150 836
217

NOTES TO FINANCIAL STATEMENTS – FUND SPECIFIC INFORMATION
Please see the generic notes at the back of the financial statements.
March 31, 2017
BLUEBAY GLOBAL CONVERTIBLE BOND CLASS (CANADA)
Series H and Series I mutual fund shares have been capped
and are no longer available for purchase by new investors
effective June 30, 2016. Existing investors who hold Series H
and Series I mutual fund shares of the Fund can continue to
make additional investments into these series. In addition,
RBC GAM may maintain capacity for certain investors,
including other related funds, that may invest in these series.
General information (see note 1 in the generic notes)
The investment objective of the Fund is to provide total
returns consisting of interest income and modest capital
appreciation through exposure to global convertible bonds.
Financial instrument risk and capital management (see note 4 in the generic notes)
The Fund invests in the BlueBay Global Convertible Bond
Fund (Canada). The Fund’s exposure to financial instrument
risk is based on the underlying mutual fund asset mix.
Credit risk (%)
The table below summarizes the BlueBay Global Convertible
Bond Fund (Canada)’s exposure to credit risk grouped by
credit ratings as at:
RatingMarch 31
2017March 31
2016
A 8.7 10.8BBB 5.8 6.1BB 9.7 13.5B 8.2 6.4Unrated 67.6 63.2Total 100.0 100.0
Concentration risk (%)
The table below summarizes the Fund’s investment portfolio
(after consideration of derivative products, if any) as at:
Investment mixMarch 31
2017March 31
2016
United States 31.8 28.5Japan 15.0 13.9China 9.0 6.4Germany 6.1 3.7United Kingdom 5.9 3.9South Africa 3.0 1.0Hong Kong 2.7 4.6Taiwan 2.7 2.0Netherlands 2.3 3.2Norway 2.2 2.5
Investment mixMarch 31
2017March 31
2016
Malaysia 1.7 2.7Singapore 1.3 1.6France 1.2 3.0United Arab Emirates 1.0 2.3Other Countries 6.0 10.2Cash/Other 8.1 10.5Total 100.0 100.0
Interest rate risk (%)
The table below summarizes the BlueBay Global Convertible
Bond Fund (Canada)’s exposure to interest rate risk by
remaining term to maturity as at:
Term to maturityMarch 31
2017March 31
2016
Less than 1 year 9.0 1.71 – 5 years 55.4 78.35 – 10 years 29.1 14.3> 10 years 6.5 5.7Total 100.0 100.0
As at March 31, 2017, had prevailing interest rates risen or
lowered by 1%, with all other factors kept constant, the Fund’s
net assets may have decreased or increased, respectively,
by approximately 3.5% (March 31, 2016 – 3.1%). In practice,
actual results could differ from this sensitivity analysis and
the difference could be material.
Currency risk (% of net assets)
Since the currency risk of the underlying fund has been
hedged using foreign exchange contracts, the Fund has
minimal sensitivity to changes in foreign exchange rates.
Fair value hierarchy ($000s except % amounts) (see note 3 in the generic notes)
The following is a summary of the inputs used as of
March 31, 2017 and 2016.
March 31, 2017 Level 1 Level 2 Level 3 Total
Equities – – – – Mutual fund units 101 174 – – 101 174Fixed-income and debt securities – – – – Short-term investments – – – – Derivatives – assets – – – – Derivatives – liabilities – – – – Total financial instruments 101 174 – – 101 174% of total portfolio 100.0 – – 100.0
218

NOTES TO FINANCIAL STATEMENTS – FUND SPECIFIC INFORMATION
Please see the generic notes at the back of the financial statements.
March 31, 2017
BLUEBAY GLOBAL CONVERTIBLE BOND CLASS (CANADA)
March 31, 2016 Level 1 Level 2 Level 3 Total
Equities – – – – Mutual fund units 151 089 – – 151 089 Fixed-income and debt securities – – – – Short-term investments – – – – Derivatives – assets – – – – Derivatives – liabilities – – – – Total financial instruments 151 089 – – 151 089 % of total portfolio 100.0 – – 100.0
For the periods ended March 31, 2017 and 2016, there were
no transfers of financial instruments between Level 1, Level 2
and Level 3.
Management fees and operating expenses (see note 6 in the generic notes)
Management fees and administration fees of each series
of the Fund are payable to RBC GAM and calculated at the
following annual percentages, before GST/HST, of the daily
net asset value of each series of the Fund.
Management fees* Operating expenses
Series A 1.65% 0.02%Advisor Series 1.65% 0.02%Advisor T5 Series 1.65% 0.02%Series T5 1.65% 0.02%Series H 1.45% 0.02%Series D 1.05% 0.02%Series F 0.90% 0.02%Series FT5 0.90% 0.02%Series I 0.70% 0.02%Series O n/a† 0.02%
* Effective June 30, 2016, the management fees for Series A, Advisor Series, Advisor T5 Series and Series T5 mutual fund shares were reduced to 1.65% from 1.70%; for Series D mutual fund shares were reduced to 1.05% from 1.10%; and for Series F and Series FT5 mutual fund shares were reduced to 0.90% from 0.95%.
† Series O shareholders pay a negotiated management fee directly to RBC GAM for investment-counselling services.
Investments by related parties ($000s except mutual fund share amounts)
Royal Bank of Canada, or one of its subsidiaries, held the
following investments in the Fund as at:
March 31 2017
March 31 2016
Mutual fund shares held Series A 100 100 Advisor Series 100 100 Advisor T5 Series 115 109 Series T5 115 109 Series H 100 100
March 31 2017
March 31 2016
Series D 100 100 Series F 100 100 Series FT5 114 109 Series I 100 100 Series O 100 100Value of all mutual fund shares 11 10
Underlying mutual fund ownership interest (%)
The table below summarizes the Fund’s interest in the
underlying mutual fund as a percentage of NAV, and the
Fund’s ownership interest as a percentage of the net assets of
the underlying fund (“Ownership”). The underlying fund is
established and conducts business in Canada, and has an
associate relationship to the Fund.
March 31 2017
March 31 2016
NAV Ownership NAV Ownership
BlueBay Global Convertible Bond Fund (Canada) 100.3 9.2 100.2 12.0
Taxes ($000s) (see note 5 in the generic notes)
The Fund had no capital or non-capital losses as at
March 31, 2017.
Redeemable mutual fund shares (000s)
There is no limitation on the number of mutual fund shares
available for issue. Mutual fund shares are purchased and
redeemed at the NAV per mutual fund share.
For the periods ended March 31 (see note 2 in the generic notes) 2017 2016
Series A Opening mutual fund shares 1 142 1 000Issued number of mutual fund shares 192 403Reinvested number of mutual fund shares – – Redeemed number of mutual fund shares (738) (261)Ending number of mutual fund shares 596 1 142
Advisor SeriesOpening mutual fund shares 3 247 3 178Issued number of mutual fund shares 153 1 118Reinvested number of mutual fund shares – – Redeemed number of mutual fund shares (1 481) (1 049)Ending number of mutual fund shares 1 919 3 247
Advisor T5 SeriesOpening mutual fund shares 244 205Issued number of mutual fund shares 31 125Reinvested number of mutual fund shares 3 2Redeemed number of mutual fund shares (110) (88)Ending number of mutual fund shares 168 244
219
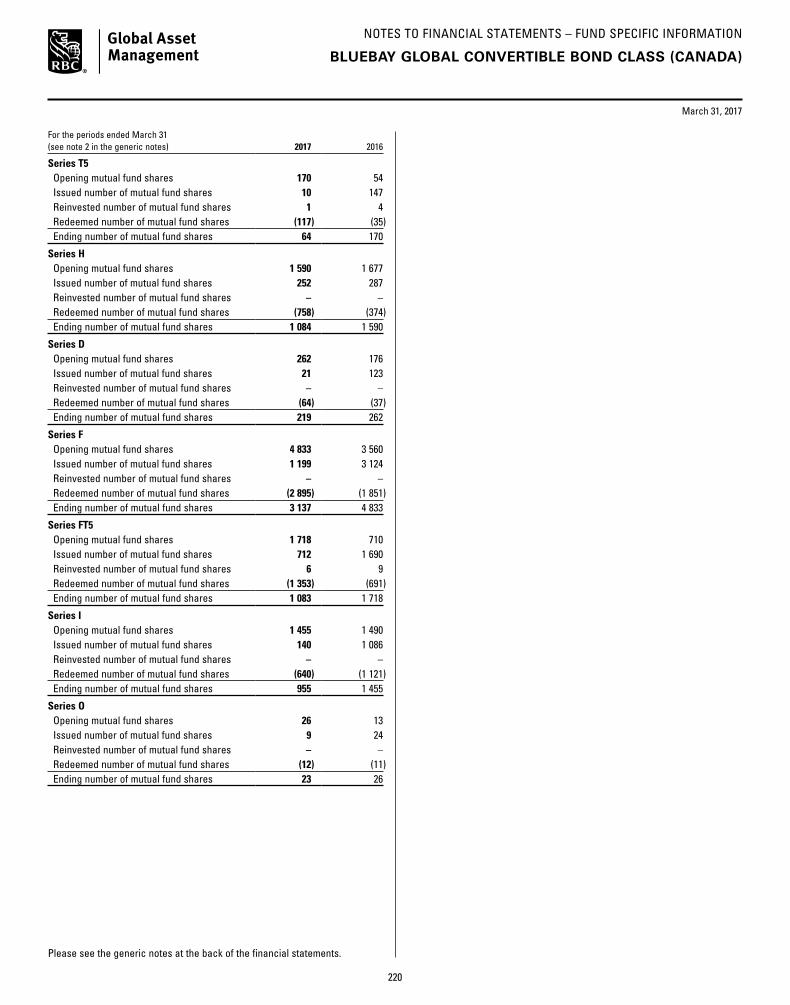
NOTES TO FINANCIAL STATEMENTS – FUND SPECIFIC INFORMATION
Please see the generic notes at the back of the financial statements.
March 31, 2017
For the periods ended March 31 (see note 2 in the generic notes) 2017 2016
Series T5Opening mutual fund shares 170 54Issued number of mutual fund shares 10 147Reinvested number of mutual fund shares 1 4Redeemed number of mutual fund shares (117) (35)Ending number of mutual fund shares 64 170
Series HOpening mutual fund shares 1 590 1 677Issued number of mutual fund shares 252 287Reinvested number of mutual fund shares – – Redeemed number of mutual fund shares (758) (374)Ending number of mutual fund shares 1 084 1 590
Series DOpening mutual fund shares 262 176Issued number of mutual fund shares 21 123Reinvested number of mutual fund shares – – Redeemed number of mutual fund shares (64) (37)Ending number of mutual fund shares 219 262
Series FOpening mutual fund shares 4 833 3 560Issued number of mutual fund shares 1 199 3 124Reinvested number of mutual fund shares – – Redeemed number of mutual fund shares (2 895) (1 851)Ending number of mutual fund shares 3 137 4 833
Series FT5Opening mutual fund shares 1 718 710Issued number of mutual fund shares 712 1 690Reinvested number of mutual fund shares 6 9Redeemed number of mutual fund shares (1 353) (691)Ending number of mutual fund shares 1 083 1 718
Series IOpening mutual fund shares 1 455 1 490Issued number of mutual fund shares 140 1 086Reinvested number of mutual fund shares – – Redeemed number of mutual fund shares (640) (1 121)Ending number of mutual fund shares 955 1 455
Series O Opening mutual fund shares 26 13Issued number of mutual fund shares 9 24Reinvested number of mutual fund shares – – Redeemed number of mutual fund shares (12) (11)Ending number of mutual fund shares 23 26
BLUEBAY GLOBAL CONVERTIBLE BOND CLASS (CANADA)
220

ANNUAL FINANCIAL STATEMENTS
March 31, 2017
The accompanying notes are an integral part of the financial statements.
SCHEDULE OF INVESTMENT PORTFOLIO (in USD000s)
BLUEBAY $U.S. GLOBAL CONVERTIBLE BOND CLASS (CANADA)
Number Fair % of Net of Units Security Cost Value Assets
MUTUAL FUND UNITS 20 739 BlueBay $U.S. Global Convertible Bond Fund (Canada)* $ 196 $ 213
TOTAL MUTUAL FUND UNITS $ 196 213 100.0OTHER NET ASSETS ATTRIBUTABLE TO HOLDERS OF REDEEMABLE SHARES – –NET ASSETS ATTRIBUTABLE TO HOLDERS OF REDEEMABLE SHARES $ 213 100.0
* Investment in related party (see note 6 in the generic notes).
221
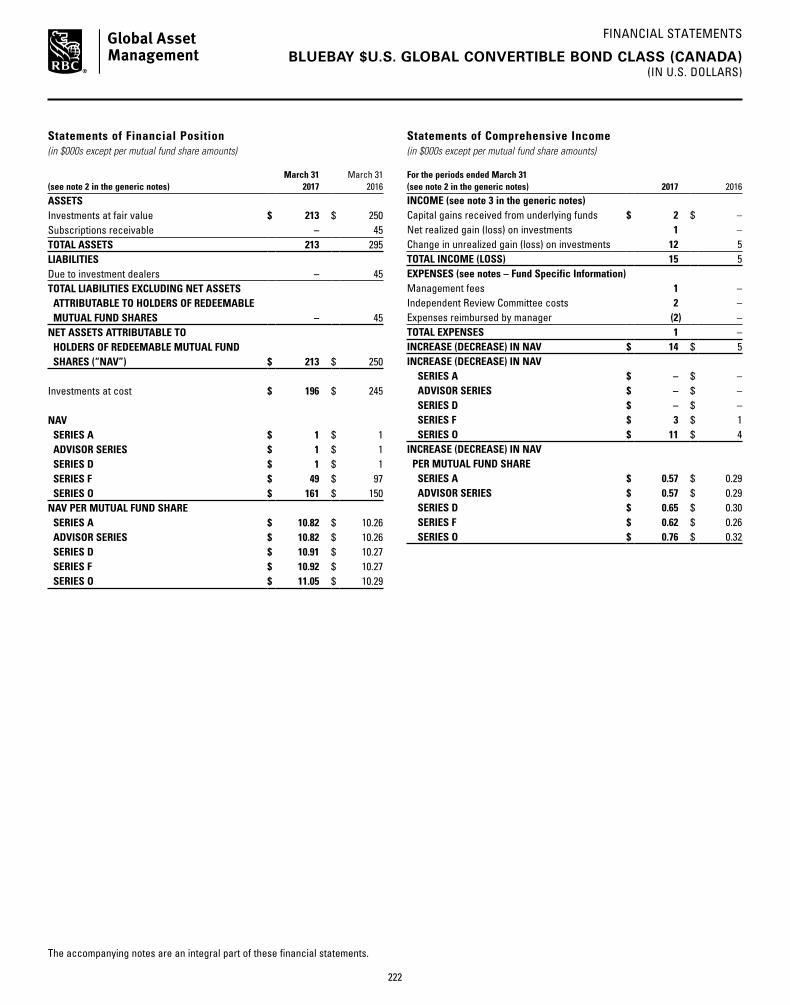
FINANCIAL STATEMENTS
The accompanying notes are an integral part of these financial statements.
BLUEBAY $U.S. GLOBAL CONVERTIBLE BOND CLASS (CANADA)(IN U.S. DOLLARS)
Statements of Financial Position (in $000s except per mutual fund share amounts)
(see note 2 in the generic notes)March 31
2017March 31
2016
ASSETSInvestments at fair value $ 213 $ 250 Subscriptions receivable – 45 TOTAL ASSETS 213 295 LIABILITIESDue to investment dealers – 45 TOTAL LIABILITIES EXCLUDING NET ASSETS ATTRIBUTABLE TO HOLDERS OF REDEEMABLE MUTUAL FUND SHARES – 45 NET ASSETS ATTRIBUTABLE TO HOLDERS OF REDEEMABLE MUTUAL FUND SHARES (“NAV”) $ 213 $ 250
Investments at cost $ 196 $ 245
NAV SERIES A $ 1 $ 1 ADVISOR SERIES $ 1 $ 1 SERIES D $ 1 $ 1 SERIES F $ 49 $ 97 SERIES O $ 161 $ 150 NAV PER MUTUAL FUND SHARE SERIES A $ 10.82 $ 10.26 ADVISOR SERIES $ 10.82 $ 10.26 SERIES D $ 10.91 $ 10.27 SERIES F $ 10.92 $ 10.27 SERIES O $ 11.05 $ 10.29
Statements of Comprehensive Income (in $000s except per mutual fund share amounts)
For the periods ended March 31 (see note 2 in the generic notes) 2017 2016INCOME (see note 3 in the generic notes)Capital gains received from underlying funds $ 2 $ –Net realized gain (loss) on investments 1 – Change in unrealized gain (loss) on investments 12 5 TOTAL INCOME (LOSS) 15 5EXPENSES (see notes – Fund Specific Information)Management fees 1 – Independent Review Committee costs 2 –Expenses reimbursed by manager (2) –TOTAL EXPENSES 1 –INCREASE (DECREASE) IN NAV $ 14 $ 5INCREASE (DECREASE) IN NAV SERIES A $ – $ – ADVISOR SERIES $ – $ – SERIES D $ – $ – SERIES F $ 3 $ 1 SERIES O $ 11 $ 4 INCREASE (DECREASE) IN NAV PER MUTUAL FUND SHARE SERIES A $ 0.57 $ 0.29 ADVISOR SERIES $ 0.57 $ 0.29 SERIES D $ 0.65 $ 0.30 SERIES F $ 0.62 $ 0.26 SERIES O $ 0.76 $ 0.32
222

FINANCIAL STATEMENTS
The accompanying notes are an integral part of these financial statements.
BLUEBAY $U.S. GLOBAL CONVERTIBLE BOND CLASS (CANADA)(IN U.S. DOLLARS)
Statements of Cash Flow (in $000s)
For the periods ended March 31 (see note 2 in the generic notes) 2017
2016
CASH FLOWS FROM OPERATING ACTIVITIESIncrease (decrease) in NAV $ 14 $ 5 ADJUSTMENTS TO RECONCILE NET CASH PROVIDED BY (USED IN) OPERATIONSInterest for distribution purposes – – Net realized loss (gain) on investments (1) – Change in unrealized loss (gain) on investments (12) (5)(Increase) decrease in accrued receivables – – Increase (decrease) in accrued payables – – Cost of investments purchased (47) (200)Proceeds on sales of investments 52 – NET CASH PROVIDED BY (USED IN) OPERATING ACTIVITIES 6 (200)CASH FLOWS FROM FINANCING ACTIVITIESProceeds from issue of redeemable mutual fund shares 45 200 Cash paid on redemption of redeemable mutual fund shares (51) – Distributions paid to holders of redeemable mutual fund shares – – NET CASH PROVIDED BY (USED IN) FINANCING ACTIVITIES $ (6) $ 200 Net increase (decrease) in cash for the period – – Cash (bank overdraft), beginning of period – – CASH (BANK OVERDRAFT), END OF PERIOD $ – $ –
Interest received (paid) $ – $ – Dividends received, net of withholding taxes $ – $ –
Cash consists of cash and futures contracts margin receivable/payable, as applicable.
223

FINANCIAL STATEMENTS
The accompanying notes are an integral part of these financial statements.
BLUEBAY $U.S. GLOBAL CONVERTIBLE BOND CLASS (CANADA)(IN U.S. DOLLARS)
Statements of Changes in NAV (in $000s)
For the periods ended March 31 (see note 2 in the generic notes)
Series A Advisor Series Series D Series F2017 2016 2017 2016 2017 2016 2017 2016
NAV AT BEGINNING OF PERIOD $ 1 $ – $ 1 $ – $ 1 $ – $ 97 $ – INCREASE (DECREASE) IN NAV – – – – – – 3 1 Early redemption fees – – – – – – – – Proceeds from redeemable mutual fund shares issued – 1 – 1 – 1 – 96 Reinvestments of distributions to holders of redeemable mutual fund shares – – – – – – – – Redemption of redeemable mutual fund shares – – – – – – (51) – NET INCREASE (DECREASE) FROM REDEEMABLE MUTUAL FUND SHARE TRANSACTIONS – 1 – 1 – 1 (51) 96 Distributions from net income – – – – – – – – Distributions from net gains – – – – – – – – Distributions from capital – – – – – – – – TOTAL DISTRIBUTIONS TO HOLDERS OF REDEEMABLE MUTUAL FUND SHARES – – – – – – – – NET INCREASE (DECREASE) IN NAV – 1 – 1 – 1 (48) 97 NAV AT END OF PERIOD $ 1 $ 1 $ 1 $ 1 $ 1 $ 1 $ 49 $ 97
For the periods ended March 31 (see note 2 in the generic notes)
Series O Total2017 2016 2017 2016
NAV AT BEGINNING OF PERIOD $ 150 $ – $ 250 $ – INCREASE (DECREASE) IN NAV 11 4 14 5 Early redemption fees – – – – Proceeds from redeemable mutual fund shares issued – 146 – 245 Reinvestments of distributions to holders of redeemable mutual fund shares – – – – Redemption of redeemable mutual fund shares – – (51) – NET INCREASE (DECREASE) FROM REDEEMABLE MUTUAL FUND SHARE TRANSACTIONS – 146 (51) 245 Distributions from net income – – – – Distributions from net gains – – – – Distributions from capital – – – – TOTAL DISTRIBUTIONS TO HOLDERS OF REDEEMABLE MUTUAL FUND SHARES – – – – NET INCREASE (DECREASE) IN NAV 11 150 (37) 250 NAV AT END OF PERIOD $ 161 $ 150 $ 213 $ 250
224

NOTES TO FINANCIAL STATEMENTS – FUND SPECIFIC INFORMATION
Please see the generic notes at the back of the financial statements.
March 31, 2017
BLUEBAY $U.S. GLOBAL CONVERTIBLE BOND CLASS (CANADA)
General information (see note 1 in the generic notes)
The investment objective of the Fund is to provide U.S. dollar
total returns comprised of interest income and modest capital
appreciation through exposure to global convertible bonds.
The Fund was started in October 2015.
Financial instrument risk and capital management (see note 4 in the generic notes)
The Fund invests in the BlueBay $U.S. Global Convertible
Bond Fund (Canada). The Fund’s exposure to financial
instrument risk is based on the underlying mutual fund
asset mix.
Credit risk (%)
The table below summarizes the BlueBay $U.S. Global
Convertible Bond Fund (Canada)’s exposure to credit risk
grouped by credit ratings as at:
RatingMarch 31
2017March 31
2016
AAA – 1.2A 9.6 10.4BBB 6.4 6.9BB 9.2 11.5B 5.1 6.2Unrated 69.7 63.8 Total 100.0 100.0
Concentration risk (%)
The table below summarizes the Fund’s investment portfolio
(after consideration of derivative products, if any) as at:
Investment mixMarch 31
2017March 31
2016
United States 25.9 26.1Japan 16.5 14.5China 9.7 8.8Germany 6.9 5.8United Kingdom 5.9 3.5Taiwan 4.5 6.0Hong Kong 3.2 4.4Malaysia 3.2 2.8South Africa 2.9 –Norway 1.9 2.2Singapore 1.8 2.6Philippines 1.5 1.2France 1.3 3.7
Investment mixMarch 31
2017March 31
2016
Netherlands 1.3 2.5United Arab Emirates 1.2 2.9Mexico 1.1 4.1Other Countries 3.3 4.8Cash/Other 7.9 4.1Total 100.0 100.0
Interest rate risk (%)
The table below summarizes the BlueBay $U.S. Global
Convertible Bond Fund (Canada)’s exposure to interest rate
risk by remaining term to maturity as at:
Term to maturityMarch 31
2017March 31
2016
Less than 1 year 8.0 2.01 – 5 years 59.6 77.55 – 10 years 25.9 15.7> 10 years 6.5 4.8 Total 100.0 100.0
As at March 31, 2017, had prevailing interest rates risen or
lowered by 1%, with all other factors kept constant, the Fund’s
net assets may have decreased or increased, respectively,
by approximately 3.3% (March 31, 2016 – 3.1%). In practice,
actual results could differ from this sensitivity analysis and
the difference could be material.
Currency risk (% of net assets)
Since the currency risk of the underlying fund has been
hedged using foreign exchange contracts, the Fund has
minimal sensitivity to changes in foreign exchange rates.
Fair value hierarchy (USD000s except % amounts) (see note 3 in the generic notes)
The following is a summary of the inputs used as of
March 31, 2017 and 2016.
March 31, 2017 Level 1 Level 2 Level 3 Total
Equities – – – – Mutual fund units 213 – – 213Fixed-income and debt securities – – – – Short-term investments – – – – Derivatives – assets – – – – Derivatives – liabilities – – – – Total financial instruments 213 – – 213% of total portfolio 100.0 – – 100.0
225

NOTES TO FINANCIAL STATEMENTS – FUND SPECIFIC INFORMATION
Please see the generic notes at the back of the financial statements.
March 31, 2017
BLUEBAY $U.S. GLOBAL CONVERTIBLE BOND CLASS (CANADA)
March 31, 2016 Level 1 Level 2 Level 3 Total
Equities – – – – Mutual fund units 250 – – 250 Fixed-income and debt securities – – – – Short-term investments – – – – Derivatives – assets – – – – Derivatives – liabilities – – – – Total financial instruments 250 – – 250 % of total portfolio 100.0 – – 100.0
For the periods ended March 31, 2017 and 2016, there were
no transfers of financial instruments between Level 1, Level 2
and Level 3.
Management fees and operating expenses (see note 6 in the generic notes)
Management fees and administration fees of each series
of the Fund are payable to RBC GAM and calculated at the
following annual percentages, before GST/HST, of the daily
net asset value of each series of the Fund.
Management fees* Operating expenses
Series A 1.65% 0.02%Advisor Series 1.65% 0.02%Series D 1.05% 0.02%Series F 0.90% 0.02%Series O n/a† 0.02%
* Effective June 30, 2016, the management fees for Series A and Advisor Series mutual fund shares were reduced to 1.65% from 1.70%; for Series D mutual fund shares were reduced to 1.05% from 1.10%; and for Series F mutual fund shares were reduced to 0.90% from 0.95%.
† Series O shareholders pay a negotiated management fee directly to RBC GAM for investment-counselling services.
Investments by related parties (USD000s except mutual fund share amounts)
Royal Bank of Canada, or one of its subsidiaries, held the
following investments in the Fund as at:
March 31 2017
March 31 2016
Mutual fund shares held Series A 100 100 Advisor Series 100 100 Series D 100 100 Series F 100 100 Series O 14 600 14 600 Value of all mutual fund shares 166 154
Underlying mutual fund ownership interest (%)
The table below summarizes the Fund’s interest in the
underlying mutual fund as a percentage of NAV, and the
Fund’s ownership interest as a percentage of the net assets of
the underlying fund (“Ownership”). The underlying fund is
established and conducts business in Canada, and has an
associate relationship to the Fund.
March 31 2017
March 31 2016
NAV Ownership NAV Ownership
BlueBay $U.S. Global Convertible Bond Fund (Canada) 100.0 0.5 100.0 0.7
Taxes (CAD000s) (see note 5 in the generic notes)
The Fund prepares its financial statements in U.S. dollars
but is taxable on its income and net realized capital gains
(including gains from foreign exchange movements)
calculated on a Canadian dollar basis.
The Fund had no capital or non-capital losses as at
March 31, 2017.
Redeemable mutual fund shares (000s)
There is no limitation on the number of mutual fund shares
available for issue. Mutual fund shares are purchased and
redeemed at the NAV per mutual fund share.
For the periods ended March 31 (see note 2 in the generic notes) 2017 2016
Series A Opening mutual fund shares – – Issued number of mutual fund shares – – Reinvested number of mutual fund shares – – Redeemed number of mutual fund shares – – Ending number of mutual fund shares – –
Advisor SeriesOpening mutual fund shares – – Issued number of mutual fund shares – – Reinvested number of mutual fund shares – – Redeemed number of mutual fund shares – – Ending number of mutual fund shares – –
Series DOpening mutual fund shares – – Issued number of mutual fund shares – – Reinvested number of mutual fund shares – – Redeemed number of mutual fund shares – – Ending number of mutual fund shares – –
226
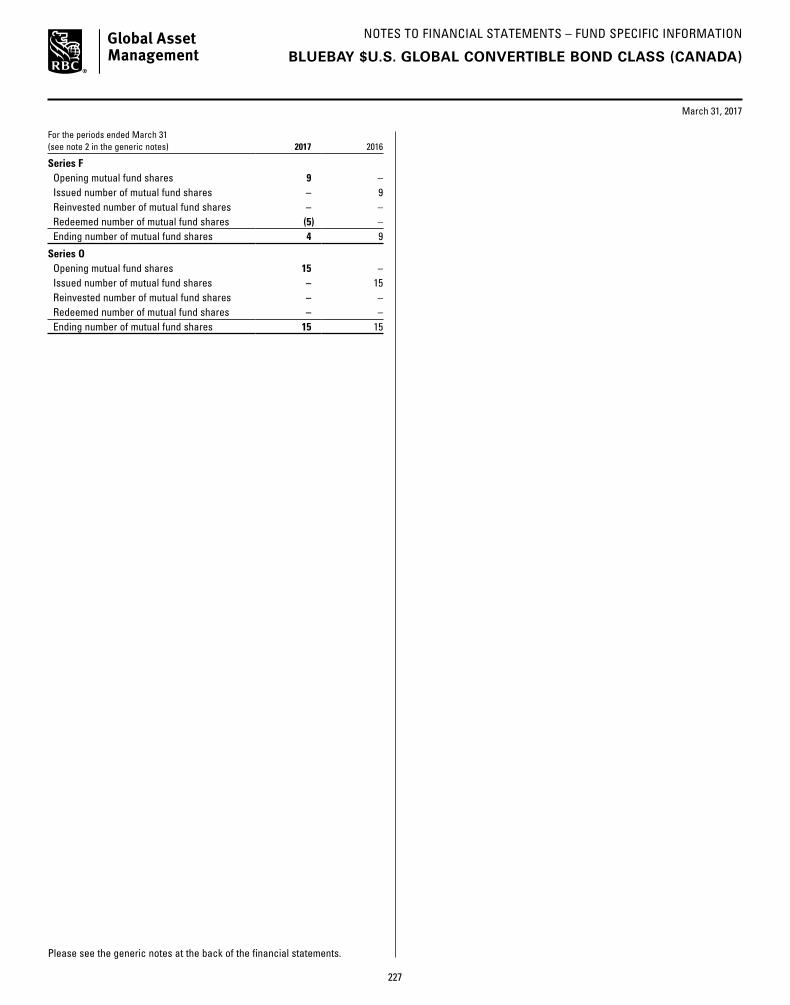
NOTES TO FINANCIAL STATEMENTS – FUND SPECIFIC INFORMATION
Please see the generic notes at the back of the financial statements.
March 31, 2017
For the periods ended March 31 (see note 2 in the generic notes) 2017 2016
Series FOpening mutual fund shares 9 – Issued number of mutual fund shares – 9Reinvested number of mutual fund shares – – Redeemed number of mutual fund shares (5) – Ending number of mutual fund shares 4 9
Series O Opening mutual fund shares 15 – Issued number of mutual fund shares – 15Reinvested number of mutual fund shares – – Redeemed number of mutual fund shares – – Ending number of mutual fund shares 15 15
BLUEBAY $U.S. GLOBAL CONVERTIBLE BOND CLASS (CANADA)
227

SCHEDULE OF INVESTMENT PORTFOLIO (in $000s)
ANNUAL FINANCIAL STATEMENTS
March 31, 2017
The accompanying notes are an integral part of the financial statements.
PHILLIPS, HAGER & NORTH MONTHLY INCOME CLASS
Number Fair % of Net of Units Security Cost Value Assets
MUTUAL FUND UNITS 10 818 161 Phillips, Hager & North Monthly Income Fund* $ 120 600 $ 121 525
TOTAL MUTUAL FUND UNITS $ 120 600 121 525 100.0OTHER NET ASSETS ATTRIBUTABLE TO HOLDERS OF REDEEMABLE SHARES 34 –NET ASSETS ATTRIBUTABLE TO HOLDERS OF REDEEMABLE SHARES $ 121 559 100.0
* Investment in related party (see note 6 in the generic notes).
228
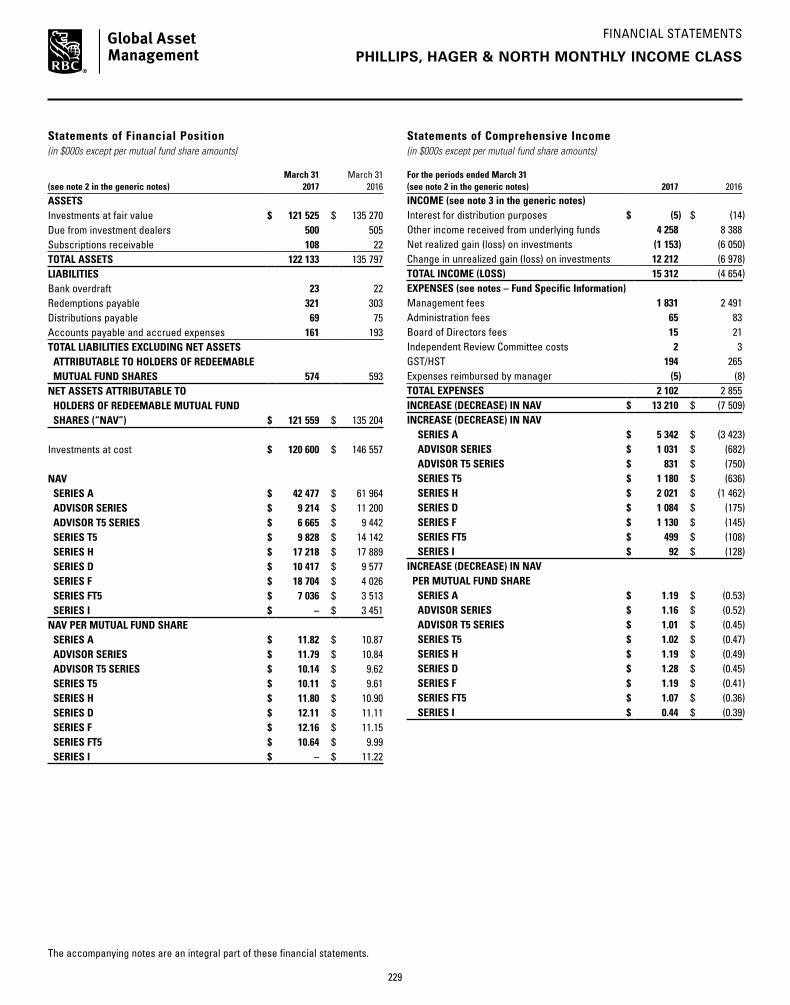
FINANCIAL STATEMENTS
The accompanying notes are an integral part of these financial statements.
PHILLIPS, HAGER & NORTH MONTHLY INCOME CLASS
Statements of Financial Position (in $000s except per mutual fund share amounts)
(see note 2 in the generic notes)March 31
2017March 31
2016
ASSETSInvestments at fair value $ 121 525 $ 135 270 Due from investment dealers 500 505 Subscriptions receivable 108 22 TOTAL ASSETS 122 133 135 797 LIABILITIESBank overdraft 23 22 Redemptions payable 321 303 Distributions payable 69 75 Accounts payable and accrued expenses 161 193 TOTAL LIABILITIES EXCLUDING NET ASSETS ATTRIBUTABLE TO HOLDERS OF REDEEMABLE MUTUAL FUND SHARES 574 593 NET ASSETS ATTRIBUTABLE TO HOLDERS OF REDEEMABLE MUTUAL FUND SHARES (“NAV”) $ 121 559 $ 135 204
Investments at cost $ 120 600 $ 146 557
NAV SERIES A $ 42 477 $ 61 964 ADVISOR SERIES $ 9 214 $ 11 200 ADVISOR T5 SERIES $ 6 665 $ 9 442 SERIES T5 $ 9 828 $ 14 142 SERIES H $ 17 218 $ 17 889 SERIES D $ 10 417 $ 9 577 SERIES F $ 18 704 $ 4 026 SERIES FT5 $ 7 036 $ 3 513 SERIES I $ – $ 3 451 NAV PER MUTUAL FUND SHARE SERIES A $ 11.82 $ 10.87 ADVISOR SERIES $ 11.79 $ 10.84 ADVISOR T5 SERIES $ 10.14 $ 9.62 SERIES T5 $ 10.11 $ 9.61 SERIES H $ 11.80 $ 10.90 SERIES D $ 12.11 $ 11.11 SERIES F $ 12.16 $ 11.15 SERIES FT5 $ 10.64 $ 9.99 SERIES I $ – $ 11.22
Statements of Comprehensive Income (in $000s except per mutual fund share amounts)
For the periods ended March 31 (see note 2 in the generic notes) 2017 2016INCOME (see note 3 in the generic notes)Interest for distribution purposes $ (5) $ (14)Other income received from underlying funds 4 258 8 388 Net realized gain (loss) on investments (1 153) (6 050)Change in unrealized gain (loss) on investments 12 212 (6 978)TOTAL INCOME (LOSS) 15 312 (4 654)EXPENSES (see notes – Fund Specific Information)Management fees 1 831 2 491 Administration fees 65 83 Board of Directors fees 15 21 Independent Review Committee costs 2 3 GST/HST 194 265 Expenses reimbursed by manager (5) (8)TOTAL EXPENSES 2 102 2 855 INCREASE (DECREASE) IN NAV $ 13 210 $ (7 509)INCREASE (DECREASE) IN NAV SERIES A $ 5 342 $ (3 423) ADVISOR SERIES $ 1 031 $ (682) ADVISOR T5 SERIES $ 831 $ (750) SERIES T5 $ 1 180 $ (636) SERIES H $ 2 021 $ (1 462) SERIES D $ 1 084 $ (175) SERIES F $ 1 130 $ (145) SERIES FT5 $ 499 $ (108) SERIES I $ 92 $ (128)INCREASE (DECREASE) IN NAV PER MUTUAL FUND SHARE SERIES A $ 1.19 $ (0.53) ADVISOR SERIES $ 1.16 $ (0.52) ADVISOR T5 SERIES $ 1.01 $ (0.45) SERIES T5 $ 1.02 $ (0.47) SERIES H $ 1.19 $ (0.49) SERIES D $ 1.28 $ (0.45) SERIES F $ 1.19 $ (0.41) SERIES FT5 $ 1.07 $ (0.36) SERIES I $ 0.44 $ (0.39)
229

FINANCIAL STATEMENTS
The accompanying notes are an integral part of these financial statements.
PHILLIPS, HAGER & NORTH MONTHLY INCOME CLASS
Statements of Cash Flow (in $000s)
For the periods ended March 31 (see note 2 in the generic notes) 2017
2016
CASH FLOWS FROM OPERATING ACTIVITIESIncrease (decrease) in NAV $ 13 210 $ (7 509)ADJUSTMENTS TO RECONCILE NET CASH PROVIDED BY (USED IN) OPERATIONSInterest for distribution purposes – – Net realized loss (gain) on investments 1 153 6 050 Change in unrealized loss (gain) on investments (12 212) 6 978 (Increase) decrease in accrued receivables – – Increase (decrease) in accrued payables (32) (104)Cost of investments purchased (8 773) (17 736)Proceeds on sales of investments 33 582 68 598 NET CASH PROVIDED BY (USED IN) OPERATING ACTIVITIES 26 928 56 277 CASH FLOWS FROM FINANCING ACTIVITIESProceeds from issue of redeemable mutual fund shares 37 445 24 001 Cash paid on redemption of redeemable mutual fund shares (63 246) (79 071)Distributions paid to holders of redeemable mutual fund shares (1 128) (1 500)NET CASH PROVIDED BY (USED IN) FINANCING ACTIVITIES $ (26 929) $ (56 570)Net increase (decrease) in cash for the period (1) (293)Cash (bank overdraft), beginning of period (22) 271 CASH (BANK OVERDRAFT), END OF PERIOD $ (23) $ (22)
Interest received (paid) $ (5) $ (14)Dividends received, net of withholding taxes $ – $ –
Cash consists of cash and futures contracts margin receivable/payable, as applicable.
230

FINANCIAL STATEMENTS
The accompanying notes are an integral part of these financial statements.
PHILLIPS, HAGER & NORTH MONTHLY INCOME CLASS
Statements of Changes in NAV (in $000s)
For the periods ended March 31 (see note 2 in the generic notes)
Series A Advisor Series Advisor T5 Series Series T52017 2016 2017 2016 2017 2016 2017 2016
NAV AT BEGINNING OF PERIOD $ 61 964 $ 85 328 $ 11 200 $ 16 884 $ 9 442 $ 15 519 $ 14 142 $ 19 876 INCREASE (DECREASE) IN NAV 5 342 (3 423) 1 031 (682) 831 (750) 1 180 (636)Early redemption fees – – – – – – – – Proceeds from redeemable mutual fund shares issued 4 203 8 286 1 620 1 613 686 2 697 754 2 127 Reinvestments of distributions to holders of redeemable mutual fund shares 671 1 432 143 256 59 98 234 364 Redemption of redeemable mutual fund shares (28 994) (28 164) (4 627) (6 592) (3 966) (7 428) (5 936) (6 787)NET INCREASE (DECREASE) FROM REDEEMABLE MUTUAL FUND SHARE TRANSACTIONS (24 120) (18 446) (2 864) (4 723) (3 221) (4 633) (4 948) (4 296)Distributions from net income (709) (1 495) (153) (279) (146) (269) (204) (310)Distributions from net gains – – – – – – – – Distributions from capital – – – – (241) (425) (342) (492)TOTAL DISTRIBUTIONS TO HOLDERS OF REDEEMABLE MUTUAL FUND SHARES (709) (1 495) (153) (279) (387) (694) (546) (802)NET INCREASE (DECREASE) IN NAV (19 487) (23 364) (1 986) (5 684) (2 777) (6 077) (4 314) (5 734)NAV AT END OF PERIOD $ 42 477 $ 61 964 $ 9 214 $ 11 200 $ 6 665 $ 9 442 $ 9 828 $ 14 142
For the periods ended March 31 (see note 2 in the generic notes)
Series H Series D Series F Series FT52017 2016 2017 2016 2017 2016 2017 2016
NAV AT BEGINNING OF PERIOD $ 17 889 $ 35 658 $ 9 577 $ 8 007 $ 4 026 $ 5 464 $ 3 513 $ 4 558 INCREASE (DECREASE) IN NAV 2 021 (1 462) 1 084 (175) 1 130 (145) 499 (108)Early redemption fees – – – – – – – – Proceeds from redeemable mutual fund shares issued 6 164 1 960 2 411 3 805 16 655 2 080 4 610 460 Reinvestments of distributions to holders of redeemable mutual fund shares 271 381 219 286 312 132 61 24 Redemption of redeemable mutual fund shares (8 754) (18 161) (2 641) (2 044) (2 967) (3 364) (1 408) (1 220)NET INCREASE (DECREASE) FROM REDEEMABLE MUTUAL FUND SHARE TRANSACTIONS (2 319) (15 820) (11) 2 047 14 000 (1 152) 3 263 (736)Distributions from net income (373) (487) (233) (302) (452) (141) (89) (75)Distributions from net gains – – – – – – – – Distributions from capital – – – – – – (150) (126)TOTAL DISTRIBUTIONS TO HOLDERS OF REDEEMABLE MUTUAL FUND SHARES (373) (487) (233) (302) (452) (141) (239) (201)NET INCREASE (DECREASE) IN NAV (671) (17 769) 840 1 570 14 678 (1 438) 3 523 (1 045)NAV AT END OF PERIOD $ 17 218 $ 17 889 $ 10 417 $ 9 577 $ 18 704 $ 4 026 $ 7 036 $ 3 513
231
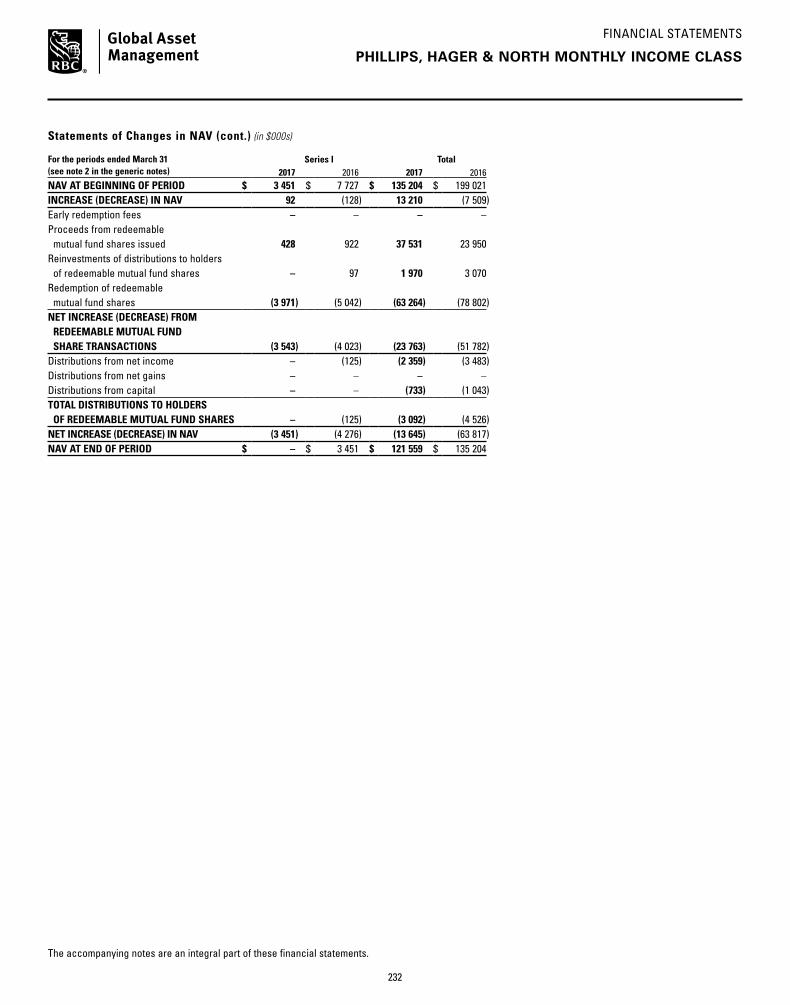
FINANCIAL STATEMENTS
The accompanying notes are an integral part of these financial statements.
Statements of Changes in NAV (cont.) (in $000s)
For the periods ended March 31 (see note 2 in the generic notes)
Series I Total2017 2016 2017 2016
NAV AT BEGINNING OF PERIOD $ 3 451 $ 7 727 $ 135 204 $ 199 021 INCREASE (DECREASE) IN NAV 92 (128) 13 210 (7 509)Early redemption fees – – – – Proceeds from redeemable mutual fund shares issued 428 922 37 531 23 950 Reinvestments of distributions to holders of redeemable mutual fund shares – 97 1 970 3 070 Redemption of redeemable mutual fund shares (3 971) (5 042) (63 264) (78 802)NET INCREASE (DECREASE) FROM REDEEMABLE MUTUAL FUND SHARE TRANSACTIONS (3 543) (4 023) (23 763) (51 782)Distributions from net income – (125) (2 359) (3 483)Distributions from net gains – – – – Distributions from capital – – (733) (1 043)TOTAL DISTRIBUTIONS TO HOLDERS OF REDEEMABLE MUTUAL FUND SHARES – (125) (3 092) (4 526)NET INCREASE (DECREASE) IN NAV (3 451) (4 276) (13 645) (63 817)NAV AT END OF PERIOD $ – $ 3 451 $ 121 559 $ 135 204
PHILLIPS, HAGER & NORTH MONTHLY INCOME CLASS
232

NOTES TO FINANCIAL STATEMENTS – FUND SPECIFIC INFORMATION
Please see the generic notes at the back of the financial statements.
March 31, 2017
PHILLIPS, HAGER & NORTH MONTHLY INCOME CLASS
Series H mutual fund shares have been capped and are no
longer available for purchase by new investors effective
June 30, 2016. Existing investors who hold Series H mutual
fund shares of the Fund can continue to make additional
investments into this series. In addition, RBC GAM may
maintain capacity for certain investors, including other
related funds, that may invest in this series.
General information (see note 1 in the generic notes)
The investment objective of the Fund is to provide monthly
income that may consist of dividend income, interest
income, realized capital gains and return of capital.
Financial instrument risk and capital management (see note 4 in the generic notes)
The Fund invests in the Phillips, Hager & North Monthly
Income Fund. The Fund’s exposure to financial instrument
risk is based on the underlying mutual fund asset mix.
Credit risk (%)
Credit-exposed securities, excluding short-term investments,
comprise 42.0% (March 31, 2016 – 43.9%) of the net assets of
the Fund. The table below summarizes the Phillips, Hager &
North Monthly Income Fund’s exposure to credit risk grouped
by credit ratings as at:
RatingMarch 31
2017March 31
2016
AAA 24.6 20.5AA 26.2 30.3A 12.9 11.4BBB 14.6 20.0BB 8.6 7.8B 9.6 7.2CCC 3.2 2.7Unrated 0.3 0.1Total 100.0 100.0
Concentration risk (%)
The table below summarizes the Fund’s investment portfolio
(after consideration of derivative products, if any) as at:
Investment mixMarch 31
2017March 31
2016
Canadian Equities 50.2 47.5Bonds 32.3 41.6Investment Funds 9.8 –Preferred Equities 5.4 5.1Cash/Other 2.3 5.8Total 100.0 100.0
Interest rate risk (%)
Fixed-income and debt securities, excluding short-term
investments, comprise 32.3% (March 31, 2016 – 34.1%) of
the net assets of the Fund. The table below summarizes the
Phillips, Hager & North Monthly Income Fund’s exposure to
interest rate risk by remaining term to maturity as at:
Term to maturityMarch 31
2017March 31
2016
Less than 1 year 3.6 14.71 – 5 years 36.6 27.65 – 10 years 27.8 21.8> 10 years 32.0 35.9Total 100.0 100.0
As at March 31, 2017, had prevailing interest rates risen or
lowered by 1%, with all other factors kept constant, the Fund’s
net assets may have decreased or increased, respectively, by
approximately 2.3% (March 31, 2016 – 2.4%). In practice,
actual results could differ from this sensitivity analysis and
the difference could be material.
Other price risk (% impact on net assets)
The table below shows the impact of a 1% change in the
broad-based index (noted below) on the Fund’s net assets,
using a 36-month historical correlation of data of the Fund’s
return and the index, with all other factors kept constant, as at:
March 31 2017
March 31 2016
S&P/TSX Capped Composite Total Return Index + or - 0.6 + or - 0.6
Since historical correlation may not be representative of
future correlation, actual results could differ from this
sensitivity analysis and the difference could be material.
Fair value hierarchy ($000s except % amounts) (see note 3 in the generic notes)
The following is a summary of the inputs used as of
March 31, 2017 and 2016.
March 31, 2017 Level 1 Level 2 Level 3 Total
Equities – – – – Mutual fund units 121 525 – – 121 525Fixed-income and debt securities – – – – Short-term investments – – – – Derivatives – assets – – – – Derivatives – liabilities – – – – Total financial instruments 121 525 – – 121 525% of total portfolio 100.0 – – 100.0
233
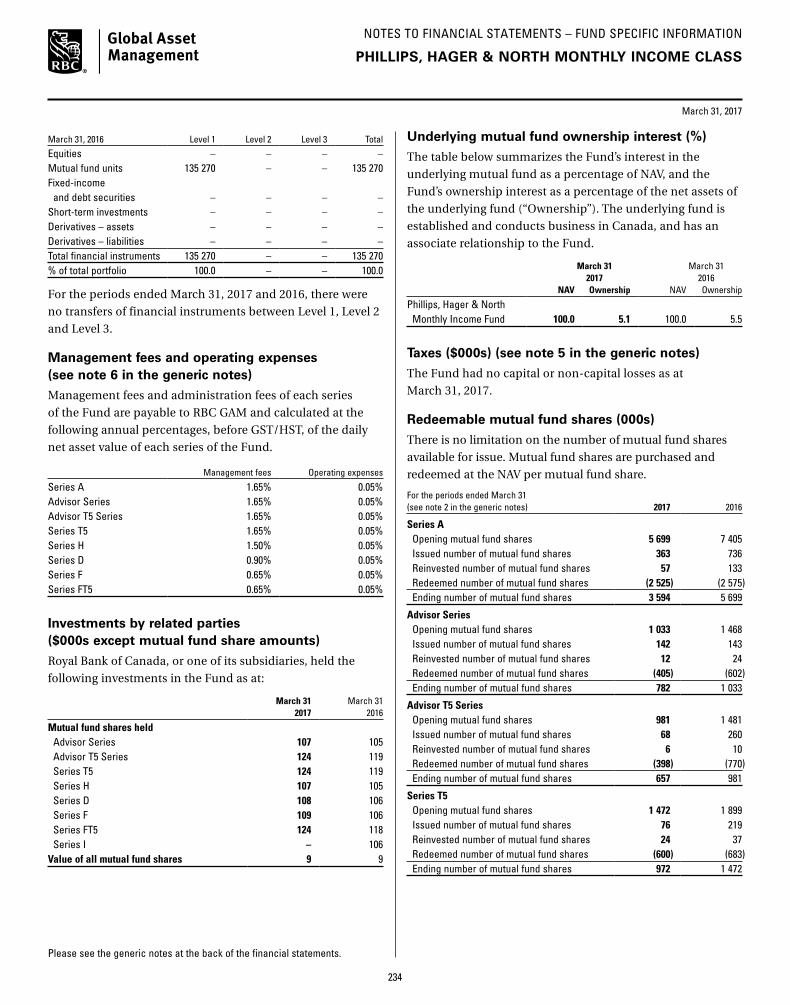
NOTES TO FINANCIAL STATEMENTS – FUND SPECIFIC INFORMATION
Please see the generic notes at the back of the financial statements.
March 31, 2017
PHILLIPS, HAGER & NORTH MONTHLY INCOME CLASS
March 31, 2016 Level 1 Level 2 Level 3 Total
Equities – – – – Mutual fund units 135 270 – – 135 270 Fixed-income and debt securities – – – – Short-term investments – – – – Derivatives – assets – – – – Derivatives – liabilities – – – – Total financial instruments 135 270 – – 135 270 % of total portfolio 100.0 – – 100.0
For the periods ended March 31, 2017 and 2016, there were
no transfers of financial instruments between Level 1, Level 2
and Level 3.
Management fees and operating expenses (see note 6 in the generic notes)
Management fees and administration fees of each series
of the Fund are payable to RBC GAM and calculated at the
following annual percentages, before GST/HST, of the daily
net asset value of each series of the Fund.
Management fees Operating expenses
Series A 1.65% 0.05%Advisor Series 1.65% 0.05%Advisor T5 Series 1.65% 0.05%Series T5 1.65% 0.05%Series H 1.50% 0.05%Series D 0.90% 0.05%Series F 0.65% 0.05%Series FT5 0.65% 0.05%
Investments by related parties ($000s except mutual fund share amounts)
Royal Bank of Canada, or one of its subsidiaries, held the
following investments in the Fund as at:
March 31 2017
March 31 2016
Mutual fund shares held Advisor Series 107 105 Advisor T5 Series 124 119 Series T5 124 119 Series H 107 105 Series D 108 106 Series F 109 106 Series FT5 124 118 Series I – 106Value of all mutual fund shares 9 9
Underlying mutual fund ownership interest (%)
The table below summarizes the Fund’s interest in the
underlying mutual fund as a percentage of NAV, and the
Fund’s ownership interest as a percentage of the net assets of
the underlying fund (“Ownership”). The underlying fund is
established and conducts business in Canada, and has an
associate relationship to the Fund.
March 31 2017
March 31 2016
NAV Ownership NAV Ownership
Phillips, Hager & North Monthly Income Fund 100.0 5.1 100.0 5.5
Taxes ($000s) (see note 5 in the generic notes)
The Fund had no capital or non-capital losses as at
March 31, 2017.
Redeemable mutual fund shares (000s)
There is no limitation on the number of mutual fund shares
available for issue. Mutual fund shares are purchased and
redeemed at the NAV per mutual fund share.
For the periods ended March 31 (see note 2 in the generic notes) 2017 2016
Series A Opening mutual fund shares 5 699 7 405Issued number of mutual fund shares 363 736Reinvested number of mutual fund shares 57 133Redeemed number of mutual fund shares (2 525) (2 575)Ending number of mutual fund shares 3 594 5 699
Advisor SeriesOpening mutual fund shares 1 033 1 468Issued number of mutual fund shares 142 143Reinvested number of mutual fund shares 12 24Redeemed number of mutual fund shares (405) (602)Ending number of mutual fund shares 782 1 033
Advisor T5 SeriesOpening mutual fund shares 981 1 481Issued number of mutual fund shares 68 260Reinvested number of mutual fund shares 6 10Redeemed number of mutual fund shares (398) (770)Ending number of mutual fund shares 657 981
Series T5Opening mutual fund shares 1 472 1 899Issued number of mutual fund shares 76 219Reinvested number of mutual fund shares 24 37Redeemed number of mutual fund shares (600) (683)Ending number of mutual fund shares 972 1 472
234

NOTES TO FINANCIAL STATEMENTS – FUND SPECIFIC INFORMATION
Please see the generic notes at the back of the financial statements.
March 31, 2017
PHILLIPS, HAGER & NORTH MONTHLY INCOME CLASS
For the periods ended March 31 (see note 2 in the generic notes) 2017 2016
Series HOpening mutual fund shares 1 642 3 083Issued number of mutual fund shares 551 170Reinvested number of mutual fund shares 23 35Redeemed number of mutual fund shares (757) (1 646)Ending number of mutual fund shares 1 459 1 642
Series DOpening mutual fund shares 862 681Issued number of mutual fund shares 203 339Reinvested number of mutual fund shares 18 26Redeemed number of mutual fund shares (222) (184)Ending number of mutual fund shares 861 862
Series FOpening mutual fund shares 361 462Issued number of mutual fund shares 1 397 182Reinvested number of mutual fund shares 26 12Redeemed number of mutual fund shares (245) (295)Ending number of mutual fund shares 1 539 361
Series FT5Opening mutual fund shares 352 424Issued number of mutual fund shares 439 47Reinvested number of mutual fund shares 6 2Redeemed number of mutual fund shares (136) (121)Ending number of mutual fund shares 661 352
235

SCHEDULE OF INVESTMENT PORTFOLIO (in $000s)
ANNUAL FINANCIAL STATEMENTS
March 31, 2017
The accompanying notes are an integral part of the financial statements.
RBC BALANCED GROWTH & INCOME CLASS
Number Fair % of Net of Units Security Cost Value Assets
MUTUAL FUND UNITS 843 652 BlueBay Global Monthly Income Bond Fund* $ 8 537 $ 8 666 1 474 792 Phillips, Hager & North Total Return Bond Fund* 17 105 16 721 1 285 290 RBC Canadian Equity Income Fund* 34 758 38 943 990 791 RBC Emerging Markets Dividend Fund* 11 195 12 794 712 461 RBC European Dividend Fund* 8 495 8 290 1 153 297 RBC Global Corporate Bond Fund* 11 287 11 358 798 743 RBC Global High Yield Bond Fund* 8 480 8 681 963 216 RBC U.S. Dividend Fund* 24 728 27 272
TOTAL MUTUAL FUND UNITS 124 585 132 725 99.7SHORT-TERM INVESTMENTS† 1 482 1 482 1.1TOTAL INVESTMENTS $ 126 067 134 207 100.8OTHER NET ASSETS (LIABILITIES) ATTRIBUTABLE TO HOLDERS OF REDEEMABLE SHARES (1 100) (0.8)NET ASSETS ATTRIBUTABLE TO HOLDERS OF REDEEMABLE SHARES $ 133 107 100.0
* Investment in related party (see note 6 in the generic notes).† Short-term investments, which may be made up of treasury bills, commercial paper, term deposits and discount notes, earn interest at a rate of 0.45% and mature on April 3, 2017.
236

FINANCIAL STATEMENTS
The accompanying notes are an integral part of these financial statements.
RBC BALANCED GROWTH & INCOME CLASS
Statements of Financial Position (in $000s except per mutual fund share amounts)
(see note 2 in the generic notes)March 31
2017March 31
2016
ASSETS Investments at fair value $ 134 207 $ 100 766 Cash 1 1 Subscriptions receivable 756 603 TOTAL ASSETS 134 964 101 370 LIABILITIESDue to investment dealers 1 280 450 Redemptions payable 286 44 Distributions payable 125 86 Accounts payable and accrued expenses 166 133 TOTAL LIABILITIES EXCLUDING NET ASSETS ATTRIBUTABLE TO HOLDERS OF REDEEMABLE MUTUAL FUND SHARES 1 857 713 NET ASSETS ATTRIBUTABLE TO HOLDERS OF REDEEMABLE MUTUAL FUND SHARES (“NAV”) $ 133 107 $ 100 657
Investments at cost $ 126 067 $ 103 869
NAV SERIES A $ 33 375 $ 29 438 ADVISOR SERIES $ 23 407 $ 9 484 ADVISOR T5 SERIES $ 6 389 $ 5 036 SERIES T5 $ 8 349 $ 9 387 SERIES H $ – $ 15 669 SERIES F $ 42 958 $ 9 961 SERIES FT5 $ 18 628 $ 7 575 SERIES I $ – $ 14 106 SERIES O $ 1 $ 1 NAV PER MUTUAL FUND SHARE SERIES A $ 10.73 $ 9.57 ADVISOR SERIES $ 10.72 $ 9.56 ADVISOR T5 SERIES $ 9.79 $ 9.13 SERIES T5 $ 9.77 $ 9.12 SERIES H $ – $ 9.58 SERIES F $ 10.80 $ 9.55 SERIES FT5 $ 10.00 $ 9.22 SERIES I $ – $ 9.56 SERIES O $ 10.88 $ 9.55
Statements of Comprehensive Income (in $000s except per mutual fund share amounts)
For the periods ended March 31 (see note 2 in the generic notes) 2017 2016INCOME (see note 3 in the generic notes)Interest for distribution purposes $ – $ 3 Other income received from underlying funds 3 370 2 615 Capital gains received from underlying funds 433 1 228 Net realized gain (loss) on investments 188 (661)Net gain (loss) on foreign currencies and other net assets 1 –Change in unrealized gain (loss) on investments 11 243 (3 103)TOTAL INCOME (LOSS) 15 235 82 EXPENSES (see notes – Fund Specific Information)Management fees 1 500 918 Administration fees 56 32 Board of Directors fees 14 7 Independent Review Committee costs 2 3 GST/HST 164 102 Expenses reimbursed by manager (5) (3)TOTAL EXPENSES 1 731 1 059 INCREASE (DECREASE) IN NAV $ 13 504 $ (977)INCREASE (DECREASE) IN NAV SERIES A $ 4 053 $ (260) ADVISOR SERIES $ 1 960 $ (241) ADVISOR T5 SERIES $ 684 $ (145) SERIES T5 $ 1 215 $ (5) SERIES H $ 301 $ (223) SERIES F $ 3 535 $ (74) SERIES FT5 $ 1 505 $ 48 SERIES I $ 251 $ (75) SERIES O $ – $ (2)INCREASE (DECREASE) IN NAV PER MUTUAL FUND SHARE SERIES A $ 1.22 $ (0.17) ADVISOR SERIES $ 1.24 $ (0.17) ADVISOR T5 SERIES $ 1.15 $ (0.17) SERIES T5 $ 1.12 $ (0.17) SERIES H $ 0.22 $ (0.16) SERIES F $ 1.37 $ (0.07) SERIES FT5 $ 1.29 $ (0.08) SERIES I $ 0.23 $ (0.06) SERIES O $ 1.42 $ 0.04
237

FINANCIAL STATEMENTS
The accompanying notes are an integral part of these financial statements.
RBC BALANCED GROWTH & INCOME CLASS
Statements of Cash Flow (in $000s)
For the periods ended March 31 (see note 2 in the generic notes) 2017 2016
CASH FLOWS FROM OPERATING ACTIVITIES Increase (decrease) in NAV $ 13 504 $ (977)ADJUSTMENTS TO RECONCILE NET CASH PROVIDED BY (USED IN) OPERATIONSInterest for distribution purposes – – Net realized loss (gain) on investments (188) 661 Change in unrealized loss (gain) on investments (11 243) 3 103 (Increase) decrease in accrued receivables – – Increase (decrease) in accrued payables 33 133 Cost of investments purchased (206 302) (503 493)Proceeds on sales of investments 185 122 399 413 NET CASH PROVIDED BY (USED IN) OPERATING ACTIVITIES (19 074) (101 160)CASH FLOWS FROM FINANCING ACTIVITIESProceeds from issue of redeemable mutual fund shares 87 175 134 203 Cash paid on redemption of redeemable mutual fund shares (66 836) (32 347)Distributions paid to holders of redeemable mutual fund shares (1 265) (695)NET CASH PROVIDED BY (USED IN) FINANCING ACTIVITIES $ 19 074 $ 101 161 Net increase (decrease) in cash for the period – 1 Cash (bank overdraft), beginning of period 1 – CASH (BANK OVERDRAFT), END OF PERIOD $ 1 $ 1
Interest received (paid) $ – $ 3 Dividends received, net of withholding taxes $ – $ –
Cash consists of cash and futures contracts margin receivable/payable, as applicable.
238

FINANCIAL STATEMENTS
The accompanying notes are an integral part of these financial statements.
RBC BALANCED GROWTH & INCOME CLASS
Statements of Changes in NAV (in $000s)
For the periods ended March 31 (see note 2 in the generic notes)
Series A Advisor Series Advisor T5 Series Series T52017 2016 2017 2016 2017 2016 2017 2016
NAV AT BEGINNING OF PERIOD $ 29 438 $ – $ 9 484 $ – $ 5 036 $ – $ 9 387 $ – INCREASE (DECREASE) IN NAV 4 053 (260) 1 960 (241) 684 (145) 1 215 (5)Early redemption fees 1 – – – – – – – Proceeds from redeemable mutual fund shares issued 13 421 34 848 16 893 17 648 1 964 9 246 4 105 10 524 Reinvestments of distributions to holders of redeemable mutual fund shares 127 130 83 50 35 28 63 22 Redemption of redeemable mutual fund shares (13 531) (5 143) (4 919) (7 918) (1 049) (3 859) (5 915) (876)NET INCREASE (DECREASE) FROM REDEEMABLE MUTUAL FUND SHARE TRANSACTIONS 18 29 835 12 057 9 780 950 5 415 (1 747) 9 670 Distributions from net income (134) (137) (94) (55) (31) (155) (56) (165)Distributions from net gains – – – – – – – – Distributions from capital – – – – (250) (79) (450) (113)TOTAL DISTRIBUTIONS TO HOLDERS OF REDEEMABLE MUTUAL FUND SHARES (134) (137) (94) (55) (281) (234) (506) (278)NET INCREASE (DECREASE) IN NAV 3 937 29 438 13 923 9 484 1 353 5 036 (1 038) 9 387 NAV AT END OF PERIOD $ 33 375 $ 29 438 $ 23 407 $ 9 484 $ 6 389 $ 5 036 $ 8 349 $ 9 387
For the periods ended March 31 (see note 2 in the generic notes)
Series H Series F Series FT5 Series I2017 2016 2017 2016 2017 2016 2017 2016
NAV AT BEGINNING OF PERIOD $ 15 669 $ – $ 9 961 $ – $ 7 575 $ – $ 14 106 $ – INCREASE (DECREASE) IN NAV 301 (223) 3 535 (74) 1 505 48 251 (75)Early redemption fees – – – – – – – – Proceeds from redeemable mutual fund shares issued 840 20 017 36 013 15 104 13 442 8 755 650 18 522 Reinvestments of distributions to holders of redeemable mutual fund shares – 103 191 113 53 18 – 200 Redemption of redeemable mutual fund shares (16 810) (4 125) (6 467) (5 019) (3 381) (1 026) (15 007) (4 286)NET INCREASE (DECREASE) FROM REDEEMABLE MUTUAL FUND SHARE TRANSACTIONS (15 970) 15 995 29 737 10 198 10 114 7 747 (14 357) 14 436 Distributions from net income – (103) (275) (163) (63) (134) – (255)Distributions from net gains – – – – – – – – Distributions from capital – – – – (503) (86) – – TOTAL DISTRIBUTIONS TO HOLDERS OF REDEEMABLE MUTUAL FUND SHARES – (103) (275) (163) (566) (220) – (255)NET INCREASE (DECREASE) IN NAV (15 669) 15 669 32 997 9 961 11 053 7 575 (14 106) 14 106 NAV AT END OF PERIOD $ – $ 15 669 $ 42 958 $ 9 961 $ 18 628 $ 7 575 $ – $ 14 106
239

FINANCIAL STATEMENTS
The accompanying notes are an integral part of these financial statements.
Statements of Changes in NAV (cont.) (in $000s)
For the periods ended March 31 (see note 2 in the generic notes)
Series O Total2017 2016 2017 2016
NAV AT BEGINNING OF PERIOD $ 1 $ – $ 100 657 $ – INCREASE (DECREASE) IN NAV – (2) 13 504 (977)Early redemption fees – – 1 – Proceeds from redeemable mutual fund shares issued – 142 87 328 134 806 Reinvestments of distributions to holders of redeemable mutual fund shares – – 552 664 Redemption of redeemable mutual fund shares – (139) (67 079) (32 391)NET INCREASE (DECREASE) FROM REDEEMABLE MUTUAL FUND SHARE TRANSACTIONS – 3 20 802 103 079 Distributions from net income – – (653) (1 167)Distributions from net gains – – – – Distributions from capital – – (1 203) (278)TOTAL DISTRIBUTIONS TO HOLDERS OF REDEEMABLE MUTUAL FUND SHARES – – (1 856) (1 445)NET INCREASE (DECREASE) IN NAV – 1 32 450 100 657 NAV AT END OF PERIOD $ 1 $ 1 $ 133 107 $ 100 657
RBC BALANCED GROWTH & INCOME CLASS
240
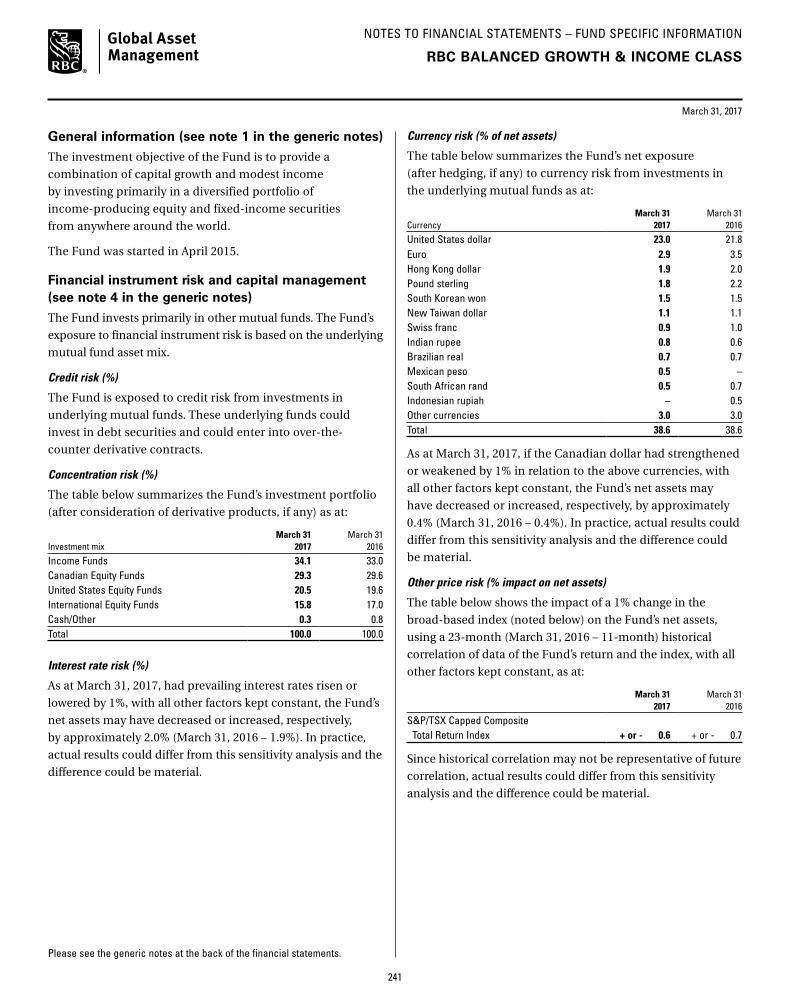
NOTES TO FINANCIAL STATEMENTS – FUND SPECIFIC INFORMATION
Please see the generic notes at the back of the financial statements.
March 31, 2017
RBC BALANCED GROWTH & INCOME CLASS
General information (see note 1 in the generic notes)
The investment objective of the Fund is to provide a
combination of capital growth and modest income
by investing primarily in a diversified portfolio of
income-producing equity and fixed-income securities
from anywhere around the world.
The Fund was started in April 2015.
Financial instrument risk and capital management (see note 4 in the generic notes)
The Fund invests primarily in other mutual funds. The Fund’s
exposure to financial instrument risk is based on the underlying
mutual fund asset mix.
Credit risk (%)
The Fund is exposed to credit risk from investments in
underlying mutual funds. These underlying funds could
invest in debt securities and could enter into over-the-
counter derivative contracts.
Concentration risk (%)
The table below summarizes the Fund’s investment portfolio
(after consideration of derivative products, if any) as at:
Investment mixMarch 31
2017March 31
2016
Income Funds 34.1 33.0Canadian Equity Funds 29.3 29.6United States Equity Funds 20.5 19.6International Equity Funds 15.8 17.0Cash/Other 0.3 0.8Total 100.0 100.0
Interest rate risk (%)
As at March 31, 2017, had prevailing interest rates risen or
lowered by 1%, with all other factors kept constant, the Fund’s
net assets may have decreased or increased, respectively,
by approximately 2.0% (March 31, 2016 – 1.9%). In practice,
actual results could differ from this sensitivity analysis and the
difference could be material.
Currency risk (% of net assets)
The table below summarizes the Fund’s net exposure
(after hedging, if any) to currency risk from investments in
the underlying mutual funds as at:
CurrencyMarch 31
2017March 31
2016
United States dollar 23.0 21.8Euro 2.9 3.5Hong Kong dollar 1.9 2.0Pound sterling 1.8 2.2South Korean won 1.5 1.5New Taiwan dollar 1.1 1.1Swiss franc 0.9 1.0Indian rupee 0.8 0.6Brazilian real 0.7 0.7Mexican peso 0.5 –South African rand 0.5 0.7Indonesian rupiah – 0.5Other currencies 3.0 3.0Total 38.6 38.6
As at March 31, 2017, if the Canadian dollar had strengthened
or weakened by 1% in relation to the above currencies, with
all other factors kept constant, the Fund’s net assets may
have decreased or increased, respectively, by approximately
0.4% (March 31, 2016 – 0.4%). In practice, actual results could
differ from this sensitivity analysis and the difference could
be material.
Other price risk (% impact on net assets)
The table below shows the impact of a 1% change in the
broad-based index (noted below) on the Fund’s net assets,
using a 23-month (March 31, 2016 – 11-month) historical
correlation of data of the Fund’s return and the index, with all
other factors kept constant, as at:
March 31 2017
March 31 2016
S&P/TSX Capped Composite Total Return Index + or - 0.6 + or - 0.7
Since historical correlation may not be representative of future
correlation, actual results could differ from this sensitivity
analysis and the difference could be material.
241

NOTES TO FINANCIAL STATEMENTS – FUND SPECIFIC INFORMATION
Please see the generic notes at the back of the financial statements.
March 31, 2017
RBC BALANCED GROWTH & INCOME CLASS
Fair value hierarchy ($000s except % amounts) (see note 3 in the generic notes)
The following is a summary of the inputs used as of
March 31, 2017 and 2016.
March 31, 2017 Level 1 Level 2 Level 3 Total
Equities – – – – Mutual fund units 132 725 – – 132 725Fixed-income and debt securities – – – – Short-term investments – 1 482 – 1 482Derivatives – assets – – – – Derivatives – liabilities – – – – Total financial instruments 132 725 1 482 – 134 207% of total portfolio 98.9 1.1 – 100.0
March 31, 2016 Level 1 Level 2 Level 3 Total
Equities – – – – Mutual fund units 99 945 – – 99 945 Fixed-income and debt securities – – – – Short-term investments – 821 – 821 Derivatives – assets – – – – Derivatives – liabilities – – – – Total financial instruments 99 945 821 – 100 766 % of total portfolio 99.2 0.8 – 100.0
For the periods ended March 31, 2017 and 2016, there were
no transfers of financial instruments between Level 1, Level 2
and Level 3.
Management fees and operating expenses (see note 6 in the generic notes)
Management fees and administration fees of each series
of the Fund are payable to RBC GAM and calculated at the
following annual percentages, before GST/HST, of the daily
net asset value of each series of the Fund.
Management fees Operating expenses
Series A 1.75% 0.05%Advisor Series 1.75% 0.05%Advisor T5 Series 1.75% 0.05%Series T5 1.75% 0.05%Series F 0.75% 0.05%Series FT5 0.75% 0.05%Series O n/a* 0.02%
* Series O shareholders pay a negotiated management fee directly to RBC GAM for investment-counselling services.
Investments by related parties ($000s except mutual fund share amounts)
Royal Bank of Canada, or one of its subsidiaries, held the
following investments in the Fund as at:
March 31 2017
March 31 2016
Mutual fund shares held Series A 101 100 Advisor Series 101 101 Advisor T5 Series 111 105 Series T5 111 105 Series H – 101 Series F 102 102 Series FT5 111 105 Series I – 102 Series O 103 103Value of all mutual fund shares 8 9
Underlying mutual fund ownership interest (%)
The table below summarizes the Fund’s interest in the
underlying mutual funds as a percentage of NAV, and the
Fund’s ownership interest as a percentage of the net assets of
the underlying funds (“Ownership”). All underlying funds are
established and conduct business in Canada, and have an
associate relationship to the Fund.
March 31 2017
March 31 2016
NAV Ownership NAV Ownership
BlueBay Global Monthly Income Bond Fund 6.5 0.6 6.3 0.5Phillips, Hager & North Total Return Bond Fund 12.6 0.2 12.2 0.2RBC Canadian Equity Income Fund 29.3 1.1 29.6 0.9RBC Emerging Markets Dividend Fund 9.6 2.1 9.8 2.2RBC European Dividend Fund 6.2 6.7 7.2 5.7RBC Global Corporate Bond Fund 8.5 0.1 8.2 0.1RBC Global High Yield Bond Fund 6.5 0.3 6.3 0.2RBC U.S. Dividend Fund 20.5 0.7 19.6 0.7
Taxes ($000s) (see note 5 in the generic notes)
The Fund had no capital or non-capital losses as at
March 31, 2017.
242
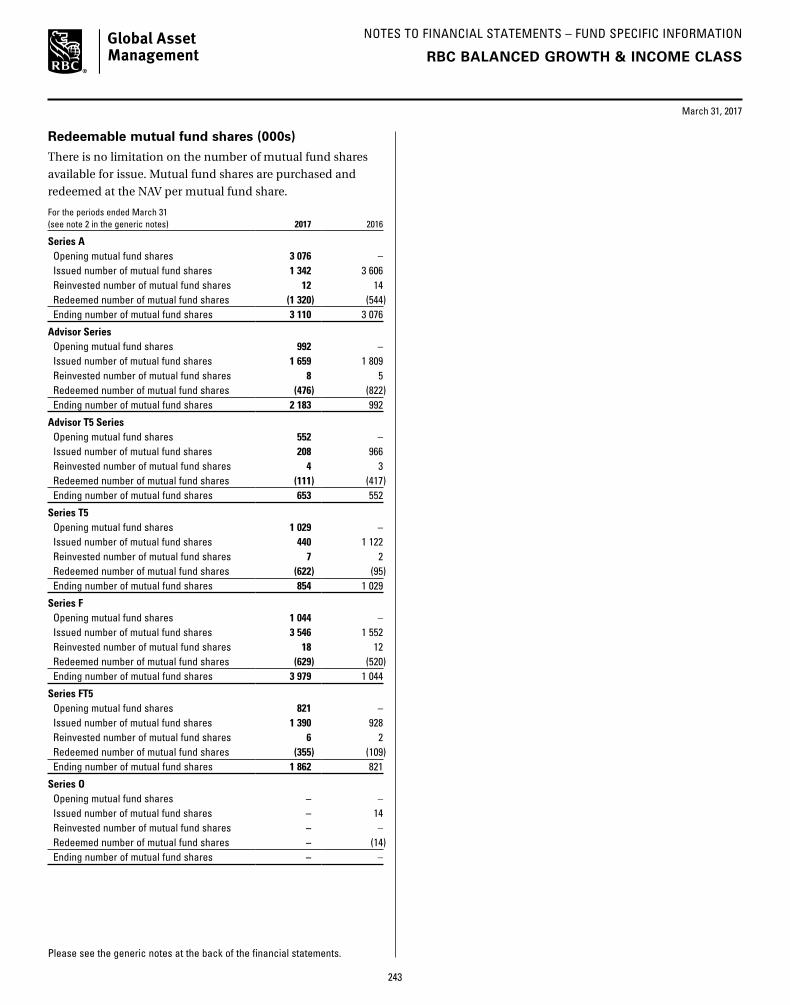
NOTES TO FINANCIAL STATEMENTS – FUND SPECIFIC INFORMATION
Please see the generic notes at the back of the financial statements.
March 31, 2017
RBC BALANCED GROWTH & INCOME CLASS
Redeemable mutual fund shares (000s)
There is no limitation on the number of mutual fund shares
available for issue. Mutual fund shares are purchased and
redeemed at the NAV per mutual fund share.
For the periods ended March 31 (see note 2 in the generic notes) 2017 2016
Series A Opening mutual fund shares 3 076 – Issued number of mutual fund shares 1 342 3 606Reinvested number of mutual fund shares 12 14Redeemed number of mutual fund shares (1 320) (544)Ending number of mutual fund shares 3 110 3 076
Advisor SeriesOpening mutual fund shares 992 – Issued number of mutual fund shares 1 659 1 809Reinvested number of mutual fund shares 8 5Redeemed number of mutual fund shares (476) (822)Ending number of mutual fund shares 2 183 992
Advisor T5 SeriesOpening mutual fund shares 552 – Issued number of mutual fund shares 208 966Reinvested number of mutual fund shares 4 3Redeemed number of mutual fund shares (111) (417)Ending number of mutual fund shares 653 552
Series T5Opening mutual fund shares 1 029 – Issued number of mutual fund shares 440 1 122Reinvested number of mutual fund shares 7 2Redeemed number of mutual fund shares (622) (95)Ending number of mutual fund shares 854 1 029
Series FOpening mutual fund shares 1 044 – Issued number of mutual fund shares 3 546 1 552Reinvested number of mutual fund shares 18 12Redeemed number of mutual fund shares (629) (520)Ending number of mutual fund shares 3 979 1 044
Series FT5Opening mutual fund shares 821 – Issued number of mutual fund shares 1 390 928Reinvested number of mutual fund shares 6 2Redeemed number of mutual fund shares (355) (109)Ending number of mutual fund shares 1 862 821
Series OOpening mutual fund shares – – Issued number of mutual fund shares – 14Reinvested number of mutual fund shares – – Redeemed number of mutual fund shares – (14)Ending number of mutual fund shares – –
243

SCHEDULE OF INVESTMENT PORTFOLIO (in $000s)
ANNUAL FINANCIAL STATEMENTS
March 31, 2017
The accompanying notes are an integral part of the financial statements.
RBC CANADIAN DIVIDEND CLASS
Number Fair % of Net of Units Security Cost Value Assets
MUTUAL FUND UNITS 3 018 882 RBC Private Canadian Dividend Pool* $ 112 180 $ 136 788
TOTAL MUTUAL FUND UNITS $ 112 180 136 788 100.0OTHER NET ASSETS ATTRIBUTABLE TO HOLDERS OF REDEEMABLE SHARES 24 –NET ASSETS ATTRIBUTABLE TO HOLDERS OF REDEEMABLE SHARES $ 136 812 100.0
* Investment in related party (see note 6 in the generic notes).
244

FINANCIAL STATEMENTS
The accompanying notes are an integral part of these financial statements.
RBC CANADIAN DIVIDEND CLASS
Statements of Financial Position (in $000s except per mutual fund share amounts)
(see note 2 in the generic notes)March 31
2017March 31
2016
ASSETS Investments at fair value $ 136 788 $ 118 136 Cash 48 167 Due from investment dealers 2 865 –Subscriptions receivable 88 210 TOTAL ASSETS 139 789 118 513 LIABILITIESDue to investment dealers – 160 Redemptions payable 2 870 165 Accounts payable and accrued expenses 107 105 TOTAL LIABILITIES EXCLUDING NET ASSETS ATTRIBUTABLE TO HOLDERS OF REDEEMABLE MUTUAL FUND SHARES 2 977 430 NET ASSETS ATTRIBUTABLE TO HOLDERS OF REDEEMABLE MUTUAL FUND SHARES (“NAV”) $ 136 812 $ 118 083
Investments at cost $ 112 180 $ 108 110
NAV SERIES A $ 41 595 $ 41 246 ADVISOR SERIES $ 10 100 $ 7 735 SERIES H $ – $ 10 392 SERIES D $ 17 432 $ 14 166 SERIES F $ 25 917 $ 7 199 SERIES I $ – $ 3 484 SERIES O $ 41 768 $ 33 861 NAV PER MUTUAL FUND SHARE SERIES A $ 14.38 $ 12.62 ADVISOR SERIES $ 14.38 $ 12.62 SERIES H $ – $ 12.62 SERIES D $ 14.57 $ 12.80 SERIES F $ 14.78 $ 12.98 SERIES I $ – $ 13.02 SERIES O $ 15.09 $ 13.25
Statements of Comprehensive Income (in $000s except per mutual fund share amounts)
For the periods ended March 31 (see note 2 in the generic notes) 2017 2016INCOME (see note 3 in the generic notes)Interest for distribution purposes $ (2) $ (4)Other income received from underlying funds 3 795 3 470 Net realized gain (loss) on investments 2 004 1 433 Net gain (loss) on foreign currencies and other net assets 3 –Change in unrealized gain (loss) on investments 14 582 (5 280)TOTAL INCOME (LOSS) 20 382 (381)EXPENSES (see notes – Fund Specific Information)Management fees 1 064 1 106 Administration fees 42 39 Board of Directors fees 14 13 Independent Review Committee costs 2 3 GST/HST 111 114 Expenses reimbursed by manager (4) (5)TOTAL EXPENSES 1 229 1 270 INCREASE (DECREASE) IN NAV $ 19 153 $ (1 651)INCREASE (DECREASE) IN NAV SERIES A $ 6 433 $ (1 108) ADVISOR SERIES $ 1 371 $ (107) SERIES H $ 191 $ (334) SERIES D $ 2 381 $ (330) SERIES F $ 2 595 $ (21) SERIES I $ 74 $ (40) SERIES O $ 6 108 $ 289 INCREASE (DECREASE) IN NAV PER MUTUAL FUND SHARE SERIES A $ 2.01 $ (0.27) ADVISOR SERIES $ 2.03 $ (0.27) SERIES H $ 0.31 $ (0.26) SERIES D $ 2.12 $ (0.20) SERIES F $ 2.23 $ (0.16) SERIES I $ 0.27 $ (0.13) SERIES O $ 2.34 $ (0.05)
245
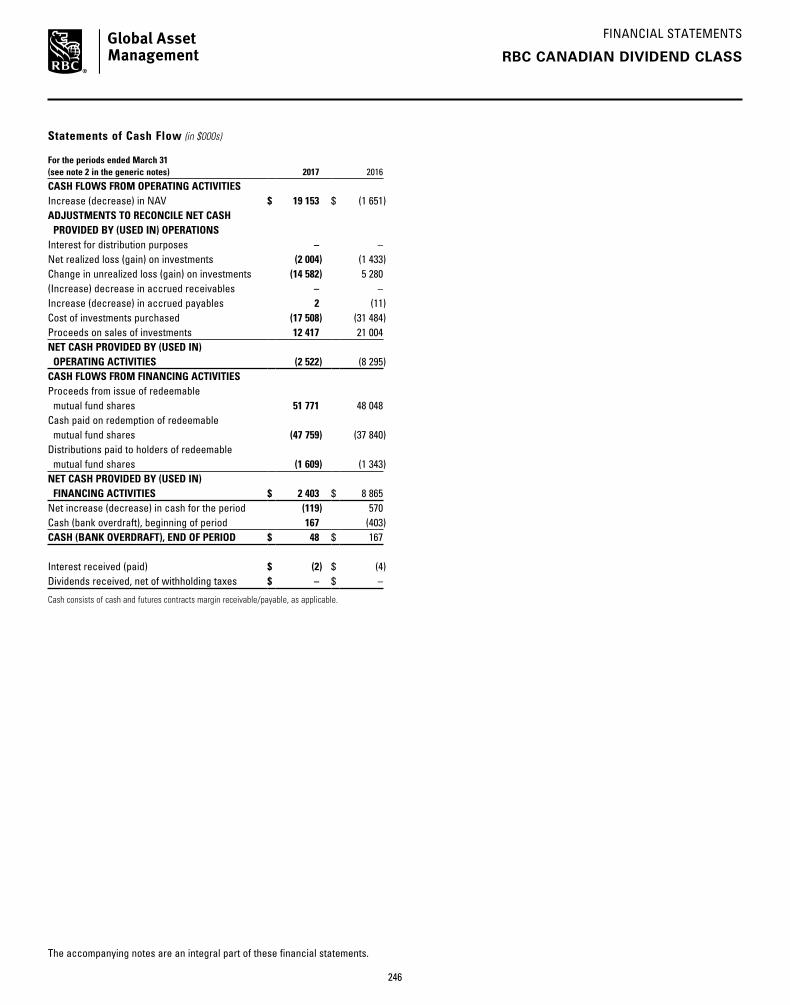
FINANCIAL STATEMENTS
The accompanying notes are an integral part of these financial statements.
RBC CANADIAN DIVIDEND CLASS
Statements of Cash Flow (in $000s)
For the periods ended March 31 (see note 2 in the generic notes) 2017
2016
CASH FLOWS FROM OPERATING ACTIVITIESIncrease (decrease) in NAV $ 19 153 $ (1 651)ADJUSTMENTS TO RECONCILE NET CASH PROVIDED BY (USED IN) OPERATIONSInterest for distribution purposes – – Net realized loss (gain) on investments (2 004) (1 433)Change in unrealized loss (gain) on investments (14 582) 5 280 (Increase) decrease in accrued receivables – – Increase (decrease) in accrued payables 2 (11)Cost of investments purchased (17 508) (31 484)Proceeds on sales of investments 12 417 21 004 NET CASH PROVIDED BY (USED IN) OPERATING ACTIVITIES (2 522) (8 295)CASH FLOWS FROM FINANCING ACTIVITIESProceeds from issue of redeemable mutual fund shares 51 771 48 048 Cash paid on redemption of redeemable mutual fund shares (47 759) (37 840)Distributions paid to holders of redeemable mutual fund shares (1 609) (1 343)NET CASH PROVIDED BY (USED IN) FINANCING ACTIVITIES $ 2 403 $ 8 865 Net increase (decrease) in cash for the period (119) 570 Cash (bank overdraft), beginning of period 167 (403)CASH (BANK OVERDRAFT), END OF PERIOD $ 48 $ 167
Interest received (paid) $ (2) $ (4)Dividends received, net of withholding taxes $ – $ –
Cash consists of cash and futures contracts margin receivable/payable, as applicable.
246

FINANCIAL STATEMENTS
The accompanying notes are an integral part of these financial statements.
RBC CANADIAN DIVIDEND CLASS
Statements of Changes in NAV (in $000s)
For the periods ended March 31 (see note 2 in the generic notes)
Series A Advisor Series Series H Series D2017 2016 2017 2016 2017 2016 2017 2016
NAV AT BEGINNING OF PERIOD $ 41 246 $ 45 127 $ 7 735 $ 7 208 $ 10 392 $ 12 328 $ 14 166 $ 13 551 INCREASE (DECREASE) IN NAV 6 433 (1 108) 1 371 (107) 191 (334) 2 381 (330)Early redemption fees – – – – – – – 1 Proceeds from redeemable mutual fund shares issued 11 788 10 028 2 599 2 075 6 4 583 4 117 4 591 Reinvestments of distributions to holders of redeemable mutual fund shares 683 784 160 136 – 208 397 344 Redemption of redeemable mutual fund shares (17 852) (12 780) (1 594) (1 426) (10 589) (6 185) (3 202) (3 632)NET INCREASE (DECREASE) FROM REDEEMABLE MUTUAL FUND SHARE TRANSACTIONS (5 381) (1 968) 1 165 785 (10 583) (1 394) 1 312 1 304 Distributions from net income (703) (805) (171) (151) – (208) (427) (359)Distributions from net gains – – – – – – – – Distributions from capital – – – – – – – – TOTAL DISTRIBUTIONS TO HOLDERS OF REDEEMABLE MUTUAL FUND SHARES (703) (805) (171) (151) – (208) (427) (359)NET INCREASE (DECREASE) IN NAV 349 (3 881) 2 365 527 (10 392) (1 936) 3 266 615 NAV AT END OF PERIOD $ 41 595 $ 41 246 $ 10 100 $ 7 735 $ – $ 10 392 $ 17 432 $ 14 166
For the periods ended March 31 (see note 2 in the generic notes)
Series F Series I Series O Total2017 2016 2017 2016 2017 2016 2017 2016
NAV AT BEGINNING OF PERIOD $ 7 199 $ 5 397 $ 3 484 $ 3 601 $ 33 861 $ 24 008 $ 118 083 $ 111 220 INCREASE (DECREASE) IN NAV 2 595 (21) 74 (40) 6 108 289 19 153 (1 651)Early redemption fees – – – – – – – 1 Proceeds from redeemable mutual fund shares issued 23 604 4 081 108 516 9 427 21 967 51 649 47 841 Reinvestments of distributions to holders of redeemable mutual fund shares 529 152 – 89 140 43 1 909 1 756 Redemption of redeemable mutual fund shares (7 244) (2 210) (3 666) (579) (6 317) (11 173) (50 464) (37 985)NET INCREASE (DECREASE) FROM REDEEMABLE MUTUAL FUND SHARE TRANSACTIONS 16 889 2 023 (3 558) 26 3 250 10 837 3 094 11 613 Distributions from net income (766) (200) – (103) (1 451) (1 273) (3 518) (3 099)Distributions from net gains – – – – – – – – Distributions from capital – – – – – – – – TOTAL DISTRIBUTIONS TO HOLDERS OF REDEEMABLE MUTUAL FUND SHARES (766) (200) – (103) (1 451) (1 273) (3 518) (3 099)NET INCREASE (DECREASE) IN NAV 18 718 1 802 (3 484) (117) 7 907 9 853 18 729 6 863 NAV AT END OF PERIOD $ 25 917 $ 7 199 $ – $ 3 484 $ 41 768 $ 33 861 $ 136 812 $ 118 083
247
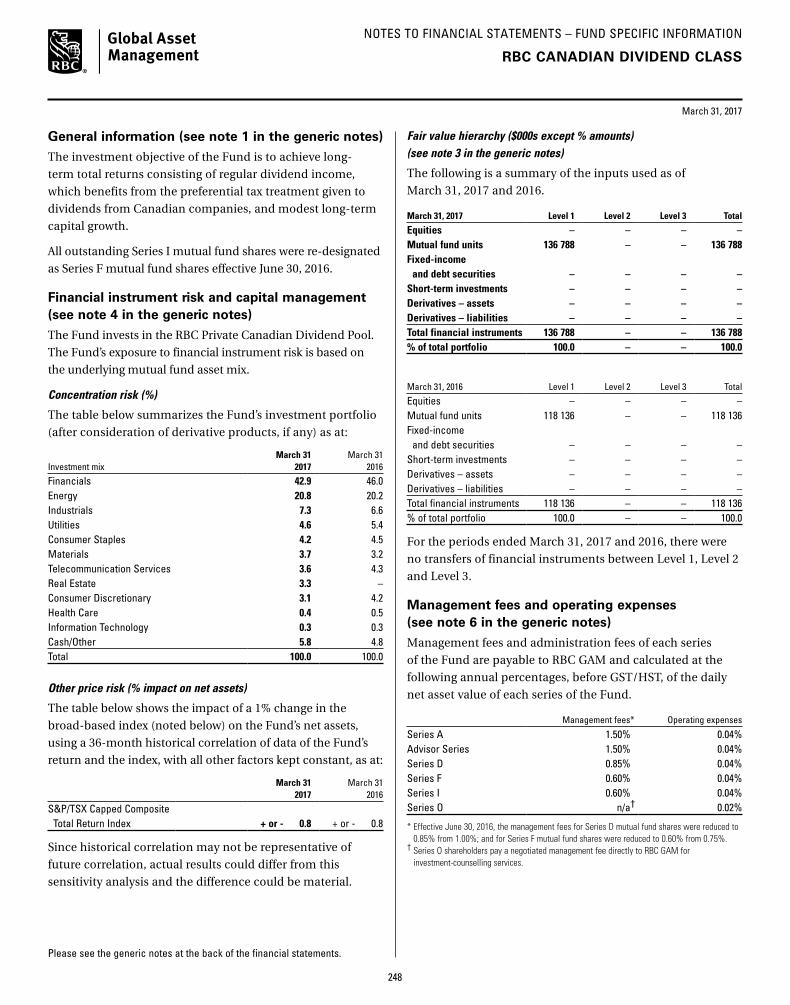
NOTES TO FINANCIAL STATEMENTS – FUND SPECIFIC INFORMATION
Please see the generic notes at the back of the financial statements.
March 31, 2017
RBC CANADIAN DIVIDEND CLASS
General information (see note 1 in the generic notes)
The investment objective of the Fund is to achieve long-
term total returns consisting of regular dividend income,
which benefits from the preferential tax treatment given to
dividends from Canadian companies, and modest long-term
capital growth.
All outstanding Series I mutual fund shares were re-designated
as Series F mutual fund shares effective June 30, 2016.
Financial instrument risk and capital management (see note 4 in the generic notes)
The Fund invests in the RBC Private Canadian Dividend Pool.
The Fund’s exposure to financial instrument risk is based on
the underlying mutual fund asset mix.
Concentration risk (%)
The table below summarizes the Fund’s investment portfolio
(after consideration of derivative products, if any) as at:
Investment mixMarch 31
2017March 31
2016
Financials 42.9 46.0Energy 20.8 20.2Industrials 7.3 6.6Utilities 4.6 5.4Consumer Staples 4.2 4.5Materials 3.7 3.2Telecommunication Services 3.6 4.3Real Estate 3.3 –Consumer Discretionary 3.1 4.2Health Care 0.4 0.5Information Technology 0.3 0.3Cash/Other 5.8 4.8Total 100.0 100.0
Other price risk (% impact on net assets)
The table below shows the impact of a 1% change in the
broad-based index (noted below) on the Fund’s net assets,
using a 36-month historical correlation of data of the Fund’s
return and the index, with all other factors kept constant, as at:
March 31 2017
March 31 2016
S&P/TSX Capped Composite Total Return Index + or - 0.8 + or - 0.8
Since historical correlation may not be representative of
future correlation, actual results could differ from this
sensitivity analysis and the difference could be material.
Fair value hierarchy ($000s except % amounts) (see note 3 in the generic notes)
The following is a summary of the inputs used as of
March 31, 2017 and 2016.
March 31, 2017 Level 1 Level 2 Level 3 Total
Equities – – – – Mutual fund units 136 788 – – 136 788Fixed-income and debt securities – – – – Short-term investments – – – – Derivatives – assets – – – – Derivatives – liabilities – – – – Total financial instruments 136 788 – – 136 788% of total portfolio 100.0 – – 100.0
March 31, 2016 Level 1 Level 2 Level 3 Total
Equities – – – – Mutual fund units 118 136 – – 118 136 Fixed-income and debt securities – – – – Short-term investments – – – – Derivatives – assets – – – – Derivatives – liabilities – – – – Total financial instruments 118 136 – – 118 136 % of total portfolio 100.0 – – 100.0
For the periods ended March 31, 2017 and 2016, there were
no transfers of financial instruments between Level 1, Level 2
and Level 3.
Management fees and operating expenses (see note 6 in the generic notes)
Management fees and administration fees of each series
of the Fund are payable to RBC GAM and calculated at the
following annual percentages, before GST/HST, of the daily
net asset value of each series of the Fund.
Management fees* Operating expenses
Series A 1.50% 0.04%Advisor Series 1.50% 0.04%Series D 0.85% 0.04%Series F 0.60% 0.04%Series I 0.60% 0.04%Series O n/a† 0.02%
* Effective June 30, 2016, the management fees for Series D mutual fund shares were reduced to 0.85% from 1.00%; and for Series F mutual fund shares were reduced to 0.60% from 0.75%.
† Series O shareholders pay a negotiated management fee directly to RBC GAM for investment-counselling services.
248

NOTES TO FINANCIAL STATEMENTS – FUND SPECIFIC INFORMATION
Please see the generic notes at the back of the financial statements.
March 31, 2017
Investments by related parties ($000s except mutual fund share amounts)
Royal Bank of Canada, or one of its subsidiaries, held the
following investments in the Fund as at:
March 31 2017
March 31 2016
Mutual fund shares held Series A 55 54 Advisor Series 55 54 Series H – 108 Series D 56 54 Series F 168 54 Series I – 109Value of all mutual fund shares 5 6
Underlying mutual fund ownership interest (%)
The table below summarizes the Fund’s interest in the
underlying mutual fund as a percentage of NAV, and the
Fund’s ownership interest as a percentage of the net assets of
the underlying fund (“Ownership”). The underlying fund is
established and conducts business in Canada, and has an
associate relationship to the Fund.
March 31 2017
March 31 2016
NAV Ownership NAV Ownership
RBC Private Canadian Dividend Pool 100.0 4.8 100.0 5.4
Taxes ($000s) (see note 5 in the generic notes)
The Fund had no capital or non-capital losses as at
March 31, 2017.
Redeemable mutual fund shares (000s)
There is no limitation on the number of mutual fund shares
available for issue. Mutual fund shares are purchased and
redeemed at the NAV per mutual fund share.
For the periods ended March 31 (see note 2 in the generic notes) 2017 2016
Series A Opening mutual fund shares 3 268 3 432Issued number of mutual fund shares 887 795Reinvested number of mutual fund shares 48 63Redeemed number of mutual fund shares (1 311) (1 022)Ending number of mutual fund shares 2 892 3 268
Advisor SeriesOpening mutual fund shares 613 548Issued number of mutual fund shares 196 168Reinvested number of mutual fund shares 11 11Redeemed number of mutual fund shares (118) (114)Ending number of mutual fund shares 702 613
RBC CANADIAN DIVIDEND CLASS
For the periods ended March 31 (see note 2 in the generic notes) 2017 2016
Series DOpening mutual fund shares 1 107 1 016Issued number of mutual fund shares 291 355Reinvested number of mutual fund shares 27 27Redeemed number of mutual fund shares (228) (291)Ending number of mutual fund shares 1 197 1 107
Series FOpening mutual fund shares 555 399Issued number of mutual fund shares 1 659 312Reinvested number of mutual fund shares 36 12Redeemed number of mutual fund shares (497) (168)Ending number of mutual fund shares 1 753 555
Series IOpening mutual fund shares 268 265Issued number of mutual fund shares 8 39Reinvested number of mutual fund shares – 7Redeemed number of mutual fund shares (276) (43)Ending number of mutual fund shares – 268
Series OOpening mutual fund shares 2 555 1 738Issued number of mutual fund shares 647 1 668Reinvested number of mutual fund shares 9 3Redeemed number of mutual fund shares (443) (854)Ending number of mutual fund shares 2 768 2 555
249
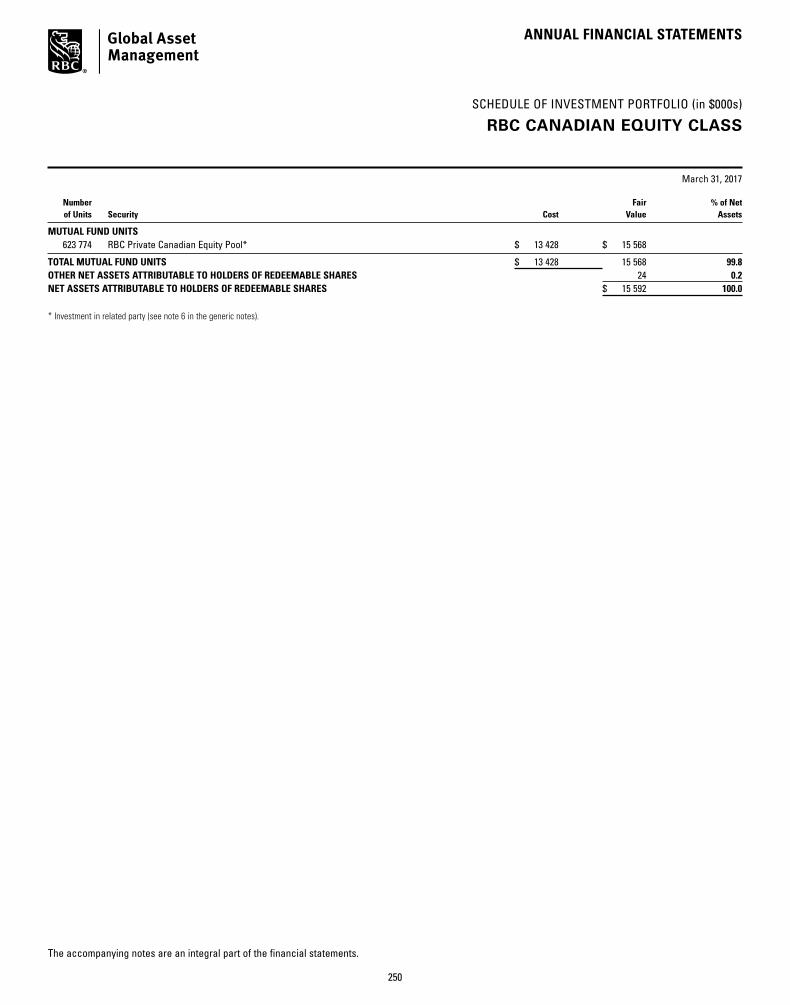
SCHEDULE OF INVESTMENT PORTFOLIO (in $000s)
ANNUAL FINANCIAL STATEMENTS
March 31, 2017
The accompanying notes are an integral part of the financial statements.
RBC CANADIAN EQUITY CLASS
Number Fair % of Net of Units Security Cost Value Assets
MUTUAL FUND UNITS 623 774 RBC Private Canadian Equity Pool* $ 13 428 $ 15 568
TOTAL MUTUAL FUND UNITS $ 13 428 15 568 99.8OTHER NET ASSETS ATTRIBUTABLE TO HOLDERS OF REDEEMABLE SHARES 24 0.2NET ASSETS ATTRIBUTABLE TO HOLDERS OF REDEEMABLE SHARES $ 15 592 100.0
* Investment in related party (see note 6 in the generic notes).
250
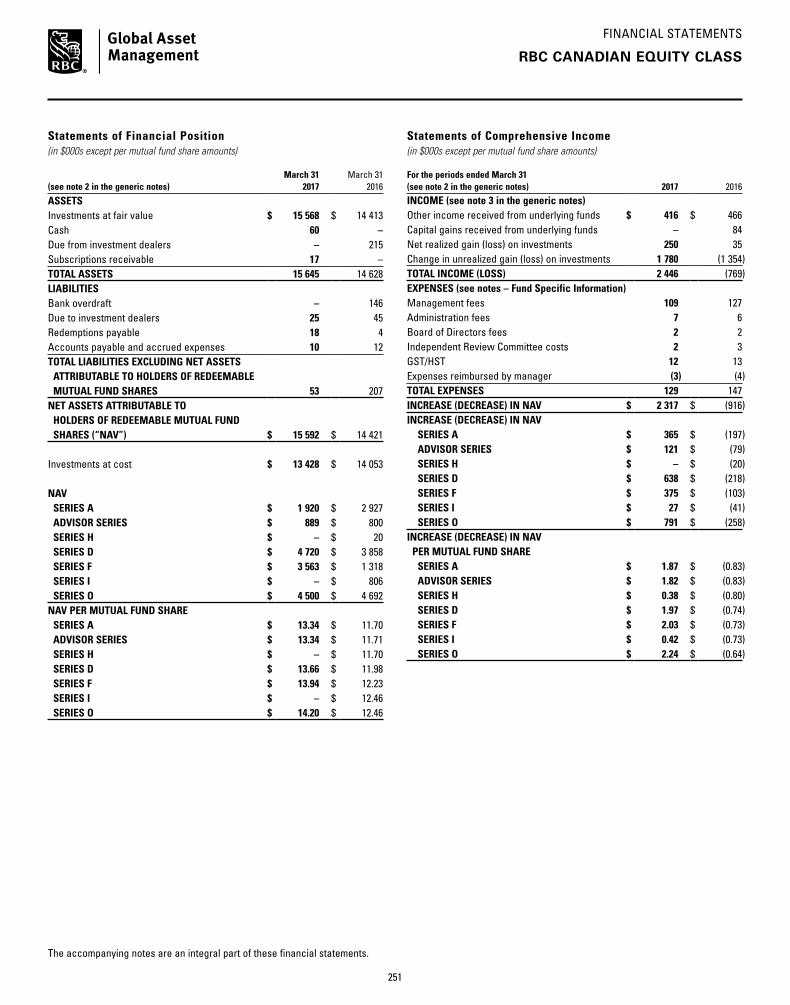
FINANCIAL STATEMENTS
The accompanying notes are an integral part of these financial statements.
RBC CANADIAN EQUITY CLASS
Statements of Financial Position (in $000s except per mutual fund share amounts)
(see note 2 in the generic notes)March 31
2017March 31
2016
ASSETSInvestments at fair value $ 15 568 $ 14 413 Cash 60 –Due from investment dealers – 215 Subscriptions receivable 17 – TOTAL ASSETS 15 645 14 628 LIABILITIESBank overdraft – 146 Due to investment dealers 25 45 Redemptions payable 18 4 Accounts payable and accrued expenses 10 12 TOTAL LIABILITIES EXCLUDING NET ASSETS ATTRIBUTABLE TO HOLDERS OF REDEEMABLE MUTUAL FUND SHARES 53 207 NET ASSETS ATTRIBUTABLE TO HOLDERS OF REDEEMABLE MUTUAL FUND SHARES (“NAV”) $ 15 592 $ 14 421
Investments at cost $ 13 428 $ 14 053
NAV SERIES A $ 1 920 $ 2 927 ADVISOR SERIES $ 889 $ 800 SERIES H $ – $ 20 SERIES D $ 4 720 $ 3 858 SERIES F $ 3 563 $ 1 318 SERIES I $ – $ 806 SERIES O $ 4 500 $ 4 692 NAV PER MUTUAL FUND SHARE SERIES A $ 13.34 $ 11.70 ADVISOR SERIES $ 13.34 $ 11.71 SERIES H $ – $ 11.70 SERIES D $ 13.66 $ 11.98 SERIES F $ 13.94 $ 12.23 SERIES I $ – $ 12.46 SERIES O $ 14.20 $ 12.46
Statements of Comprehensive Income (in $000s except per mutual fund share amounts)
For the periods ended March 31 (see note 2 in the generic notes) 2017 2016INCOME (see note 3 in the generic notes)Other income received from underlying funds $ 416 $ 466 Capital gains received from underlying funds – 84 Net realized gain (loss) on investments 250 35 Change in unrealized gain (loss) on investments 1 780 (1 354)TOTAL INCOME (LOSS) 2 446 (769)EXPENSES (see notes – Fund Specific Information)Management fees 109 127 Administration fees 7 6 Board of Directors fees 2 2 Independent Review Committee costs 2 3 GST/HST 12 13 Expenses reimbursed by manager (3) (4)TOTAL EXPENSES 129 147 INCREASE (DECREASE) IN NAV $ 2 317 $ (916)INCREASE (DECREASE) IN NAV SERIES A $ 365 $ (197) ADVISOR SERIES $ 121 $ (79) SERIES H $ – $ (20) SERIES D $ 638 $ (218) SERIES F $ 375 $ (103) SERIES I $ 27 $ (41) SERIES O $ 791 $ (258)INCREASE (DECREASE) IN NAV PER MUTUAL FUND SHARE SERIES A $ 1.87 $ (0.83) ADVISOR SERIES $ 1.82 $ (0.83) SERIES H $ 0.38 $ (0.80) SERIES D $ 1.97 $ (0.74) SERIES F $ 2.03 $ (0.73) SERIES I $ 0.42 $ (0.73) SERIES O $ 2.24 $ (0.64)
251

FINANCIAL STATEMENTS
The accompanying notes are an integral part of these financial statements.
Statements of Cash Flow (in $000s)
For the periods ended March 31 (see note 2 in the generic notes) 2017
2016
CASH FLOWS FROM OPERATING ACTIVITIESIncrease (decrease) in NAV $ 2 317 $ (916)ADJUSTMENTS TO RECONCILE NET CASH PROVIDED BY (USED IN) OPERATIONSInterest for distribution purposes – – Net realized loss (gain) on investments (250) (35)Change in unrealized loss (gain) on investments (1 780) 1 354 (Increase) decrease in accrued receivables – – Increase (decrease) in accrued payables (2) – Cost of investments purchased (1 858) (4 208)Proceeds on sales of investments 2 928 4 224 NET CASH PROVIDED BY (USED IN) OPERATING ACTIVITIES 1 355 419 CASH FLOWS FROM FINANCING ACTIVITIESProceeds from issue of redeemable mutual fund shares 4 356 4 595 Cash paid on redemption of redeemable mutual fund shares (5 292) (4 846)Distributions paid to holders of redeemable mutual fund shares (213) (226)NET CASH PROVIDED BY (USED IN) FINANCING ACTIVITIES $ (1 149) $ (477)Net increase (decrease) in cash for the period 206 (58)Cash (bank overdraft), beginning of period (146) (88)CASH (BANK OVERDRAFT), END OF PERIOD $ 60 $ (146)
Interest received (paid) $ – $ – Dividends received, net of withholding taxes $ – $ –
Cash consists of cash and futures contracts margin receivable/payable, as applicable.
RBC CANADIAN EQUITY CLASS
252

FINANCIAL STATEMENTS
The accompanying notes are an integral part of these financial statements.
RBC CANADIAN EQUITY CLASS
Statements of Changes in NAV (in $000s)
For the periods ended March 31 (see note 2 in the generic notes)
Series A Advisor Series Series H Series D2017 2016 2017 2016 2017 2016 2017 2016
NAV AT BEGINNING OF PERIOD $ 2 927 $ 2 878 $ 800 $ 1 083 $ 20 $ 250 $ 3 858 $ 4 053 INCREASE (DECREASE) IN NAV 365 (197) 121 (79) – (20) 638 (218)Early redemption fees – – – – – – – – Proceeds from redeemable mutual fund shares issued 105 655 163 195 – – 546 575 Reinvestments of distributions to holders of redeemable mutual fund shares 28 52 13 13 – – 89 96 Redemption of redeemable mutual fund shares (1 477) (407) (195) (397) (20) (210) (301) (542)NET INCREASE (DECREASE) FROM REDEEMABLE MUTUAL FUND SHARE TRANSACTIONS (1 344) 300 (19) (189) (20) (210) 334 129 Distributions from net income (28) (54) (13) (15) – – (110) (106)Distributions from net gains – – – – – – – – Distributions from capital – – – – – – – – TOTAL DISTRIBUTIONS TO HOLDERS OF REDEEMABLE MUTUAL FUND SHARES (28) (54) (13) (15) – – (110) (106)NET INCREASE (DECREASE) IN NAV (1 007) 49 89 (283) (20) (230) 862 (195)NAV AT END OF PERIOD $ 1 920 $ 2 927 $ 889 $ 800 $ – $ 20 $ 4 720 $ 3 858
For the periods ended March 31 (see note 2 in the generic notes)
Series F Series I Series O Total2017 2016 2017 2016 2017 2016 2017 2016
NAV AT BEGINNING OF PERIOD $ 1 318 $ 1 417 $ 806 $ 853 $ 4 692 $ 5 319 $ 14 421 $ 15 853 INCREASE (DECREASE) IN NAV 375 (103) 27 (41) 791 (258) 2 317 (916)Early redemption fees – – – – – – – – Proceeds from redeemable mutual fund shares issued 2 316 469 – – 1 243 2 666 4 373 4 560 Reinvestments of distributions to holders of redeemable mutual fund shares 50 17 – 25 – 3 180 206 Redemption of redeemable mutual fund shares (406) (442) (833) (6) (2 074) (2 846) (5 306) (4 850)NET INCREASE (DECREASE) FROM REDEEMABLE MUTUAL FUND SHARE TRANSACTIONS 1 960 44 (833) 19 (831) (177) (753) (84)Distributions from net income (90) (40) – (25) (152) (192) (393) (432)Distributions from net gains – – – – – – – – Distributions from capital – – – – – – – – TOTAL DISTRIBUTIONS TO HOLDERS OF REDEEMABLE MUTUAL FUND SHARES (90) (40) – (25) (152) (192) (393) (432)NET INCREASE (DECREASE) IN NAV 2 245 (99) (806) (47) (192) (627) 1 171 (1 432)NAV AT END OF PERIOD $ 3 563 $ 1 318 $ – $ 806 $ 4 500 $ 4 692 $ 15 592 $ 14 421
253

NOTES TO FINANCIAL STATEMENTS – FUND SPECIFIC INFORMATION
Please see the generic notes at the back of the financial statements.
March 31, 2017
RBC CANADIAN EQUITY CLASS
General information (see note 1 in the generic notes)
The investment objective of the Fund is to provide long-term
capital growth by investing primarily in equity securities of
major Canadian companies.
All outstanding Series I mutual fund shares were re-designated
as Series F mutual fund shares effective June 30, 2016.
Financial instrument risk and capital management (see note 4 in the generic notes)
The Fund invests in the RBC Private Canadian Equity Pool
and/or the RBC Canadian Equity Fund. The Fund’s exposure
to financial instrument risk is based on the underlying mutual
fund asset mix.
Concentration risk (%)
The table below summarizes the Fund’s investment portfolio
(after consideration of derivative products, if any) as at:
Investment mixMarch 31
2017March 31
2016
Financials 30.0 35.4Energy 22.4 20.7Industrials 9.3 8.2Materials 6.7 6.2Consumer Staples 5.7 5.3Consumer Discretionary 5.4 6.7Utilities 5.3 4.7Real Estate 3.3 –Telecommunication Services 3.1 4.2Information Technology 2.5 1.7Health Care 0.4 0.3Cash/Other 5.9 6.6Total 100.0 100.0
Other price risk (% impact on net assets)
The table below shows the impact of a 1% change in the
broad-based index (noted below) on the Fund’s net assets,
using a 36-month historical correlation of data of the Fund’s
return and the index, with all other factors kept constant, as at:
March 31 2017
March 31 2016
S&P/TSX Capped Composite Total Return Index + or - 1.0 + or - 1.0
Since historical correlation may not be representative of
future correlation, actual results could differ from this
sensitivity analysis and the difference could be material.
Fair value hierarchy ($000s except % amounts) (see note 3 in the generic notes)
The following is a summary of the inputs used as of
March 31, 2017 and 2016.
March 31, 2017 Level 1 Level 2 Level 3 Total
Equities – – – – Mutual fund units 15 568 – – 15 568Fixed-income and debt securities – – – – Short-term investments – – – – Derivatives – assets – – – – Derivatives – liabilities – – – – Total financial instruments 15 568 – – 15 568% of total portfolio 100.0 – – 100.0
March 31, 2016 Level 1 Level 2 Level 3 Total
Equities – – – – Mutual fund units 14 413 – – 14 413 Fixed-income and debt securities – – – – Short-term investments – – – – Derivatives – assets – – – – Derivatives – liabilities – – – – Total financial instruments 14 413 – – 14 413 % of total portfolio 100.0 – – 100.0
For the periods ended March 31, 2017 and 2016, there were
no transfers of financial instruments between Level 1, Level 2
and Level 3.
Management fees and operating expenses (see note 6 in the generic notes)
Management fees and administration fees of each series
of the Fund are payable to RBC GAM and calculated at the
following annual percentages, before GST/HST, of the daily
net asset value of each series of the Fund.
Management fees* Operating expenses
Series A 1.60% 0.06%Advisor Series 1.60% 0.06%Series D 0.85% 0.04%Series F 0.60% 0.04%Series I 0.60% 0.04%Series O n/a† 0.02%
* Effective June 30, 2016, the management fees for Series A and Advisor Series mutual fund shares were reduced to 1.60% from 1.75%; for Series D mutual fund shares were reduced to 0.85% from 1.00%; and for Series F mutual fund shares were reduced to 0.60% from 0.75%.
† Series O shareholders pay a negotiated management fee directly to RBC GAM for investment-counselling services.
254
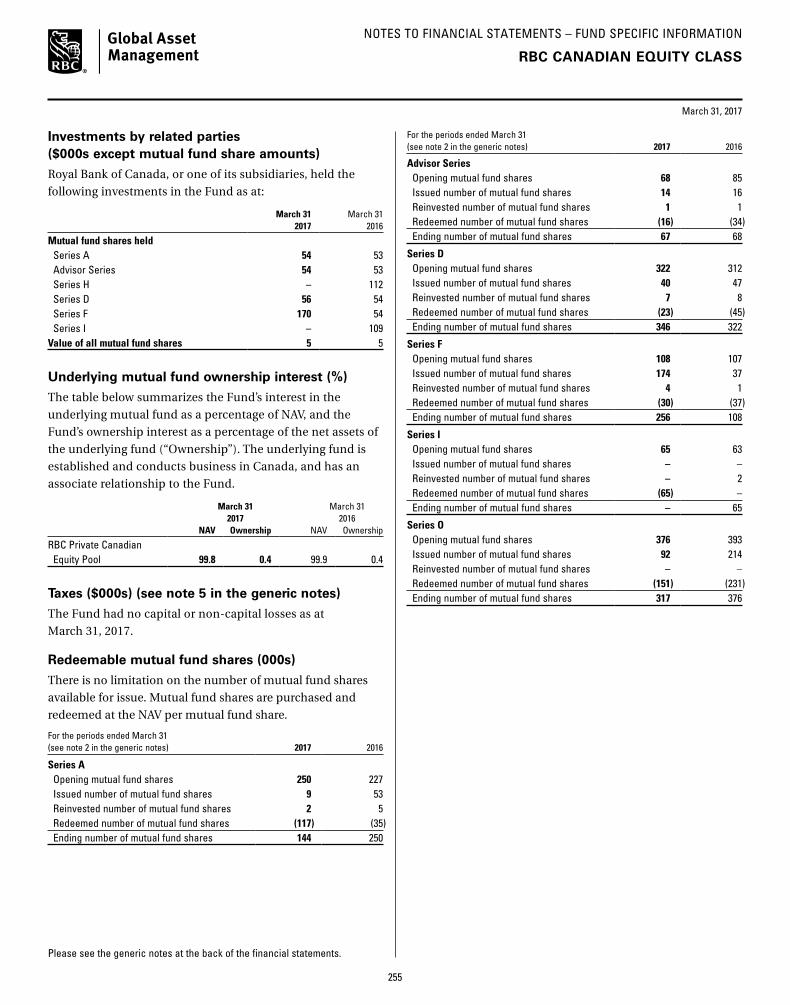
NOTES TO FINANCIAL STATEMENTS – FUND SPECIFIC INFORMATION
Please see the generic notes at the back of the financial statements.
March 31, 2017
Investments by related parties ($000s except mutual fund share amounts)
Royal Bank of Canada, or one of its subsidiaries, held the
following investments in the Fund as at:
March 31 2017
March 31 2016
Mutual fund shares held Series A 54 53 Advisor Series 54 53 Series H – 112 Series D 56 54 Series F 170 54 Series I – 109Value of all mutual fund shares 5 5
Underlying mutual fund ownership interest (%)
The table below summarizes the Fund’s interest in the
underlying mutual fund as a percentage of NAV, and the
Fund’s ownership interest as a percentage of the net assets of
the underlying fund (“Ownership”). The underlying fund is
established and conducts business in Canada, and has an
associate relationship to the Fund.
March 31 2017
March 31 2016
NAV Ownership NAV Ownership
RBC Private Canadian Equity Pool 99.8 0.4 99.9 0.4
Taxes ($000s) (see note 5 in the generic notes)
The Fund had no capital or non-capital losses as at
March 31, 2017.
Redeemable mutual fund shares (000s)
There is no limitation on the number of mutual fund shares
available for issue. Mutual fund shares are purchased and
redeemed at the NAV per mutual fund share.
For the periods ended March 31 (see note 2 in the generic notes) 2017 2016
Series A Opening mutual fund shares 250 227Issued number of mutual fund shares 9 53Reinvested number of mutual fund shares 2 5Redeemed number of mutual fund shares (117) (35)Ending number of mutual fund shares 144 250
RBC CANADIAN EQUITY CLASS
For the periods ended March 31 (see note 2 in the generic notes) 2017 2016
Advisor SeriesOpening mutual fund shares 68 85Issued number of mutual fund shares 14 16Reinvested number of mutual fund shares 1 1Redeemed number of mutual fund shares (16) (34)Ending number of mutual fund shares 67 68
Series DOpening mutual fund shares 322 312Issued number of mutual fund shares 40 47Reinvested number of mutual fund shares 7 8Redeemed number of mutual fund shares (23) (45)Ending number of mutual fund shares 346 322
Series FOpening mutual fund shares 108 107Issued number of mutual fund shares 174 37Reinvested number of mutual fund shares 4 1Redeemed number of mutual fund shares (30) (37)Ending number of mutual fund shares 256 108
Series IOpening mutual fund shares 65 63Issued number of mutual fund shares – – Reinvested number of mutual fund shares – 2Redeemed number of mutual fund shares (65) – Ending number of mutual fund shares – 65
Series OOpening mutual fund shares 376 393Issued number of mutual fund shares 92 214Reinvested number of mutual fund shares – – Redeemed number of mutual fund shares (151) (231)Ending number of mutual fund shares 317 376
255

SCHEDULE OF INVESTMENT PORTFOLIO (in $000s)
ANNUAL FINANCIAL STATEMENTS
March 31, 2017
The accompanying notes are an integral part of the financial statements.
RBC QUBE LOW VOLATILITY CANADIAN EQUITY CLASS
Number Fair % of Net of Units Security Cost Value Assets
MUTUAL FUND UNITS 1 810 563 RBC QUBE Low Volatility Canadian Equity Fund* $ 25 418 $ 26 687
TOTAL MUTUAL FUND UNITS $ 25 418 26 687 99.9OTHER NET ASSETS ATTRIBUTABLE TO HOLDERS OF REDEEMABLE SHARES 38 0.1NET ASSETS ATTRIBUTABLE TO HOLDERS OF REDEEMABLE SHARES $ 26 725 100.0
* Investment in related party (see note 6 in the generic notes).
256
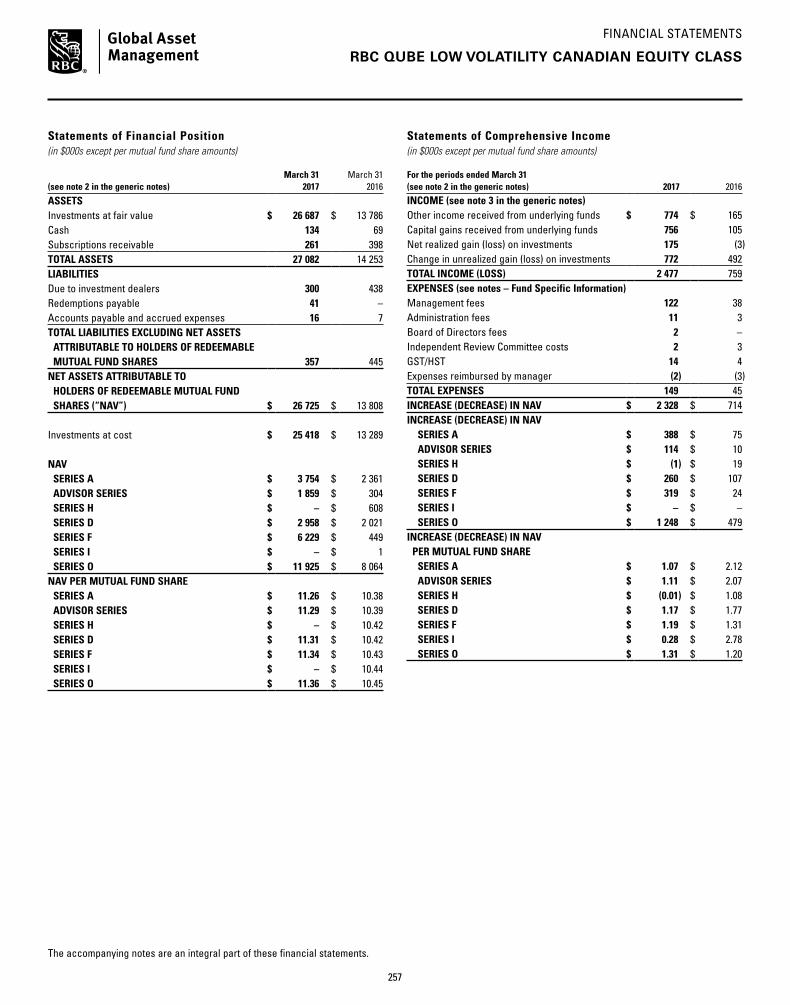
FINANCIAL STATEMENTS
The accompanying notes are an integral part of these financial statements.
RBC QUBE LOW VOLATILITY CANADIAN EQUITY CLASS
Statements of Financial Position (in $000s except per mutual fund share amounts)
(see note 2 in the generic notes)March 31
2017March 31
2016
ASSETSInvestments at fair value $ 26 687 $ 13 786 Cash 134 69 Subscriptions receivable 261 398 TOTAL ASSETS 27 082 14 253 LIABILITIESDue to investment dealers 300 438 Redemptions payable 41 –Accounts payable and accrued expenses 16 7 TOTAL LIABILITIES EXCLUDING NET ASSETS ATTRIBUTABLE TO HOLDERS OF REDEEMABLE MUTUAL FUND SHARES 357 445 NET ASSETS ATTRIBUTABLE TO HOLDERS OF REDEEMABLE MUTUAL FUND SHARES (“NAV”) $ 26 725 $ 13 808
Investments at cost $ 25 418 $ 13 289
NAV SERIES A $ 3 754 $ 2 361 ADVISOR SERIES $ 1 859 $ 304 SERIES H $ – $ 608 SERIES D $ 2 958 $ 2 021 SERIES F $ 6 229 $ 449 SERIES I $ – $ 1 SERIES O $ 11 925 $ 8 064 NAV PER MUTUAL FUND SHARE SERIES A $ 11.26 $ 10.38 ADVISOR SERIES $ 11.29 $ 10.39 SERIES H $ – $ 10.42 SERIES D $ 11.31 $ 10.42 SERIES F $ 11.34 $ 10.43 SERIES I $ – $ 10.44 SERIES O $ 11.36 $ 10.45
Statements of Comprehensive Income (in $000s except per mutual fund share amounts)
For the periods ended March 31 (see note 2 in the generic notes) 2017 2016INCOME (see note 3 in the generic notes)Other income received from underlying funds $ 774 $ 165 Capital gains received from underlying funds 756 105 Net realized gain (loss) on investments 175 (3)Change in unrealized gain (loss) on investments 772 492 TOTAL INCOME (LOSS) 2 477 759 EXPENSES (see notes – Fund Specific Information)Management fees 122 38 Administration fees 11 3 Board of Directors fees 2 –Independent Review Committee costs 2 3 GST/HST 14 4 Expenses reimbursed by manager (2) (3)TOTAL EXPENSES 149 45 INCREASE (DECREASE) IN NAV $ 2 328 $ 714 INCREASE (DECREASE) IN NAV SERIES A $ 388 $ 75 ADVISOR SERIES $ 114 $ 10 SERIES H $ (1) $ 19 SERIES D $ 260 $ 107 SERIES F $ 319 $ 24 SERIES I $ – $ – SERIES O $ 1 248 $ 479 INCREASE (DECREASE) IN NAV PER MUTUAL FUND SHARE SERIES A $ 1.07 $ 2.12 ADVISOR SERIES $ 1.11 $ 2.07 SERIES H $ (0.01) $ 1.08 SERIES D $ 1.17 $ 1.77 SERIES F $ 1.19 $ 1.31 SERIES I $ 0.28 $ 2.78 SERIES O $ 1.31 $ 1.20
257
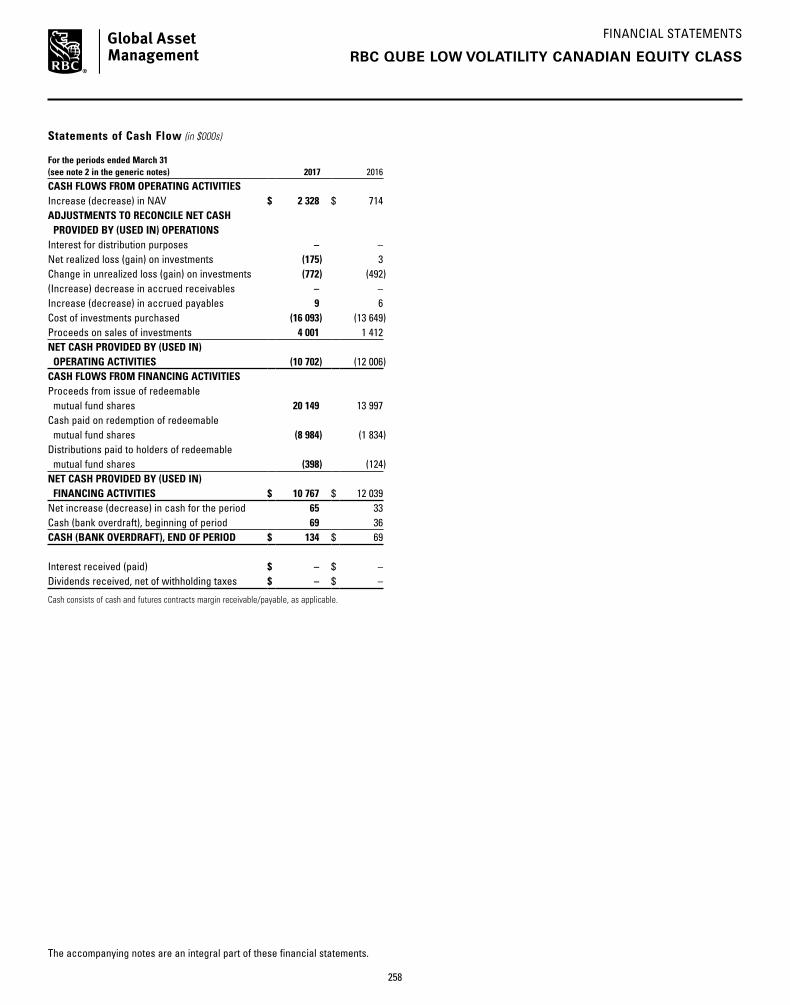
FINANCIAL STATEMENTS
The accompanying notes are an integral part of these financial statements.
RBC QUBE LOW VOLATILITY CANADIAN EQUITY CLASS
Statements of Cash Flow (in $000s)
For the periods ended March 31 (see note 2 in the generic notes) 2017
2016
CASH FLOWS FROM OPERATING ACTIVITIESIncrease (decrease) in NAV $ 2 328 $ 714 ADJUSTMENTS TO RECONCILE NET CASH PROVIDED BY (USED IN) OPERATIONSInterest for distribution purposes – – Net realized loss (gain) on investments (175) 3 Change in unrealized loss (gain) on investments (772) (492)(Increase) decrease in accrued receivables – – Increase (decrease) in accrued payables 9 6 Cost of investments purchased (16 093) (13 649)Proceeds on sales of investments 4 001 1 412 NET CASH PROVIDED BY (USED IN) OPERATING ACTIVITIES (10 702) (12 006)CASH FLOWS FROM FINANCING ACTIVITIESProceeds from issue of redeemable mutual fund shares 20 149 13 997 Cash paid on redemption of redeemable mutual fund shares (8 984) (1 834)Distributions paid to holders of redeemable mutual fund shares (398) (124)NET CASH PROVIDED BY (USED IN) FINANCING ACTIVITIES $ 10 767 $ 12 039 Net increase (decrease) in cash for the period 65 33 Cash (bank overdraft), beginning of period 69 36 CASH (BANK OVERDRAFT), END OF PERIOD $ 134 $ 69
Interest received (paid) $ – $ – Dividends received, net of withholding taxes $ – $ –
Cash consists of cash and futures contracts margin receivable/payable, as applicable.
258

FINANCIAL STATEMENTS
The accompanying notes are an integral part of these financial statements.
RBC QUBE LOW VOLATILITY CANADIAN EQUITY CLASS
Statements of Changes in NAV (in $000s)
For the periods ended March 31 (see note 2 in the generic notes)
Series A Advisor Series Series H Series D2017 2016 2017 2016 2017 2016 2017 2016
NAV AT BEGINNING OF PERIOD $ 2 361 $ 1 193 $ 304 $ 1 $ 608 $ 1 $ 2 021 $ 82 INCREASE (DECREASE) IN NAV 388 75 114 10 (1) 19 260 107 Early redemption fees – – – – – – – – Proceeds from redeemable mutual fund shares issued 4 245 1 953 1 743 303 – 824 1 782 2 057 Reinvestments of distributions to holders of redeemable mutual fund shares 50 – 26 – – – 68 12 Redemption of redeemable mutual fund shares (3 237) (860) (300) (10) (607) (236) (1 104) (225)NET INCREASE (DECREASE) FROM REDEEMABLE MUTUAL FUND SHARE TRANSACTIONS 1 058 1 093 1 469 293 (607) 588 746 1 844 Distributions from net income (53) – (28) – – – (69) (12)Distributions from net gains – – – – – – – – Distributions from capital – – – – – – – – TOTAL DISTRIBUTIONS TO HOLDERS OF REDEEMABLE MUTUAL FUND SHARES (53) – (28) – – – (69) (12)NET INCREASE (DECREASE) IN NAV 1 393 1 168 1 555 303 (608) 607 937 1 939 NAV AT END OF PERIOD $ 3 754 $ 2 361 $ 1 859 $ 304 $ – $ 608 $ 2 958 $ 2 021
For the periods ended March 31 (see note 2 in the generic notes)
Series F Series I Series O Total2017 2016 2017 2016 2017 2016 2017 2016
NAV AT BEGINNING OF PERIOD $ 449 $ 31 $ 1 $ 1 $ 8 064 $ 147 $ 13 808 $ 1 456 INCREASE (DECREASE) IN NAV 319 24 – – 1 248 479 2 328 714 Early redemption fees – – – – – – – – Proceeds from redeemable mutual fund shares issued 5 977 580 – – 6 265 7 879 20 012 13 596 Reinvestments of distributions to holders of redeemable mutual fund shares 110 4 – – 17 9 271 25 Redemption of redeemable mutual fund shares (479) (186) (1) – (3 297) (317) (9 025) (1 834)NET INCREASE (DECREASE) FROM REDEEMABLE MUTUAL FUND SHARE TRANSACTIONS 5 608 398 (1) – 2 985 7 571 11 258 11 787 Distributions from net income (147) (4) – – (372) (133) (669) (149)Distributions from net gains – – – – – – – – Distributions from capital – – – – – – – – TOTAL DISTRIBUTIONS TO HOLDERS OF REDEEMABLE MUTUAL FUND SHARES (147) (4) – – (372) (133) (669) (149)NET INCREASE (DECREASE) IN NAV 5 780 418 (1) – 3 861 7 917 12 917 12 352 NAV AT END OF PERIOD $ 6 229 $ 449 $ – $ 1 $ 11 925 $ 8 064 $ 26 725 $ 13 808
259

NOTES TO FINANCIAL STATEMENTS – FUND SPECIFIC INFORMATION
Please see the generic notes at the back of the financial statements.
March 31, 2017
RBC QUBE LOW VOLATILITY CANADIAN EQUITY CLASS
General information (see note 1 in the generic notes)
The investment objective of the Fund is to provide long-term
capital growth by investing primarily in equity securities of
Canadian companies.
Financial instrument risk and capital management (see note 4 in the generic notes)
The Fund invests in the RBC QUBE Low Volatility Canadian
Equity Fund. The Fund’s exposure to financial instrument risk
is based on the underlying mutual fund asset mix.
Concentration risk (%)
The table below summarizes the Fund’s investment portfolio
(after consideration of derivative products, if any) as at:
Investment mixMarch 31
2017March 31
2016
Financials 28.9 28.8Utilities 13.4 11.7Industrials 13.0 5.8Energy 9.9 13.4Real Estate 9.9 –Telecommunication Services 9.4 8.3Consumer Staples 7.7 17.2Consumer Discretionary 4.5 8.9Materials 2.1 3.5Health Care 0.7 0.6Information Technology – 1.4Cash/Other 0.5 0.4Total 100.0 100.0
Other price risk (% impact on net assets)
The table below shows the impact of a 1% change in the
broad-based index (noted below) on the Fund’s net assets,
using a 26-month (March 31, 2016 – 14-month) historical
correlation of data of the Fund’s return and the index, with all
other factors kept constant, as at:
March 31 2017
March 31 2016
S&P/TSX Capped Composite Total Return Index + or - 0.5 + or - 0.6
Since historical correlation may not be representative of future
correlation, actual results could differ from this sensitivity
analysis and the difference could be material.
Fair value hierarchy ($000s except % amounts) (see note 3 in the generic notes)
The following is a summary of the inputs used as of
March 31, 2017 and 2016.
March 31, 2017 Level 1 Level 2 Level 3 Total
Equities – – – – Mutual fund units 26 687 – – 26 687Fixed-income and debt securities – – – – Short-term investments – – – – Derivatives – assets – – – – Derivatives – liabilities – – – – Total financial instruments 26 687 – – 26 687% of total portfolio 100.0 – – 100.0
March 31, 2016 Level 1 Level 2 Level 3 Total
Equities – – – – Mutual fund units 13 786 – – 13 786 Fixed-income and debt securities – – – – Short-term investments – – – – Derivatives – assets – – – – Derivatives – liabilities – – – – Total financial instruments 13 786 – – 13 786 % of total portfolio 100.0 – – 100.0
For the periods ended March 31, 2017 and 2016, there were
no transfers of financial instruments between Level 1, Level 2
and Level 3.
Management fees and operating expenses (see note 6 in the generic notes)
Management fees and administration fees of each series
of the Fund are payable to RBC GAM and calculated at the
following annual percentages, before GST/HST, of the daily
net asset value of each series of the Fund.
Management fees* Operating expenses
Series A 1.60% 0.08%Advisor Series 1.60% 0.08%Series D 0.85% 0.08%Series F 0.60% 0.08%Series O n/a† 0.02%
* Effective June 30, 2016, the management fees for Series A and Advisor Series mutual fund shares were reduced to 1.60% from 1.75%; for Series D mutual fund shares were reduced to 0.85% from 1.00%; and for Series F mutual fund shares were reduced to 0.60% from 0.75%.
† Series O shareholders pay a negotiated management fee directly to RBC GAM for investment-counselling services.
260

NOTES TO FINANCIAL STATEMENTS – FUND SPECIFIC INFORMATION
Please see the generic notes at the back of the financial statements.
March 31, 2017
RBC QUBE LOW VOLATILITY CANADIAN EQUITY CLASS
Investments by related parties ($000s except mutual fund share amounts)
Royal Bank of Canada, or one of its subsidiaries, held the
following investments in the Fund as at:
March 31 2017
March 31 2016
Mutual fund shares held Series A 102 100 Advisor Series 102 100 Series H – 100 Series D 103 101 Series F 103 101 Series I – 101 Series O 105 102Value of all mutual fund shares 6 7
Underlying mutual fund ownership interest (%)
The table below summarizes the Fund’s interest in the
underlying mutual fund as a percentage of NAV, and the
Fund’s ownership interest as a percentage of the net assets of
the underlying fund (“Ownership”). The underlying fund is
established and conducts business in Canada, and has an
associate relationship to the Fund.
March 31 2017
March 31 2016
NAV Ownership NAV Ownership
RBC QUBE Low Volatility Canadian Equity Fund 99.9 1.5 99.8 0.9
Taxes ($000s) (see note 5 in the generic notes)
The Fund had no capital or non-capital losses as at
March 31, 2017.
Redeemable mutual fund shares (000s)
There is no limitation on the number of mutual fund shares
available for issue. Mutual fund shares are purchased and
redeemed at the NAV per mutual fund share.
For the periods ended March 31 (see note 2 in the generic notes) 2017 2016
Series A Opening mutual fund shares 228 117Issued number of mutual fund shares 397 197Reinvested number of mutual fund shares 4 – Redeemed number of mutual fund shares (296) (86)Ending number of mutual fund shares 333 228
For the periods ended March 31 (see note 2 in the generic notes) 2017 2016
Advisor SeriesOpening mutual fund shares 29 – Issued number of mutual fund shares 161 30Reinvested number of mutual fund shares 2 – Redeemed number of mutual fund shares (27) (1)Ending number of mutual fund shares 165 29
Series DOpening mutual fund shares 194 8Issued number of mutual fund shares 164 208Reinvested number of mutual fund shares 6 1Redeemed number of mutual fund shares (103) (23)Ending number of mutual fund shares 261 194
Series FOpening mutual fund shares 43 3Issued number of mutual fund shares 539 58Reinvested number of mutual fund shares 10 – Redeemed number of mutual fund shares (43) (18)Ending number of mutual fund shares 549 43
Series OOpening mutual fund shares 772 14Issued number of mutual fund shares 570 788Reinvested number of mutual fund shares 2 1Redeemed number of mutual fund shares (295) (31)Ending number of mutual fund shares 1 049 772
261

SCHEDULE OF INVESTMENT PORTFOLIO (in $000s)
ANNUAL FINANCIAL STATEMENTS
March 31, 2017
The accompanying notes are an integral part of the financial statements.
PHILLIPS, HAGER & NORTH CANADIAN EQUITY VALUE CLASS
Number Fair % of Net of Units Security Cost Value Assets
MUTUAL FUND UNITS 257 070 Phillips, Hager & North Canadian Equity Value Fund* $ 3 392 $ 3 681
TOTAL MUTUAL FUND UNITS $ 3 392 3 681 100.0OTHER NET ASSETS ATTRIBUTABLE TO HOLDERS OF REDEEMABLE SHARES 1 –NET ASSETS ATTRIBUTABLE TO HOLDERS OF REDEEMABLE SHARES $ 3 682 100.0
* Investment in related party (see note 6 in the generic notes).
262
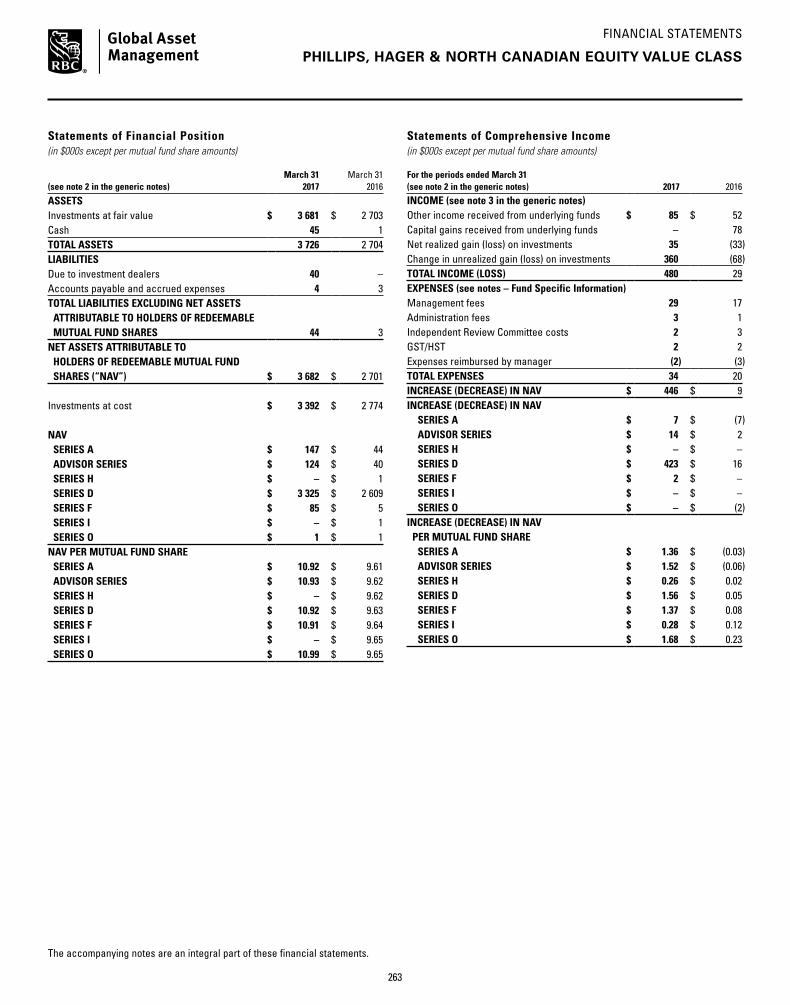
FINANCIAL STATEMENTS
The accompanying notes are an integral part of these financial statements.
PHILLIPS, HAGER & NORTH CANADIAN EQUITY VALUE CLASS
Statements of Financial Position (in $000s except per mutual fund share amounts)
(see note 2 in the generic notes)March 31
2017March 31
2016
ASSETSInvestments at fair value $ 3 681 $ 2 703 Cash 45 1 TOTAL ASSETS 3 726 2 704 LIABILITIESDue to investment dealers 40 –Accounts payable and accrued expenses 4 3 TOTAL LIABILITIES EXCLUDING NET ASSETS ATTRIBUTABLE TO HOLDERS OF REDEEMABLE MUTUAL FUND SHARES 44 3 NET ASSETS ATTRIBUTABLE TO HOLDERS OF REDEEMABLE MUTUAL FUND SHARES (“NAV”) $ 3 682 $ 2 701
Investments at cost $ 3 392 $ 2 774
NAV SERIES A $ 147 $ 44 ADVISOR SERIES $ 124 $ 40 SERIES H $ – $ 1 SERIES D $ 3 325 $ 2 609 SERIES F $ 85 $ 5 SERIES I $ – $ 1 SERIES O $ 1 $ 1 NAV PER MUTUAL FUND SHARE SERIES A $ 10.92 $ 9.61 ADVISOR SERIES $ 10.93 $ 9.62 SERIES H $ – $ 9.62 SERIES D $ 10.92 $ 9.63 SERIES F $ 10.91 $ 9.64 SERIES I $ – $ 9.65 SERIES O $ 10.99 $ 9.65
Statements of Comprehensive Income (in $000s except per mutual fund share amounts)
For the periods ended March 31 (see note 2 in the generic notes) 2017 2016INCOME (see note 3 in the generic notes)Other income received from underlying funds $ 85 $ 52 Capital gains received from underlying funds – 78 Net realized gain (loss) on investments 35 (33)Change in unrealized gain (loss) on investments 360 (68)TOTAL INCOME (LOSS) 480 29 EXPENSES (see notes – Fund Specific Information)Management fees 29 17 Administration fees 3 1 Independent Review Committee costs 2 3 GST/HST 2 2 Expenses reimbursed by manager (2) (3)TOTAL EXPENSES 34 20 INCREASE (DECREASE) IN NAV $ 446 $ 9 INCREASE (DECREASE) IN NAV SERIES A $ 7 $ (7) ADVISOR SERIES $ 14 $ 2 SERIES H $ – $ – SERIES D $ 423 $ 16 SERIES F $ 2 $ – SERIES I $ – $ – SERIES O $ – $ (2)INCREASE (DECREASE) IN NAV PER MUTUAL FUND SHARE SERIES A $ 1.36 $ (0.03) ADVISOR SERIES $ 1.52 $ (0.06) SERIES H $ 0.26 $ 0.02 SERIES D $ 1.56 $ 0.05 SERIES F $ 1.37 $ 0.08 SERIES I $ 0.28 $ 0.12 SERIES O $ 1.68 $ 0.23
263

FINANCIAL STATEMENTS
The accompanying notes are an integral part of these financial statements.
PHILLIPS, HAGER & NORTH CANADIAN EQUITY VALUE CLASS
Statements of Cash Flow (in $000s)
For the periods ended March 31 (see note 2 in the generic notes) 2017 2016
CASH FLOWS FROM OPERATING ACTIVITIESIncrease (decrease) in NAV $ 446 $ 9 ADJUSTMENTS TO RECONCILE NET CASH PROVIDED BY (USED IN) OPERATIONSInterest for distribution purposes – – Net realized loss (gain) on investments (35) 33 Change in unrealized loss (gain) on investments (360) 68 (Increase) decrease in accrued receivables – – Increase (decrease) in accrued payables 1 2 Cost of investments purchased (1 254) (2 658)Proceeds on sales of investments 711 634 NET CASH PROVIDED BY (USED IN) OPERATING ACTIVITIES (491) (1 912)CASH FLOWS FROM FINANCING ACTIVITIESProceeds from issue of redeemable mutual fund shares 1 376 2 494 Cash paid on redemption of redeemable mutual fund shares (839) (589)Distributions paid to holders of redeemable mutual fund shares (2) (1)NET CASH PROVIDED BY (USED IN) FINANCING ACTIVITIES $ 535 $ 1 904 Net increase (decrease) in cash for the period 44 (8)Cash (bank overdraft), beginning of period 1 9 CASH (BANK OVERDRAFT), END OF PERIOD $ 45 $ 1
Interest received (paid) $ – $ – Dividends received, net of withholding taxes $ – $ –
Cash consists of cash and futures contracts margin receivable/payable, as applicable.
264

FINANCIAL STATEMENTS
The accompanying notes are an integral part of these financial statements.
PHILLIPS, HAGER & NORTH CANADIAN EQUITY VALUE CLASS
Statements of Changes in NAV (in $000s)
For the periods ended March 31 (see note 2 in the generic notes)
Series A Advisor Series Series H Series D2017 2016 2017 2016 2017 2016 2017 2016
NAV AT BEGINNING OF PERIOD $ 44 $ 10 $ 40 $ 1 $ 1 $ 1 $ 2 609 $ 629 INCREASE (DECREASE) IN NAV 7 (7) 14 2 – – 423 16 Early redemption fees – – – – – – – – Proceeds from redeemable mutual fund shares issued 138 119 70 37 – – 1 085 2 334 Reinvestments of distributions to holders of redeemable mutual fund shares 2 – 2 – – – 77 50 Redemption of redeemable mutual fund shares (42) (78) – – (1) – (790) (369)NET INCREASE (DECREASE) FROM REDEEMABLE MUTUAL FUND SHARE TRANSACTIONS 98 41 72 37 (1) – 372 2 015 Distributions from net income (2) – (2) – – – (79) (51)Distributions from net gains – – – – – – – – Distributions from capital – – – – – – – – TOTAL DISTRIBUTIONS TO HOLDERS OF REDEEMABLE MUTUAL FUND SHARES (2) – (2) – – – (79) (51)NET INCREASE (DECREASE) IN NAV 103 34 84 39 (1) – 716 1 980 NAV AT END OF PERIOD $ 147 $ 44 $ 124 $ 40 $ – $ 1 $ 3 325 $ 2 609
For the periods ended March 31 (see note 2 in the generic notes)
Series F Series I Series O Total2017 2016 2017 2016 2017 2016 2017 2016
NAV AT BEGINNING OF PERIOD $ 5 $ 1 $ 1 $ 1 $ 1 $ 145 $ 2 701 $ 788 INCREASE (DECREASE) IN NAV 2 – – – – (2) 446 9 Early redemption fees – – – – – – – – Proceeds from redeemable mutual fund shares issued 83 4 – – – – 1 376 2 494 Reinvestments of distributions to holders of redeemable mutual fund shares 2 – – – – – 83 50 Redemption of redeemable mutual fund shares (5) – (1) – – (142) (839) (589)NET INCREASE (DECREASE) FROM REDEEMABLE MUTUAL FUND SHARE TRANSACTIONS 80 4 (1) – – (142) 620 1 955 Distributions from net income (2) – – – – – (85) (51)Distributions from net gains – – – – – – – – Distributions from capital – – – – – – – – TOTAL DISTRIBUTIONS TO HOLDERS OF REDEEMABLE MUTUAL FUND SHARES (2) – – – – – (85) (51)NET INCREASE (DECREASE) IN NAV 80 4 (1) – – (144) 981 1 913 NAV AT END OF PERIOD $ 85 $ 5 $ – $ 1 $ 1 $ 1 $ 3 682 $ 2 701
265
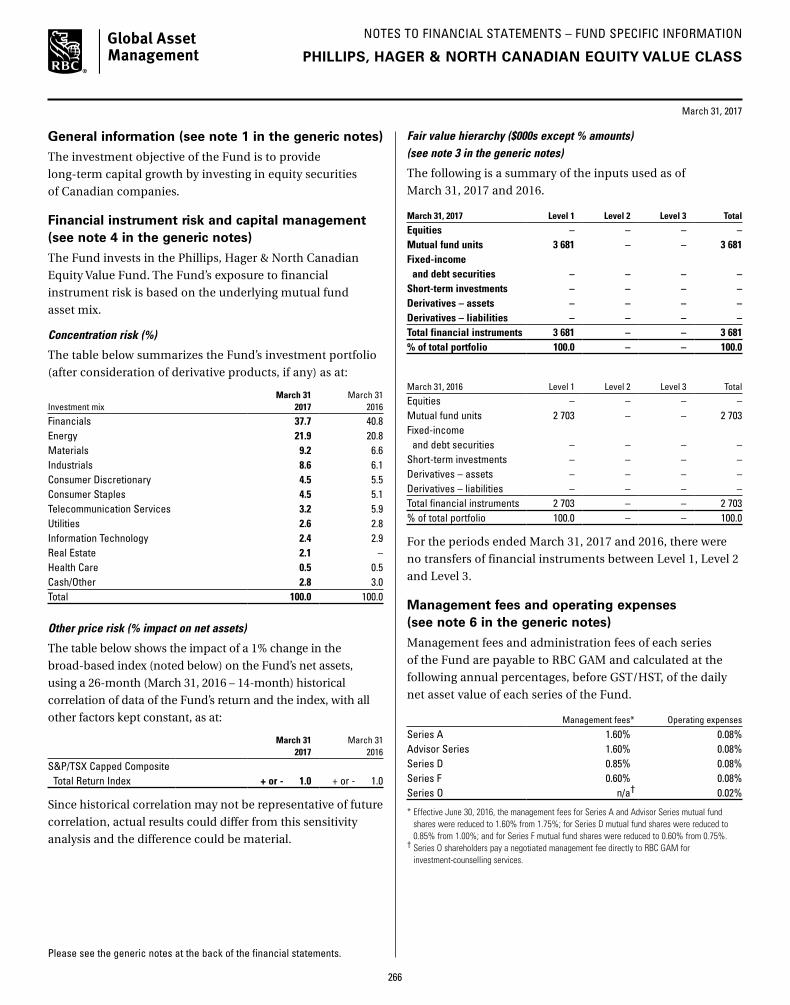
NOTES TO FINANCIAL STATEMENTS – FUND SPECIFIC INFORMATION
Please see the generic notes at the back of the financial statements.
March 31, 2017
PHILLIPS, HAGER & NORTH CANADIAN EQUITY VALUE CLASS
General information (see note 1 in the generic notes)
The investment objective of the Fund is to provide
long-term capital growth by investing in equity securities
of Canadian companies.
Financial instrument risk and capital management (see note 4 in the generic notes)
The Fund invests in the Phillips, Hager & North Canadian
Equity Value Fund. The Fund’s exposure to financial
instrument risk is based on the underlying mutual fund
asset mix.
Concentration risk (%)
The table below summarizes the Fund’s investment portfolio
(after consideration of derivative products, if any) as at:
Investment mixMarch 31
2017March 31
2016
Financials 37.7 40.8Energy 21.9 20.8Materials 9.2 6.6Industrials 8.6 6.1Consumer Discretionary 4.5 5.5Consumer Staples 4.5 5.1Telecommunication Services 3.2 5.9Utilities 2.6 2.8Information Technology 2.4 2.9Real Estate 2.1 –Health Care 0.5 0.5Cash/Other 2.8 3.0Total 100.0 100.0
Other price risk (% impact on net assets)
The table below shows the impact of a 1% change in the
broad-based index (noted below) on the Fund’s net assets,
using a 26-month (March 31, 2016 – 14-month) historical
correlation of data of the Fund’s return and the index, with all
other factors kept constant, as at:
March 31 2017
March 31 2016
S&P/TSX Capped Composite Total Return Index + or - 1.0 + or - 1.0
Since historical correlation may not be representative of future
correlation, actual results could differ from this sensitivity
analysis and the difference could be material.
Fair value hierarchy ($000s except % amounts) (see note 3 in the generic notes)
The following is a summary of the inputs used as of
March 31, 2017 and 2016.
March 31, 2017 Level 1 Level 2 Level 3 Total
Equities – – – – Mutual fund units 3 681 – – 3 681Fixed-income and debt securities – – – – Short-term investments – – – – Derivatives – assets – – – – Derivatives – liabilities – – – – Total financial instruments 3 681 – – 3 681% of total portfolio 100.0 – – 100.0
March 31, 2016 Level 1 Level 2 Level 3 Total
Equities – – – – Mutual fund units 2 703 – – 2 703 Fixed-income and debt securities – – – – Short-term investments – – – – Derivatives – assets – – – – Derivatives – liabilities – – – – Total financial instruments 2 703 – – 2 703 % of total portfolio 100.0 – – 100.0
For the periods ended March 31, 2017 and 2016, there were
no transfers of financial instruments between Level 1, Level 2
and Level 3.
Management fees and operating expenses (see note 6 in the generic notes)
Management fees and administration fees of each series
of the Fund are payable to RBC GAM and calculated at the
following annual percentages, before GST/HST, of the daily
net asset value of each series of the Fund.
Management fees* Operating expenses
Series A 1.60% 0.08%Advisor Series 1.60% 0.08%Series D 0.85% 0.08%Series F 0.60% 0.08%Series O n/a† 0.02%
* Effective June 30, 2016, the management fees for Series A and Advisor Series mutual fund shares were reduced to 1.60% from 1.75%; for Series D mutual fund shares were reduced to 0.85% from 1.00%; and for Series F mutual fund shares were reduced to 0.60% from 0.75%.
† Series O shareholders pay a negotiated management fee directly to RBC GAM for investment-counselling services.
266

NOTES TO FINANCIAL STATEMENTS – FUND SPECIFIC INFORMATION
Please see the generic notes at the back of the financial statements.
March 31, 2017
PHILLIPS, HAGER & NORTH CANADIAN EQUITY VALUE CLASS
Investments by related parties ($000s except mutual fund share amounts)
Royal Bank of Canada, or one of its subsidiaries, held the
following investments in the Fund as at:
March 312017
March 31 2016
Mutual fund shares held Series A 103 101 Advisor Series 103 101 Series H – 101 Series D 104 102 Series F 105 102 Series I – 102 Series O 106 103Value of all mutual fund shares 6 7
Underlying mutual fund ownership interest (%)
The table below summarizes the Fund’s interest in the
underlying mutual fund as a percentage of NAV, and the
Fund’s ownership interest as a percentage of the net assets of
the underlying fund (“Ownership”). The underlying fund is
established and conducts business in Canada, and has an
associate relationship to the Fund.
March 31 2017
March 31 2016
NAV Ownership NAV Ownership
Phillips, Hager & North Canadian Equity Value Fund 100.0 0.3 100.1 0.3
Taxes ($000s) (see note 5 in the generic notes)
The Fund had no capital or non-capital losses as at
March 31, 2017.
Redeemable mutual fund shares (000s)
There is no limitation on the number of mutual fund shares
available for issue. Mutual fund shares are purchased and
redeemed at the NAV per mutual fund share.
For the periods ended March 31 (see note 2 in the generic notes) 2017 2016
Series A Opening mutual fund shares 5 1Issued number of mutual fund shares 12 13Reinvested number of mutual fund shares – – Redeemed number of mutual fund shares (4) (9)Ending number of mutual fund shares 13 5
For the periods ended March 31 (see note 2 in the generic notes) 2017 2016
Advisor SeriesOpening mutual fund shares 4 – Issued number of mutual fund shares 7 4Reinvested number of mutual fund shares – – Redeemed number of mutual fund shares – – Ending number of mutual fund shares 11 4
Series DOpening mutual fund shares 271 62Issued number of mutual fund shares 101 243Reinvested number of mutual fund shares 7 5Redeemed number of mutual fund shares (75) (39)Ending number of mutual fund shares 304 271
Series FOpening mutual fund shares 1 – Issued number of mutual fund shares 7 1Reinvested number of mutual fund shares – – Redeemed number of mutual fund shares – – Ending number of mutual fund shares 8 1
Series OOpening mutual fund shares – 14Issued number of mutual fund shares – – Reinvested number of mutual fund shares – – Redeemed number of mutual fund shares – (14)Ending number of mutual fund shares – –
267
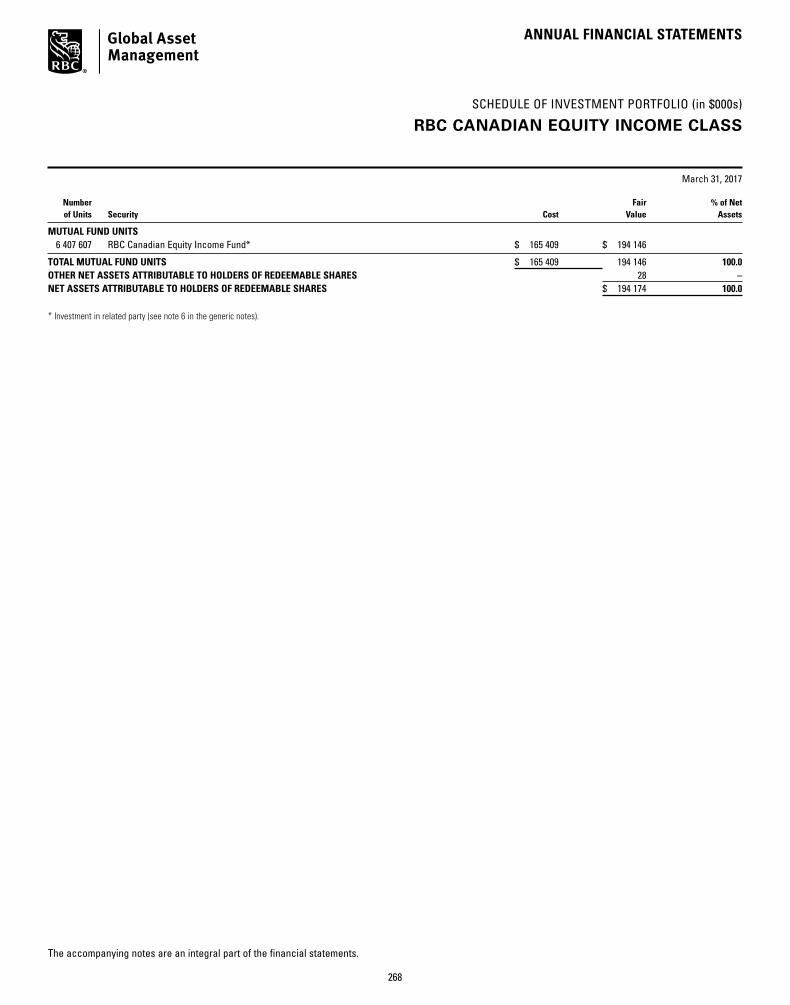
SCHEDULE OF INVESTMENT PORTFOLIO (in $000s)
ANNUAL FINANCIAL STATEMENTS
March 31, 2017
The accompanying notes are an integral part of the financial statements.
RBC CANADIAN EQUITY INCOME CLASS
Number Fair % of Net of Units Security Cost Value Assets
MUTUAL FUND UNITS 6 407 607 RBC Canadian Equity Income Fund* $ 165 409 $ 194 146
TOTAL MUTUAL FUND UNITS $ 165 409 194 146 100.0OTHER NET ASSETS ATTRIBUTABLE TO HOLDERS OF REDEEMABLE SHARES 28 –NET ASSETS ATTRIBUTABLE TO HOLDERS OF REDEEMABLE SHARES $ 194 174 100.0
* Investment in related party (see note 6 in the generic notes).
268

FINANCIAL STATEMENTS
The accompanying notes are an integral part of these financial statements.
RBC CANADIAN EQUITY INCOME CLASS
Statements of Financial Position (in $000s except per mutual fund share amounts)
(see note 2 in the generic notes)March 31
2017March 31
2016
ASSETSInvestments at fair value $ 194 146 $ 181 842 Cash 313 82 Due from investment dealers 300 250 Subscriptions receivable 93 151 TOTAL ASSETS 194 852 182 325 LIABILITIESRedemptions payable 436 313 Distributions payable 21 6 Accounts payable and accrued expenses 221 243 TOTAL LIABILITIES EXCLUDING NET ASSETS ATTRIBUTABLE TO HOLDERS OF REDEEMABLE MUTUAL FUND SHARES 678 562 NET ASSETS ATTRIBUTABLE TO HOLDERS OF REDEEMABLE MUTUAL FUND SHARES (“NAV”) $ 194 174 $ 181 763
Investments at cost $ 165 409 $ 181 650
NAV SERIES A $ 47 493 $ 39 064 ADVISOR SERIES $ 45 406 $ 48 330 ADVISOR T5 SERIES $ 1 614 $ 645 SERIES T5 $ 1 399 $ 907 SERIES H $ – $ 21 963 SERIES D $ 18 394 $ 16 637 SERIES F $ 75 552 $ 35 727 SERIES FT5 $ 2 621 $ 192 SERIES I $ – $ 17 117 SERIES O $ 1 695 $ 1 181 NAV PER MUTUAL FUND SHARE SERIES A $ 14.14 $ 12.22 ADVISOR SERIES $ 14.12 $ 12.20 ADVISOR T5 SERIES $ 13.35 $ 11.89 SERIES T5 $ 13.35 $ 11.89 SERIES H $ – $ 12.30 SERIES D $ 14.57 $ 12.58 SERIES F $ 14.71 $ 12.70 SERIES FT5 $ 14.19 $ 12.50 SERIES I $ – $ 12.76 SERIES O $ 14.97 $ 12.93
Statements of Comprehensive Income (in $000s except per mutual fund share amounts)
For the periods ended March 31 (see note 2 in the generic notes) 2017 2016INCOME (see note 3 in the generic notes)Interest for distribution purposes $ (3) $ (13)Other income received from underlying funds 3 746 8 580 Capital gains received from underlying funds – 1 843 Net realized gain (loss) on investments 2 228 (553)Change in unrealized gain (loss) on investments 28 545 (23 729)TOTAL INCOME (LOSS) 34 516 (13 872)EXPENSES (see notes – Fund Specific Information)Management fees 2 288 2 932 Administration fees 199 212 Board of Directors fees 23 27 Independent Review Committee costs 2 3 GST/HST 244 311 Expenses reimbursed by manager (7) (9)TOTAL EXPENSES 2 749 3 476 INCREASE (DECREASE) IN NAV $ 31 767 $ (17 348)INCREASE (DECREASE) IN NAV SERIES A $ 8 198 $ (3 785) ADVISOR SERIES $ 7 691 $ (4 990) ADVISOR T5 SERIES $ 152 $ (26) SERIES T5 $ 207 $ 69 SERIES H $ 870 $ (2 454) SERIES D $ 2 989 $ (943) SERIES F $ 10 462 $ (3 609) SERIES FT5 $ 195 $ (2) SERIES I $ 733 $ (1 561) SERIES O $ 270 $ (47)INCREASE (DECREASE) IN NAV PER MUTUAL FUND SHARE SERIES A $ 2.20 $ (1.06) ADVISOR SERIES $ 2.14 $ (1.06) ADVISOR T5 SERIES $ 1.98 $ (1.07) SERIES T5 $ 2.03 $ (1.09) SERIES H $ 0.49 $ (1.04) SERIES D $ 2.34 $ (0.98) SERIES F $ 2.41 $ (0.95) SERIES FT5 $ 2.28 $ (0.99) SERIES I $ 0.54 $ (0.95) SERIES O $ 2.56 $ (0.87)
269

FINANCIAL STATEMENTS
The accompanying notes are an integral part of these financial statements.
Statements of Cash Flow (in $000s)
For the periods ended March 31 (see note 2 in the generic notes) 2017
2016
CASH FLOWS FROM OPERATING ACTIVITIESIncrease (decrease) in NAV $ 31 767 $ (17 348)ADJUSTMENTS TO RECONCILE NET CASH PROVIDED BY (USED IN) OPERATIONSInterest for distribution purposes – – Net realized loss (gain) on investments (2 228) 553 Change in unrealized loss (gain) on investments (28 545) 23 729 (Increase) decrease in accrued receivables – – Increase (decrease) in accrued payables (22) (124)Cost of investments purchased (12 452) (18 184)Proceeds on sales of investments 30 871 71 547 NET CASH PROVIDED BY (USED IN) OPERATING ACTIVITIES 19 391 60 173 CASH FLOWS FROM FINANCING ACTIVITIESProceeds from issue of redeemable mutual fund shares 90 158 43 308 Cash paid on redemption of redeemable mutual fund shares (108 295) (102 250)Distributions paid to holders of redeemable mutual fund shares (1 023) (971)NET CASH PROVIDED BY (USED IN) FINANCING ACTIVITIES $ (19 160) $ (59 913)Net increase (decrease) in cash for the period 231 260 Cash (bank overdraft), beginning of period 82 (178)CASH (BANK OVERDRAFT), END OF PERIOD $ 313 $ 82
Interest received (paid) $ (3) $ (13)Dividends received, net of withholding taxes $ – $ –
Cash consists of cash and futures contracts margin receivable/payable, as applicable.
RBC CANADIAN EQUITY INCOME CLASS
270

FINANCIAL STATEMENTS
The accompanying notes are an integral part of these financial statements.
RBC CANADIAN EQUITY INCOME CLASS
Statements of Changes in NAV (in $000s)
For the periods ended March 31 (see note 2 in the generic notes)
Series A Advisor Series Advisor T5 Series Series T52017 2016 2017 2016 2017 2016 2017 2016
NAV AT BEGINNING OF PERIOD $ 39 064 $ 57 773 $ 48 330 $ 73 116 $ 645 $ 50 $ 907 $ 140 INCREASE (DECREASE) IN NAV 8 198 (3 785) 7 691 (4 990) 152 (26) 207 69 Early redemption fees – – 1 – – – – – Proceeds from redeemable mutual fund shares issued 26 791 5 272 5 796 8 068 974 747 732 807 Reinvestments of distributions to holders of redeemable mutual fund shares 647 740 629 909 6 1 8 2 Redemption of redeemable mutual fund shares (26 474) (20 111) (16 342) (27 764) (116) (101) (394) (96)NET INCREASE (DECREASE) FROM REDEEMABLE MUTUAL FUND SHARE TRANSACTIONS 964 (14 099) (9 916) (18 787) 864 647 346 713 Distributions from net income (733) (825) (699) (1 009) (19) (15) (24) (10)Distributions from net gains – – – – – – – – Distributions from capital – – – – (28) (11) (37) (5)TOTAL DISTRIBUTIONS TO HOLDERS OF REDEEMABLE MUTUAL FUND SHARES (733) (825) (699) (1 009) (47) (26) (61) (15)NET INCREASE (DECREASE) IN NAV 8 429 (18 709) (2 924) (24 786) 969 595 492 767 NAV AT END OF PERIOD $ 47 493 $ 39 064 $ 45 406 $ 48 330 $ 1 614 $ 645 $ 1 399 $ 907
For the periods ended March 31 (see note 2 in the generic notes)
Series H Series D Series F Series FT52017 2016 2017 2016 2017 2016 2017 2016
NAV AT BEGINNING OF PERIOD $ 21 963 $ 32 574 $ 16 637 $ 17 374 $ 35 727 $ 54 612 $ 192 $ 1 INCREASE (DECREASE) IN NAV 870 (2 454) 2 989 (943) 10 462 (3 609) 195 (2)Early redemption fees – – 1 – 1 – – – Proceeds from redeemable mutual fund shares issued 794 4 071 2 590 3 482 48 646 15 837 2 464 250 Reinvestments of distributions to holders of redeemable mutual fund shares – 392 378 454 1 265 680 10 4 Redemption of redeemable mutual fund shares (23 627) (12 118) (3 772) (3 234) (18 618) (30 628) (180) (55)NET INCREASE (DECREASE) FROM REDEEMABLE MUTUAL FUND SHARE TRANSACTIONS (22 833) (7 655) (803) 702 31 294 (14 111) 2 294 199 Distributions from net income – (502) (429) (496) (1 931) (1 165) (23) (3)Distributions from net gains – – – – – – – – Distributions from capital – – – – – – (37) (3)TOTAL DISTRIBUTIONS TO HOLDERS OF REDEEMABLE MUTUAL FUND SHARES – (502) (429) (496) (1 931) (1 165) (60) (6)NET INCREASE (DECREASE) IN NAV (21 963) (10 611) 1 757 (737) 39 825 (18 885) 2 429 191 NAV AT END OF PERIOD $ – $ 21 963 $ 18 394 $ 16 637 $ 75 552 $ 35 727 $ 2 621 $ 192
271
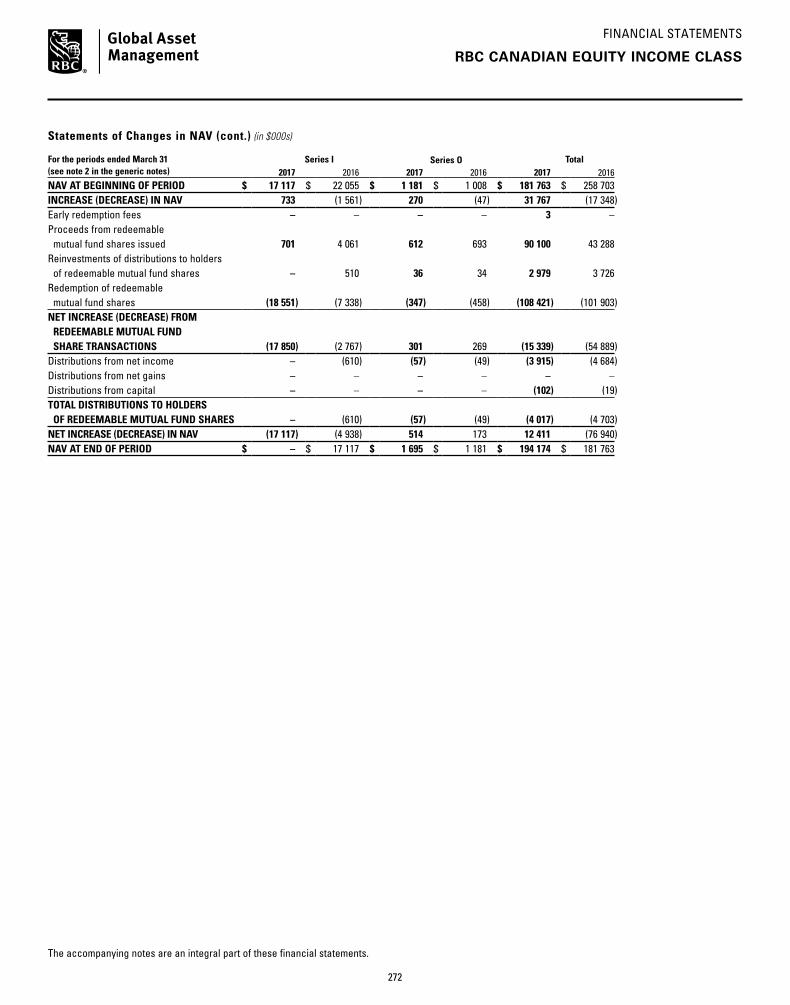
FINANCIAL STATEMENTS
The accompanying notes are an integral part of these financial statements.
RBC CANADIAN EQUITY INCOME CLASS
Statements of Changes in NAV (cont.) (in $000s)
For the periods ended March 31 (see note 2 in the generic notes)
Series I Series O Total2017 2016 2017 2016 2017 2016
NAV AT BEGINNING OF PERIOD $ 17 117 $ 22 055 $ 1 181 $ 1 008 $ 181 763 $ 258 703 INCREASE (DECREASE) IN NAV 733 (1 561) 270 (47) 31 767 (17 348)Early redemption fees – – – – 3 – Proceeds from redeemable mutual fund shares issued 701 4 061 612 693 90 100 43 288 Reinvestments of distributions to holders of redeemable mutual fund shares – 510 36 34 2 979 3 726 Redemption of redeemable mutual fund shares (18 551) (7 338) (347) (458) (108 421) (101 903)NET INCREASE (DECREASE) FROM REDEEMABLE MUTUAL FUND SHARE TRANSACTIONS (17 850) (2 767) 301 269 (15 339) (54 889)Distributions from net income – (610) (57) (49) (3 915) (4 684)Distributions from net gains – – – – – – Distributions from capital – – – – (102) (19)TOTAL DISTRIBUTIONS TO HOLDERS OF REDEEMABLE MUTUAL FUND SHARES – (610) (57) (49) (4 017) (4 703)NET INCREASE (DECREASE) IN NAV (17 117) (4 938) 514 173 12 411 (76 940)NAV AT END OF PERIOD $ – $ 17 117 $ 1 695 $ 1 181 $ 194 174 $ 181 763
272

NOTES TO FINANCIAL STATEMENTS – FUND SPECIFIC INFORMATION
Please see the generic notes at the back of the financial statements.
March 31, 2017
RBC CANADIAN EQUITY INCOME CLASS
General information (see note 1 in the generic notes)
The investment objective of the Fund is to provide long-term
capital growth by investing primarily in a diversified portfolio
of Canadian securities including, but not limited to, common
and preferred shares of Canadian companies that pay
dividends, real estate investment trusts and income trusts.
All outstanding Series H mutual fund shares were re-designated
as Series A mutual fund shares effective June 30, 2016. All
outstanding Series I mutual fund shares were re-designated as
Series F mutual fund shares effective June 30, 2016.
Financial instrument risk and capital management (see note 4 in the generic notes)
The Fund invests in the RBC Canadian Equity Income Fund.
The Fund’s exposure to financial instrument risk is based on
the underlying mutual fund asset mix.
Concentration risk (%)
The table below summarizes the Fund’s investment portfolio
(after consideration of derivative products, if any) as at:
Investment mixMarch 31
2017March 31
2016
Financials 31.8 41.2Energy 25.1 24.3Real Estate 11.3 –Utilities 9.0 9.4Materials 7.3 5.0Industrials 4.8 6.1Consumer Staples 2.4 2.9Telecommunication Services 2.4 4.1Health Care 1.5 0.9Consumer Discretionary 1.4 2.4Information Technology 0.6 0.5Cash/Other 2.4 3.2Total 100.0 100.0
Other price risk (% impact on net assets)
The table below shows the impact of a 1% change in the
broad-based index (noted below) on the Fund’s net assets,
using a 36-month historical correlation of data of the Fund’s
return and the index, with all other factors kept constant, as at:
March 31 2017
March 31 2016
S&P/TSX Capped Composite Total Return Index + or - 1.0 + or - 1.0
Since historical correlation may not be representative of
future correlation, actual results could differ from this
sensitivity analysis and the difference could be material.
Fair value hierarchy ($000s except % amounts) (see note 3 in the generic notes)
The following is a summary of the inputs used as of
March 31, 2017 and 2016.
March 31, 2017 Level 1 Level 2 Level 3 Total
Equities – – – – Mutual fund units 194 146 – – 194 146Fixed-income and debt securities – – – – Short-term investments – – – – Derivatives – assets – – – – Derivatives – liabilities – – – – Total financial instruments 194 146 – – 194 146% of total portfolio 100.0 – – 100.0
March 31, 2016 Level 1 Level 2 Level 3 Total
Equities – – – – Mutual fund units 181 842 – – 181 842 Fixed-income and debt securities – – – – Short-term investments – – – – Derivatives – assets – – – – Derivatives – liabilities – – – – Total financial instruments 181 842 – – 181 842 % of total portfolio 100.0 – – 100.0
For the periods ended March 31, 2017 and 2016, there were
no transfers of financial instruments between Level 1, Level 2
and Level 3.
Management fees and operating expenses (see note 6 in the generic notes)
Management fees and administration fees of each series
of the Fund are payable to RBC GAM and calculated at the
following annual percentages, before GST/HST, of the daily
net asset value of each series of the Fund.
Management fees* Operating expenses
Series A 1.60% 0.13%Advisor Series 1.60% 0.13%Advisor T5 Series 1.60% 0.13%Series T5 1.60% 0.13%Series H 1.65% 0.05%Series D 0.85% 0.08%Series F 0.60% 0.08%Series FT5 0.60% 0.08%Series I 0.60% 0.05%Series O n/a† 0.02%
* Effective June 30, 2016, the management fees for Series A, Advisor Series, Advisor T5 Series and Series T5 mutual fund shares were reduced to 1.60% from 1.75%; for Series D mutual fund shares were reduced to 0.85% from 1.00%; and for Series F and Series FT5 mutual fund shares were reduced to 0.60% from 0.75%.
† Series O shareholders pay a negotiated management fee directly to RBC GAM for investment-counselling services.
273
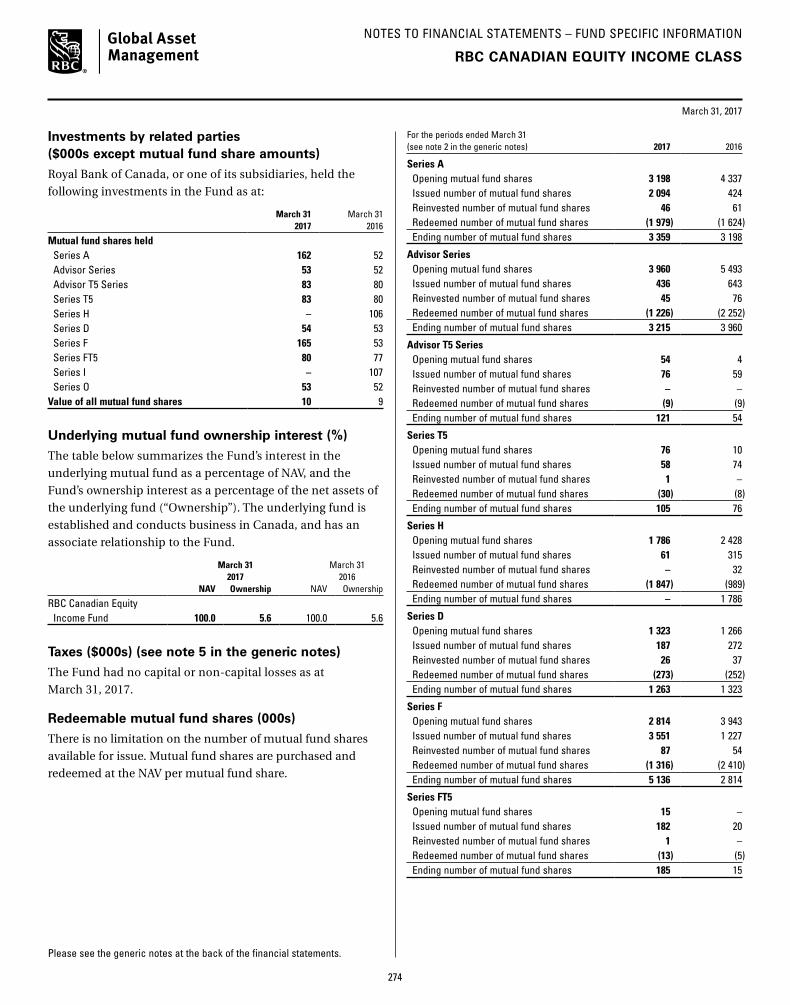
NOTES TO FINANCIAL STATEMENTS – FUND SPECIFIC INFORMATION
Please see the generic notes at the back of the financial statements.
March 31, 2017
Investments by related parties ($000s except mutual fund share amounts)
Royal Bank of Canada, or one of its subsidiaries, held the
following investments in the Fund as at:
March 31 2017
March 31 2016
Mutual fund shares held Series A 162 52 Advisor Series 53 52 Advisor T5 Series 83 80 Series T5 83 80 Series H – 106 Series D 54 53 Series F 165 53 Series FT5 80 77 Series I – 107 Series O 53 52Value of all mutual fund shares 10 9
Underlying mutual fund ownership interest (%)
The table below summarizes the Fund’s interest in the
underlying mutual fund as a percentage of NAV, and the
Fund’s ownership interest as a percentage of the net assets of
the underlying fund (“Ownership”). The underlying fund is
established and conducts business in Canada, and has an
associate relationship to the Fund.
March 31 2017
March 31 2016
NAV Ownership NAV Ownership
RBC Canadian Equity Income Fund 100.0 5.6 100.0 5.6
Taxes ($000s) (see note 5 in the generic notes)
The Fund had no capital or non-capital losses as at
March 31, 2017.
Redeemable mutual fund shares (000s)
There is no limitation on the number of mutual fund shares
available for issue. Mutual fund shares are purchased and
redeemed at the NAV per mutual fund share.
RBC CANADIAN EQUITY INCOME CLASS
For the periods ended March 31 (see note 2 in the generic notes) 2017 2016
Series A Opening mutual fund shares 3 198 4 337Issued number of mutual fund shares 2 094 424Reinvested number of mutual fund shares 46 61Redeemed number of mutual fund shares (1 979) (1 624)Ending number of mutual fund shares 3 359 3 198
Advisor SeriesOpening mutual fund shares 3 960 5 493Issued number of mutual fund shares 436 643Reinvested number of mutual fund shares 45 76Redeemed number of mutual fund shares (1 226) (2 252)Ending number of mutual fund shares 3 215 3 960
Advisor T5 SeriesOpening mutual fund shares 54 4Issued number of mutual fund shares 76 59Reinvested number of mutual fund shares – – Redeemed number of mutual fund shares (9) (9)Ending number of mutual fund shares 121 54
Series T5Opening mutual fund shares 76 10Issued number of mutual fund shares 58 74Reinvested number of mutual fund shares 1 – Redeemed number of mutual fund shares (30) (8)Ending number of mutual fund shares 105 76
Series HOpening mutual fund shares 1 786 2 428Issued number of mutual fund shares 61 315Reinvested number of mutual fund shares – 32Redeemed number of mutual fund shares (1 847) (989)Ending number of mutual fund shares – 1 786
Series DOpening mutual fund shares 1 323 1 266Issued number of mutual fund shares 187 272Reinvested number of mutual fund shares 26 37Redeemed number of mutual fund shares (273) (252)Ending number of mutual fund shares 1 263 1 323
Series FOpening mutual fund shares 2 814 3 943Issued number of mutual fund shares 3 551 1 227Reinvested number of mutual fund shares 87 54Redeemed number of mutual fund shares (1 316) (2 410)Ending number of mutual fund shares 5 136 2 814
Series FT5Opening mutual fund shares 15 – Issued number of mutual fund shares 182 20Reinvested number of mutual fund shares 1 – Redeemed number of mutual fund shares (13) (5)Ending number of mutual fund shares 185 15
274
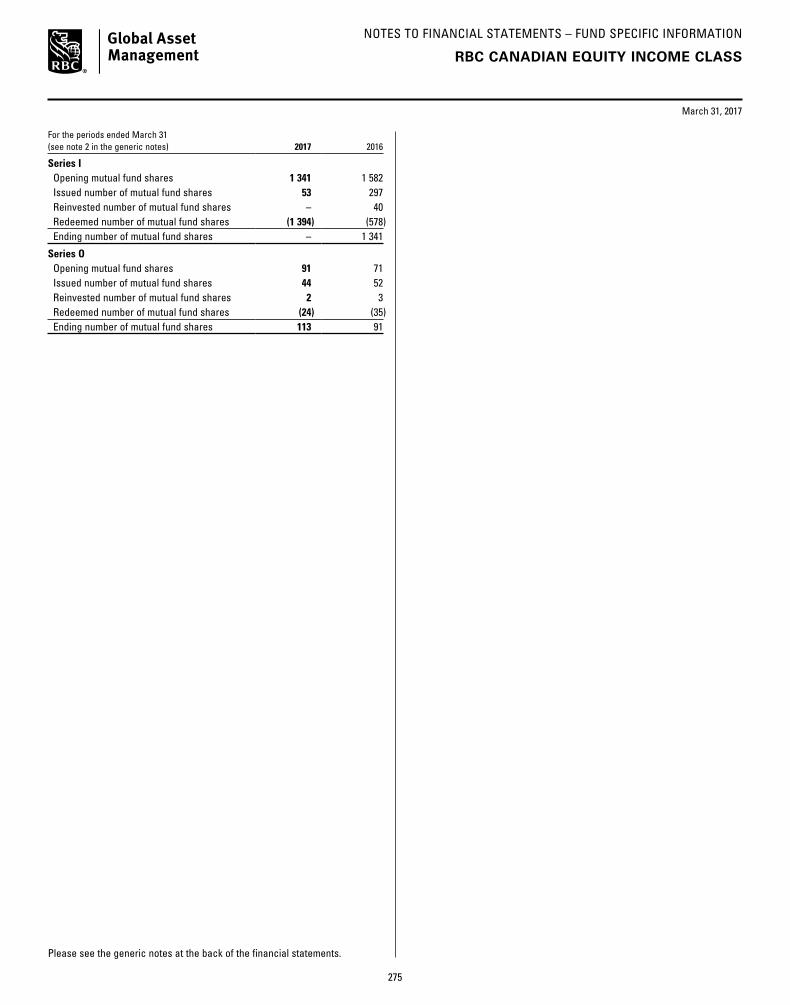
NOTES TO FINANCIAL STATEMENTS – FUND SPECIFIC INFORMATION
Please see the generic notes at the back of the financial statements.
March 31, 2017
For the periods ended March 31 (see note 2 in the generic notes) 2017 2016
Series IOpening mutual fund shares 1 341 1 582Issued number of mutual fund shares 53 297Reinvested number of mutual fund shares – 40Redeemed number of mutual fund shares (1 394) (578)Ending number of mutual fund shares – 1 341
Series OOpening mutual fund shares 91 71Issued number of mutual fund shares 44 52Reinvested number of mutual fund shares 2 3Redeemed number of mutual fund shares (24) (35)Ending number of mutual fund shares 113 91
RBC CANADIAN EQUITY INCOME CLASS
275

SCHEDULE OF INVESTMENT PORTFOLIO (in $000s)
ANNUAL FINANCIAL STATEMENTS
March 31, 2017
The accompanying notes are an integral part of the financial statements.
RBC CANADIAN MID-CAP EQUITY CLASS
Number Fair % of Net of Units Security Cost Value Assets
MUTUAL FUND UNITS 428 200 RBC Private Canadian Mid-Cap Equity Pool* $ 9 687 $ 10 732
TOTAL MUTUAL FUND UNITS $ 9 687 10 732 99.8OTHER NET ASSETS ATTRIBUTABLE TO HOLDERS OF REDEEMABLE SHARES 21 0.2NET ASSETS ATTRIBUTABLE TO HOLDERS OF REDEEMABLE SHARES $ 10 753 100.0
* Investment in related party (see note 6 in the generic notes).
276

FINANCIAL STATEMENTS
The accompanying notes are an integral part of these financial statements.
RBC CANADIAN MID-CAP EQUITY CLASS
Statements of Financial Position (in $000s except per mutual fund share amounts)
(see note 2 in the generic notes)March 31
2017March 31
2016
ASSETSInvestments at fair value $ 10 732 $ 7 899 Cash 25 2 Due from investment dealers – 5 Subscriptions receivable – 16 TOTAL ASSETS 10 757 7 922 LIABILITIESDue to investment dealers – 4 Redemptions payable – 40 Accounts payable and accrued expenses 4 3 TOTAL LIABILITIES EXCLUDING NET ASSETS ATTRIBUTABLE TO HOLDERS OF REDEEMABLE MUTUAL FUND SHARES 4 47 NET ASSETS ATTRIBUTABLE TO HOLDERS OF REDEEMABLE MUTUAL FUND SHARES (“NAV”) $ 10 753 $ 7 875
Investments at cost $ 9 687 $ 8 398
NAV SERIES A $ 1 033 $ 820 ADVISOR SERIES $ 219 $ 29 SERIES H $ – $ 1 SERIES D $ 843 $ 445 SERIES F $ 726 $ 209 SERIES I $ – $ 1 SERIES O $ 7 932 $ 6 370 NAV PER MUTUAL FUND SHARE SERIES A $ 12.92 $ 10.60 ADVISOR SERIES $ 13.19 $ 10.83 SERIES H $ – $ 10.62 SERIES D $ 13.47 $ 10.97 SERIES F $ 13.42 $ 10.94 SERIES I $ – $ 11.04 SERIES O $ 13.95 $ 11.30
Statements of Comprehensive Income (in $000s except per mutual fund share amounts)
For the periods ended March 31 (see note 2 in the generic notes) 2017 2016INCOME (see note 3 in the generic notes)Other income received from underlying funds $ 167 $ 249 Capital gains received from underlying funds 134 –Net realized gain (loss) on investments 153 (219)Change in unrealized gain (loss) on investments 1 544 (770)TOTAL INCOME (LOSS) 1 998 (740)EXPENSES (see notes – Fund Specific Information)Management fees 34 23 Administration fees 3 2 Board of Directors fees 1 1 Independent Review Committee costs 2 3 GST/HST 4 3 Expenses reimbursed by manager (2) (3)TOTAL EXPENSES 42 29 INCREASE (DECREASE) IN NAV $ 1 956 $ (769)INCREASE (DECREASE) IN NAV SERIES A $ 198 $ (129) ADVISOR SERIES $ 19 $ (7) SERIES H $ – $ – SERIES D $ 130 $ (30) SERIES F $ 91 $ (13) SERIES I $ – $ – SERIES O $ 1 518 $ (590)INCREASE (DECREASE) IN NAV PER MUTUAL FUND SHARE SERIES A $ 2.25 $ (1.07) ADVISOR SERIES $ 1.58 $ (1.08) SERIES H $ 1.29 $ (1.03) SERIES D $ 1.93 $ (1.01) SERIES F $ 2.28 $ (0.98) SERIES I $ 1.37 $ (0.96) SERIES O $ 2.86 $ (0.91)
277

FINANCIAL STATEMENTS
The accompanying notes are an integral part of these financial statements.
Statements of Cash Flow (in $000s)
For the periods ended March 31 (see note 2 in the generic notes) 2017
2016
CASH FLOWS FROM OPERATING ACTIVITIESIncrease (decrease) in NAV $ 1 956 $ (769)ADJUSTMENTS TO RECONCILE NET CASH PROVIDED BY (USED IN) OPERATIONSInterest for distribution purposes – – Net realized loss (gain) on investments (153) 219 Change in unrealized loss (gain) on investments (1 544) 770 (Increase) decrease in accrued receivables – – Increase (decrease) in accrued payables 1 (2)Cost of investments purchased (4 114) (1 766)Proceeds on sales of investments 2 979 3 737 NET CASH PROVIDED BY (USED IN) OPERATING ACTIVITIES (875) 2 189 CASH FLOWS FROM FINANCING ACTIVITIESProceeds from issue of redeemable mutual fund shares 5 446 1 778 Cash paid on redemption of redeemable mutual fund shares (4 465) (3 632)Distributions paid to holders of redeemable mutual fund shares (83) (154)NET CASH PROVIDED BY (USED IN) FINANCING ACTIVITIES $ 898 $ (2 008)Net increase (decrease) in cash for the period 23 181 Cash (bank overdraft), beginning of period 2 (179)CASH (BANK OVERDRAFT), END OF PERIOD $ 25 $ 2
Interest received (paid) $ – $ – Dividends received, net of withholding taxes $ – $ –
Cash consists of cash and futures contracts margin receivable/payable, as applicable.
RBC CANADIAN MID-CAP EQUITY CLASS
278

FINANCIAL STATEMENTS
The accompanying notes are an integral part of these financial statements.
RBC CANADIAN MID-CAP EQUITY CLASS
Statements of Changes in NAV (in $000s)
For the periods ended March 31 (see note 2 in the generic notes)
Series A Advisor Series Series H Series D2017 2016 2017 2016 2017 2016 2017 2016
NAV AT BEGINNING OF PERIOD $ 820 $ 1 354 $ 29 $ 65 $ 1 $ 1 $ 445 $ 435 INCREASE (DECREASE) IN NAV 198 (129) 19 (7) – – 130 (30)Early redemption fees – – – – – – 1 – Proceeds from redeemable mutual fund shares issued 1 045 60 289 6 – – 1 928 372 Reinvestments of distributions to holders of redeemable mutual fund shares 7 8 1 – – – 6 8 Redemption of redeemable mutual fund shares (1 030) (465) (118) (35) (1) – (1 661) (332)NET INCREASE (DECREASE) FROM REDEEMABLE MUTUAL FUND SHARE TRANSACTIONS 22 (397) 172 (29) (1) – 274 48 Distributions from net income (7) (8) (1) – – – (6) (8)Distributions from net gains – – – – – – – – Distributions from capital – – – – – – – – TOTAL DISTRIBUTIONS TO HOLDERS OF REDEEMABLE MUTUAL FUND SHARES (7) (8) (1) – – – (6) (8)NET INCREASE (DECREASE) IN NAV 213 (534) 190 (36) (1) – 398 10 NAV AT END OF PERIOD $ 1 033 $ 820 $ 219 $ 29 $ – $ 1 $ 843 $ 445
For the periods ended March 31 (see note 2 in the generic notes)
Series F Series I Series O Total2017 2016 2017 2016 2017 2016 2017 2016
NAV AT BEGINNING OF PERIOD $ 209 $ 184 $ 1 $ 1 $ 6 370 $ 8 636 $ 7 875 $ 10 676 INCREASE (DECREASE) IN NAV 91 (13) – – 1 518 (590) 1 956 (769)Early redemption fees – – – – – – 1 – Proceeds from redeemable mutual fund shares issued 679 157 – – 1 489 1 199 5 430 1 794 Reinvestments of distributions to holders of redeemable mutual fund shares 4 2 – – 31 37 49 55 Redemption of redeemable mutual fund shares (249) (117) (1) – (1 366) (2 723) (4 426) (3 672)NET INCREASE (DECREASE) FROM REDEEMABLE MUTUAL FUND SHARE TRANSACTIONS 434 42 (1) – 154 (1 487) 1 054 (1 823)Distributions from net income (8) (4) – – (110) (189) (132) (209)Distributions from net gains – – – – – – – – Distributions from capital – – – – – – – – TOTAL DISTRIBUTIONS TO HOLDERS OF REDEEMABLE MUTUAL FUND SHARES (8) (4) – – (110) (189) (132) (209)NET INCREASE (DECREASE) IN NAV 517 25 (1) – 1 562 (2 266) 2 878 (2 801)NAV AT END OF PERIOD $ 726 $ 209 $ – $ 1 $ 7 932 $ 6 370 $ 10 753 $ 7 875
279
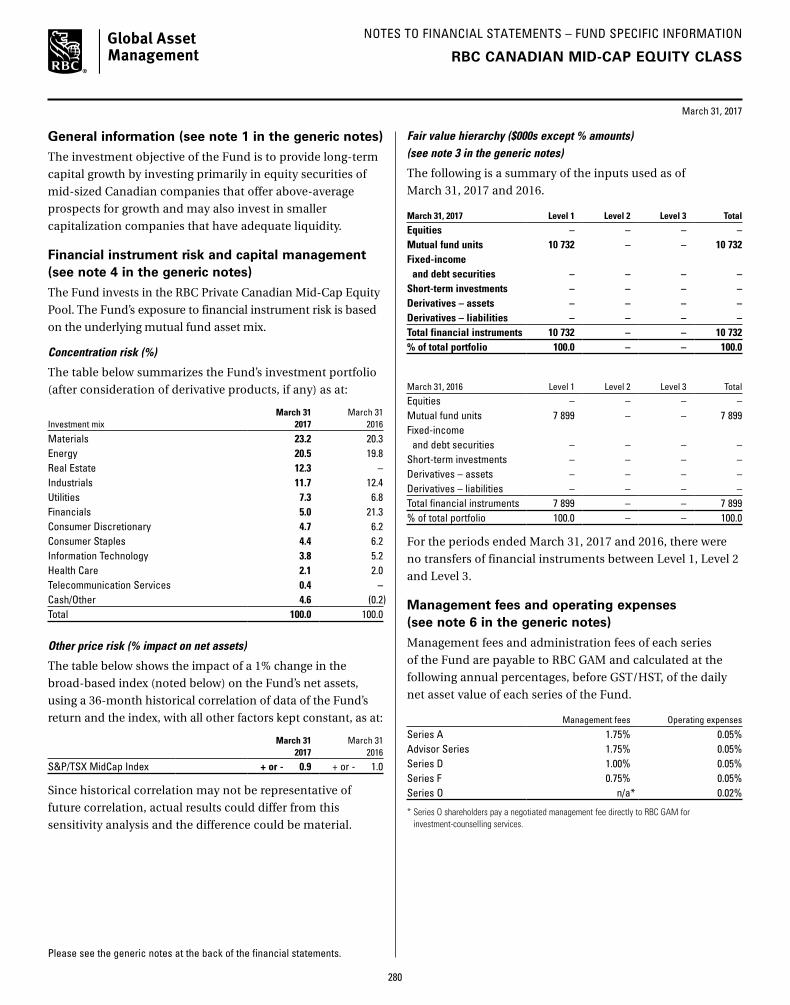
NOTES TO FINANCIAL STATEMENTS – FUND SPECIFIC INFORMATION
Please see the generic notes at the back of the financial statements.
March 31, 2017
RBC CANADIAN MID-CAP EQUITY CLASS
General information (see note 1 in the generic notes)
The investment objective of the Fund is to provide long-term
capital growth by investing primarily in equity securities of
mid-sized Canadian companies that offer above-average
prospects for growth and may also invest in smaller
capitalization companies that have adequate liquidity.
Financial instrument risk and capital management (see note 4 in the generic notes)
The Fund invests in the RBC Private Canadian Mid-Cap Equity
Pool. The Fund’s exposure to financial instrument risk is based
on the underlying mutual fund asset mix.
Concentration risk (%)
The table below summarizes the Fund’s investment portfolio
(after consideration of derivative products, if any) as at:
Investment mixMarch 31
2017March 31
2016
Materials 23.2 20.3Energy 20.5 19.8Real Estate 12.3 –Industrials 11.7 12.4Utilities 7.3 6.8Financials 5.0 21.3Consumer Discretionary 4.7 6.2Consumer Staples 4.4 6.2Information Technology 3.8 5.2Health Care 2.1 2.0Telecommunication Services 0.4 –Cash/Other 4.6 (0.2)Total 100.0 100.0
Other price risk (% impact on net assets)
The table below shows the impact of a 1% change in the
broad-based index (noted below) on the Fund’s net assets,
using a 36-month historical correlation of data of the Fund’s
return and the index, with all other factors kept constant, as at:
March 31 2017
March 31 2016
S&P/TSX MidCap Index + or - 0.9 + or - 1.0
Since historical correlation may not be representative of
future correlation, actual results could differ from this
sensitivity analysis and the difference could be material.
Fair value hierarchy ($000s except % amounts) (see note 3 in the generic notes)
The following is a summary of the inputs used as of
March 31, 2017 and 2016.
March 31, 2017 Level 1 Level 2 Level 3 Total
Equities – – – – Mutual fund units 10 732 – – 10 732Fixed-income and debt securities – – – – Short-term investments – – – – Derivatives – assets – – – – Derivatives – liabilities – – – – Total financial instruments 10 732 – – 10 732% of total portfolio 100.0 – – 100.0
March 31, 2016 Level 1 Level 2 Level 3 Total
Equities – – – – Mutual fund units 7 899 – – 7 899 Fixed-income and debt securities – – – – Short-term investments – – – – Derivatives – assets – – – – Derivatives – liabilities – – – – Total financial instruments 7 899 – – 7 899 % of total portfolio 100.0 – – 100.0
For the periods ended March 31, 2017 and 2016, there were
no transfers of financial instruments between Level 1, Level 2
and Level 3.
Management fees and operating expenses (see note 6 in the generic notes)
Management fees and administration fees of each series
of the Fund are payable to RBC GAM and calculated at the
following annual percentages, before GST/HST, of the daily
net asset value of each series of the Fund.
Management fees Operating expenses
Series A 1.75% 0.05%Advisor Series 1.75% 0.05%Series D 1.00% 0.05%Series F 0.75% 0.05%Series O n/a* 0.02%
* Series O shareholders pay a negotiated management fee directly to RBC GAM for investment-counselling services.
280
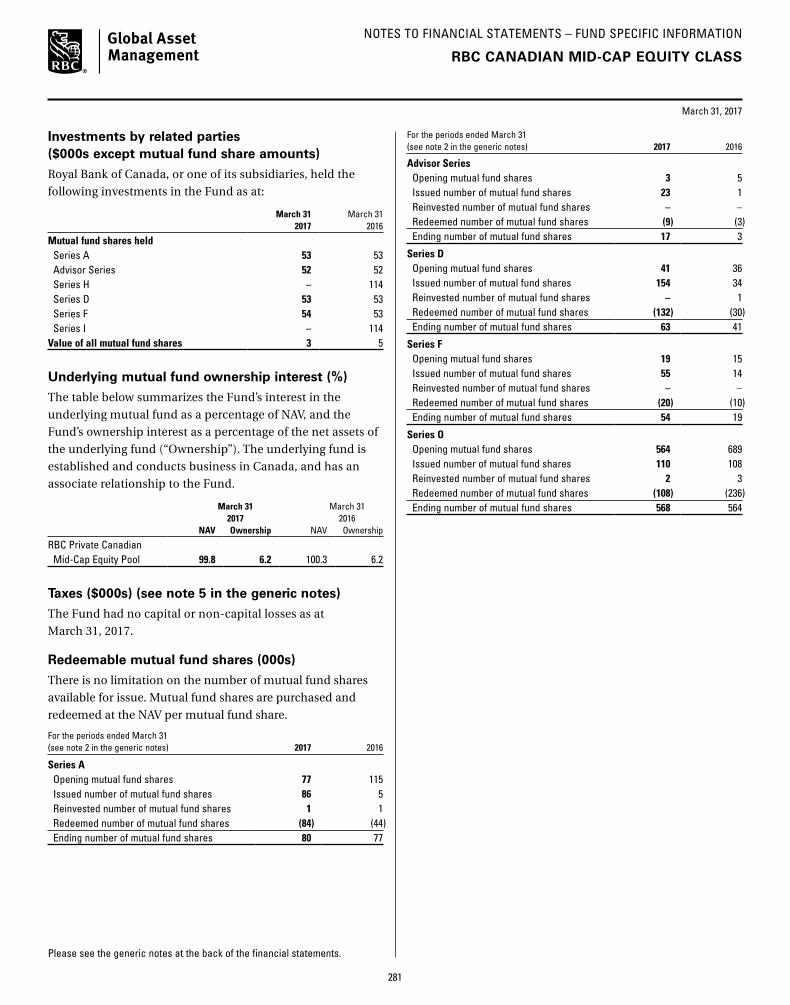
NOTES TO FINANCIAL STATEMENTS – FUND SPECIFIC INFORMATION
Please see the generic notes at the back of the financial statements.
March 31, 2017
Investments by related parties ($000s except mutual fund share amounts)
Royal Bank of Canada, or one of its subsidiaries, held the
following investments in the Fund as at:
March 31 2017
March 31 2016
Mutual fund shares held Series A 53 53 Advisor Series 52 52 Series H – 114 Series D 53 53 Series F 54 53 Series I – 114Value of all mutual fund shares 3 5
Underlying mutual fund ownership interest (%)
The table below summarizes the Fund’s interest in the
underlying mutual fund as a percentage of NAV, and the
Fund’s ownership interest as a percentage of the net assets of
the underlying fund (“Ownership”). The underlying fund is
established and conducts business in Canada, and has an
associate relationship to the Fund.
March 31 2017
March 31 2016
NAV Ownership NAV Ownership
RBC Private Canadian Mid-Cap Equity Pool 99.8 6.2 100.3 6.2
Taxes ($000s) (see note 5 in the generic notes)
The Fund had no capital or non-capital losses as at
March 31, 2017.
Redeemable mutual fund shares (000s)
There is no limitation on the number of mutual fund shares
available for issue. Mutual fund shares are purchased and
redeemed at the NAV per mutual fund share.
For the periods ended March 31 (see note 2 in the generic notes) 2017 2016
Series A Opening mutual fund shares 77 115Issued number of mutual fund shares 86 5Reinvested number of mutual fund shares 1 1Redeemed number of mutual fund shares (84) (44)Ending number of mutual fund shares 80 77
RBC CANADIAN MID-CAP EQUITY CLASS
For the periods ended March 31 (see note 2 in the generic notes) 2017 2016
Advisor SeriesOpening mutual fund shares 3 5Issued number of mutual fund shares 23 1Reinvested number of mutual fund shares – – Redeemed number of mutual fund shares (9) (3)Ending number of mutual fund shares 17 3
Series DOpening mutual fund shares 41 36Issued number of mutual fund shares 154 34Reinvested number of mutual fund shares – 1Redeemed number of mutual fund shares (132) (30)Ending number of mutual fund shares 63 41
Series FOpening mutual fund shares 19 15Issued number of mutual fund shares 55 14Reinvested number of mutual fund shares – – Redeemed number of mutual fund shares (20) (10)Ending number of mutual fund shares 54 19
Series OOpening mutual fund shares 564 689Issued number of mutual fund shares 110 108Reinvested number of mutual fund shares 2 3Redeemed number of mutual fund shares (108) (236)Ending number of mutual fund shares 568 564
281

SCHEDULE OF INVESTMENT PORTFOLIO (in $000s)
ANNUAL FINANCIAL STATEMENTS
March 31, 2017
The accompanying notes are an integral part of the financial statements.
RBC NORTH AMERICAN VALUE CLASS
Number Fair % of Net of Units Security Cost Value Assets
MUTUAL FUND UNITS 7 653 339 RBC North American Value Fund* $ 154 900 $ 191 761
TOTAL MUTUAL FUND UNITS $ 154 900 191 761 100.0OTHER NET ASSETS ATTRIBUTABLE TO HOLDERS OF REDEEMABLE SHARES 48 –NET ASSETS ATTRIBUTABLE TO HOLDERS OF REDEEMABLE SHARES $ 191 809 100.0
* Investment in related party (see note 6 in the generic notes).
282

FINANCIAL STATEMENTS
The accompanying notes are an integral part of these financial statements.
RBC NORTH AMERICAN VALUE CLASS
Statements of Financial Position (in $000s except per mutual fund share amounts)
(see note 2 in the generic notes)March 31
2017March 31
2016
ASSETSInvestments at fair value $ 191 761 $ 184 386 Cash 224 –Due from investment dealers 55 320 Subscriptions receivable 183 1 060 TOTAL ASSETS 192 223 185 766 LIABILITIESBank overdraft – 37 Due to investment dealers – 400 Redemptions payable 177 442 Accounts payable and accrued expenses 237 257 TOTAL LIABILITIES EXCLUDING NET ASSETS ATTRIBUTABLE TO HOLDERS OF REDEEMABLE MUTUAL FUND SHARES 414 1 136 NET ASSETS ATTRIBUTABLE TO HOLDERS OF REDEEMABLE MUTUAL FUND SHARES (“NAV”) $ 191 809 $ 184 630
Investments at cost $ 154 900 $ 165 076
NAV SERIES A $ 63 329 $ 46 522 ADVISOR SERIES $ 48 980 $ 48 778 SERIES H $ – $ 31 807 SERIES D $ 6 567 $ 5 276 SERIES F $ 72 219 $ 26 373 SERIES I $ – $ 25 262 SERIES O $ 714 $ 612 NAV PER MUTUAL FUND SHARE SERIES A $ 16.50 $ 14.64 ADVISOR SERIES $ 16.49 $ 14.63 SERIES H $ – $ 14.72 SERIES D $ 16.97 $ 15.06 SERIES F $ 17.10 $ 15.18 SERIES I $ – $ 15.28 SERIES O $ 17.60 $ 15.62
Statements of Comprehensive Income (in $000s except per mutual fund share amounts)
For the periods ended March 31 (see note 2 in the generic notes) 2017 2016INCOME (see note 3 in the generic notes)Interest for distribution purposes $ (4) $ (6)Other income received from underlying funds 3 737 4 321 Capital gains received from underlying funds 3 004 1 883 Net realized gain (loss) on investments 3 972 3 825 Change in unrealized gain (loss) on investments 17 551 (11 972)TOTAL INCOME (LOSS) 28 260 (1 949)EXPENSES (see notes – Fund Specific Information)Management fees 2 327 2 798 Administration fees 197 189 Board of Directors fees 22 24 Independent Review Committee costs 2 3 GST/HST 269 320 Expenses reimbursed by manager (7) (7)TOTAL EXPENSES 2 810 3 327 INCREASE (DECREASE) IN NAV $ 25 450 $ (5 276)INCREASE (DECREASE) IN NAV SERIES A $ 8 827 $ (1 756) ADVISOR SERIES $ 6 335 $ (1 549) SERIES H $ 472 $ (1 229) SERIES D $ 792 $ (98) SERIES F $ 8 476 $ (254) SERIES I $ 459 $ (380) SERIES O $ 89 $ (10)INCREASE (DECREASE) IN NAV PER MUTUAL FUND SHARE SERIES A $ 2.26 $ (0.46) ADVISOR SERIES $ 2.08 $ (0.46) SERIES H $ 0.23 $ (0.43) SERIES D $ 2.27 $ (0.33) SERIES F $ 2.57 $ (0.31) SERIES I $ 0.28 $ (0.26) SERIES O $ 2.52 $ (0.17)
283

FINANCIAL STATEMENTS
The accompanying notes are an integral part of these financial statements.
Statements of Cash Flow (in $000s)
For the periods ended March 31 (see note 2 in the generic notes) 2017
2016
CASH FLOWS FROM OPERATING ACTIVITIESIncrease (decrease) in NAV $ 25 450 $ (5 276)ADJUSTMENTS TO RECONCILE NET CASH PROVIDED BY (USED IN) OPERATIONSInterest for distribution purposes – – Net realized loss (gain) on investments (3 972) (3 825)Change in unrealized loss (gain) on investments (17 551) 11 972 (Increase) decrease in accrued receivables – – Increase (decrease) in accrued payables (20) (49)Cost of investments purchased (13 025) (25 955)Proceeds on sales of investments 27 038 38 083 NET CASH PROVIDED BY (USED IN) OPERATING ACTIVITIES 17 920 14 950 CASH FLOWS FROM FINANCING ACTIVITIESProceeds from issue of redeemable mutual fund shares 94 544 44 824 Cash paid on redemption of redeemable mutual fund shares (111 737) (59 191)Distributions paid to holders of redeemable mutual fund shares (466) (431)NET CASH PROVIDED BY (USED IN) FINANCING ACTIVITIES $ (17 659) $ (14 798)Net increase (decrease) in cash for the period 261 152 Cash (bank overdraft), beginning of period (37) (189)CASH (BANK OVERDRAFT), END OF PERIOD $ 224 $ (37)
Interest received (paid) $ (4) $ (6)Dividends received, net of withholding taxes $ – $ –
Cash consists of cash and futures contracts margin receivable/payable, as applicable.
RBC NORTH AMERICAN VALUE CLASS
284

FINANCIAL STATEMENTS
The accompanying notes are an integral part of these financial statements.
RBC NORTH AMERICAN VALUE CLASS
Statements of Changes in NAV (in $000s)
For the periods ended March 31 (see note 2 in the generic notes)
Series A Advisor Series Series H Series D2017 2016 2017 2016 2017 2016 2017 2016
NAV AT BEGINNING OF PERIOD $ 46 522 $ 56 074 $ 48 778 $ 55 251 $ 31 807 $ 38 132 $ 5 276 $ 5 655 INCREASE (DECREASE) IN NAV 8 827 (1 756) 6 335 (1 549) 472 (1 229) 792 (98)Early redemption fees – – – – – – – – Proceeds from redeemable mutual fund shares issued 34 031 9 673 7 574 9 123 30 8 193 3 149 887 Reinvestments of distributions to holders of redeemable mutual fund shares 822 850 680 892 – 570 147 140 Redemption of redeemable mutual fund shares (25 928) (17 414) (13 672) (14 001) (32 309) (13 173) (2 642) (1 158)NET INCREASE (DECREASE) FROM REDEEMABLE MUTUAL FUND SHARE TRANSACTIONS 8 925 (6 891) (5 418) (3 986) (32 279) (4 410) 654 (131)Distributions from net income (945) (905) (715) (938) – (686) (155) (150)Distributions from net gains – – – – – – – – Distributions from capital – – – – – – – – TOTAL DISTRIBUTIONS TO HOLDERS OF REDEEMABLE MUTUAL FUND SHARES (945) (905) (715) (938) – (686) (155) (150)NET INCREASE (DECREASE) IN NAV 16 807 (9 552) 202 (6 473) (31 807) (6 325) 1 291 (379)NAV AT END OF PERIOD $ 63 329 $ 46 522 $ 48 980 $ 48 778 $ – $ 31 807 $ 6 567 $ 5 276
For the periods ended March 31 (see note 2 in the generic notes)
Series F Series I Series O Total2017 2016 2017 2016 2017 2016 2017 2016
NAV AT BEGINNING OF PERIOD $ 26 373 $ 22 860 $ 25 262 $ 24 422 $ 612 $ 593 $ 184 630 $ 202 987 INCREASE (DECREASE) IN NAV 8 476 (254) 459 (380) 89 (10) 25 450 (5 276)Early redemption fees – – – – – – – – Proceeds from redeemable mutual fund shares issued 48 019 10 564 280 6 839 584 396 93 667 45 675 Reinvestments of distributions to holders of redeemable mutual fund shares 1 622 689 – 745 – – 3 271 3 886 Redemption of redeemable mutual fund shares (10 374) (6 684) (26 001) (5 553) (546) (342) (111 472) (58 325)NET INCREASE (DECREASE) FROM REDEEMABLE MUTUAL FUND SHARE TRANSACTIONS 39 267 4 569 (25 721) 2 031 38 54 (14 534) (8 764)Distributions from net income (1 897) (802) – (811) (25) (25) (3 737) (4 317)Distributions from net gains – – – – – – – – Distributions from capital – – – – – – – – TOTAL DISTRIBUTIONS TO HOLDERS OF REDEEMABLE MUTUAL FUND SHARES (1 897) (802) – (811) (25) (25) (3 737) (4 317)NET INCREASE (DECREASE) IN NAV 45 846 3 513 (25 262) 840 102 19 7 179 (18 357)NAV AT END OF PERIOD $ 72 219 $ 26 373 $ – $ 25 262 $ 714 $ 612 $ 191 809 $ 184 630
285

NOTES TO FINANCIAL STATEMENTS – FUND SPECIFIC INFORMATION
Please see the generic notes at the back of the financial statements.
March 31, 2017
RBC NORTH AMERICAN VALUE CLASS
General information (see note 1 in the generic notes)
The investment objective of the Fund is to provide long-term
capital growth by investing in equity securities of Canadian
and/or U.S. companies priced below their true value and
offering long-term opportunities for growth.
All outstanding Series H mutual fund shares were re-designated
as Series A mutual fund shares effective June 30, 2016. All
outstanding Series I mutual fund shares were re-designated as
Series F mutual fund shares effective June 30, 2016.
Financial instrument risk and capital management (see note 4 in the generic notes)
The Fund invests in the RBC North American Value Fund.
The Fund’s exposure to financial instrument risk is based on
the underlying mutual fund asset mix.
Concentration risk (%)
The table below summarizes the Fund’s investment portfolio
(after consideration of derivative products, if any) as at:
Investment mixMarch 31
2017March 31
2016
Financials 29.3 31.6Energy 14.1 15.2Information Technology 10.4 8.4Industrials 8.8 9.2Consumer Discretionary 7.4 5.3Health Care 5.8 9.2Consumer Staples 5.1 5.2Materials 5.1 3.8Telecommunication Services 3.1 3.7Real Estate 1.4 –Utilities 1.0 2.3Cash/Other 8.5 6.1Total 100.0 100.0
Currency risk (% of net assets)
The table below summarizes the Fund’s net exposure (after
hedging, if any) to currency risk from investments in the
underlying mutual fund as at:
CurrencyMarch 31
2017March 31
2016
United States dollar 23.5 20.6Total 23.5 20.6
As at March 31, 2017, if the Canadian dollar had strengthened
or weakened by 1% in relation to the above currencies, with
all other factors kept constant, the Fund’s net assets may
have decreased or increased, respectively, by approximately
0.2% (March 31, 2016 – 0.2%). In practice, actual results could
differ from this sensitivity analysis and the difference could
be material.
Other price risk (% impact on net assets)
The table below shows the impact of a 1% change in the
broad-based index (noted below) on the Fund’s net assets,
using a 36-month historical correlation of data of the Fund’s
return and the index, with all other factors kept constant, as at:
March 31 2017
March 31 2016
S&P/TSX Capped Composite Total Return Index + or - 0.7 + or - 0.7
Since historical correlation may not be representative of
future correlation, actual results could differ from this
sensitivity analysis and the difference could be material.
Fair value hierarchy ($000s except % amounts) (see note 3 in the generic notes)
The following is a summary of the inputs used as of
March 31, 2017 and 2016.
March 31, 2017 Level 1 Level 2 Level 3 Total
Equities – – – – Mutual fund units 191 761 – – 191 761Fixed-income and debt securities – – – – Short-term investments – – – – Derivatives – assets – – – – Derivatives – liabilities – – – – Total financial instruments 191 761 – – 191 761% of total portfolio 100.0 – – 100.0
March 31, 2016 Level 1 Level 2 Level 3 Total
Equities – – – – Mutual fund units 184 386 – – 184 386 Fixed-income and debt securities – – – – Short-term investments – – – – Derivatives – assets – – – – Derivatives – liabilities – – – – Total financial instruments 184 386 – – 184 386 % of total portfolio 100.0 – – 100.0
For the periods ended March 31, 2017 and 2016, there were
no transfers of financial instruments between Level 1, Level 2
and Level 3.
286

NOTES TO FINANCIAL STATEMENTS – FUND SPECIFIC INFORMATION
Please see the generic notes at the back of the financial statements.
March 31, 2017
Management fees and operating expenses (see note 6 in the generic notes)
Management fees and administration fees of each series
of the Fund are payable to RBC GAM and calculated at the
following annual percentages, before GST/HST, of the daily
net asset value of each series of the Fund.
Management fees* Operating expenses
Series A 1.60% 0.13%Advisor Series 1.60% 0.13%Series H 1.65% 0.05%Series D 0.85% 0.08%Series F 0.60% 0.08%Series I 0.60% 0.05%Series O n/a† 0.02%
* Effective June 30, 2016, the management fees for Series A and Advisor Series mutual fund shares were reduced to 1.60% from 1.75%; for Series D mutual fund shares were reduced to 0.85% from 1.00%; and for Series F mutual fund shares were reduced to 0.60% from 0.75%.
† Series O shareholders pay a negotiated management fee directly to RBC GAM for investment-counselling services.
Investments by related parties ($000s except mutual fund share amounts)
Royal Bank of Canada, or one of its subsidiaries, held the
following investments in the Fund as at:
March 312017
March 31 2016
Mutual fund shares held Series A 159 52 Advisor Series 53 52 Series H – 104 Series D 54 52 Series F 162 52 Series I – 105 Series O 52 50Value of all mutual fund shares 8 7
Underlying mutual fund ownership interest (%)
The table below summarizes the Fund’s interest in the
underlying mutual fund as a percentage of NAV, and the
Fund’s ownership interest as a percentage of the net assets of
the underlying fund (“Ownership”). The underlying fund is
established and conducts business in Canada, and has an
associate relationship to the Fund.
March 31 2017
March 31 2016
NAV Ownership NAV Ownership
RBC North American Value Fund 100.0 7.0 99.9 7.9
RBC NORTH AMERICAN VALUE CLASS
Taxes ($000s) (see note 5 in the generic notes)
The Fund had no capital or non-capital losses as at
March 31, 2017.
Redeemable mutual fund shares (000s)
There is no limitation on the number of mutual fund shares
available for issue. Mutual fund shares are purchased and
redeemed at the NAV per mutual fund share.
For the periods ended March 31 (see note 2 in the generic notes) 2017 2016
Series A Opening mutual fund shares 3 178 3 659Issued number of mutual fund shares 2 268 644Reinvested number of mutual fund shares 50 58Redeemed number of mutual fund shares (1 658) (1 183)Ending number of mutual fund shares 3 838 3 178
Advisor SeriesOpening mutual fund shares 3 334 3 607Issued number of mutual fund shares 471 612Reinvested number of mutual fund shares 41 61Redeemed number of mutual fund shares (876) (946)Ending number of mutual fund shares 2 970 3 334
Series HOpening mutual fund shares 2 160 2 474Issued number of mutual fund shares 2 543Reinvested number of mutual fund shares – 39Redeemed number of mutual fund shares (2 162) (896)Ending number of mutual fund shares – 2 160
Series DOpening mutual fund shares 350 359Issued number of mutual fund shares 191 58Reinvested number of mutual fund shares 9 9Redeemed number of mutual fund shares (163) (76)Ending number of mutual fund shares 387 350
Series FOpening mutual fund shares 1 737 1 438Issued number of mutual fund shares 3 018 686Reinvested number of mutual fund shares 95 46Redeemed number of mutual fund shares (627) (433)Ending number of mutual fund shares 4 223 1 737
Series IOpening mutual fund shares 1 653 1 526Issued number of mutual fund shares 19 433Reinvested number of mutual fund shares – 49Redeemed number of mutual fund shares (1 672) (355)Ending number of mutual fund shares – 1 653
Series OOpening mutual fund shares 39 36Issued number of mutual fund shares 34 24Reinvested number of mutual fund shares – – Redeemed number of mutual fund shares (32) (21)Ending number of mutual fund shares 41 39
287

SCHEDULE OF INVESTMENT PORTFOLIO (in $000s)
ANNUAL FINANCIAL STATEMENTS
March 31, 2017
The accompanying notes are an integral part of the financial statements.
RBC U.S. DIVIDEND CLASS
Number Fair % of Net of Units Security Cost Value Assets
MUTUAL FUND UNITS 4 304 230 RBC U.S. Dividend Fund* $ 96 999 $ 121 869
TOTAL MUTUAL FUND UNITS $ 96 999 121 869 100.1OTHER NET ASSETS (LIABILITIES) ATTRIBUTABLE TO HOLDERS OF REDEEMABLE SHARES (66) (0.1)NET ASSETS ATTRIBUTABLE TO HOLDERS OF REDEEMABLE SHARES $ 121 803 100.0
* Investment in related party (see note 6 in the generic notes).
288
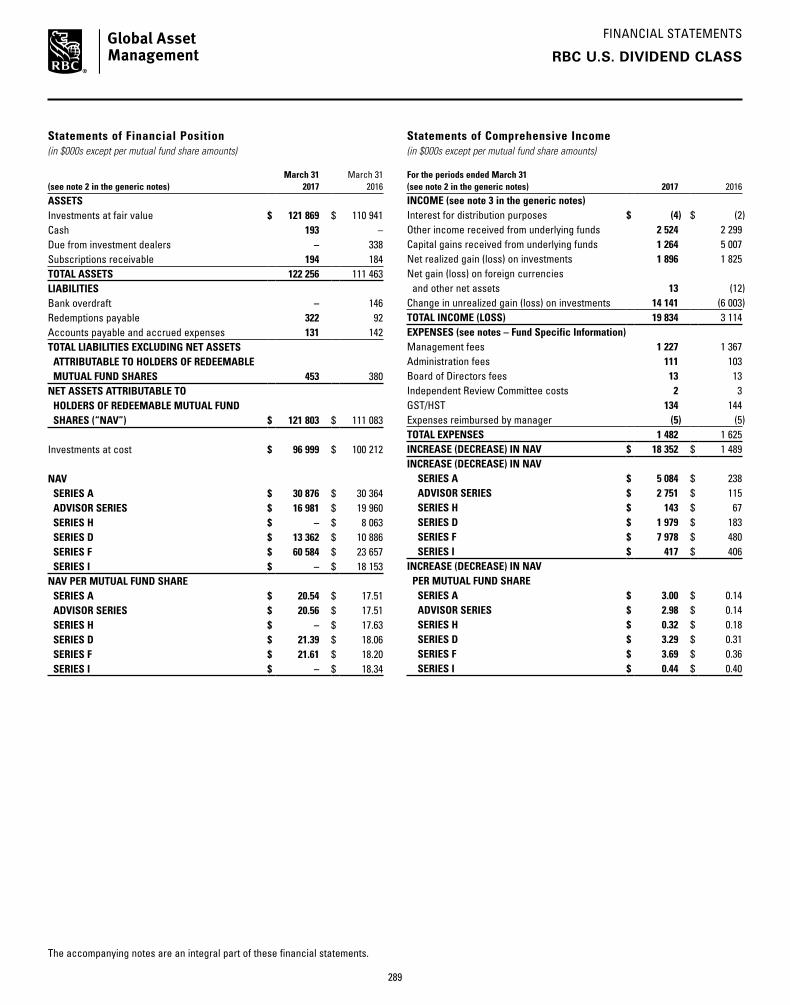
FINANCIAL STATEMENTS
The accompanying notes are an integral part of these financial statements.
RBC U.S. DIVIDEND CLASS
Statements of Financial Position (in $000s except per mutual fund share amounts)
(see note 2 in the generic notes)March 31
2017March 31
2016
ASSETSInvestments at fair value $ 121 869 $ 110 941 Cash 193 – Due from investment dealers – 338 Subscriptions receivable 194 184 TOTAL ASSETS 122 256 111 463 LIABILITIESBank overdraft – 146 Redemptions payable 322 92 Accounts payable and accrued expenses 131 142 TOTAL LIABILITIES EXCLUDING NET ASSETS ATTRIBUTABLE TO HOLDERS OF REDEEMABLE MUTUAL FUND SHARES 453 380 NET ASSETS ATTRIBUTABLE TO HOLDERS OF REDEEMABLE MUTUAL FUND SHARES (“NAV”) $ 121 803 $ 111 083
Investments at cost $ 96 999 $ 100 212
NAV SERIES A $ 30 876 $ 30 364 ADVISOR SERIES $ 16 981 $ 19 960 SERIES H $ – $ 8 063 SERIES D $ 13 362 $ 10 886 SERIES F $ 60 584 $ 23 657 SERIES I $ – $ 18 153 NAV PER MUTUAL FUND SHARE SERIES A $ 20.54 $ 17.51 ADVISOR SERIES $ 20.56 $ 17.51 SERIES H $ – $ 17.63 SERIES D $ 21.39 $ 18.06 SERIES F $ 21.61 $ 18.20 SERIES I $ – $ 18.34
Statements of Comprehensive Income (in $000s except per mutual fund share amounts)
For the periods ended March 31 (see note 2 in the generic notes) 2017 2016INCOME (see note 3 in the generic notes)Interest for distribution purposes $ (4) $ (2)Other income received from underlying funds 2 524 2 299 Capital gains received from underlying funds 1 264 5 007 Net realized gain (loss) on investments 1 896 1 825 Net gain (loss) on foreign currencies and other net assets 13 (12)Change in unrealized gain (loss) on investments 14 141 (6 003)TOTAL INCOME (LOSS) 19 834 3 114 EXPENSES (see notes – Fund Specific Information)Management fees 1 227 1 367 Administration fees 111 103 Board of Directors fees 13 13 Independent Review Committee costs 2 3 GST/HST 134 144 Expenses reimbursed by manager (5) (5)TOTAL EXPENSES 1 482 1 625 INCREASE (DECREASE) IN NAV $ 18 352 $ 1 489 INCREASE (DECREASE) IN NAV SERIES A $ 5 084 $ 238 ADVISOR SERIES $ 2 751 $ 115 SERIES H $ 143 $ 67 SERIES D $ 1 979 $ 183 SERIES F $ 7 978 $ 480 SERIES I $ 417 $ 406 INCREASE (DECREASE) IN NAV PER MUTUAL FUND SHARE SERIES A $ 3.00 $ 0.14 ADVISOR SERIES $ 2.98 $ 0.14 SERIES H $ 0.32 $ 0.18 SERIES D $ 3.29 $ 0.31 SERIES F $ 3.69 $ 0.36 SERIES I $ 0.44 $ 0.40
289
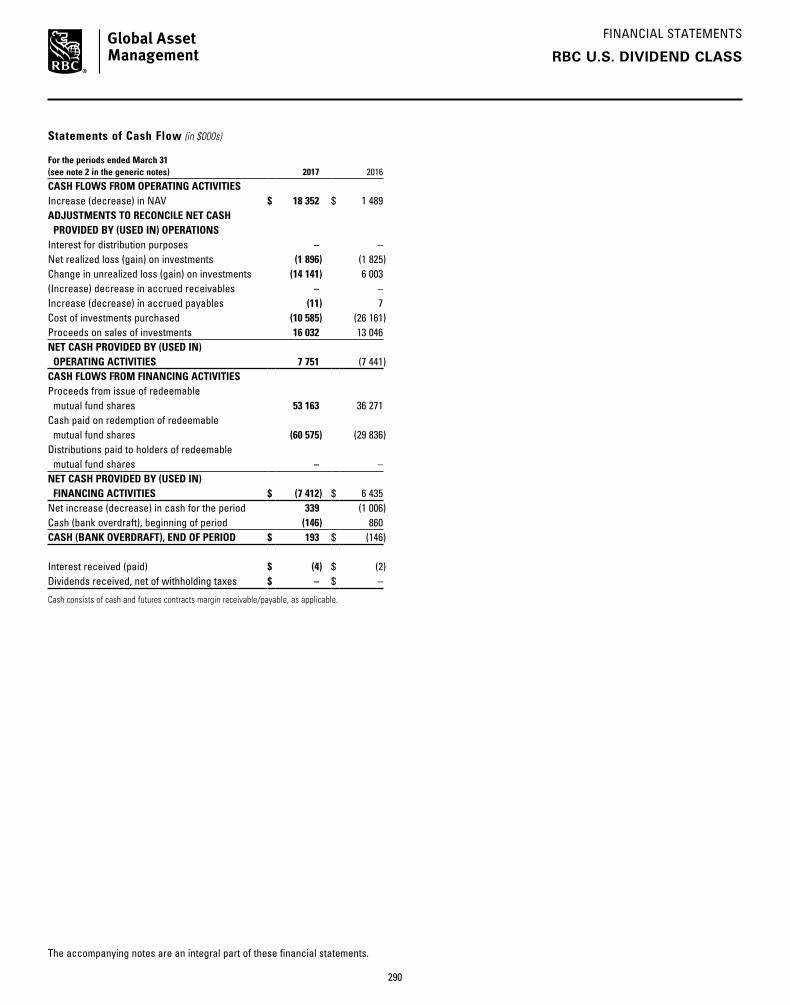
FINANCIAL STATEMENTS
The accompanying notes are an integral part of these financial statements.
Statements of Cash Flow (in $000s)
For the periods ended March 31 (see note 2 in the generic notes) 2017
2016
CASH FLOWS FROM OPERATING ACTIVITIESIncrease (decrease) in NAV $ 18 352 $ 1 489 ADJUSTMENTS TO RECONCILE NET CASH PROVIDED BY (USED IN) OPERATIONSInterest for distribution purposes – – Net realized loss (gain) on investments (1 896) (1 825)Change in unrealized loss (gain) on investments (14 141) 6 003 (Increase) decrease in accrued receivables – – Increase (decrease) in accrued payables (11) 7 Cost of investments purchased (10 585) (26 161)Proceeds on sales of investments 16 032 13 046 NET CASH PROVIDED BY (USED IN) OPERATING ACTIVITIES 7 751 (7 441)CASH FLOWS FROM FINANCING ACTIVITIESProceeds from issue of redeemable mutual fund shares 53 163 36 271 Cash paid on redemption of redeemable mutual fund shares (60 575) (29 836)Distributions paid to holders of redeemable mutual fund shares – – NET CASH PROVIDED BY (USED IN) FINANCING ACTIVITIES $ (7 412) $ 6 435 Net increase (decrease) in cash for the period 339 (1 006)Cash (bank overdraft), beginning of period (146) 860 CASH (BANK OVERDRAFT), END OF PERIOD $ 193 $ (146)
Interest received (paid) $ (4) $ (2)Dividends received, net of withholding taxes $ – $ –
Cash consists of cash and futures contracts margin receivable/payable, as applicable.
RBC U.S. DIVIDEND CLASS
290

FINANCIAL STATEMENTS
The accompanying notes are an integral part of these financial statements.
RBC U.S. DIVIDEND CLASS
Statements of Changes in NAV (in $000s)
For the periods ended March 31 (see note 2 in the generic notes)
Series A Advisor Series Series H Series D2017 2016 2017 2016 2017 2016 2017 2016
NAV AT BEGINNING OF PERIOD $ 30 364 $ 29 824 $ 19 960 $ 16 331 $ 8 063 $ 8 548 $ 10 886 $ 11 584 INCREASE (DECREASE) IN NAV 5 084 238 2 751 115 143 67 1 979 183 Early redemption fees – – 3 – – – – – Proceeds from redeemable mutual fund shares issued 9 047 8 227 2 658 7 015 8 2 208 2 489 2 485 Reinvestments of distributions to holders of redeemable mutual fund shares – – – – – – – – Redemption of redeemable mutual fund shares (13 619) (7 925) (8 391) (3 501) (8 214) (2 760) (1 992) (3 366)NET INCREASE (DECREASE) FROM REDEEMABLE MUTUAL FUND SHARE TRANSACTIONS (4 572) 302 (5 730) 3 514 (8 206) (552) 497 (881)Distributions from net income – – – – – – – – Distributions from net gains – – – – – – – – Distributions from capital – – – – – – – – TOTAL DISTRIBUTIONS TO HOLDERS OF REDEEMABLE MUTUAL FUND SHARES – – – – – – – – NET INCREASE (DECREASE) IN NAV 512 540 (2 979) 3 629 (8 063) (485) 2 476 (698)NAV AT END OF PERIOD $ 30 876 $ 30 364 $ 16 981 $ 19 960 $ – $ 8 063 $ 13 362 $ 10 886
For the periods ended March 31 (see note 2 in the generic notes)
Series F Series I Total2017 2016 2017 2016 2017 2016
NAV AT BEGINNING OF PERIOD $ 23 657 $ 21 588 $ 18 153 $ 15 256 $ 111 083 $ 103 131 INCREASE (DECREASE) IN NAV 7 978 480 417 406 18 352 1 489 Early redemption fees – – – – 3 – Proceeds from redeemable mutual fund shares issued 38 523 9 447 448 6 891 53 173 36 273 Reinvestments of distributions to holders of redeemable mutual fund shares – – – – – – Redemption of redeemable mutual fund shares (9 574) (7 858) (19 018) (4 400) (60 808) (29 810)NET INCREASE (DECREASE) FROM REDEEMABLE MUTUAL FUND SHARE TRANSACTIONS 28 949 1 589 (18 570) 2 491 (7 632) 6 463 Distributions from net income – – – – – – Distributions from net gains – – – – – – Distributions from capital – – – – – – TOTAL DISTRIBUTIONS TO HOLDERS OF REDEEMABLE MUTUAL FUND SHARES – – – – – – NET INCREASE (DECREASE) IN NAV 36 927 2 069 (18 153) 2 897 10 720 7 952 NAV AT END OF PERIOD $ 60 584 $ 23 657 $ – $ 18 153 $ 121 803 $ 111 083
291
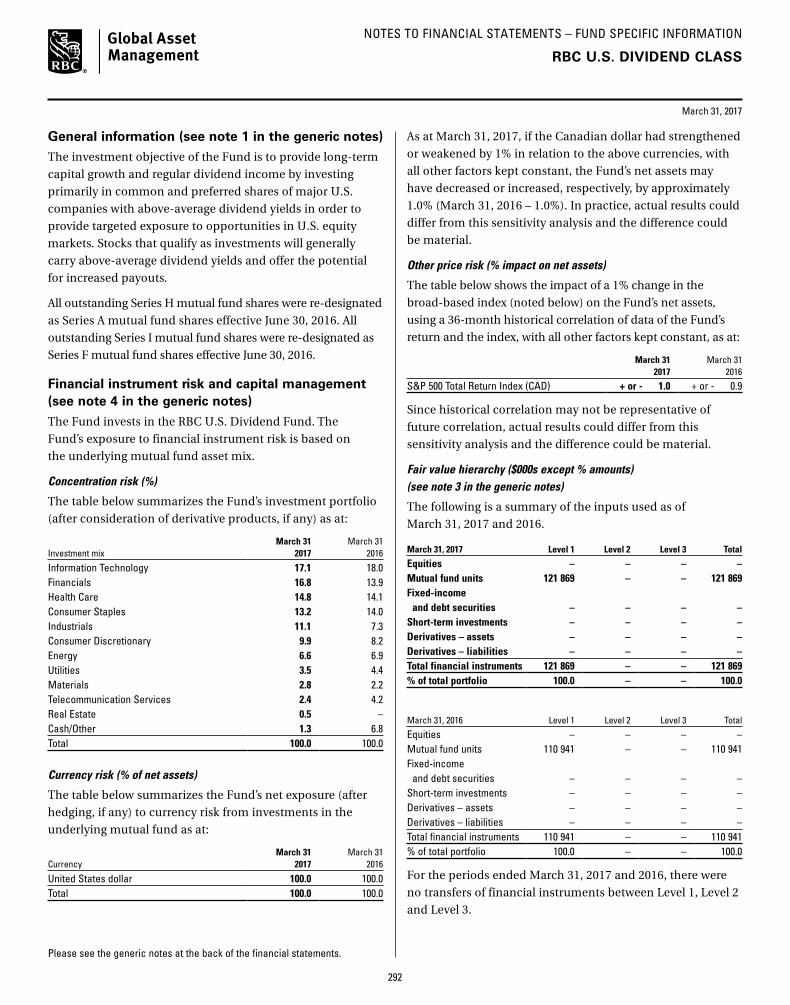
NOTES TO FINANCIAL STATEMENTS – FUND SPECIFIC INFORMATION
Please see the generic notes at the back of the financial statements.
March 31, 2017
RBC U.S. DIVIDEND CLASS
General information (see note 1 in the generic notes)
The investment objective of the Fund is to provide long-term
capital growth and regular dividend income by investing
primarily in common and preferred shares of major U.S.
companies with above-average dividend yields in order to
provide targeted exposure to opportunities in U.S. equity
markets. Stocks that qualify as investments will generally
carry above-average dividend yields and offer the potential
for increased payouts.
All outstanding Series H mutual fund shares were re-designated
as Series A mutual fund shares effective June 30, 2016. All
outstanding Series I mutual fund shares were re-designated as
Series F mutual fund shares effective June 30, 2016.
Financial instrument risk and capital management (see note 4 in the generic notes)
The Fund invests in the RBC U.S. Dividend Fund. The
Fund’s exposure to financial instrument risk is based on
the underlying mutual fund asset mix.
Concentration risk (%)
The table below summarizes the Fund’s investment portfolio
(after consideration of derivative products, if any) as at:
Investment mixMarch 31
2017March 31
2016
Information Technology 17.1 18.0Financials 16.8 13.9Health Care 14.8 14.1Consumer Staples 13.2 14.0Industrials 11.1 7.3Consumer Discretionary 9.9 8.2Energy 6.6 6.9Utilities 3.5 4.4Materials 2.8 2.2Telecommunication Services 2.4 4.2Real Estate 0.5 –Cash/Other 1.3 6.8Total 100.0 100.0
Currency risk (% of net assets)
The table below summarizes the Fund’s net exposure (after
hedging, if any) to currency risk from investments in the
underlying mutual fund as at:
CurrencyMarch 31
2017March 31
2016
United States dollar 100.0 100.0Total 100.0 100.0
As at March 31, 2017, if the Canadian dollar had strengthened
or weakened by 1% in relation to the above currencies, with
all other factors kept constant, the Fund’s net assets may
have decreased or increased, respectively, by approximately
1.0% (March 31, 2016 – 1.0%). In practice, actual results could
differ from this sensitivity analysis and the difference could
be material.
Other price risk (% impact on net assets)
The table below shows the impact of a 1% change in the
broad-based index (noted below) on the Fund’s net assets,
using a 36-month historical correlation of data of the Fund’s
return and the index, with all other factors kept constant, as at:
March 31 2017
March 31 2016
S&P 500 Total Return Index (CAD) + or - 1.0 + or - 0.9
Since historical correlation may not be representative of
future correlation, actual results could differ from this
sensitivity analysis and the difference could be material.
Fair value hierarchy ($000s except % amounts) (see note 3 in the generic notes)
The following is a summary of the inputs used as of
March 31, 2017 and 2016.
March 31, 2017 Level 1 Level 2 Level 3 Total
Equities – – – – Mutual fund units 121 869 – – 121 869Fixed-income and debt securities – – – – Short-term investments – – – – Derivatives – assets – – – – Derivatives – liabilities – – – – Total financial instruments 121 869 – – 121 869% of total portfolio 100.0 – – 100.0
March 31, 2016 Level 1 Level 2 Level 3 Total
Equities – – – – Mutual fund units 110 941 – – 110 941 Fixed-income and debt securities – – – – Short-term investments – – – – Derivatives – assets – – – – Derivatives – liabilities – – – – Total financial instruments 110 941 – – 110 941 % of total portfolio 100.0 – – 100.0
For the periods ended March 31, 2017 and 2016, there were
no transfers of financial instruments between Level 1, Level 2
and Level 3.
292

NOTES TO FINANCIAL STATEMENTS – FUND SPECIFIC INFORMATION
Please see the generic notes at the back of the financial statements.
March 31, 2017
Management fees and operating expenses (see note 6 in the generic notes)
Management fees and administration fees of each series
of the Fund are payable to RBC GAM and calculated at the
following annual percentages, before GST/HST, of the daily
net asset value of each series of the Fund.
Management fees* Operating expenses
Series A 1.60% 0.13%Advisor Series 1.60% 0.13%Series H 1.65% 0.05%Series D 0.85% 0.08%Series F 0.60% 0.08%Series I 0.60% 0.05%
* Effective June 30, 2016, the management fees for Series A and Advisor Series mutual fund shares were reduced to 1.60% from 1.75%; for Series D mutual fund shares were reduced to 0.85% from 1.00%; and for Series F mutual fund shares were reduced to 0.60% from 0.75%.
Investments by related parties ($000s except mutual fund share amounts)
Royal Bank of Canada, or one of its subsidiaries, held the
following investments in the Fund as at:
March 31 2017
March 31 2016
Mutual fund shares held Series A 101 – Advisor Series 100 100 Series H – 100 Series D 100 100 Series F 201 100 Series I – 100Value of all mutual fund shares 11 9
Underlying mutual fund ownership interest (%)
The table below summarizes the Fund’s interest in the
underlying mutual fund as a percentage of NAV, and the
Fund’s ownership interest as a percentage of the net assets of
the underlying fund (“Ownership”). The underlying fund is
established and conducts business in Canada, and has an
associate relationship to the Fund.
March 31 2017
March 31 2016
NAV Ownership NAV Ownership
RBC U.S. Dividend Fund 100.1 3.3 99.9 4.1
RBC U.S. DIVIDEND CLASS
Taxes ($000s) (see note 5 in the generic notes)
The Fund had no capital or non-capital losses as at
March 31, 2017.
Redeemable mutual fund shares (000s)
There is no limitation on the number of mutual fund shares
available for issue. Mutual fund shares are purchased and
redeemed at the NAV per mutual fund share.
For the periods ended March 31 (see note 2 in the generic notes) 2017 2016
Series A Opening mutual fund shares 1 735 1 721Issued number of mutual fund shares 499 470Reinvested number of mutual fund shares – – Redeemed number of mutual fund shares (731) (456)Ending number of mutual fund shares 1 503 1 735
Advisor SeriesOpening mutual fund shares 1 140 942Issued number of mutual fund shares 137 398Reinvested number of mutual fund shares – – Redeemed number of mutual fund shares (451) (200)Ending number of mutual fund shares 826 1 140
Series HOpening mutual fund shares 457 491Issued number of mutual fund shares 1 127Reinvested number of mutual fund shares – – Redeemed number of mutual fund shares (458) (161)Ending number of mutual fund shares – 457
Series DOpening mutual fund shares 603 654Issued number of mutual fund shares 126 136Reinvested number of mutual fund shares – – Redeemed number of mutual fund shares (104) (187)Ending number of mutual fund shares 625 603
Series FOpening mutual fund shares 1 300 1 212Issued number of mutual fund shares 1 991 523Reinvested number of mutual fund shares – – Redeemed number of mutual fund shares (487) (435)Ending number of mutual fund shares 2 804 1 300
Series IOpening mutual fund shares 990 852Issued number of mutual fund shares 24 379Reinvested number of mutual fund shares – – Redeemed number of mutual fund shares (1 014) (241)Ending number of mutual fund shares – 990
293

SCHEDULE OF INVESTMENT PORTFOLIO (in $000s)
ANNUAL FINANCIAL STATEMENTS
March 31, 2017
The accompanying notes are an integral part of the financial statements.
RBC U.S. EQUITY CLASS
Number Fair % of Net of Units Security Cost Value Assets
MUTUAL FUND UNITS 863 989 RBC U.S. Equity Fund* $ 18 609 $ 27 921
TOTAL MUTUAL FUND UNITS $ 18 609 27 921 99.8OTHER NET ASSETS ATTRIBUTABLE TO HOLDERS OF REDEEMABLE SHARES 60 0.2NET ASSETS ATTRIBUTABLE TO HOLDERS OF REDEEMABLE SHARES $ 27 981 100.0
* Investment in related party (see note 6 in the generic notes).
294

FINANCIAL STATEMENTS
The accompanying notes are an integral part of these financial statements.
RBC U.S. EQUITY CLASS
Statements of Financial Position (in $000s except per mutual fund share amounts)
(see note 2 in the generic notes)March 31
2017March 31
2016
ASSETSInvestments at fair value $ 27 921 $ 25 457 Cash 88 –Due from investment dealers – 205 Subscriptions receivable – 30 TOTAL ASSETS 28 009 25 692 LIABILITIESBank overdraft – 199 Due to investment dealers – 5 Redemptions payable 8 –Accounts payable and accrued expenses 20 24 TOTAL LIABILITIES EXCLUDING NET ASSETS ATTRIBUTABLE TO HOLDERS OF REDEEMABLE MUTUAL FUND SHARES 28 228 NET ASSETS ATTRIBUTABLE TO HOLDERS OF REDEEMABLE MUTUAL FUND SHARES (“NAV”) $ 27 981 $ 25 464
Investments at cost $ 18 609 $ 19 459
NAV SERIES A $ 7 199 $ 8 908 ADVISOR SERIES $ 1 187 $ 1 470 SERIES H $ – $ 195 SERIES D $ 3 708 $ 3 318 SERIES F $ 4 632 $ 1 495 SERIES I $ – $ 927 SERIES O $ 11 255 $ 9 151 NAV PER MUTUAL FUND SHARE SERIES A $ 20.92 $ 17.97 ADVISOR SERIES $ 20.94 $ 17.99 SERIES H $ – $ 18.15 SERIES D $ 21.99 $ 18.71 SERIES F $ 22.26 $ 18.90 SERIES I $ – $ 19.04 SERIES O $ 23.26 $ 19.60
Statements of Comprehensive Income (in $000s except per mutual fund share amounts)
For the periods ended March 31 (see note 2 in the generic notes) 2017 2016INCOME (see note 3 in the generic notes)Interest for distribution purposes $ (1) $ (3)Other income received from underlying funds 394 495 Capital gains received from underlying funds – 323 Net realized gain (loss) on investments 788 2 679 Change in unrealized gain (loss) on investments 3 314 (3 139)TOTAL INCOME (LOSS) 4 495 355 EXPENSES (see notes – Fund Specific Information)Management fees 208 251 Administration fees 15 17 Board of Directors fees 3 4 Independent Review Committee costs 2 3 GST/HST 28 32 Expenses reimbursed by manager (3) (4)TOTAL EXPENSES 253 303 INCREASE (DECREASE) IN NAV $ 4 242 $ 52 INCREASE (DECREASE) IN NAV SERIES A $ 1 252 $ (70) ADVISOR SERIES $ 229 $ (13) SERIES H $ – $ (11) SERIES D $ 553 $ (5) SERIES F $ 468 $ 2 SERIES I $ 15 $ 4 SERIES O $ 1 725 $ 145 INCREASE (DECREASE) IN NAV PER MUTUAL FUND SHARE SERIES A $ 2.85 $ (0.16) ADVISOR SERIES $ 3.03 $ (0.16) SERIES H $ (0.09) $ (0.13) SERIES D $ 3.24 $ 0.02 SERIES F $ 3.65 $ 0.06 SERIES I $ 0.33 $ 0.09 SERIES O $ 3.66 $ 0.23
295

FINANCIAL STATEMENTS
The accompanying notes are an integral part of these financial statements.
RBC U.S. EQUITY CLASS
Statements of Cash Flow (in $000s)
For the periods ended March 31 (see note 2 in the generic notes) 2017
2016
CASH FLOWS FROM OPERATING ACTIVITIESIncrease (decrease) in NAV $ 4 242 $ 52 ADJUSTMENTS TO RECONCILE NET CASH PROVIDED BY (USED IN) OPERATIONSInterest for distribution purposes – – Net realized loss (gain) on investments (788) (2 679)Change in unrealized loss (gain) on investments (3 314) 3 139 (Increase) decrease in accrued receivables – – Increase (decrease) in accrued payables (4) 1 Cost of investments purchased (1 282) (27 607)Proceeds on sales of investments 3 120 32 181 NET CASH PROVIDED BY (USED IN) OPERATING ACTIVITIES 1 974 5 087 CASH FLOWS FROM FINANCING ACTIVITIESProceeds from issue of redeemable mutual fund shares 5 654 6 515 Cash paid on redemption of redeemable mutual fund shares (7 341) (11 788)Distributions paid to holders of redeemable mutual fund shares – – NET CASH PROVIDED BY (USED IN) FINANCING ACTIVITIES $ (1 687) $ (5 273)Net increase (decrease) in cash for the period 287 (186)Cash (bank overdraft), beginning of period (199) (13)CASH (BANK OVERDRAFT), END OF PERIOD $ 88 $ (199)
Interest received (paid) $ (1) $ (3)Dividends received, net of withholding taxes $ – $ –
Cash consists of cash and futures contracts margin receivable/payable, as applicable.
296

FINANCIAL STATEMENTS
The accompanying notes are an integral part of these financial statements.
RBC U.S. EQUITY CLASS
Statements of Changes in NAV (in $000s)
For the periods ended March 31 (see note 2 in the generic notes)
Series A Advisor Series Series H Series D2017 2016 2017 2016 2017 2016 2017 2016
NAV AT BEGINNING OF PERIOD $ 8 908 $ 9 580 $ 1 470 $ 801 $ 195 $ 778 $ 3 318 $ 3 372 INCREASE (DECREASE) IN NAV 1 252 (70) 229 (13) – (11) 553 (5)Early redemption fees – – – – – – – – Proceeds from redeemable mutual fund shares issued 311 1 735 594 1 048 – 211 252 628 Reinvestments of distributions to holders of redeemable mutual fund shares – – – – – – – – Redemption of redeemable mutual fund shares (3 272) (2 337) (1 106) (366) (195) (783) (415) (677)NET INCREASE (DECREASE) FROM REDEEMABLE MUTUAL FUND SHARE TRANSACTIONS (2 961) (602) (512) 682 (195) (572) (163) (49)Distributions from net income – – – – – – – – Distributions from net gains – – – – – – – – Distributions from capital – – – – – – – – TOTAL DISTRIBUTIONS TO HOLDERS OF REDEEMABLE MUTUAL FUND SHARES – – – – – – – – NET INCREASE (DECREASE) IN NAV (1 709) (672) (283) 669 (195) (583) 390 (54)NAV AT END OF PERIOD $ 7 199 $ 8 908 $ 1 187 $ 1 470 $ – $ 195 $ 3 708 $ 3 318
For the periods ended March 31 (see note 2 in the generic notes)
Series F Series I Series O Total2017 2016 2017 2016 2017 2016 2017 2016
NAV AT BEGINNING OF PERIOD $ 1 495 $ 1 251 $ 927 $ 956 $ 9 151 $ 13 797 $ 25 464 $ 30 535 INCREASE (DECREASE) IN NAV 468 2 15 4 1 725 145 4 242 52 Early redemption fees – – – – – – – – Proceeds from redeemable mutual fund shares issued 3 170 536 – 8 1 297 2 291 5 624 6 457 Reinvestments of distributions to holders of redeemable mutual fund shares – – – – – – – – Redemption of redeemable mutual fund shares (501) (294) (942) (41) (918) (7 082) (7 349) (11 580)NET INCREASE (DECREASE) FROM REDEEMABLE MUTUAL FUND SHARE TRANSACTIONS 2 669 242 (942) (33) 379 (4 791) (1 725) (5 123)Distributions from net income – – – – – – – – Distributions from net gains – – – – – – – – Distributions from capital – – – – – – – – TOTAL DISTRIBUTIONS TO HOLDERS OF REDEEMABLE MUTUAL FUND SHARES – – – – – – – – NET INCREASE (DECREASE) IN NAV 3 137 244 (927) (29) 2 104 (4 646) 2 517 (5 071)NAV AT END OF PERIOD $ 4 632 $ 1 495 $ – $ 927 $ 11 255 $ 9 151 $ 27 981 $ 25 464
297

NOTES TO FINANCIAL STATEMENTS – FUND SPECIFIC INFORMATION
Please see the generic notes at the back of the financial statements.
March 31, 2017
RBC U.S. EQUITY CLASS
General information (see note 1 in the generic notes)
The investment objective of the Fund is to provide long-term
capital growth by investing primarily in equity securities of
major U.S. companies.
All outstanding Series I mutual fund shares were re-designated
as Series F mutual fund shares effective June 30, 2016.
Financial instrument risk and capital management (see note 4 in the generic notes)
The Fund invests in the RBC U.S. Equity Fund. The Fund’s
exposure to financial instrument risk is based on the
underlying mutual fund asset mix.
Concentration risk (%)
The table below summarizes the Fund’s investment portfolio
(after consideration of derivative products, if any) as at:
Investment mixMarch 31
2017March 31
2016
Information Technology 21.0 20.6Financials 13.8 12.9Health Care 12.3 10.6Consumer Discretionary 10.7 11.0Industrials 8.8 10.1Consumer Staples 7.8 9.0Energy 7.3 5.8Utilities 2.9 3.3Telecommunication Services 2.3 2.9Materials 1.7 2.9Real Estate 0.4 –Cash/Other 11.0 10.9Total 100.0 100.0
Currency risk (% of net assets)
The table below summarizes the Fund’s net exposure
(after hedging, if any) to currency risk from investments in
the underlying mutual fund as at:
CurrencyMarch 31
2017March 31
2016
United States dollar 99.9 100.7Total 99.9 100.7
As at March 31, 2017, if the Canadian dollar had strengthened
or weakened by 1% in relation to the above currencies, with
all other factors kept constant, the Fund’s net assets may
have decreased or increased, respectively, by approximately
1.0% (March 31, 2016 – 1.0%). In practice, actual results could
differ from this sensitivity analysis and the difference could
be material.
Other price risk (% impact on net assets)
The table below shows the impact of a 1% change in the
broad-based index (noted below) on the Fund’s net assets,
using a 36-month historical correlation of data of the Fund’s
return and the index, with all other factors kept constant, as at:
March 31 2017
March 31 2016
S&P 500 Total Return Index (CAD) + or - 1.0 + or - 1.0
Since historical correlation may not be representative of
future correlation, actual results could differ from this
sensitivity analysis and the difference could be material.
Fair value hierarchy ($000s except % amounts) (see note 3 in the generic notes)
The following is a summary of the inputs used as of
March 31, 2017 and 2016.
March 31, 2017 Level 1 Level 2 Level 3 Total
Equities – – – – Mutual fund units 27 921 – – 27 921Fixed-income and debt securities – – – – Short-term investments – – – – Derivatives – assets – – – – Derivatives – liabilities – – – – Total financial instruments 27 921 – – 27 921% of total portfolio 100.0 – – 100.0
March 31, 2016 Level 1 Level 2 Level 3 Total
Equities – – – – Mutual fund units 25 457 – – 25 457 Fixed-income and debt securities – – – – Short-term investments – – – – Derivatives – assets – – – – Derivatives – liabilities – – – – Total financial instruments 25 457 – – 25 457 % of total portfolio 100.0 – – 100.0
For the periods ended March 31, 2017 and 2016, there were
no transfers of financial instruments between Level 1, Level 2
and Level 3.
298
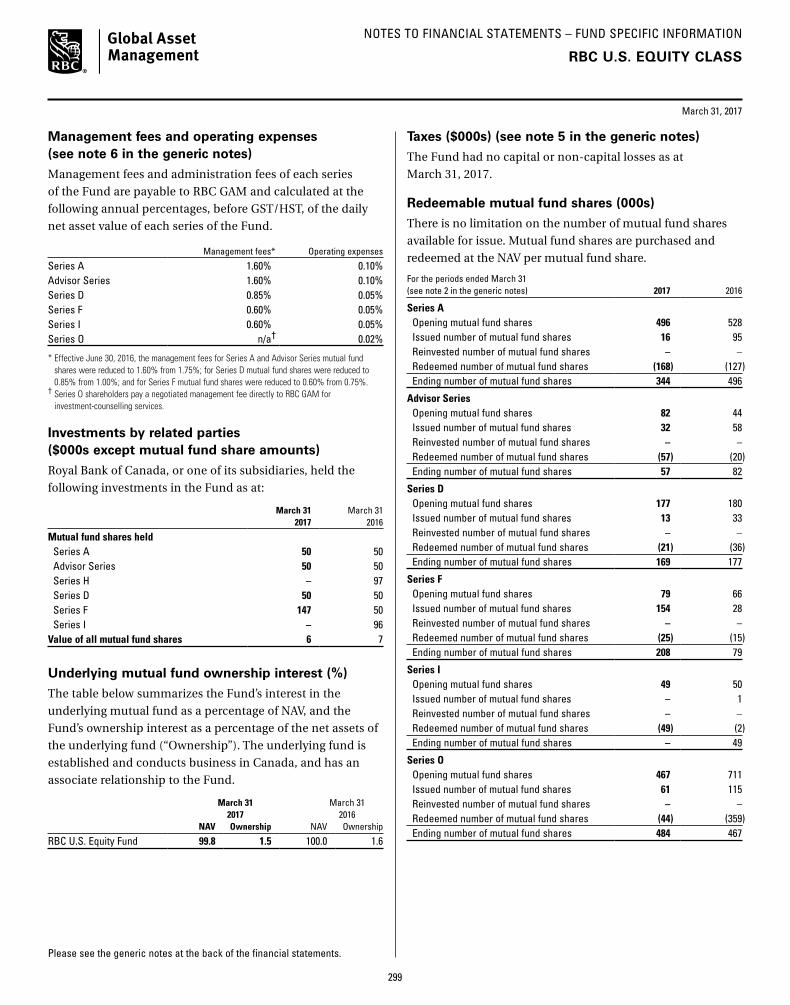
NOTES TO FINANCIAL STATEMENTS – FUND SPECIFIC INFORMATION
Please see the generic notes at the back of the financial statements.
March 31, 2017
Management fees and operating expenses (see note 6 in the generic notes)
Management fees and administration fees of each series
of the Fund are payable to RBC GAM and calculated at the
following annual percentages, before GST/HST, of the daily
net asset value of each series of the Fund.
Management fees* Operating expenses
Series A 1.60% 0.10%Advisor Series 1.60% 0.10%Series D 0.85% 0.05%Series F 0.60% 0.05%Series I 0.60% 0.05%Series O n/a† 0.02%
* Effective June 30, 2016, the management fees for Series A and Advisor Series mutual fund shares were reduced to 1.60% from 1.75%; for Series D mutual fund shares were reduced to 0.85% from 1.00%; and for Series F mutual fund shares were reduced to 0.60% from 0.75%.
† Series O shareholders pay a negotiated management fee directly to RBC GAM for investment-counselling services.
Investments by related parties ($000s except mutual fund share amounts)
Royal Bank of Canada, or one of its subsidiaries, held the
following investments in the Fund as at:
March 31 2017
March 31 2016
Mutual fund shares held Series A 50 50 Advisor Series 50 50 Series H – 97 Series D 50 50 Series F 147 50 Series I – 96Value of all mutual fund shares 6 7
Underlying mutual fund ownership interest (%)
The table below summarizes the Fund’s interest in the
underlying mutual fund as a percentage of NAV, and the
Fund’s ownership interest as a percentage of the net assets of
the underlying fund (“Ownership”). The underlying fund is
established and conducts business in Canada, and has an
associate relationship to the Fund.
March 31 2017
March 31 2016
NAV Ownership NAV Ownership
RBC U.S. Equity Fund 99.8 1.5 100.0 1.6
Taxes ($000s) (see note 5 in the generic notes)
The Fund had no capital or non-capital losses as at
March 31, 2017.
Redeemable mutual fund shares (000s)
There is no limitation on the number of mutual fund shares
available for issue. Mutual fund shares are purchased and
redeemed at the NAV per mutual fund share.
For the periods ended March 31 (see note 2 in the generic notes) 2017 2016
Series A Opening mutual fund shares 496 528Issued number of mutual fund shares 16 95Reinvested number of mutual fund shares – – Redeemed number of mutual fund shares (168) (127)Ending number of mutual fund shares 344 496
Advisor SeriesOpening mutual fund shares 82 44Issued number of mutual fund shares 32 58Reinvested number of mutual fund shares – – Redeemed number of mutual fund shares (57) (20)Ending number of mutual fund shares 57 82
Series DOpening mutual fund shares 177 180Issued number of mutual fund shares 13 33Reinvested number of mutual fund shares – – Redeemed number of mutual fund shares (21) (36)Ending number of mutual fund shares 169 177
Series FOpening mutual fund shares 79 66Issued number of mutual fund shares 154 28Reinvested number of mutual fund shares – – Redeemed number of mutual fund shares (25) (15)Ending number of mutual fund shares 208 79
Series IOpening mutual fund shares 49 50Issued number of mutual fund shares – 1Reinvested number of mutual fund shares – – Redeemed number of mutual fund shares (49) (2)Ending number of mutual fund shares – 49
Series OOpening mutual fund shares 467 711Issued number of mutual fund shares 61 115Reinvested number of mutual fund shares – – Redeemed number of mutual fund shares (44) (359)Ending number of mutual fund shares 484 467
RBC U.S. EQUITY CLASS
299

SCHEDULE OF INVESTMENT PORTFOLIO (in $000s)
ANNUAL FINANCIAL STATEMENTS
March 31, 2017
The accompanying notes are an integral part of the financial statements.
RBC QUBE LOW VOLATILITY U.S. EQUITY CLASS
Number Fair % of Net of Units Security Cost Value Assets
MUTUAL FUND UNITS 1 584 251 RBC QUBE Low Volatility U.S. Equity Fund* $ 31 791 $ 34 645
TOTAL MUTUAL FUND UNITS $ 31 791 34 645 99.8OTHER NET ASSETS ATTRIBUTABLE TO HOLDERS OF REDEEMABLE SHARES 57 0.2NET ASSETS ATTRIBUTABLE TO HOLDERS OF REDEEMABLE SHARES $ 34 702 100.0
* Investment in related party (see note 6 in the generic notes).
300

FINANCIAL STATEMENTS
The accompanying notes are an integral part of these financial statements.
RBC QUBE LOW VOLATILITY U.S. EQUITY CLASS
Statements of Financial Position (in $000s except per mutual fund share amounts)
(see note 2 in the generic notes)March 31
2017March 31
2016
ASSETSInvestments at fair value $ 34 645 $ 14 216 Cash 145 527 Due from investment dealers – 775 Subscriptions receivable 161 97 TOTAL ASSETS 34 951 15 615 LIABILITIESDue to investment dealers 199 1 355 Redemptions payable 20 –Accounts payable and accrued expenses 30 16 TOTAL LIABILITIES EXCLUDING NET ASSETS ATTRIBUTABLE TO HOLDERS OF REDEEMABLE MUTUAL FUND SHARES 249 1 371 NET ASSETS ATTRIBUTABLE TO HOLDERS OF REDEEMABLE MUTUAL FUND SHARES (“NAV”) $ 34 702 $ 14 244
Investments at cost $ 31 791 $ 13 641
NAV SERIES A $ 9 980 $ 5 559 ADVISOR SERIES $ 2 741 $ 774 SERIES H $ – $ 1 399 SERIES D $ 2 772 $ 2 796 SERIES F $ 14 610 $ 2 692 SERIES I $ – $ 816 SERIES O $ 4 599 $ 208 NAV PER MUTUAL FUND SHARE SERIES A $ 12.29 $ 10.84 ADVISOR SERIES $ 12.30 $ 10.84 SERIES H $ – $ 10.86 SERIES D $ 12.52 $ 10.94 SERIES F $ 12.59 $ 10.98 SERIES I $ – $ 11.01 SERIES O $ 12.82 $ 11.10
Statements of Comprehensive Income (in $000s except per mutual fund share amounts)
For the periods ended March 31 (see note 2 in the generic notes) 2017 2016INCOME (see note 3 in the generic notes)Interest for distribution purposes $ (2) $ (2)Other income received from underlying funds 591 128 Capital gains received from underlying funds 676 30 Net realized gain (loss) on investments 241 44 Net gain (loss) on foreign currencies and other net assets (19) 6 Change in unrealized gain (loss) on investments 2 279 560 TOTAL INCOME (LOSS) 3 766 766 EXPENSES (see notes – Fund Specific Information)Management fees 255 96 Administration fees 17 4 Board of Directors fees 3 1 Independent Review Committee costs 2 3 GST/HST 25 9 Expenses reimbursed by manager (2) (3)TOTAL EXPENSES 300 110 INCREASE (DECREASE) IN NAV $ 3 466 $ 656 INCREASE (DECREASE) IN NAV SERIES A $ 1 047 $ 302 ADVISOR SERIES $ 304 $ 44 SERIES H $ 21 $ 81 SERIES D $ 379 $ 173 SERIES F $ 1 282 $ 40 SERIES I $ (2) $ (11) SERIES O $ 435 $ 27 INCREASE (DECREASE) IN NAV PER MUTUAL FUND SHARE SERIES A $ 1.37 $ 0.97 ADVISOR SERIES $ 1.48 $ 0.84 SERIES H $ 0.19 $ 1.07 SERIES D $ 1.63 $ 1.02 SERIES F $ 1.99 $ 0.89 SERIES I $ (0.03) $ 0.66 SERIES O $ 1.91 $ 1.46
301

FINANCIAL STATEMENTS
The accompanying notes are an integral part of these financial statements.
RBC QUBE LOW VOLATILITY U.S. EQUITY CLASS
Statements of Cash Flow (in $000s)
For the periods ended March 31 (see note 2 in the generic notes) 2017
2016
CASH FLOWS FROM OPERATING ACTIVITIESIncrease (decrease) in NAV $ 3 466 $ 656 ADJUSTMENTS TO RECONCILE NET CASH PROVIDED BY (USED IN) OPERATIONSInterest for distribution purposes – – Net realized loss (gain) on investments (241) (44)Change in unrealized loss (gain) on investments (2 279) (560)(Increase) decrease in accrued receivables – – Increase (decrease) in accrued payables 14 12 Cost of investments purchased (24 885) (12 992)Proceeds on sales of investments 6 595 2 204 NET CASH PROVIDED BY (USED IN) OPERATING ACTIVITIES (17 330) (10 724)CASH FLOWS FROM FINANCING ACTIVITIESProceeds from issue of redeemable mutual fund shares 33 190 15 079 Cash paid on redemption of redeemable mutual fund shares (16 242) (4 214)Distributions paid to holders of redeemable mutual fund shares – – NET CASH PROVIDED BY (USED IN) FINANCING ACTIVITIES $ 16 948 $ 10 865 Net increase (decrease) in cash for the period (382) 141 Cash (bank overdraft), beginning of period 527 386 CASH (BANK OVERDRAFT), END OF PERIOD $ 145 $ 527
Interest received (paid) $ (2) $ (2)Dividends received, net of withholding taxes $ – $ –
Cash consists of cash and futures contracts margin receivable/payable, as applicable.
302

FINANCIAL STATEMENTS
The accompanying notes are an integral part of these financial statements.
RBC QUBE LOW VOLATILITY U.S. EQUITY CLASS
Statements of Changes in NAV (in $000s)
For the periods ended March 31 (see note 2 in the generic notes)
Series A Advisor Series Series H Series D2017 2016 2017 2016 2017 2016 2017 2016
NAV AT BEGINNING OF PERIOD $ 5 559 $ 1 534 $ 774 $ 1 $ 1 399 $ 909 $ 2 796 $ 499 INCREASE (DECREASE) IN NAV 1 047 302 304 44 21 81 379 173 Early redemption fees – – – – – – – – Proceeds from redeemable mutual fund shares issued 8 208 5 068 3 841 836 – 1 309 1 527 2 632 Reinvestments of distributions to holders of redeemable mutual fund shares – – – – – – – – Redemption of redeemable mutual fund shares (4 834) (1 345) (2 178) (107) (1 420) (900) (1 930) (508)NET INCREASE (DECREASE) FROM REDEEMABLE MUTUAL FUND SHARE TRANSACTIONS 3 374 3 723 1 663 729 (1 420) 409 (403) 2 124 Distributions from net income – – – – – – – – Distributions from net gains – – – – – – – – Distributions from capital – – – – – – – – TOTAL DISTRIBUTIONS TO HOLDERS OF REDEEMABLE MUTUAL FUND SHARES – – – – – – – – NET INCREASE (DECREASE) IN NAV 4 421 4 025 1 967 773 (1 399) 490 (24) 2 297 NAV AT END OF PERIOD $ 9 980 $ 5 559 $ 2 741 $ 774 $ – $ 1 399 $ 2 772 $ 2 796
For the periods ended March 31 (see note 2 in the generic notes)
Series F Series I Series O Total2017 2016 2017 2016 2017 2016 2017 2016
NAV AT BEGINNING OF PERIOD $ 2 692 $ 187 $ 816 $ 1 $ 208 $ 285 $ 14 244 $ 3 416 INCREASE (DECREASE) IN NAV 1 282 40 (2) (11) 435 27 3 466 656 Early redemption fees – – – – – – – – Proceeds from redeemable mutual fund shares issued 15 139 2 668 – 1 826 4 539 47 33 254 14 386 Reinvestments of distributions to holders of redeemable mutual fund shares – – – – – – – – Redemption of redeemable mutual fund shares (4 503) (203) (814) (1 000) (583) (151) (16 262) (4 214)NET INCREASE (DECREASE) FROM REDEEMABLE MUTUAL FUND SHARE TRANSACTIONS 10 636 2 465 (814) 826 3 956 (104) 16 992 10 172 Distributions from net income – – – – – – – – Distributions from net gains – – – – – – – – Distributions from capital – – – – – – – – TOTAL DISTRIBUTIONS TO HOLDERS OF REDEEMABLE MUTUAL FUND SHARES – – – – – – – – NET INCREASE (DECREASE) IN NAV 11 918 2 505 (816) 815 4 391 (77) 20 458 10 828 NAV AT END OF PERIOD $ 14 610 $ 2 692 $ – $ 816 $ 4 599 $ 208 $ 34 702 $ 14 244
303

NOTES TO FINANCIAL STATEMENTS – FUND SPECIFIC INFORMATION
Please see the generic notes at the back of the financial statements.
March 31, 2017
RBC QUBE LOW VOLATILITY U.S. EQUITY CLASS
General information (see note 1 in the generic notes)
The investment objective of the Fund is to provide long-term
capital growth by investing primarily in equity securities of
U.S. companies.
All outstanding Series H mutual fund shares were re-designated
as Series A mutual fund shares effective June 30, 2016.
Financial instrument risk and capital management (see note 4 in the generic notes)
The Fund invests in the RBC QUBE Low Volatility U.S. Equity
Fund. The Fund’s exposure to financial instrument risk is
based on the underlying mutual fund asset mix.
Concentration risk (%)
The table below summarizes the Fund’s investment portfolio
(after consideration of derivative products, if any) as at:
Investment mixMarch 31
2017March 31
2016
Information Technology 20.2 15.4Utilities 18.0 17.3Consumer Staples 13.9 20.2Financials 13.7 12.8Industrials 10.4 8.5Consumer Discretionary 7.3 9.9Health Care 7.3 9.4Real Estate 3.8 –Telecommunication Services 3.1 3.6Energy 1.8 0.2Materials 0.3 2.4Cash/Other 0.2 0.3Total 100.0 100.0
Currency risk (% of net assets)
The table below summarizes the Fund’s net exposure
(after hedging, if any) to currency risk from investments in
the underlying mutual fund as at:
CurrencyMarch 31
2017March 31
2016
United States dollar 99.3 100.0Total 99.3 100.0
As at March 31, 2017, if the Canadian dollar had strengthened
or weakened by 1% in relation to the above currencies, with
all other factors kept constant, the Fund’s net assets may
have decreased or increased, respectively, by approximately
1.0% (March 31, 2016 – 1.0%). In practice, actual results could
differ from this sensitivity analysis and the difference could
be material.
Other price risk (% impact on net assets)
The table below shows the impact of a 1% change in the
broad-based index (noted below) on the Fund’s net assets,
using a 26-month (March 31, 2016 – 14-month) historical
correlation of data of the Fund’s return and the index, with all
other factors kept constant, as at:
March 31 2017
March 31 2016
S&P 500 Total Return Index (CAD) + or - 0.8 + or - 0.8
Since historical correlation may not be representative of
future correlation, actual results could differ from this
sensitivity analysis and the difference could be material.
Fair value hierarchy ($000s except % amounts) (see note 3 in the generic notes)
The following is a summary of the inputs used as of
March 31, 2017 and 2016.
March 31, 2017 Level 1 Level 2 Level 3 Total
Equities – – – – Mutual fund units 34 645 – – 34 645Fixed-income and debt securities – – – – Short-term investments – – – – Derivatives – assets – – – – Derivatives – liabilities – – – – Total financial instruments 34 645 – – 34 645% of total portfolio 100.0 – – 100.0
March 31, 2016 Level 1 Level 2 Level 3 Total
Equities – – – – Mutual fund units 14 216 – – 14 216 Fixed-income and debt securities – – – – Short-term investments – – – – Derivatives – assets – – – – Derivatives – liabilities – – – – Total financial instruments 14 216 – – 14 216 % of total portfolio 100.0 – – 100.0
For the periods ended March 31, 2017 and 2016, there were
no transfers of financial instruments between Level 1, Level 2
and Level 3.
304

NOTES TO FINANCIAL STATEMENTS – FUND SPECIFIC INFORMATION
Please see the generic notes at the back of the financial statements.
March 31, 2017
RBC QUBE LOW VOLATILITY U.S. EQUITY CLASS
Management fees and operating expenses (see note 6 in the generic notes)
Management fees and administration fees of each series
of the Fund are payable to RBC GAM and calculated at the
following annual percentages, before GST/HST, of the daily
net asset value of each series of the Fund.
Management fees* Operating expenses
Series A 1.60% 0.08%Advisor Series 1.60% 0.08%Series H 1.60% 0.08%Series D 0.85% 0.08%Series F 0.60% 0.08%Series O n/a† 0.02%
* Effective June 30, 2016, the management fees for Series A and Advisor Series mutual fund shares were reduced to 1.60% from 1.75%; for Series D mutual fund shares were reduced to 0.85% from 1.00%; and for Series F mutual fund shares were reduced to 0.60% from 0.75%.
† Series O shareholders pay a negotiated management fee directly to RBC GAM for investment-counselling services.
Investments by related parties ($000s except mutual fund share amounts)
Royal Bank of Canada, or one of its subsidiaries, held the
following investments in the Fund as at:
March 31 2017
March 31 2016
Mutual fund shares held Series A 200 100 Advisor Series 100 100 Series H – 100 Series D 100 100 Series F 100 100 Series I – 100 Series O 100 100Value of all mutual fund shares 7 8
Underlying mutual fund ownership interest (%)
The table below summarizes the Fund’s interest in the
underlying mutual fund as a percentage of NAV, and the
Fund’s ownership interest as a percentage of the net assets of
the underlying fund (“Ownership”). The underlying fund is
established and conducts business in Canada, and has an
associate relationship to the Fund.
March 31 2017
March 31 2016
NAV Ownership NAV Ownership
RBC QUBE Low Volatility U.S. Equity Fund 99.8 2.1 99.8 1.2
Taxes ($000s) (see note 5 in the generic notes)
The Fund had no capital or non-capital losses as at
March 31, 2017.
Redeemable mutual fund shares (000s)
There is no limitation on the number of mutual fund shares
available for issue. Mutual fund shares are purchased and
redeemed at the NAV per mutual fund share.
For the periods ended March 31 (see note 2 in the generic notes) 2017 2016
Series A Opening mutual fund shares 513 154Issued number of mutual fund shares 726 493Reinvested number of mutual fund shares – –Redeemed number of mutual fund shares (427) (134)Ending number of mutual fund shares 812 513
Advisor SeriesOpening mutual fund shares 71 –Issued number of mutual fund shares 334 81Reinvested number of mutual fund shares – –Redeemed number of mutual fund shares (182) (10)Ending number of mutual fund shares 223 71
Series HOpening mutual fund shares 129 92Issued number of mutual fund shares – 128Reinvested number of mutual fund shares – –Redeemed number of mutual fund shares (129) (91)Ending number of mutual fund shares – 129
Series DOpening mutual fund shares 256 50Issued number of mutual fund shares 133 254Reinvested number of mutual fund shares – –Redeemed number of mutual fund shares (168) (48)Ending number of mutual fund shares 221 256
Series FOpening mutual fund shares 245 19Issued number of mutual fund shares 1 307 247Reinvested number of mutual fund shares – –Redeemed number of mutual fund shares (392) (21)Ending number of mutual fund shares 1 160 245
Series OOpening mutual fund shares 19 29Issued number of mutual fund shares 390 4Reinvested number of mutual fund shares – – Redeemed number of mutual fund shares (50) (14)Ending number of mutual fund shares 359 19
305

SCHEDULE OF INVESTMENT PORTFOLIO (in $000s)
ANNUAL FINANCIAL STATEMENTS
March 31, 2017
The accompanying notes are an integral part of the financial statements.
RBC U.S. EQUITY VALUE CLASS
Number Fair % of Net of Units Security Cost Value Assets
MUTUAL FUND UNITS 52 665 RBC U.S. Equity Value Fund* $ 668 $ 725
TOTAL MUTUAL FUND UNITS $ 668 725 100.1OTHER NET ASSETS (LIABILITIES) ATTRIBUTABLE TO HOLDERS OF REDEEMABLE SHARES (1) (0.1)NET ASSETS ATTRIBUTABLE TO HOLDERS OF REDEEMABLE SHARES $ 724 100.0
* Investment in related party (see note 6 in the generic notes).
306
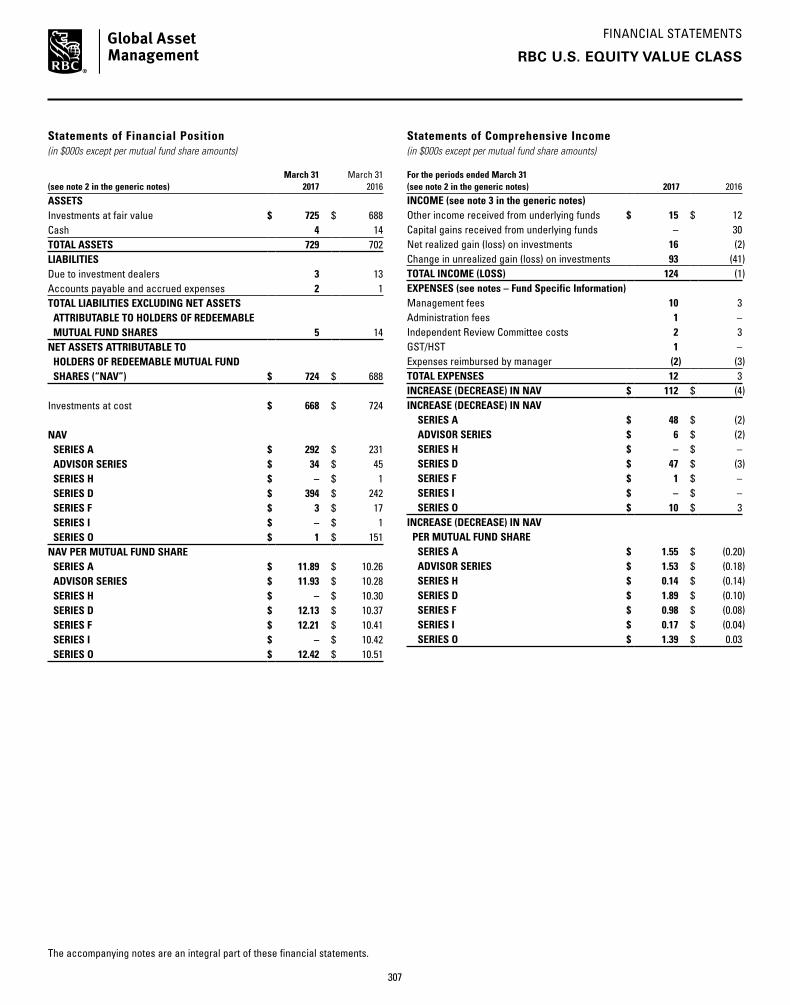
FINANCIAL STATEMENTS
The accompanying notes are an integral part of these financial statements.
RBC U.S. EQUITY VALUE CLASS
Statements of Financial Position (in $000s except per mutual fund share amounts)
(see note 2 in the generic notes)March 31
2017March 31
2016
ASSETSInvestments at fair value $ 725 $ 688 Cash 4 14 TOTAL ASSETS 729 702 LIABILITIESDue to investment dealers 3 13 Accounts payable and accrued expenses 2 1 TOTAL LIABILITIES EXCLUDING NET ASSETS ATTRIBUTABLE TO HOLDERS OF REDEEMABLE MUTUAL FUND SHARES 5 14 NET ASSETS ATTRIBUTABLE TO HOLDERS OF REDEEMABLE MUTUAL FUND SHARES (“NAV”) $ 724 $ 688
Investments at cost $ 668 $ 724
NAV SERIES A $ 292 $ 231 ADVISOR SERIES $ 34 $ 45 SERIES H $ – $ 1 SERIES D $ 394 $ 242 SERIES F $ 3 $ 17 SERIES I $ – $ 1 SERIES O $ 1 $ 151 NAV PER MUTUAL FUND SHARE SERIES A $ 11.89 $ 10.26 ADVISOR SERIES $ 11.93 $ 10.28 SERIES H $ – $ 10.30 SERIES D $ 12.13 $ 10.37 SERIES F $ 12.21 $ 10.41 SERIES I $ – $ 10.42 SERIES O $ 12.42 $ 10.51
Statements of Comprehensive Income (in $000s except per mutual fund share amounts)
For the periods ended March 31 (see note 2 in the generic notes) 2017 2016INCOME (see note 3 in the generic notes)Other income received from underlying funds $ 15 $ 12 Capital gains received from underlying funds – 30 Net realized gain (loss) on investments 16 (2)Change in unrealized gain (loss) on investments 93 (41)TOTAL INCOME (LOSS) 124 (1)EXPENSES (see notes – Fund Specific Information)Management fees 10 3 Administration fees 1 –Independent Review Committee costs 2 3 GST/HST 1 –Expenses reimbursed by manager (2) (3)TOTAL EXPENSES 12 3 INCREASE (DECREASE) IN NAV $ 112 $ (4)INCREASE (DECREASE) IN NAV SERIES A $ 48 $ (2) ADVISOR SERIES $ 6 $ (2) SERIES H $ – $ – SERIES D $ 47 $ (3) SERIES F $ 1 $ – SERIES I $ – $ – SERIES O $ 10 $ 3 INCREASE (DECREASE) IN NAV PER MUTUAL FUND SHARE SERIES A $ 1.55 $ (0.20) ADVISOR SERIES $ 1.53 $ (0.18) SERIES H $ 0.14 $ (0.14) SERIES D $ 1.89 $ (0.10) SERIES F $ 0.98 $ (0.08) SERIES I $ 0.17 $ (0.04) SERIES O $ 1.39 $ 0.03
307

FINANCIAL STATEMENTS
The accompanying notes are an integral part of these financial statements.
RBC U.S. EQUITY VALUE CLASS
Statements of Cash Flow (in $000s)
For the periods ended March 31 (see note 2 in the generic notes) 2017
2016
CASH FLOWS FROM OPERATING ACTIVITIESIncrease (decrease) in NAV $ 112 $ (4)ADJUSTMENTS TO RECONCILE NET CASH PROVIDED BY (USED IN) OPERATIONSInterest for distribution purposes – – Net realized loss (gain) on investments (16) 2 Change in unrealized loss (gain) on investments (93) 41 (Increase) decrease in accrued receivables – – Increase (decrease) in accrued payables 1 1 Cost of investments purchased (499) (554)Proceeds on sales of investments 561 64 NET CASH PROVIDED BY (USED IN) OPERATING ACTIVITIES 66 (450)CASH FLOWS FROM FINANCING ACTIVITIESProceeds from issue of redeemable mutual fund shares 493 523 Cash paid on redemption of redeemable mutual fund shares (569) (59)Distributions paid to holders of redeemable mutual fund shares – – NET CASH PROVIDED BY (USED IN) FINANCING ACTIVITIES $ (76) $ 464 Net increase (decrease) in cash for the period (10) 14 Cash (bank overdraft), beginning of period 14 – CASH (BANK OVERDRAFT), END OF PERIOD $ 4 $ 14
Interest received (paid) $ – $ – Dividends received, net of withholding taxes $ – $ –
Cash consists of cash and futures contracts margin receivable/payable, as applicable.
308

FINANCIAL STATEMENTS
The accompanying notes are an integral part of these financial statements.
RBC U.S. EQUITY VALUE CLASS
Statements of Changes in NAV (in $000s)
For the periods ended March 31 (see note 2 in the generic notes)
Series A Advisor Series Series H Series D2017 2016 2017 2016 2017 2016 2017 2016
NAV AT BEGINNING OF PERIOD $ 231 $ 39 $ 45 $ 1 $ 1 $ 1 $ 242 $ 37 INCREASE (DECREASE) IN NAV 48 (2) 6 (2) – – 47 (3)Early redemption fees – – – – – – – – Proceeds from redeemable mutual fund shares issued 220 197 – 46 – – 273 264 Reinvestments of distributions to holders of redeemable mutual fund shares – – – – – – – – Redemption of redeemable mutual fund shares (207) (3) (17) – (1) – (168) (56)NET INCREASE (DECREASE) FROM REDEEMABLE MUTUAL FUND SHARE TRANSACTIONS 13 194 (17) 46 (1) – 105 208 Distributions from net income – – – – – – – – Distributions from net gains – – – – – – – – Distributions from capital – – – – – – – – TOTAL DISTRIBUTIONS TO HOLDERS OF REDEEMABLE MUTUAL FUND SHARES – – – – – – – – NET INCREASE (DECREASE) IN NAV 61 192 (11) 44 (1) – 152 205 NAV AT END OF PERIOD $ 292 $ 231 $ 34 $ 45 $ – $ 1 $ 394 $ 242
For the periods ended March 31 (see note 2 in the generic notes)
Series F Series I Series O Total2017 2016 2017 2016 2017 2016 2017 2016
NAV AT BEGINNING OF PERIOD $ 17 $ 1 $ 1 $ 1 $ 151 $ 148 $ 688 $ 228 INCREASE (DECREASE) IN NAV 1 – – – 10 3 112 (4)Early redemption fees – – – – – – – – Proceeds from redeemable mutual fund shares issued – 16 – – – – 493 523 Reinvestments of distributions to holders of redeemable mutual fund shares – – – – – – – – Redemption of redeemable mutual fund shares (15) – (1) – (160) – (569) (59)NET INCREASE (DECREASE) FROM REDEEMABLE MUTUAL FUND SHARE TRANSACTIONS (15) 16 (1) – (160) – (76) 464 Distributions from net income – – – – – – – – Distributions from net gains – – – – – – – – Distributions from capital – – – – – – – – TOTAL DISTRIBUTIONS TO HOLDERS OF REDEEMABLE MUTUAL FUND SHARES – – – – – – – – NET INCREASE (DECREASE) IN NAV (14) 16 (1) – (150) 3 36 460 NAV AT END OF PERIOD $ 3 $ 17 $ – $ 1 $ 1 $ 151 $ 724 $ 688
309

NOTES TO FINANCIAL STATEMENTS – FUND SPECIFIC INFORMATION
Please see the generic notes at the back of the financial statements.
March 31, 2017
RBC U.S. EQUITY VALUE CLASS
General information (see note 1 in the generic notes)
The investment objective of the Fund is to provide long-term
capital growth by investing primarily in equity securities
of U.S. companies in order to provide broad exposure to
economic growth through the U.S. stock market.
Financial instrument risk and capital management (see note 4 in the generic notes)
The Fund invests in the RBC U.S. Equity Value Fund. The
Fund’s exposure to financial instrument risk is based on the
underlying mutual fund asset mix.
Concentration risk (%)
The table below summarizes the Fund’s investment portfolio
(after consideration of derivative products, if any) as at:
Investment mixMarch 31
2017March 31
2016
Information Technology 20.5 21.9Financials 14.0 16.0Health Care 12.8 11.4Industrials 11.4 11.3Consumer Discretionary 10.5 7.9Consumer Staples 7.9 10.2Energy 5.8 5.8Real Estate 2.2 –Materials 2.1 3.2Telecommunication Services 2.1 0.6Utilities 2.1 2.5Cash/Other 8.6 9.2Total 100.0 100.0
Currency risk (% of net assets)
The table below summarizes the Fund’s net exposure
(after hedging, if any) to currency risk from investments in
the underlying mutual fund as at:
CurrencyMarch 31
2017March 31
2016
United States dollar 100.0 100.0Total 100.0 100.0
As at March 31, 2017, if the Canadian dollar had strengthened
or weakened by 1% in relation to the above currencies, with
all other factors kept constant, the Fund’s net assets may
have decreased or increased, respectively, by approximately
1.0% (March 31, 2016 – 1.0%). In practice, actual results could
differ from this sensitivity analysis and the difference could
be material.
Other price risk (% impact on net assets)
The table below shows the impact of a 1% change in the
broad-based index (noted below) on the Fund’s net assets,
using a 26-month (March 31, 2016 – 14-month) historical
correlation of data of the Fund’s return and the index, with all
other factors kept constant, as at:
March 31 2017
March 31 2016
S&P 500 Total Return Index (CAD) + or - 1.0 + or - 1.0
Since historical correlation may not be representative of
future correlation, actual results could differ from this
sensitivity analysis and the difference could be material.
Fair value hierarchy ($000s except % amounts) (see note 3 in the generic notes)
The following is a summary of the inputs used as of
March 31, 2017 and 2016.
March 31, 2017 Level 1 Level 2 Level 3 Total
Equities – – – – Mutual fund units 725 – – 725Fixed-income and debt securities – – – – Short-term investments – – – – Derivatives – assets – – – – Derivatives – liabilities – – – – Total financial instruments 725 – – 725% of total portfolio 100.0 – – 100.0
March 31, 2016 Level 1 Level 2 Level 3 Total
Equities – – – – Mutual fund units 688 – – 688 Fixed-income and debt securities – – – – Short-term investments – – – – Derivatives – assets – – – – Derivatives – liabilities – – – – Total financial instruments 688 – – 688 % of total portfolio 100.0 – – 100.0
For the periods ended March 31, 2017 and 2016, there were
no transfers of financial instruments between Level 1, Level 2
and Level 3.
310

NOTES TO FINANCIAL STATEMENTS – FUND SPECIFIC INFORMATION
Please see the generic notes at the back of the financial statements.
March 31, 2017
RBC U.S. EQUITY VALUE CLASS
Management fees and operating expenses (see note 6 in the generic notes)
Management fees and administration fees of each series
of the Fund are payable to RBC GAM and calculated at the
following annual percentages, before GST/HST, of the daily
net asset value of each series of the Fund.
Management fees* Operating expenses
Series A 1.60% 0.08%Advisor Series 1.60% 0.08%Series D 0.85% 0.08%Series F 0.60% 0.08%Series O n/a† 0.02%
* Effective June 30, 2016, the management fees for Series A and Advisor Series mutual fund shares were reduced to 1.60% from 1.75%; for Series D mutual fund shares were reduced to 0.85% from 1.00%; and for Series F mutual fund shares were reduced to 0.60% from 0.75%.
† Series O shareholders pay a negotiated management fee directly to RBC GAM for investment-counselling services.
Investments by related parties ($000s except mutual fund share amounts)
Royal Bank of Canada, or one of its subsidiaries, held the
following investments in the Fund as at:
March 31 2017
March 31 2016
Mutual fund shares held Series A 100 100 Advisor Series 100 100 Series H – 100 Series D 100 100 Series F 100 100 Series I – 100 Series O 100 14 400 Value of all mutual fund shares 6 158
Underlying mutual fund ownership interest (%)
The table below summarizes the Fund’s interest in the
underlying mutual fund as a percentage of NAV, and the
Fund’s ownership interest as a percentage of the net assets of
the underlying fund (“Ownership”). The underlying fund is
established and conducts business in Canada, and has an
associate relationship to the Fund.
March 31 2017
March 31 2016
NAV Ownership NAV Ownership
RBC U.S. Equity Value Fund 100.1 1.8 100.0 1.8
Taxes ($000s) (see note 5 in the generic notes)
The Fund had no capital or non-capital losses as at
March 31, 2017.
Redeemable mutual fund shares (000s)
There is no limitation on the number of mutual fund shares
available for issue. Mutual fund shares are purchased and
redeemed at the NAV per mutual fund share.
For the periods ended March 31 (see note 2 in the generic notes) 2017 2016
Series A Opening mutual fund shares 22 4Issued number of mutual fund shares 21 18Reinvested number of mutual fund shares – –Redeemed number of mutual fund shares (18) –Ending number of mutual fund shares 25 22
Advisor SeriesOpening mutual fund shares 4 –Issued number of mutual fund shares 1 4Reinvested number of mutual fund shares – –Redeemed number of mutual fund shares (2) –Ending number of mutual fund shares 3 4
Series DOpening mutual fund shares 23 4Issued number of mutual fund shares 25 24Reinvested number of mutual fund shares – –Redeemed number of mutual fund shares (15) (5)Ending number of mutual fund shares 33 23
Series FOpening mutual fund shares 2 – Issued number of mutual fund shares – 2Reinvested number of mutual fund shares – – Redeemed number of mutual fund shares (2) – Ending number of mutual fund shares – 2
Series OOpening mutual fund shares 14 14Issued number of mutual fund shares – – Reinvested number of mutual fund shares – – Redeemed number of mutual fund shares (14) – Ending number of mutual fund shares – 14
311

SCHEDULE OF INVESTMENT PORTFOLIO (in $000s)
ANNUAL FINANCIAL STATEMENTS
March 31, 2017
The accompanying notes are an integral part of the financial statements.
PHILLIPS, HAGER & NORTH U.S. MULTI-STYLE ALL-CAP EQUITY CLASS
Number Fair % of Net of Units Security Cost Value Assets
MUTUAL FUND UNITS 1 881 431 Phillips, Hager & North U.S. Multi-Style All-Cap Equity Fund* $ 27 768 $ 33 007
TOTAL MUTUAL FUND UNITS $ 27 768 33 007 100.0OTHER NET ASSETS ATTRIBUTABLE TO HOLDERS OF REDEEMABLE SHARES 11 –NET ASSETS ATTRIBUTABLE TO HOLDERS OF REDEEMABLE SHARES $ 33 018 100.0
* Investment in related party (see note 6 in the generic notes).
312

FINANCIAL STATEMENTS
The accompanying notes are an integral part of these financial statements.
PHILLIPS, HAGER & NORTH U.S. MULTI-STYLE ALL-CAP EQUITY CLASS
Statements of Financial Position (in $000s except per mutual fund share amounts)
(see note 2 in the generic notes)March 31
2017March 31
2016
ASSETSInvestments at fair value $ 33 007 $ 38 079 Cash 61 –Due from investment dealers – 415 Subscriptions receivable – 12 TOTAL ASSETS 33 068 38 506 LIABILITIESBank overdraft – 329 Redemptions payable 20 38 Accounts payable and accrued expenses 30 40 TOTAL LIABILITIES EXCLUDING NET ASSETS ATTRIBUTABLE TO HOLDERS OF REDEEMABLE MUTUAL FUND SHARES 50 407 NET ASSETS ATTRIBUTABLE TO HOLDERS OF REDEEMABLE MUTUAL FUND SHARES (“NAV”) $ 33 018 $ 38 099
Investments at cost $ 27 768 $ 35 895
NAV SERIES A $ 7 929 $ 12 677 ADVISOR SERIES $ 183 $ 269 SERIES H $ – $ 667 SERIES D $ 15 794 $ 15 701 SERIES F $ 6 594 $ 2 613 SERIES I $ – $ 332 SERIES O $ 2 518 $ 5 840 NAV PER MUTUAL FUND SHARE SERIES A $ 21.95 $ 18.71 ADVISOR SERIES $ 21.98 $ 18.73 SERIES H $ – $ 18.87 SERIES D $ 22.98 $ 19.42 SERIES F $ 23.26 $ 19.61 SERIES I $ – $ 19.77 SERIES O $ 24.29 $ 20.33
Statements of Comprehensive Income (in $000s except per mutual fund share amounts)
For the periods ended March 31 (see note 2 in the generic notes) 2017 2016INCOME (see note 3 in the generic notes)Interest for distribution purposes $ (3) $ (2)Other income received from underlying funds 520 527 Capital gains received from underlying funds 1 140 3 424 Net realized gain (loss) on investments 1 268 681 Change in unrealized gain (loss) on investments 3 055 (4 313)TOTAL INCOME (LOSS) 5 980 317 EXPENSES (see notes – Fund Specific Information)Management fees 337 427 Administration fees 16 16 Board of Directors fees 4 4 Independent Review Committee costs 2 3 GST/HST 32 43 Expenses reimbursed by manager (3) (4)TOTAL EXPENSES 388 489 INCREASE (DECREASE) IN NAV $ 5 592 $ (172)INCREASE (DECREASE) IN NAV SERIES A $ 1 594 $ (105) ADVISOR SERIES $ 35 $ 4 SERIES H $ (3) $ (3) SERIES D $ 2 554 $ 21 SERIES F $ 812 $ 3 SERIES I $ (1) $ 2 SERIES O $ 601 $ (94)INCREASE (DECREASE) IN NAV PER MUTUAL FUND SHARE SERIES A $ 3.05 $ (0.21) ADVISOR SERIES $ 2.92 $ (0.19) SERIES H $ (0.08) $ (0.17) SERIES D $ 3.50 $ (0.06) SERIES F $ 4.12 $ – SERIES I $ (0.01) $ 0.03 SERIES O $ 3.38 $ 0.16
313

FINANCIAL STATEMENTS
The accompanying notes are an integral part of these financial statements.
Statements of Cash Flow (in $000s)
For the periods ended March 31 (see note 2 in the generic notes) 2017
2016
CASH FLOWS FROM OPERATING ACTIVITIES Increase (decrease) in NAV $ 5 592 $ (172)ADJUSTMENTS TO RECONCILE NET CASH PROVIDED BY (USED IN) OPERATIONSInterest for distribution purposes – – Net realized loss (gain) on investments (1 268) (681)Change in unrealized loss (gain) on investments (3 055) 4 313 (Increase) decrease in accrued receivables – – Increase (decrease) in accrued payables (10) (2)Cost of investments purchased (3 342) (14 642)Proceeds on sales of investments 13 152 5 876 NET CASH PROVIDED BY (USED IN) OPERATING ACTIVITIES 11 069 (5 308)CASH FLOWS FROM FINANCING ACTIVITIESProceeds from issue of redeemable mutual fund shares 7 660 14 875 Cash paid on redemption of redeemable mutual fund shares (18 339) (9 856)Distributions paid to holders of redeemable mutual fund shares – – NET CASH PROVIDED BY (USED IN) FINANCING ACTIVITIES $ (10 679) $ 5 019 Net increase (decrease) in cash for the period 390 (289)Cash (bank overdraft), beginning of period (329) (40)CASH (BANK OVERDRAFT), END OF PERIOD $ 61 $ (329)
Interest received (paid) $ (3) $ (2)Dividends received, net of withholding taxes $ – $ –
Cash consists of cash and futures contracts margin receivable/payable, as applicable.
PHILLIPS, HAGER & NORTH U.S. MULTI-STYLE ALL-CAP EQUITY CLASS
314

FINANCIAL STATEMENTS
The accompanying notes are an integral part of these financial statements.
PHILLIPS, HAGER & NORTH U.S. MULTI-STYLE ALL-CAP EQUITY CLASS
Statements of Changes in NAV (in $000s)
For the periods ended March 31 (see note 2 in the generic notes)
Series A Advisor Series Series H Series D2017 2016 2017 2016 2017 2016 2017 2016
NAV AT BEGINNING OF PERIOD $ 12 677 $ 13 369 $ 269 $ 359 $ 667 $ 842 $ 15 701 $ 14 619 INCREASE (DECREASE) IN NAV 1 594 (105) 35 4 (3) (3) 2 554 21 Early redemption fees – – – – – – – – Proceeds from redeemable mutual fund shares issued 1 273 1 565 43 168 – 265 959 3 710 Reinvestments of distributions to holders of redeemable mutual fund shares – – – – – – – – Redemption of redeemable mutual fund shares (7 615) (2 152) (164) (262) (664) (437) (3 420) (2 649)NET INCREASE (DECREASE) FROM REDEEMABLE MUTUAL FUND SHARE TRANSACTIONS (6 342) (587) (121) (94) (664) (172) (2 461) 1 061 Distributions from net income – – – – – – – – Distributions from net gains – – – – – – – – Distributions from capital – – – – – – – – TOTAL DISTRIBUTIONS TO HOLDERS OF REDEEMABLE MUTUAL FUND SHARES – – – – – – – – NET INCREASE (DECREASE) IN NAV (4 748) (692) (86) (90) (667) (175) 93 1 082 NAV AT END OF PERIOD $ 7 929 $ 12 677 $ 183 $ 269 $ – $ 667 $ 15 794 $ 15 701
For the periods ended March 31 (see note 2 in the generic notes)
Series F Series I Series O Total2017 2016 2017 2016 2017 2016 2017 2016
NAV AT BEGINNING OF PERIOD $ 2 613 $ 2 700 $ 332 $ 330 $ 5 840 $ 1 233 $ 38 099 $ 33 452 INCREASE (DECREASE) IN NAV 812 3 (1) 2 601 (94) 5 592 (172)Early redemption fees – – – – – – – – Proceeds from redeemable mutual fund shares issued 3 882 457 39 – 1 452 8 466 7 648 14 631 Reinvestments of distributions to holders of redeemable mutual fund shares – – – – – – – – Redemption of redeemable mutual fund shares (713) (547) (370) – (5 375) (3 765) (18 321) (9 812)NET INCREASE (DECREASE) FROM REDEEMABLE MUTUAL FUND SHARE TRANSACTIONS 3 169 (90) (331) – (3 923) 4 701 (10 673) 4 819 Distributions from net income – – – – – – – – Distributions from net gains – – – – – – – – Distributions from capital – – – – – – – – TOTAL DISTRIBUTIONS TO HOLDERS OF REDEEMABLE MUTUAL FUND SHARES – – – – – – – – NET INCREASE (DECREASE) IN NAV 3 981 (87) (332) 2 (3 322) 4 607 (5 081) 4 647 NAV AT END OF PERIOD $ 6 594 $ 2 613 $ – $ 332 $ 2 518 $ 5 840 $ 33 018 $ 38 099
315

NOTES TO FINANCIAL STATEMENTS – FUND SPECIFIC INFORMATION
Please see the generic notes at the back of the financial statements.
March 31, 2017
PHILLIPS, HAGER & NORTH U.S. MULTI-STYLE ALL-CAP EQUITY CLASS
General information (see note 1 in the generic notes)
The investment objective of the Fund is to provide long-term
capital growth by investing primarily in a well-diversified
portfolio of U.S. equity securities.
All outstanding Series H mutual fund shares were re-designated
as Series A mutual fund shares effective June 30, 2016. All
outstanding Series I mutual fund shares were re-designated as
Series F mutual fund shares effective June 30, 2016.
Financial instrument risk and capital management (see note 4 in the generic notes)
The Fund invests in the Phillips, Hager & North U.S.
Multi-Style All-Cap Equity Fund. The Fund’s exposure
to financial instrument risk is based on the underlying
mutual fund asset mix.
Concentration risk (%)
The table below summarizes the Fund’s investment portfolio
(after consideration of derivative products, if any) as at:
Investment mixMarch 31
2017March 31
2016
Information Technology 22.7 21.0Financials 15.2 16.8Health Care 13.7 11.6Consumer Discretionary 12.3 14.7Industrials 10.5 11.9Consumer Staples 8.2 8.0Energy 5.2 4.8Utilities 4.0 4.6Materials 2.4 3.2Real Estate 2.4 –Telecommunication Services 2.3 2.4Cash/Other 1.1 1.0Total 100.0 100.0
Currency risk (% of net assets)
The table below summarizes the Fund’s net exposure
(after hedging, if any) to currency risk from investments in
the underlying mutual fund as at:
CurrencyMarch 31
2017March 31
2016
United States dollar 100.0 100.0Total 100.0 100.0
As at March 31, 2017, if the Canadian dollar had strengthened
or weakened by 1% in relation to the above currencies, with
all other factors kept constant, the Fund’s net assets may
have decreased or increased, respectively, by approximately
1.0% (March 31, 2016 – 1.0%). In practice, actual results could
differ from this sensitivity analysis and the difference could
be material.
Other price risk (% impact on net assets)
The table below shows the impact of a 1% change in the
broad-based index (noted below) on the Fund’s net assets,
using a 36-month historical correlation of data of the Fund’s
return and the index, with all other factors kept constant, as at:
March 31 2017
March 31 2016
Russell 3000 Total Return Index (CAD) + or - 1.0 + or - 1.0
Since historical correlation may not be representative of
future correlation, actual results could differ from this
sensitivity analysis and the difference could be material.
Fair value hierarchy ($000s except % amounts) (see note 3 in the generic notes)
The following is a summary of the inputs used as of
March 31, 2017 and 2016.
March 31, 2017 Level 1 Level 2 Level 3 Total
Equities – – – – Mutual fund units 33 007 – – 33 007Fixed-income and debt securities – – – – Short-term investments – – – – Derivatives – assets – – – – Derivatives – liabilities – – – – Total financial instruments 33 007 – – 33 007% of total portfolio 100.0 – – 100.0
March 31, 2016 Level 1 Level 2 Level 3 Total
Equities – – – – Mutual fund units 38 079 – – 38 079 Fixed-income and debt securities – – – – Short-term investments – – – – Derivatives – assets – – – – Derivatives – liabilities – – – – Total financial instruments 38 079 – – 38 079 % of total portfolio 100.0 – – 100.0
For the periods ended March 31, 2017 and 2016, there were
no transfers of financial instruments between Level 1, Level 2
and Level 3.
316

NOTES TO FINANCIAL STATEMENTS – FUND SPECIFIC INFORMATION
Please see the generic notes at the back of the financial statements.
March 31, 2017
Management fees and operating expenses (see note 6 in the generic notes)
Management fees and administration fees of each series
of the Fund are payable to RBC GAM and calculated at the
following annual percentages, before GST/HST, of the daily
net asset value of each series of the Fund.
Management fees* Operating expenses
Series A 1.60% 0.05%Advisor Series 1.60% 0.05%Series H 1.60% 0.05%Series D 0.85% 0.05%Series F 0.60% 0.05%Series I 0.60% 0.05%Series O n/a† 0.02%
* Effective June 30, 2016, the management fees for Series A and Advisor Series mutual fund shares were reduced to 1.60% from 1.75%; for Series D mutual fund shares were reduced to 0.85% from 1.00%; and for Series F mutual fund shares were reduced to 0.60% from 0.75%.
† Series O shareholders pay a negotiated management fee directly to RBC GAM for investment-counselling services.
Investments by related parties ($000s except mutual fund share amounts)
Royal Bank of Canada, or one of its subsidiaries, held the
following investments in the Fund as at:
March 31 2017
March 31 2016
Mutual fund shares held Series A 151 51 Advisor Series 51 51 Series H – 99 Series D 51 51 Series F 151 51 Series I – 99 Series O 49 49Value of all mutual fund shares 10 9
Underlying mutual fund ownership interest (%)
The table below summarizes the Fund’s interest in the
underlying mutual fund as a percentage of NAV, and the
Fund’s ownership interest as a percentage of the net assets of
the underlying fund (“Ownership”). The underlying fund is
established and conducts business in Canada, and has an
associate relationship to the Fund.
March 31 2017
March 31 2016
NAV Ownership NAV Ownership
Phillips, Hager & North U.S. Multi-Style All-Cap Equity Fund 100.0 0.7 99.9 1.0
Taxes ($000s) (see note 5 in the generic notes)
The Fund had no capital or non-capital losses as at
March 31, 2017.
Redeemable mutual fund shares (000s)
There is no limitation on the number of mutual fund shares
available for issue. Mutual fund shares are purchased and
redeemed at the NAV per mutual fund share.
For the periods ended March 31 (see note 2 in the generic notes) 2017 2016
Series A Opening mutual fund shares 678 709Issued number of mutual fund shares 65 83Reinvested number of mutual fund shares – –Redeemed number of mutual fund shares (382) (114)Ending number of mutual fund shares 361 678
Advisor SeriesOpening mutual fund shares 14 19Issued number of mutual fund shares 2 9Reinvested number of mutual fund shares – –Redeemed number of mutual fund shares (8) (14)Ending number of mutual fund shares 8 14
Series HOpening mutual fund shares 35 44Issued number of mutual fund shares – 14Reinvested number of mutual fund shares – –Redeemed number of mutual fund shares (35) (23)Ending number of mutual fund shares – 35
Series DOpening mutual fund shares 809 754Issued number of mutual fund shares 44 191Reinvested number of mutual fund shares – –Redeemed number of mutual fund shares (166) (136)Ending number of mutual fund shares 687 809
Series FOpening mutual fund shares 133 138Issued number of mutual fund shares 184 23Reinvested number of mutual fund shares – –Redeemed number of mutual fund shares (33) (28)Ending number of mutual fund shares 284 133
Series IOpening mutual fund shares 17 17Issued number of mutual fund shares 2 – Reinvested number of mutual fund shares – – Redeemed number of mutual fund shares (19) – Ending number of mutual fund shares – 17
Series OOpening mutual fund shares 287 61Issued number of mutual fund shares 68 413Reinvested number of mutual fund shares – – Redeemed number of mutual fund shares (251) (187)Ending number of mutual fund shares 104 287
PHILLIPS, HAGER & NORTH U.S. MULTI-STYLE ALL-CAP EQUITY CLASS
317

SCHEDULE OF INVESTMENT PORTFOLIO (in $000s)
ANNUAL FINANCIAL STATEMENTS
March 31, 2017
The accompanying notes are an integral part of the financial statements.
RBC U.S. MID-CAP VALUE EQUITY CLASS
Number Fair % of Net of Units Security Cost Value Assets
MUTUAL FUND UNITS 389 276 RBC U.S. Mid-Cap Value Equity Fund* $ 5 564 $ 5 711
TOTAL MUTUAL FUND UNITS $ 5 564 5 711 99.8OTHER NET ASSETS ATTRIBUTABLE TO HOLDERS OF REDEEMABLE SHARES 11 0.2NET ASSETS ATTRIBUTABLE TO HOLDERS OF REDEEMABLE SHARES $ 5 722 100.0
* Investment in related party (see note 6 in the generic notes).
318

FINANCIAL STATEMENTS
The accompanying notes are an integral part of these financial statements.
RBC U.S. MID-CAP VALUE EQUITY CLASS
Statements of Financial Position (in $000s except per mutual fund share amounts)
(see note 2 in the generic notes)March 31
2017March 31
2016
ASSETSInvestments at fair value $ 5 711 $ 4 209 Due from investment dealers 25 –Subscriptions receivable 95 146 TOTAL ASSETS 5 831 4 355 LIABILITIESBank overdraft 47 –Due to investment dealers 45 110 Redemptions payable 11 –Accounts payable and accrued expenses 6 6 TOTAL LIABILITIES EXCLUDING NET ASSETS ATTRIBUTABLE TO HOLDERS OF REDEEMABLE MUTUAL FUND SHARES 109 116 NET ASSETS ATTRIBUTABLE TO HOLDERS OF REDEEMABLE MUTUAL FUND SHARES (“NAV”) $ 5 722 $ 4 239
Investments at cost $ 5 564 $ 4 838
NAV SERIES A $ 1 117 $ 564 ADVISOR SERIES $ 643 $ 336 SERIES H $ – $ 192 SERIES D $ 340 $ 129 SERIES F $ 3 621 $ 2 591 SERIES I $ – $ 426 SERIES O $ 1 $ 1 NAV PER MUTUAL FUND SHARE SERIES A $ 11.54 $ 9.78 ADVISOR SERIES $ 11.56 $ 9.79 SERIES H $ – $ 9.81 SERIES D $ 11.76 $ 9.88 SERIES F $ 11.83 $ 9.91 SERIES I $ – $ 9.93 SERIES O $ 12.08 $ 10.03
Statements of Comprehensive Income (in $000s except per mutual fund share amounts)
For the periods ended March 31 (see note 2 in the generic notes) 2017 2016INCOME (see note 3 in the generic notes)Other income received from underlying funds $ 36 $ 32 Capital gains received from underlying funds 60 658 Net realized gain (loss) on investments (68) (436)Net gain (loss) on foreign currencies and other net assets 1 –Change in unrealized gain (loss) on investments 776 (655)TOTAL INCOME (LOSS) 805 (401)EXPENSES (see notes – Fund Specific Information)Management fees 45 30 Administration fees 3 2 Board of Directors fees 1 –Independent Review Committee costs 2 3 GST/HST 5 3 Expenses reimbursed by manager (2) (3)TOTAL EXPENSES 54 35 INCREASE (DECREASE) IN NAV $ 751 $ (436)INCREASE (DECREASE) IN NAV SERIES A $ 123 $ (36) ADVISOR SERIES $ 62 $ (26) SERIES H $ (4) $ (8) SERIES D $ 31 $ (19) SERIES F $ 547 $ (201) SERIES I $ (8) $ (143) SERIES O $ – $ (3)INCREASE (DECREASE) IN NAV PER MUTUAL FUND SHARE SERIES A $ 1.75 $ (1.93) ADVISOR SERIES $ 1.70 $ (2.01) SERIES H $ (0.53) $ (1.46) SERIES D $ 1.63 $ (2.24) SERIES F $ 1.97 $ (1.22) SERIES I $ (0.17) $ (1.49) SERIES O $ 2.05 $ (3.40)
319

FINANCIAL STATEMENTS
The accompanying notes are an integral part of these financial statements.
RBC U.S. MID-CAP VALUE EQUITY CLASS
Statements of Cash Flow (in $000s)
For the periods ended March 31 (see note 2 in the generic notes) 2017
2016
CASH FLOWS FROM OPERATING ACTIVITIESIncrease (decrease) in NAV $ 751 $ (436)ADJUSTMENTS TO RECONCILE NET CASH PROVIDED BY (USED IN) OPERATIONSInterest for distribution purposes – – Net realized loss (gain) on investments 68 436 Change in unrealized loss (gain) on investments (776) 655 (Increase) decrease in accrued receivables – – Increase (decrease) in accrued payables – 4 Cost of investments purchased (2 723) (7 145)Proceeds on sales of investments 1 839 2 530 NET CASH PROVIDED BY (USED IN) OPERATING ACTIVITIES (841) (3 956)CASH FLOWS FROM FINANCING ACTIVITIESProceeds from issue of redeemable mutual fund shares 4 080 6 975 Cash paid on redemption of redeemable mutual fund shares (3 286) (3 020)Distributions paid to holders of redeemable mutual fund shares – – NET CASH PROVIDED BY (USED IN) FINANCING ACTIVITIES $ 794 $ 3 955 Net increase (decrease) in cash for the period (47) (1)Cash (bank overdraft), beginning of period – 1 CASH (BANK OVERDRAFT), END OF PERIOD $ (47) $ –
Interest received (paid) $ – $ – Dividends received, net of withholding taxes $ – $ –
Cash consists of cash and futures contracts margin receivable/payable, as applicable.
320

FINANCIAL STATEMENTS
The accompanying notes are an integral part of these financial statements.
RBC U.S. MID-CAP VALUE EQUITY CLASS
Statements of Changes in NAV (in $000s)
For the periods ended March 31 (see note 2 in the generic notes)
Series A Advisor Series Series H Series D2017 2016 2017 2016 2017 2016 2017 2016
NAV AT BEGINNING OF PERIOD $ 564 $ 43 $ 336 $ 57 $ 192 $ 1 $ 129 $ 66 INCREASE (DECREASE) IN NAV 123 (36) 62 (26) (4) (8) 31 (19)Early redemption fees – – – – – – – – Proceeds from redeemable mutual fund shares issued 633 723 483 355 – 289 413 317 Reinvestments of distributions to holders of redeemable mutual fund shares – – – – – – – – Redemption of redeemable mutual fund shares (203) (166) (238) (50) (188) (90) (233) (235)NET INCREASE (DECREASE) FROM REDEEMABLE MUTUAL FUND SHARE TRANSACTIONS 430 557 245 305 (188) 199 180 82 Distributions from net income – – – – – – – – Distributions from net gains – – – – – – – – Distributions from capital – – – – – – – – TOTAL DISTRIBUTIONS TO HOLDERS OF REDEEMABLE MUTUAL FUND SHARES – – – – – – – – NET INCREASE (DECREASE) IN NAV 553 521 307 279 (192) 191 211 63 NAV AT END OF PERIOD $ 1 117 $ 564 $ 643 $ 336 $ – $ 192 $ 340 $ 129
For the periods ended March 31 (see note 2 in the generic notes)
Series F Series I Series O Total2017 2016 2017 2016 2017 2016 2017 2016
NAV AT BEGINNING OF PERIOD $ 2 591 $ 42 $ 426 $ 212 $ 1 $ 153 $ 4 239 $ 574 INCREASE (DECREASE) IN NAV 547 (201) (8) (143) – (3) 751 (436)Early redemption fees – – – – – – – – Proceeds from redeemable mutual fund shares issued 2 275 3 904 225 1 533 – – 4 029 7 121 Reinvestments of distributions to holders of redeemable mutual fund shares – – – – – – – – Redemption of redeemable mutual fund shares (1 792) (1 154) (643) (1 176) – (149) (3 297) (3 020)NET INCREASE (DECREASE) FROM REDEEMABLE MUTUAL FUND SHARE TRANSACTIONS 483 2 750 (418) 357 – (149) 732 4 101 Distributions from net income – – – – – – – – Distributions from net gains – – – – – – – – Distributions from capital – – – – – – – – TOTAL DISTRIBUTIONS TO HOLDERS OF REDEEMABLE MUTUAL FUND SHARES – – – – – – – – NET INCREASE (DECREASE) IN NAV 1 030 2 549 (426) 214 – (152) 1 483 3 665 NAV AT END OF PERIOD $ 3 621 $ 2 591 $ – $ 426 $ 1 $ 1 $ 5 722 $ 4 239
321

NOTES TO FINANCIAL STATEMENTS – FUND SPECIFIC INFORMATION
Please see the generic notes at the back of the financial statements.
March 31, 2017
RBC U.S. MID-CAP VALUE EQUITY CLASS
General information (see note 1 in the generic notes)
The investment objective of the Fund is to provide long-term
capital growth by investing primarily in equity securities of
U.S. mid-cap companies that are deemed to be undervalued
in order to provide broad exposure to economic growth
opportunities in the equity markets.
Financial instrument risk and capital management (see note 4 in the generic notes)
The Fund invests in the RBC U.S. Mid-Cap Value Equity Fund.
The Fund’s exposure to financial instrument risk is based on
the underlying mutual fund asset mix.
Concentration risk (%)
The table below summarizes the Fund’s investment portfolio
(after consideration of derivative products, if any) as at:
Investment mixMarch 31
2017March 31
2016
Financials 17.5 29.2Consumer Discretionary 16.8 20.1Energy 15.9 6.6Information Technology 15.0 14.2Health Care 11.0 11.3Utilities 6.4 3.4Real Estate 5.6 –Materials 5.4 6.1Industrials 5.0 8.7Consumer Staples 0.5 –Cash/Other 0.9 0.4Total 100.0 100.0
Currency risk (% of net assets)
The table below summarizes the Fund’s net exposure
(after hedging, if any) to currency risk from investments in
the underlying mutual fund as at:
CurrencyMarch 31
2017March 31
2016
United States dollar 100.0 100.0Total 100.0 100.0
As at March 31, 2017, if the Canadian dollar had strengthened
or weakened by 1% in relation to the above currencies, with
all other factors kept constant, the Fund’s net assets may
have decreased or increased, respectively, by approximately
1.0% (March 31, 2016 – 1.0%). In practice, actual results could
differ from this sensitivity analysis and the difference could
be material.
Other price risk (% impact on net assets)
The table below shows the impact of a 1% change in the
broad-based index (noted below) on the Fund’s net assets,
using a 26-month (March 31, 2016 – 14-month) historical
correlation of data of the Fund’s return and the index, with all
other factors kept constant, as at:
March 31 2017
March 31 2016
Russell Midcap Value Index (CAD) + or - 1.2 + or - 1.2
Since historical correlation may not be representative of
future correlation, actual results could differ from this
sensitivity analysis and the difference could be material.
Fair value hierarchy ($000s except % amounts) (see note 3 in the generic notes)
The following is a summary of the inputs used as of
March 31, 2017 and 2016.
March 31, 2017 Level 1 Level 2 Level 3 Total
Equities – – – – Mutual fund units 5 711 – – 5 711Fixed-income and debt securities – – – – Short-term investments – – – – Derivatives – assets – – – – Derivatives – liabilities – – – – Total financial instruments 5 711 – – 5 711% of total portfolio 100.0 – – 100.0
March 31, 2016 Level 1 Level 2 Level 3 Total
Equities – – – – Mutual fund units 4 209 – – 4 209 Fixed-income and debt securities – – – – Short-term investments – – – – Derivatives – assets – – – – Derivatives – liabilities – – – – Total financial instruments 4 209 – – 4 209 % of total portfolio 100.0 – – 100.0
For the periods ended March 31, 2017 and 2016, there were
no transfers of financial instruments between Level 1, Level 2
and Level 3.
322

NOTES TO FINANCIAL STATEMENTS – FUND SPECIFIC INFORMATION
Please see the generic notes at the back of the financial statements.
March 31, 2017
RBC U.S. MID-CAP VALUE EQUITY CLASS
Management fees and operating expenses (see note 6 in the generic notes)
Management fees and administration fees of each series
of the Fund are payable to RBC GAM and calculated at the
following annual percentages, before GST/HST, of the daily
net asset value of each series of the Fund.
Management fees* Operating expenses
Series A 1.75% 0.08%Advisor Series 1.75% 0.08%Series D 1.00% 0.08%Series F 0.75% 0.08%Series O n/a† 0.02%
* Effective June 30, 2016, the management fees for Series A and Advisor Series mutual fund shares were reduced to 1.75% from 1.85%; for Series D mutual fund shares were reduced to 1.00% from 1.10%; and for Series F mutual fund shares were reduced to 0.75% from 0.85%.
† Series O shareholders pay a negotiated management fee directly to RBC GAM for investment-counselling services.
Investments by related parties ($000s except mutual fund share amounts)
Royal Bank of Canada, or one of its subsidiaries, held the
following investments in the Fund as at:
March 31 2017
March 31 2016
Mutual fund shares held Series A 100 100 Advisor Series 100 100 Series H – 100 Series D 100 100 Series F 100 100 Series I – 100 Series O 100 100Value of all mutual fund shares 6 7
Underlying mutual fund ownership interest (%)
The table below summarizes the Fund’s interest in the
underlying mutual fund as a percentage of NAV, and the
Fund’s ownership interest as a percentage of the net assets of
the underlying fund (“Ownership”). The underlying fund is
established and conducts business in Canada, and has an
associate relationship to the Fund.
March 31 2017
March 31 2016
NAV Ownership NAV Ownership
RBC U.S. Mid-Cap Value Equity Fund 99.8 0.9 99.3 0.9
Taxes ($000s) (see note 5 in the generic notes)
The Fund had no capital or non-capital losses as at
March 31, 2017.
Redeemable mutual fund shares (000s)
There is no limitation on the number of mutual fund shares
available for issue. Mutual fund shares are purchased and
redeemed at the NAV per mutual fund share.
For the periods ended March 31 (see note 2 in the generic notes) 2017 2016
Series A Opening mutual fund shares 58 4Issued number of mutual fund shares 58 70Reinvested number of mutual fund shares – – Redeemed number of mutual fund shares (19) (16)Ending number of mutual fund shares 97 58
Advisor SeriesOpening mutual fund shares 34 5Issued number of mutual fund shares 43 34Reinvested number of mutual fund shares – – Redeemed number of mutual fund shares (21) (5)Ending number of mutual fund shares 56 34
Series DOpening mutual fund shares 13 6Issued number of mutual fund shares 37 30Reinvested number of mutual fund shares – – Redeemed number of mutual fund shares (21) (23)Ending number of mutual fund shares 29 13
Series FOpening mutual fund shares 261 4Issued number of mutual fund shares 207 375Reinvested number of mutual fund shares – – Redeemed number of mutual fund shares (162) (118)Ending number of mutual fund shares 306 261
Series OOpening mutual fund shares – 14Issued number of mutual fund shares – – Reinvested number of mutual fund shares – – Redeemed number of mutual fund shares – (14)Ending number of mutual fund shares – –
323

SCHEDULE OF INVESTMENT PORTFOLIO (in $000s)
ANNUAL FINANCIAL STATEMENTS
March 31, 2017
The accompanying notes are an integral part of the financial statements.
RBC U.S. SMALL-CAP CORE EQUITY CLASS
Number Fair % of Net of Units Security Cost Value Assets
MUTUAL FUND UNITS 91 994 RBC U.S. Small-Cap Core Equity Fund* $ 1 946 $ 2 027
TOTAL MUTUAL FUND UNITS $ 1 946 2 027 103.7OTHER NET ASSETS (LIABILITIES) ATTRIBUTABLE TO HOLDERS OF REDEEMABLE SHARES (72) (3.7)NET ASSETS ATTRIBUTABLE TO HOLDERS OF REDEEMABLE SHARES $ 1 955 100.0
* Investment in related party (see note 6 in the generic notes).
324
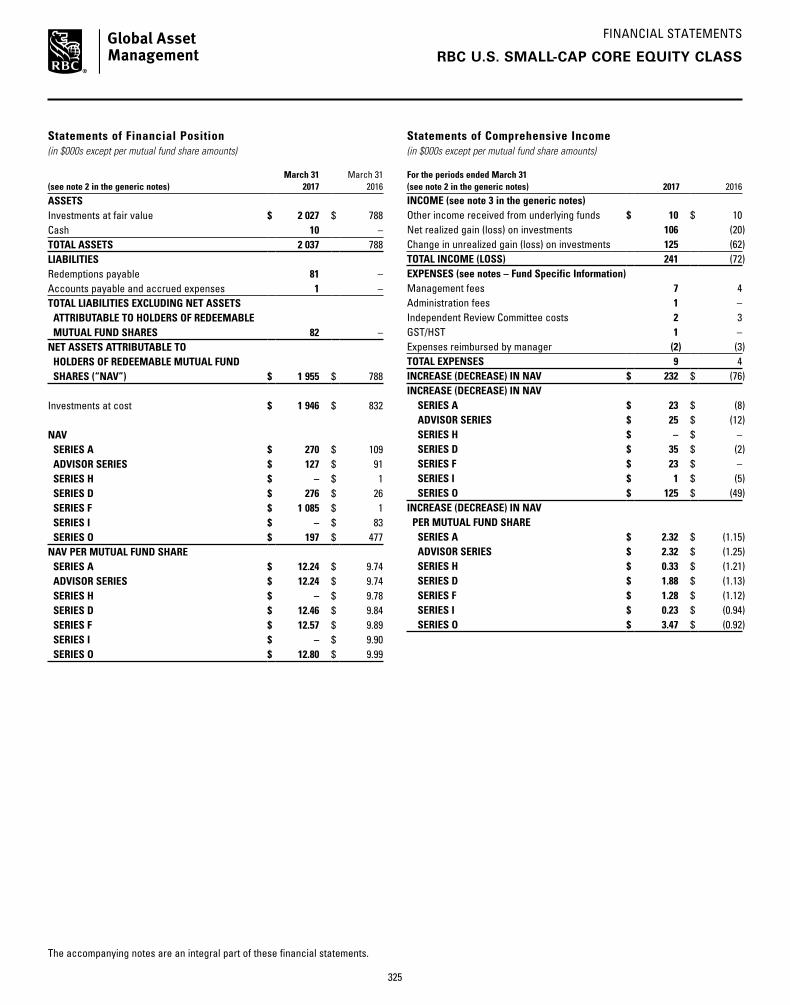
FINANCIAL STATEMENTS
The accompanying notes are an integral part of these financial statements.
RBC U.S. SMALL-CAP CORE EQUITY CLASS
Statements of Financial Position (in $000s except per mutual fund share amounts)
(see note 2 in the generic notes)March 31
2017March 31
2016
ASSETSInvestments at fair value $ 2 027 $ 788 Cash 10 –TOTAL ASSETS 2 037 788 LIABILITIESRedemptions payable 81 –Accounts payable and accrued expenses 1 – TOTAL LIABILITIES EXCLUDING NET ASSETS ATTRIBUTABLE TO HOLDERS OF REDEEMABLE MUTUAL FUND SHARES 82 – NET ASSETS ATTRIBUTABLE TO HOLDERS OF REDEEMABLE MUTUAL FUND SHARES (“NAV”) $ 1 955 $ 788
Investments at cost $ 1 946 $ 832
NAV SERIES A $ 270 $ 109 ADVISOR SERIES $ 127 $ 91 SERIES H $ – $ 1 SERIES D $ 276 $ 26 SERIES F $ 1 085 $ 1 SERIES I $ – $ 83 SERIES O $ 197 $ 477 NAV PER MUTUAL FUND SHARE SERIES A $ 12.24 $ 9.74 ADVISOR SERIES $ 12.24 $ 9.74 SERIES H $ – $ 9.78 SERIES D $ 12.46 $ 9.84 SERIES F $ 12.57 $ 9.89 SERIES I $ – $ 9.90 SERIES O $ 12.80 $ 9.99
Statements of Comprehensive Income (in $000s except per mutual fund share amounts)
For the periods ended March 31 (see note 2 in the generic notes) 2017 2016INCOME (see note 3 in the generic notes)Other income received from underlying funds $ 10 $ 10 Net realized gain (loss) on investments 106 (20)Change in unrealized gain (loss) on investments 125 (62)TOTAL INCOME (LOSS) 241 (72)EXPENSES (see notes – Fund Specific Information)Management fees 7 4 Administration fees 1 –Independent Review Committee costs 2 3 GST/HST 1 –Expenses reimbursed by manager (2) (3)TOTAL EXPENSES 9 4 INCREASE (DECREASE) IN NAV $ 232 $ (76)INCREASE (DECREASE) IN NAV SERIES A $ 23 $ (8) ADVISOR SERIES $ 25 $ (12) SERIES H $ – $ – SERIES D $ 35 $ (2) SERIES F $ 23 $ – SERIES I $ 1 $ (5) SERIES O $ 125 $ (49)INCREASE (DECREASE) IN NAV PER MUTUAL FUND SHARE SERIES A $ 2.32 $ (1.15) ADVISOR SERIES $ 2.32 $ (1.25) SERIES H $ 0.33 $ (1.21) SERIES D $ 1.88 $ (1.13) SERIES F $ 1.28 $ (1.12) SERIES I $ 0.23 $ (0.94) SERIES O $ 3.47 $ (0.92)
325

FINANCIAL STATEMENTS
The accompanying notes are an integral part of these financial statements.
RBC U.S. SMALL-CAP CORE EQUITY CLASS
Statements of Cash Flow (in $000s)
For the periods ended March 31 (see note 2 in the generic notes) 2017
2016
CASH FLOWS FROM OPERATING ACTIVITIESIncrease (decrease) in NAV $ 232 $ (76)ADJUSTMENTS TO RECONCILE NET CASH PROVIDED BY (USED IN) OPERATIONSInterest for distribution purposes – – Net realized loss (gain) on investments (106) 20 Change in unrealized loss (gain) on investments (125) 62 (Increase) decrease in accrued receivables – – Increase (decrease) in accrued payables 1 – Cost of investments purchased (2 181) (878)Proceeds on sales of investments 1 173 326 NET CASH PROVIDED BY (USED IN) OPERATING ACTIVITIES (1 006) (546)CASH FLOWS FROM FINANCING ACTIVITIESProceeds from issue of redeemable mutual fund shares 2 424 949 Cash paid on redemption of redeemable mutual fund shares (1 408) (403)Distributions paid to holders of redeemable mutual fund shares – – NET CASH PROVIDED BY (USED IN) FINANCING ACTIVITIES $ 1 016 $ 546 Net increase (decrease) in cash for the period 10 – Cash (bank overdraft), beginning of period – – CASH (BANK OVERDRAFT), END OF PERIOD $ 10 $ –
Interest received (paid) $ – $ – Dividends received, net of withholding taxes $ – $ –
Cash consists of cash and futures contracts margin receivable/payable, as applicable.
326

FINANCIAL STATEMENTS
The accompanying notes are an integral part of these financial statements.
RBC U.S. SMALL-CAP CORE EQUITY CLASS
Statements of Changes in NAV (in $000s)
For the periods ended March 31 (see note 2 in the generic notes)
Series A Advisor Series Series H Series D2017 2016 2017 2016 2017 2016 2017 2016
NAV AT BEGINNING OF PERIOD $ 109 $ 7 $ 91 $ 74 $ 1 $ 1 $ 26 $ 20 INCREASE (DECREASE) IN NAV 23 (8) 25 (12) – – 35 (2)Early redemption fees – – – – – – – – Proceeds from redeemable mutual fund shares issued 271 128 70 64 – – 775 92 Reinvestments of distributions to holders of redeemable mutual fund shares – – – – – – – – Redemption of redeemable mutual fund shares (133) (18) (59) (35) (1) – (560) (84)NET INCREASE (DECREASE) FROM REDEEMABLE MUTUAL FUND SHARE TRANSACTIONS 138 110 11 29 (1) – 215 8 Distributions from net income – – – – – – – – Distributions from net gains – – – – – – – – Distributions from capital – – – – – – – – TOTAL DISTRIBUTIONS TO HOLDERS OF REDEEMABLE MUTUAL FUND SHARES – – – – – – – – NET INCREASE (DECREASE) IN NAV 161 102 36 17 (1) – 250 6 NAV AT END OF PERIOD $ 270 $ 109 $ 127 $ 91 $ – $ 1 $ 276 $ 26
For the periods ended March 31 (see note 2 in the generic notes)
Series F Series I Series O Total2017 2016 2017 2016 2017 2016 2017 2016
NAV AT BEGINNING OF PERIOD $ 1 $ 1 $ 83 $ 1 $ 477 $ 214 $ 788 $ 318 INCREASE (DECREASE) IN NAV 23 – 1 (5) 125 (49) 232 (76)Early redemption fees – – – – – – – – Proceeds from redeemable mutual fund shares issued 1 233 – – 87 75 578 2 424 949 Reinvestments of distributions to holders of redeemable mutual fund shares – – – – – – – – Redemption of redeemable mutual fund shares (172) – (84) – (480) (266) (1 489) (403)NET INCREASE (DECREASE) FROM REDEEMABLE MUTUAL FUND SHARE TRANSACTIONS 1 061 – (84) 87 (405) 312 935 546 Distributions from net income – – – – – – – – Distributions from net gains – – – – – – – – Distributions from capital – – – – – – – – TOTAL DISTRIBUTIONS TO HOLDERS OF REDEEMABLE MUTUAL FUND SHARES – – – – – – – – NET INCREASE (DECREASE) IN NAV 1 084 – (83) 82 (280) 263 1 167 470 NAV AT END OF PERIOD $ 1 085 $ 1 $ – $ 83 $ 197 $ 477 $ 1 955 $ 788
327

NOTES TO FINANCIAL STATEMENTS – FUND SPECIFIC INFORMATION
Please see the generic notes at the back of the financial statements.
March 31, 2017
RBC U.S. SMALL-CAP CORE EQUITY CLASS
General information (see note 1 in the generic notes)
The investment objective of the Fund is to provide long-term
capital growth by investing primarily in equity securities of
U.S. small-cap companies in order to provide broad exposure
to economic growth opportunities in the equity markets.
Financial instrument risk and capital management (see note 4 in the generic notes)
The Fund invests in the RBC U.S. Small-Cap Core Equity Fund.
The Fund’s exposure to financial instrument risk is based on
the underlying mutual fund asset mix.
Concentration risk (%)
The table below summarizes the Fund’s investment portfolio
(after consideration of derivative products, if any) as at:
Investment mixMarch 31
2017March 31
2016
Industrials 25.3 24.7Financials 21.9 18.8Consumer Discretionary 16.7 22.4Information Technology 13.1 14.6Health Care 6.6 7.6Materials 4.8 4.5Energy 3.6 3.3Real Estate 2.2 –Utilities 1.1 1.5Telecommunication Services 0.8 –Consumer Staples 0.4 0.5Cash/Other 3.5 2.1Total 100.0 100.0
Currency risk (% of net assets)
The table below summarizes the Fund’s net exposure
(after hedging, if any) to currency risk from investments in
the underlying mutual fund as at:
CurrencyMarch 31
2017March 31
2016
United States dollar 99.8 100.0Total 99.8 100.0
As at March 31, 2017, if the Canadian dollar had strengthened
or weakened by 1% in relation to the above currencies, with
all other factors kept constant, the Fund’s net assets may
have decreased or increased, respectively, by approximately
1.0% (March 31, 2016 – 1.0%). In practice, actual results could
differ from this sensitivity analysis and the difference could
be material.
Other price risk (% impact on net assets)
The table below shows the impact of a 1% change in the
broad-based index (noted below) on the Fund’s net assets,
using a 26-month (March 31, 2016 – 14-month) historical
correlation of data of the Fund’s return and the index, with all
other factors kept constant, as at:
March 31 2017
March 31 2016
Russell 2000 Total Return Index (CAD) + or - 0.9 + or - 0.9
Since historical correlation may not be representative of
future correlation, actual results could differ from this
sensitivity analysis and the difference could be material.
Fair value hierarchy ($000s except % amounts) (see note 3 in the generic notes)
The following is a summary of the inputs used as of
March 31, 2017 and 2016.
March 31, 2017 Level 1 Level 2 Level 3 Total
Equities – – – – Mutual fund units 2 027 – – 2 027Fixed-income and debt securities – – – – Short-term investments – – – – Derivatives – assets – – – – Derivatives – liabilities – – – – Total financial instruments 2 027 – – 2 027% of total portfolio 100.0 – – 100.0
March 31, 2016 Level 1 Level 2 Level 3 Total
Equities – – – – Mutual fund units 788 – – 788 Fixed-income and debt securities – – – – Short-term investments – – – – Derivatives – assets – – – – Derivatives – liabilities – – – – Total financial instruments 788 – – 788 % of total portfolio 100.0 – – 100.0
For the periods ended March 31, 2017 and 2016, there were
no transfers of financial instruments between Level 1, Level 2
and Level 3.
328
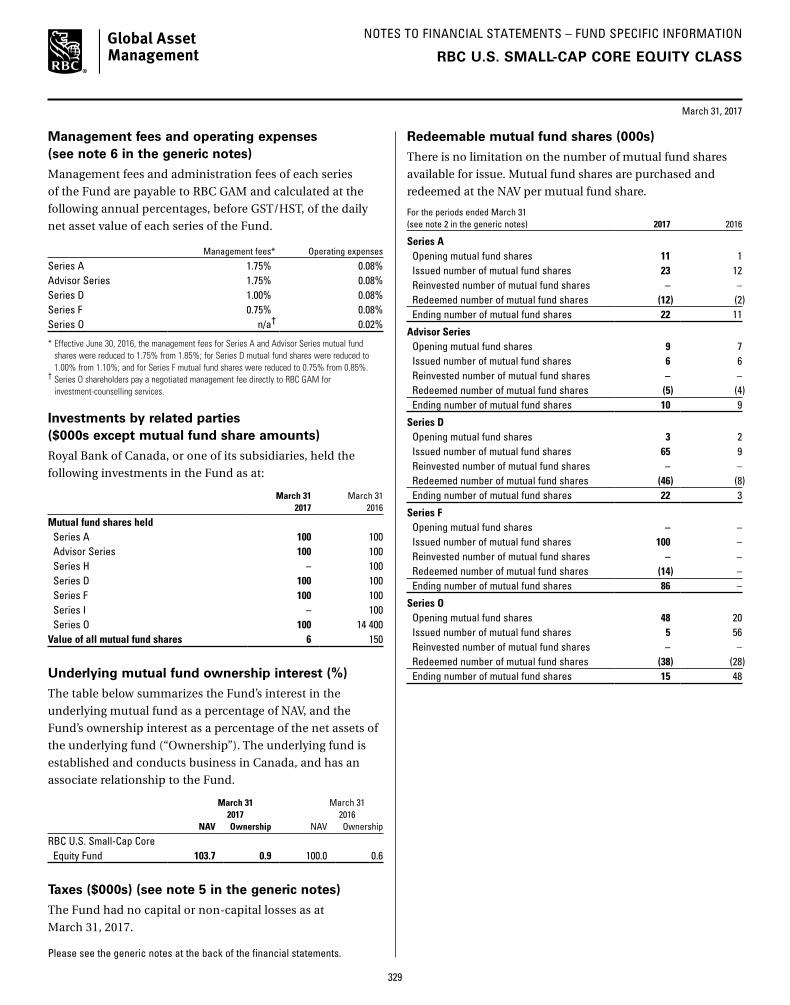
NOTES TO FINANCIAL STATEMENTS – FUND SPECIFIC INFORMATION
Please see the generic notes at the back of the financial statements.
March 31, 2017
RBC U.S. SMALL-CAP CORE EQUITY CLASS
Management fees and operating expenses (see note 6 in the generic notes)
Management fees and administration fees of each series
of the Fund are payable to RBC GAM and calculated at the
following annual percentages, before GST/HST, of the daily
net asset value of each series of the Fund.
Management fees* Operating expenses
Series A 1.75% 0.08%Advisor Series 1.75% 0.08%Series D 1.00% 0.08%Series F 0.75% 0.08%Series O n/a† 0.02%
* Effective June 30, 2016, the management fees for Series A and Advisor Series mutual fund shares were reduced to 1.75% from 1.85%; for Series D mutual fund shares were reduced to 1.00% from 1.10%; and for Series F mutual fund shares were reduced to 0.75% from 0.85%.
† Series O shareholders pay a negotiated management fee directly to RBC GAM for investment-counselling services.
Investments by related parties ($000s except mutual fund share amounts)
Royal Bank of Canada, or one of its subsidiaries, held the
following investments in the Fund as at:
March 31 2017
March 31 2016
Mutual fund shares held Series A 100 100 Advisor Series 100 100 Series H – 100 Series D 100 100 Series F 100 100 Series I – 100 Series O 100 14 400 Value of all mutual fund shares 6 150
Underlying mutual fund ownership interest (%)
The table below summarizes the Fund’s interest in the
underlying mutual fund as a percentage of NAV, and the
Fund’s ownership interest as a percentage of the net assets of
the underlying fund (“Ownership”). The underlying fund is
established and conducts business in Canada, and has an
associate relationship to the Fund.
March 31 2017
March 31 2016
NAV Ownership NAV Ownership
RBC U.S. Small-Cap Core Equity Fund 103.7 0.9 100.0 0.6
Taxes ($000s) (see note 5 in the generic notes)
The Fund had no capital or non-capital losses as at
March 31, 2017.
Redeemable mutual fund shares (000s)
There is no limitation on the number of mutual fund shares
available for issue. Mutual fund shares are purchased and
redeemed at the NAV per mutual fund share.
For the periods ended March 31 (see note 2 in the generic notes) 2017 2016
Series A Opening mutual fund shares 11 1Issued number of mutual fund shares 23 12Reinvested number of mutual fund shares – – Redeemed number of mutual fund shares (12) (2)Ending number of mutual fund shares 22 11
Advisor SeriesOpening mutual fund shares 9 7Issued number of mutual fund shares 6 6Reinvested number of mutual fund shares – – Redeemed number of mutual fund shares (5) (4)Ending number of mutual fund shares 10 9
Series DOpening mutual fund shares 3 2Issued number of mutual fund shares 65 9Reinvested number of mutual fund shares – – Redeemed number of mutual fund shares (46) (8)Ending number of mutual fund shares 22 3
Series FOpening mutual fund shares – – Issued number of mutual fund shares 100 – Reinvested number of mutual fund shares – – Redeemed number of mutual fund shares (14) – Ending number of mutual fund shares 86 –
Series OOpening mutual fund shares 48 20Issued number of mutual fund shares 5 56Reinvested number of mutual fund shares – – Redeemed number of mutual fund shares (38) (28)Ending number of mutual fund shares 15 48
329

SCHEDULE OF INVESTMENT PORTFOLIO (in $000s)
ANNUAL FINANCIAL STATEMENTS
March 31, 2017
The accompanying notes are an integral part of the financial statements.
RBC INTERNATIONAL EQUITY CLASS
Number Fair % of Net of Units Security Cost Value Assets
MUTUAL FUND UNITS 235 506 RBC International Equity Fund* $ 4 705 $ 4 864
TOTAL MUTUAL FUND UNITS $ 4 705 4 864 100.0OTHER NET ASSETS ATTRIBUTABLE TO HOLDERS OF REDEEMABLE SHARES 1 –NET ASSETS ATTRIBUTABLE TO HOLDERS OF REDEEMABLE SHARES $ 4 865 100.0
* Investment in related party (see note 6 in the generic notes).
330
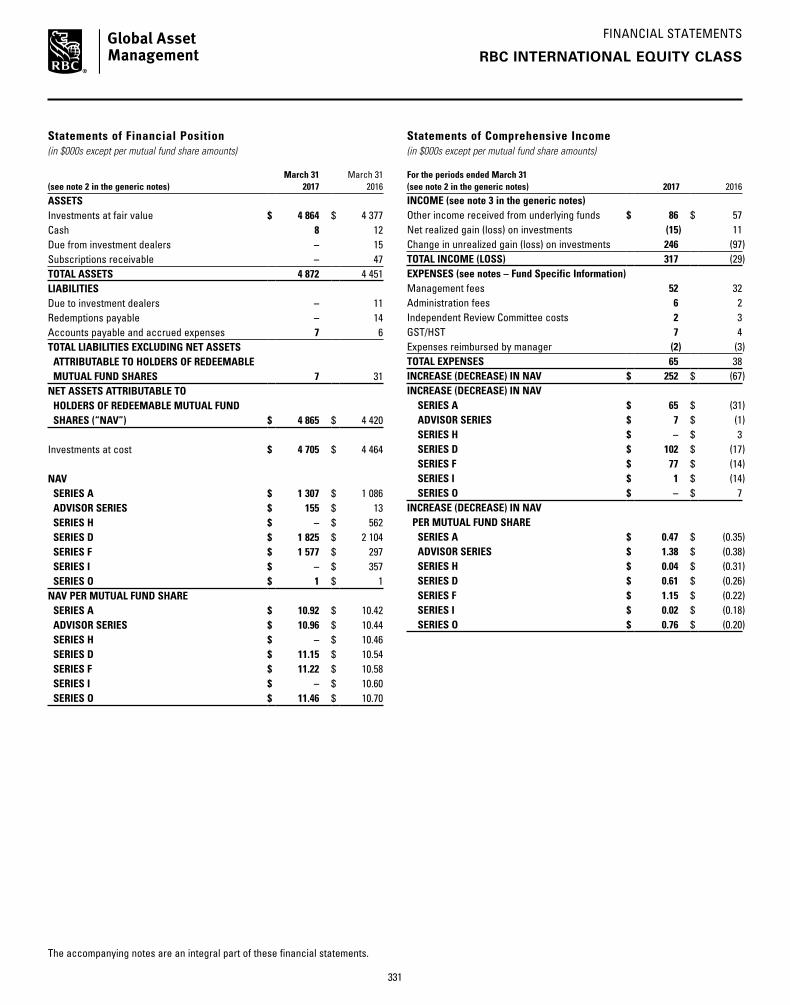
FINANCIAL STATEMENTS
The accompanying notes are an integral part of these financial statements.
RBC INTERNATIONAL EQUITY CLASS
Statements of Financial Position (in $000s except per mutual fund share amounts)
(see note 2 in the generic notes)March 31
2017March 31
2016
ASSETSInvestments at fair value $ 4 864 $ 4 377 Cash 8 12 Due from investment dealers – 15 Subscriptions receivable – 47 TOTAL ASSETS 4 872 4 451 LIABILITIESDue to investment dealers – 11 Redemptions payable – 14 Accounts payable and accrued expenses 7 6 TOTAL LIABILITIES EXCLUDING NET ASSETS ATTRIBUTABLE TO HOLDERS OF REDEEMABLE MUTUAL FUND SHARES 7 31 NET ASSETS ATTRIBUTABLE TO HOLDERS OF REDEEMABLE MUTUAL FUND SHARES (“NAV”) $ 4 865 $ 4 420
Investments at cost $ 4 705 $ 4 464
NAV SERIES A $ 1 307 $ 1 086 ADVISOR SERIES $ 155 $ 13 SERIES H $ – $ 562 SERIES D $ 1 825 $ 2 104 SERIES F $ 1 577 $ 297 SERIES I $ – $ 357 SERIES O $ 1 $ 1 NAV PER MUTUAL FUND SHARE SERIES A $ 10.92 $ 10.42 ADVISOR SERIES $ 10.96 $ 10.44 SERIES H $ – $ 10.46 SERIES D $ 11.15 $ 10.54 SERIES F $ 11.22 $ 10.58 SERIES I $ – $ 10.60 SERIES O $ 11.46 $ 10.70
Statements of Comprehensive Income (in $000s except per mutual fund share amounts)
For the periods ended March 31 (see note 2 in the generic notes) 2017 2016INCOME (see note 3 in the generic notes)Other income received from underlying funds $ 86 $ 57 Net realized gain (loss) on investments (15) 11 Change in unrealized gain (loss) on investments 246 (97)TOTAL INCOME (LOSS) 317 (29)EXPENSES (see notes – Fund Specific Information)Management fees 52 32 Administration fees 6 2 Independent Review Committee costs 2 3 GST/HST 7 4 Expenses reimbursed by manager (2) (3)TOTAL EXPENSES 65 38 INCREASE (DECREASE) IN NAV $ 252 $ (67)INCREASE (DECREASE) IN NAV SERIES A $ 65 $ (31) ADVISOR SERIES $ 7 $ (1) SERIES H $ – $ 3 SERIES D $ 102 $ (17) SERIES F $ 77 $ (14) SERIES I $ 1 $ (14) SERIES O $ – $ 7 INCREASE (DECREASE) IN NAV PER MUTUAL FUND SHARE SERIES A $ 0.47 $ (0.35) ADVISOR SERIES $ 1.38 $ (0.38) SERIES H $ 0.04 $ (0.31) SERIES D $ 0.61 $ (0.26) SERIES F $ 1.15 $ (0.22) SERIES I $ 0.02 $ (0.18) SERIES O $ 0.76 $ (0.20)
331

FINANCIAL STATEMENTS
The accompanying notes are an integral part of these financial statements.
RBC INTERNATIONAL EQUITY CLASS
Statements of Cash Flow (in $000s)
For the periods ended March 31 (see note 2 in the generic notes) 2017
2016
CASH FLOWS FROM OPERATING ACTIVITIESIncrease (decrease) in NAV $ 252 $ (67)ADJUSTMENTS TO RECONCILE NET CASH PROVIDED BY (USED IN) OPERATIONSInterest for distribution purposes – – Net realized loss (gain) on investments 15 (11)Change in unrealized loss (gain) on investments (246) 97 (Increase) decrease in accrued receivables – – Increase (decrease) in accrued payables 1 4 Cost of investments purchased (1 749) (4 261)Proceeds on sales of investments 1 497 493 NET CASH PROVIDED BY (USED IN) OPERATING ACTIVITIES (230) (3 745)CASH FLOWS FROM FINANCING ACTIVITIESProceeds from issue of redeemable mutual fund shares 3 104 4 377 Cash paid on redemption of redeemable mutual fund shares (2 878) (620)Distributions paid to holders of redeemable mutual fund shares – – NET CASH PROVIDED BY (USED IN) FINANCING ACTIVITIES $ 226 $ 3 757 Net increase (decrease) in cash for the period (4) 12 Cash (bank overdraft), beginning of period 12 – CASH (BANK OVERDRAFT), END OF PERIOD $ 8 $ 12
Interest received (paid) $ – $ – Dividends received, net of withholding taxes $ – $ –
Cash consists of cash and futures contracts margin receivable/payable, as applicable.
332

FINANCIAL STATEMENTS
The accompanying notes are an integral part of these financial statements.
RBC INTERNATIONAL EQUITY CLASS
Statements of Changes in NAV (in $000s)
For the periods ended March 31 (see note 2 in the generic notes)
Series A Advisor Series Series H Series D2017 2016 2017 2016 2017 2016 2017 2016
NAV AT BEGINNING OF PERIOD $ 1 086 $ 188 $ 13 $ 3 $ 562 $ 1 $ 2 104 $ 363 INCREASE (DECREASE) IN NAV 65 (31) 7 (1) – 3 102 (17)Early redemption fees – – – – – – – – Proceeds from redeemable mutual fund shares issued 1 033 1 198 161 26 – 558 177 1 939 Reinvestments of distributions to holders of redeemable mutual fund shares – – – – – – – – Redemption of redeemable mutual fund shares (877) (269) (26) (15) (562) – (558) (181)NET INCREASE (DECREASE) FROM REDEEMABLE MUTUAL FUND SHARE TRANSACTIONS 156 929 135 11 (562) 558 (381) 1 758 Distributions from net income – – – – – – – – Distributions from net gains – – – – – – – – Distributions from capital – – – – – – – – TOTAL DISTRIBUTIONS TO HOLDERS OF REDEEMABLE MUTUAL FUND SHARES – – – – – – – – NET INCREASE (DECREASE) IN NAV 221 898 142 10 (562) 561 (279) 1 741 NAV AT END OF PERIOD $ 1 307 $ 1 086 $ 155 $ 13 $ – $ 562 $ 1 825 $ 2 104
For the periods ended March 31 (see note 2 in the generic notes)
Series F Series I Series O Total2017 2016 2017 2016 2017 2016 2017 2016
NAV AT BEGINNING OF PERIOD $ 297 $ 49 $ 357 $ 1 $ 1 $ 150 $ 4 420 $ 755 INCREASE (DECREASE) IN NAV 77 (14) 1 (14) – 7 252 (67)Early redemption fees – – – – – – – – Proceeds from redeemable mutual fund shares issued 1 686 275 – 370 – – 3 057 4 366 Reinvestments of distributions to holders of redeemable mutual fund shares – – – – – – – – Redemption of redeemable mutual fund shares (483) (13) (358) – – (156) (2 864) (634)NET INCREASE (DECREASE) FROM REDEEMABLE MUTUAL FUND SHARE TRANSACTIONS 1 203 262 (358) 370 – (156) 193 3 732 Distributions from net income – – – – – – – – Distributions from net gains – – – – – – – – Distributions from capital – – – – – – – – TOTAL DISTRIBUTIONS TO HOLDERS OF REDEEMABLE MUTUAL FUND SHARES – – – – – – – – NET INCREASE (DECREASE) IN NAV 1 280 248 (357) 356 – (149) 445 3 665 NAV AT END OF PERIOD $ 1 577 $ 297 $ – $ 357 $ 1 $ 1 $ 4 865 $ 4 420
333
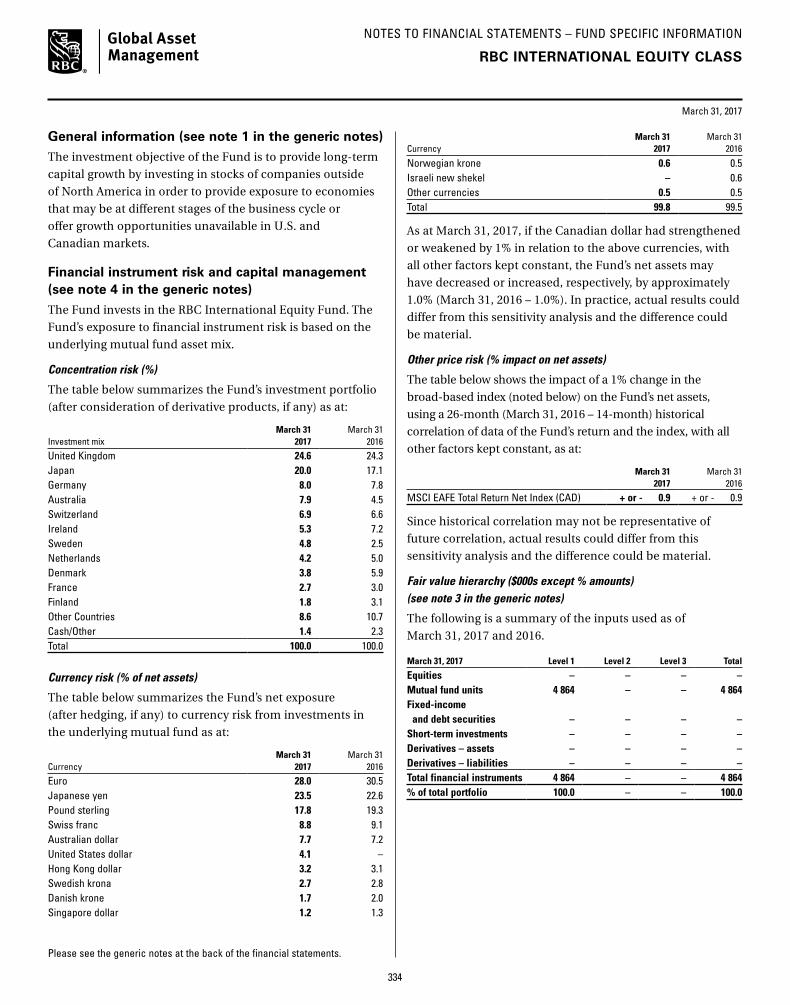
NOTES TO FINANCIAL STATEMENTS – FUND SPECIFIC INFORMATION
Please see the generic notes at the back of the financial statements.
March 31, 2017
RBC INTERNATIONAL EQUITY CLASS
General information (see note 1 in the generic notes)
The investment objective of the Fund is to provide long-term
capital growth by investing in stocks of companies outside
of North America in order to provide exposure to economies
that may be at different stages of the business cycle or
offer growth opportunities unavailable in U.S. and
Canadian markets.
Financial instrument risk and capital management (see note 4 in the generic notes)
The Fund invests in the RBC International Equity Fund. The
Fund’s exposure to financial instrument risk is based on the
underlying mutual fund asset mix.
Concentration risk (%)
The table below summarizes the Fund’s investment portfolio
(after consideration of derivative products, if any) as at:
Investment mixMarch 31
2017March 31
2016
United Kingdom 24.6 24.3Japan 20.0 17.1Germany 8.0 7.8Australia 7.9 4.5Switzerland 6.9 6.6Ireland 5.3 7.2Sweden 4.8 2.5Netherlands 4.2 5.0Denmark 3.8 5.9France 2.7 3.0Finland 1.8 3.1Other Countries 8.6 10.7Cash/Other 1.4 2.3Total 100.0 100.0
Currency risk (% of net assets)
The table below summarizes the Fund’s net exposure
(after hedging, if any) to currency risk from investments in
the underlying mutual fund as at:
CurrencyMarch 31
2017March 31
2016
Euro 28.0 30.5Japanese yen 23.5 22.6Pound sterling 17.8 19.3Swiss franc 8.8 9.1Australian dollar 7.7 7.2United States dollar 4.1 –Hong Kong dollar 3.2 3.1Swedish krona 2.7 2.8Danish krone 1.7 2.0Singapore dollar 1.2 1.3
CurrencyMarch 31
2017March 31
2016
Norwegian krone 0.6 0.5Israeli new shekel – 0.6Other currencies 0.5 0.5Total 99.8 99.5
As at March 31, 2017, if the Canadian dollar had strengthened
or weakened by 1% in relation to the above currencies, with
all other factors kept constant, the Fund’s net assets may
have decreased or increased, respectively, by approximately
1.0% (March 31, 2016 – 1.0%). In practice, actual results could
differ from this sensitivity analysis and the difference could
be material.
Other price risk (% impact on net assets)
The table below shows the impact of a 1% change in the
broad-based index (noted below) on the Fund’s net assets,
using a 26-month (March 31, 2016 – 14-month) historical
correlation of data of the Fund’s return and the index, with all
other factors kept constant, as at:
March 31 2017
March 31 2016
MSCI EAFE Total Return Net Index (CAD) + or - 0.9 + or - 0.9
Since historical correlation may not be representative of
future correlation, actual results could differ from this
sensitivity analysis and the difference could be material.
Fair value hierarchy ($000s except % amounts) (see note 3 in the generic notes)
The following is a summary of the inputs used as of
March 31, 2017 and 2016.
March 31, 2017 Level 1 Level 2 Level 3 Total
Equities – – – – Mutual fund units 4 864 – – 4 864Fixed-income and debt securities – – – – Short-term investments – – – – Derivatives – assets – – – – Derivatives – liabilities – – – – Total financial instruments 4 864 – – 4 864% of total portfolio 100.0 – – 100.0
334

NOTES TO FINANCIAL STATEMENTS – FUND SPECIFIC INFORMATION
Please see the generic notes at the back of the financial statements.
March 31, 2017
March 31, 2016 Level 1 Level 2 Level 3 Total
Equities – – – – Mutual fund units 4 377 – – 4 377 Fixed-income and debt securities – – – – Short-term investments – – – – Derivatives – assets – – – – Derivatives – liabilities – – – – Total financial instruments 4 377 – – 4 377% of total portfolio 100.0 – – 100.0
For the periods ended March 31, 2017 and 2016, there were
no transfers of financial instruments between Level 1, Level 2
and Level 3.
Management fees and operating expenses (see note 6 in the generic notes)
Management fees and administration fees of each series
of the Fund are payable to RBC GAM and calculated at the
following annual percentages, before GST/HST, of the daily
net asset value of each series of the Fund.
Management fees* Operating expenses
Series A 1.75% 0.13%Advisor Series 1.75% 0.13%Series D 1.00% 0.13%Series F 0.75% 0.13%Series O n/a† 0.02%
* Effective June 30, 2016, the management fees for Series A and Advisor Series mutual fund shares were reduced to 1.75% from 1.85%.
† Series O shareholders pay a negotiated management fee directly to RBC GAM for investment-counselling services.
Investments by related parties ($000s except mutual fund share amounts)
Royal Bank of Canada, or one of its subsidiaries, held the
following investments in the Fund as at:
March 31 2017
March 31 2016
Mutual fund shares held Series A 100 100 Advisor Series 100 100 Series H – 100 Series D 100 100 Series F 100 100 Series I – 100 Series O 100 100Value of all mutual fund shares 6 7
Underlying mutual fund ownership interest (%)
The table below summarizes the Fund’s interest in the
underlying mutual fund as a percentage of NAV, and the
Fund’s ownership interest as a percentage of the net assets of
the underlying fund (“Ownership”). The underlying fund is
established and conducts business in Canada, and has an
associate relationship to the Fund.
March 31 2017
March 31 2016
NAV Ownership NAV Ownership
RBC International Equity Fund 100.0 0.5 99.0 0.6
Taxes ($000s) (see note 5 in the generic notes)
The Fund had no capital or non-capital losses as at
March 31, 2017.
Redeemable mutual fund shares (000s)
There is no limitation on the number of mutual fund shares
available for issue. Mutual fund shares are purchased and
redeemed at the NAV per mutual fund share.
For the periods ended March 31 (see note 2 in the generic notes) 2017 2016
Series A Opening mutual fund shares 104 18Issued number of mutual fund shares 100 111Reinvested number of mutual fund shares – – Redeemed number of mutual fund shares (84) (25)Ending number of mutual fund shares 120 104
Advisor SeriesOpening mutual fund shares 1 – Issued number of mutual fund shares 15 2Reinvested number of mutual fund shares – – Redeemed number of mutual fund shares (2) (1)Ending number of mutual fund shares 14 1
Series DOpening mutual fund shares 200 35Issued number of mutual fund shares 17 182Reinvested number of mutual fund shares – – Redeemed number of mutual fund shares (53) (17)Ending number of mutual fund shares 164 200
Series FOpening mutual fund shares 28 5Issued number of mutual fund shares 158 24Reinvested number of mutual fund shares – – Redeemed number of mutual fund shares (45) (1)Ending number of mutual fund shares 141 28
Series OOpening mutual fund shares – 14Issued number of mutual fund shares – – Reinvested number of mutual fund shares – – Redeemed number of mutual fund shares – (14)Ending number of mutual fund shares – –
RBC INTERNATIONAL EQUITY CLASS
335

SCHEDULE OF INVESTMENT PORTFOLIO (in $000s)
ANNUAL FINANCIAL STATEMENTS
March 31, 2017
The accompanying notes are an integral part of the financial statements.
PHILLIPS, HAGER & NORTH OVERSEAS EQUITY CLASS
Number Fair % of Net of Units Security Cost Value Assets
MUTUAL FUND UNITS 3 840 504 Phillips, Hager & North Overseas Equity Fund* $ 44 000 $ 52 139
TOTAL MUTUAL FUND UNITS $ 44 000 52 139 100.0OTHER NET ASSETS ATTRIBUTABLE TO HOLDERS OF REDEEMABLE SHARES 1 –NET ASSETS ATTRIBUTABLE TO HOLDERS OF REDEEMABLE SHARES $ 52 140 100.0
* Investment in related party (see note 6 in the generic notes).
336
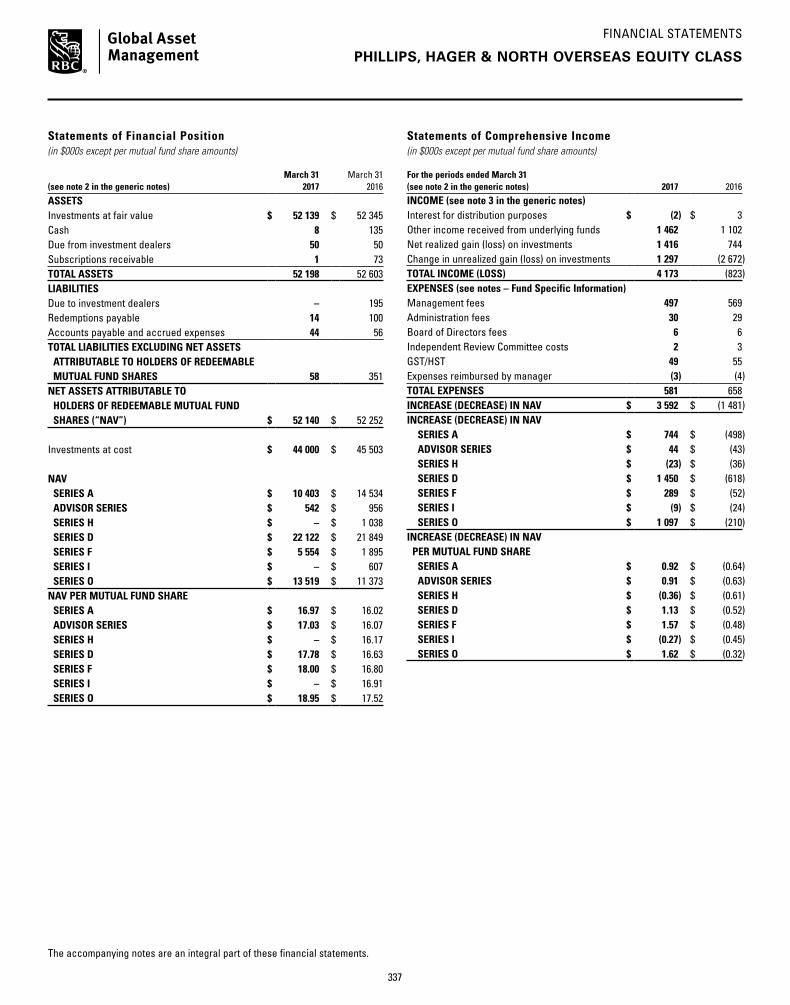
FINANCIAL STATEMENTS
The accompanying notes are an integral part of these financial statements.
PHILLIPS, HAGER & NORTH OVERSEAS EQUITY CLASS
Statements of Financial Position (in $000s except per mutual fund share amounts)
(see note 2 in the generic notes)March 31
2017March 31
2016
ASSETSInvestments at fair value $ 52 139 $ 52 345 Cash 8 135 Due from investment dealers 50 50 Subscriptions receivable 1 73 TOTAL ASSETS 52 198 52 603 LIABILITIESDue to investment dealers – 195 Redemptions payable 14 100 Accounts payable and accrued expenses 44 56 TOTAL LIABILITIES EXCLUDING NET ASSETS ATTRIBUTABLE TO HOLDERS OF REDEEMABLE MUTUAL FUND SHARES 58 351 NET ASSETS ATTRIBUTABLE TO HOLDERS OF REDEEMABLE MUTUAL FUND SHARES (“NAV”) $ 52 140 $ 52 252
Investments at cost $ 44 000 $ 45 503
NAV SERIES A $ 10 403 $ 14 534 ADVISOR SERIES $ 542 $ 956 SERIES H $ – $ 1 038 SERIES D $ 22 122 $ 21 849 SERIES F $ 5 554 $ 1 895 SERIES I $ – $ 607 SERIES O $ 13 519 $ 11 373 NAV PER MUTUAL FUND SHARE SERIES A $ 16.97 $ 16.02 ADVISOR SERIES $ 17.03 $ 16.07 SERIES H $ – $ 16.17 SERIES D $ 17.78 $ 16.63 SERIES F $ 18.00 $ 16.80 SERIES I $ – $ 16.91 SERIES O $ 18.95 $ 17.52
Statements of Comprehensive Income (in $000s except per mutual fund share amounts)
For the periods ended March 31 (see note 2 in the generic notes) 2017 2016INCOME (see note 3 in the generic notes)Interest for distribution purposes $ (2) $ 3 Other income received from underlying funds 1 462 1 102 Net realized gain (loss) on investments 1 416 744 Change in unrealized gain (loss) on investments 1 297 (2 672)TOTAL INCOME (LOSS) 4 173 (823)EXPENSES (see notes – Fund Specific Information)Management fees 497 569 Administration fees 30 29 Board of Directors fees 6 6 Independent Review Committee costs 2 3 GST/HST 49 55 Expenses reimbursed by manager (3) (4)TOTAL EXPENSES 581 658 INCREASE (DECREASE) IN NAV $ 3 592 $ (1 481)INCREASE (DECREASE) IN NAV SERIES A $ 744 $ (498) ADVISOR SERIES $ 44 $ (43) SERIES H $ (23) $ (36) SERIES D $ 1 450 $ (618) SERIES F $ 289 $ (52) SERIES I $ (9) $ (24) SERIES O $ 1 097 $ (210)INCREASE (DECREASE) IN NAV PER MUTUAL FUND SHARE SERIES A $ 0.92 $ (0.64) ADVISOR SERIES $ 0.91 $ (0.63) SERIES H $ (0.36) $ (0.61) SERIES D $ 1.13 $ (0.52) SERIES F $ 1.57 $ (0.48) SERIES I $ (0.27) $ (0.45) SERIES O $ 1.62 $ (0.32)
337

FINANCIAL STATEMENTS
The accompanying notes are an integral part of these financial statements.
PHILLIPS, HAGER & NORTH OVERSEAS EQUITY CLASS
Statements of Cash Flow (in $000s)
For the periods ended March 31 (see note 2 in the generic notes) 2017
2016
CASH FLOWS FROM OPERATING ACTIVITIES Increase (decrease) in NAV $ 3 592 $ (1 481)ADJUSTMENTS TO RECONCILE NET CASH PROVIDED BY (USED IN) OPERATIONSInterest for distribution purposes – – Net realized loss (gain) on investments (1 416) (744)Change in unrealized loss (gain) on investments (1 297) 2 672 (Increase) decrease in accrued receivables – – Increase (decrease) in accrued payables (12) 2 Cost of investments purchased (7 821) (15 944)Proceeds on sales of investments 10 545 3 998 NET CASH PROVIDED BY (USED IN) OPERATING ACTIVITIES 3 591 (11 497)CASH FLOWS FROM FINANCING ACTIVITIESProceeds from issue of redeemable mutual fund shares 15 895 20 271 Cash paid on redemption of redeemable mutual fund shares (19 613) (8 805)Distributions paid to holders of redeemable mutual fund shares – – NET CASH PROVIDED BY (USED IN) FINANCING ACTIVITIES $ (3 718) $ 11 466 Net increase (decrease) in cash for the period (127) (31)Cash (bank overdraft), beginning of period 135 166 CASH (BANK OVERDRAFT), END OF PERIOD $ 8 $ 135
Interest received (paid) $ (2) $ 3 Dividends received, net of withholding taxes $ – $ –
Cash consists of cash and futures contracts margin receivable/payable, as applicable.
338

FINANCIAL STATEMENTS
The accompanying notes are an integral part of these financial statements.
PHILLIPS, HAGER & NORTH OVERSEAS EQUITY CLASS
Statements of Changes in NAV (in $000s)
For the periods ended March 31 (see note 2 in the generic notes)
Series A Advisor Series Series H Series D2017 2016 2017 2016 2017 2016 2017 2016
NAV AT BEGINNING OF PERIOD $ 14 534 $ 15 036 $ 956 $ 653 $ 1 038 $ 685 $ 21 849 $ 19 072 INCREASE (DECREASE) IN NAV 744 (498) 44 (43) (23) (36) 1 450 (618)Early redemption fees – – – – – – – – Proceeds from redeemable mutual fund shares issued 1 834 3 481 90 565 – 585 2 528 5 412 Reinvestments of distributions to holders of redeemable mutual fund shares – – – – – – – – Redemption of redeemable mutual fund shares (6 709) (3 485) (548) (219) (1 015) (196) (3 705) (2 017)NET INCREASE (DECREASE) FROM REDEEMABLE MUTUAL FUND SHARE TRANSACTIONS (4 875) (4) (458) 346 (1 015) 389 (1 177) 3 395 Distributions from net income – – – – – – – – Distributions from net gains – – – – – – – – Distributions from capital – – – – – – – – TOTAL DISTRIBUTIONS TO HOLDERS OF REDEEMABLE MUTUAL FUND SHARES – – – – – – – – NET INCREASE (DECREASE) IN NAV (4 131) (502) (414) 303 (1 038) 353 273 2 777 NAV AT END OF PERIOD $ 10 403 $ 14 534 $ 542 $ 956 $ – $ 1 038 $ 22 122 $ 21 849
For the periods ended March 31 (see note 2 in the generic notes)
Series F Series I Series O Total2017 2016 2017 2016 2017 2016 2017 2016
NAV AT BEGINNING OF PERIOD $ 1 895 $ 1 293 $ 607 $ 648 $ 11 373 $ 5 117 $ 52 252 $ 42 504 INCREASE (DECREASE) IN NAV 289 (52) (9) (24) 1 097 (210) 3 592 (1 481)Early redemption fees – – – – – – – – Proceeds from redeemable mutual fund shares issued 4 549 1 482 178 291 6 644 8 255 15 823 20 071 Reinvestments of distributions to holders of redeemable mutual fund shares – – – – – – – – Redemption of redeemable mutual fund shares (1 179) (828) (776) (308) (5 595) (1 789) (19 527) (8 842)NET INCREASE (DECREASE) FROM REDEEMABLE MUTUAL FUND SHARE TRANSACTIONS 3 370 654 (598) (17) 1 049 6 466 (3 704) 11 229 Distributions from net income – – – – – – – – Distributions from net gains – – – – – – – – Distributions from capital – – – – – – – – TOTAL DISTRIBUTIONS TO HOLDERS OF REDEEMABLE MUTUAL FUND SHARES – – – – – – – – NET INCREASE (DECREASE) IN NAV 3 659 602 (607) (41) 2 146 6 256 (112) 9 748 NAV AT END OF PERIOD $ 5 554 $ 1 895 $ – $ 607 $ 13 519 $ 11 373 $ 52 140 $ 52 252
339
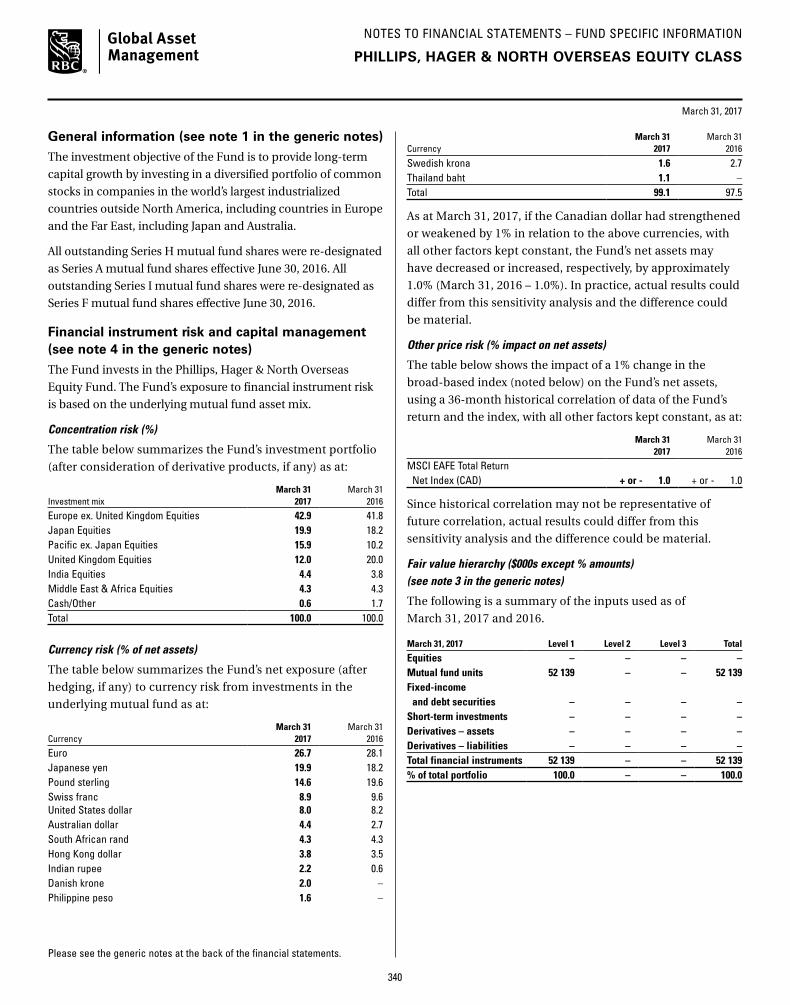
NOTES TO FINANCIAL STATEMENTS – FUND SPECIFIC INFORMATION
Please see the generic notes at the back of the financial statements.
March 31, 2017
PHILLIPS, HAGER & NORTH OVERSEAS EQUITY CLASS
General information (see note 1 in the generic notes)
The investment objective of the Fund is to provide long-term
capital growth by investing in a diversified portfolio of common
stocks in companies in the world’s largest industrialized
countries outside North America, including countries in Europe
and the Far East, including Japan and Australia.
All outstanding Series H mutual fund shares were re-designated
as Series A mutual fund shares effective June 30, 2016. All
outstanding Series I mutual fund shares were re-designated as
Series F mutual fund shares effective June 30, 2016.
Financial instrument risk and capital management (see note 4 in the generic notes)
The Fund invests in the Phillips, Hager & North Overseas
Equity Fund. The Fund’s exposure to financial instrument risk
is based on the underlying mutual fund asset mix.
Concentration risk (%)
The table below summarizes the Fund’s investment portfolio
(after consideration of derivative products, if any) as at:
Investment mixMarch 31
2017March 31
2016
Europe ex. United Kingdom Equities 42.9 41.8Japan Equities 19.9 18.2Pacific ex. Japan Equities 15.9 10.2United Kingdom Equities 12.0 20.0India Equities 4.4 3.8Middle East & Africa Equities 4.3 4.3Cash/Other 0.6 1.7Total 100.0 100.0
Currency risk (% of net assets)
The table below summarizes the Fund’s net exposure (after
hedging, if any) to currency risk from investments in the
underlying mutual fund as at:
CurrencyMarch 31
2017March 31
2016
Euro 26.7 28.1Japanese yen 19.9 18.2Pound sterling 14.6 19.6Swiss franc 8.9 9.6United States dollar 8.0 8.2Australian dollar 4.4 2.7South African rand 4.3 4.3Hong Kong dollar 3.8 3.5Indian rupee 2.2 0.6Danish krone 2.0 –Philippine peso 1.6 –
CurrencyMarch 31
2017March 31
2016
Swedish krona 1.6 2.7Thailand baht 1.1 –Total 99.1 97.5
As at March 31, 2017, if the Canadian dollar had strengthened
or weakened by 1% in relation to the above currencies, with
all other factors kept constant, the Fund’s net assets may
have decreased or increased, respectively, by approximately
1.0% (March 31, 2016 – 1.0%). In practice, actual results could
differ from this sensitivity analysis and the difference could
be material.
Other price risk (% impact on net assets)
The table below shows the impact of a 1% change in the
broad-based index (noted below) on the Fund’s net assets,
using a 36-month historical correlation of data of the Fund’s
return and the index, with all other factors kept constant, as at:
March 31 2017
March 31 2016
MSCI EAFE Total Return Net Index (CAD) + or - 1.0 + or - 1.0
Since historical correlation may not be representative of
future correlation, actual results could differ from this
sensitivity analysis and the difference could be material.
Fair value hierarchy ($000s except % amounts) (see note 3 in the generic notes)
The following is a summary of the inputs used as of
March 31, 2017 and 2016.
March 31, 2017 Level 1 Level 2 Level 3 Total
Equities – – – – Mutual fund units 52 139 – – 52 139Fixed-income and debt securities – – – – Short-term investments – – – – Derivatives – assets – – – – Derivatives – liabilities – – – – Total financial instruments 52 139 – – 52 139% of total portfolio 100.0 – – 100.0
340

NOTES TO FINANCIAL STATEMENTS – FUND SPECIFIC INFORMATION
Please see the generic notes at the back of the financial statements.
March 31, 2017
March 31, 2016 Level 1 Level 2 Level 3 Total
Equities – – – – Mutual fund units 52 345 – – 52 345 Fixed-income and debt securities – – – – Short-term investments – – – – Derivatives – assets – – – – Derivatives – liabilities – – – – Total financial instruments 52 345 – – 52 345 % of total portfolio 100.0 – – 100.0
For the periods ended March 31, 2017 and 2016, there were
no transfers of financial instruments between Level 1, Level 2
and Level 3.
Management fees and operating expenses (see note 6 in the generic notes)
Management fees and administration fees of each series
of the Fund are payable to RBC GAM and calculated at the
following annual percentages, before GST/HST, of the daily
net asset value of each series of the Fund.
Management fees* Operating expenses
Series A 1.75% 0.07%Advisor Series 1.75% 0.07%Series H 1.75% 0.07%Series D 1.00% 0.07%Series F 0.75% 0.07%Series I 0.75% 0.07%Series O n/a† 0.02%
* Effective June 30, 2016, the management fees for Series A and Advisor Series mutual fund shares were reduced to 1.75% from 1.85%; for Series D mutual fund shares were reduced to 1.00% from 1.10%; and for Series F mutual fund shares were reduced to 0.75% from 0.85%.
† Series O shareholders pay a negotiated management fee directly to RBC GAM for investment-counselling services.
Investments by related parties ($000s except mutual fund share amounts)
Royal Bank of Canada, or one of its subsidiaries, held the
following investments in the Fund as at:
March 31 2017
March 31 2016
Mutual fund shares held Series A 149 50 Advisor Series 50 50 Series H – 98 Series D 50 50 Series F 148 50 Series I – 97Value of all mutual fund shares 7 6
Underlying mutual fund ownership interest (%)
The table below summarizes the Fund’s interest in the
underlying mutual fund as a percentage of NAV, and the
Fund’s ownership interest as a percentage of the net assets of
the underlying fund (“Ownership”). The underlying fund is
established and conducts business in Canada, and has an
associate relationship to the Fund.
March 31 2017
March 31 2016
NAV Ownership NAV Ownership
Phillips, Hager & North Overseas Equity Fund 100.0 4.8 100.2 5.3
Taxes ($000s) (see note 5 in the generic notes)
The Fund had no capital or non-capital losses as at
March 31, 2017.
Redeemable mutual fund shares (000s)
There is no limitation on the number of mutual fund shares
available for issue. Mutual fund shares are purchased and
redeemed at the NAV per mutual fund share.
For the periods ended March 31 (see note 2 in the generic notes) 2017 2016
Series A Opening mutual fund shares 907 908Issued number of mutual fund shares 116 209Reinvested number of mutual fund shares – – Redeemed number of mutual fund shares (410) (210)Ending number of mutual fund shares 613 907
Advisor SeriesOpening mutual fund shares 60 39Issued number of mutual fund shares 5 34Reinvested number of mutual fund shares – – Redeemed number of mutual fund shares (33) (13)Ending number of mutual fund shares 32 60
Series HOpening mutual fund shares 64 41Issued number of mutual fund shares – 35Reinvested number of mutual fund shares – – Redeemed number of mutual fund shares (64) (12)Ending number of mutual fund shares – 64
Series DOpening mutual fund shares 1 314 1 119Issued number of mutual fund shares 150 314Reinvested number of mutual fund shares – – Redeemed number of mutual fund shares (220) (119)Ending number of mutual fund shares 1 244 1 314
PHILLIPS, HAGER & NORTH OVERSEAS EQUITY CLASS
341

NOTES TO FINANCIAL STATEMENTS – FUND SPECIFIC INFORMATION
Please see the generic notes at the back of the financial statements.
March 31, 2017
PHILLIPS, HAGER & NORTH OVERSEAS EQUITY CLASS
For the periods ended March 31 (see note 2 in the generic notes) 2017 2016
Series FOpening mutual fund shares 113 75Issued number of mutual fund shares 265 86Reinvested number of mutual fund shares – – Redeemed number of mutual fund shares (69) (48)Ending number of mutual fund shares 309 113
Series IOpening mutual fund shares 36 38Issued number of mutual fund shares 10 16Reinvested number of mutual fund shares – – Redeemed number of mutual fund shares (46) (18)Ending number of mutual fund shares – 36
Series OOpening mutual fund shares 649 288Issued number of mutual fund shares 377 460Reinvested number of mutual fund shares – – Redeemed number of mutual fund shares (313) (99)Ending number of mutual fund shares 713 649
342

SCHEDULE OF INVESTMENT PORTFOLIO (in $000s)
ANNUAL FINANCIAL STATEMENTS
March 31, 2017
The accompanying notes are an integral part of the financial statements.
RBC EUROPEAN EQUITY CLASS
Number Fair % of Net of Units Security Cost Value Assets
MUTUAL FUND UNITS 1 325 913 RBC European Equity Fund* $ 30 850 $ 29 818
TOTAL MUTUAL FUND UNITS $ 30 850 29 818 100.1OTHER NET ASSETS (LIABILITIES) ATTRIBUTABLE TO HOLDERS OF REDEEMABLE SHARES (15) (0.1)NET ASSETS ATTRIBUTABLE TO HOLDERS OF REDEEMABLE SHARES $ 29 803 100.0
* Investment in related party (see note 6 in the generic notes).
343

FINANCIAL STATEMENTS
The accompanying notes are an integral part of these financial statements.
RBC EUROPEAN EQUITY CLASS
Statements of Financial Position (in $000s except per mutual fund share amounts)
(see note 2 in the generic notes)March 31
2017March 31
2016
ASSETSInvestments at fair value $ 29 818 $ 33 343 Cash 62 – Due from investment dealers 275 28 Subscriptions receivable 49 4 499 TOTAL ASSETS 30 204 37 870 LIABILITIESBank overdraft – 24 Redemptions payable 375 1 935 Accounts payable and accrued expenses 26 28 TOTAL LIABILITIES EXCLUDING NET ASSETS ATTRIBUTABLE TO HOLDERS OF REDEEMABLE MUTUAL FUND SHARES 401 1 987 NET ASSETS ATTRIBUTABLE TO HOLDERS OF REDEEMABLE MUTUAL FUND SHARES (“NAV”) $ 29 803 $ 35 883
Investments at cost $ 30 850 $ 34 928
NAV SERIES A $ 1 666 $ 3 437 ADVISOR SERIES $ 1 816 $ 767 SERIES H $ – $ 381 SERIES D $ 420 $ 422 SERIES F $ 10 814 $ 9 833 SERIES I $ 15 086 $ 21 042 SERIES O $ 1 $ 1 NAV PER MUTUAL FUND SHARE SERIES A $ 10.52 $ 10.42 ADVISOR SERIES $ 10.52 $ 10.42 SERIES H $ – $ 10.42 SERIES D $ 10.73 $ 10.53 SERIES F $ 10.80 $ 10.57 SERIES I $ 10.85 $ 10.60 SERIES O $ 11.03 $ 10.69
Statements of Comprehensive Income (in $000s except per mutual fund share amounts)
For the periods ended March 31 (see note 2 in the generic notes) 2017 2016INCOME (see note 3 in the generic notes)Interest for distribution purposes $ (2) $ – Other income received from underlying funds 648 697 Capital gains received from underlying funds 357 –Net realized gain (loss) on investments (1 230) (135)Change in unrealized gain (loss) on investments 553 (1 590)TOTAL INCOME (LOSS) 326 (1 028)EXPENSES (see notes – Fund Specific Information)Management fees 270 179 Administration fees 46 27 Board of Directors fees 5 2 Independent Review Committee costs 2 3 GST/HST 23 18 Expenses reimbursed by manager (3) (3)TOTAL EXPENSES 343 226 INCREASE (DECREASE) IN NAV $ (17) $ (1 254)INCREASE (DECREASE) IN NAV SERIES A $ (12) $ (65) ADVISOR SERIES $ 55 $ (26) SERIES H $ (10) $ (23) SERIES D $ 13 $ (11) SERIES F $ 6 $ (176) SERIES I $ (69) $ (961) SERIES O $ – $ 8 INCREASE (DECREASE) IN NAV PER MUTUAL FUND SHARE SERIES A $ (0.05) $ (1.35) ADVISOR SERIES $ 0.41 $ (0.91) SERIES H $ (0.32) $ (1.80) SERIES D $ 0.30 $ (1.30) SERIES F $ 0.01 $ (0.58) SERIES I $ (0.04) $ (0.44) SERIES O $ 0.34 $ (2.93)
344

FINANCIAL STATEMENTS
The accompanying notes are an integral part of these financial statements.
RBC EUROPEAN EQUITY CLASS
Statements of Cash Flow (in $000s)
For the periods ended March 31 (see note 2 in the generic notes) 2017
2016
CASH FLOWS FROM OPERATING ACTIVITIESIncrease (decrease) in NAV $ (17) $ (1 254)ADJUSTMENTS TO RECONCILE NET CASH PROVIDED BY (USED IN) OPERATIONSInterest for distribution purposes – – Net realized loss (gain) on investments 1 230 135 Change in unrealized loss (gain) on investments (553) 1 590 (Increase) decrease in accrued receivables – – Increase (decrease) in accrued payables (2) 28 Cost of investments purchased (12 560) (36 795)Proceeds on sales of investments 15 161 2 814 NET CASH PROVIDED BY (USED IN) OPERATING ACTIVITIES 3 259 (33 482)CASH FLOWS FROM FINANCING ACTIVITIESProceeds from issue of redeemable mutual fund shares 19 586 38 703 Cash paid on redemption of redeemable mutual fund shares (22 759) (5 248)Distributions paid to holders of redeemable mutual fund shares – – NET CASH PROVIDED BY (USED IN) FINANCING ACTIVITIES $ (3 173) $ 33 455 Net increase (decrease) in cash for the period 86 (27)Cash (bank overdraft), beginning of period (24) 3 CASH (BANK OVERDRAFT), END OF PERIOD $ 62 $ (24)
Interest received (paid) $ (2) $ – Dividends received, net of withholding taxes $ – $ –
Cash consists of cash and futures contracts margin receivable/payable, as applicable.
345

FINANCIAL STATEMENTS
The accompanying notes are an integral part of these financial statements.
RBC EUROPEAN EQUITY CLASS
Statements of Changes in NAV (in $000s)
For the periods ended March 31 (see note 2 in the generic notes)
Series A Advisor Series Series H Series D2017 2016 2017 2016 2017 2016 2017 2016
NAV AT BEGINNING OF PERIOD $ 3 437 $ 799 $ 767 $ 11 $ 381 $ 1 $ 422 $ 69 INCREASE (DECREASE) IN NAV (12) (65) 55 (26) (10) (23) 13 (11)Early redemption fees – – – – – – – – Proceeds from redeemable mutual fund shares issued 336 3 303 1 145 982 – 605 427 773 Reinvestments of distributions to holders of redeemable mutual fund shares – – – – – – – – Redemption of redeemable mutual fund shares (2 095) (600) (151) (200) (371) (202) (442) (409)NET INCREASE (DECREASE) FROM REDEEMABLE MUTUAL FUND SHARE TRANSACTIONS (1 759) 2 703 994 782 (371) 403 (15) 364 Distributions from net income – – – – – – – – Distributions from net gains – – – – – – – – Distributions from capital – – – – – – – – TOTAL DISTRIBUTIONS TO HOLDERS OF REDEEMABLE MUTUAL FUND SHARES – – – – – – – – NET INCREASE (DECREASE) IN NAV (1 771) 2 638 1 049 756 (381) 380 (2) 353 NAV AT END OF PERIOD $ 1 666 $ 3 437 $ 1 816 $ 767 $ – $ 381 $ 420 $ 422
For the periods ended March 31 (see note 2 in the generic notes)
Series F Series I Series O Total2017 2016 2017 2016 2017 2016 2017 2016
NAV AT BEGINNING OF PERIOD $ 9 833 $ 103 $ 21 042 $ 1 $ 1 $ 150 $ 35 883 $ 1 134 INCREASE (DECREASE) IN NAV 6 (176) (69) (961) – 8 (17) (1 254)Early redemption fees 2 – – – – – 2 – Proceeds from redeemable mutual fund shares issued 7 992 12 631 5 236 24 892 – – 15 136 43 186 Reinvestments of distributions to holders of redeemable mutual fund shares – – – – – – – – Redemption of redeemable mutual fund shares (7 019) (2 725) (11 123) (2 890) – (157) (21 201) (7 183)NET INCREASE (DECREASE) FROM REDEEMABLE MUTUAL FUND SHARE TRANSACTIONS 975 9 906 (5 887) 22 002 – (157) (6 063) 36 003 Distributions from net income – – – – – – – – Distributions from net gains – – – – – – – – Distributions from capital – – – – – – – – TOTAL DISTRIBUTIONS TO HOLDERS OF REDEEMABLE MUTUAL FUND SHARES – – – – – – – – NET INCREASE (DECREASE) IN NAV 981 9 730 (5 956) 21 041 – (149) (6 080) 34 749 NAV AT END OF PERIOD $ 10 814 $ 9 833 $ 15 086 $ 21 042 $ 1 $ 1 $ 29 803 $ 35 883
346
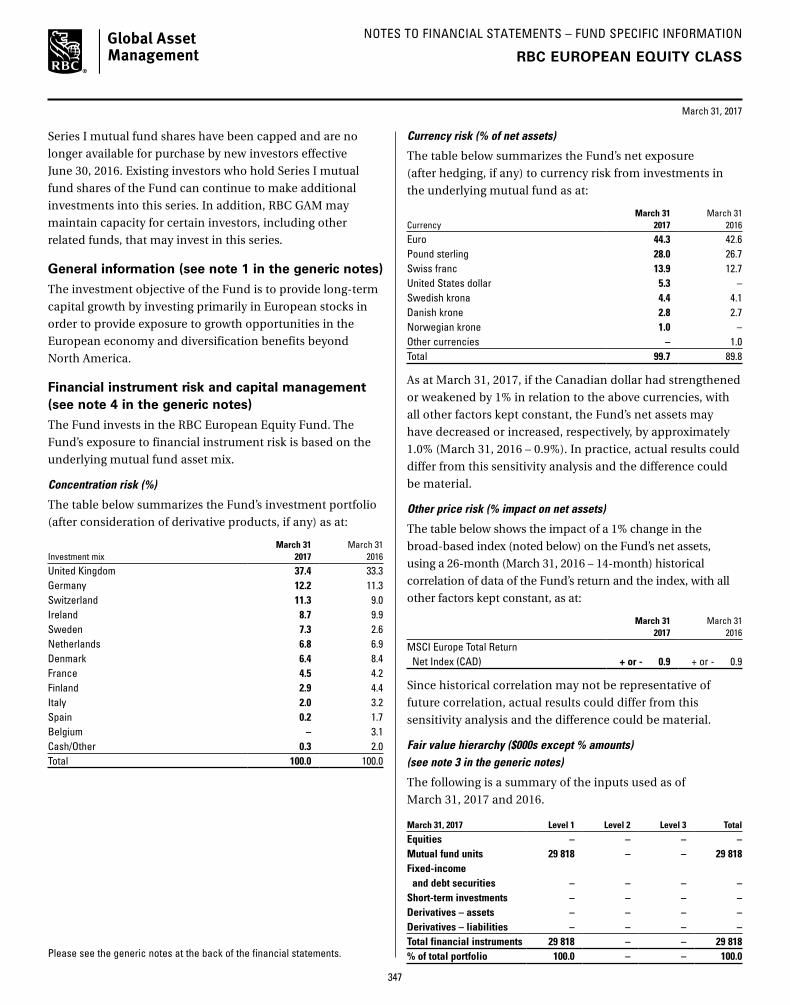
NOTES TO FINANCIAL STATEMENTS – FUND SPECIFIC INFORMATION
Please see the generic notes at the back of the financial statements.
March 31, 2017
RBC EUROPEAN EQUITY CLASS
Series I mutual fund shares have been capped and are no
longer available for purchase by new investors effective
June 30, 2016. Existing investors who hold Series I mutual
fund shares of the Fund can continue to make additional
investments into this series. In addition, RBC GAM may
maintain capacity for certain investors, including other
related funds, that may invest in this series.
General information (see note 1 in the generic notes)
The investment objective of the Fund is to provide long-term
capital growth by investing primarily in European stocks in
order to provide exposure to growth opportunities in the
European economy and diversification benefits beyond
North America.
Financial instrument risk and capital management (see note 4 in the generic notes)
The Fund invests in the RBC European Equity Fund. The
Fund’s exposure to financial instrument risk is based on the
underlying mutual fund asset mix.
Concentration risk (%)
The table below summarizes the Fund’s investment portfolio
(after consideration of derivative products, if any) as at:
Investment mixMarch 31
2017March 31
2016
United Kingdom 37.4 33.3Germany 12.2 11.3Switzerland 11.3 9.0Ireland 8.7 9.9Sweden 7.3 2.6Netherlands 6.8 6.9Denmark 6.4 8.4France 4.5 4.2Finland 2.9 4.4Italy 2.0 3.2Spain 0.2 1.7Belgium – 3.1Cash/Other 0.3 2.0Total 100.0 100.0
Currency risk (% of net assets)
The table below summarizes the Fund’s net exposure
(after hedging, if any) to currency risk from investments in
the underlying mutual fund as at:
CurrencyMarch 31
2017March 31
2016
Euro 44.3 42.6Pound sterling 28.0 26.7Swiss franc 13.9 12.7United States dollar 5.3 –Swedish krona 4.4 4.1Danish krone 2.8 2.7Norwegian krone 1.0 –Other currencies – 1.0Total 99.7 89.8
As at March 31, 2017, if the Canadian dollar had strengthened
or weakened by 1% in relation to the above currencies, with
all other factors kept constant, the Fund’s net assets may
have decreased or increased, respectively, by approximately
1.0% (March 31, 2016 – 0.9%). In practice, actual results could
differ from this sensitivity analysis and the difference could
be material.
Other price risk (% impact on net assets)
The table below shows the impact of a 1% change in the
broad-based index (noted below) on the Fund’s net assets,
using a 26-month (March 31, 2016 – 14-month) historical
correlation of data of the Fund’s return and the index, with all
other factors kept constant, as at:
March 31 2017
March 31 2016
MSCI Europe Total Return Net Index (CAD) + or - 0.9 + or - 0.9
Since historical correlation may not be representative of
future correlation, actual results could differ from this
sensitivity analysis and the difference could be material.
Fair value hierarchy ($000s except % amounts) (see note 3 in the generic notes)
The following is a summary of the inputs used as of
March 31, 2017 and 2016.
March 31, 2017 Level 1 Level 2 Level 3 Total
Equities – – – – Mutual fund units 29 818 – – 29 818Fixed-income and debt securities – – – – Short-term investments – – – – Derivatives – assets – – – – Derivatives – liabilities – – – – Total financial instruments 29 818 – – 29 818% of total portfolio 100.0 – – 100.0
347

NOTES TO FINANCIAL STATEMENTS – FUND SPECIFIC INFORMATION
Please see the generic notes at the back of the financial statements.
March 31, 2017
March 31, 2016 Level 1 Level 2 Level 3 Total
Equities – – – – Mutual fund units 33 343 – – 33 343 Fixed-income and debt securities – – – – Short-term investments – – – – Derivatives – assets – – – – Derivatives – liabilities – – – – Total financial instruments 33 343 – – 33 343 % of total portfolio 100.0 – – 100.0
For the periods ended March 31, 2017 and 2016, there were
no transfers of financial instruments between Level 1, Level 2
and Level 3.
Management fees and operating expenses (see note 6 in the generic notes)
Management fees and administration fees of each series
of the Fund are payable to RBC GAM and calculated at the
following annual percentages, before GST/HST, of the daily
net asset value of each series of the Fund.
Management fees* Operating expenses
Series A 1.75% 0.13%Advisor Series 1.75% 0.13%Series D 1.00% 0.13%Series F 0.75% 0.13%Series I 0.60% 0.13%Series O n/a† 0.02%
* Effective June 30, 2016, the management fees for Series A and Advisor Series mutual fund shares were reduced to 1.75% from 1.85%.
† Series O shareholders pay a negotiated management fee directly to RBC GAM for investment-counselling services.
Investments by related parties ($000s except mutual fund share amounts)
Royal Bank of Canada, or one of its subsidiaries, held the
following investments in the Fund as at:
March 31 2017
March 31 2016
Mutual fund shares held Series A 100 100 Advisor Series 100 100 Series H – 100 Series D 100 100 Series F 100 100 Series I 100 100 Series O 100 100Value of all mutual fund shares 6 7
Underlying mutual fund ownership interest (%)
The table below summarizes the Fund’s interest in the
underlying mutual fund as a percentage of NAV, and the
Fund’s ownership interest as a percentage of the net assets of
the underlying fund (“Ownership”). The underlying fund is
established and conducts business in Canada, and has an
associate relationship to the Fund.
March 31 2017
March 31 2016
NAV Ownership NAV Ownership
RBC European Equity Fund 100.1 0.5 92.9 0.6
Taxes ($000s) (see note 5 in the generic notes)
The Fund had no capital or non-capital losses as at
March 31, 2017.
Redeemable mutual fund shares (000s)
There is no limitation on the number of mutual fund shares
available for issue. Mutual fund shares are purchased and
redeemed at the NAV per mutual fund share.
For the periods ended March 31 (see note 2 in the generic notes) 2017 2016
Series A Opening mutual fund shares 330 77Issued number of mutual fund shares 33 308Reinvested number of mutual fund shares – – Redeemed number of mutual fund shares (205) (55)Ending number of mutual fund shares 158 330
Advisor SeriesOpening mutual fund shares 74 1Issued number of mutual fund shares 114 92Reinvested number of mutual fund shares – – Redeemed number of mutual fund shares (15) (19)Ending number of mutual fund shares 173 74
Series DOpening mutual fund shares 40 7Issued number of mutual fund shares 41 71Reinvested number of mutual fund shares – – Redeemed number of mutual fund shares (42) (38)Ending number of mutual fund shares 39 40
Series FOpening mutual fund shares 930 10Issued number of mutual fund shares 764 1 178Reinvested number of mutual fund shares – – Redeemed number of mutual fund shares (693) (258)Ending number of mutual fund shares 1 001 930
RBC EUROPEAN EQUITY CLASS
348

NOTES TO FINANCIAL STATEMENTS – FUND SPECIFIC INFORMATION
Please see the generic notes at the back of the financial statements.
March 31, 2017
For the periods ended March 31 (see note 2 in the generic notes) 2017 2016
Series IOpening mutual fund shares 1 985 – Issued number of mutual fund shares 498 2 260Reinvested number of mutual fund shares – – Redeemed number of mutual fund shares (1 093) (275)Ending number of mutual fund shares 1 390 1 985
Series OOpening mutual fund shares – 14Issued number of mutual fund shares – – Reinvested number of mutual fund shares – – Redeemed number of mutual fund shares – (14)Ending number of mutual fund shares – –
RBC EUROPEAN EQUITY CLASS
349

SCHEDULE OF INVESTMENT PORTFOLIO (in $000s)
ANNUAL FINANCIAL STATEMENTS
March 31, 2017
The accompanying notes are an integral part of the financial statements.
RBC EMERGING MARKETS EQUITY CLASS
Number Fair % of Net of Units Security Cost Value Assets
MUTUAL FUND UNITS 6 404 088 RBC Emerging Markets Equity Fund* $ 83 952 $ 102 064
TOTAL MUTUAL FUND UNITS $ 83 952 102 064 99.9OTHER NET ASSETS ATTRIBUTABLE TO HOLDERS OF REDEEMABLE SHARES 121 0.1NET ASSETS ATTRIBUTABLE TO HOLDERS OF REDEEMABLE SHARES $ 102 185 100.0
* Investment in related party (see note 6 in the generic notes).
350

FINANCIAL STATEMENTS
The accompanying notes are an integral part of these financial statements.
RBC EMERGING MARKETS EQUITY CLASS
Statements of Financial Position (in $000s except per mutual fund share amounts)
(see note 2 in the generic notes)March 31
2017March 31
2016
ASSETSInvestments at fair value $ 102 064 $ 76 216 Cash 451 – Due from investment dealers – 45 Subscriptions receivable 239 148 TOTAL ASSETS 102 754 76 409 LIABILITIESBank overdraft – 5 Due to investment dealers 450 45 Redemptions payable 49 15 Accounts payable and accrued expenses 70 46 TOTAL LIABILITIES EXCLUDING NET ASSETS ATTRIBUTABLE TO HOLDERS OF REDEEMABLE MUTUAL FUND SHARES 569 111 NET ASSETS ATTRIBUTABLE TO HOLDERS OF REDEEMABLE MUTUAL FUND SHARES (“NAV”) $ 102 185 $ 76 298
Investments at cost $ 83 952 $ 70 240
NAV SERIES A $ 7 198 $ 8 034 ADVISOR SERIES $ 3 024 $ 1 601 SERIES H $ – $ 1 829 SERIES D $ 2 279 $ 1 630 SERIES F $ 61 214 $ 24 094 SERIES I $ – $ 7 966 SERIES O $ 28 470 $ 31 144 NAV PER MUTUAL FUND SHARE SERIES A $ 16.38 $ 14.22 ADVISOR SERIES $ 16.39 $ 14.22 SERIES H $ – $ 14.34 SERIES D $ 17.24 $ 14.82 SERIES F $ 17.47 $ 14.98 SERIES I $ – $ 15.01 SERIES O $ 18.32 $ 15.56
Statements of Comprehensive Income (in $000s except per mutual fund share amounts)
For the periods ended March 31 (see note 2 in the generic notes) 2017 2016INCOME (see note 3 in the generic notes)Interest for distribution purposes $ (1) $ (5)Other income received from underlying funds 1 508 2 156 Net realized gain (loss) on investments 1 252 928 Net gain (loss) on foreign currencies and other net assets 8 –Change in unrealized gain (loss) on investments 12 136 (8 407)TOTAL INCOME (LOSS) 14 903 (5 328)EXPENSES (see notes – Fund Specific Information)Management fees 556 475 Administration fees 65 48 Board of Directors fees 10 9 Independent Review Committee costs 2 3 GST/HST 72 54 Expenses reimbursed by manager (4) (5)TOTAL EXPENSES 701 584 INCREASE (DECREASE) IN NAV $ 14 202 $ (5 912)INCREASE (DECREASE) IN NAV SERIES A $ 1 095 $ (795) ADVISOR SERIES $ 362 $ (178) SERIES H $ – $ (562) SERIES D $ 254 $ (134) SERIES F $ 7 264 $ (1 403) SERIES I $ (3) $ (591) SERIES O $ 5 230 $ (2 249)INCREASE (DECREASE) IN NAV PER MUTUAL FUND SHARE SERIES A $ 2.17 $ (1.36) ADVISOR SERIES $ 2.38 $ (1.36) SERIES H $ – $ (1.34) SERIES D $ 2.33 $ (1.27) SERIES F $ 2.61 $ (1.22) SERIES I $ (0.01) $ (1.21) SERIES O $ 2.67 $ (1.13)
351

FINANCIAL STATEMENTS
The accompanying notes are an integral part of these financial statements.
RBC EMERGING MARKETS EQUITY CLASS
Statements of Cash Flow (in $000s)
For the periods ended March 31 (see note 2 in the generic notes) 2017
2016
CASH FLOWS FROM OPERATING ACTIVITIES Increase (decrease) in NAV $ 14 202 $ (5 912)ADJUSTMENTS TO RECONCILE NET CASH PROVIDED BY (USED IN) OPERATIONSInterest for distribution purposes – – Net realized loss (gain) on investments (1 252) (928)Change in unrealized loss (gain) on investments (12 136) 8 407 (Increase) decrease in accrued receivables – – Increase (decrease) in accrued payables 24 5 Cost of investments purchased (22 150) (29 743)Proceeds on sales of investments 10 140 13 962 NET CASH PROVIDED BY (USED IN) OPERATING ACTIVITIES (11 172) (14 209)CASH FLOWS FROM FINANCING ACTIVITIESProceeds from issue of redeemable mutual fund shares 47 087 39 088 Cash paid on redemption of redeemable mutual fund shares (35 459) (25 265)Distributions paid to holders of redeemable mutual fund shares – – NET CASH PROVIDED BY (USED IN) FINANCING ACTIVITIES $ 11 628 $ 13 823 Net increase (decrease) in cash for the period 456 (386)Cash (bank overdraft), beginning of period (5) 381 CASH (BANK OVERDRAFT), END OF PERIOD $ 451 $ (5)
Interest received (paid) $ (1) $ (5)Dividends received, net of withholding taxes $ – $ –
Cash consists of cash and futures contracts margin receivable/payable, as applicable.
352
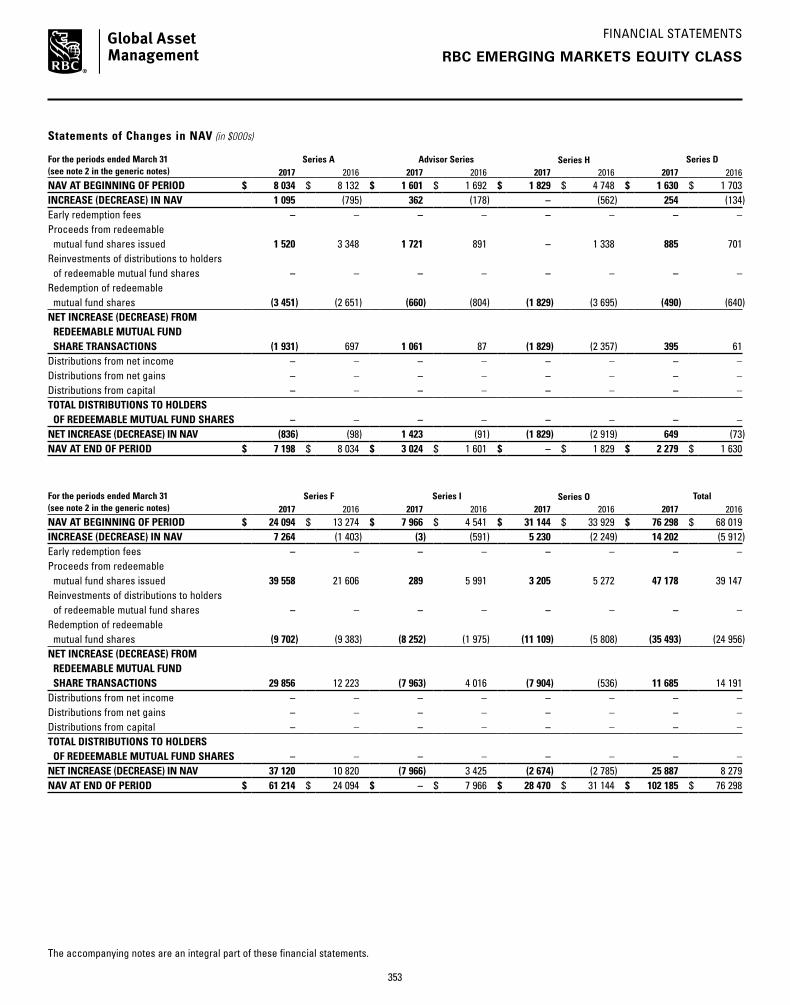
FINANCIAL STATEMENTS
The accompanying notes are an integral part of these financial statements.
RBC EMERGING MARKETS EQUITY CLASS
Statements of Changes in NAV (in $000s)
For the periods ended March 31 (see note 2 in the generic notes)
Series A Advisor Series Series H Series D2017 2016 2017 2016 2017 2016 2017 2016
NAV AT BEGINNING OF PERIOD $ 8 034 $ 8 132 $ 1 601 $ 1 692 $ 1 829 $ 4 748 $ 1 630 $ 1 703 INCREASE (DECREASE) IN NAV 1 095 (795) 362 (178) – (562) 254 (134)Early redemption fees – – – – – – – – Proceeds from redeemable mutual fund shares issued 1 520 3 348 1 721 891 – 1 338 885 701 Reinvestments of distributions to holders of redeemable mutual fund shares – – – – – – – – Redemption of redeemable mutual fund shares (3 451) (2 651) (660) (804) (1 829) (3 695) (490) (640)NET INCREASE (DECREASE) FROM REDEEMABLE MUTUAL FUND SHARE TRANSACTIONS (1 931) 697 1 061 87 (1 829) (2 357) 395 61 Distributions from net income – – – – – – – – Distributions from net gains – – – – – – – – Distributions from capital – – – – – – – – TOTAL DISTRIBUTIONS TO HOLDERS OF REDEEMABLE MUTUAL FUND SHARES – – – – – – – – NET INCREASE (DECREASE) IN NAV (836) (98) 1 423 (91) (1 829) (2 919) 649 (73)NAV AT END OF PERIOD $ 7 198 $ 8 034 $ 3 024 $ 1 601 $ – $ 1 829 $ 2 279 $ 1 630
For the periods ended March 31 (see note 2 in the generic notes)
Series F Series I Series O Total2017 2016 2017 2016 2017 2016 2017 2016
NAV AT BEGINNING OF PERIOD $ 24 094 $ 13 274 $ 7 966 $ 4 541 $ 31 144 $ 33 929 $ 76 298 $ 68 019 INCREASE (DECREASE) IN NAV 7 264 (1 403) (3) (591) 5 230 (2 249) 14 202 (5 912)Early redemption fees – – – – – – – – Proceeds from redeemable mutual fund shares issued 39 558 21 606 289 5 991 3 205 5 272 47 178 39 147 Reinvestments of distributions to holders of redeemable mutual fund shares – – – – – – – – Redemption of redeemable mutual fund shares (9 702) (9 383) (8 252) (1 975) (11 109) (5 808) (35 493) (24 956)NET INCREASE (DECREASE) FROM REDEEMABLE MUTUAL FUND SHARE TRANSACTIONS 29 856 12 223 (7 963) 4 016 (7 904) (536) 11 685 14 191 Distributions from net income – – – – – – – – Distributions from net gains – – – – – – – – Distributions from capital – – – – – – – – TOTAL DISTRIBUTIONS TO HOLDERS OF REDEEMABLE MUTUAL FUND SHARES – – – – – – – – NET INCREASE (DECREASE) IN NAV 37 120 10 820 (7 966) 3 425 (2 674) (2 785) 25 887 8 279 NAV AT END OF PERIOD $ 61 214 $ 24 094 $ – $ 7 966 $ 28 470 $ 31 144 $ 102 185 $ 76 298
353
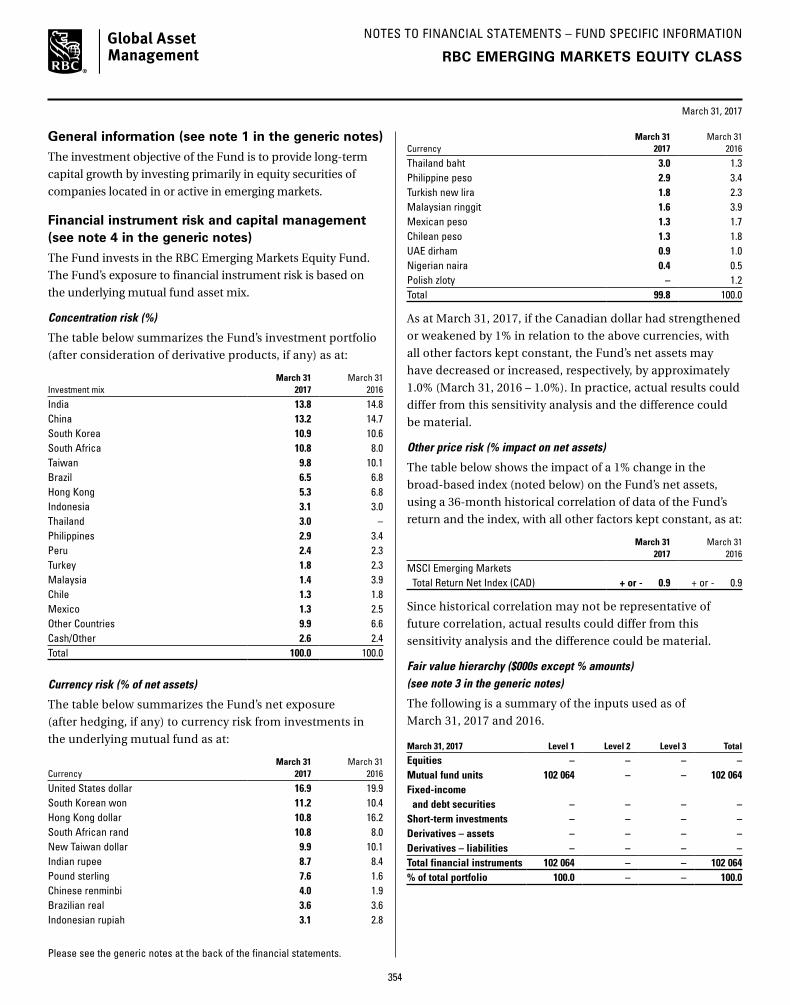
NOTES TO FINANCIAL STATEMENTS – FUND SPECIFIC INFORMATION
Please see the generic notes at the back of the financial statements.
March 31, 2017
RBC EMERGING MARKETS EQUITY CLASS
General information (see note 1 in the generic notes)
The investment objective of the Fund is to provide long-term
capital growth by investing primarily in equity securities of
companies located in or active in emerging markets.
Financial instrument risk and capital management (see note 4 in the generic notes)
The Fund invests in the RBC Emerging Markets Equity Fund.
The Fund’s exposure to financial instrument risk is based on
the underlying mutual fund asset mix.
Concentration risk (%)
The table below summarizes the Fund’s investment portfolio
(after consideration of derivative products, if any) as at:
Investment mixMarch 31
2017March 31
2016
India 13.8 14.8China 13.2 14.7South Korea 10.9 10.6South Africa 10.8 8.0Taiwan 9.8 10.1Brazil 6.5 6.8Hong Kong 5.3 6.8Indonesia 3.1 3.0Thailand 3.0 –Philippines 2.9 3.4Peru 2.4 2.3Turkey 1.8 2.3Malaysia 1.4 3.9Chile 1.3 1.8Mexico 1.3 2.5Other Countries 9.9 6.6Cash/Other 2.6 2.4Total 100.0 100.0
Currency risk (% of net assets)
The table below summarizes the Fund’s net exposure
(after hedging, if any) to currency risk from investments in
the underlying mutual fund as at:
CurrencyMarch 31
2017March 31
2016
United States dollar 16.9 19.9South Korean won 11.2 10.4Hong Kong dollar 10.8 16.2South African rand 10.8 8.0New Taiwan dollar 9.9 10.1Indian rupee 8.7 8.4Pound sterling 7.6 1.6Chinese renminbi 4.0 1.9Brazilian real 3.6 3.6Indonesian rupiah 3.1 2.8
CurrencyMarch 31
2017March 31
2016
Thailand baht 3.0 1.3Philippine peso 2.9 3.4Turkish new lira 1.8 2.3Malaysian ringgit 1.6 3.9Mexican peso 1.3 1.7Chilean peso 1.3 1.8UAE dirham 0.9 1.0Nigerian naira 0.4 0.5Polish zloty – 1.2Total 99.8 100.0
As at March 31, 2017, if the Canadian dollar had strengthened
or weakened by 1% in relation to the above currencies, with
all other factors kept constant, the Fund’s net assets may
have decreased or increased, respectively, by approximately
1.0% (March 31, 2016 – 1.0%). In practice, actual results could
differ from this sensitivity analysis and the difference could
be material.
Other price risk (% impact on net assets)
The table below shows the impact of a 1% change in the
broad-based index (noted below) on the Fund’s net assets,
using a 36-month historical correlation of data of the Fund’s
return and the index, with all other factors kept constant, as at:
March 31 2017
March 31 2016
MSCI Emerging Markets Total Return Net Index (CAD) + or - 0.9 + or - 0.9
Since historical correlation may not be representative of
future correlation, actual results could differ from this
sensitivity analysis and the difference could be material.
Fair value hierarchy ($000s except % amounts) (see note 3 in the generic notes)
The following is a summary of the inputs used as of
March 31, 2017 and 2016.
March 31, 2017 Level 1 Level 2 Level 3 Total
Equities – – – – Mutual fund units 102 064 – – 102 064Fixed-income and debt securities – – – – Short-term investments – – – – Derivatives – assets – – – – Derivatives – liabilities – – – – Total financial instruments 102 064 – – 102 064% of total portfolio 100.0 – – 100.0
354

NOTES TO FINANCIAL STATEMENTS – FUND SPECIFIC INFORMATION
Please see the generic notes at the back of the financial statements.
March 31, 2017
March 31, 2016 Level 1 Level 2 Level 3 Total
Equities – – – – Mutual fund units 76 216 – – 76 216 Fixed-income and debt securities – – – – Short-term investments – – – – Derivatives – assets – – – – Derivatives – liabilities – – – – Total financial instruments 76 216 – – 76 216 % of total portfolio 100.0 – – 100.0
For the periods ended March 31, 2017 and 2016, there were
no transfers of financial instruments between Level 1, Level 2
and Level 3.
Management fees and operating expenses (see note 6 in the generic notes)
Management fees and administration fees of each series
of the Fund are payable to RBC GAM and calculated at the
following annual percentages, before GST/HST, of the daily
net asset value of each series of the Fund.
Management fees Operating expenses
Series A 1.85% 0.10%Advisor Series 1.85% 0.10%Series D 1.00% 0.10%Series F 0.75% 0.10%Series O n/a* 0.02%
* Series O shareholders pay a negotiated management fee directly to RBC GAM for investment-counselling services.
Investments by related parties ($000s except mutual fund share amounts)
Royal Bank of Canada, or one of its subsidiaries, held the
following investments in the Fund as at:
March 31 2017
March 31 2016
Mutual fund shares held Series A 50 50 Advisor Series 50 50 Series H – 98 Series D 50 50 Series F 50 50 Series I – 97Value of all mutual fund shares 3 6
Underlying mutual fund ownership interest (%)
The table below summarizes the Fund’s interest in the
underlying mutual fund as a percentage of NAV, and the
Fund’s ownership interest as a percentage of the net assets of
the underlying fund (“Ownership”). The underlying fund is
established and conducts business in Canada, and has an
associate relationship to the Fund.
March 31 2017
March 31 2016
NAV Ownership NAV Ownership
RBC Emerging Markets Equity Fund 99.9 3.4 99.9 3.3
Taxes ($000s) (see note 5 in the generic notes)
The Fund had no capital or non-capital losses as at
March 31, 2017.
Redeemable mutual fund shares (000s)
There is no limitation on the number of mutual fund shares
available for issue. Mutual fund shares are purchased and
redeemed at the NAV per mutual fund share.
For the periods ended March 31 (see note 2 in the generic notes) 2017 2016
Series A Opening mutual fund shares 565 524Issued number of mutual fund shares 101 224Reinvested number of mutual fund shares – – Redeemed number of mutual fund shares (227) (183)Ending number of mutual fund shares 439 565
Advisor SeriesOpening mutual fund shares 113 109Issued number of mutual fund shares 114 61Reinvested number of mutual fund shares – – Redeemed number of mutual fund shares (43) (57)Ending number of mutual fund shares 184 113
Series DOpening mutual fund shares 110 106Issued number of mutual fund shares 53 46Reinvested number of mutual fund shares – – Redeemed number of mutual fund shares (31) (42)Ending number of mutual fund shares 132 110
Series FOpening mutual fund shares 1 608 822Issued number of mutual fund shares 2 499 1 418Reinvested number of mutual fund shares – – Redeemed number of mutual fund shares (604) (632)Ending number of mutual fund shares 3 503 1 608
Series OOpening mutual fund shares 2 001 2 041Issued number of mutual fund shares 194 336Reinvested number of mutual fund shares – – Redeemed number of mutual fund shares (641) (376)Ending number of mutual fund shares 1 554 2 001
RBC EMERGING MARKETS EQUITY CLASS
355

SCHEDULE OF INVESTMENT PORTFOLIO (in $000s)
ANNUAL FINANCIAL STATEMENTS
March 31, 2017
The accompanying notes are an integral part of the financial statements.
RBC GLOBAL EQUITY CLASS
Number Fair % of Net of Units Security Cost Value Assets
MUTUAL FUND UNITS 278 214 RBC Global Equity Fund* $ 3 543 $ 3 865
TOTAL MUTUAL FUND UNITS $ 3 543 3 865 100.1OTHER NET ASSETS (LIABILITIES) ATTRIBUTABLE TO HOLDERS OF REDEEMABLE SHARES (2) (0.1)NET ASSETS ATTRIBUTABLE TO HOLDERS OF REDEEMABLE SHARES $ 3 863 100.0
* Investment in related party (see note 6 in the generic notes).
356

FINANCIAL STATEMENTS
The accompanying notes are an integral part of these financial statements.
RBC GLOBAL EQUITY CLASS
Statements of Financial Position (in $000s except per mutual fund share amounts)
(see note 2 in the generic notes)March 31
2017March 31
2016
ASSETSInvestments at fair value $ 3 865 $ 4 114 Cash 3 38 Subscriptions receivable – 12 TOTAL ASSETS 3 868 4 164 LIABILITIESDue to investment dealers – 37 Accounts payable and accrued expenses 5 5 TOTAL LIABILITIES EXCLUDING NET ASSETS ATTRIBUTABLE TO HOLDERS OF REDEEMABLE MUTUAL FUND SHARES 5 42 NET ASSETS ATTRIBUTABLE TO HOLDERS OF REDEEMABLE MUTUAL FUND SHARES (“NAV”) $ 3 863 $ 4 122
Investments at cost $ 3 543 $ 4 263
NAV SERIES A $ 780 $ 743 ADVISOR SERIES $ 535 $ 513 SERIES H $ – $ 842 SERIES D $ 775 $ 562 SERIES F $ 1 772 $ 556 SERIES I $ – $ 905 SERIES O $ 1 $ 1 NAV PER MUTUAL FUND SHARE SERIES A $ 11.54 $ 10.21 ADVISOR SERIES $ 11.52 $ 10.20 SERIES H $ – $ 10.23 SERIES D $ 11.73 $ 10.30 SERIES F $ 11.80 $ 10.34 SERIES I $ – $ 10.37 SERIES O $ 12.07 $ 10.46
Statements of Comprehensive Income (in $000s except per mutual fund share amounts)
For the periods ended March 31 (see note 2 in the generic notes) 2017 2016INCOME (see note 3 in the generic notes)Other income received from underlying funds $ 67 $ 39 Capital gains received from underlying funds – 33 Net realized gain (loss) on investments 18 3 Change in unrealized gain (loss) on investments 471 (170)TOTAL INCOME (LOSS) 556 (95)EXPENSES (see notes – Fund Specific Information)Management fees 50 38 Administration fees 6 2 Independent Review Committee costs 2 3 GST/HST 5 3 Expenses reimbursed by manager (2) (3)TOTAL EXPENSES 61 43 INCREASE (DECREASE) IN NAV $ 495 $ (138)INCREASE (DECREASE) IN NAV SERIES A $ 125 $ (9) ADVISOR SERIES $ 63 $ (20) SERIES H $ 15 $ (27) SERIES D $ 85 $ (15) SERIES F $ 188 $ (23) SERIES I $ 19 $ (51) SERIES O $ – $ 7 INCREASE (DECREASE) IN NAV PER MUTUAL FUND SHARE SERIES A $ 1.26 $ (0.65) ADVISOR SERIES $ 1.32 $ (0.59) SERIES H $ 0.20 $ (0.60) SERIES D $ 1.51 $ (0.52) SERIES F $ 1.54 $ (0.43) SERIES I $ 0.30 $ (0.35) SERIES O $ 1.61 $ (0.56)
357

FINANCIAL STATEMENTS
The accompanying notes are an integral part of these financial statements.
RBC GLOBAL EQUITY CLASS
Statements of Cash Flow (in $000s)
For the periods ended March 31 (see note 2 in the generic notes) 2017 2016
CASH FLOWS FROM OPERATING ACTIVITIESIncrease (decrease) in NAV $ 495 $ (138)ADJUSTMENTS TO RECONCILE NET CASH PROVIDED BY (USED IN) OPERATIONSInterest for distribution purposes – – Net realized loss (gain) on investments (18) (3)Change in unrealized loss (gain) on investments (471) 170 (Increase) decrease in accrued receivables – – Increase (decrease) in accrued payables – 4 Cost of investments purchased (810) (3 734)Proceeds on sales of investments 1 511 710 NET CASH PROVIDED BY (USED IN) OPERATING ACTIVITIES 707 (2 991)CASH FLOWS FROM FINANCING ACTIVITIESProceeds from issue of redeemable mutual fund shares 2 327 3 806 Cash paid on redemption of redeemable mutual fund shares (3 069) (849)Distributions paid to holders of redeemable mutual fund shares – – NET CASH PROVIDED BY (USED IN) FINANCING ACTIVITIES $ (742) $ 2 957 Net increase (decrease) in cash for the period (35) (34)Cash (bank overdraft), beginning of period 38 72 CASH (BANK OVERDRAFT), END OF PERIOD $ 3 $ 38
Interest received (paid) $ – $ – Dividends received, net of withholding taxes $ – $ –
Cash consists of cash and futures contracts margin receivable/payable, as applicable.
358

FINANCIAL STATEMENTS
The accompanying notes are an integral part of these financial statements.
RBC GLOBAL EQUITY CLASS
Statements of Changes in NAV (in $000s)
For the periods ended March 31 (see note 2 in the generic notes)
Series A Advisor Series Series H Series D2017 2016 2017 2016 2017 2016 2017 2016
NAV AT BEGINNING OF PERIOD $ 743 $ 583 $ 513 $ 12 $ 842 $ 464 $ 562 $ 85 INCREASE (DECREASE) IN NAV 125 (9) 63 (20) 15 (27) 85 (15)Early redemption fees – – – – – – – – Proceeds from redeemable mutual fund shares issued 694 344 64 637 – 416 332 843 Reinvestments of distributions to holders of redeemable mutual fund shares – – – – – – – – Redemption of redeemable mutual fund shares (782) (175) (105) (116) (857) (11) (204) (351)NET INCREASE (DECREASE) FROM REDEEMABLE MUTUAL FUND SHARE TRANSACTIONS (88) 169 (41) 521 (857) 405 128 492 Distributions from net income – – – – – – – – Distributions from net gains – – – – – – – – Distributions from capital – – – – – – – – TOTAL DISTRIBUTIONS TO HOLDERS OF REDEEMABLE MUTUAL FUND SHARES – – – – – – – – NET INCREASE (DECREASE) IN NAV 37 160 22 501 (842) 378 213 477 NAV AT END OF PERIOD $ 780 $ 743 $ 535 $ 513 $ – $ 842 $ 775 $ 562
For the periods ended March 31 (see note 2 in the generic notes)
Series F Series I Series O Total2017 2016 2017 2016 2017 2016 2017 2016
NAV AT BEGINNING OF PERIOD $ 556 $ 38 $ 905 $ 1 $ 1 $ 148 $ 4 122 $ 1 331 INCREASE (DECREASE) IN NAV 188 (23) 19 (51) – 7 495 (138)Early redemption fees – – – – – – – – Proceeds from redeemable mutual fund shares issued 1 225 583 – 955 – – 2 315 3 778 Reinvestments of distributions to holders of redeemable mutual fund shares – – – – – – – – Redemption of redeemable mutual fund shares (197) (42) (924) – – (154) (3 069) (849)NET INCREASE (DECREASE) FROM REDEEMABLE MUTUAL FUND SHARE TRANSACTIONS 1 028 541 (924) 955 – (154) (754) 2 929 Distributions from net income – – – – – – – – Distributions from net gains – – – – – – – – Distributions from capital – – – – – – – – TOTAL DISTRIBUTIONS TO HOLDERS OF REDEEMABLE MUTUAL FUND SHARES – – – – – – – – NET INCREASE (DECREASE) IN NAV 1 216 518 (905) 904 – (147) (259) 2 791 NAV AT END OF PERIOD $ 1 772 $ 556 $ – $ 905 $ 1 $ 1 $ 3 863 $ 4 122
359

NOTES TO FINANCIAL STATEMENTS – FUND SPECIFIC INFORMATION
Please see the generic notes at the back of the financial statements.
March 31, 2017
RBC GLOBAL EQUITY CLASS
General information (see note 1 in the generic notes)
The investment objective of the Fund is to provide long-term
capital growth by investing primarily in equity securities of a
diversified mix of companies operating around the world and
across a range of sectors.
Financial instrument risk and capital management (see note 4 in the generic notes)
The Fund invests in the RBC Global Equity Fund. The Fund’s
exposure to financial instrument risk is based on the
underlying mutual fund asset mix.
Concentration risk (%)
The table below summarizes the Fund’s investment portfolio
(after consideration of derivative products, if any) as at:
Investment mixMarch 31
2017March 31
2016
United States 57.8 55.6Japan 5.9 5.1Netherlands 4.3 –United Kingdom 4.1 7.9Switzerland 3.6 4.9France 3.5 5.3Taiwan 3.2 3.1South Africa 2.7 2.5India 2.6 2.5Germany 2.5 3.3Belgium 2.3 2.9Other Countries 6.6 5.7Cash/Other 0.9 1.2Total 100.0 100.0
Currency risk (% of net assets)
The table below summarizes the Fund’s net exposure
(after hedging, if any) to currency risk from investments in
the underlying mutual fund as at:
CurrencyMarch 31
2017March 31
2016
United States dollar 62.5 61.9Euro 12.6 12.7Japanese yen 5.9 5.1Pound sterling 5.6 8.7Swiss franc 3.6 4.9South African rand 2.7 2.5Danish krone 1.4 –Indian rupee 1.2 –Hong Kong dollar 1.1 1.8Australian dollar 0.8 0.9Philippine peso 0.8 –Total 98.2 98.5
As at March 31, 2017, if the Canadian dollar had strengthened
or weakened by 1% in relation to the above currencies, with
all other factors kept constant, the Fund’s net assets may
have decreased or increased, respectively, by approximately
1.0% (March 31, 2016 – 1.0%). In practice, actual results could
differ from this sensitivity analysis and the difference could
be material.
Other price risk (% impact on net assets)
The table below shows the impact of a 1% change in the
broad-based index (noted below) on the Fund’s net assets,
using a 26-month (March 31, 2016 – 14-month) historical
correlation of data of the Fund’s return and the index, with all
other factors kept constant, as at:
March 31 2017
March 31 2016
MSCI World Total Return Net Index (CAD) + or - 1.1 + or - 1.1
Since historical correlation may not be representative of
future correlation, actual results could differ from this
sensitivity analysis and the difference could be material.
Fair value hierarchy ($000s except % amounts) (see note 3 in the generic notes)
The following is a summary of the inputs used as of
March 31, 2017 and 2016.
March 31, 2017 Level 1 Level 2 Level 3 Total
Equities – – – – Mutual fund units 3 865 – – 3 865Fixed-income and debt securities – – – – Short-term investments – – – – Derivatives – assets – – – – Derivatives – liabilities – – – – Total financial instruments 3 865 – – 3 865% of total portfolio 100.0 – – 100.0
March 31, 2016 Level 1 Level 2 Level 3 Total
Equities – – – – Mutual fund units 4 114 – – 4 114 Fixed-income and debt securities – – – – Short-term investments – – – – Derivatives – assets – – – – Derivatives – liabilities – – – – Total financial instruments 4 114 – – 4 114 % of total portfolio 100.0 – – 100.0
For the periods ended March 31, 2017 and 2016, there were
no transfers of financial instruments between Level 1, Level 2
and Level 3.
360
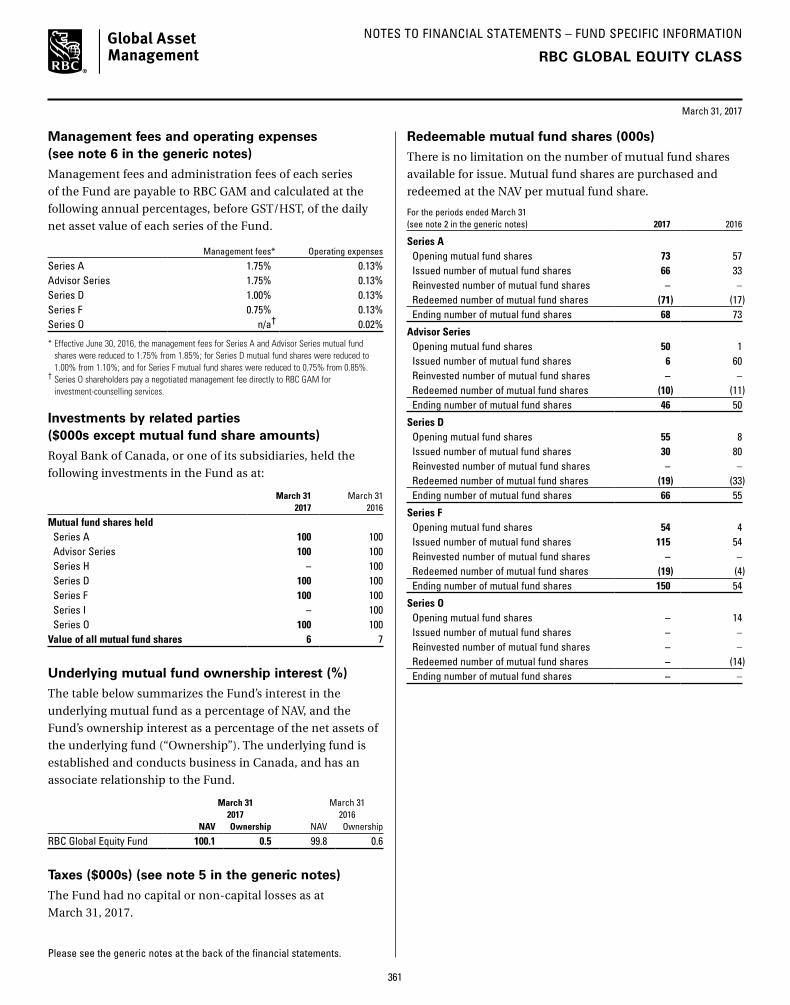
NOTES TO FINANCIAL STATEMENTS – FUND SPECIFIC INFORMATION
Please see the generic notes at the back of the financial statements.
March 31, 2017
RBC GLOBAL EQUITY CLASS
Management fees and operating expenses (see note 6 in the generic notes)
Management fees and administration fees of each series
of the Fund are payable to RBC GAM and calculated at the
following annual percentages, before GST/HST, of the daily
net asset value of each series of the Fund.
Management fees* Operating expenses
Series A 1.75% 0.13%Advisor Series 1.75% 0.13%Series D 1.00% 0.13%Series F 0.75% 0.13%Series O n/a† 0.02%
* Effective June 30, 2016, the management fees for Series A and Advisor Series mutual fund shares were reduced to 1.75% from 1.85%; for Series D mutual fund shares were reduced to 1.00% from 1.10%; and for Series F mutual fund shares were reduced to 0.75% from 0.85%.
† Series O shareholders pay a negotiated management fee directly to RBC GAM for investment-counselling services.
Investments by related parties ($000s except mutual fund share amounts)
Royal Bank of Canada, or one of its subsidiaries, held the
following investments in the Fund as at:
March 31 2017
March 31 2016
Mutual fund shares held Series A 100 100 Advisor Series 100 100 Series H – 100 Series D 100 100 Series F 100 100 Series I – 100 Series O 100 100Value of all mutual fund shares 6 7
Underlying mutual fund ownership interest (%)
The table below summarizes the Fund’s interest in the
underlying mutual fund as a percentage of NAV, and the
Fund’s ownership interest as a percentage of the net assets of
the underlying fund (“Ownership”). The underlying fund is
established and conducts business in Canada, and has an
associate relationship to the Fund.
March 31 2017
March 31 2016
NAV Ownership NAV Ownership
RBC Global Equity Fund 100.1 0.5 99.8 0.6
Taxes ($000s) (see note 5 in the generic notes)
The Fund had no capital or non-capital losses as at
March 31, 2017.
Redeemable mutual fund shares (000s)
There is no limitation on the number of mutual fund shares
available for issue. Mutual fund shares are purchased and
redeemed at the NAV per mutual fund share.
For the periods ended March 31 (see note 2 in the generic notes) 2017 2016
Series A Opening mutual fund shares 73 57Issued number of mutual fund shares 66 33Reinvested number of mutual fund shares – – Redeemed number of mutual fund shares (71) (17)Ending number of mutual fund shares 68 73
Advisor SeriesOpening mutual fund shares 50 1Issued number of mutual fund shares 6 60Reinvested number of mutual fund shares – – Redeemed number of mutual fund shares (10) (11)Ending number of mutual fund shares 46 50
Series DOpening mutual fund shares 55 8Issued number of mutual fund shares 30 80Reinvested number of mutual fund shares – – Redeemed number of mutual fund shares (19) (33)Ending number of mutual fund shares 66 55
Series FOpening mutual fund shares 54 4Issued number of mutual fund shares 115 54Reinvested number of mutual fund shares – – Redeemed number of mutual fund shares (19) (4)Ending number of mutual fund shares 150 54
Series OOpening mutual fund shares – 14Issued number of mutual fund shares – – Reinvested number of mutual fund shares – – Redeemed number of mutual fund shares – (14)Ending number of mutual fund shares – –
361

SCHEDULE OF INVESTMENT PORTFOLIO (in $000s)
ANNUAL FINANCIAL STATEMENTS
March 31, 2017
The accompanying notes are an integral part of the financial statements.
RBC QUBE LOW VOLATILITY GLOBAL EQUITY CLASS
Number Fair % of Net of Units Security Cost Value Assets
MUTUAL FUND UNITS 2 613 667 RBC QUBE Low Volatility Global Equity Fund* $ 44 926 $ 47 802
TOTAL MUTUAL FUND UNITS $ 44 926 47 802 100.0OTHER NET ASSETS ATTRIBUTABLE TO HOLDERS OF REDEEMABLE SHARES 6 –NET ASSETS ATTRIBUTABLE TO HOLDERS OF REDEEMABLE SHARES $ 47 808 100.0
* Investment in related party (see note 6 in the generic notes).
362
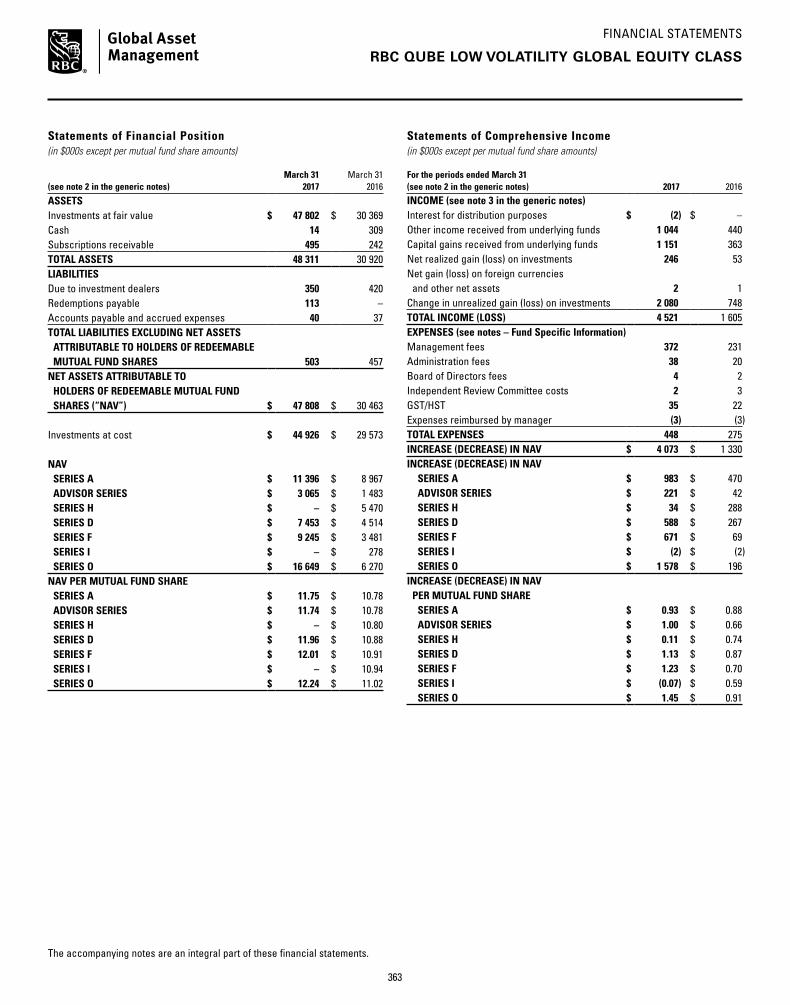
FINANCIAL STATEMENTS
The accompanying notes are an integral part of these financial statements.
RBC QUBE LOW VOLATILITY GLOBAL EQUITY CLASS
Statements of Financial Position (in $000s except per mutual fund share amounts)
(see note 2 in the generic notes)March 31
2017March 31
2016
ASSETSInvestments at fair value $ 47 802 $ 30 369 Cash 14 309 Subscriptions receivable 495 242 TOTAL ASSETS 48 311 30 920 LIABILITIESDue to investment dealers 350 420 Redemptions payable 113 –Accounts payable and accrued expenses 40 37 TOTAL LIABILITIES EXCLUDING NET ASSETS ATTRIBUTABLE TO HOLDERS OF REDEEMABLE MUTUAL FUND SHARES 503 457 NET ASSETS ATTRIBUTABLE TO HOLDERS OF REDEEMABLE MUTUAL FUND SHARES (“NAV”) $ 47 808 $ 30 463
Investments at cost $ 44 926 $ 29 573
NAV SERIES A $ 11 396 $ 8 967 ADVISOR SERIES $ 3 065 $ 1 483 SERIES H $ – $ 5 470 SERIES D $ 7 453 $ 4 514 SERIES F $ 9 245 $ 3 481 SERIES I $ – $ 278 SERIES O $ 16 649 $ 6 270 NAV PER MUTUAL FUND SHARE SERIES A $ 11.75 $ 10.78 ADVISOR SERIES $ 11.74 $ 10.78 SERIES H $ – $ 10.80 SERIES D $ 11.96 $ 10.88 SERIES F $ 12.01 $ 10.91 SERIES I $ – $ 10.94 SERIES O $ 12.24 $ 11.02
Statements of Comprehensive Income (in $000s except per mutual fund share amounts)
For the periods ended March 31 (see note 2 in the generic notes) 2017 2016INCOME (see note 3 in the generic notes)Interest for distribution purposes $ (2) $ –Other income received from underlying funds 1 044 440 Capital gains received from underlying funds 1 151 363 Net realized gain (loss) on investments 246 53 Net gain (loss) on foreign currencies and other net assets 2 1 Change in unrealized gain (loss) on investments 2 080 748 TOTAL INCOME (LOSS) 4 521 1 605 EXPENSES (see notes – Fund Specific Information)Management fees 372 231 Administration fees 38 20 Board of Directors fees 4 2 Independent Review Committee costs 2 3 GST/HST 35 22 Expenses reimbursed by manager (3) (3)TOTAL EXPENSES 448 275 INCREASE (DECREASE) IN NAV $ 4 073 $ 1 330 INCREASE (DECREASE) IN NAV SERIES A $ 983 $ 470 ADVISOR SERIES $ 221 $ 42 SERIES H $ 34 $ 288 SERIES D $ 588 $ 267 SERIES F $ 671 $ 69 SERIES I $ (2) $ (2) SERIES O $ 1 578 $ 196 INCREASE (DECREASE) IN NAV PER MUTUAL FUND SHARE SERIES A $ 0.93 $ 0.88 ADVISOR SERIES $ 1.00 $ 0.66 SERIES H $ 0.11 $ 0.74 SERIES D $ 1.13 $ 0.87 SERIES F $ 1.23 $ 0.70 SERIES I $ (0.07) $ 0.59 SERIES O $ 1.45 $ 0.91
363
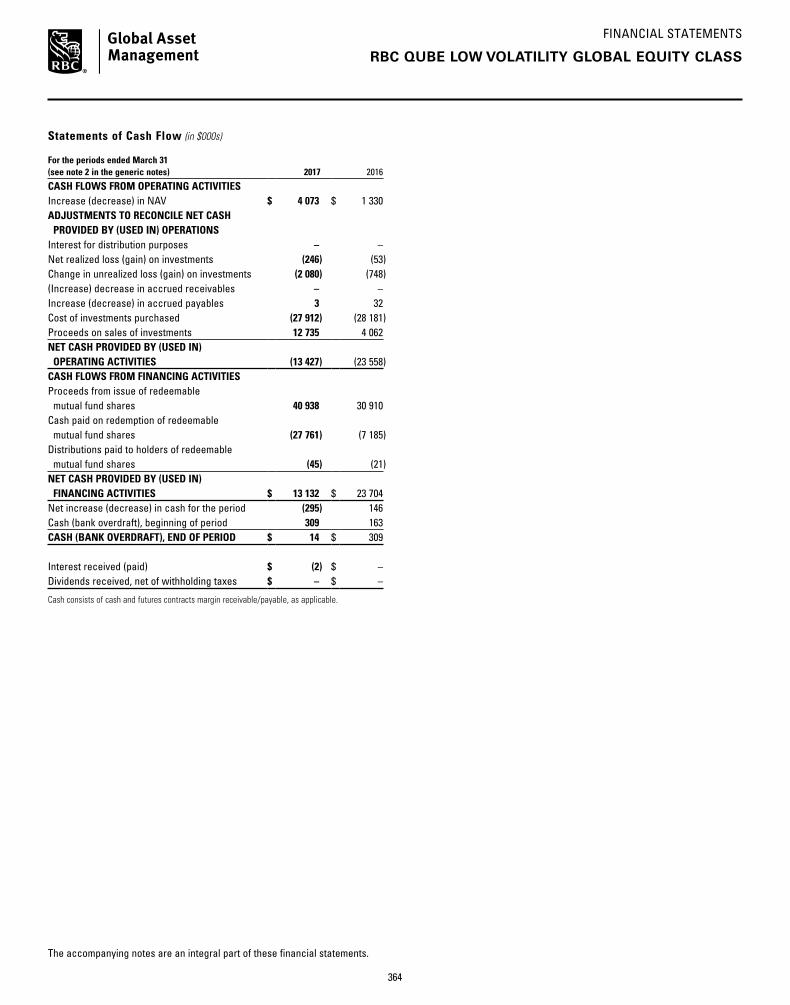
FINANCIAL STATEMENTS
The accompanying notes are an integral part of these financial statements.
RBC QUBE LOW VOLATILITY GLOBAL EQUITY CLASS
Statements of Cash Flow (in $000s)
For the periods ended March 31 (see note 2 in the generic notes) 2017
2016
CASH FLOWS FROM OPERATING ACTIVITIESIncrease (decrease) in NAV $ 4 073 $ 1 330 ADJUSTMENTS TO RECONCILE NET CASH PROVIDED BY (USED IN) OPERATIONSInterest for distribution purposes – – Net realized loss (gain) on investments (246) (53)Change in unrealized loss (gain) on investments (2 080) (748)(Increase) decrease in accrued receivables – – Increase (decrease) in accrued payables 3 32 Cost of investments purchased (27 912) (28 181)Proceeds on sales of investments 12 735 4 062 NET CASH PROVIDED BY (USED IN) OPERATING ACTIVITIES (13 427) (23 558)CASH FLOWS FROM FINANCING ACTIVITIESProceeds from issue of redeemable mutual fund shares 40 938 30 910 Cash paid on redemption of redeemable mutual fund shares (27 761) (7 185)Distributions paid to holders of redeemable mutual fund shares (45) (21)NET CASH PROVIDED BY (USED IN) FINANCING ACTIVITIES $ 13 132 $ 23 704 Net increase (decrease) in cash for the period (295) 146 Cash (bank overdraft), beginning of period 309 163 CASH (BANK OVERDRAFT), END OF PERIOD $ 14 $ 309
Interest received (paid) $ (2) $ – Dividends received, net of withholding taxes $ – $ –
Cash consists of cash and futures contracts margin receivable/payable, as applicable.
364

FINANCIAL STATEMENTS
The accompanying notes are an integral part of these financial statements.
RBC QUBE LOW VOLATILITY GLOBAL EQUITY CLASS
Statements of Changes in NAV (in $000s)
For the periods ended March 31 (see note 2 in the generic notes)
Series A Advisor Series Series H Series D2017 2016 2017 2016 2017 2016 2017 2016
NAV AT BEGINNING OF PERIOD $ 8 967 $ 4 141 $ 1 483 $ 147 $ 5 470 $ 387 $ 4 514 $ 629 INCREASE (DECREASE) IN NAV 983 470 221 42 34 288 588 267 Early redemption fees – – – – – – – – Proceeds from redeemable mutual fund shares issued 7 887 9 256 2 286 1 387 1 5 436 3 790 4 101 Reinvestments of distributions to holders of redeemable mutual fund shares 8 – 3 – – – 3 2 Redemption of redeemable mutual fund shares (6 440) (4 900) (925) (93) (5 505) (641) (1 439) (483)NET INCREASE (DECREASE) FROM REDEEMABLE MUTUAL FUND SHARE TRANSACTIONS 1 455 4 356 1 364 1 294 (5 504) 4 795 2 354 3 620 Distributions from net income (9) – (3) – – – (3) (2)Distributions from net gains – – – – – – – – Distributions from capital – – – – – – – – TOTAL DISTRIBUTIONS TO HOLDERS OF REDEEMABLE MUTUAL FUND SHARES (9) – (3) – – – (3) (2)NET INCREASE (DECREASE) IN NAV 2 429 4 826 1 582 1 336 (5 470) 5 083 2 939 3 885 NAV AT END OF PERIOD $ 11 396 $ 8 967 $ 3 065 $ 1 483 $ – $ 5 470 $ 7 453 $ 4 514
For the periods ended March 31 (see note 2 in the generic notes)
Series F Series I Series O Total2017 2016 2017 2016 2017 2016 2017 2016
NAV AT BEGINNING OF PERIOD $ 3 481 $ 61 $ 278 $ 1 $ 6 270 $ 411 $ 30 463 $ 5 777 INCREASE (DECREASE) IN NAV 671 69 (2) (2) 1 578 196 4 073 1 330 Early redemption fees – – – – – – – – Proceeds from redeemable mutual fund shares issued 8 554 3 512 – 279 18 673 6 591 41 191 30 562 Reinvestments of distributions to holders of redeemable mutual fund shares 7 3 – – – – 21 5 Redemption of redeemable mutual fund shares (3 457) (161) (276) – (9 832) (907) (27 874) (7 185)NET INCREASE (DECREASE) FROM REDEEMABLE MUTUAL FUND SHARE TRANSACTIONS 5 104 3 354 (276) 279 8 841 5 684 13 338 23 382 Distributions from net income (11) (3) – – (40) (21) (66) (26)Distributions from net gains – – – – – – – – Distributions from capital – – – – – – – – TOTAL DISTRIBUTIONS TO HOLDERS OF REDEEMABLE MUTUAL FUND SHARES (11) (3) – – (40) (21) (66) (26)NET INCREASE (DECREASE) IN NAV 5 764 3 420 (278) 277 10 379 5 859 17 345 24 686 NAV AT END OF PERIOD $ 9 245 $ 3 481 $ – $ 278 $ 16 649 $ 6 270 $ 47 808 $ 30 463
365

NOTES TO FINANCIAL STATEMENTS – FUND SPECIFIC INFORMATION
Please see the generic notes at the back of the financial statements.
March 31, 2017
RBC QUBE LOW VOLATILITY GLOBAL EQUITY CLASS
General information (see note 1 in the generic notes)
The investment objective of the Fund is to provide long-term
capital growth by investing primarily in equity securities of
global companies. The Fund uses a quantitative approach
and seeks to achieve a reduced level of volatility of returns
compared with the broader global equity market.
Financial instrument risk and capital management (see note 4 in the generic notes)
The Fund invests in the RBC QUBE Low Volatility Global
Equity Fund. The Fund’s exposure to financial instrument
risk is based on the underlying mutual fund asset mix.
Concentration risk (%)
The table below summarizes the Fund’s investment portfolio
(after consideration of derivative products, if any) as at:
Investment mixMarch 31
2017March 31
2016
United States 56.2 62.1Japan 13.5 11.4Canada 7.1 3.9Switzerland 4.6 3.9Hong Kong 4.3 4.6Belgium 3.5 1.9Israel 3.5 1.9Singapore 1.9 1.8United Kingdom 1.5 2.3Other Countries 3.6 6.0Cash/Other 0.3 0.2Total 100.0 100.0
Currency risk (% of net assets)
The table below summarizes the Fund’s net exposure
(after hedging, if any) to currency risk from investments in
the underlying mutual fund as at:
CurrencyMarch 31
2017March 31
2016
United States dollar 57.3 62.3Japanese yen 13.6 11.4Euro 6.1 6.5Swiss franc 4.6 3.9Hong Kong dollar 4.3 4.6Israeli new shekel 2.6 1.8Singapore dollar 1.9 1.8Pound sterling 1.5 2.3Australian dollar 0.7 1.5Swedish krona 0.3 –Total 92.9 96.1
As at March 31, 2017, if the Canadian dollar had strengthened
or weakened by 1% in relation to the above currencies, with
all other factors kept constant, the Fund’s net assets may
have decreased or increased, respectively, by approximately
0.9% (March 31, 2016 – 1.0%). In practice, actual results could
differ from this sensitivity analysis and the difference could
be material.
Other price risk (% impact on net assets)
The table below shows the impact of a 1% change in the
broad-based index (noted below) on the Fund’s net assets,
using a 26-month (March 31, 2016 – 14-month) historical
correlation of data of the Fund’s return and the index, with all
other factors kept constant, as at:
March 31 2017
March 31 2016
MSCI World Total Return Net Index (CAD) + or - 0.7 + or - 0.7
Since historical correlation may not be representative of
future correlation, actual results could differ from this
sensitivity analysis and the difference could be material.
Fair value hierarchy ($000s except % amounts) (see note 3 in the generic notes)
The following is a summary of the inputs used as of
March 31, 2017 and 2016.
March 31, 2017 Level 1 Level 2 Level 3 Total
Equities – – – – Mutual fund units 47 802 – – 47 802Fixed-income and debt securities – – – – Short-term investments – – – – Derivatives – assets – – – – Derivatives – liabilities – – – – Total financial instruments 47 802 – – 47 802% of total portfolio 100.0 – – 100.0
March 31, 2016 Level 1 Level 2 Level 3 Total
Equities – – – – Mutual fund units 30 369 – – 30 369 Fixed-income and debt securities – – – – Short-term investments – – – – Derivatives – assets – – – – Derivatives – liabilities – – – – Total financial instruments 30 369 – – 30 369 % of total portfolio 100.0 – – 100.0
For the periods ended March 31, 2017 and 2016, there were
no transfers of financial instruments between Level 1, Level 2
and Level 3.
366

NOTES TO FINANCIAL STATEMENTS – FUND SPECIFIC INFORMATION
Please see the generic notes at the back of the financial statements.
March 31, 2017
RBC QUBE LOW VOLATILITY GLOBAL EQUITY CLASS
Management fees and operating expenses (see note 6 in the generic notes)
Management fees and administration fees of each series
of the Fund are payable to RBC GAM and calculated at the
following annual percentages, before GST/HST, of the daily
net asset value of each series of the Fund.
Management fees* Operating expenses
Series A 1.75% 0.13%Advisor Series 1.75% 0.13%Series D 1.00% 0.13%Series F 0.75% 0.13%Series O n/a† 0.02%
* Effective June 30, 2016, the management fees for Series A and Advisor Series mutual fund shares were reduced to 1.75% from 1.85%; for Series D mutual fund shares were reduced to 1.00% from 1.10%; and for Series F mutual fund shares were reduced to 0.75% from 0.85%.
† Series O shareholders pay a negotiated management fee directly to RBC GAM for investment-counselling services.
Investments by related parties ($000s except mutual fund share amounts)
Royal Bank of Canada, or one of its subsidiaries, held the
following investments in the Fund as at:
March 31 2017
March 31 2016
Mutual fund shares held Series A 100 100 Advisor Series 100 100 Series H – 100 Series D 100 100 Series F 100 100 Series I – 100 Series O 101 100Value of all mutual fund shares 6 8
Underlying mutual fund ownership interest (%)
The table below summarizes the Fund’s interest in the
underlying mutual fund as a percentage of NAV, and the
Fund’s ownership interest as a percentage of the net assets of
the underlying fund (“Ownership”). The underlying fund is
established and conducts business in Canada, and has an
associate relationship to the Fund.
March 31 2017
March 31 2016
NAV Ownership NAV Ownership
RBC QUBE Low Volatility Global Equity Fund 100.0 5.6 99.7 5.7
Taxes ($000s) (see note 5 in the generic notes)
The Fund had no capital or non-capital losses as at
March 31, 2017.
Redeemable mutual fund shares (000s)
There is no limitation on the number of mutual fund shares
available for issue. Mutual fund shares are purchased and
redeemed at the NAV per mutual fund share.
For the periods ended March 31 (see note 2 in the generic notes) 2017 2016
Series A Opening mutual fund shares 832 408Issued number of mutual fund shares 717 891Reinvested number of mutual fund shares 1 – Redeemed number of mutual fund shares (580) (467)Ending number of mutual fund shares 970 832
Advisor SeriesOpening mutual fund shares 138 14Issued number of mutual fund shares 206 133Reinvested number of mutual fund shares – – Redeemed number of mutual fund shares (83) (9)Ending number of mutual fund shares 261 138
Series DOpening mutual fund shares 415 62Issued number of mutual fund shares 336 398Reinvested number of mutual fund shares – – Redeemed number of mutual fund shares (128) (45)Ending number of mutual fund shares 623 415
Series FOpening mutual fund shares 319 6Issued number of mutual fund shares 756 328Reinvested number of mutual fund shares 1 – Redeemed number of mutual fund shares (306) (15)Ending number of mutual fund shares 770 319
Series OOpening mutual fund shares 569 40Issued number of mutual fund shares 1 641 612Reinvested number of mutual fund shares – – Redeemed number of mutual fund shares (849) (83)Ending number of mutual fund shares 1 361 569
367
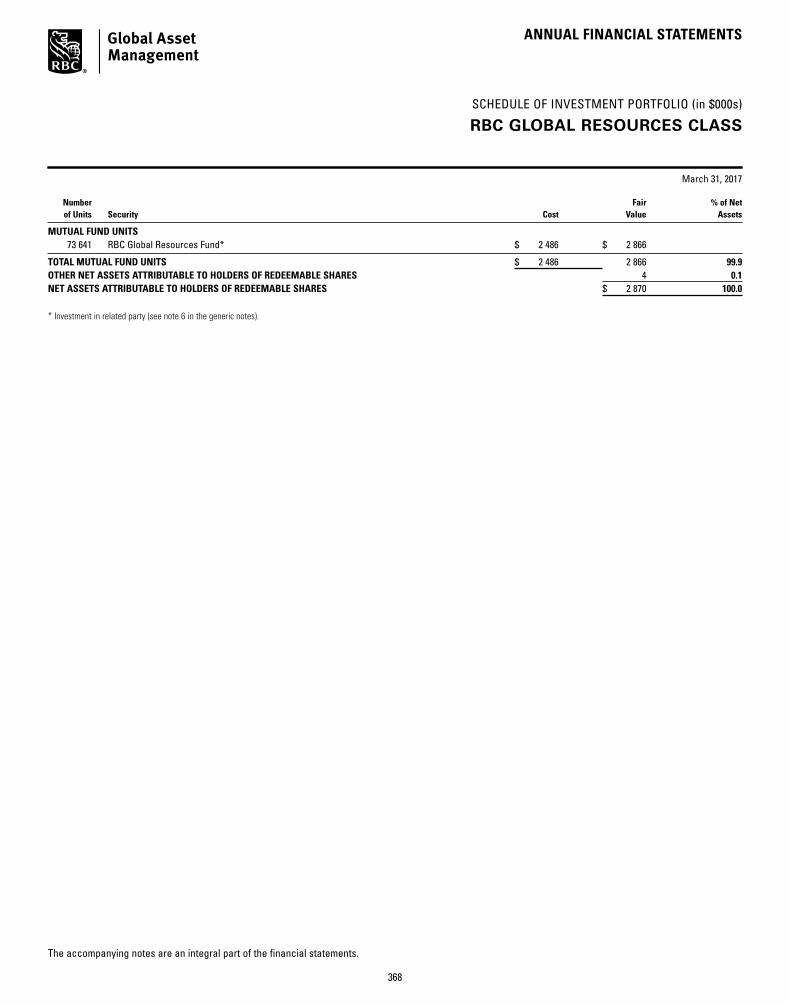
SCHEDULE OF INVESTMENT PORTFOLIO (in $000s)
ANNUAL FINANCIAL STATEMENTS
March 31, 2017
The accompanying notes are an integral part of the financial statements.
RBC GLOBAL RESOURCES CLASS
Number Fair % of Net of Units Security Cost Value Assets
MUTUAL FUND UNITS 73 641 RBC Global Resources Fund* $ 2 486 $ 2 866
TOTAL MUTUAL FUND UNITS $ 2 486 2 866 99.9OTHER NET ASSETS ATTRIBUTABLE TO HOLDERS OF REDEEMABLE SHARES 4 0.1NET ASSETS ATTRIBUTABLE TO HOLDERS OF REDEEMABLE SHARES $ 2 870 100.0
* Investment in related party (see note 6 in the generic notes).
368
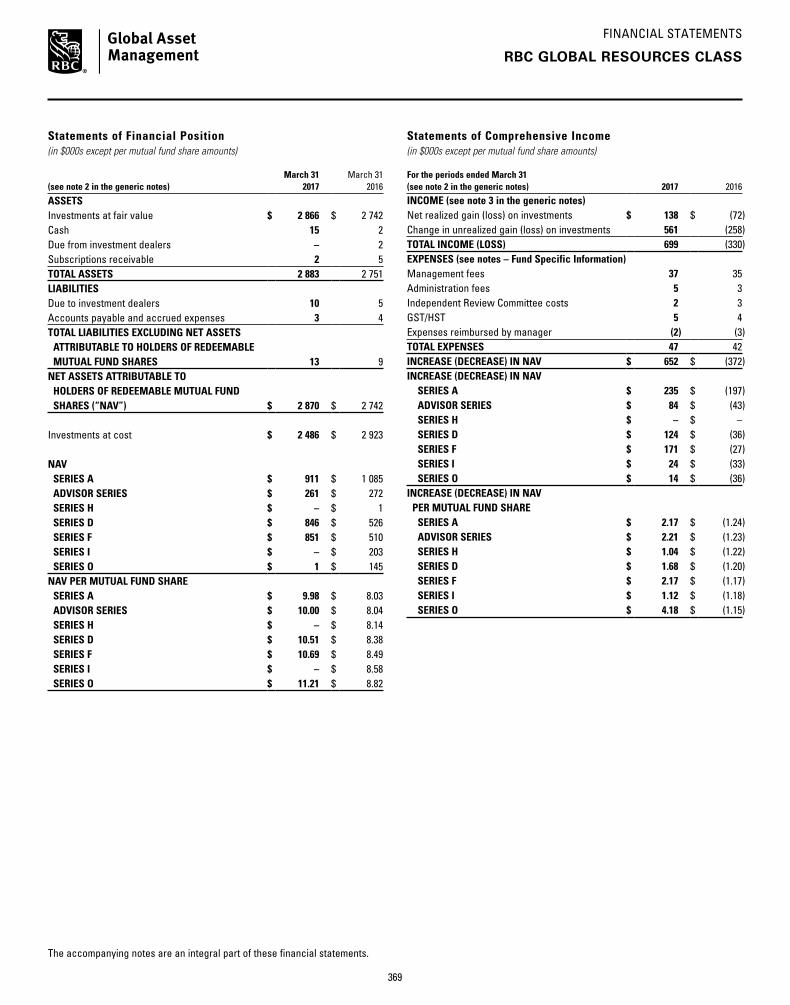
FINANCIAL STATEMENTS
The accompanying notes are an integral part of these financial statements.
RBC GLOBAL RESOURCES CLASS
Statements of Financial Position (in $000s except per mutual fund share amounts)
(see note 2 in the generic notes)March 31
2017March 31
2016
ASSETSInvestments at fair value $ 2 866 $ 2 742 Cash 15 2 Due from investment dealers – 2 Subscriptions receivable 2 5 TOTAL ASSETS 2 883 2 751 LIABILITIESDue to investment dealers 10 5 Accounts payable and accrued expenses 3 4 TOTAL LIABILITIES EXCLUDING NET ASSETS ATTRIBUTABLE TO HOLDERS OF REDEEMABLE MUTUAL FUND SHARES 13 9 NET ASSETS ATTRIBUTABLE TO HOLDERS OF REDEEMABLE MUTUAL FUND SHARES (“NAV”) $ 2 870 $ 2 742
Investments at cost $ 2 486 $ 2 923
NAV SERIES A $ 911 $ 1 085 ADVISOR SERIES $ 261 $ 272 SERIES H $ – $ 1 SERIES D $ 846 $ 526 SERIES F $ 851 $ 510 SERIES I $ – $ 203 SERIES O $ 1 $ 145 NAV PER MUTUAL FUND SHARE SERIES A $ 9.98 $ 8.03 ADVISOR SERIES $ 10.00 $ 8.04 SERIES H $ – $ 8.14 SERIES D $ 10.51 $ 8.38 SERIES F $ 10.69 $ 8.49 SERIES I $ – $ 8.58 SERIES O $ 11.21 $ 8.82
Statements of Comprehensive Income (in $000s except per mutual fund share amounts)
For the periods ended March 31 (see note 2 in the generic notes) 2017 2016INCOME (see note 3 in the generic notes)Net realized gain (loss) on investments $ 138 $ (72)Change in unrealized gain (loss) on investments 561 (258)TOTAL INCOME (LOSS) 699 (330)EXPENSES (see notes – Fund Specific Information)Management fees 37 35 Administration fees 5 3 Independent Review Committee costs 2 3 GST/HST 5 4 Expenses reimbursed by manager (2) (3)TOTAL EXPENSES 47 42 INCREASE (DECREASE) IN NAV $ 652 $ (372)INCREASE (DECREASE) IN NAV SERIES A $ 235 $ (197) ADVISOR SERIES $ 84 $ (43) SERIES H $ – $ – SERIES D $ 124 $ (36) SERIES F $ 171 $ (27) SERIES I $ 24 $ (33) SERIES O $ 14 $ (36)INCREASE (DECREASE) IN NAV PER MUTUAL FUND SHARE SERIES A $ 2.17 $ (1.24) ADVISOR SERIES $ 2.21 $ (1.23) SERIES H $ 1.04 $ (1.22) SERIES D $ 1.68 $ (1.20) SERIES F $ 2.17 $ (1.17) SERIES I $ 1.12 $ (1.18) SERIES O $ 4.18 $ (1.15)
369

FINANCIAL STATEMENTS
The accompanying notes are an integral part of these financial statements.
RBC GLOBAL RESOURCES CLASS
Statements of Cash Flow (in $000s)
For the periods ended March 31 (see note 2 in the generic notes) 2017
2016
CASH FLOWS FROM OPERATING ACTIVITIES Increase (decrease) in NAV $ 652 $ (372)ADJUSTMENTS TO RECONCILE NET CASH PROVIDED BY (USED IN) OPERATIONSInterest for distribution purposes – – Net realized loss (gain) on investments (138) 72 Change in unrealized loss (gain) on investments (561) 258 (Increase) decrease in accrued receivables – – Increase (decrease) in accrued payables (1) 1 Cost of investments purchased (885) (1 350)Proceeds on sales of investments 1 467 770 NET CASH PROVIDED BY (USED IN) OPERATING ACTIVITIES 534 (621)CASH FLOWS FROM FINANCING ACTIVITIESProceeds from issue of redeemable mutual fund shares 1 617 1 517 Cash paid on redemption of redeemable mutual fund shares (2 138) (897)Distributions paid to holders of redeemable mutual fund shares – – NET CASH PROVIDED BY (USED IN) FINANCING ACTIVITIES $ (521) $ 620 Net increase (decrease) in cash for the period 13 (1)Cash (bank overdraft), beginning of period 2 3 CASH (BANK OVERDRAFT), END OF PERIOD $ 15 $ 2
Interest received (paid) $ – $ – Dividends received, net of withholding taxes $ – $ –
Cash consists of cash and futures contracts margin receivable/payable, as applicable.
370
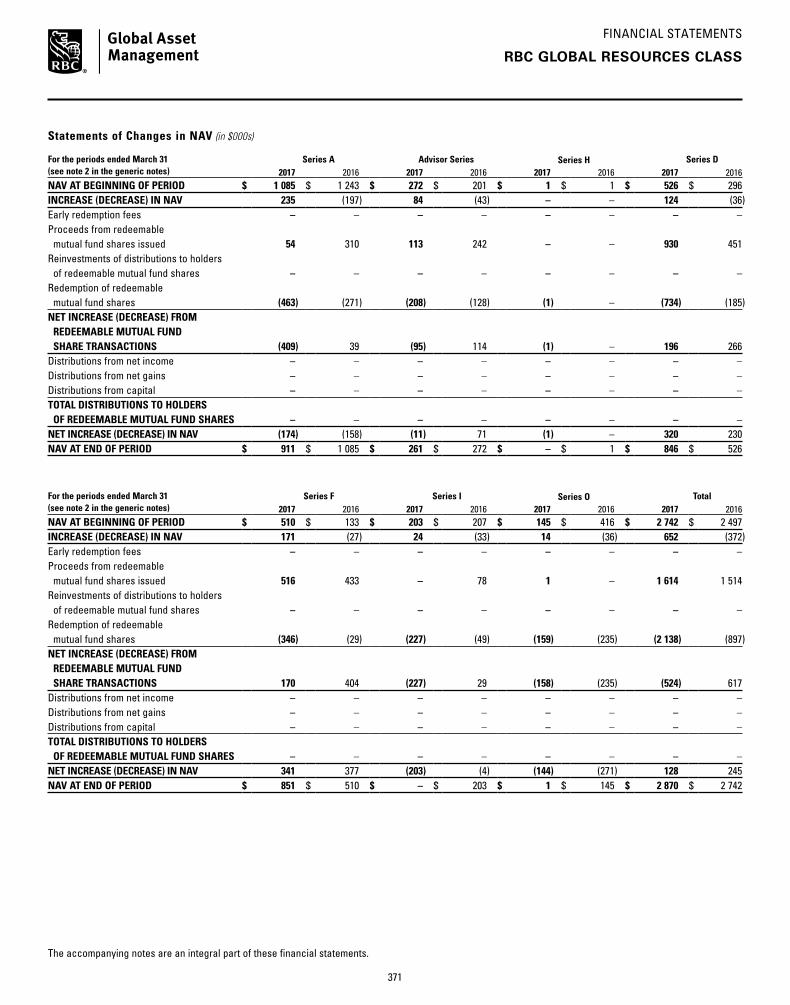
FINANCIAL STATEMENTS
The accompanying notes are an integral part of these financial statements.
RBC GLOBAL RESOURCES CLASS
Statements of Changes in NAV (in $000s)
For the periods ended March 31 (see note 2 in the generic notes)
Series A Advisor Series Series H Series D2017 2016 2017 2016 2017 2016 2017 2016
NAV AT BEGINNING OF PERIOD $ 1 085 $ 1 243 $ 272 $ 201 $ 1 $ 1 $ 526 $ 296 INCREASE (DECREASE) IN NAV 235 (197) 84 (43) – – 124 (36)Early redemption fees – – – – – – – – Proceeds from redeemable mutual fund shares issued 54 310 113 242 – – 930 451 Reinvestments of distributions to holders of redeemable mutual fund shares – – – – – – – – Redemption of redeemable mutual fund shares (463) (271) (208) (128) (1) – (734) (185)NET INCREASE (DECREASE) FROM REDEEMABLE MUTUAL FUND SHARE TRANSACTIONS (409) 39 (95) 114 (1) – 196 266 Distributions from net income – – – – – – – – Distributions from net gains – – – – – – – – Distributions from capital – – – – – – – – TOTAL DISTRIBUTIONS TO HOLDERS OF REDEEMABLE MUTUAL FUND SHARES – – – – – – – – NET INCREASE (DECREASE) IN NAV (174) (158) (11) 71 (1) – 320 230 NAV AT END OF PERIOD $ 911 $ 1 085 $ 261 $ 272 $ – $ 1 $ 846 $ 526
For the periods ended March 31 (see note 2 in the generic notes)
Series F Series I Series O Total2017 2016 2017 2016 2017 2016 2017 2016
NAV AT BEGINNING OF PERIOD $ 510 $ 133 $ 203 $ 207 $ 145 $ 416 $ 2 742 $ 2 497 INCREASE (DECREASE) IN NAV 171 (27) 24 (33) 14 (36) 652 (372)Early redemption fees – – – – – – – – Proceeds from redeemable mutual fund shares issued 516 433 – 78 1 – 1 614 1 514 Reinvestments of distributions to holders of redeemable mutual fund shares – – – – – – – – Redemption of redeemable mutual fund shares (346) (29) (227) (49) (159) (235) (2 138) (897)NET INCREASE (DECREASE) FROM REDEEMABLE MUTUAL FUND SHARE TRANSACTIONS 170 404 (227) 29 (158) (235) (524) 617 Distributions from net income – – – – – – – – Distributions from net gains – – – – – – – – Distributions from capital – – – – – – – – TOTAL DISTRIBUTIONS TO HOLDERS OF REDEEMABLE MUTUAL FUND SHARES – – – – – – – – NET INCREASE (DECREASE) IN NAV 341 377 (203) (4) (144) (271) 128 245 NAV AT END OF PERIOD $ 851 $ 510 $ – $ 203 $ 1 $ 145 $ 2 870 $ 2 742
371

NOTES TO FINANCIAL STATEMENTS – FUND SPECIFIC INFORMATION
Please see the generic notes at the back of the financial statements.
March 31, 2017
RBC GLOBAL RESOURCES CLASS
General information (see note 1 in the generic notes)
The investment objective of the Fund is to provide long-term
capital growth by investing in equity securities of companies
around the world in any or all of the Energy, Materials,
Industrials and Utilities sectors.
Financial instrument risk and capital management (see note 4 in the generic notes)
The Fund invests in the RBC Global Resources Fund. The
Fund’s exposure to financial instrument risk is based on the
underlying mutual fund asset mix.
Concentration risk (%)
The table below summarizes the Fund’s investment portfolio
(after consideration of derivative products, if any) as at:
Investment mixMarch 31
2017March 31
2016
Oil, Gas and Consumable Fuels 40.1 46.2Metals and Mining 28.7 11.8Energy Equipment and Services 10.5 5.1Chemicals 7.6 19.6Paper and Forest Products 5.5 2.5Construction Materials 3.8 4.2Containers and Packaging 2.1 3.9Semiconductors and Semiconductor Equipment – 1.1Cash/Other 1.7 5.6Total 100.0 100.0
Currency risk (% of net assets)
The table below summarizes the Fund’s net exposure
(after hedging, if any) to currency risk from investments in
the underlying mutual fund as at:
CurrencyMarch 31
2017March 31
2016
United States dollar 40.7 44.0Pound sterling 6.8 4.3Euro 4.8 8.5Australian dollar 0.7 –Norwegian krone 0.3 0.7Japanese yen – 0.5Swiss franc – 1.2Total 53.3 59.2
As at March 31, 2017, if the Canadian dollar had strengthened
or weakened by 1% in relation to the above currencies, with
all other factors kept constant, the Fund’s net assets may
have decreased or increased, respectively, by approximately
0.5% (March 31, 2016 – 0.6%). In practice, actual results could
differ from this sensitivity analysis and the difference could
be material.
Other price risk (% impact on net assets)
The table below shows the impact of a 1% change in the
broad-based index (noted below) on the Fund’s net assets,
using a 36-month historical correlation of data of the Fund’s
return and the index, with all other factors kept constant, as at:
March 31 2017
March 31 2016
MSCI World Total Return Net Index (CAD) + or - 0.4 + or - 0.6
Since historical correlation may not be representative of
future correlation, actual results could differ from this
sensitivity analysis and the difference could be material.
Fair value hierarchy ($000s except % amounts) (see note 3 in the generic notes)
The following is a summary of the inputs used as of
March 31, 2017 and 2016.
March 31, 2017 Level 1 Level 2 Level 3 Total
Equities – – – – Mutual fund units 2 866 – – 2 866Fixed-income and debt securities – – – – Short-term investments – – – – Derivatives – assets – – – – Derivatives – liabilities – – – – Total financial instruments 2 866 – – 2 866% of total portfolio 100.0 – – 100.0
March 31, 2016 Level 1 Level 2 Level 3 Total
Equities – – – – Mutual fund units 2 742 – – 2 742 Fixed-income and debt securities – – – – Short-term investments – – – – Derivatives – assets – – – – Derivatives – liabilities – – – – Total financial instruments 2 742 – – 2 742 % of total portfolio 100.0 – – 100.0
For the periods ended March 31, 2017 and 2016, there were
no transfers of financial instruments between Level 1, Level 2
and Level 3.
Management fees and operating expenses (see note 6 in the generic notes)
Management fees and administration fees of each series
of the Fund are payable to RBC GAM and calculated at the
following annual percentages, before GST/HST, of the daily
net asset value of each series of the Fund.
372

NOTES TO FINANCIAL STATEMENTS – FUND SPECIFIC INFORMATION
Please see the generic notes at the back of the financial statements.
March 31, 2017
RBC GLOBAL RESOURCES CLASS
Management fees* Operating expenses
Series A 1.75% 0.18%Advisor Series 1.75% 0.18%Series D 1.00% 0.13%Series F 0.75% 0.13%Series O n/a† 0.02%
* Effective June 30, 2016, the management fees for Series A and Advisor Series mutual fund shares were reduced to 1.75% from 1.85%.
† Series O shareholders pay a negotiated management fee directly to RBC GAM for investment-counselling services.
Investments by related parties ($000s except mutual fund share amounts)
Royal Bank of Canada, or one of its subsidiaries, held the
following investments in the Fund as at:
March 31 2017
March 31 2016
Mutual fund shares held Series A 50 50 Advisor Series 50 50 Series H – 121 Series D 50 50 Series F 50 50 Series I – 121 Series O 52 –Value of all mutual fund shares 3 4
Underlying mutual fund ownership interest (%)
The table below summarizes the Fund’s interest in the
underlying mutual fund as a percentage of NAV, and the
Fund’s ownership interest as a percentage of the net assets of
the underlying fund (“Ownership”). The underlying fund is
established and conducts business in Canada, and has an
associate relationship to the Fund.
March 31 2017
March 31 2016
NAV Ownership NAV Ownership
RBC Global Resources Fund 99.9 1.7 100.0 1.8
Taxes ($000s) (see note 5 in the generic notes)
The Fund had no capital or non-capital losses as at
March 31, 2017.
Redeemable mutual fund shares (000s)
There is no limitation on the number of mutual fund shares
available for issue. Mutual fund shares are purchased and
redeemed at the NAV per mutual fund share.
For the periods ended March 31 (see note 2 in the generic notes) 2017 2016
Series A Opening mutual fund shares 135 135Issued number of mutual fund shares 5 34Reinvested number of mutual fund shares – – Redeemed number of mutual fund shares (49) (34)Ending number of mutual fund shares 91 135
Advisor SeriesOpening mutual fund shares 34 22Issued number of mutual fund shares 13 28Reinvested number of mutual fund shares – – Redeemed number of mutual fund shares (21) (16)Ending number of mutual fund shares 26 34
Series DOpening mutual fund shares 63 31Issued number of mutual fund shares 92 53Reinvested number of mutual fund shares – – Redeemed number of mutual fund shares (75) (21)Ending number of mutual fund shares 80 63
Series FOpening mutual fund shares 60 14Issued number of mutual fund shares 53 49Reinvested number of mutual fund shares – – Redeemed number of mutual fund shares (33) (3)Ending number of mutual fund shares 80 60
Series OOpening mutual fund shares 16 42Issued number of mutual fund shares – – Reinvested number of mutual fund shares – – Redeemed number of mutual fund shares (16) (26)Ending number of mutual fund shares – 16
373
GENERIC NOTES TO FINANCIAL STATEMENTS
March 31, 2017
(also see Fund Specific Information)
1. The FundsThe mutual funds (“Fund” or “Funds”) are classes of mutual fund shares of RBC Corporate Class Inc. (the “Corporation”). The Corporation is a mutual fund corporation incorporated under the laws of Canada by articles of incorporation dated July 8, 2011. RBC GAM is the manager and portfolio manager of the Funds and its head office is located at 155 Wellington Street West, 22nd Floor, Toronto, Ontario. These financial statements were approved for issuance by the Board of Directors of the Corporation on May 11, 2017.
The Funds may issue an unlimited number of mutual fund shares in some or all of Series A, Advisor Series, Advisor T5 Series, Series T5, Series H, Series D, Series F, Series FT5, Series I and Series O.
Series A and Series T5 mutual fund shares have no sales charges and are available to all investors. Series T5 shareholders receive regular monthly distributions.
Advisor Series and Advisor T5 Series mutual fund shares are available to all investors with an initial sales charge or low-load sales charge option. Under the initial sales charge option, investors pay a sales commission ranging from 0% to 5% of the amount invested. Under the low-load sales charge option, investors do not pay a commission. Advisor T5 Series shareholders receive regular monthly distributions.
Series H mutual fund shares have no sales charges, have lower fees than Series A mutual fund shares and are only available to investors who invest and maintain the required minimum balance.
Series D mutual fund shares have no sales charges and have lower fees than Series A mutual fund shares. Series D mutual fund shares are only available to investors who have accounts with RBC Direct Investing Inc. or Phillips, Hager & North Investment Funds Ltd.
Series F and Series FT5 mutual fund shares have no sales charges and have lower fees than Series A mutual fund shares. Series F mutual fund shares are only available to investors who have accounts with dealers who have signed a fee-based agreement with RBC GAM. Series FT5 shareholders receive regular monthly distributions.
Series I mutual fund shares have no sales charges, have lower fees than Series F mutual fund shares and are only available to investors who invest and maintain the required minimum balance and who have accounts with dealers who have signed a fee-based agreement with RBC GAM.
Series O mutual fund shares have no management fees. Series O shareholders pay a negotiated fee directly to RBC GAM.
2. Financial year/period
The information provided in these financial statements and
notes thereto is for the 12-month periods ended or as at
March 31, 2017 and 2016. In the year a Fund or series is
established, “period” represents the period from inception to
March 31 of that fiscal year.
3. Summary of significant accounting policies
These financial statements have been prepared in
compliance with International Financial Reporting Standards
(“IFRS”), which include estimates and assumptions made by
management that may affect the reported amounts of assets
(primarily valuation of investments), liabilities, income and
expenses during the reported period. Actual results may differ
from estimates. The significant accounting policies of the
Funds, which are investment entities, are as follows:
Classification of Financial Assets and Liabilities The
Funds’ financial assets and financial liabilities, other than
derivatives, are designated at fair value through profit or
loss at inception, as those financial assets and liabilities are
managed together and their performance evaluated on a
fair value basis in accordance with the Funds’ documented
investment strategy. Derivatives are classified as held for
trading and measured at fair value through profit or loss.
Unrealized gains (losses) arising on derivatives are shown
on the respective Fund’s Statements of Financial Position
and such amounts are included in the Statements of
Comprehensive Income in “Change in unrealized gain (loss)
on investments,” where applicable. Realized gains arising on
derivatives during a period are included in the Statements
of Comprehensive Income in “Other derivatives,” where
applicable. Refer to note 3 for net gains (losses) on financial
instruments by category.
Classification of Redeemable Shares The Funds have
multiple features across the different series of the Funds.
Consequently, the Funds’ outstanding redeemable shares
are classified as financial liabilities in accordance with the
requirements of IAS 32 Financial Instruments: Presentation.
Unconsolidated Structured Entities The Funds may invest
in other Funds managed by the manager or an affiliate of
the manager (“Investee Funds”). The Investee Funds are
determined to be unconsolidated structured entities, as
decision making in the Investee Fund is not governed by the
voting rights or other similar rights held by the Fund. The
374

GENERIC NOTES TO FINANCIAL STATEMENTS
March 31, 2017
(also see Fund Specific Information)
investments in Investee Funds are subject to the terms and
conditions of the offering documentation of the respective
Investee Funds and are susceptible to market price risk arising
from uncertainties about future values of those Investee
Funds. The Investee Funds’ objectives are generally to achieve
long-term capital appreciation and/or current income by
investing in a portfolio of securities and other funds in
line with each of their documented investment strategies.
The Investee Funds apply various investment strategies to
accomplish their respective investment objectives.
The Investee Funds finance their operations by issuing
redeemable units which are puttable at the unitholder’s
option, and entitle the unitholder to a proportional stake in
the respective Fund’s net assets.
The Funds do not consolidate their investment in underlying
funds but account for these investments at fair value. The
manager has determined that the Funds are investment
entities in accordance with IFRS 10 Consolidated Financial
Statements, since the Funds meet the following criteria:
(i) The Funds obtain capital from one or more investors for
the purpose of providing those investors with investment
management services,
(ii) The Funds commit to their investors that their business
purpose is to invest funds solely for the returns from
capital appreciation, investment income or both and
(iii) The Funds measure and evaluate the performance of
substantially all of their investments on a fair value basis.
Therefore, the fair value of the investment in the Investee
Fund is included in the Schedule of Investment Portfolio
and included in “Investments at fair value” in the Fund’s
Statements of Financial Position. The change in fair value
of the investment held in the Investee Fund is included in
“Change in unrealized gain (loss) on investments” in the
Statements of Comprehensive Income.
Determination of Fair Value The fair value of a financial
instrument is the amount at which the financial instrument
could be exchanged in an arm’s-length transaction between
knowledgeable and willing parties under no compulsion to
act. In determining fair value, a three-tier hierarchy based on
inputs is used to value the Funds’ financial instruments. The
hierarchy of inputs is summarized below:
Level 1 – quoted prices (unadjusted) in active markets for
identical assets or liabilities;
Level 2 – inputs other than quoted prices included in Level 1
that are observable for the asset or liability, either directly
(i.e., as prices) or indirectly (i.e., derived from prices); and
Level 3 – inputs for the asset or liability that are not based on
observable market data (unobservable inputs).
Changes in valuation methods may result in transfers into or
out of an investment’s assigned level.
The three-tier hierarchy of investments and derivatives is
included in “Notes to Financial Statements – Fund Specific
Information.”
Investments are recorded at fair value, which is determined
as follows:
Mutual Fund Unit Valuation – Units of Funds are valued at their
respective net asset value per unit from fund companies on
the relevant valuation dates.
Fair Valuation of Investments – The Funds have procedures to
determine the fair value of securities and other financial
instruments for which market prices are not readily available
or which may not be reliably priced. Under these fair
valuation procedures, the Funds primarily employ a market-
based approach, which may use related or comparable assets
or liabilities, recent transactions, market multiples, book
values and other relevant information for the investment
to determine its fair value. The Funds may also use an
income-based valuation approach in which the anticipated
future cash flows of the investment are discounted to
calculate fair value. Discounts may also be applied due to
the nature or duration of any restrictions on the disposition
of the investments, but only if they arise as a feature of
the instrument itself. Due to the inherent uncertainty of
valuations of such investments, the fair values may differ
significantly from the values that would have been used had
an active market existed.
All security valuation techniques are periodically reviewed
by the Valuation Committee (“VC”) of the manager and are
approved by the manager. The VC provides oversight of the
Funds’ valuation policies and procedures.
Foreign Exchange The value of investments and other assets
and liabilities in foreign currencies is translated into Canadian
dollars (U.S. dollars in the case of the RBC $U.S. Short Term
Income Class and BlueBay $U.S. Global Convertible Bond
Class (Canada)) at the rate of exchange on each valuation
date. Purchases and sales of investments, income and
375
GENERIC NOTES TO FINANCIAL STATEMENTS
March 31, 2017
(also see Fund Specific Information)
expenses are translated at the rate of exchange prevailing
on the respective dates of such transactions. Realized foreign
exchange gains/losses are included in “Net gain (loss) on
foreign currencies and other net assets” in the Statements
of Comprehensive Income.
Functional Currency The Funds, with the exceptions below,
have their subscriptions, redemptions and performance
denominated in Canadian dollars and, consequently, the
Canadian dollar is the functional currency for the Funds.
RBC $U.S. Short Term Income Class and BlueBay $U.S. Global
Convertible Bond Class (Canada) have their subscriptions,
redemptions and performance denominated in U.S. dollars
and, consequently, the U.S. dollar is the functional currency
for these Funds.
Valuation of Series A different net asset value is calculated
for each series of mutual fund shares of a Fund. The net asset
value of a particular series of mutual fund shares is computed
by calculating the value of the series’ proportionate share
of the assets and liabilities of the Fund common to all series
less the liabilities of the Fund attributable only to that series.
Expenses directly attributable to a series are charged to that
series. Other expenses are allocated proportionately to each
series based upon the relative net asset value of each series.
Expenses are accrued daily.
Investment Transactions Investment transactions are
accounted for as of the trade date. The unrealized gain and
loss on investments is the difference between fair value and
average cost for the period. The basis of determining the cost
of portfolio assets, and realized and unrealized gains and
losses on investments, is average cost which does not include
amortization of premiums or discounts on fixed income and
debt securities with the exception of zero coupon bonds.
Income Recognition Interest income is recognized
on an accrual basis. “Other income received from underlying
funds” includes income earned by a Fund from investments
in underlying funds.
Increase (Decrease) in NAV Per Mutual Fund Share
Increase (decrease) in NAV per mutual fund share in the
Statements of Comprehensive Income represents the increase
(decrease) in net assets attributable to holders of mutual fund
shares by series, divided by the average mutual fund shares
outstanding per series during the period.
Early Redemption Fees Early redemption fees (short-term
trading fees) are paid directly to a Fund and are designed
to deter excessive trading and its associated costs. With the
exception of money market funds, a Fund may apply a fee of
2% of the current value of mutual fund shares if the shareholder
redeems or switches out mutual fund shares within seven
days of purchasing or previously switching into a Fund. These
amounts are included in the Statements of Changes in NAV.
4. Financial instrument risk and capital management
RBC GAM is responsible for managing each Fund’s
capital, which is its net assets and consists primarily of its
financial instruments.
A Fund’s investment activities expose it to a variety of
financial risks. RBC GAM seeks to minimize potential
adverse effects of these risks on a Fund’s performance by
employing professional, experienced portfolio managers,
daily monitoring of the Fund’s holdings and market events,
diversifying its investment portfolio within the constraints
of its investment objectives, and, in some cases, periodically
hedging certain risk exposures through the use of derivatives.
To assist in managing risks, RBC GAM also uses internal
guidelines, maintains a governance structure that oversees
each Fund’s investment activities and monitors compliance
with the Fund’s investment strategies, internal guidelines and
securities regulations.
Financial instrument risk, as applicable to a Fund, is
disclosed in its Notes to Financial Statements – Fund
Specific Information.
Liquidity risk
Liquidity risk is the possibility that investments in a Fund
cannot be readily converted into cash when required. A
Fund is exposed to daily cash redemptions of redeemable
mutual fund shares. Liquidity risk is managed by investing the
majority of a Fund’s assets in investments that are traded in an
active market and that can be readily disposed. In accordance
with securities regulations, a Fund must maintain at least
90% of its assets in liquid investments. In addition, a Fund
aims to retain sufficient cash and cash equivalent positions to
maintain liquidity, and has the ability to borrow up to 5% of
its net assets for the purpose of funding redemptions. All
non-derivative financial liabilities, other than redeemable
units, are due within 90 days.
Credit risk
Credit risk is the risk that a loss could arise from a security
issuer or counterparty not being able to meet its financial
obligations. The carrying amount of investments and other
assets represents the maximum credit risk exposure as
disclosed in a Fund’s Statements of Financial Position. The
fair value of fixed-income and debt securities includes a
376
GENERIC NOTES TO FINANCIAL STATEMENTS
March 31, 2017
(also see Fund Specific Information)
consideration of the credit worthiness of the debt issuer.
Credit risk exposure to over-the-counter derivative instruments
is based on a Fund’s unrealized gain on the contractual
obligations with the counterparty. RBC GAM monitors each
Fund’s credit exposure and counterparty ratings daily.
Concentration risk
Concentration risk arises as a result of net financial
instrument exposures to the same category such as,
geographical region, asset type, industry sector or market
segment. Financial instruments in the same category have
similar characteristics and may be affected similarly by
changes in economic or other conditions.
Interest rate risk
Interest rate risk is the risk that the fair value of a Fund’s
interest-bearing investments will fluctuate due to changes
in market interest rates. The value of fixed-income and debt
securities, such as bonds, debentures, mortgages, or other
income-producing securities, is affected by interest rates.
Generally, the value of these securities increases if interest
rates fall and decreases if interest rates rise.
Currency risk
Currency risk is the risk that the value of investments
denominated in currencies, other than the functional
currency of a Fund, will fluctuate due to changes in foreign
exchange rates. The value of investments denominated in a
currency other than Canadian dollars is affected by changes
in the value of the Canadian dollar or a Fund’s functional
currency, in relation to the value of the currency in which the
investment is denominated. When the value of the Canadian
dollar falls in relation to foreign currencies, then the value of
foreign investments rises. When the value of the Canadian
dollar rises, the value of foreign investments falls.
Other price risk
Other price risk is the risk that the value of financial
instruments will fluctuate as a result of changes in market
prices (other than those arising from interest rate or currency
risk), whether caused by factors specific to an individual
investment, its issuer, or all factors affecting all instruments
traded in a market or market segment.
5. Taxes
The Corporation qualifies as a mutual fund corporation
under the Income Tax Act (Canada) and is subject to tax
on the amount of its taxable income in each taxation year,
ending March 31.
Each Fund represents a class of mutual fund shares of the
Corporation. All classes of the mutual fund shares of the
Corporation are combined as a single legal entity for tax
purposes in computing the net income (loss) and net capital
gains (losses). Net losses of one class may be used to offset
net gains of another class to reduce the net income or net
gain of the Corporation as a whole.
Taxable dividends received from taxable Canadian
corporations are subject to a tax of 381⁄3% effective
January 1, 2016 (previously 331⁄3%). Such taxes are fully
refundable upon payment of taxable dividends to its
shareholders when sufficient dividends are paid. Any such
tax paid is reported as an amount receivable until recovered
through the payment to shareholders of dividends out of net
investment income. Interest income and foreign dividends,
net of applicable expense, are taxed at full corporate rates
applicable to mutual fund corporations with credits, subject
to certain limitations for foreign taxes paid. All tax on net
realized taxable capital gains is refundable when the gains are
distributed to shareholders as capital gains dividends or
through redemption of shares at the request of shareholders.
Income taxes, if any, are allocated to the classes of shares of
the Corporation on a fair and reasonable basis.
For the taxation year ended March 31, 2017, the Corporation
has no capital losses and non-capital losses to carry forward.
On December 15, 2016, the Canadian government enacted
new tax rules that eliminate the ability of investors to switch
among different classes of RBC Corporate Class Funds on a
tax-deferred basis. The new rules do not apply to switches
between different series of the same fund.
6. Administrative and other related-party transactions
Manager and Portfolio Manager
RBC GAM is an indirect, wholly owned subsidiary of Royal
Bank of Canada (“Royal Bank”) and is the manager and
portfolio manager of the Funds. RBC GAM is responsible for
the Funds’ day-to-day operations, provides investment advice
and portfolio management services to the Funds and appoints
distributors for the Funds. RBC GAM is paid a management
fee by the Funds as compensation for its services. No
management fees are paid by the Funds with respect to Series O
mutual fund shares. Series O shareholders pay a negotiated
fee directly to RBC GAM for investment-counselling services.
377

GENERIC NOTES TO FINANCIAL STATEMENTS
March 31, 2017
(also see Fund Specific Information)
The Funds pay a fixed administration fee to RBC GAM.
RBC GAM in turn pays certain operating expenses of the
Funds. These expenses include regulatory filing fees and
other day-to-day operating expenses including, but not
limited to, recordkeeping, accounting and fund valuation
costs, custody fees, audit and legal fees and the costs of
preparing and distributing annual and interim reports,
prospectuses, statements and investor communications.
Notwithstanding the fixed administration fee, the Funds
also pay certain operating expenses directly, including the
costs related to the Board of Directors of the Corporation,
the Independent Review Committee of the Funds and the
trustees of the Corporate Class Trust (the holders of the
Common Shares of the Corporation), the cost of any new
government or regulatory requirements introduced and any
borrowing costs (collectively, other fund costs), and taxes
(including, but not limited to, GST/HST). Other fund costs
will be allocated among each series of mutual fund shares
of a Fund in accordance with the services used. RBC GAM
may, in some years and in certain cases, absorb a portion of
operating expenses. The decision to absorb the operating
expenses is reviewed annually and determined at the
discretion of RBC GAM, without notice to shareholders.
Certain Funds may invest in units of other funds managed
by RBC GAM or its affiliates (“underlying mutual funds”).
The Fund’s ownership interest in underlying mutual funds is
disclosed in the Fund Specific Information.
Affiliates of RBC GAM that provide services to the Funds in the
course of their normal business, all of which are wholly owned
subsidiaries of Royal Bank of Canada, are discussed below.
Distributors
RBC GAM, RBC Direct Investing Inc., RBC Dominion
Securities Inc. and Phillips, Hager & North Investment Funds
Ltd. are principal distributors of, or distribute certain series of
mutual fund shares of, the Funds. Dealers receive an ongoing
commission based on the total value of their clients’ Series A,
Advisor Series, Series H and Series D mutual fund shares.
Custodian
RBC Investor Services Trust (“RBC IS”) is the custodian and
holds the assets of the Funds.
Registrars
Royal Bank, RBC IS and RBC GAM are the registrars of the
Funds and keep records of who owns the mutual fund shares
of the Funds.
Other Related-Party Transactions
Pursuant to applicable securities legislation, the Funds
relied on the standing instructions from the Independent
Review Committee with respect to one or more of the
following transactions:
Related-Party Trading Activities(a) trades in securities of Royal Bank;
(b) investments in the securities of issuers for which
a related-party dealer acted as an underwriter during
the distribution of such securities and the 60-day period
following the conclusion of such distribution of the
underwritten securities to the public;
(c) purchases of equity and debt securities from or sales of
equity or debt securities to a related-party dealer, where it
acted as principal; and
Inter-Fund Trading(d) purchases or sales of securities of an issuer from or to
another investment fund or managed account managed
by RBC GAM.
The applicable standing instructions require that Related-
Party Trading Activities and Inter-Fund Trading be conducted
in accordance with RBC GAM policy and that RBC GAM
advise the Independent Review Committee of a material
breach of any standing instruction. RBC GAM policy requires
that an investment decision in respect of Related-Party
Trading Activities (i) is made free from any influence of
Royal Bank or its associates or affiliates and without taking
into account any consideration relevant to Royal Bank or its
affiliates or associates, (ii) represents the business judgment
of the portfolio manager, uninfluenced by considerations
other than the best interests of the Funds, (iii) is in
compliance with RBC GAM policies and procedures, and
(iv) achieves a fair and reasonable result for the Funds.
RBC GAM policy requires that an investment decision in
respect of Inter-Fund Trading is in the best interests of
each Fund.
378

GENERIC NOTES TO FINANCIAL STATEMENTS
March 31, 2017
(also see Fund Specific Information)
7. Future accounting changes
The following IFRS standard has been issued, but is not yet
in effect:
In July 2014, the IASB finalized the reform of financial
instruments accounting and issued IFRS 9 (as revised in 2014),
which contains the requirements for a) the classification and
measurement of financial assets and financial liabilities,
b) impairment methodology and c) general hedge accounting.
IFRS 9 (as revised in 2014) will supersede IAS 39 Financial
Instruments: Recognition and Measurement in its entirety
upon its effective date.
The new standard, which becomes effective for annual
periods beginning on or after January 1, 2018, is not expected
to have a significant impact on the Funds.
379

380
By Phone
Investors: 1-800-463-FUND (3863) Dealers: 1-800-662-0652
By Mail
Head office:
RBC Global Asset Management Inc. 155 Wellington Street WestSuite 2200Toronto, Ontario M5V 3K7
For general mutual fund enquiries, write to:
RBC Global Asset Management Inc.P.O. Box 7500, Station AToronto, OntarioM5W 1P9
On the Internet
Visit our website at: www.rbcgam.com/fundsEmail us at: [email protected]
RBC Corporate Class Funds are offered by RBC Global Asset Management Inc. and distributed through authorized dealers. ® / TM Trademark(s) of Royal Bank of Canada. Used under licence. © RBC Global Asset Management Inc. 2017
If you have questions regarding RBC Corporate Class Funds, you can contact us using the following options:
CONTACT US

42374 (06-2017)
March
31, 2017R
BC
CO
RP
OR
ATE C
LAS
S FU
ND
S 2017 A
NN
UA
L REP
OR
T
RBC CORPORATE CLASS FUNDS
2017 Annual Report