rcv1: a new benchmark collection for text categorization
TRANSCRIPT

Journal of Machine Learning Research 5 (2004) 361-397 Submitted 9/02; Published 4/04
RCV1: A New Benchmark Collectionfor Text Categorization Research
David D. Lewis [email protected]
Ornarose, Inc. and David D. Lewis Consulting858 West Armitage Avenue, #296Chicago, IL 60614, USA
Yiming Yang [email protected]
Language Technologies Institute & Computer Science DepartmentCarnegie Mellon UniversityNewell Simon Hall 3612D, LTI5000 Forbes AvenuePittsburgh, PA 15213, USA
Tony G. Rose [email protected]
Cancer Research UKAdvanced Computation Laboratory44 Lincoln’s Inn FieldsLondon WC2A 3PX, UK
Fan Li [email protected]
Language Technologies InstituteCarnegie Mellon UniversityNewell Simon Hall 3612D, LTI5000 Forbes AvenuePittsburgh, PA 15213, USA
Editor: Thomas G. Dietterich
Abstract
Reuters Corpus Volume I (RCV1) is an archive of over 800,000 manually categorized newswirestories recently made available by Reuters, Ltd. for research purposes. Use of this data for researchon text categorization requires a detailed understanding of the real world constraints under whichthe data was produced. Drawing on interviews with Reuters personnel and access to Reuters doc-umentation, we describe the coding policy and quality control procedures used in producing theRCV1 data, the intended semantics of the hierarchical category taxonomies, and the correctionsnecessary to remove errorful data. We refer to the original data as RCV1-v1, and the corrected dataas RCV1-v2. We benchmark several widely used supervised learning methods on RCV1-v2, illus-trating the collection’s properties, suggesting new directions for research, and providing baselineresults for future studies. We make available detailed, per-category experimental results, as well ascorrected versions of the category assignments and taxonomy structures, via online appendices.
Keywords: applications, automated indexing, controlled vocabulary indexing, effectiveness mea-sures, evaluation, feature selection, k-NN, methodology, multiclass, multilabel, nearest neighbor,news articles, operational systems, Rocchio, SCut, SCutFBR, support vector machines, SVMs,term weighting, test collection, text classification, thresholding
c©2004 David D. Lewis, Yiming Yang, Tony G. Rose, and Fan Li.

LEWIS, YANG, ROSE, AND LI
1. Introduction
Text categorization is the automated assignment of natural language texts to predefined categoriesbased on their content. It is a supporting technology in several information processing tasks, includ-ing controlled vocabulary indexing, routing and packaging of news and other text streams, contentfiltering (spam, pornography, etc.), information security, help desk automation, and others. Closelyrelated technology is applicable to other classification tasks on text, including classification withrespect to personalized or emerging classes (alerting systems, topic detection and tracking), non-content based classes (author identification, language identification), and to mixtures of text withother data (multimedia and cross-media indexing, text mining).
Research interest in text categorization has been growing in machine learning, information re-trieval, computational linguistics, and other fields. This partly reflects the importance of text cat-egorization as an application area for machine learning, but also results from the availability oftext categorization test collections (Lewis, Schapire, Callan, and Papka, 1996; Lewis, 1997; Yang,1999; Sebastiani, 2002). These are collections of documents to which human indexers have as-signed categories from a predefined set. Test collections enable researchers to test ideas withouthiring indexers, and (ideally) to objectively compare results with published studies.
Existing text categorization test collections suffer from one or more of the following weak-nesses: few documents, lack of the full document text, inconsistent or incomplete category assign-ments, peculiar textual properties, and/or limited availability. These difficulties are exacerbated bya lack of documentation on how the collections were produced and on the nature of their categorysystems. The problem has been particularly severe for researchers interested in hierarchical textcategorization who, due to the lack of good collections and good documentation, have often beenforced to impose their own hierarchies on categories (Koller and Sahami, 1997; Weigend, Wienerand Pedersen, 1999).
Even if current collections were perfect, however, there would be an ongoing need for newones. Just as machine learning algorithms can overfit by tuning a classifier’s parameters to theaccidental properties of a training set, a research community can overfit by refining algorithms thathave already done well on the existing data sets. Only by periodically testing algorithms on newtest collections can progress be verified.
A data set recently made available, Reuters Corpus Volume 1 (RCV1) (Rose, Stevenson andWhitehead, 2003), has the potential to address many of the above weaknesses. It consists of over800,000 newswire stories that have been manually coded using three category sets. However, RCV1as distributed is simply a collection of newswire stories, not a test collection. It includes knownerrors in category assignment, provides lists of category descriptions that are not consistent withthe categories assigned to articles, and lacks essential documentation on the intended semantics ofcategory assignment.
This paper attempts to provide the necessary documentation, and to describe how to eliminatemiscodings where possible. We begin in Section 2 by describing the operational setting in whichRCV1 was produced, with particular attention to the categories and how they were assigned. Be-sides being crucial to understanding the semantics of the category assignments, the insight intooperational text categorization may be of independent interest. Section 3 examines the implicationsof the production process for the use of RCV1 in research, and Section 4 summarizes the changeswe recommend to produce a better test collection, which we call RCV1-v2. (We refer to the originaldata as RCV1-v1.)
362

RCV1: A NEW BENCHMARK COLLECTION
Appendix Description1 Valid Topic categories2 Original Topics hierarchy3 Expanded Topics hierarchy4 Valid Industry categories5 Best-guess Industries hierarchy6 Valid Region categories7 IDs of RCV1-v2 documents8 RCV1-v2 Topic assignments9 RCV1-v2 Industry assignments10 RCV1-v2 Region assignments11 SMART stopword list12 Tokenized RCV1-v2 data13 Vectorized RCV1-v2 data (LYRL2004 training/test split)14 Term dictionary for vectorized data15 Contingency tables for experimental results16 RBB Topics list17 RBB Industries list18 RBB Regions list
Table 1: List of online appendices accompanying this paper. They provide data sets used in orproduced by the experiments, as well as additional information on the RCV1 collection,and are explained later in the paper.
Sections 2 to 4 are based on Reuters documentation, interviews with Reuters personnel, and sta-tistical analysis of the documents and categories. To complement this analysis, we provide bench-mark results on RCV1-v2 for well-known supervised learning approaches to text categorization.These results provide future users with a standard for comparison, as well as reassurance that thetasks posed by the corrected collection are neither trivial nor impossible. Section 5 gives the designof our experiments, Sections 6 & 7 discuss the algorithms and text representation, and Section 8presents the benchmark results and observations. We end with some thoughts on research directionsthe new collection may support.
Several online appendices accompany this paper, and are listed in Table 1.
2. Coding the RCV1 Data
Apart from the terrible memories this stirs up for me personally (coding stories throughthe night etc.), I can’t find fault with your account.
– Reuters editor commenting on a draft of this section.
The RCV1 data was produced in an operational setting at Reuters, Ltd., under procedures thathave since been superceded. Only later was use of the data in research contemplated. Informa-tion that in a research setting would have been retained was therefore not recorded. In particular,
363

LEWIS, YANG, ROSE, AND LI
no formal specification remains of the coding practices at the time the RCV1 data was produced.However, by combining related documentation and interviews with Reuters personnel we believewe have largely reconstructed those aspects of coding relevant to text categorization research.
2.1 The Documents
Reuters is the largest international text and television news agency. Its editorial division producessome 11,000 stories a day in 23 languages. Stories are both distributed in real time and madeavailable via online databases and other archival products.
RCV1 is drawn from one of those online databases. It was intended to consist of all and onlyEnglish language stories produced by Reuters journalists between August 20, 1996, and August 19,1997. The data is available on two CD-ROMs and has been formatted in XML.1 Both the archivingprocess and later preparation of the XML dataset involved substantial verification and validation ofthe content, attempts to remove spurious or duplicated documents, normalization of dateline andbyline formats, addition of copyright statements, and so on.
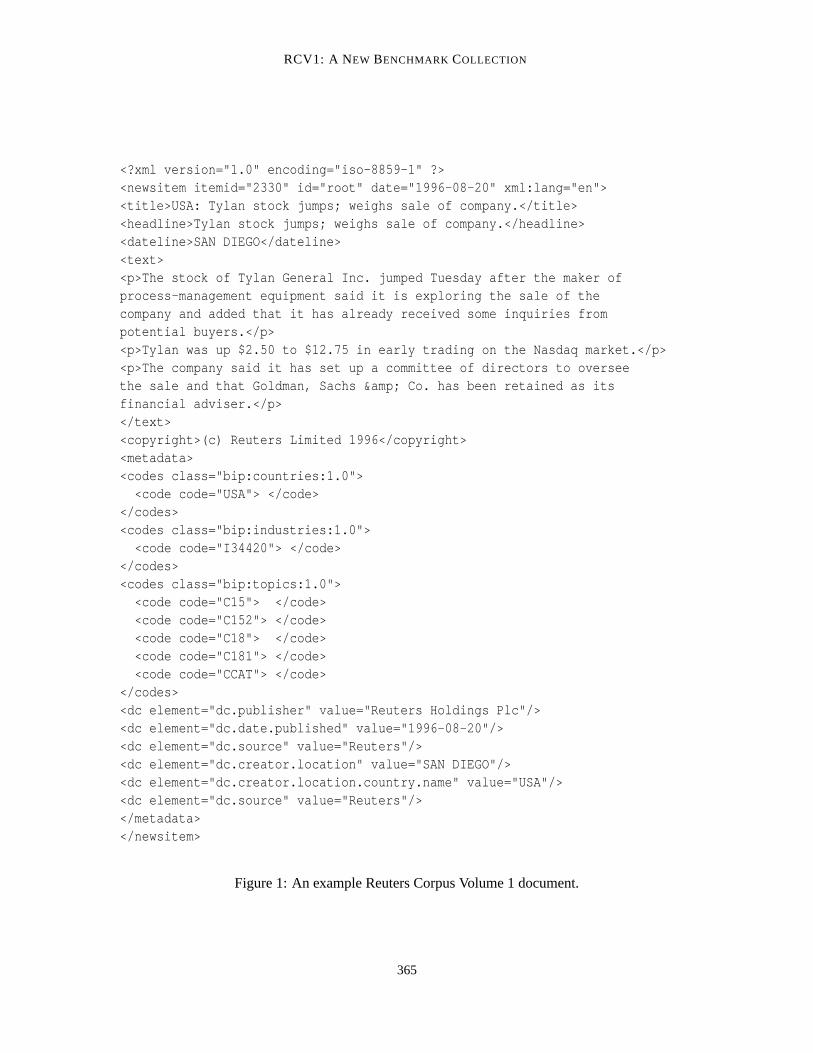
The stories cover the range of content typical of a large English language international newswire.They vary from a few hundred to several thousand words in length. Figure 1 shows an example story(with some simplification of the markup for brevity).
2.2 The Categories
To aid retrieval from database products such as Reuters Business Briefing (RBB), category codesfrom three sets (Topics, Industries, and Regions) were assigned to stories. The code sets were orig-inally designed to meet customer requirements for access to corporate/business information, withthe main focus on company coding and associated topics. With the introduction of the RBB productthe focus broadened to the end user in large corporations, banks, financial services, consultancy,marketing, advertising and PR firms.
2.2.1 TOPIC CODES
Topic codes were assigned to capture the major subjects of a story. They were organized in four hi-erarchical groups: CCAT (Corporate/Industrial), ECAT (Economics), GCAT (Government/Social),and MCAT (Markets). This code set provides a good example of how controlled vocabulary schemesrepresent a particular perspective on a data set. The RCV1 articles span a broad range of content,but the code set only emphasizes distinctions relevant to Reuters’ customers. For instance, there arethree different Topic codes for corporate ownership changes, but all of science and technology is asingle category (GSCI).
2.2.2 INDUSTRY CODES
Industry codes were assigned based on types of businesses discussed in the story. They weregrouped in 10 subhierarchies, such as I2 (METALS AND MINERALS) and I5 (CONSTRUCTION).The Industry codes make up the largest of the three code sets, supporting many fine distinctions.
1. Further formatting details are available at http://about.reuters.com/researchandstandards/corpus/.
364
RCV1: A NEW BENCHMARK COLLECTION
<?xml version="1.0" encoding="iso-8859-1" ?><newsitem itemid="2330" id="root" date="1996-08-20" xml:lang="en"><title>USA: Tylan stock jumps; weighs sale of company.</title><headline>Tylan stock jumps; weighs sale of company.</headline><dateline>SAN DIEGO</dateline><text><p>The stock of Tylan General Inc. jumped Tuesday after the maker ofprocess-management equipment said it is exploring the sale of thecompany and added that it has already received some inquiries frompotential buyers.</p><p>Tylan was up $2.50 to $12.75 in early trading on the Nasdaq market.</p><p>The company said it has set up a committee of directors to overseethe sale and that Goldman, Sachs & Co. has been retained as itsfinancial adviser.</p></text><copyright>(c) Reuters Limited 1996</copyright><metadata><codes class="bip:countries:1.0"><code code="USA"> </code>
</codes><codes class="bip:industries:1.0"><code code="I34420"> </code>
</codes><codes class="bip:topics:1.0"><code code="C15"> </code><code code="C152"> </code><code code="C18"> </code><code code="C181"> </code><code code="CCAT"> </code>
</codes><dc element="dc.publisher" value="Reuters Holdings Plc"/><dc element="dc.date.published" value="1996-08-20"/><dc element="dc.source" value="Reuters"/><dc element="dc.creator.location" value="SAN DIEGO"/><dc element="dc.creator.location.country.name" value="USA"/><dc element="dc.source" value="Reuters"/></metadata></newsitem>
Figure 1: An example Reuters Corpus Volume 1 document.
365

LEWIS, YANG, ROSE, AND LI
2.2.3 REGION CODES
Region codes included both geographic locations and economic/political groupings. No hierarchicaltaxonomy was defined.
2.3 Coding Policy
Explicit policies on code assignment presumedly increase consistency and usefulness of coding,though coming up with precise policies is difficult (Lancaster, 1998, pp. 30-32). Reuters’ guidancefor coding included two broad policies, among others. We have named these policies for conve-nience, though they were not so named by Reuters:
1. Minimum Code Policy: Each story was required to have at least one Topic code and oneRegion code.
2. Hierarchy Policy: Coding was to assign the most specific appropriate codes from the Topicand Industry sets, as well as (usually automatically) all ancestors of those codes. In contrastto some coding systems, there was no limit on the number of codes with the same parent thatcould be applied.
These policies were (imperfectly) implemented by a combination of manual and automatedmeans during coding, as discussed below and in Section 3.3.
2.4 The Coding Process
During the years 1996 and 1997, the period from which the corpus is drawn, Reuters produced justover 800,000 English language news stories per year. Coding was a substantial undertaking. At onepoint Reuters employed 90 people to handle the coding of 5.5 million English language stories peryear. However, this figure includes both English language stories produced by Reuters journalistsand ones obtained from other sources, and included additional code sets not present in the RCV1data. Therefore, the exact effort devoted to documents and codes of the sort represented in RCV1 isunclear, though one estimate is around 12 person-years (Rose, Stevenson and Whitehead, 2003).
Coding of Reuters-produced stories was accomplished in three stages: autocoding, manual edit-ing, and manual correction.
2.4.1 AUTOCODING
Stories first passed through a rule-based text categorization system known as TIS (Topic Identi-fication System), a descendant of the system originally developed for Reuters by Carnegie Group(Hayes and Weinstein, 1990). Most codes had at least one rule that could assign them, but automatedcoding was not attempted for some codes believed to be beyond the capability of the technology.Two of the codes perceived to be difficult were GODD (human interest) and GOBIT (obituaries).It is interesting to note that these two categories proved in our experiments to be two of the mostdifficult to assign automatically.
In addition to their text, some stories entering the system already had codes, from a differentcode set (the “Editorial codes”), that had been manually assigned by journalists. Some simple“source processing” rules were used that mapped these codes to equivalent codes in the final codeset. For example, a story with the Editorial code SPO (Sport) would automatically be assigned
366

RCV1: A NEW BENCHMARK COLLECTION
the final code GSPO. Other source processing rules triggered on other parts of the markup, forinstance assigning any story whose slug (a brief line of identifying information on a newswirestory) contained the string “BC-PRESS DIGEST” to the most general news code (GCAT).
Finally, as discussed in Section 3, some Topic, Industry, and Region codes were assigned on thebasis of other codes of the same or different type, to enforce the Hierarchy Policy or capture otherrelationships.
2.4.2 MANUAL EDITING
The output of TIS was automatically checked for compliance with the Minimum Code policy. If so,the story was sent to a holding queue. If not, the story was first sent to a human editor. This editorwould assign the codes they felt applied, while ensuring the story got at least one Topic and oneRegion code. Editors could also delete or change automatically assigned codes. Editors occasionallyfixed errors in the formatting of the story during this phase, but their primary responsibility wascorrection of coding. The edited story then went to the holding queue for final review.
2.4.3 MANUAL CORRECTION IN THE HOLDING QUEUE
Every six hours, the holding queue was reviewed by editors, who had the opportunity to correctmistakes in coding. Once stories passed through the holding queue, they were batched up andloaded into the database in blocks.
2.5 Coding Quality
Human coding is inevitably a subjective process. Studies have shown considerable variation in in-terindexer consistency rates for different data sets (Cleverdon, 1991). The process described abovewas an attempt to achieve high consistency and correctness for the Reuters codes. Stories were sam-pled periodically and feedback given to coders on how to improve their accuracy. The consistencyof coders with each other and with standards was evaluated from samples and found to be high,though we were not able to obtain quantitative data from these evaluations for publication.
Table 2 provides some additional evidence of consistency of the coding. It shows, for the year1997, how many stories had autocoding that failed the Minimum Code test and thus underwentmanual editing, as well as how many had at least one code corrected in the holding queue. Note thatRCV1 contains stories spanning parts of 1996 and 1997, so the number of stories in the corpus isnot the same as the number of stories in Table 2.
A total of 312,140 stories had autocoding that failed the Minimum Code test and were thusmanually edited. All of these stories were also reviewed by a second editor in the holding queue,but only 23,289 or 13.4% had codes changed by that second editor. In contrast, 334,975 (66.2%) ofthe 505,720 stories whose autocoding passed the Minimum Code test were changed in the holdingqueue. In other words, a manually edited coding was much less likely to be overridden in theholding queue than a coding assigned by the automated system.
It should be noted that an annotation let editors reviewing the holding queue know which storieshad been manually edited, and this undoubtedly influenced their choice of stories to correct. Ta-ble 2 therefore cannot be considered an objective measure of interindexer consistency. However, itprovides some additional evidence that the different human coders were mostly in agreement on themeaning of the codes. Rose, Stevenson and Whitehead (2003) present additional data on correctionsby editors.
367

LEWIS, YANG, ROSE, AND LI
Manually CorrectedNo Yes
Manually Edited No 170,745 334,975Yes 288,851 23,289
Table 2: Number of stories produced by Reuters in 1997 that received manual editing and/or manualcorrection.
2.6 The Evolution of Coding at Reuters
It should be mentioned that the above approach, based on TIS and manual correction, has since beensuperceded at Reuters. The rule-based approach of TIS had several drawbacks:
• Creating rules required specialized knowledge, thus slowing down the addition of new codesand the adaptation of rules to changes in the input.
• The rules did not provide an indication of the confidence in their output. There was thusno way to focus editorial correction on the most uncertain cases, nor any way of detecting(except by violation of coding policy) that new types of stories were appearing that wouldsuggest changes or additions to the code set.
Reuters now uses a machine learning approach for text categorization. Classifiers are inducedfrom large amounts of training data, with a feedback loop to trigger the involvement of humaneditors (based on autocoding confidence scores) and analysis tools to indicate when new trainingdata/categories may be required.
3. RCV1 and Text Categorization Research
A test collection is more than a corpus. In this section we consider how the production and characterof RCV1 impact its use for text categorization research. In Section 4 we go on to describe how tocorrect errors in the raw RCV1 data (which we call RCV1-v1) to produce a text categorization testcollection (which we call RCV1-v2). Therefore here we present statistics for both versions of thedata, indicating when they are different.
3.1 Documents
RCV1 contains 35 times as many documents (806,791 for RCV1-v1, and 804,414 for RCV1-v2) asthe popular Reuters-21578 collection and its variants (Lewis, 1992, 1997), and 60 times as manywith reliable coding. Indeed, the only widely available text categorization test collection of com-parable size is OHSUMED (Hersh, Buckley, Leone, and Hickman, 1994; Lewis, Schapire, Callan,and Papka, 1996; Yang and Pedersen, 1997; Yang, 1999) at 348,566 documents. While useful,OHSUMED has disadvantages: it does not contain the full text of documents, its medical languageis hard for non-experts to understand, and its category hierarchy (MeSH) is huge and structurallycomplex.
RCV1 is also “cleaner” than previous collections. Stories appear one to a file, and have uniquedocument IDs. IDs range from 2286 to 810597 for RCV1-v1, and 2286 to 810596 for RCV1-v2.
368

RCV1: A NEW BENCHMARK COLLECTION
There are gaps in the range of IDs in the original RCV1-v1, and additional gaps (due to deleteddocuments) in RCV1-v2. Regrettably, the ID order does not correspond to chronological orderof the stories, even at the level of days. Fortunately, the documents do have time stamps (in the<newsitem> element), and chronological order at the level of days can be determined from those.The time stamps do not give a time of day since the stories were taken from an archival database,not from the original stream sent out over the newswire.
XML formatting of both text and metadata in RCV1 simplifies use of the data. The fact thatthe stories are from an archival database means fewer brief alerts (the infamous “blah, blah, blah”stories of Reuters-21578), corrections to previous stories, and other oddities. RCV1 contains all oralmost all stories of a particular type from an interval of one year. For temporal studies, this is amajor advantage over Reuters-21578, which had bursty coverage of a fraction of a year.
The processes that produced the archival database and, later, the research corpus, were inevitablyimperfect. Khmelev and Teahan (2003) discuss a number of anomalies in the corpus, including thepresence of approximately 400 foreign language documents. They also emphasize the presence ofduplicate and near-duplicate articles. Some of these simply reflect the fact that very similar storiesdo occasionally appear, particularly ones containing financial data. In other cases multiple drafts ofthe same story were retained. Some simple accidents undoubtedly occurred as well.
We found between 2,500 and 30,000 documents that could be considered duplicates of someother document, depending on the definition of duplication. Our analysis is consistent with that ofTeahan and Kmelev, who found 27,754 duplicate or substantially overlapping documents in theiranalysis.
Whether the number of duplicates, foreign language documents, and other anomalies present inRCV1 is problematic depends on the questions a researcher is using RCV1 to study. We believe thenumber of such problems is sufficiently small, or sufficiently similar to levels seen in operationalsettings, that they can be ignored for most purposes.
3.2 Categories
RCV1 documents are categorized with respect to three controlled vocabularies: Topics, Industries,and Regions. In this section, we discuss the three RCV1 category sets and their implications for textcategorization experiments. In particular, we describe our interpretation of the hierarchical structurefor each code set, something that is not made clear in the documentation on the RCV1 CD-ROMs.
3.2.1 TOPIC CODES
The file topic codes.txt on the RCV1 CD-ROMs lists 126 Topic codes. However, some of thesecodes were not actually used by editors at the time the RCV1 data was categorized. Various evi-dence, including Reuters documentation on an alternate version of the Topics hierarchy, suggeststhat these codes were not used:
1POL, 2ECO, 3SPO, 4GEN, 6INS, 7RSK, 8YDB, 9BNX, ADS10, BRP11, ENT12,PRB13, BNW14, G11, G111, G112, G113, G12, G13, G131, G14, GEDU, MEUR.
This leaves 103 Topic codes we believe were actually available for coding, and which we there-fore recommend be used in text categorization experiments. We provide a list of valid Topic codesas Online Appendix 1. As it happens, all of these 103 codes occur at least once in both the RCV1-v1and RCV1-v2 datasets. Their corpus frequencies span five orders of magnitude, from 5 occurrences
369

LEWIS, YANG, ROSE, AND LI
for GMIL (MILLENNIUM ISSUES), to 374,316 occurrences (381,327 in RCV1-v2) for CCAT(CORPORATE/INDUSTRIAL). Note that some Topic category frequencies are higher in RCV1-v2than in RCV1-v1, despite RCV1-v1 having fewer documents, because RCV1-v2 fills in missinghierarchical expansions of Topic categories (Section 4).
The code symbols inserted in articles to indicate their membership in categories were chosenso that related categories would have related codes. This “morphological structure” of the codesreflects two distinct needs:
1. Defining a hierarchy to support automated assignment of more general codes on the basis of(manual or automated) assignment of more specific codes (Section 3.3).
2. Imposing an alphanumeric sort order that grouped related codes, aiding manual lookup.
For instance, the code C311 (DOMESTIC MARKETS) is a child in the hierarchy of its truncation,code C31 (MARKETS/MARKETING). Code C311 also appears near related codes, such as C32(ADVERTISING/PROMOTION), in an alphanumeric listing.
The original hierarchy used for automated assignment can be reconstructed as follows:
1. Treat the codes CCAT, ECAT, GCAT, and MCAT as actually being the corresponding singleletters C, E, G, and M.
2. To find the parent of a code, remove the minimal suffix such that the result is another code.The codes C, E, G, and M have as parent the root of the tree.
However, there are other versions of the hierarchy that might be of interest. In particular, onecould introduce an additional level of the hierarchy corresponding to the high level numeric group-ings that aided lookup. This can be done by first adding to the hierarchy the artificial codes C1-C4,E1-E7, G1, and M1, and then following the above procedure. Taking into account this new hierarchylevel might (or might not) improve the effectiveness of hierarchy-based algorithms when assigningthe original 103 categories. (We doubt it is interesting to actually assign the 13 artificial codes todocuments or to measure classifiers’ accuracy at assigning them.)
Online Appendix 2 specifies the original version of the hierarchy. It contains a total of 104nodes: 103 for assignable Topic codes and 1 root node. Online Appendix 3 specifies a hierarchythat includes the two-character truncations as a new intermediate layer. It contains a total of 117nodes: 103 for assignable Topic codes, 13 nodes in the new non-assignable intermediate layer, and1 root node.
Editors were able to assign any of the 103 Topic codes to a story, not just codes at leaf nodes ofthe hierarchy. They were instructed to use the most specific code applicable to a particular aspectof a story, a common indexing principle (Lancaster, 1998, pp. 28-30). Codes at internal nodes ofthe hierarchy thus acted much like named “Other” categories, implicitly forming a contrast set withtheir child codes.
However, in the RCV1 data a non-leaf code may be present not because it was directly found tobe applicable, but because it was the ancestor of a code found to be applicable. We call this “Other+ expansion” semantics, to distinguish it from pure “Other” semantics. We discuss the implicationsof this for research use of RCV1 in Section 3.3.
370
RCV1: A NEW BENCHMARK COLLECTION
3.2.2 INDUSTRY CODES
The file industry codes.txt on the RCV1 CD-ROMs lists a total of 870 codes. Most do not appearin the documents and at first glance they appear confusing and redundant. As discussed below, only354 of these codes appear to have been available for use by the coders. We therefore recommendthat only these 354 codes (which we list in Online Appendix 4) be used in experiments.
Of the 354 valid Industry codes, 350 have at least one occurrence in the corpus (in both RCV1-v1and RCV1-v2). Nonzero category frequencies range from two for I5020030 (RESERVOIR CON-STRUCTION) and I5020050 (SEA DEFENCE CONSTRUCTION) to 34,788 (34,775 in RCV1-v2)for I81402 (COMMERCIAL BANKING). In contrast to Topic and Region codes, Industry codeswere not required to be assigned. Only a subset of documents (351,812 for RCV1-v1 and 351,761for RCV1-v2) have them.
The Industry codes incorporate many fine-grained distinctions in subject matter. (For instance,there are five variations on the real estate industry.) They may therefore provide a test of the abilityof text categorization systems to distinguish small differences in content.
As with Topics, the Industry code symbols encode both a hierarchy and a numeric sort order.The hierarchy was used for automated assignment of ancestor categories, though these automatedassignments were imperfectly preserved in RCV1 (Section 3.5.2). In addition, some use of relation-ships between codes for companies (not present in the RCV1 CD-ROMs) and codes for Industrieswas used during automated assignment of Industries.
Several anomalies of the morphology of the Industry code symbols, and in the way the codeswere used, make the relationships among codes hard to discern. We first discuss these anomalies,and then how to deal with them for experimental purposes.
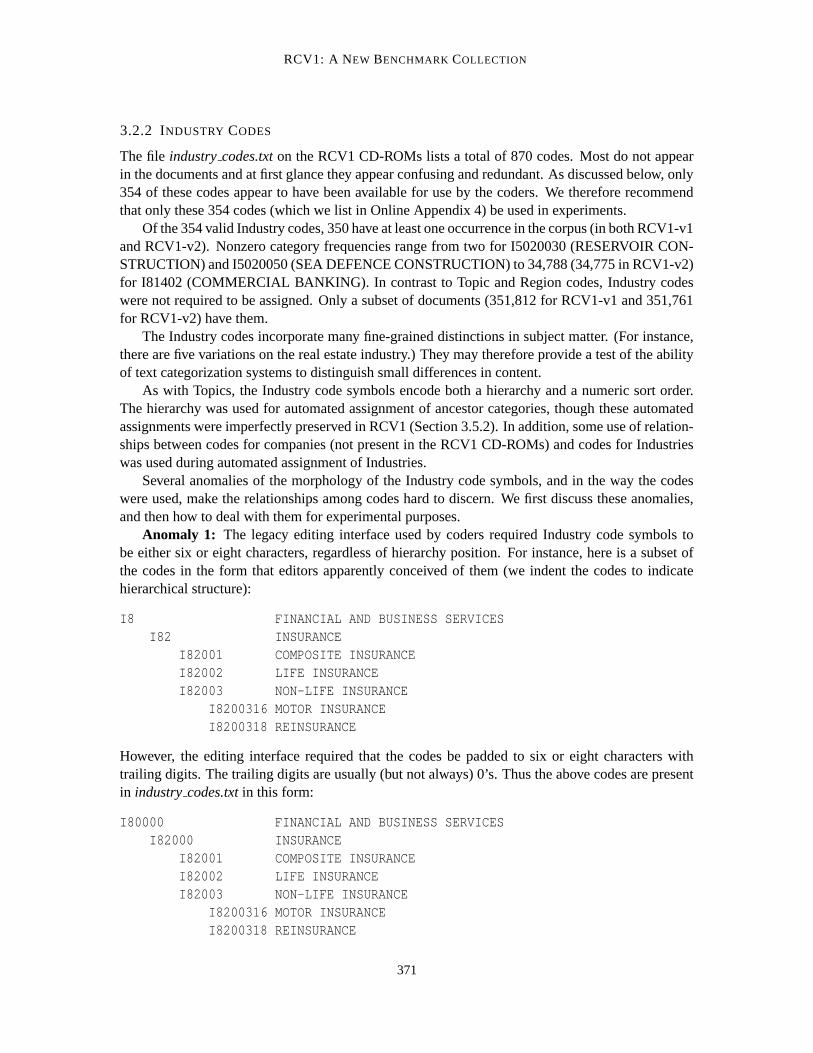
Anomaly 1: The legacy editing interface used by coders required Industry code symbols tobe either six or eight characters, regardless of hierarchy position. For instance, here is a subset ofthe codes in the form that editors apparently conceived of them (we indent the codes to indicatehierarchical structure):
I8 FINANCIAL AND BUSINESS SERVICESI82 INSURANCE
I82001 COMPOSITE INSURANCEI82002 LIFE INSURANCEI82003 NON-LIFE INSURANCE
I8200316 MOTOR INSURANCEI8200318 REINSURANCE
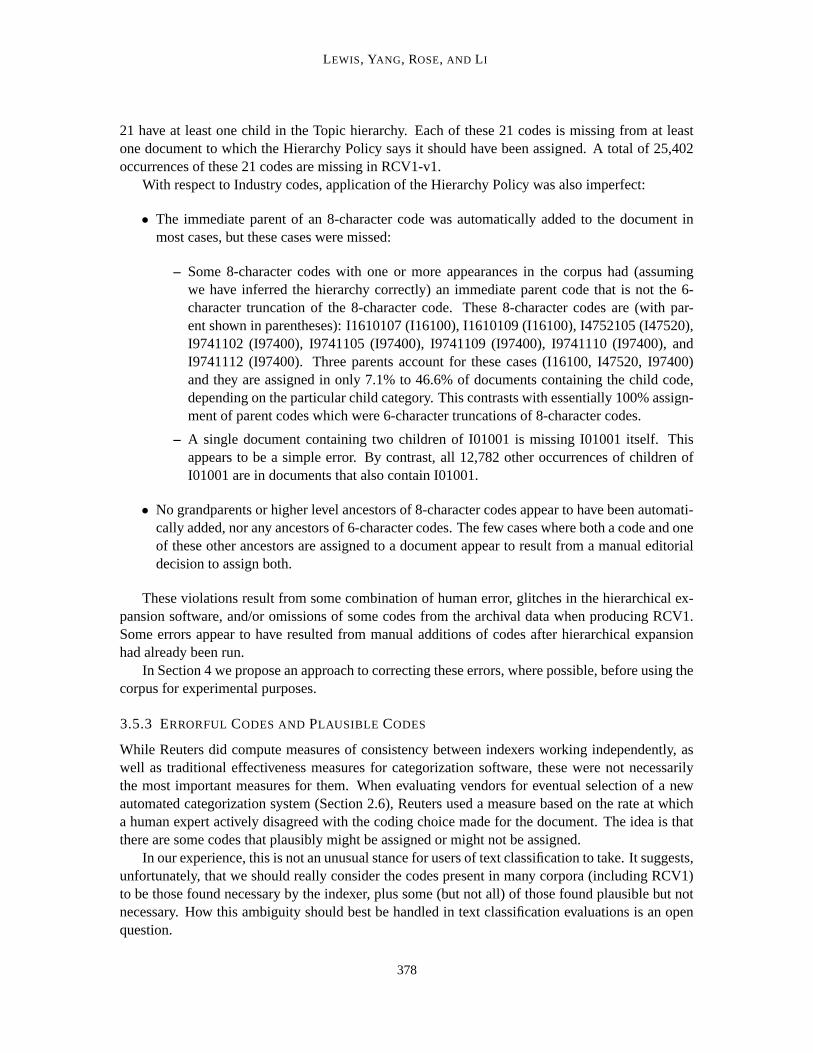
However, the editing interface required that the codes be padded to six or eight characters withtrailing digits. The trailing digits are usually (but not always) 0’s. Thus the above codes are presentin industry codes.txt in this form:
I80000 FINANCIAL AND BUSINESS SERVICESI82000 INSURANCE
I82001 COMPOSITE INSURANCEI82002 LIFE INSURANCEI82003 NON-LIFE INSURANCE
I8200316 MOTOR INSURANCEI8200318 REINSURANCE
371

LEWIS, YANG, ROSE, AND LI
The 6- or 8-character padded versions of the codes are the ones found in the RCV1 documents. Werefer to these as “padded” codes, and the raw versions (which more directly encode the hierarchy)as “unpadded” codes.
Anomaly 2: The hierarchical expansion software apparently required a code list containingcodes in both unpadded and padded forms, and the intermediate forms as well. So the file indus-try codes.txt actually contains:
I8 FINANCIAL AND BUSINESS SERVICESI80 FINANCIAL AND BUSINESS SERVICESI800 FINANCIAL AND BUSINESS SERVICESI8000 FINANCIAL AND BUSINESS SERVICESI80000 FINANCIAL AND BUSINESS SERVICES
I82 INSURANCEI820 INSURANCEI8200 INSURANCEI82000 INSURANCE
I82001 COMPOSITE INSURANCEI82002 LIFE INSURANCEI82003 NON-LIFE INSURANCE
I8200316 MOTOR INSURANCEI8200318 REINSURANCE
Anomaly 3: There are nine 7-character codes (such as I815011) in industry codes.txt. Codeswith seven characters were purely a navigational aid to editors in searching the code set. These 7-character codes were not assigned to documents either by editors or during hierarchical expansion.
Anomaly 4: There are nine codes labeled TEMPORARY, eight with 6 characters and one withfive characters. There are also two codes labeled DUMMY CODE (I9999 and I99999). These ap-pear to be placeholders where new, meaningful codes (or navigational aids) might have been addedbut weren’t. These codes were not assigned to documents either by editors or during hierarchicalexpansion.
Anomaly 5: The top level of codes, I0 through I9 in unpadded form (I00000 through I90000 inpadded form), were apparently not allowed to be assigned to documents.
Anomaly 6: The code I50000 was assigned to documents. It is a 6-character padding of un-padded code I500 (GENERAL CONSTRUCTION AND DEMOLITION), not a padding of disal-lowed unpadded code I5 (CONSTRUCTION).
Anomaly 7: There are six cases (excluding TEMPORARY and DUMMY codes) where two ormore distinct 6- or 8-character padded codes have the same name in industry codes.txt. Each ofthese cases appears to have a different interpretation, as described next.
Anomaly 7a: The unpadded code I161 (ELECTRICITY PRODUCTION) has two paddedforms, I16100 and I16101, listed in industry codes.txt. The code I16100 is assigned to many doc-uments, but I16101 to none. Other documentation suggests I16101 should not be considered anassignable code, and that the children of I16101 should instead be considered children of I16100.
Anomaly 7b: The padded codes I22400 and I22470 both have the name NON FER-ROUS METALS. Other documentation suggests the original name for I2247 (padded to I22470)was OTHER NON FERROUS METALS and that it is a child of I224 (padded to I22400). BothI22400 and I22470 are assigned to documents, so both should be viewed as assignable.
372

RCV1: A NEW BENCHMARK COLLECTION
Anomaly 7c: The padded codes I45500 (HOUSEHOLD TEXTILES) and I64700 (HOUSE-HOLD TEXTILES) are distinct codes with the same name. The I455 version is in the subhierarchyfor I4 (PROCESSING INDUSTRIES), while I647 is in the subhierarchy for I6 (DISTRIBUTION,HOTELS AND CATERING). Both should be viewed as assignable, and both are in fact assigned todocuments.
Anomaly 7d: The 6-character code I47521 (TRADE JOURNAL PUBLISHING) has asingle child code, I4752105 (TRADE JOURNAL PUBLISHING). There are no occurrences ofI47521 on the corpus, but several occurrences of I4752105. Other documentation also suggests thatI4752105 is the unpadded version of the code, while I47521 was not available for use.
Anomaly 7e: The codes I64000 and I65000 have the name RETAIL DISTRIBUTION. Atone point these apparently referred to “RETAIL - GENERAL” (I64000) and “RETAIL - SPECIAL-IST” (I65000). Later the two were merged, and it appears that for the RCV1 data they should beconsidered to be the same code. The code I64000 is assigned to documents, while I65000 is not, sothe children of I65000 should instead be considered children of I64000, and I65000 ignored.
Anomaly 7f: Similarly to Anomaly 7a, the unpadded code I974 (TELEVISION AND RA-DIO) has two 6-character paddings: I97400 and I97411. The code I97400 is assigned to manydocuments, while I97411 is assigned to none. Other documentation also suggests I97411 was notavailable for use. I97411 should be considered unavailable, and its children should be consideredchildren of I97400.
Anomaly 8: The padded code I16300 has the name “ALTERNATIVE ENERGY” which isslightly different than the name (“ALTERNATIVE ENERGY PRODUCTION”) for the apparentunpadded version of it (I163). Other documentation suggests there is not meant to be a distinctionbetween these, so we rename I16300 to “ALTERNATIVE ENERGY PRODUCTION”.
Given these anomalies, we believe the set of Industry codes that were available to be assignedto documents are those from industry codes.txt that satisfy these criteria:
• Have six or eight characters (i.e., five or seven digits)
• Are not named DUMMY or TEMPORARY
• Are not of the form Ix0000, except for I50000
• Are not any of I16101, I47521, I65000, or I97411.
There are 354 such Industry codes, of which 350 appear in the corpus (both RCV1-v1 andRCV1-v2). The four available codes that do not appear in any document (I32753, I3302018, I841padded to I84100, and I84802) are leaf nodes of the hierarchy. They have narrow enough meaningsthat there plausibly was no RCV1 document to which they were applicable. We provide a list ofthese 354 Industry codes as Online Appendix 4.
Reproducing the hierarchical structure in which the codes were embedded is more difficult.In producing our best guess at the hierarchy, we made use both of documentation (of uncertainvintage) from Reuters and of the UK Standard Industrial Classification of Economic Activities (UKSIC(92)) (Great Britain Office for National Statistics, 1997, 2002), since it is known that someversion of the UK SIC was consulted by Reuters personnel during design of the Industries codes.One of our informants also suggested that some codes from a set defined by the International PressTelecommunications Council (http://www.iptc.org/) may have been used as well, but we have notbeen able to determine which codes these were.
373

LEWIS, YANG, ROSE, AND LI
We also had to choose what kinds of codes to include in the hierarchy. We decided to omitTEMPORARY, DUMMY, and 7-character codes, as well as other codes that weren’t available toeditors. The only exception to requiring that codes have been assignable was that we included theunassignable second level codes I0 through I9.
Online Appendix 5 contains our hierarchy. It has 365 nodes: one root, the 10 second level codesI0 through I9, and the 354 assignable codes. As part of the hierarchy file, we include the name ofeach node. We rename I22470 to OTHER NON FERROUS METALS, I45500 to HOUSEHOLDTEXTILES PROCESSING, and I64700 to HOUSEHOLD TEXTILES DISTRIBUTION, so that allvalid codes have a unique name.
3.2.3 REGION CODES
The file region codes.txt on the RCV1 CD-ROMs contains 366 geographic codes, of which 296occur at least once in the corpus. The Reuters documentation we could obtain suggests that all 366of these codes were available to Reuters editors, and so are appropriate to use in experiments. Weprovide a list of these 366 valid Region codes as Online Appendix 6. Nonzero class frequencies spanthe range from one (for 10 codes in RCV1-v1 and eight codes in RCV1-v2) to 266,239 (265,625 inRCV-v2) for USA.
In addition, three codes with a total of four occurrences are present in the RCV1 articles but notin the file region codes.txt, bringing the total number of Region codes actually present in RCV1-v1articles to 299. These codes are CZ - CANAL ZONE (one occurrence), CZECH - CZECHOSLO-VAKIA (two occurrences), and GDR - EAST GERMANY (one occurrence). These codes appearto be errors, so in producing RCV1-v2 relevance judgment files we replaced them by what appearto be the corresponding correct codes from region codes.txt: PANA (PANAMA), CZREP (CZECHREPUBLIC), and GFR (GERMANY).
While no formal category hierarchy is provided with the RCV1 data, some Reuters personneldid view the Region codes as falling into three informal groups: Countries, Regional Groupings, andEconomic Groupings. Other personnel viewed the latter two groups as not being clearly distinct.We did not find documentation defining the groupings, and so do not include a hierarchy or groupingof Region categories in our online appendices.
Hierarchies or networks of Region categories could be defined based on geographic, economic,political, or other criteria. Indeed, one Reuters informant has indicated that there was automaticassignment of some country codes based on company codes (not present in RCV1), and automatedassignment of some regional or economic grouping codes (such as GSEVEN) based on countrycodes of member countries. We have not investigated this issue.
Whether assigning RCV1 Region codes is a good test of text categorization capability as op-posed to named entity recognition capability (Grishman and Sundheim, 1995), is debatable. It isclear, however, that assigning Region codes is not solely a named entity task. There are many sto-ries that mention the United States, for instance, that are not assigned to the USA code, and thereare Region codes which are not named entities, such as WORLD and DEVGCO (DEVELOPINGCOUNTRIES).
3.2.4 RBB FILES
Just as the final version of this paper was being submitted, Reuters gave permission to publiclyrelease some of the documentation we used in the above analysis. We therefore include, as Online
374

RCV1: A NEW BENCHMARK COLLECTION
Appendices 16, 17, and 18, the RBB lists of Topics, Industries, and Region codes. RBB refers tothe Reuters Business Briefing archival database offering (Section 2.2).
The RBB files present code sets that are related to the codes appearing in the RCV1 docu-ments, and to the codes specified in the CD-ROM files industry codes.txt, topic codes.txt, and re-gion codes.txt. None of the corresponding sets of codes is exactly identical to any of the others,however, and the time period during which any particular set of codes was in use is not clear. Wehave slightly edited the Topics and Industries RBB files to fix some inconsistencies in code names,and to add descriptions for two codes missing from the RBB data, to make the resulting files moreconsistent with the RCV1 data. (Note that the Industries files also contains the RBB descriptionsfor the intermediate non-code nodes I0 through I9.) We have not edited the Regions RBB file, sinceit has significant differences from the RCV1 data.
Despite these differences, the RBB files should prove a useful supplement to the CD-ROM files,particularly since the RBB files give more extensive descriptions of some categories.
3.3 Coding Policy
Coding policies specify certain requirements for how coding should be done, beyond an editors’judgment of which codes capture the content of a particular text. As mentioned in Section 2.3,at least two coding policies, which we call the Hierarchy Policy and the Minimum Code Policy,were used by Reuters during the period the data in RCV1 was produced. We discuss here theirimplications for the use of RCV1 as a test categorization test collection.
3.3.1 IMPLICATIONS FOR CORPUS PROPERTIES
The Hierarchy Policy required that when a Topic or Industry code was assigned to an article, allthe codes which were ancestors of it in the Topic code hierarchy should be assigned as well. (Theapplication of this policy in producing the data that became RCV1 was imperfect, as discussed inSection 3.5.) Adding ancestor codes creates some very high frequency codes (CCAT is assigned to46% of the corpus), as well as strong, partially deterministic, dependencies between hierarchicallyrelated codes.
The Minimum Code Policy required that articles get at least one Region code and one Topiccode. This policy probably did not greatly affect the codes assigned, since the code sets themselveswere designed to cover the likely content of the newswire. However, unlike the Hierarchy Policy,the Minimum Code Policy did require human coders to change their behavior: in cases where theymight otherwise decide that no code applies, they were forced to choose some assignment. From astatistical standpoint, the Minimum Coding Policy introduces a weak dependence among all codesin a set.
3.3.2 IMPLICATIONS FOR ALGORITHM DESIGN
If one knows that the correct categorization of a document obeys coding policies, it is natural toattempt to modify a text categorization algorithm so its output obeys those policies. Whether doingthis will actually improve the effectiveness of a given system is, however, less clear.
The obvious approach to implementing the Hierarchy Policy is to run a categorizer as usual, andthen add the ancestors of all assigned categories if not already present. This runs the risk, however,of adding a high level category which was rejected by a well-trained classifier, on the basis of a lowlevel category assigned by a less well-trained classifier.
375

LEWIS, YANG, ROSE, AND LI
How easy (and desirable) it is to implement the Minimum Code Policy varies with the textcategorization method. For instance, a common strategy in text categorization is to create a sep-arate binary classifier for each category. This approach is likely to assign no categories to somedocuments, and so would sometimes violate the Minimum Code Policy.
3.3.3 IMPLICATIONS FOR EVALUATION
When testing algorithms on a corpus produced using a particular coding policy, should one disallowoutputs that violate that policy? This is often done when testing algorithms for multiclass (1-of-k)categorization: only algorithms that assign exactly one category for each test document are allowed.In an operational setting the data model, software interfaces, or other constraints might require strictadherence to coding policy.
On the other hand, if we view the system’s output as something which will be reviewed andcorrected by a human editor, a more relaxed approach may be appropriate. Rather than forbiddingoutputs that violate coding policy, one can instead measure the effort that would be required tocorrect these policy violations, along with correcting any other errorful assignments.
One way to measure the effort that would be required to correct errors is simply to compute theusual microaveraged or macroaveraged effectiveness measures from binary contingency tables forthe categories. This is the approach we adopt in reporting benchmark results in Section 8.
3.4 Was Each Document Manually Coded?
There are two somewhat conflicting worries that one might have about the RCV1 corpus. One isthat a portion of the corpus might have been missed during coding, as was the case with Reuters-21578 (Lewis, 1997). Conversely, one might worry that the use of autocoding (Section 2.4.1) meansthat achieving good effectiveness on RCV1 is an exercise in rediscovering the (possibly simple anduninteresting) rules used by the automated categorizer.
We believe neither worry is justified. Reuters procedures assured that each story was codedautomatically, and then had those codes checked by at least one, and sometimes two human editors.Further, a simple check of the raw RCV1-v1 corpus shows no documents that are totally lacking incodes, though some are missing one or another type of obligatory code (Section 3.5.2).
On the second question, we note that for each document a human editor always made the finaldecision on the codes to be assigned. Indeed, Table 2 shows that on average 79% of stories hadat least one autocoding decision overruled. This argues that, despite the use of automated coding,RCV1 can be considered a manually categorized test collection.
We believe that the only code whose automated assignment was not checked in this process wasGMIL, for millennium-related stories. This was automatically assigned, possibly without manualchecking, sometime after the period the documents were originally archived. There may have beena very small number of other such codes, but we have not found evidence for this.
3.5 Coding Errors
The Reuters-supplied interindexer consistency data presented in Section 2.5 suggests low levels ofdisagreements between indexers, and low levels of simple errors. However, there are also ways tostudy interindexer consistency directly on the collection. We investigate two such methods below,as well as discussing a more fundamental difficulty with the concept of coding errors.
376

RCV1: A NEW BENCHMARK COLLECTION
3.5.1 DETECTING CODING ERRORS USING DUPLICATE DOCUMENTS
One way to detect coding errors is to take advantage of documents which are duplicates of eachother and so presumedly should have the same codes assigned. Using a substring-based measure,Khmelev and Teahan (2003) found a total of 27,754 identical or highly similar documents in RCV1-v1. They observed that 52.3% of such documents had the same set of Topics, 80.1% had the sameset of Industries, and 86.8% had the same set of Regions. They suggest that the percentage ofmatching Topics is worrisomely low.
We have done a similar study which suggests less cause for concern. We identified the 14,347documents in RCV1-v2 whose <headline> and <text> elements are identical to those of anotherdocument (ignoring variations in whitespace). We then computed classification effectiveness foreach category based on treating all copies of a document as supplying fractional relevance judgmentsfor that document. For instance, if there were three copies of a document, each would be evaluatedagainst the other two, with each of the other two contributing a relevance judgment with weight 0.5.We computed the F1.0 measure for each category that appeared at least once in the 14,347 duplicateddocuments, and took the macroaverage of these values. (See Section 5.3 for this measure.)
The resulting macroaveraged F1.0 values were 0.69 for Topics (with 102 out of 103 possiblecategories being observed in the duplicates), 0.57 for Industries (262 of 354 categories observed),and 0.74 for Regions (206 of 366 categories observed). These values are all higher than the bestmacroaveraged F1.0 values seen in our experiments (Section 8) on categories with at least one pos-itive test example (0.61 for Topics, 0.27 for Industries, and 0.47 for Regions). So even if duplicatedocuments gave an accurate measure of the limitations on interindexer agreement, we are not reach-ing this limit.
Further, we suspect that the duplicated documents have a higher proportion of errorful assign-ments than do nonduplicated documents. A surprisingly high proportion of duplicated documentshave category assignments that are a superset of the assignments of one of their duplicates. Thisis most clear in cases where there were exactly two documents with the same <headline> and<text>. There were 6,271 such pairs. Of these, 4,182 had some difference in their Topics assign-ments, and in 1,840 of these cases one set of assignments is a superset of the other. For Regions,967 pairs have some difference, and 801 of these have a superset relationship. And for Industries,1,500 pairs have some difference, and 1,328 of these have a superset relationship.
The proportion of superset relationships seems higher than would be expected for independentindexings of the documents, though a precise statistical model is hard to pose. One hypothesisis that the duplicate documents are present precisely because one editor was correcting an assign-ment produced by a previous editor (or by the automated coder). While there was an attempt toremove duplicated stories before archiving, this was not done perfectly, so both the corrected anduncorrected versions may have been archived. If this was the case, then the disagreement rate seenamong duplicated stories will be much higher than for independent indexings of stories in general.
3.5.2 DETECTING CODING ERRORS BY VIOLATIONS OF CODING POLICIES
Another approach to identifying coding errors comes from knowledge of Reuters coding policies.There are 2,377 documents (0.29% of RCV1-v1) which violate the Minimum Code Policy by havingeither no Topic codes (2,364 documents) or no Region codes (13 documents). There are 14,786documents (1.8% of RCV1-v1) which violate the Hierarchy Policy on Topic codes, i.e., an ancestorof some assigned Topic code is missing. Of the 103 Topic codes that were used for the RCV1 data,
377
LEWIS, YANG, ROSE, AND LI
21 have at least one child in the Topic hierarchy. Each of these 21 codes is missing from at leastone document to which the Hierarchy Policy says it should have been assigned. A total of 25,402occurrences of these 21 codes are missing in RCV1-v1.
With respect to Industry codes, application of the Hierarchy Policy was also imperfect:
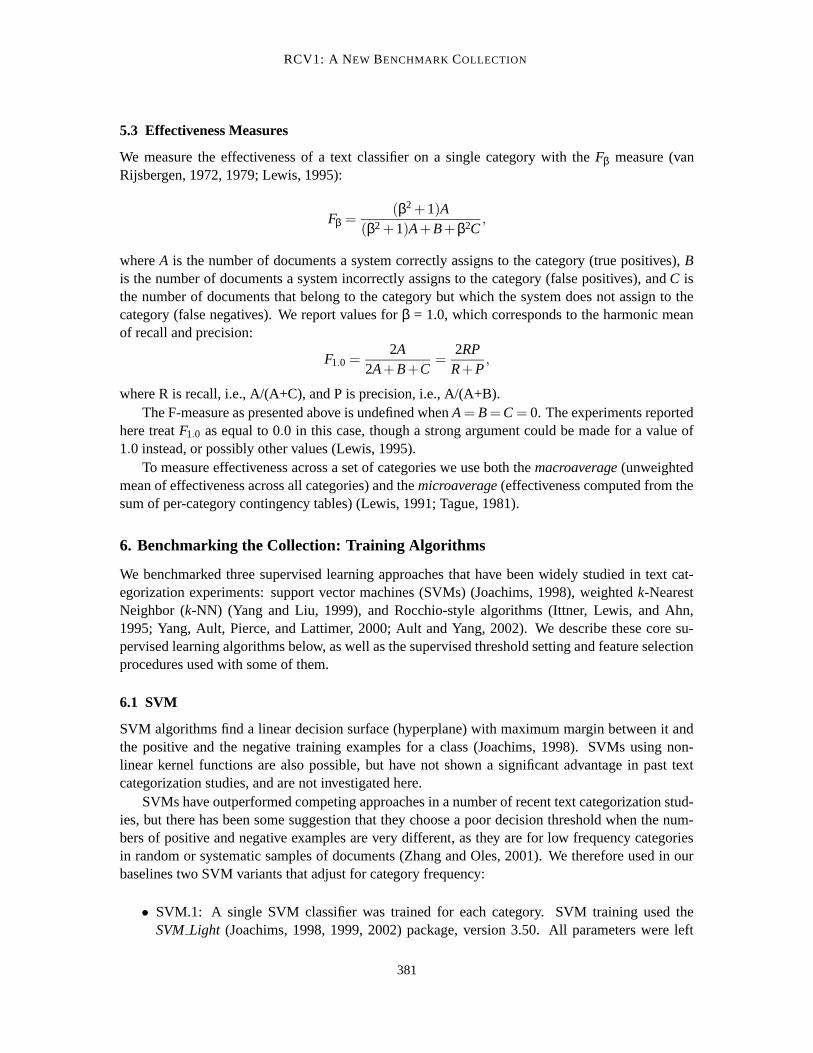
• The immediate parent of an 8-character code was automatically added to the document inmost cases, but these cases were missed:
– Some 8-character codes with one or more appearances in the corpus had (assumingwe have inferred the hierarchy correctly) an immediate parent code that is not the 6-character truncation of the 8-character code. These 8-character codes are (with par-ent shown in parentheses): I1610107 (I16100), I1610109 (I16100), I4752105 (I47520),I9741102 (I97400), I9741105 (I97400), I9741109 (I97400), I9741110 (I97400), andI9741112 (I97400). Three parents account for these cases (I16100, I47520, I97400)and they are assigned in only 7.1% to 46.6% of documents containing the child code,depending on the particular child category. This contrasts with essentially 100% assign-ment of parent codes which were 6-character truncations of 8-character codes.
– A single document containing two children of I01001 is missing I01001 itself. Thisappears to be a simple error. By contrast, all 12,782 other occurrences of children ofI01001 are in documents that also contain I01001.
• No grandparents or higher level ancestors of 8-character codes appear to have been automati-cally added, nor any ancestors of 6-character codes. The few cases where both a code and oneof these other ancestors are assigned to a document appear to result from a manual editorialdecision to assign both.
These violations result from some combination of human error, glitches in the hierarchical ex-pansion software, and/or omissions of some codes from the archival data when producing RCV1.Some errors appear to have resulted from manual additions of codes after hierarchical expansionhad already been run.
In Section 4 we propose an approach to correcting these errors, where possible, before using thecorpus for experimental purposes.
3.5.3 ERRORFUL CODES AND PLAUSIBLE CODES
While Reuters did compute measures of consistency between indexers working independently, aswell as traditional effectiveness measures for categorization software, these were not necessarilythe most important measures for them. When evaluating vendors for eventual selection of a newautomated categorization system (Section 2.6), Reuters used a measure based on the rate at whicha human expert actively disagreed with the coding choice made for the document. The idea is thatthere are some codes that plausibly might be assigned or might not be assigned.
In our experience, this is not an unusual stance for users of text classification to take. It suggests,unfortunately, that we should really consider the codes present in many corpora (including RCV1)to be those found necessary by the indexer, plus some (but not all) of those found plausible but notnecessary. How this ambiguity should best be handled in text classification evaluations is an openquestion.
378

RCV1: A NEW BENCHMARK COLLECTION
4. RCV1-v2: A New Text Categorization Test Collection
Since all evidence suggests that violations of the Hierarchy Policy and Minimum Coding Policy aresimple errors, removing these violations where possible will produce more accurate results in anyclassification experiments made using RCV1. In this section we describe the procedures necessaryto remove these errors. We call the resulting corrected text categorization test collection RCV1-v2(for version 2), while referring to the uncorrected original version as RCV1-v1.
The following corrections convert RCV1-v1 to RCV1-v2:
1. Remove from the corpus the 13 documents that violate the Minimum Code Policy due tomissing all Region codes, and the 2,364 documents that violate the policy due to missing allTopics. This leaves a total of 804,414 documents. Online Appendix 7 provides a list of theIDs of the 804,414 documents in RCV1-v2.
2. For each Topic code present in a document, add all missing ancestors of the code. This adds25,402 Topic code assignments.
3. Replace the four errorful occurrences of Region codes, as described in Section 3.2.3.
We applied these corrections to the corpus before producing the results reported in Section 8.We decided not to try to correct violations of the Hierarchy Policy for Industry codes. One
reason is that we are unsure of the exact Industry hierarchy at the time the RCV1 data was produced.In addition, it is not clear that the coding resulting from an expansion would actually be superior forresearch purposes. There are three classes of codes to consider:
• Leaf codes (i.e., all 8-character codes and some 6-character codes). Their assignments wouldnot be affected under any hierarchical expansion scheme.
• Non-leaf 6-character codes with 8-character children. All but 4 of these 6-character codesare assigned in 100% of the cases one or more of their children are present. One (I01001)is missing from only one of the 12,783 documents that contain one or more of its children.The three remaining codes (I16100, I47520, and I97400) are assigned to a fraction of thedocuments to which their children are assigned. These are exactly the three codes where theunpadded code for the parent is not a truncation of the unpadded code for one or more of itschild codes. We do not know if the assignments of these codes which are present in the corpusrepresent a partially successful automated assignment or, conversely, an intended omission ofautomated assignment in combination with manual decisions to assign the codes in certaincases. If we modified the corpus by assigning these codes when their children are present, itis unclear whether we would be respecting the intended semantics, or washing it out.
• Non-leaf 6-character codes that only have 6-character children. There seems to have beenlittle or no assignment of these codes based on expansion of children. Occurrences of thesecodes appear to correspond to a manual judgment that this code is appropriate. Automatedexpansion would swamp these manual judgments with large numbers of expansion-basedassignments (up to 100-fold more), producing an arguably less interesting classification task.
We therefore decided not to attempt hierarchical expansion of Industry codes. This means thatsome non-leaf Industry categories (6-character codes with 8-character children) have “Other + ex-pansion” semantics, some (I16100, I47520, and I97400) have unclear semantics, and the rest appar-ently have pure “Other” semantics (Section 3.2.1).
379

LEWIS, YANG, ROSE, AND LI
4.1 Availability of RCV1-v2 Data
Online Appendix 7 gives the complete list of RCV1-v2 document IDs. The complete sets of cor-rected RCV1-v2 category assignments are provided in Online Appendices 8, 9, and 10. In addition,two versions of the complete set of RCV1-v2 documents in vector form are provided as OnlineAppendices (see Section 7).
5. Benchmarking the Collection: Methods
An important part of the value of a machine learning data set is the availability of published bench-mark results. Among other things, good benchmark results serve to ensure that apparently superiornew methods are not being compared to artificially low baselines. We therefore ran three of the mostpopular supervised learning approaches on the RCV1-v2 data, both to provide such a benchmark,and as a check that our corrections to the data did not introduce any new anomalies.
5.1 Training/Test Split
We split the RCV1-v2 documents chronologically into a training set (articles published from August20, 1996 to August 31, 1996; document IDs 2286 to 26150) and test set (September 1, 1996 toAugust 19, 1997; document IDs 26151 to 810596). The result is a split of the 804,414 RCV1-v2documents into 23,149 training documents and 781,265 test documents. We call this the LYRL2004split. (Notice that ID order does not always correspond to chronological order in either RCV1-v1or RCV1-v2, so chronological splits in general should be based on the date tag in the <newsitem>element, not on IDs.)
The chronological boundary we used is the same used in the TREC-10/2001 filtering track(Robertson and Soboroff, 2002). However the TREC-10/2001 filtering track used the raw RCV1data (806,791 uncorrected RCV1-v1 documents split into 23,307 training documents and 783,484test documents) and raw category labels, so the TREC results are not comparable with ours.
A chronological split, rather than a random one, is realistic since the majority of operational textcategorization tasks require training on currently available material, and then applying the systemto material that is received later. A chronological split also reduces the tendency of duplicate andnear-duplicate documents to inflate measured effectiveness. The chronological breakpoint we chosehas the advantage of giving almost all Topic categories two or more training examples, while stillretaining most of a complete year as test data.
5.2 Categories
We provide benchmark data on all categories that evidence indicates were available to Reutersindexers, even those with few or no positive examples. There are 103 Topic categories, 101 withone or more positive training examples on our training set. All 103 (including all the 101, obviously)have one or more positive test examples on our test set. There are 354 Industry categories, 313 withpositive training examples, and 350 (including all of the 313) with positive test examples. And thereare 366 Region categories, 228 with positive training examples, and 296 (including all of the 228)with positive test examples. (All counts are the same for RCV1-v1, if the four invalid assignmentsof three invalid Region categories in RCV1-v1 are ignored.)
380
RCV1: A NEW BENCHMARK COLLECTION
5.3 Effectiveness Measures
We measure the effectiveness of a text classifier on a single category with the Fβ measure (vanRijsbergen, 1972, 1979; Lewis, 1995):
Fβ =(β2 +1)A
(β2 +1)A+B+β2C,
where A is the number of documents a system correctly assigns to the category (true positives), Bis the number of documents a system incorrectly assigns to the category (false positives), and C isthe number of documents that belong to the category but which the system does not assign to thecategory (false negatives). We report values for β = 1.0, which corresponds to the harmonic meanof recall and precision:
F1.0 =2A
2A+B+C=
2RPR+P
,
where R is recall, i.e., A/(A+C), and P is precision, i.e., A/(A+B).The F-measure as presented above is undefined when A = B = C = 0. The experiments reported
here treat F1.0 as equal to 0.0 in this case, though a strong argument could be made for a value of1.0 instead, or possibly other values (Lewis, 1995).
To measure effectiveness across a set of categories we use both the macroaverage (unweightedmean of effectiveness across all categories) and the microaverage (effectiveness computed from thesum of per-category contingency tables) (Lewis, 1991; Tague, 1981).
6. Benchmarking the Collection: Training Algorithms
We benchmarked three supervised learning approaches that have been widely studied in text cat-egorization experiments: support vector machines (SVMs) (Joachims, 1998), weighted k-NearestNeighbor (k-NN) (Yang and Liu, 1999), and Rocchio-style algorithms (Ittner, Lewis, and Ahn,1995; Yang, Ault, Pierce, and Lattimer, 2000; Ault and Yang, 2002). We describe these core su-pervised learning algorithms below, as well as the supervised threshold setting and feature selectionprocedures used with some of them.
6.1 SVM
SVM algorithms find a linear decision surface (hyperplane) with maximum margin between it andthe positive and the negative training examples for a class (Joachims, 1998). SVMs using non-linear kernel functions are also possible, but have not shown a significant advantage in past textcategorization studies, and are not investigated here.
SVMs have outperformed competing approaches in a number of recent text categorization stud-ies, but there has been some suggestion that they choose a poor decision threshold when the num-bers of positive and negative examples are very different, as they are for low frequency categoriesin random or systematic samples of documents (Zhang and Oles, 2001). We therefore used in ourbaselines two SVM variants that adjust for category frequency:
• SVM.1: A single SVM classifier was trained for each category. SVM training used theSVM Light (Joachims, 1998, 1999, 2002) package, version 3.50. All parameters were left
381

LEWIS, YANG, ROSE, AND LI
at default values. This meant, in particular, that we used a linear kernel (by leaving -t unspec-ified), equal weighting of all examples whether positive or negative (by leaving -j unspeci-fied), and set the tradeoff C between training error and margin to the reciprocal of the averageEuclidean norm of training examples (by leaving -c unspecified). Since we were using cosine-normalized training examples, leaving -c unspecified meant C was set approximately to 1.0.SVM Light was used to produce scoring models, but the SVM Light thresholds were replacedwith ones chosen by the SCutFBR.1 algorithm (Section 6.4).
• SVM.2: In this approach (Lewis, 2002), SVM Light, version 3.50, was run multiple times foreach category, once for each of these settings of its -j parameter: 0.1, 0.2, 0.4, 0.6, 0.8, 0.9,1.0, 1.25, 1.5, 2.0, 3.0, 4.0, 6.0, 8.0, 10.0, and 15.0. The -j parameter controls the relativeweighting of positive to negative examples in choosing an SVM classifier, and thus providesa way to compensate for unbalanced classes. Leave-one-out cross-validation (LOO) (turnedon by SVM Light’s -x 1 parameter) was used to compute a training set contingency tablecorresponding to each setting of -j. All other SVM Light parameters were left at their defaultvalues.
For each category, the F1.0 value for each setting of -j was computed from its LOO contin-gency table. The -j setting giving the highest LOO-estimated F1.0 for a category was selectedfor that category. (In case of ties, the value of -j closest to 1.0 was used, with -j values lessthan 1.0 replaced by their reciprocals when computing closeness. If a value had been tiedonly with its reciprocal for best and closest, we planned to choose the value greater than 1.0,but this situation did not arise.)
As expected, the algorithm tended to choose values of -j that gave additional weight to positiveexamples. The value 0.8 was chosen once for -j, 1.0 was chosen five times, 1.25 was choseneight times, 1.5 was chosen 11 times, 2.0 was chosen 27 times, 3.0 was chosen 27 times, 4.0was chosen 17 times, 6.0 was chosen four times, and 8.0 was chosen once.
A final classifier was trained on all training data for the category using the chosen setting of-j. The threshold chosen by SVM Light based on the selected setting of -j was used as is forthat category (SCutFBR.1 was not used). Due to its expense, SVM.2 was tried only for Topiccategories.
SVM.2 was the top-ranked approach in the batch filtering and routing tasks in the TREC-10evaluation (Robertson and Soboroff, 2002).
6.1.1 PARAMETER TUNING
The SVM.1 approach had one free parameter, the value of fbr in the SCutFBR.1 threshold settingalgorithm (Section 6.4). We compared the values 0.1, 0.2, 0.3, 0.4, 0.5, 0.6, 0.7, and 0.8 for fbrusing five-fold cross-validation on the training set and picked the best value for each category set(Topics, Industries, Regions) and effectiveness measure (microaveraged F1.0 and macroaveragedF1.0). (Note this five-fold cross-validation loop called the SCutFBR.1 procedure, which in turn usedits own five-fold cross-validation internally.) The final classifiers for each category in a categoryset were then trained using all training data and the chosen fbr value for their category set andeffectiveness measure.
382

RCV1: A NEW BENCHMARK COLLECTION
The SVM.2 algorithm itself incorporated tuning of its only free parameter (-j) so no outsidetuning was needed. Given the robustness of SVMs to high dimensional feature sets, no featureselection was used with either of the SVM algorithms.
6.2 k-NN
Weighted k-NN (k-nearest neighbor) classifiers have been consistently strong performers in textcategorization evaluations (Yang, 1999; Yang and Liu, 1999). The variant we used here chooses, asneighbors of a test document, the k training documents that have the highest dot product with thetest document. Then, for each category, the dot products of the neighbors belonging to that categoryare summed to produce the score of the category for the document. That is, the score of category c j
with respect to test document~x (a vector of term weights) is
s(c j,~x) = ∑~d∈Rk(~x)
cos(~x, ~d) I(~d,c j),
where ~d is a training document; Rk(~x) is the set consisting of the k training documents nearest to~x; and I(~d,c j) is indicator function whose value is 1.0 if ~d is a member of category c j, and 0.0otherwise. Since~x and ~d were normalized to have Euclidean norm of 1.0, their dot product is equalto the cosine of the angle between them, so we write the dot product as cos(~x, ~d). The resultingscore is then compared to the category threshold to determine whether or not to assign the categoryto the test document. Thresholds were chosen by SCutFBR.1 (Section 6.4).
The k-NN method is more sensitive to nonrelevant features than SVMs are, so the vectors usedwith it first had feature selection applied (Section 6.5).
6.2.1 PARAMETER TUNING
The k-NN algorithm had three free parameters, fbr, k (neighborhood size), and the feature set size.Five-fold cross-validation on the training set was used to select values for these parameters for eachcategory set and effectiveness measure. The following values were tried:
• fbr : 0.1, 0.2, 0.3, 0.4, 0.5, 0.6, 0.7, 0.8
• k : 1, 3, 5, 10, 20, 40, 60, 80, 100, 130, 160, 200, 400, 600, 800
• Feature set size : 50, 100, 200, 400, 600, 800, 1000, 2000, 3000, 4000, 5000, 6000, 7000,8000, 9000, 10000, 12000, 14000, 16000, 20000, 25000, 30000, 47152
However, not all combinations of values were tried. Instead parameter values were first initial-ized to defaults: 0.3 for fbr, 50 for k, and the number of terms with nonzero values in the training set(47,152 terms) for feature set size. Then one parameter value at a time was optimized while holdingthe others fixed: first k (holding default fbr and feature set size fixed), then feature set size (holdingthe chosen k and default fbr fixed), and finally fbr (holding the chosen k and chosen feature set sizefixed). Table 3 shows the k-NN parameter values chosen by this cross-validation process.
6.3 Rocchio-Style Prototype Classifier
The Rocchio method was developed for query expansion using relevance feedback in text retrieval(Rocchio, 1971; Salton and Buckley, 1990). Applied to text classification, it computes a prototype
383

LEWIS, YANG, ROSE, AND LI
ParametersNeighborhood
Effectiveness Features sizeCategory Set Measure selected (k) fbrTopics Micro F1 8000 100 0.5
Macro F1 8000 100 0.1Industries Micro F1 10000 10 0.4
Macro F1 10000 10 0.1Regions Micro F1 10000 10 0.5
Macro F1 10000 100 0.1
Table 3: Parameters chosen by cross-validation for our weighted k-NN algorithm, for each of thesix combinations of category set and averaged effectiveness measure.
vector for each category as a weighted average of positive and negative training examples (Ittner,Lewis, and Ahn, 1995).
Our Rocchio prototype for category c j was
~p j(γ) =1
|D(c j)|∑
~di∈D(c j)
~di − γ1
|Dn( c̄j)|∑
~di∈D(c̄ j)
~di,
where ~di is a training document; D(c j) and D( c̄j) are, respectively, the set of positive and negativetraining examples for category c j; and γ is the weight of the negative centroid.
Many enhancements have been proposed to the original Rocchio algorithm (Schapire, Singerand Singhal, 1998; Ault and Yang, 2002). We used only the following ones:
1. As with k-NN, we do an initial feature selection for each category set and averaged effective-ness measure, using the χ2 max criterion (Section 6.5).
2. We then do a further feature selection on a per-category basis by zeroing out all but the pmax
largest nonzero coefficients in the Rocchio vector. This keeps all positive coefficients beforeany negative ones. It is uncommon, but possible, for negative coefficients to remain in theRocchio vector after this procedure.
3. The Rocchio algorithm produces a scoring model only. We choose a threshold for this modelusing the SCutFBR.1 algorithm (Section 6.4).
6.3.1 PARAMETER TUNING
Our modified Rocchio algorithm had four free parameters, fbr, γ, pmax, and the feature set size.However, preliminary experiments on the training data for Topics showed that the choice of pmax
had little impact on effectiveness. A value of 3000 for pmax was found to be best in the Topicsrun, and so was used in all runs for all category sets and effectiveness measures. Five-fold cross-validation on the training data was used to select values for the other three parameters for eachcategory set and effectiveness measure. The following values were tried:
384

RCV1: A NEW BENCHMARK COLLECTION
ParametersFeatures Nonrelevant
Initial retained centroidEffectiveness features in model weight
Category Set Measure selected (pmax) (γ) fbrTopics Micro F1 5000 3000 1 0.3
Macro F1 5000 3000 1 0.2Industries Micro F1 10000 3000 2 0.4
Macro F1 10000 3000 6 0.1Regions Micro F1 10000 3000 2 0.5
Macro F1 10000 3000 2 0.5
Table 4: Parameters chosen by cross-validation for our modified Rocchio algorithm, for each of thesix combinations of category set and averaged effectiveness measure. The value of pmax
was chosen in an initial run on Topics, and then used for all combinations.
• fbr : 0.1, 0.2, 0.3, 0.4, 0.5, 0.6, 0.7, 0.8
• γ : 50, 20, 15, 10, 8, 6, 4, 3, 2, 1, 0, -1, -2
• Feature set size : 50, 100, 200, 400, 600, 800, 1000, 2000, 3000, 4000, 5000, 6000, 7000,8000, 9000, 10000, 12000, 14000, 16000, 20000, 25000, 30000, 47152
As with k-NN, we first initialized the three parameters to default values (0.3 for fbr, 1 for γ, and47,152 for feature set size), and then optimized one parameter at a time: first γ, then feature set size,and finally fbr. The selected parameter values are shown in Table 4.
6.4 Supervised Threshold Setting
Each of our algorithms produces, for each category, a model that assigns scores to documents. Touse these models for classification, we use the SCut strategy (Yang, 2001), i.e., simply associatinga threshold value with each category, and assigning the category to a document when the scorefor that category exceeds the threshold. Other category assignment strategies (Yang, 2001) besidesSCut were evaluated on the training data, but Scut was consistently superior so only it was used toproduce classifiers evaluated on the test data.
The SVM.2 algorithm incorporates its own method for choosing a threshold to be used in theSCut approach. The other core training algorithms (SVM.1, k-NN, and Rocchio) were used to trainscoring models. Thresholds for those scoring models were found by wrapping the core trainingalgorithm within Yang’s SCutFBR.1 algorithm (Yang, 2001). The .1 refers to the rank of the val-idation document whose score becomes the threshold if the cross-validated threshold gives poorestimated effectiveness (see below). The core SCutFBR algorithm can be used with other fallbackranks as well (Yang, 2001).
SCutFBR.1 uses five-fold cross-validation with random assignment of documents to folds (i.e.,no balancing of positive and negative examples). In each fold, a scoring model was trained on four-fifths of the data and its threshold was tuned on the remaining one-fifth. If the tuned threshold gave
385

LEWIS, YANG, ROSE, AND LI
an F1.0 value less than a specified minimum value fbr, then that threshold was replaced by the scoreof the top-ranked validation document. The final threshold for the category is the average of thethresholds across the five folds.
6.5 Supervised Feature Selection
Our text representation approach produced a set of 47,236 features (stemmed words), of which47,152 occurred in one or more training set documents and so potentially could be included in clas-sifiers (Section 7). Two of the algorithms studied, k-NN and Rocchio, are known to be significantlyhampered by irrelevant features. Feature selection based on labeled data was used with these twoalgorithms. A separate feature set was chosen for each combination of algorithm (k-NN or Roc-chio), category set (Topics, Industries, or Regions), and effectiveness measure (microaveraged F1.0
or macroaveraged F1.0).The feature set for a combination was chosen by first ranking the 47,152 features by their
χ2 max score (Yang and Pedersen, 1997; Rogati and Yang, 2002) with respect to the category set.To compute this score, we first separately compute the χ2 statistic (Altman, 1991, Section 10.7) forthe feature with respect to each category in the category set:
χ2 =n(ad −bc)
(a+b)(a+ c)(b+d)(c+d),
where n is the total number of examples used in calculating the statistic, a is the number of exampleswith both the feature and the category, b is the number of examples with the feature and not thecategory, c is the number of examples with the category and not the feature, and d is the number ofexamples with neither the feature nor the category.
The feature’s χ2 max score is the maximum value of the χ2 statistic across all categories inthe category set. Note that the use of χ2 max feature selection means that training data from allcategories in a category set influences the set of features used with each individual category in theset.
The χ2 max score produces a ranking of all features from best to worst. To choose a featureset, we then had to choose a size for the feature set to know how far down that ranking to go. Thiswas done by evaluating each of 23 corresponding feature sets using five-fold cross-validation on thetraining data, and picking the best (Sections 6.2.1 and 6.3.1).
7. Benchmarking the Collection: Text Representation
The same sets of training and test document feature vectors were provided to each algorithm. Thefeature vector for a document was produced from the concatenation of text in the <headline> and<text> XML elements. It is important to note that the <title> element of RCV1 documentscontains a “country code” string that was semi-automatically inserted, possibly based on the Re-gion codes. The <title> element should therefore not be used in experiments predicting categorymembership. (The <headline> element was added by Reuters during the production of the RCV1corpus. It contains the same text as the <title> element, but strips out the country code.)
Text was reduced to lower case characters, after which we applied tokenization, punctuationremoval and stemming, stop word removal, term weighting, feature selection, and length normal-ization, as described below.
386

RCV1: A NEW BENCHMARK COLLECTION
We defined tokens to be maximal sequences of nonblank characters. Tokens consisting purely ofdigits were discarded, as were words found on the stop word list from the SMART system (Salton,1971). The list is found at ftp://ftp.cs.cornell.edu/pub/smart/english.stop, and we also include it asOnline Appendix 11.
The remaining tokens were stemmed with our own implementation of the Porter stemmer(Porter, 1980). Our implementation did considerable punctuation removal as well as stemming.As the author of the Porter stemmer has discussed (Porter, 2003) it is very rare for two implemen-tations of the Porter stemmer to behave identically. To enable reproducing our results, we thereforeprovide our stemmed tokens in Online Appendix 12, as discussed at the end of this section.
Document vectors based on the stemmed output were then created, with each coordinate of thevectors corresponding to a unique term (stemmed word). Only terms which occurred in one ormore of the 23,307 RCV1-v1 documents falling before our chronological breakpoint were used inproducing vectors. Terms which had their only occurrences in post-breakpoint documents (i.e., ourtest documents) did not affect vector formation in any way. In particular, they were not taken intoaccount during cosine normalization (below).
We had intended to use only our training set (the 23,149 pre-breakpoint RCV1-v2 documents)for feature definition, not all 23,307 pre-breakpoint RCV1-v1 documents. The effect of accidentallyincluding stems from these 158 additional documents in document vectors is that a few featureswhose value is 0.0 on all of our training documents are nonetheless allowed to have nonzero valuesin test documents. (Except for words in these 158 documents, words that show up in the testset, butnot the training set, do not participate in any vectors.) These additional features will occasionallyhave nonzero values on test documents, thus slightly impacting (through cosine normalization) thevalue of the other features. The impact on overall results should be negligible. No label informationfrom these 158 mistaken documents was used.
The number of unique terms present in the 23,307 pre-breakpoint RCV1-v1 documents was47,236. Of these, only 47,219 occur in RCV1-v2 training and/or test documents, so 47,219 issize of the complete feature set for RCV1-v2. Of these 47,219 terms, only 47,152 have one or moreoccurrences in the RCV1-v2 training set, and so were available to be included in classifiers. Averagedocument length for RCV1-v2 documents with our text representation is 123.9 terms, and averagenumber of unique terms in a document is 75.7.
The weight of a term in a vector was computed using Cornell ltc term weighting (Buckley,Salton, and Allan, 1994), a form of TF × idf weighting. This gives term t in document d an initialweight of
wd(t) = (1+ loge n(t,d))× loge(|D|/n(t)),
where n(t) is the number of documents that contain t, n(t,d) is the number of occurrences of termt in document d, and |D| is the number of documents used in computing the inverse documentfrequency weights (idf weights).
The idf weights used were computed from all 23,307 RCV1-v1 documents which fall beforeour chronological breakpoint, not just the 23,149 RCV1-v2 documents we used for training. Again,while unintentional, this a legitimate use of additional unlabeled data. Only the document text fromthe additional documents was used, not their codes. The resulting idf values are in most cases almostidentical to the intended ones.
For the k-NN and Rocchio algorithms (but not SVM.1 and SVM.2) we then applied featureselection to the vectors, as described in Section 6.5. This implicitly replaced wd(t) with w′
d(t), where
387

LEWIS, YANG, ROSE, AND LI
w′d(t) was equal to wd(t) for features chosen by feature selection, but equal to 0.0 for nonselected
features.
Finally, ltc weighting handles differences in document length by cosine normalizing the featurevectors (normalizing them to have a Euclidean norm of 1.0). These resulting final weights were
w′′d(t) =
w′d(t)
√
∑u w′d(u)×w′
d(u).
Since cosine normalization was done after feature selection, both the set of nonzero feature values,and the feature values themselves, differ among the runs.
Despite being fairly straightforward by IR standards, we recognize that the above preprocess-ing would be nontrivial to replicate exactly. We therefore have made the exact data used in ourexperiments available in two forms.
Online Appendix 12 contains documents that have been tokenized, stopworded, and stemmed.Online Appendix 13 contains documents in final vector form, i.e., as ltc weighted vectors. Nofeature selection has been done for these vectors, i.e., they are as used for SVM training and testing.(And thus are different from those used with k-NN and Rocchio, since those had feature selectionapplied.) Online Appendix 13 uses numeric term IDs rather than the string form of words. OnlineAppendix 14 gives the mapping between the numeric term IDs and string forms.
The vectors in Online Appendix 13 are based on terms that occurred in our pre-breakpointdocuments, and so should only be used in experiments based on the same training/test split asin this paper. In contrast, the tokenized representations in Online Appendix 12 contain all non-stopwords, and so can be used with any training/test split. Online Appendix 12 will be preferablefor most purposes.
Reuters has agreed (Rose, 2002; Whitehead, 2002) to our distribution of these token and vectorfiles without a license agreement. We nevertheless strongly encourage all users of these files tolicense the official RCV1 CD-ROMs (see the Acknowledgments section at the end of this paper fordetails).
8. Benchmarking the Collection: Results
Tables 5 and 6 give microaveraged and macroaveraged values of F1.0 for the four classificationmethods, three category sets, and three subsets of each category set. The results largely confirmpast studies: SVMs are dominant, weighted k-NN is competitive, and the Rocchio-style algorithmis a plausible but lagging straw man. The choice of averaging, category set, and effectivenessmeasure affects absolute scores but rarely the ordering of approaches.
We provide not only the averaged data of Tables 5 and 6, but also the full testset contingencytables for each category as Online Appendix 15. This allows computing alternate effectivenessmeasures for our classifiers, recognizing of course that the classifiers were trained to optimize F1.0.
For example, one might feel that only leaf nodes of the Topic hierarchy should be used forevaluation, since assignments of internal nodes are partially based on automated expansion of leafassignments. Averaged effectiveness measures using only leaf categories could be computed fromour contingency tables.
388
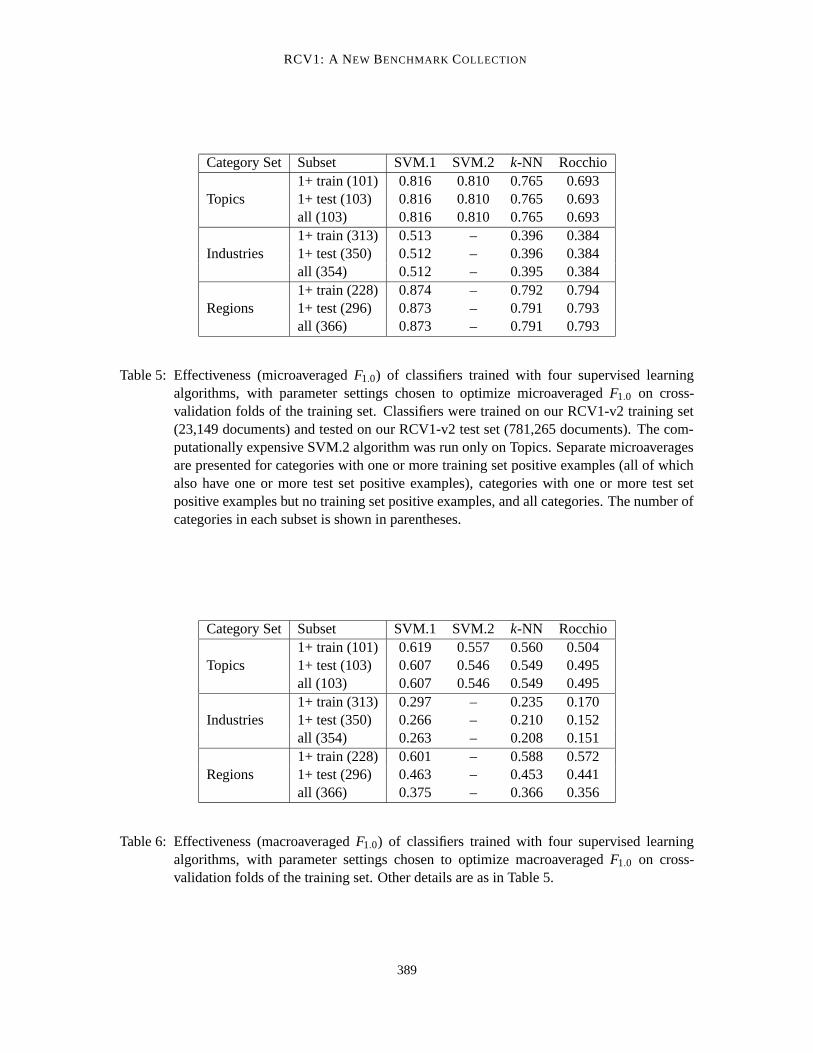
RCV1: A NEW BENCHMARK COLLECTION
Category Set Subset SVM.1 SVM.2 k-NN Rocchio1+ train (101) 0.816 0.810 0.765 0.693
Topics 1+ test (103) 0.816 0.810 0.765 0.693all (103) 0.816 0.810 0.765 0.6931+ train (313) 0.513 – 0.396 0.384
Industries 1+ test (350) 0.512 – 0.396 0.384all (354) 0.512 – 0.395 0.3841+ train (228) 0.874 – 0.792 0.794
Regions 1+ test (296) 0.873 – 0.791 0.793all (366) 0.873 – 0.791 0.793
Table 5: Effectiveness (microaveraged F1.0) of classifiers trained with four supervised learningalgorithms, with parameter settings chosen to optimize microaveraged F1.0 on cross-validation folds of the training set. Classifiers were trained on our RCV1-v2 training set(23,149 documents) and tested on our RCV1-v2 test set (781,265 documents). The com-putationally expensive SVM.2 algorithm was run only on Topics. Separate microaveragesare presented for categories with one or more training set positive examples (all of whichalso have one or more test set positive examples), categories with one or more test setpositive examples but no training set positive examples, and all categories. The number ofcategories in each subset is shown in parentheses.
Category Set Subset SVM.1 SVM.2 k-NN Rocchio1+ train (101) 0.619 0.557 0.560 0.504
Topics 1+ test (103) 0.607 0.546 0.549 0.495all (103) 0.607 0.546 0.549 0.4951+ train (313) 0.297 – 0.235 0.170
Industries 1+ test (350) 0.266 – 0.210 0.152all (354) 0.263 – 0.208 0.1511+ train (228) 0.601 – 0.588 0.572
Regions 1+ test (296) 0.463 – 0.453 0.441all (366) 0.375 – 0.366 0.356
Table 6: Effectiveness (macroaveraged F1.0) of classifiers trained with four supervised learningalgorithms, with parameter settings chosen to optimize macroaveraged F1.0 on cross-validation folds of the training set. Other details are as in Table 5.
389

LEWIS, YANG, ROSE, AND LI
8.1 Microaveraging vs. Macroaveraging
Microaveraged measures are dominated by high frequency categories. For RCV1, this effect variesamong the category sets. For Topics, hierarchical expansion inflates the frequency of all non-leaf categories. Non-leaf categories account for only 20% (21/103) of Topic categories but 79%(2,071,530 / 2,606,875) of all Topic code assignments. The four top level Topic categories (CCAT,ECAT, GCAT, and MCAT) alone account for 36% (945,334 / 2,606,875) of all Topic assignments.Thus, microaveraged scores for Topics largely measure effectiveness at broad, perhaps less inter-esting, content distinctions. In contrast, hierarchical expansion for Industry categories affected onlya few categories, and Regions underwent no hierarchical expansion at all. The most frequent (andthus dominant) categories for Industries and Regions are not necessarily the semantically broadestcategories.
Macroaveraging, on the other hand, gives equal weight to each category, and thus is dominatedby effectiveness on low frequency categories. For Topics and Industries this is largely the leafcategories in each taxonomy, thus categories with narrow meanings. For Regions, narrowness ofmeaning is less the issue than degree to which the particular geographic entity is covered in the news.Macroaveraged effectiveness for Regions is dominated by categories corresponding to countries thatare discussed only infrequently in international news.
8.2 Averaging Over Categories with No Positive Examples
Past research has varied in how categories with no training or test examples are handled in mea-suring text categorization effectiveness. We include averages over all categories, over categorieswith at least one positive training example, and over categories with at least one positive trainingexamples and at least one positive test example. (For our training/test split of RCV1-v2 there wereno categories that had one or more positive training examples but zero positive test examples.) Eachaverage is useful for different purposes:
• Averaging over all categories: This best reflects the operational task. Such an average is alsothe most appropriate for comparisons with knowledge-based and string-matching approaches,since these can be used even on categories with no positive training examples.
• Averaging over categories with one or more positive test examples: This factors out the im-pact of choosing an arbitrary value (0.0 in our case) for F1.0 when there are no positive testexamples (Section 5.3). This impact can occasionally be large. For instance, macroaveragedeffectiveness figures for Regions on RCV1-v2 are strongly affected by whether categorieswith no positive test examples are included in the average (Table 6).
• Averaging over categories with one or more positive training examples: This is appropriatewhen the primary goal is research on supervised learning methods.
8.3 Effectiveness on Individual Categories
Past text categorization research arguably has overemphasized average effectiveness. This waspartly a necessity. With the widely used ModApte split of Reuters-21578, the median frequencyTopic category (of 135 Topic categories defined on that collection) has only three test set occur-rences, so averaging was necessary to produce effectiveness figures that were at all accurate.
390

RCV1: A NEW BENCHMARK COLLECTION
101
102
103
104
0
0.1
0.2
0.3
0.4
0.5
0.6
0.7
0.8
0.9
1
category frequency
f1 v
alue
F1 vs Category frequency on 103 topic categories
knn regression curveRocchio regression curveSVM.1 regression curveSVM.2 regression curve
Figure 2: Test set F1.0 for four classifier approaches on 103 RCV1-v2 Topic categories. Categoriesare sorted by training set frequency, which is shown on the x-axis. The F1.0 value for acategory with frequency x has been smoothed by replacing it with the output of a locallinear regression over the interval x−200 to x+200.
391

LEWIS, YANG, ROSE, AND LI
Figure 3: Raw test set F1.0 values for the SVM.1 approach on all three category sets. The line showscorresponding smoothed (as in Figure 2) values. Training set frequency is shown on thex-axis.
392

RCV1: A NEW BENCHMARK COLLECTION
In contrast, the median frequency Topic category for our test set has 7,250 test set occurrences:bigger than the entire ModApte test set. Only three categories have fewer than 100 test set occur-rences, so category-level effectiveness figures are more meaningful.
Figure 2 shows smoothed F1.0 values for our four classifier training approaches on the 103 Topiccategories, sorted by training set frequency of the category. While smoothing aids comparisonacross the classifiers, it hides a good deal of category-to-category variation. Figure 3 instead showsraw F1.0 values for the SVM.1 approach on all three category sets.
Since our focus is methodological we make only a few observations on this data:
• Effectiveness generally increases with increasing class frequency, but the category-to-categoryvariation is very large (Figure 3). This variation has been noted for previous collections, butthe large size of RCV1 gives more confidence in this observation. Further, some of the de-crease in variation at the right of the graph results from the fact that even a poor classificationon a high frequency category can yield a moderately high F-measure value (Lewis and Tong,1992). For instance, the most frequent Topic category has a test set frequency of 0.465. Aclassifier that simply assigned all test documents to this category would have an F1.0 of 0.635.
• Among the tested approaches, SVM classifiers and in particular SVM.1 classifiers, are domi-nant at all category frequencies. This fact has been obscured in some previous SVM studies,which restricted experiments to a small set of high frequency categories or presented onlymicroaveraged effectiveness measures.
• The SCutFBR.1 approach to threshold tuning for SVMs (SVM.1) is as good or better than themore computationally expensive leave-one-out procedure (SVM.2). Interestingly, it appearsthat the difference in the effectiveness of SVM.1 and SVM.2 largely results from their choiceof threshold rather than from the orientation of the resulting hyperplanes. We did a test(results not reported here) in which we set both SVM.1 and SVM.2 classifiers to their testset optimal thresholds, and found the resulting effectiveness to be almost identical. Thissimilarity of effectiveness is somewhat surprising, since SVM.2 often chooses hyperplaneswith substantially different orientations than those chosen by SVM.1. We found the anglebetween the normals of the SVM.1 and SVM.2 hyperplanes (the inverse cosine of the dotproduct of weight vectors normalized to have Euclidean norm of 1.0), averaged over the 103Topic categories, to be 19.6 degrees.
• We find some support for previous suggestions (Schapire, Singer and Singhal, 1998) thatRocchio-style algorithms are at their best when relatively few positive examples are available,though in all cases they lag the other methods tested. An interesting avenue for future work,now possible with RCV1, would be teasing apart the impact of category narrowness vs. thenumber of positive training examples supplied (perhaps using stratified sampling).
9. Summary
Research in machine learning is heavily driven by available data sets, and supervised learning fortext categorization is no exception. We believe RCV1 has the potential to support substantial re-search advances in hierarchical categorization, scaling of learning algorithms, effectiveness on lowfrequency categories, sampling strategies, and other areas. As of January 5, 2004, the collection hadbeen distributed by Reuters to 520 groups, suggesting it is likely to be widely used.
393

LEWIS, YANG, ROSE, AND LI
We hope that by documenting the data production process, the nature of the coding, and the im-pact of these on the resulting test collection, we have contributed to the usefulness of the collection.Some of the insights here may also be of use to those producing future test collections and manag-ing real-world text classification systems. Finally, we hope that our benchmark data will encouragereplicability and transparency in future text categorization research.
Acknowledgments
We are grateful to Reuters, Ltd. for making Reuters Corpus Volume 1 available, and for support-ing its design and production by Reuters employees Chris Harris and Miles Whitehead. In addition,one of us (Tony Rose) thanks Reuters for supporting his work on the corpus while a Reuters em-ployee. We also acknowledge and thank Stephen Robertson (then of City University London) forhis work with Reuters on planning the corpus.
We urge the research community to support these efforts by respecting the terms of the li-cense agreement (http://about.reuters.com/researchandstandards/corpus/agreement.htm), in partic-ular clause 3.3 on acknowledging Reuters and providing a copy of any publication. We encouragethose with questions about the corpus to post them to the Reuters Corpora mailing list athttp://groups.yahoo.com/group/ReutersCorpora/.
Many current and former Reuters employees provided information on the production of the dataor on editorial processes at Reuters. These include Dave Beck, Chris Harris, Paul Hobbs, StevenMurdoch, Christopher Porter, Jo Rabin, Mark Stevenson, Miles Whitehead, Richard Willis, and An-drew Young. This paper would not have been possible without their input, and we apologize to anywhose names we have missed. We also thank Tom Ault, Evgeniy Gabrilovich, Alex Genkin, PaulKantor, Mikhail Kreines, Ray Liere, Yury Lubensky, David Madigan, Herbert Roitblat, FabrizioSebastiani, Bill Teahan, Benjy Weinberger, and the anonymous JMLR reviewers for comments ondrafts of this paper, for sharing their data on RCV1, or for other help.
This research was supported in part by the U.S. National Science Foundation (NSF) under grantnumbers KDI-9873009, IIS-9982226, EIA-0087022, and DMS-0113236. Any opinions or conclu-sions in this paper are the authors’ and do not necessarily reflect those of the sponsors.
References
D. G. Altman. Practical Statistics for Medical Research. Chapman & Hall/CRC, 1991.
T. Ault and Y. Yang. kNN, Rocchio and metrics for information filtering at TREC-10. In The TenthText REtrieval Conference (TREC 2001), pages 84–93, Gaithersburg, MD 20899-0001, 2002.National Institute of Standards and Technology. http://trec.nist.gov/pubs/trec10/papers/cmucat-correct.pdf.
C. Buckley, G. Salton, and J. Allan. The effect of adding relevance information in a relevance feed-back environment. In Proceedings of the Seventeenth Annual International ACM-SIGIR Confer-ence on Research and Development in Information Retrieval (SIGIR 94), pages 292–300, 1994.
C. W. Cleverdon. The significance of the Cranfield tests of index languages. In Proceedings ofthe Fourteenth Annual International ACM-SIGIR Conference on Research and Development inInformation Retrieval (SIGIR 91), pages 3–12, 1991.
394

RCV1: A NEW BENCHMARK COLLECTION
Great Britain Office for National Statistics. Indexes to UK Standard Industrial Classification ofEconomic Activities 1992 UK SIC(92). Office for National Statistics, London, 1997.
Great Britain Office for National Statistics. UK Standard Industrial Classification of EconomicActivities UK SIC(92), December 20, 2002.http://www.statistics.gov.uk/methods quality/sic/contents.asp.
R. Grishman and B. Sundheim. Design of the MUC-6 evaluation. In Sixth Message Understand-ing Evaluation (MUC-6), pages 1–12. Defense Advanced Research Projects Agency, MorganKaufmann, 1995.
P. J. Hayes and S. P. Weinstein. CONSTRUE/TIS: A System for Content-Based Indexing of aDatabase of News Stories. In Second Annual Conference on Innovative Applications of ArtificialIntelligence, pages 49–64, 1990.
W. Hersh, C. Buckley, T. J. Leone, and D. Hickman. OHSUMED: an interactive retrieval evaluationand new large text collection for research. In Proceedings of the Seventeenth Annual Interna-tional ACM-SIGIR Conference on Research and Development in Information Retrieval (SIGIR94), pages 192–201, 1994.
D. J. Ittner, D. D. Lewis, and D. D. Ahn. Text Categorization of Low Quality Images. In Symposiumon Document Analysis and Information Retrieval, pages 301–315, Las Vegas, 1995.
T. Joachims. Text categorization with support vector machines: Learning with many relevant fea-tures. In European Conference on Machine Learning (ECML ’98), pages 137–142, Berlin, 1998.
T. Joachims. Transductive inference for text classification using support vector machines. In In-ternational Conference on Machine Learning (ICML’99), pages 200–209, San Francisco, CA,1999.
T. Joachims. SVM Light: Support Vector Machine, May 13th, 2002. http://svmlight.joachims.org.
D. V. Khmelev and W. J. Teahan. A repetition based measure for verification of text collectionsand for text categorization. In Proceedings of the Twenty-Sixth Annual International ACM SIGIRConference on Research and Development in Information Retrieval (SIGIR 03), pages 104–110,2003.
D. Koller and M. Sahami. Hierarchically classifying documents using very few words. In Interna-tional Conference on Machine Learning (ICML’97), pages 170–178, Nashville, 1997.
F. W. Lancaster. Indexing and Abstracting in Theory and Practice. Second edition. University ofIllinois, Champaign, IL, 1998.
D. D. Lewis. Evaluating text categorization. In Proceedings of Speech and Natural LanguageWorkshop, pages 312–318. Defense Advanced Research Projects Agency, Morgan Kaufmann,1991.
D. D. Lewis. An evaluation of phrasal and clustered representations on a text categorization task.In Proceedings of the Fifteenth Annual International ACM SIGIR Conference on Research andDevelopment in Information Retrieval (SIGIR 92), pages 37–50, 1992.
395

LEWIS, YANG, ROSE, AND LI
D. D. Lewis. Evaluating and optimizing autonomous text classification systems. In Proceedings ofthe 18th Annual International ACM SIGIR Conference on Research and Development in Infor-mation Retrieval (SIGIR 95), pages 246–254, 1995.
D. D. Lewis. Reuters-21578 text Categorization test collection. Distribution 1.0. README file (ver-sion 1.2). Manuscript, September 26, 1997.http://www.daviddlewis.com/resources/testcollections/reuters21578/readme.txt
D. D. Lewis. Applying support vector machines to the TREC-2001 batch filtering androuting tasks. In The Tenth Text REtrieval Conference (TREC 2001), pages 286–292,Gaithersburg, MD 20899-0001, 2002. National Institute of Standards and Technology.http://trec.nist.gov/pubs/trec10/papers/daviddlewis-trec2001-draft4.pdf.
D. D. Lewis, R. E. Schapire, J. P. Callan, and R. Papka. Training algorithms for linear text classi-fiers. In Proceedings of the 19th Annual International ACM SIGIR Conference on Research andDevelopment in Information Retrieval (SIGIR 96), pages 298–306, 1996.
D. D. Lewis and R. M. Tong. Text filtering in MUC-3 and MUC-4. In Proceedings of theFourth Message Understanding Conference (MUC-4), pages 51–66. Defense Advanced ResearchProjects Agency, Morgan Kaufmann, 1992.
M. F. Porter. An algorithm for suffix stripping. Program, 14(3):130–137, 1980.
M. F. Porter. The Porter Stemming Algorithm, 2003.http://www.tartarus.org/˜martin/PorterStemmer.
S. Robertson and I. Soboroff. The TREC 2001 filtering track report. In The Tenth Text REtrievalConference (TREC 2001), pages 26–37, Gaithersburg, MD 20899-0001, 2002. National Instituteof Standards and Technology. http://trec.nist.gov/pubs/trec10/papers/filtering2 track.pdf.
J. J. Rocchio, Jr.. Relevance feedback in information retrieval. In G. Salton, editor, The SMARTRetrieval System: Experiments in Automatic Document Processing, pages 313–323. Prentice-Hall, 1971.
M. Rogati and Y. Yang. High performing and scalable feature selection for text classification. InProceedings of the Eleventh International Conference on Information and Knowledge Manage-ment, pages 659-661, 2002.
T. Rose, M. Stevenson, and M. Whitehead. The Reuters Corpus Volume 1 – from Yesterday’s Newsto Tomorrow’s Language Resources. In Proceedings of the Third International Conference onLanguage Resources and Evaluation, 2002.http://about.reuters.com/researchandstandards/corpus/LREC camera ready.pdf
T. Rose. Electronic mail message to [email protected], June 11, 2002.http://groups.yahoo.com/group/ReutersCorpora/message/70.
G. Salton and C. Buckley. Improving retrieval performance by relevance feedback. Journal ofAmerican Society for Information Sciences, 41:288–297, 1990.
396

RCV1: A NEW BENCHMARK COLLECTION
G. Salton, editor. The SMART Retrieval System: Experiments in Automatic Document Processing.Prentice-Hall, 1971.
R. E. Schapire, Y. Singer, and A. Singhal. Boosting and Rocchio applied to text filtering. InProceedings of the Twenty-First Annual International ACM SIGIR Conference on Research andDevelopment in Information Retrieval (SIGIR 98), pages 215–223, 1998.
F. Sebastiani. Machine learning in automated text categorization. ACM Computing Surveys,34(1):1–47, 2002.
J. M. Tague. The pragmatics of information retrieval experimentation. In K. Sparck Jones, editor,Information Retrieval Experiment, chapter 5. Butterworths, 1981.
C. J. van Rijsbergen. Automatic Information Structuring and Retrieval. PhD thesis, King’s College,Cambridge, 1972.
C. J. van Rijsbergen. Information Retrieval. Butterworths, 1979.
M. Whitehead. Electronic mail message to [email protected], November 14,2002. http://groups.yahoo.com/group/ReutersCorpora/message/106.
A. S. Weigend, E. D. Wiener, and J. O. Pedersen. Exploiting hierarchy in text categorization.Information Retrieval, 1(3):193–216, 1999.
Y. Yang. An evaluation of statistical approaches to text categorization. Information Retrieval,1(1/2):67–88, 1999.
Y. Yang. A study on thresholding strategies for text categorization. In The Twenty-Fourth AnnualInternational ACM SIGIR Conference on Research and Development in Information Retrieval(SIGIR 01), pages 137–145, 2001.
Y. Yang, T. Ault, T. Pierce, and C. W. Lattimer. Improving text categorization methods for eventtracking. In Proceedings of the 23rd Annual International ACM SIGIR Conference on Researchand Development in Information Retrieval (SIGIR 00), pages 65–72, 2000.
Y. Yang and X. Liu. A re-examination of text categorization methods. In Proceedings of theTwenty-Second Annual International ACM SIGIR Conference on Research and Development inInformation Retrieval (SIGIR 99), pages 42–49, 1999.
Y. Yang and J. O. Pedersen. A comparative study on feature selection in text categorization. In TheFourteenth International Conference on Machine Learning (ICML’97), pages 412–420. MorganKaufmann, 1997.
T. Zhang and F. J. Oles. Text categorization based on regularized linear classification methods.Information Retrieval, 4(1):5–31, 2001.
397