rd quarter progress report for cy 2017 - dilg.gov.ph · region 12 - soccsksargen 132 120 5 7 region...
TRANSCRIPT
0 | P a g e
3rd QUARTER PROGRESS REPORT
FOR CY 2017

1 | P a g e
EXECUTIVE SUMMARY: BACKGROUND
1. The Performance Challenge Fund (PCF) is an incentive provided to Local
Government Units (LGUs) in the form of financial grant for local development
projects included in their Annual Investment Program (AIP)/ Local Development
Investment Program (LDIP). The PCF aims to recognize good governance
performance particularly in the areas of transparency, accountability, participation
and service delivery.
2. The Department of the Interior and Local Government (DILG) has been
implementing the PCF since 2010 that aims to foster the alignment of the local
development initiatives with the national goals and priorities. Specifically, it
encourages LGUs to put a premium on performance in order for them to avail the
financial subsidy to jumpstart and sustain projects geared towards the achievement
of the Millennium Development Goals, Maintain Core Road Network to boost
tourism and local economic development, comply with the Ecological Solid Waste
Management Act of 2000, comply with the Philippine Disaster Risk Reduction &
Management Act of 2010/ Climate Change Act of 2009 and projects that are under
Transparency and Accountability.
3. For more than seven years of implementation, starting from its pilot stage in 2010
up to the Calendar Year 2017, the DILG through the Bureau of Local Government
Development (BLGD) monitors the over-all project implementation of more than
two thousand PCF projects nationwide. A total of 2,861 PCF projects were
registered in the PCF Portal (http://pcf.dilg.gov.ph) as of 30 September 2017. Out of
the 2,861 PCF projects, there are 2,629 completed projects, 131 projects that are still
on-going and 101 projects are still in the complying stage with the documentary
requirements of PCF. (See Table 3)
4. LGU Projects are under five categories or pillars as follows: 905 Millennium
Development Goal (MDG) projects, 1,476 Local Economic Development (LED)
projects, 140 Ecological Solid Waste Management (ESWM) projects, 338 Disaster
Risk Reduction and Management (DRRM)/ Climate Change Adaptation (CCA)
projects and 2 projects under Transparency and Accountability. (See Table 5 &
Figure 2)
5. From FYs 2010 to 2016, a total amount of Php 4.9304 Billion has been released to
qualified LGUs for this program. This year, FY 2017 General Appropriations Act
(GAA) has allocated One Billion Three Million Seven Hundred Thousand Pesos
(P1,003,700,000.00) for the Performance Challenge Fund which shall cover the
financial subsidy to qualified LGUs under the Local Governance Performance
Management Program for the implementation of projects aligned to the Philippine
Development Plan 2017-2022, Chapter V: Subsector Outcome 3: Administrative
2 | P a g e
governance enhanced. The PDP identifies the importance of empowering LGUs to improve their ability to deliver public service and promoting accountability.
LEGAL BASIS OF REPORTING AND SCOPE
6. As per Republic Act No. 10924, FY 2017 General appropriations Act (GAA),
specifically, Special Provision(s) No. 1 re Performance Challenge Fund thereof,
requires the DILG to submit to the Department of Budget and Management (DBM),
Speaker of the House of Representatives, the President of the Senate of the
Philippines, the House Committee on Appropriations and the Senate Committee on
Finance, either in printed form or by way of electronic document, quarterly reports
on financial and physical accomplishments and to ensure that said reports are posted
on the DILG website.
7. Taking into consideration the information from the Database system for M&E, the
PCF website promotes transparency in the implementation of public projects,
encourages participation of the citizenry in monitoring and to institute mechanism
for on-line reporting towards a paper-less submission of reports for efficiency. The
report covered the over-all status of implementation of the Performance Challenge
Fund subsidized projects in all Regions of the country from January to September
2017.
I. PROVISION OF FINANCIAL SUBSIDY TO LGUs
A. 2017 PCF FOR SGLG PASSERS
The Seal of Good Local Governance (SGLG) symbolizes integrity and good
governance through continuing governance reform and sustained local
development. It is a progressive assessment system adopted by the Department to
give distinction to remarkable local government performance across
In light of national government thrusts, organizational commitments, and
emerging good governance frameworks, the Seal or SGLG further aligns its
parameters to help meet expectations and contribute in realizing target outcomes
relative to local governance. Most notably accounted for is the Philippine
Development Plan (PDP) to help bring about the current Administration’s vision of
inclusive growth, high trust society, and a globally-competitive knowledge
economy, following the principles of Malasakit, Pagbabago at Patuloy na Pag-unlad.
On the other hand, the Performance Challenge Fund pursues the DILG’s
banner campaign on transparency, accountability and good local governance,
advocating that transparency and accountability in local government operations
will lead to improved service delivery systems and ultimately improved living
3 | P a g e
conditions of the people in the community. The Department strengthens its
campaign to encourage continuous improvement in the performance of local
government units (LGUs) by raising the bar of excellence to qualify for the incentive
support for local development projects.
For this FY 2017, the General Appropriations Act (GAA) allocated an
amount of One Billion Three Million Seven Hundred Thousand Pesos
(P1,003,700,000.00) for the Performance-Based Challenge Fund. The said allocation
is intended specifically to those LGUs that will pass the Seal of Good Local
Governance (SGLG) criteria for CY 2017.
In view thereof, the CY 2017 SGLG awardees will be eligible to access the
2017 PCF incentives.
4 | P a g e
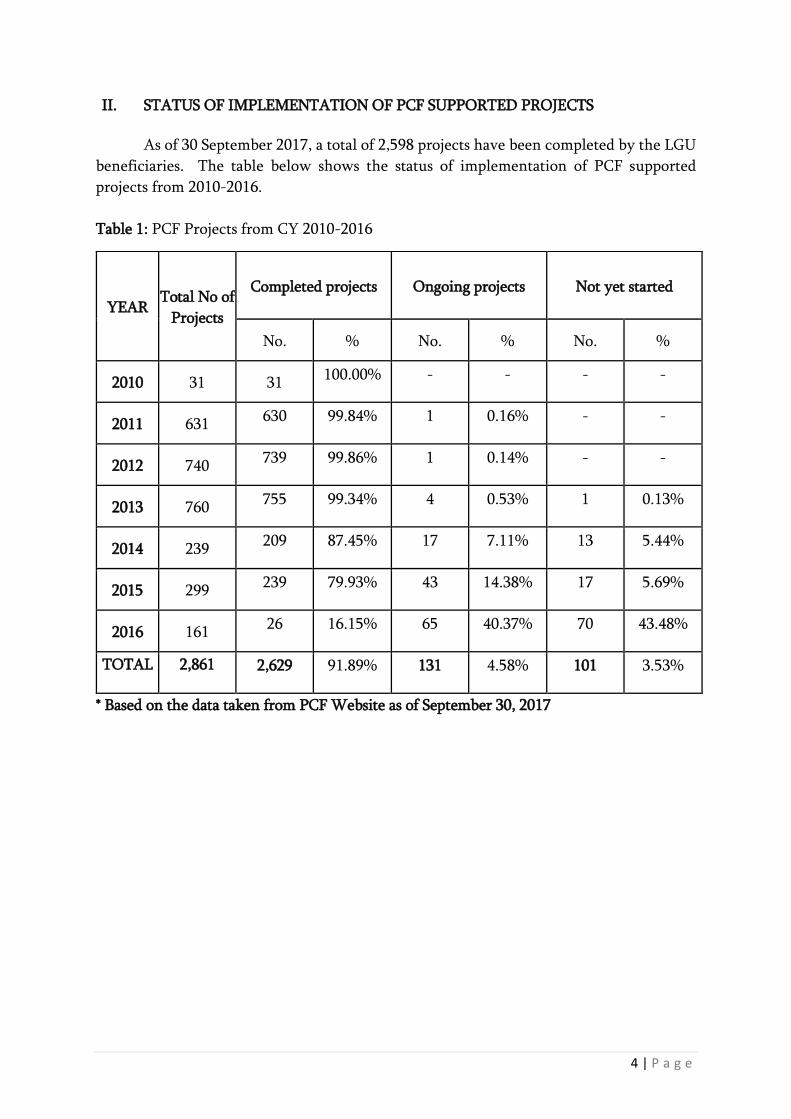
II. STATUS OF IMPLEMENTATION OF PCF SUPPORTED PROJECTS
As of 30 September 2017, a total of 2,598 projects have been completed by the LGU
beneficiaries. The table below shows the status of implementation of PCF supported
projects from 2010-2016.
Table 1: PCF Projects from CY 2010-2016
* Based on the data taken from PCF Website as of September 30, 2017
YEAR Total No of
Projects
Completed projects Ongoing projects Not yet started
No. % No. % No. %
2010 31 31 100.00% - - - -
2011 631 630 99.84% 1 0.16% - -
2012 740 739 99.86% 1 0.14% - -
2013 760 755 99.34% 4 0.53% 1 0.13%
2014 239 209 87.45% 17 7.11% 13 5.44%
2015 299 239 79.93% 43 14.38% 17 5.69%
2016 161 26 16.15% 65 40.37% 70 43.48%
TOTAL 2,861 2,629 91.89% 131 4.58% 101 3.53%
5 | P a g e
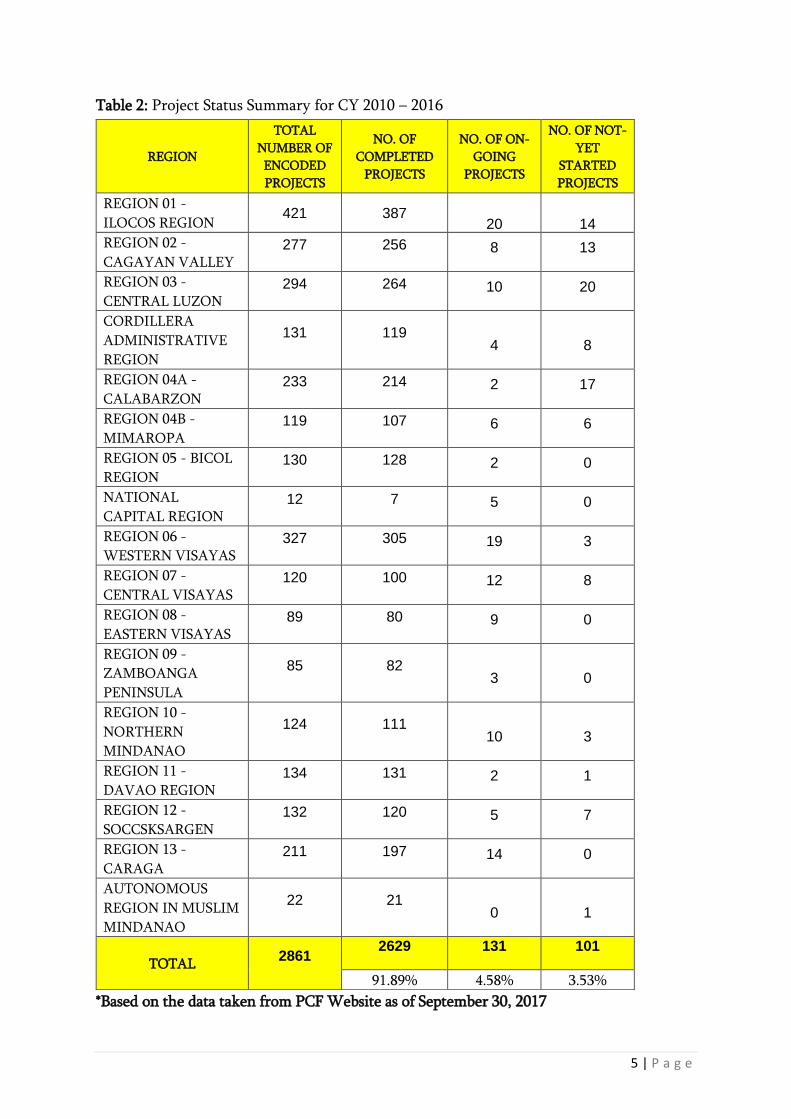
Table 2: Project Status Summary for CY 2010 – 2016
*Based on the data taken from PCF Website as of September 30, 2017
REGION
TOTAL
NUMBER OF
ENCODED
PROJECTS
NO. OF
COMPLETED
PROJECTS
NO. OF ON-
GOING
PROJECTS
NO. OF NOT-
YET
STARTED
PROJECTS
REGION 01 -
ILOCOS REGION 421 387
20 14 REGION 02 -
CAGAYAN VALLEY 277 256 8 13
REGION 03 -
CENTRAL LUZON 294 264 10 20
CORDILLERA
ADMINISTRATIVE
REGION
131 119 4 8
REGION 04A -
CALABARZON 233 214 2 17
REGION 04B -
MIMAROPA 119 107 6 6
REGION 05 - BICOL
REGION 130 128 2 0
NATIONAL
CAPITAL REGION 12 7 5 0
REGION 06 -
WESTERN VISAYAS 327 305 19 3
REGION 07 -
CENTRAL VISAYAS 120 100 12 8
REGION 08 -
EASTERN VISAYAS 89 80 9 0
REGION 09 -
ZAMBOANGA
PENINSULA
85 82 3 0
REGION 10 -
NORTHERN
MINDANAO
124 111 10 3
REGION 11 -
DAVAO REGION 134 131 2 1
REGION 12 -
SOCCSKSARGEN 132 120 5 7
REGION 13 -
CARAGA 211 197 14 0
AUTONOMOUS
REGION IN MUSLIM
MINDANAO
22 21 0 1
TOTAL 2861
2629 131 101
91.89% 4.58% 3.53%
6 | P a g e
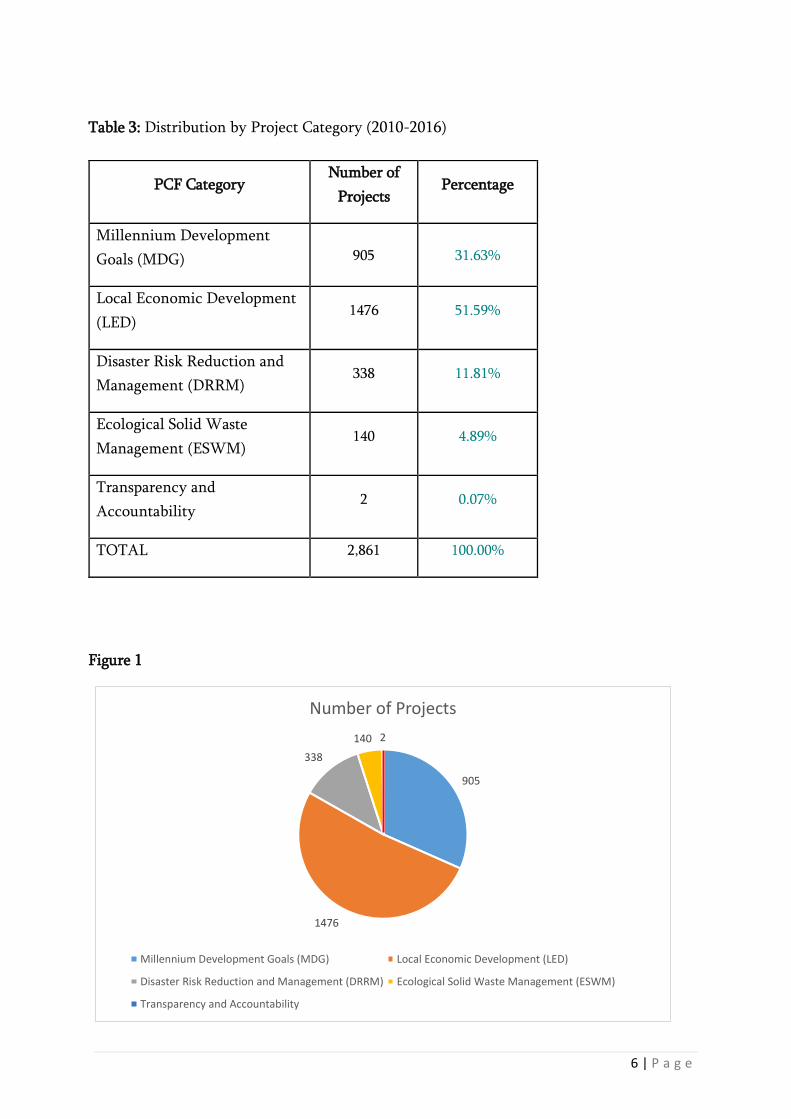
Table 3: Distribution by Project Category (2010-2016)
PCF Category Number of
Projects Percentage
Millennium Development
Goals (MDG) 905 31.63%
Local Economic Development
(LED) 1476 51.59%
Disaster Risk Reduction and
Management (DRRM) 338 11.81%
Ecological Solid Waste
Management (ESWM) 140 4.89%
Transparency and
Accountability 2 0.07%
TOTAL 2,861 100.00%
Figure 1
905
1476
338
140 2
Number of Projects
Millennium Development Goals (MDG) Local Economic Development (LED)
Disaster Risk Reduction and Management (DRRM) Ecological Solid Waste Management (ESWM)
Transparency and Accountability

7 | P a g e
Table 4: Distribution by Project Category for CY 2010
PCF Category Number of
Projects Percentage
Millennium Development Goals
(MDG)
13 41.94%
Local Economic Development
(LED)
14 45.16%
Disaster Risk Reduction and
Management (DRRM)
3 9.68%
Ecological Solid Waste
Management (ESWM)
1 3.23%
TOTAL 31 100%
Figure 2
13
14
31
Number of Projects
Millennium Development Goals (MDG) Local Economic Development (LED)
Disaster Risk Reduction and Management (DRRM) Ecological Solid Waste Management (ESWM)

8 | P a g e
Table 5: Project Status Summary for CY 2010
Region Total No. of
PCF Projects
No. of
Completed
Projects
Percentage of
Completed
Projects
REGION 01 - ILOCOS REGION 2 2 100%
REGION 02 - CAGAYAN VALLEY 2 2 100%
REGION 03 - CENTRAL LUZON 0 N/A N/A
CORDILLERA ADMINISTRATIVE
REGION
2 2 100%
REGION 04A - CALABARZON 2 2 100%
REGION 04B - MIMAROPA 0 N/A N/A
REGION 05 - BICOL REGION 3 3 100%
NATIONAL CAPITAL REGION 0 N/A N/A
REGION 06 - WESTERN VISAYAS 2 2 100%
REGION 07 - CENTRAL VISAYAS 4 4 100%
REGION 08 - EASTERN VISAYAS 2 2 100%
REGION 09 - ZAMBOANGA
PENINSULA
2 2 100%
REGION 10 - NORTHERN
MINDANAO
4 4 100%
REGION 11 - DAVAO REGION 1 1 100%
REGION 12 - SOCCSKSARGEN 0 N/A N/A
REGION 13 - CARAGA 4 4 100%
AUTONOMOUS REGION IN
MUSLIM MINDANAO
1 1 100%
Total 31 31 100%

9 | P a g e
Table 6: Distribution by Project Category for CY 2011
PCF Category Number of
Projects Percentage
Millennium Development Goals
(MDG) 225 35.66%
Local Economic Development
(LED) 304 48.18%
Disaster Risk Reduction and
Management (DRRM) 65 10.30%
Ecological Solid Waste
Management (ESWM) 37 5.86%
TOTAL 631
100.00%
* Based on the data taken from PCF Website as of September 30, 2017
Figure 3
225
304
65
37
Number of Projects
Millennium Development Goals (MDG) Local Economic Development (LED)
Disaster Risk Reduction and Management (DRRM) Ecological Solid Waste Management (ESWM)

10 | P a g e
Table 7: Project Status Summary for CY 2011
Region
Total No.
of PCF
Projects
No. of
Completed
Projects
% of
Completed
Projects
No. of
On-
Going
Projects
% of On-
Going
Projects
REGION 01 - ILOCOS REGION 108 108 100 - -
REGION 02 - CAGAYAN VALLEY 37 37 100 - -
REGION 03 - CENTRAL LUZON 43 43 100 - -
CORDILLERA ADMINISTRATIVE
REGION
34 34 100 - -
REGION 04A - CALABARZON 55 55 100 - -
REGION 04B - MIMAROPA 25 25 100 - -
REGION 05 - BICOL REGION 33 33 100 - -
NATIONAL CAPITAL REGION 0 0 0 - -
REGION 06 - WESTERN VISAYAS 104 104 100 - -
REGION 07 - CENTRAL VISAYAS 17 16 94.12 1 5.88
REGION 08 - EASTERN VISAYAS 10 10 100 - -
REGION 09 - ZAMBOANGA
PENINSULA
26 26 100 - -
REGION 10 - NORTHERN
MINDANAO
33 33 100 - -
REGION 11 - DAVAO REGION 16 16 100 - -
REGION 12 - SOCCSKSARGEN 9 9 100 - -
REGION 13 - CARAGA 73 73 100 - -
AUTONOMOUS REGION IN
MUSLIM MINDANAO
8 8 100 - -
Total 631 630 99.84 1 0.16
* Based on the data taken from PCF Website as of September 30, 2017

11 | P a g e
Table 8: Distribution by Project Category for CY 2012
Figure 4
358
321
42 19
Number of Projects
Millennium Development Goals (MDG) Local Economic Development (LED)
Disaster Risk Reduction and Management (DRRM) Ecological Solid Waste Management (ESWM)
PCF Category Number of
Projects Percentage
Millennium Development Goals
(MDG) 358 48.38%
Local Economic Development
(LED) 321 43.38%
Disaster Risk Reduction and
Management (DRRM) 42 5.68%
Ecological Solid Waste
Management (ESWM) 19 2.57%
TOTAL 740 100.00%
* Based on the data taken from PCF Website as of September 30, 2017

12 | P a g e
Table 9: Project Status Summary for the CY 2012
Region Total No. of
PCF Projects
No. of
Completed
Projects
% of
Completed
Projects
No. of On-
Going Projects
% of On-
Going
Projects
No. of Not-
Yet Started
Projects
% of On-
Going
Projects
REGION 01 - ILOCOS REGION 92 92 100.00%
- - - -
REGION 02 - CAGAYAN
VALLEY 112 111 99.11%
1 0.89 - -
REGION 03 - CENTRAL LUZON 103 103 100.00% - - - -
CORDILLERA
ADMINISTRATIVE REGION 23 23 100.00%
- - - -
REGION 04A - CALABARZON 60 60 100.00% - - - -
REGION 04B - MIMAROPA 35 35 100.00% - - - -
REGION 05 - BICOL REGION 15 15 100.00% - - - -
NATIONAL CAPITAL REGION 1 1 0.00% - - - -
REGION 06 - WESTERN
VISAYAS 71 71 100.00%
- - - -
REGION 07 - CENTRAL
VISAYAS 6 6 100.00%
- - - -
REGION 08 - EASTERN
VISAYAS 14 14 100.00%
- - - -
REGION 09 - ZAMBOANGA
PENINSULA 22 22 100.00%
- - - -
REGION 10 - NORTHERN
MINDANAO 21 21 100.00%
- - - -
REGION 11 - DAVAO REGION 63 63 100.00% - - - -
REGION 12 - SOCCSKSARGEN 53 53 100.00% - - - -
REGION 13 - CARAGA 44 44 100.00% - - - -
AUTONOMOUS REGION IN
MUSLIM MINDANAO 5 5 0.00%
- - - -
Total 740 739 99.86% 1 0.14% - -
* Based on the data taken from PCF Website as of September 30, 2017

13 | P a g e
Table 10: Distribution by Project Category for CY 2013
Figure 5
133
459
123
44 1
Number of Projects
Millennium Development Goals (MDG) Local Economic Development (LED)
Disaster Risk Reduction and Management (DRRM) Ecological Solid Waste Management (ESWM)
Transparency and Accountability
PCF Category Number of
Projects Percentage
Millennium Development Goals
(MDG) 133 17.50%
Local Economic Development
(LED) 459 60.39%
Disaster Risk Reduction and
Management (DRRM) 123 16.18%
Ecological Solid Waste
Management (ESWM) 44 5.79%
Transparency and
Accountability 1 0.13%
TOTAL 760 100.00%
* Based on the data taken from PCF Website as of September 30, 2017
14 | P a g e
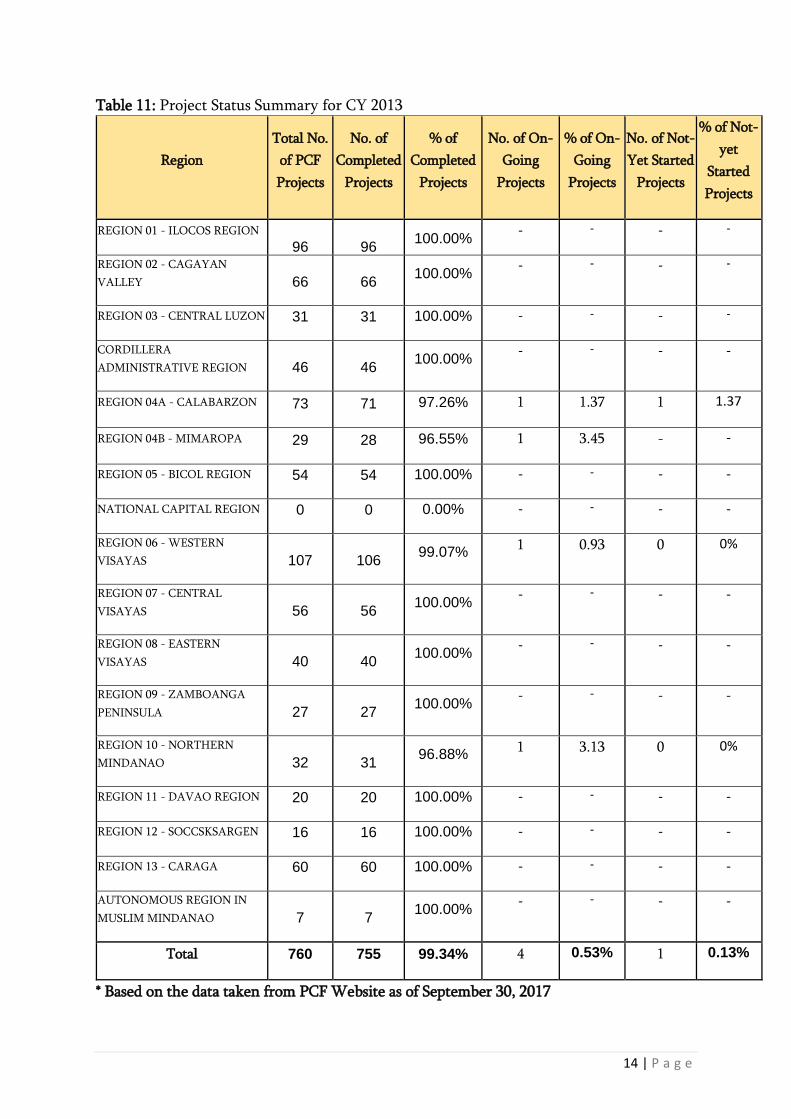
Table 11: Project Status Summary for CY 2013
Region
Total No.
of PCF
Projects
No. of
Completed
Projects
% of
Completed
Projects
No. of On-
Going
Projects
% of On-
Going
Projects
No. of Not-
Yet Started
Projects
% of Not-
yet
Started
Projects
REGION 01 - ILOCOS REGION
96 96 100.00%
- - - -
REGION 02 - CAGAYAN
VALLEY 66 66 100.00%
- - - -
REGION 03 - CENTRAL LUZON 31 31 100.00% - - - -
CORDILLERA
ADMINISTRATIVE REGION 46 46 100.00%
- - - -
REGION 04A - CALABARZON 73 71 97.26% 1 1.37 1 1.37
REGION 04B - MIMAROPA 29 28 96.55% 1 3.45 - -
REGION 05 - BICOL REGION 54 54 100.00% - - - -
NATIONAL CAPITAL REGION 0 0 0.00% - - - -
REGION 06 - WESTERN
VISAYAS 107 106 99.07%
1 0.93 0 0%
REGION 07 - CENTRAL
VISAYAS 56 56 100.00%
- - - -
REGION 08 - EASTERN
VISAYAS 40 40 100.00%
- - - -
REGION 09 - ZAMBOANGA
PENINSULA 27 27 100.00%
- - - -
REGION 10 - NORTHERN
MINDANAO 32 31 96.88%
1 3.13 0 0%
REGION 11 - DAVAO REGION 20 20 100.00% - - - -
REGION 12 - SOCCSKSARGEN 16 16 100.00% - - - -
REGION 13 - CARAGA 60 60 100.00% - - - -
AUTONOMOUS REGION IN
MUSLIM MINDANAO 7 7 100.00%
- - - -
Total 760 755 99.34% 4 0.53% 1 0.13%
* Based on the data taken from PCF Website as of September 30, 2017
15 | P a g e
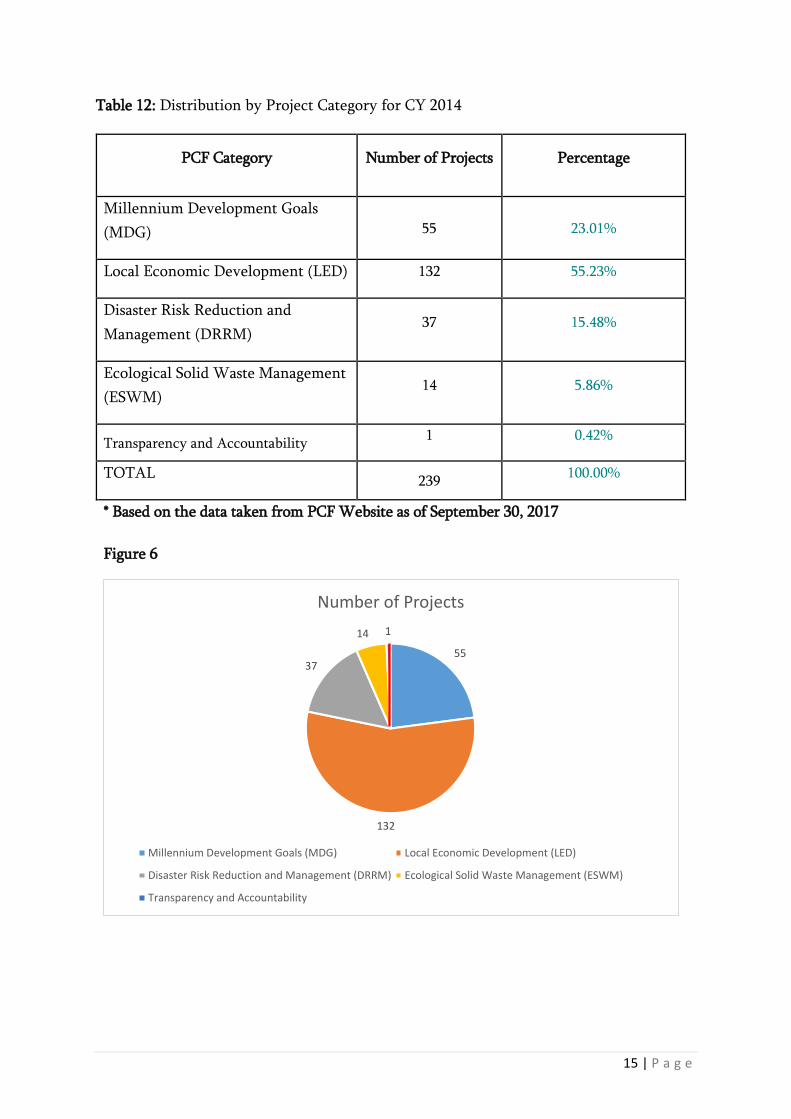
Table 12: Distribution by Project Category for CY 2014
PCF Category Number of Projects Percentage
Millennium Development Goals
(MDG) 55 23.01%
Local Economic Development (LED) 132 55.23%
Disaster Risk Reduction and
Management (DRRM) 37 15.48%
Ecological Solid Waste Management
(ESWM) 14 5.86%
Transparency and Accountability 1 0.42%
TOTAL 239
100.00%
* Based on the data taken from PCF Website as of September 30, 2017
Figure 6
55
132
37
14 1
Number of Projects
Millennium Development Goals (MDG) Local Economic Development (LED)
Disaster Risk Reduction and Management (DRRM) Ecological Solid Waste Management (ESWM)
Transparency and Accountability

16 | P a g e
Table 13: Project Status Summary for CY 2014
Region
Total No.
of PCF
Projects
No. of
Completed
Projects
% of
Completed
Projects
No. of On-
Going
Projects
% of On-
Going
Projects
No. of Not-
Yet Started
Projects
% of Not-
yet Started
Projects
REGION 01 - ILOCOS REGION
30 30 100.00% 0 0.00% 0 0.00%
REGION 02 - CAGAYAN
VALLEY 25 23 92.00%
1 4.00%
1 4.00%
REGION 03 - CENTRAL LUZON 18 18 100.00% 0 0.00% 0 0.00%
CORDILLERA
ADMINISTRATIVE REGION 7 6 85.71%
1 14.29%
0 0.00%
REGION 04A - CALABARZON 28 18 0.00% 1 0.00% 9 0.00%
REGION 04B - MIMAROPA 14 10 71.43% 3 21.43% 1 7.14%
REGION 05 - BICOL REGION 8 8 100.00% 0 0.00% 0 0.00%
NATIONAL CAPITAL REGION 3 3 100.00% 0 0.00% 0 0.00%
REGION 06 - WESTERN
VISAYAS 16 11 0.00%
5 0.00%
0 0.00%
REGION 07 - CENTRAL
VISAYAS 8 7 0.00%
1 0.00%
0 0.00%
REGION 08 - EASTERN
VISAYAS 0 0 0.00%
0 0.00%
0 0.00%
REGION 09 - ZAMBOANGA
PENINSULA 4 2 0.00%
2 0.00%
0 0.00%
REGION 10 - NORTHERN
MINDANAO 11 8 72.73%
2 18.18%
1 9.09%
REGION 11 - DAVAO REGION 21 20 95.24% 1 4.76% 0 0.00%
REGION 12 - SOCCSKSARGEN 32 31 96.88% 0 0.00% 1 3.13%
REGION 13 - CARAGA 14 14 100.00% 0 0.00% 0 0.00%
AUTONOMOUS REGION IN
MUSLIM MINDANAO 0 0 0.00%
0 0.00%
0 0.00%
Total 239 209 84.27% 17 6.85% 13 5.24%
* Based on the data taken from PCF Website as of September 30, 2017

17 | P a g e
Table 14: Distribution by Project Category for CY 2015
PCF Category Number of
Projects Percentage
Millennium Development Goals 84 28.09%
Local Economic Development 164 54.85%
Disaster Risk Reduction and
Management (DRRM) 42 14.05%
Ecological Solid Waste
Management 9 3.01%
TOTAL 299 100.00%
* Based on the data taken from PCF Website as of September 30, 2017
Figure 7
84
164
42
9
Number of Projects
Millennium Development Goals Local Economic Development
Disaster Risk Management Ecological Solid Waste Management
18 | P a g e
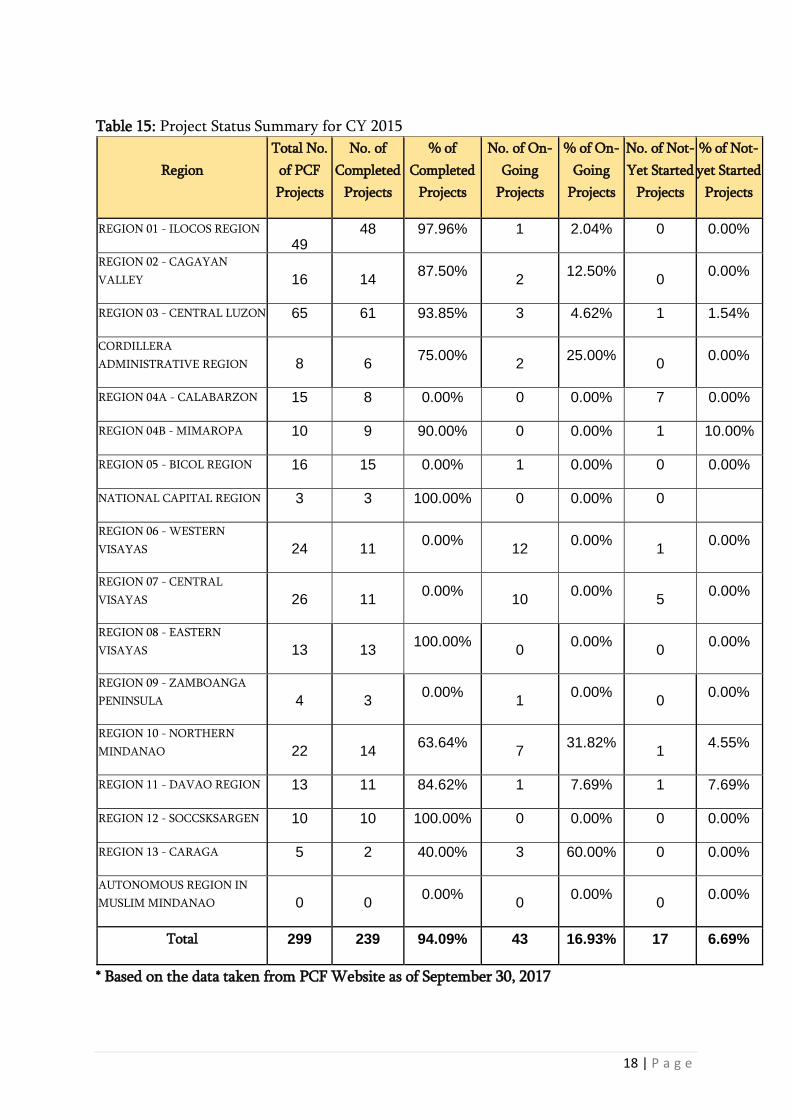
Table 15: Project Status Summary for CY 2015
Region
Total No.
of PCF
Projects
No. of
Completed
Projects
% of
Completed
Projects
No. of On-
Going
Projects
% of On-
Going
Projects
No. of Not-
Yet Started
Projects
% of Not-
yet Started
Projects
REGION 01 - ILOCOS REGION
49 48 97.96% 1 2.04% 0 0.00%
REGION 02 - CAGAYAN
VALLEY 16 14 87.50%
2 12.50%
0 0.00%
REGION 03 - CENTRAL LUZON 65 61 93.85% 3 4.62% 1 1.54%
CORDILLERA
ADMINISTRATIVE REGION 8 6 75.00%
2 25.00%
0 0.00%
REGION 04A - CALABARZON 15 8 0.00% 0 0.00% 7 0.00%
REGION 04B - MIMAROPA 10 9 90.00% 0 0.00% 1 10.00%
REGION 05 - BICOL REGION 16 15 0.00% 1 0.00% 0 0.00%
NATIONAL CAPITAL REGION 3 3 100.00% 0 0.00% 0
REGION 06 - WESTERN
VISAYAS 24 11 0.00%
12 0.00%
1 0.00%
REGION 07 - CENTRAL
VISAYAS 26 11 0.00%
10 0.00%
5 0.00%
REGION 08 - EASTERN
VISAYAS 13 13 100.00%
0 0.00%
0 0.00%
REGION 09 - ZAMBOANGA
PENINSULA 4 3 0.00%
1 0.00%
0 0.00%
REGION 10 - NORTHERN
MINDANAO 22 14 63.64%
7 31.82%
1 4.55%
REGION 11 - DAVAO REGION 13 11 84.62% 1 7.69% 1 7.69%
REGION 12 - SOCCSKSARGEN 10 10 100.00% 0 0.00% 0 0.00%
REGION 13 - CARAGA 5 2 40.00% 3 60.00% 0 0.00%
AUTONOMOUS REGION IN
MUSLIM MINDANAO 0 0 0.00%
0 0.00%
0 0.00%
Total 299 239 94.09% 43 16.93% 17 6.69%
* Based on the data taken from PCF Website as of September 30, 2017

19 | P a g e
Table 16: Distribution by Project Category for CY 2016
PCF Category Number of
Projects Percentage
Millennium Development Goals 37 22.98%
Local Economic Development 82 50.93%
Disaster Risk Reduction and
Management (DRRM) 26 16.15%
Ecological Solid Waste
Management 16 9.94%
TOTAL 161 100.00%
* Based on the data taken from PCF Website as of September 30, 2017
Figure 7
37
82
26
16
Number of Projects
Millennium Development Goals Local Economic Development
Disaster Risk Management Ecological Solid Waste Management
20 | P a g e
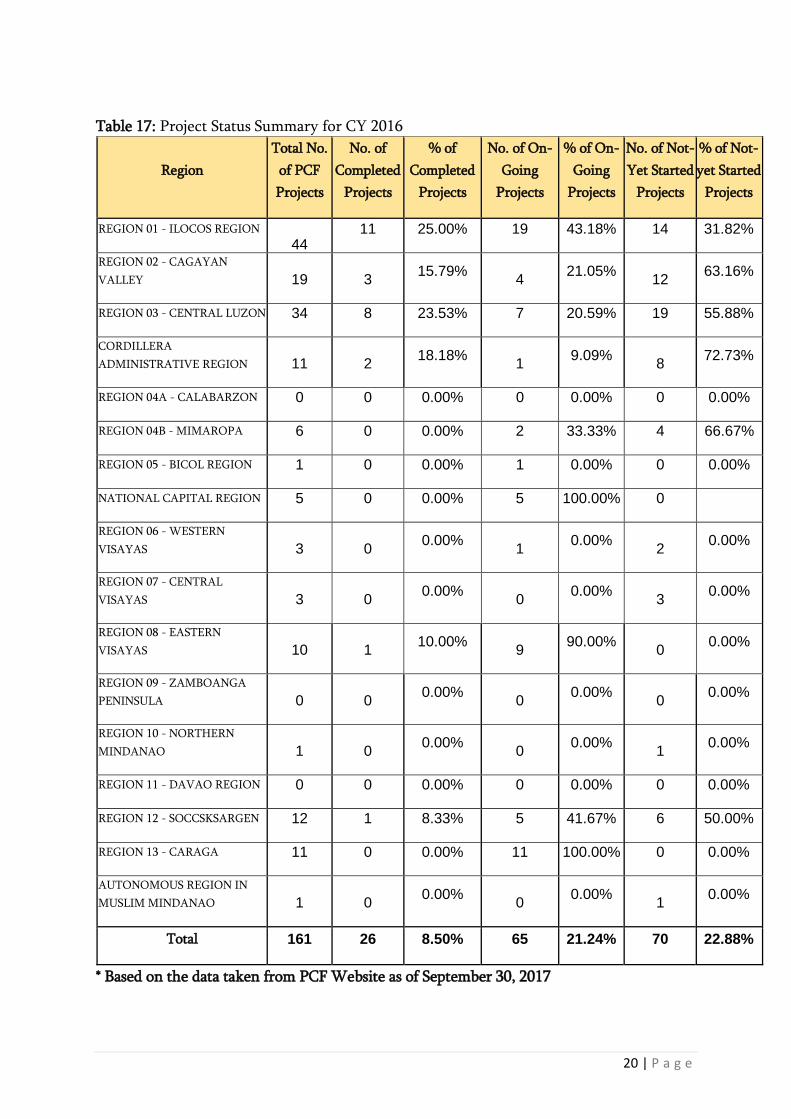
Table 17: Project Status Summary for CY 2016
Region
Total No.
of PCF
Projects
No. of
Completed
Projects
% of
Completed
Projects
No. of On-
Going
Projects
% of On-
Going
Projects
No. of Not-
Yet Started
Projects
% of Not-
yet Started
Projects
REGION 01 - ILOCOS REGION
44 11 25.00% 19 43.18% 14 31.82%
REGION 02 - CAGAYAN
VALLEY 19 3 15.79%
4 21.05%
12 63.16%
REGION 03 - CENTRAL LUZON 34 8 23.53% 7 20.59% 19 55.88%
CORDILLERA
ADMINISTRATIVE REGION 11 2 18.18%
1 9.09%
8 72.73%
REGION 04A - CALABARZON 0 0 0.00% 0 0.00% 0 0.00%
REGION 04B - MIMAROPA 6 0 0.00% 2 33.33% 4 66.67%
REGION 05 - BICOL REGION 1 0 0.00% 1 0.00% 0 0.00%
NATIONAL CAPITAL REGION 5 0 0.00% 5 100.00% 0
REGION 06 - WESTERN
VISAYAS 3 0 0.00%
1 0.00%
2 0.00%
REGION 07 - CENTRAL
VISAYAS 3 0 0.00%
0 0.00%
3 0.00%
REGION 08 - EASTERN
VISAYAS 10 1 10.00%
9 90.00%
0 0.00%
REGION 09 - ZAMBOANGA
PENINSULA 0 0 0.00%
0 0.00%
0 0.00%
REGION 10 - NORTHERN
MINDANAO 1 0 0.00%
0 0.00%
1 0.00%
REGION 11 - DAVAO REGION 0 0 0.00% 0 0.00% 0 0.00%
REGION 12 - SOCCSKSARGEN 12 1 8.33% 5 41.67% 6 50.00%
REGION 13 - CARAGA 11 0 0.00% 11 100.00% 0 0.00%
AUTONOMOUS REGION IN
MUSLIM MINDANAO 1 0 0.00%
0 0.00%
1 0.00%
Total 161 26 8.50% 65 21.24% 70 22.88%
* Based on the data taken from PCF Website as of September 30, 2017