re-assessing normative standards: a time & motion study (2015) - executive summary
DESCRIPTION
ÂTRANSCRIPT

Cover\
A BBMP AND KUIDFC REPORT
APRIL 2015
40km
20km
1 km 10 km
Rural
Urban
BENGALURU’S MSW COLLECTION AND TRANSPORTATION SYSTEM
EXECUTIVE SUMMARY
This document is for online viewing & circulation
RE-ASSESSING NORMATIVE STANDARDS: A TIME & MOTION STUDY
PARTNERS:

Cover
©2015 Karnataka Urban Infrastructure Development & Finance Corporation (KUIDFC)Silver Jubilee Block, Second FloorUnity Building Annexe, Third CrossMission Road, Bengaluru - 560027Telephone: +91 080 2223 2021Facsimile : +91 080 2223 2157Email : [email protected]
This publication should be cited as: Reassessing Normative Standards: A Time and Motion Study. Bengaluru’s MSW Collection and Transportation System. Bengaluru: KUIDFC, 2015. Print. Executive Summary.
The study was commissioned by Karnataka Urban Infrastructure Development & Finance Corporation (KUIDFC) and Bruhat Bangalore Mahanagara Palike (BBMP) for the purpose of revising normative standards used in the estimation process of the New Tender for Municipal Solid Waste Collection and Transportation. It was executed by the Centre for Public Problem Solving (CPPS) in collaboration with the Infrastructure Development Corporation Karnataka (iDeCK).
Centre for Public Problem Solving (CPPS)Email : [email protected]
Infrastructure Development Corporation Karnataka (iDeCK)Email : [email protected]

Cover
This document is an abridged version of the Time and Motion Study and is a referral document for the tender. The study explores the issues in the current Solid Waste Management System, and proposes new normative standards for stream-wise collection and transportation of MSW in a decentralised manner. These norms have
been the basis for further estimation and planning.
BENGALURU’S MSW COLLECTION AND TRANSPORTATION SYSTEM
EXECUTIVE SUMMARY
RE-ASSESSING NORMATIVE STANDARDS: A TIME & MOTION STUDY
A BBMP AND KUIDFC REPORT
APRIL 2015
PARTNERS:
Foreword
iv
Re-assessing Normative Standards: A Time and Motion Study
A BBMP and KUIDFC study
FOREWORD
Bruhat Bengaluru Mahanagara Palike (BBMP) handles its obligatory Municipal Solid Waste (MSW) function largely by outsourcing the collection and transportation of garbage through a Tendering process. Over the years the Request For Proposal (RFP) has undergone many stages and evolved, and there is a requirement to update and refine the tender conditions and performance indicators to reflect the new SWM Directives of the Hon’ble High Court and the Principles and guidelines of the Solid Waste Management (SWM) Expert Committee adopted by BBMP. The translation of the new mandate required to be further studied for norms to be established for aspects that were being introduced like SEGREGATION AT SOURCE with a waste stream driven collection and transportation system focused on maximising DECENTRALISED PROCESSING of waste by stream and reducing to the minimum waste that reaches the landfills.
Karnataka Urban Infrastructure Development and Finance Corporation Limited (KUIDFC) commissioned Infrastructure Development Corporation Karnataka Limited (iDeCK) to work on the new RFP and Tender agreement requiring a detailed analysis of the present systems and processes to enable a deep understanding to allow for a new set of normative standards to be established, in order to set new tender guidelines.
For the purpose of the establishing a well-informed framework, the Expert Committee suggested a ‘Study Group’. The intent of a study group was to bring together a group of domain experts that have been working in the field of Solid Waste Management to work with the Municipality, tabling their experiences and studies conducted. The learning from these meetings was then collated, helping in the establishment of base principles that
the tender was to address.
Moderated by members of the Expert Committee, iDecK, KUIDFC and BBMP, the group sessions included Academicians from IIM-B, Urbanists and Planners from think-tanks like the Centre for Public Problem Solving (CPPS), subject matter specialists, members of civil society groups like the Solid Waste management Round Table, Public Affairs Centre (PAC) representatives, consultants with IIHS, domain expert members of the Expert Committee on SWM, set up by the GoK.
The highlight of the suggestions from the Study Group was the need for re-assessing the normative standards used for estimation and planning. Hence a study was commissioned for which iDeCK collaborated with CPPS to conceptualise and execute a TIME AND MOTION STUDY.
The study required a comprehensive understanding of the present systems and processes on ground for which an informal collaboration was done with practitioners and members of the SWM Expert Committee, along with field officers and members of the BBMP Health and Engineering Departments and citizens in the short-listed wards and areas. The resultant of this collaborative effort is a first in ESTABLISHING TYPOLOGIES and standards for primary collection, unloading and secondary transfer of wet, dry and special streams of waste to pre-defined destinations. It is important to note that some of these trials in special areas that have been studied would need a transition time to be provided, for the City to experiment with new practices and then move from the existing practice to the recommended new mandated system for Primary and Secondary Collection and Transportation.
The Time and Motion Study recommends NEW

Foreword
v
Re-assessing Normative Standards: A Time and Motion Study
A BBMP and KUIDFC study
NORMATIVE STANDARDS by type of waste stream and typology of generator; and recommends processes and associated vehicles while referencing it against the present Karnataka Normative Standards. The application of the NEERI report and MoUD’s Service Level Benchmarks (SLBs) through the Karnataka Normative Standards have been referred to including a wider international and national search for standards to define benchmarks that could be applied to the context in Bengaluru.
As there is insufficient documentation on Time and Motion aspects of MSW collection and transportation of segregated waste by stream in Indian Cities, the study has looked at generation by typology, and vehicular and process implications that respond to the varying waste characteristics. It therefore also recommends vehicular requirements for short and long distances thereby indicating destination wise stream transportation and a separate distinct focus for Secondary transportation of waste.
In this Report there are certain gaps - the Study has not been able to address all categories of waste generators like Slums and Markets and large corporate campuses to define normative standards.
Nor has it been able to capture all categories of waste by stream.
Since the Tender addresses generation of waste from Households, small commercial establishments and MDUs and some special generators like slums and markets, this is a study to focus largely on Household generated streams namely organic waste from Kitchens and recyclable or dry waste. It also addresses the domestic sanitary waste collection and transfer to a central point (Lorry Point). Since the Tender covers Street sweeping, the inert collection and transportation has been studied and standards arrived at by definition of the road types.
We do believe that these gaps need to be studied further. The Tender has provided for these norms to be studied for three months. During this time, data will be captured and studied, and necessary modifications made, if required. This time will also provide an opportunity to capture all other waste streams and generator data to begin a data repository of sorts for the BBMP.
We are looking forward to laying the foundation for a robust and transformational system that we believe will help us deliver a clean Bengaluru!
Commissioner, BBMP Managing Director, KUIDFC
Special Commissioner, BBMP
Member, BBMP Expert Committee on SWM
Co-founder, CPPS
CEO, iDeCK Ltd.
Executive Summary
1
Re-assessing Normative Standards: A Time and Motion Study
A BBMP and KUIDFC study
1. EXECUTIVE SUMMARY1.1. BENGALURU’S SOLID WASTE MANAGEMENT STRATEGY
With a population of over 10 million, Bengaluru stands as the third most populous city in India. It has seen rapid urbanisation with its population doubling in a span of just 20 years, from 4.13 million in 1991 to a whopping 8.42 million in 2011 (Census, 2011). Though the city grew to embrace a successful and thriving IT economy, it led to an urban chaos, pushing the waste system close to its breaking point.
The closure of the Mavallipura landfill by the Karnataka State Pollution Control Board (KSPCB) in 2012, following the protest by the villagers of Mandur, the directives issued by the Hon’ble High
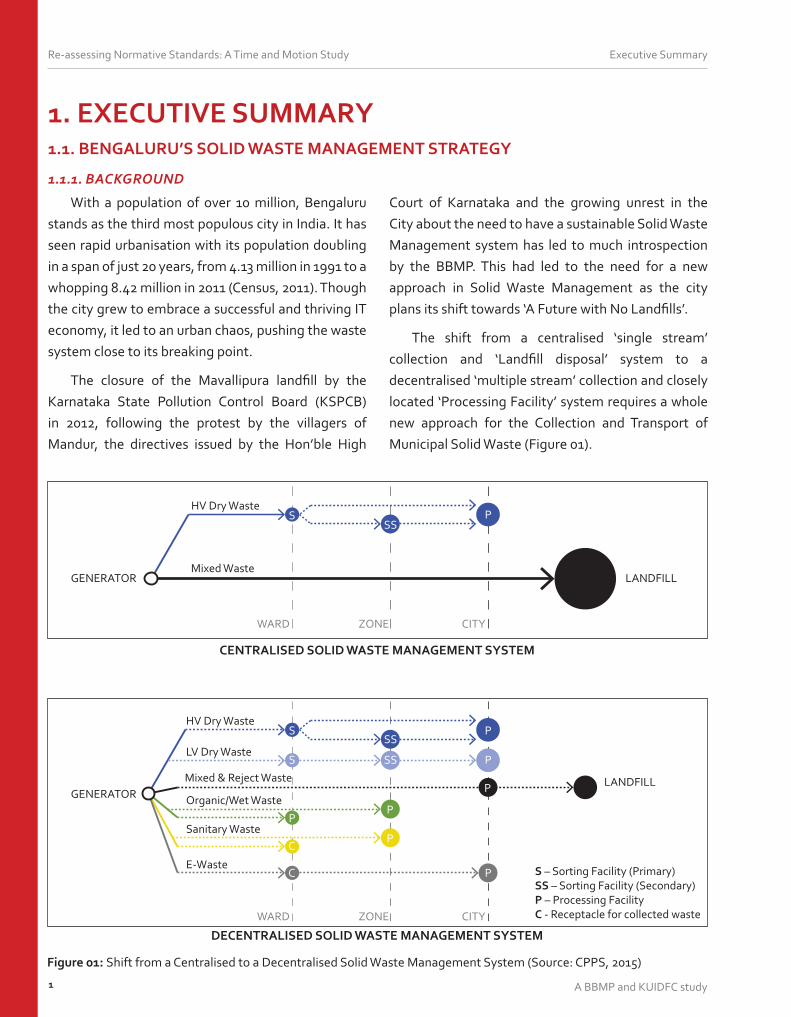
Figure 01: Shift from a Centralised to a Decentralised Solid Waste Management System (Source: CPPS, 2015)
DECENTRALISED SOLID WASTE MANAGEMENT SYSTEM
CENTRALISED SOLID WASTE MANAGEMENT SYSTEM
SSS
P
GENERATOR
HV Dry Waste
Mixed WasteLANDFILL
WARD ZONE CITY
S – Sorting Facility (Primary)SS – Sorting Facility (Secondary)P – Processing FacilityC - Receptacle for collected waste
S
S
SS
SS
P
P
P
PP
C
C
P
GENERATOR
HV Dry Waste
LV Dry Waste
Mixed & Reject Waste
Organic/Wet Waste
Sanitary Waste
E-Waste
LANDFILL
WARD ZONE CITY
Court of Karnataka and the growing unrest in the City about the need to have a sustainable Solid Waste Management system has led to much introspection by the BBMP. This had led to the need for a new approach in Solid Waste Management as the city plans its shift towards ‘A Future with No Landfills’.
The shift from a centralised ‘single stream’ collection and ‘Landfill disposal’ system to a decentralised ‘multiple stream’ collection and closely located ‘Processing Facility’ system requires a whole new approach for the Collection and Transport of Municipal Solid Waste (Figure 01).
P
1.1.1. BACKGROUND

Executive Summary
2
Re-assessing Normative Standards: A Time and Motion Study
A BBMP and KUIDFC study
1.1.2. THE CITY’S STRATEGY - 2015
In a push towards the new system, Bengaluru’s Kasa Muktha Program was launched in 2013 by the Hon’ble Chief Minister of Karnataka, Sri. Siddaramaiah. Bengaluru has since then developed 6 strategies to enable its shift from ‘Dumping’ to ‘Processing’:
1. Investing in stream-wise processing of waste: These include aspects like the enforcement on segregation at source, investing in infrastructure and technology for processing waste, and creating and efficient collection and transportation system
2. A data driven approach for estimation & planning: This includes the understanding of waste generators, data collection through field validation, re-assessing of normative standards and its application for a close estimate
3. Enabling market dynamics by creating new economic opportunities: Opening up the private market and empanelment of vendors for the servicing of Bulk Generators, application of the polluter-pay principle to generators and enabling Public-private partnership for setting up of processing facilities
4. Awareness creation & enabling behavioural change: The city has already hosted large scale events and several small events for consensus building, awareness creation, training and skilling. In addition to this it continues to conduct clean-up drives, post adverts and flyers, manuals, etc.
5. Use of technology for data collection & monitoring: Using of technologies like GIS mapping, apps, tracking systems, biometrics etc. are being used to enable transparency, enhance efficiency, increase accountability and overall help monitor the new SWM system
6. Capacity building & enabling legislative reforms: This includes building institutional capacity within the government through the setting up of a SWM cell, capacity building through inclusion of the informal sector workers, exercising Extended Producer Responsibility (EPR) and enabling legislative reforms by appropriate amendments and notifications
Executive Summary
3
Re-assessing Normative Standards: A Time and Motion Study
A BBMP and KUIDFC study
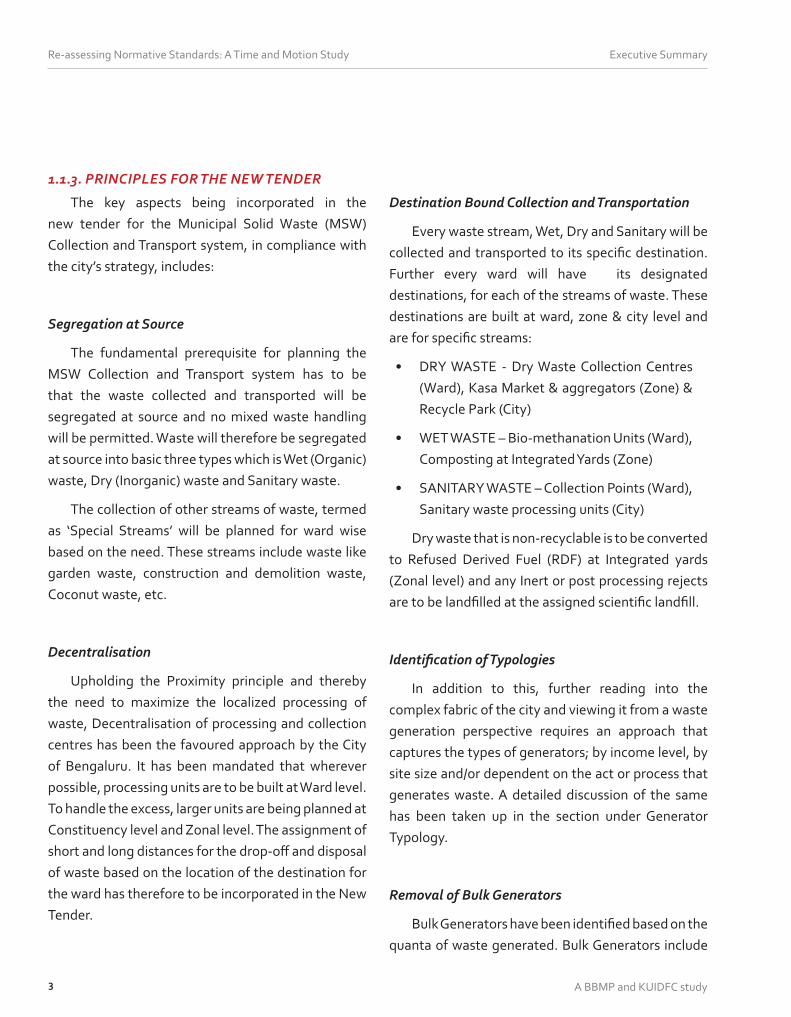
The key aspects being incorporated in the new tender for the Municipal Solid Waste (MSW) Collection and Transport system, in compliance with the city’s strategy, includes:
Segregation at Source
The fundamental prerequisite for planning the MSW Collection and Transport system has to be that the waste collected and transported will be segregated at source and no mixed waste handling will be permitted. Waste will therefore be segregated at source into basic three types which is Wet (Organic) waste, Dry (Inorganic) waste and Sanitary waste.
The collection of other streams of waste, termed as ‘Special Streams’ will be planned for ward wise based on the need. These streams include waste like garden waste, construction and demolition waste, Coconut waste, etc.
Decentralisation
Upholding the Proximity principle and thereby the need to maximize the localized processing of waste, Decentralisation of processing and collection centres has been the favoured approach by the City of Bengaluru. It has been mandated that wherever possible, processing units are to be built at Ward level. To handle the excess, larger units are being planned at Constituency level and Zonal level. The assignment of short and long distances for the drop-off and disposal of waste based on the location of the destination for the ward has therefore to be incorporated in the New Tender.
1.1.3. PRINCIPLES FOR THE NEW TENDER
Destination Bound Collection and Transportation
Every waste stream, Wet, Dry and Sanitary will be collected and transported to its specific destination. Further every ward will have its designated destinations, for each of the streams of waste. These destinations are built at ward, zone & city level and are for specific streams:
• DRY WASTE - Dry Waste Collection Centres (Ward), Kasa Market & aggregators (Zone) & Recycle Park (City)
• WET WASTE – Bio-methanation Units (Ward), Composting at Integrated Yards (Zone)
• SANITARY WASTE – Collection Points (Ward), Sanitary waste processing units (City)
Dry waste that is non-recyclable is to be converted to Refused Derived Fuel (RDF) at Integrated yards (Zonal level) and any Inert or post processing rejects are to be landfilled at the assigned scientific landfill.
Identification of Typologies
In addition to this, further reading into the complex fabric of the city and viewing it from a waste generation perspective requires an approach that captures the types of generators; by income level, by site size and/or dependent on the act or process that generates waste. A detailed discussion of the same has been taken up in the section under Generator Typology.
Removal of Bulk Generators
Bulk Generators have been identified based on the quanta of waste generated. Bulk Generators include

Executive Summary
4
Re-assessing Normative Standards: A Time and Motion Study
A BBMP and KUIDFC study
domestic generators - apartment complexes with more than 50 units and Commercial bulk generators viz hotel/restaurant, clubs, factory, choultry, mall, shopping complex, marriage halls, convention hall, place of worship, institution, office establishment,
Figure 02: Kasa Muktha Program’s key goals (Source: BBMP, 2013)
railway stations, bus stand or any other commercial or public entity which accumulates MSW of a quantity not less than 10 kg per day. These generators are required to set up in-situ systems to manage their own waste.
Executive Summary
5
Re-assessing Normative Standards: A Time and Motion Study
A BBMP and KUIDFC study
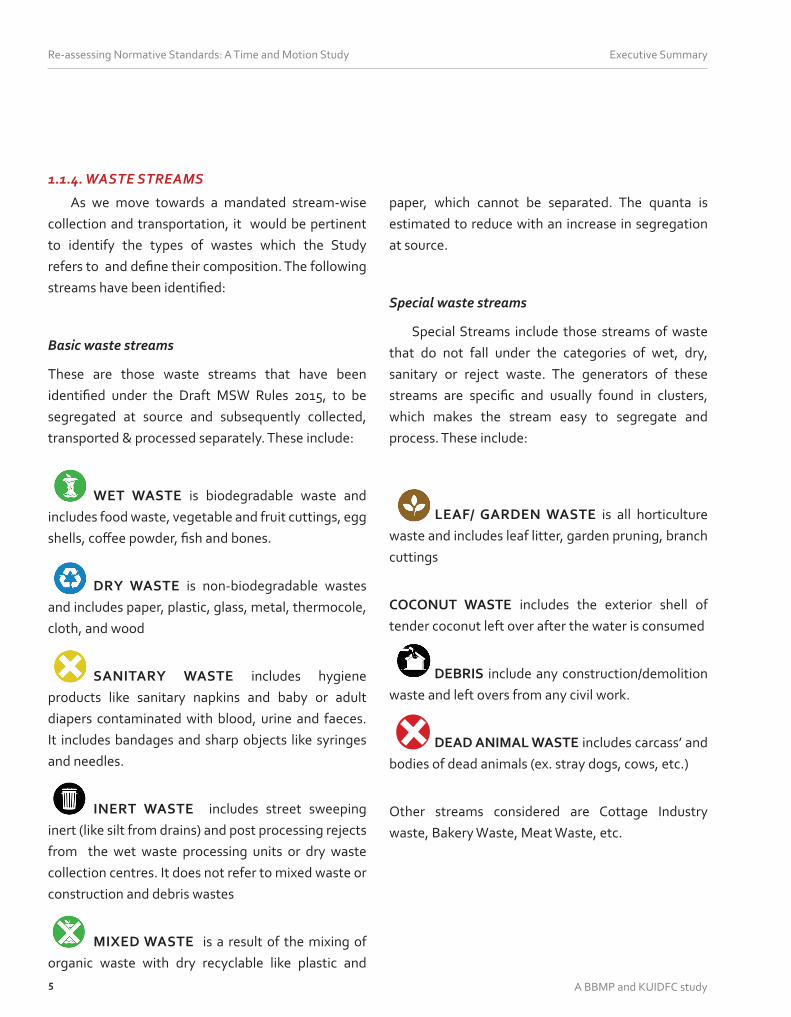
As we move towards a mandated stream-wise collection and transportation, it would be pertinent to identify the types of wastes which the Study refers to and define their composition. The following streams have been identified:
Basic waste streams
These are those waste streams that have been identified under the Draft MSW Rules 2015, to be segregated at source and subsequently collected, transported & processed separately. These include:
WET WASTE is biodegradable waste and includes food waste, vegetable and fruit cuttings, egg shells, coffee powder, fish and bones.
DRY WASTE is non-biodegradable wastes and includes paper, plastic, glass, metal, thermocole, cloth, and wood
SANITARY WASTE includes hygiene products like sanitary napkins and baby or adult diapers contaminated with blood, urine and faeces. It includes bandages and sharp objects like syringes and needles.
INERT WASTE includes street sweeping inert (like silt from drains) and post processing rejects from the wet waste processing units or dry waste collection centres. It does not refer to mixed waste or construction and debris wastes
MIXED WASTE is a result of the mixing of organic waste with dry recyclable like plastic and
paper, which cannot be separated. The quanta is estimated to reduce with an increase in segregation at source.
Special waste streams
Special Streams include those streams of waste that do not fall under the categories of wet, dry, sanitary or reject waste. The generators of these streams are specific and usually found in clusters, which makes the stream easy to segregate and process. These include:
LEAF/ GARDEN WASTE is all horticulture waste and includes leaf litter, garden pruning, branch cuttings
COCONUT WASTE includes the exterior shell of tender coconut left over after the water is consumed
DEBRIS include any construction/demolition waste and left overs from any civil work.
DEAD ANIMAL WASTE includes carcass’ and bodies of dead animals (ex. stray dogs, cows, etc.)
Other streams considered are Cottage Industry waste, Bakery Waste, Meat Waste, etc.
1.1.4. WASTE STREAMS

Executive Summary
6
Re-assessing Normative Standards: A Time and Motion Study
A BBMP and KUIDFC study
1.2. THE ESTIMATION AND PLANNING PROCESS
Any planning and estimation exercise therefore, needs to carefully consider the composition and make-up of the City. This is especially relevant for an activity like Municipal Solid Waste Management. The following aspects that influence such a system are:
1. REACH AND SCALE: The enormity of the nature of service of Solid Waste Management (SWM), an obligatory function of the Urban Local Body (ULB), needs to be recognized, since MSW can be seen as primarily coming from households, but also includes wastes from offices, hotels, shopping complexes/shops, schools, institutions, and from municipal services such as street cleaning and maintenance of recreational areas. For an effective SWM, the primary goal of the Municipality is therefore to plan and operationalise the reach of its services such that the Collection and transportation of MSW has to take place from each and every Household, Commercial, Institutional and Industrial unit in the City.
2. DESTINATION BOUND WASTE STREAM COLLECTION: Further, this waste has to then reach its destination, given that the City is now committed to Collection and Transportation of segregated waste.
3. PERFORMANCE: Also, taking into account the various progressive policies that the City has adopted, there is a real need to review and modernize the Collection and Transportation, keeping in mind not only the delivery of the pure SWM requirements, but to offer timely and efficient services and to ensure cleanliness in the process. This cannot be done
without keeping at the centre of the planning the ‘human factor’, which is the realistic work and output possible by the workers .
There are a number of challenges which need to be managed during the implementation of operations strategy with respect to solid waste management:
• The scale of the operations required, considering all of the above, therefore, is a mammoth, considering that the City of Bengaluru has a population of 10.8 million people with very vibrant commercial activity levels.
• The costs of carrying out the Collection and Transportation of waste, its processing and disposal
• The limitations of administrative and managerial competence of the Municipality machinery
• The varied composition and make up of every ward, its demographics, the land use and its geographical attributes. These vary from Ward to ward and constitute a spectrum of generators.
1.2.1. KEY ASPECTS

Executive Summary
7
Re-assessing Normative Standards: A Time and Motion Study
A BBMP and KUIDFC study
Figure 03: Structure of the MSW Collection and Transport Tender Process
TIME & MOTIONSTUDY
WARD MAPPING
BASELINE DATA -
GENERATORS
WASTE QUANTIFI
CATION
NORMATIVE STANDARDS:• Coverage• Generation• Hand over method• Process
TYPOLOGY SPATIAL DIVISION
(in the form of percentages)
SOURCES:Census, RAY, etc.
WARD TEMPLATE:Capturing field data through
engagement with Ward officials
CONTRACT
ESTIMATE
CONTROLROOM
BBMP SAHAYAA
PERFORMANCE MONITORING
SUCHIMITRA
KEY BASE DATA
1.2.2. STRUCTURE AND APPROACH
In order for a comprehensive tender that aligns with the city’s new strategy, some key requirements that were required to be addressed were:
• Quantification of waste at the present time
• The rate of growth during the tenure of the contract
• Norms to cater to the diversities of the ward demographics
• Manpower outputs and efficiencies
• Processes which will ensure stream-wise
collection of waste and uninterrupted service flow, for ensuring a clean city
• Mapping the collection and transport of waste to set a basis for monitoring the system
• Building in phases or milestones to provide flexibility during transition stages as the city transforms itself
The new tender agreement created an opportunity to analyse in detail the present systems and processes to enable a deeper understanding

Executive Summary
8
Re-assessing Normative Standards: A Time and Motion Study
A BBMP and KUIDFC study
1.2.3. DATA COLLECTION & RATIFICATION
Data has been collected from both primary and secondary sources.
Secondary data collection:
• Census 2011 - Data for Population & Households
• DMA (Slum Households) - Data from Slum Free City Plan of Action Study by DMA
• GIS Data (Typologies within Wards) - Predominantly High Income, Low Income or Mixed Category of Households based on plot sizes
• Property Tax Data - For number of Multi-dwelling Units (No. of floors)
• Bulk Generators - Data from BBMP, BESCOM Data, etc.
Primary data collection and verification from field:
This was done through the circulation of a two part ward template for capturing generator (Figure 04) and infrastructure (Figure 05) data currently existing on ground.
Other documents/studies referred to:
• IIM–B Study for Waste Generation & Characterization
• Master Plan for Bengaluru SWM in 2008
• Review of Other Cities – New Delhi, Ghaziabad, Rajkot, etc.
• Time & Motion Study for the new adapted normative standards
of estimating the SWM requirements of the city. This required a comprehensive understanding of the present systems and processes on ground from which the need of a Time and Motion Study was further evident.
The findings of this study would input into the key base data that is required to estimate and cost the collection and transportation process of MSW for every ward in the city (Figure 03).

Executive Summary
9
Re-assessing Normative Standards: A Time and Motion Study
A BBMP and KUIDFC study
Daily
Alternate
Day
Twice a
Week
Once a Week
High Income ‐
Mixed
‐
Low In
come ‐
Season
Addl. M
SW
(TPD
)No. of
Days
SIGNAT
URE
:
DESIGNAT
ION:
DAT
E:
Junior
Health Inspector
Senior
Health Inspector
Asst. Engineer
______
Ward
Asst. Exec En
gine
er_____________ Sub
Exec. Engineer
_________________
Daily Sweeping
Minor ‐
Road
width <=40'
Sweeping
every Day
Commercial & In
stitu
tiona
l(small, <10kgs)
Road
Typ
olog
ies
Major ‐
Road
width >=80'
Daily Sweeping
Interm
ediate ‐
Road
width <80
' & >40
'
Buria
l Groun
dsPlay Groun
ds
R E M A R K S
Inde
pend
ent H
H and
small A
ptmts. w
ith plot a
rea >=
240
0 sq.ft.
Small apartmen
ts & inde
pend
ent H
H with
plot a
rea >=
120
0 & <24
00 sq
.ft.
Special D
ays
Low Income HHs (inde
pend
ent &
Aptmts.) with
plot a
rea < 12
00 sq
.ft.
HHs in
Large Ap
ts
Gated
Co
mmun
itie
sPG
s
Gov
t.,
Education,
Private
Institu
tions
Large Hotels
Small H
otels
and Club
sMalls &
Large Shop
sCh
oultries
Large
markets
Religious
Institu
tions
High
Income HH
s
Street Sweeping
(in km
s)Bu
lk Gen
erators
Major
Road
sInterm
ediate
Road
s Minor Roa
dsTo
tal
Minor Roa
ds (b
y Frequency)
Low Income HH
sTo
tal
Mixed
HHs
HHs in Large Ap
artm
ents (>
50 units)
Indu
stria
l Units/G
odow
ns etc.
Regular H
Hs for D2D
Educational Institutions (small)
Total N
o. of H
Hs
Clinics (sm
all)
No. of Slum HHs
Retail Units & Offices (sm
all)
Hou
seho
ld Data
Small Com
mercial Estab
lishm
ents
Estim
ated
Pop
ulation (2015)
Shop
s & who
lesalers
BBMP WAR
D TEM
PLAT
E FO
R MSW
COLLECTION AND TRA
NSPORT
ATION
PART
A: D
ATA CO
LLECTION & RAT
IFICAT
ION
ZONE NAM
E:WAR
D NAM
E& W
ARD NO:
DAT
E
PAR
T A
: DA
TA C
OLL
ECT
ION
& R
AT
IFIC
AT
ION
Figu
re 0
4: W
ard
Tem
plat
e fo
r dat
a co
llect
ion
and
ratifi
catio
n

Executive Summary
10
Re-assessing Normative Standards: A Time and Motion Study
A BBMP and KUIDFC study
Organ
ic W
aste
Conv
ertor
Bio‐
Metha
natio
nPlan
t
Num
ber
Num
ber
Yes/No
SIGNAT
URE
:
DESIGNAT
ION:
DAT
E:
Junior
Health
Inspector
Senior
Health
Inspector
Asst. Engineer
______ Ward
Asst. Exec En
gine
er_____________ Sub Division
Exec. Engineer
_________________
OTH
ER SUPP
ORT
ING SER
VICES & FAC
ILITIES FO
R WORK
ERS
Are there an
y Pu
blic to
ilets with
in th
e ward?
Are there an
y Pu
blic bathing
facilities w
ithin th
e ward?
Are there an
y Ve
hicle Washing
Facilitie
s with
in th
e ward?
Locatio
n (if yes)
DECEN
TRAL
ISED
INFR
ASTR
UCT
URE
(WITHIN W
ARD)
Locatio
n of BLA
CK SPO
TS
Are there an
y illegal Dum
ping
Sp
ots in you
r Ward?
Y/N
How
man
y lorry po
ints do yo
u ha
ve?
ILLEGAL
DUMPING (B
LACK
SPO
TS)
LORR
Y PO
INTS
Locatio
n of LORR
Y PO
INTS
Curren
t Status
Address (Lat, lon
g)
OTH
ERS ‐ E
g.Co
conu
t Waste, G
arde
n Waste, etc.
DATE
ZONE NAM
E:
BBMP‐Neigb
orho
od parks
Num
bers
Area
of cen
tre (sq. ft.)
Capa
city of cen
tre (TPD
)
INFR
ASTR
UCT
URE
/
SPEC
IFICAT
IONS
WET
WAS
TE
DRY
WAS
TESA
NITAR
Y WAS
TELEAF
WAS
TE
Dry W
aste Collection Ce
ntre
PHC/BB
MP maternity hom
e
BBMP WAR
D TEM
PLAT
E FO
R MSW
COLLEC
TION AND TRA
NSPORT
ATION
PART
B: W
ARD IN
FRAS
TRUCT
URE
& SPE
CIAL
NEEDS
WAR
D NAM
E& W
ARD NO:
PD
W
T
PAR
T B
: IN
FRA
ST
RU
CT
UR
E &
ISS
UE
MA
PP
ING
Figu
re 0
5: W
ard
Tem
plat
e fo
r inf
rast
ruct
ure
and
issu
e m
appi
ng

Executive Summary
11
Re-assessing Normative Standards: A Time and Motion Study
A BBMP and KUIDFC study
1.3.2. UNDERSTANDING TYPOLOGY1.3.1. NEED FOR THE STUDY
The Time and Motion study is designed for the purpose of assessing , standardizing and improving the time taken for Primary / Secondary collection and transportation by waste stream and Street Sweeping activity. The need for the study has been established because of several gaps in the SWM system in the city. These are as follows:
• Issues with the existing Municipal Solid Waste Collection & Transportation System
• Shortcomings of the Karnataka Normative Standards
• Lack of adaptation & inadequacy of the Service Level Benchmarks
The Time study is a measurement of the time required to complete a normal cycle of collection and transportation, with a well-qualified and trained operator, working at a normal pace and doing a specific task.
The Motion study captures the nature of collection and lays down the best possible process standards for collecting segregated waste, whilst ensuring visual cleanliness. This is captured from the generator source to its transportation to the closest destination for processing, while ensuring appropriate receptacles are provided for interim transfer stage.
1.3. RE-ASSESSING NORMATIVE STANDARDS: TIME & MOTION STUDY
The time and motion study identified two main typologies - Waste Generator and Road Typologies, for door to door collection and street sweeping respectively.
Waste Generator Typologies
The WASTE GENERATOR may be defined as ‘any person, by site, whose act or process produces MSW waste , This definition contains three important terms - The first term, by site refers to where the waste is generated; The definition of person encompasses any entity involved with a process that generates waste; The third key component of the generator definition is the act or process by which the waste is generated’
Source :http://www.epa.gov
Adapting the findings from the Time and Motion study (2015), the tender has adopted the following generator typologies:
1. Residential Generators
• High Income Households: Area with a predominance of Independent Households (>75%) where plot sizes are greater than 2400 sq.ft.
R (HI)

Executive Summary
12
Re-assessing Normative Standards: A Time and Motion Study
A BBMP and KUIDFC study
• Mixed Households: Area with a mix of Independent Households (<75%) & MDUs (>30%) where plot sizes are between 1200 sq.ft. to 2400 sq.ft.
R (MI)
R (LI)
R (SL)
• Low Income Households: Area with a predominance of Low Income Households (>75%) where plot sizes are less than 1200 sq.ft.
• Slum households: A slum is a compact settlement of at least 20 Households with a collection of poorly built tenements, mostly of temporary nature, crowded together usually with inadequate sanitary and drinking water facilities in unhygienic conditions
Commercial Generators
• Category 1 (2 kgs/unit): Areas in wards with sparse commercial activity (>60%) where units generate 2 kgs of waste/day. These include small Shops, Wholesalers and small Clinics.
• Category 2 (6 kgs/unit): Areas where 60% of the commercial units are offices and/or retail units, Industrial godowns, Educational Institutes, independent hawkers and vendors generating 6 kgs of waste/day.
• Category 3 (10 kgs/unit): These include generators like small markets and temples, which generate around 10 kgs of waste/day.
Road Typologies
ROADS are defined as ‘any highway, street, lane, pathway, alley, stairway, passageway, footway, square place, grade separator, subway or bridge, whether a thoroughfare or note, over which the public have a right of passage or access, and includes any bunds, channels, ditches, storm water drains, culverts, sidewalks, traffic islands, road side trees and hedges, retaining walls, fences, barriers and railings within the street lines.’
Source: Mysore CDP (2031)
Adapting the findings from the Time and Motion study (2015), the tender has adopted the following road typologies:

Executive Summary
13
Re-assessing Normative Standards: A Time and Motion Study
A BBMP and KUIDFC study
• Major Roads: These include roads that are greater than or equal to 80 ft in width
<80’ and >= 40’ width roads
Carriage wayFoot Path
Foot Path
INT-R
Carriage way
Foot Path
<40’ width roads
MIN-R
• Intermediate Roads: These are less than 80 ft and include those that are upto 40 ft wide
Carriage wayCarriage wayFoot Path
Foot Path
MAJ-R
>= 80’
• Minor Roads: These are less than 40 ft roads. They maybe tarred, concreted or just a mud road and also include Conservancy Lanes.

Executive Summary
14
Re-assessing Normative Standards: A Time and Motion Study
A BBMP and KUIDFC study
1.3.3. NEW NORMATIVE STANDARDS
The normative standards that have been used in the tender are adapted from the Time and Motion Study (Table 06). These are in contrast variation from the current Karnataka Norms. These normative standards have been established for both Primary & Secondary Collection and Transportation.
Primary Collection, Transportation & Transfer:
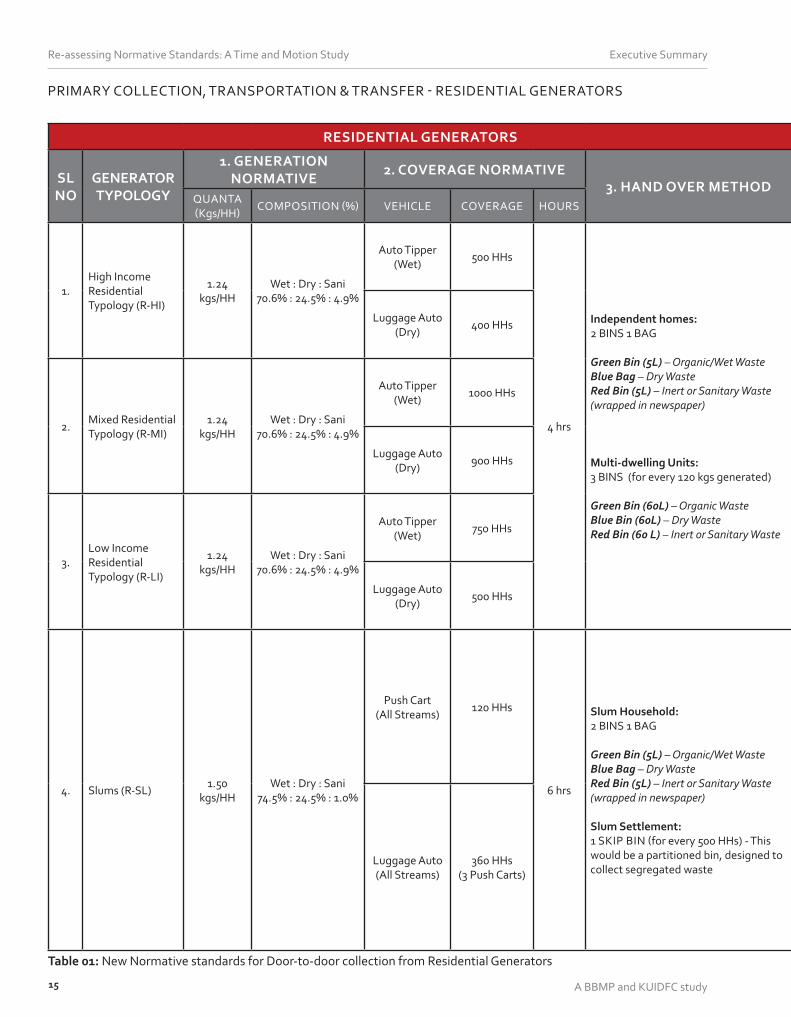
For primary collection, transportation & transfer of waste, the normative standards have been established under four heads for each typology (Table 01-03)
1. GENERATION NORMATIVE
This is looks at the quanta of waste generated by that generator type and the characterisation of waste streams (% of Wet, Dry, Sanitary & Reject)
2. COVERAGE NORMATIVE
This looks at establishing the vehicle type, timing for collection and coverage
3. HAND-OVER METHOD
This emphasises the use of specific receptacles for waste streams generated by the type of generator, and the ways in which waste has to handed over to the collector
4. PROCESS
This defines the entire cycle completed by the vehicle, from collection, to the drop-off of the waste stream collected and transfer of waste at the assigned destination
Note: Co-ordination for the transfer of waste from the primary to secondary vehicle may require interim
holding areas. Hence the placement of receptacles at Lorry Points (LP) and Decentralised Processing Facilities (DPF) have been suggested in the tender.
Secondary Collection & Drop-off:
Normative standards for secondary collection have been mandatory for receiving waste and its transportation to specified stream-wise destination. Drop-off’s have been divided into two levels based on distances.
1. DROP-OFF WITHIN WARD
This looks at mapping potential destinations within the ward boundary, within a radius of 2.5 kms (Table 04, Figure 06).
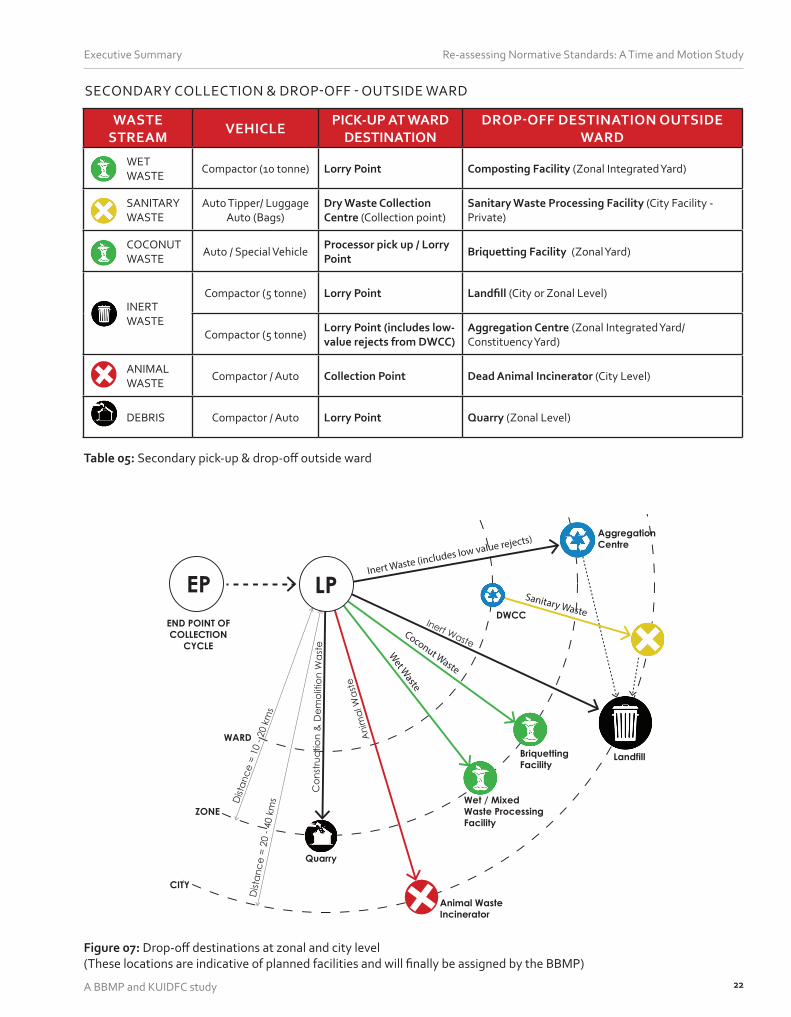
2. DROP-OFF OUTSIDE WARD
This looks at destinations outside of the ward boundary, which may be at constituency, zone or city level (Figure 07)
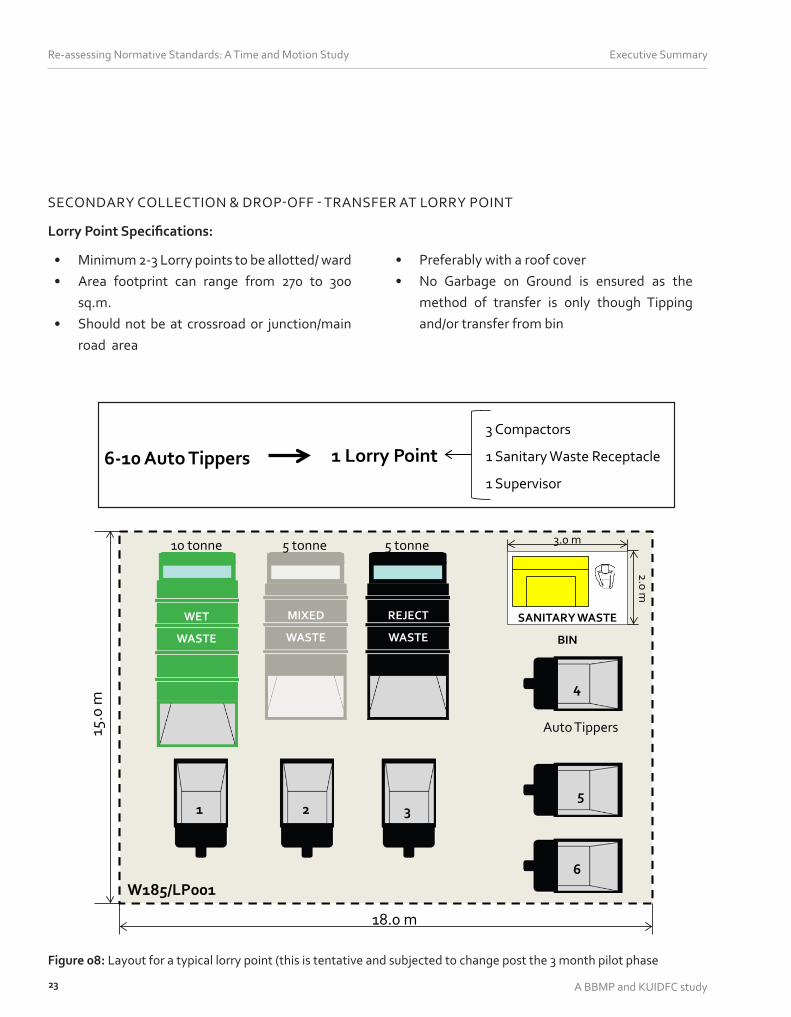
3. TRANSFER AT LORRY POINT
The normative standard for number of lorry points has also been established as a ratio to the number of vehicles and holding capacity (Figure 08).
Executive Summary
15
Re-assessing Normative Standards: A Time and Motion Study
A BBMP and KUIDFC study
RESIDENTIAL GENERATORS
SL NO
GENERATOR TYPOLOGY
1. GENERATION NORMATIVE
2. COVERAGE NORMATIVE3. HAND OVER METHOD
QUANTA (Kgs/HH)
COMPOSITION (%) VEHICLE COVERAGE HOURS
1.High Income Residential Typology (R-HI)
1.24 kgs/HH
Wet : Dry : Sani70.6% : 24.5% : 4.9%
Auto Tipper (Wet)
500 HHs
4 hrs
Independent homes: 2 BINS 1 BAG
Green Bin (5L) – Organic/Wet WasteBlue Bag – Dry WasteRed Bin (5L) – Inert or Sanitary Waste (wrapped in newspaper)
Multi-dwelling Units: 3 BINS (for every 120 kgs generated)
Green Bin (60L) – Organic WasteBlue Bin (60L) – Dry WasteRed Bin (60 L) – Inert or Sanitary Waste
Luggage Auto (Dry)
400 HHs
2.Mixed Residential Typology (R-MI)
1.24 kgs/HH
Wet : Dry : Sani70.6% : 24.5% : 4.9%
Auto Tipper (Wet)
1000 HHs
Luggage Auto (Dry)
900 HHs
3.Low Income Residential Typology (R-LI)
1.24 kgs/HH
Wet : Dry : Sani70.6% : 24.5% : 4.9%
Auto Tipper (Wet)
750 HHs
Luggage Auto (Dry)
500 HHs
4. Slums (R-SL)1.50
kgs/HHWet : Dry : Sani
74.5% : 24.5% : 1.0%
Push Cart (All Streams)
120 HHs
6 hrs
Slum Household: 2 BINS 1 BAG
Green Bin (5L) – Organic/Wet WasteBlue Bag – Dry WasteRed Bin (5L) – Inert or Sanitary Waste (wrapped in newspaper)
Slum Settlement: 1 SKIP BIN (for every 500 HHs) - This would be a partitioned bin, designed to collect segregated waste
Luggage Auto (All Streams)
360 HHs (3 Push Carts)
Table 01: New Normative standards for Door-to-door collection from Residential Generators
PRIMARY COLLECTION, TRANSPORTATION & TRANSFER - RESIDENTIAL GENERATORS

Executive Summary
16
Re-assessing Normative Standards: A Time and Motion Study
A BBMP and KUIDFC study
RESIDENTIAL GENERATORS
4. PROCESS OF COLLECTION & TRANSFER
WET CYCLE (Daily collection)
DRY CYCLE (Alternate day collection)
ALL STREAMS(Daily collection)
Time = 4-4.5 hrs, Coverage = 400HH - R(HI), 900HH - R(MI), 500HH - R(LI) Distance = 2-2.5 kms
END POINT OF COLLECTION
CYCLE
DRY WASTE COLLECTION CENTREPlatform/Receptacle - Dry Waste
D
D
HAND-OVER METHOD
Bag - Dry Waste
LUGGAGE AUTO (Blue Colour)350 Kgs CapacityJumbo Bags - 350 kgs Dry Waste
PRIMARY COLLECTION DROP-OFF (WITHIN WARD)
METHOD OF TRANSFER
EP DPF
D
RESIDENTIAL GENERATORS
SL NO
GENERATOR TYPOLOGY
1. GENERATION NORMATIVE
2. COVERAGE NORMATIVE3. HAND OVER METHOD
QUANTA (Kgs/HH)
COMPOSITION (%) VEHICLE COVERAGE HOURS
1.High Income Residential Typology (R-HI)
1.24 kgs/HH
Wet : Dry : Sani70.6% : 24.5% : 4.9%
Auto Tipper (Wet)
500 HHs
4 hrs
Independent homes: 2 BINS 1 BAG
Green Bin (5L) – Organic/Wet WasteBlue Bag – Dry WasteRed Bin (5L) – Inert or Sanitary Waste (wrapped in newspaper)
Multi-dwelling Units: 3 BINS (for every 120 kgs generated)
Green Bin (60L) – Organic WasteBlue Bin (60L) – Dry WasteRed Bin (60 L) – Inert or Sanitary Waste
Luggage Auto (Dry)
400 HHs
2.Mixed Residential Typology (R-MI)
1.24 kgs/HH
Wet : Dry : Sani70.6% : 24.5% : 4.9%
Auto Tipper (Wet)
1000 HHs
Luggage Auto (Dry)
900 HHs
3.Low Income Residential Typology (R-LI)
1.24 kgs/HH
Wet : Dry : Sani70.6% : 24.5% : 4.9%
Auto Tipper (Wet)
750 HHs
Luggage Auto (Dry)
500 HHs
4. Slums (R-SL)1.50
kgs/HHWet : Dry : Sani
74.5% : 24.5% : 1.0%
Push Cart (All Streams)
120 HHs
6 hrs
Slum Household: 2 BINS 1 BAG
Green Bin (5L) – Organic/Wet WasteBlue Bag – Dry WasteRed Bin (5L) – Inert or Sanitary Waste (wrapped in newspaper)
Slum Settlement: 1 SKIP BIN (for every 500 HHs) - This would be a partitioned bin, designed to collect segregated waste
Luggage Auto (All Streams)
360 HHs (3 Push Carts)
Time = 4-4.5 hrs, Coverage = 500HH - R(HI), 1000HH - R(MI), 750HH - R(LI) Dist. = 2-2.5 kms
LORRY POINTCompactor (10 Tonnes) - Wet WasteBin (1100L) - Sanitary Waste
END POINT OF COLLECTION
CYCLE
OR
BIO-METHANATION/COMPOSTING UNITPlatform/Receptacle - Wet Waste
S
S
W
W
W
W
HAND-OVER METHODGreen Bin (5L) - Wet/Organic WasteRed Bin (5L) - Sanitary Waste (in Newspaper)
AUTO TIPPER (Green Colour)500 Kgs CapacityTipper - 475 kgs Wet WasteDrum (25L) - 25 kgs Sanitary Waste
PRIMARY COLLECTION DROP-OFF (WITHIN WARD)
METHOD OF TRANSFER
EP
LP
DPF
S
S
S
W
WW
W
D
W W
DS
W W
DS
W W
DS
W W
DS
W W
DS
D
Time = 6 hrs, Coverage = 120 HHs per Push Cart; 5 PCs per Luggage Auto* Dist. = 2-2.5 kms
END POINT OF COLLECTION
CYCLE
HAND-OVER METHODGreen Bin (5L) - Wet Waste
Red Bin (5L) - Sanitary Waste (in Newspaper)
Blue Bag - Dry Waste *1 additional partioned Bin (660L) t0 be placed in close proximity to the slum for every 500 HHs, to be collected by the Luggage Auto
LUGGAGE AUTO 450 Kgs CapacityGreen Bin (65L) - Wet WasteYellow Bin (65L) - Sanitary Waste Jumbo Bags - Dry Waste5 Push carts = 1 Luggage Auto
PUSH CART (PC)90 Kgs CapacityGreen Bin (25L) - Wet WasteYellow Bin (25L) - Sanitary Waste Blue Bin (25L)/Jumbo Bags - Dry Waste
PRIMARY COLLECTION DROP-OFF (WITHIN WARD)
METHOD OF TRANSFER
EP
DPF
LP
DRY WASTE COLLECTION CENTRE
Platform/Receptacle - Dry Waste
LORRY POINTCompactor (10 Tonnes) - Wet Waste
Bin (1100L) - Sanitary Waste
WS
D

Executive Summary
17
Re-assessing Normative Standards: A Time and Motion Study
A BBMP and KUIDFC study
COMMERCIAL GENERATORS
SL NO
GENERATOR TYPOLOGY
1. GENERATION NORMATIVE
2. COVERAGE NORMATIVE3. HAND OVER METHOD
QUANTA (Kgs/Unit)
COMPOSITION (%) VEHICLE COVERAGE HOURS
1.
Shops & Wholesalers
2 kgs/Unit
Wet : Dry35% : 65%
Luggage Auto(All Streams)
200 Units
2 hrs
Commercial:2 BINS
Green Bin – Organic/Wet WasteBlue Bin – Dry Waste
*Capacity of bins to be decided
based on the requirement and daily
generation
Clinics
2.
Retail units & Offices
6 kgs/Unit
Wet : Dry25% : 75%
65 Units
Industrial Units / Godowns & Small Education Institutes
Hawkers & Vendors (Fruit & Veg)
Wet : Dry91% : 9%
3. Temples (small)10
kgs/UnitWet : Dry75% : 25%
40 Units
Table 02: New Normative standards for Door-to-door collection from Commercial Generators
PRIMARY COLLECTION, TRANSPORTATION & TRANSFER - COMMERCIAL GENERATORS

Executive Summary
18
Re-assessing Normative Standards: A Time and Motion Study
A BBMP and KUIDFC study
COMMERCIAL GENERATORS
SL NO
GENERATOR TYPOLOGY
1. GENERATION NORMATIVE
2. COVERAGE NORMATIVE3. HAND OVER METHOD
QUANTA (Kgs/Unit)
COMPOSITION (%) VEHICLE COVERAGE HOURS
1.
Shops & Wholesalers
2 kgs/Unit
Wet : Dry35% : 65%
Luggage Auto(All Streams)
200 Units
2 hrs
Commercial:2 BINS
Green Bin – Organic/Wet WasteBlue Bin – Dry Waste
*Capacity of bins to be decided
based on the requirement and daily
generation
Clinics
2.
Retail units & Offices
6 kgs/Unit
Wet : Dry25% : 75%
65 Units
Industrial Units / Godowns & Small Education Institutes
Hawkers & Vendors (Fruit & Veg)
Wet : Dry91% : 9%
3. Temples (small)10
kgs/UnitWet : Dry75% : 25%
40 Units
COMMERCIAL GENERATORS
4. PROCESS OF COLLECTION & TRANSFER
ALL STREAMS(Daily collection)
W
WW
D
D
OR
LP
DPF
Time = 2 hrs, Coverage = Total Quanta/400 kgs Dist. = 2-2.5 kms
END POINT OF COLLECTION
CYCLE
HAND-OVER METHODGreen Bin - Wet Waste
Blue Bin - Dry Waste
LUGGAGE AUTO 400 Kgs Capacity2 Green Bins (65L) - Wet WasteJumbo Bags - Dry Waste
PRIMARY COLLECTION DROP-OFF (WITHIN WARD)
METHOD OF TRANSFER
EP
DRY WASTE COLLECTION CENTREPlatform/Receptacle - Dry Waste
LORRY POINTCompactor (10 Tonnes) - Wet Waste

Executive Summary
19
Re-assessing Normative Standards: A Time and Motion Study
A BBMP and KUIDFC study
ROADS & STREETS
4. PROCESS OF COLLECTION & TRANSFER
LEAF WASTE OR INERT WASTE(Daily sweeping for Major and Intermediate roadsAlternate day for minor roads)
ROADS & STREETS
SL NO
GENERATOR TYPOLOGY
1. GENERATION NORMATIVE
2. COVERAGE NORMATIVE3. HAND OVER METHOD
QUANTA (Kgs/km)
COMPOSITION (%) VEHICLE COVERAGE HOURS
1. Major Road
30 kgs/km
Inerts100%
OR
Leaf Litter*100%
*Leaf litter waste would be easier
to collect in large volumes only in
specific streets with dense foliage
Sweeper (1 bag) 0.35 kms 4 hrs
Sweeper: 2 BagsSmall volume bags of 5 - 7.5 kg volume (carried, to collect waste at the time of sweeping)Large volume bags of 15 kg capacity (remain stationary at the mid point of the area - collection point)
Auto Tipper: Collect the Street sweeping inert / leaf waste from the Large Volume bag and directly tip into tipper. Bags collected to be re-used
Auto Tipper10 kms (28 stops)
2 hrs
2. Intermediate Road
Sweeper (2 bags)
0.50 kms 4 hrs
Auto Tipper10 kms (20 stops)
2 hrs
3. Minor Road
Sweeper (2 bags)
0.50 km 4 hrs
Auto Tipper10 kms (20 stops)
2 hrs
Table 03: New Normative standards for Street Sweeping of Roads & Streets
PRIMARY COLLECTION, TRANSPORTATION & TRANSFER - STREET SWEEPING

Executive Summary
20
Re-assessing Normative Standards: A Time and Motion Study
A BBMP and KUIDFC study
ROADS & STREETS
4. PROCESS OF COLLECTION & TRANSFER
LEAF WASTE OR INERT WASTE(Daily sweeping for Major and Intermediate roadsAlternate day for minor roads)
Time = 4-4.5 hrs sweeping & 2 hrs collection Coverage = 350m (Major), 500m (Intermediate & Minor)
distance between stops = 50 m
Jumbo Bag
Dist. = 2-2.5 kms
LORRY POINTCompactor (5 Tonnes) - Inert Waste
END POINT OF COLLECTION
CYCLE
OR
LEAF LITTER COMPOSTING UNITPit - Wet Waste
HAND-OVER METHODJumbo Bags (every 0.5m)
AUTO TIPPER500 Kgs CapacityCovers 10 kms28 stops - Major Roads20 stops - Intermediate & Minor Roads
MIN-R
INT-R
MAJ-R
PRIMARY COLLECTION DROP-OFF (WITHIN WARD)
METHOD OF TRANSFER
EPLP
LP
DPF

Executive Summary
21
Re-assessing Normative Standards: A Time and Motion Study
A BBMP and KUIDFC study
END POINT OF
COLLECTION CYCLE
EP LP
DWCC + Sanitary Waste Receptacle
OWC/ Bio-methanation
Facility
Leaf Litter Composting Facility(BBMP Park)
WARD
ZONE
CITY
Dry Waste (Low Value & Rejects)
Distance = 2-2.5 kms
WASTE STREAM
VEHICLE PICK-UP FROM DROP-OFF DESTINATION
WET WASTE
Auto Tipper (Tipper)Residential (High Income, Mixed & Low Income)
Bio-methanation / Composting Facility (Upto 5 TPD capacity) OR
Lorry Point (Excess above 5 TPD & if no Bio-methanation / Composting Facility)Luggage Auto (Bins)
Commercial (All) & Residential (Slum)
DRY WASTE
Luggage Auto (Jumbo Bags)
Residential & Commercial Dry Waste Collection Centre / Designated location
SANITARY WASTE
Auto Tipper (Bin) Residential Lorry Point (Holding receptacle) TO Dry Waste Collection Centre (Collection point)
LEAF WASTE
Auto Tipper (Tipper) Roads with dense foliageLeaf Waste Composting Facility/Shredder/ Designated location
INERT WASTE
Auto Tipper (Tipper) Roads & Streets Lorry Point (to be put in a separate 5 Tonne compactor)
Auto Tipper (Tipper) / Luggage Auto (Bags)
Dry Waste Collection Centre (DWCC)
Lorry Point (to be put in a separate 5 Tonne compactor)
Table 04: Secondary transfer & drop-off within ward
Figure 06: Drop-off destinations at ward level (These locations are indicative of planned facilities and will finally be assigned by the BBMP)
SECONDARY COLLECTION & DROP-OFF - WITHIN WARD
Executive Summary
22
Re-assessing Normative Standards: A Time and Motion Study
A BBMP and KUIDFC study
END POINT OF COLLECTION
CYCLE
EP
WARD
ZONE
CITY
Aggregation Centre
Sanitary Waste Processing Facility
DWCC
Wet / Mixed Waste Processing Facility
Briquetting Facility
Animal Waste Incinerator
Quarry
Landfill
Wet W
aste
Coconut Waste
Sanitary Waste
Inert Waste (includes low value rejects)
LP
WASTE STREAM
VEHICLEPICK-UP AT WARD
DESTINATIONDROP-OFF DESTINATION OUTSIDE
WARD
WET WASTE
Compactor (10 tonne) Lorry Point Composting Facility (Zonal Integrated Yard)
SANITARY WASTE
Auto Tipper/ Luggage Auto (Bags)
Dry Waste Collection Centre (Collection point)
Sanitary Waste Processing Facility (City Facility - Private)
COCONUT WASTE
Auto / Special VehicleProcessor pick up / Lorry Point
Briquetting Facility (Zonal Yard)
INERT WASTE
Compactor (5 tonne) Lorry Point Landfill (City or Zonal Level)
Compactor (5 tonne)Lorry Point (includes low-value rejects from DWCC)
Aggregation Centre (Zonal Integrated Yard/ Constituency Yard)
ANIMAL WASTE
Compactor / Auto Collection Point Dead Animal Incinerator (City Level)
DEBRIS Compactor / Auto Lorry Point Quarry (Zonal Level)
Table 05: Secondary pick-up & drop-off outside ward
Figure 07: Drop-off destinations at zonal and city level (These locations are indicative of planned facilities and will finally be assigned by the BBMP)
SECONDARY COLLECTION & DROP-OFF - OUTSIDE WARD
Executive Summary
23
Re-assessing Normative Standards: A Time and Motion Study
A BBMP and KUIDFC study
Figure 08: Layout for a typical lorry point (this is tentative and subjected to change post the 3 month pilot phase
15.0
m
WET
WASTE
MIXED
WASTE
REJECT
WASTE
SANITARY WASTE
BIN
3.0 m
2.0 m
10 tonne 5 tonne
18.0 m
Auto Tippers
1 2 3
4
5
6
5 tonne
W185/LP001
SECONDARY COLLECTION & DROP-OFF - TRANSFER AT LORRY POINT
6-10 Auto Tippers 1 Lorry Point3 Compactors
1 Sanitary Waste Receptacle
1 Supervisor
Lorry Point Specifications:
• Minimum 2-3 Lorry points to be allotted/ ward• Area footprint can range from 270 to 300
sq.m.• Should not be at crossroad or junction/main
road area
• Preferably with a roof cover• No Garbage on Ground is ensured as the
method of transfer is only though Tipping and/or transfer from bin

Executive Summary
24
Re-assessing Normative Standards: A Time and Motion Study
A BBMP and KUIDFC study
PARTICULARS DETAILS CATEGORYNORMATIVE STANDARDS
Current NormTime & Motion
StudyProposed
Auto Tipper - Wet Waste
Door-to-door Collection
From Households (HH)
High Income
1000 HHs
430 500 HHs
Mixed 1250 1000 HHs
Low Income 790 750 HHs
Luggage Auto - Dry Waste
High Income 390 400 HHs
Mixed 820 900 HHs
Low Income 440 500 HHs
Push Carts - Segregated Waste
Slum HHs 160 - 120 HHs
Sweepers (Pourakarmikas - PK)
Street Sweeping
Major Roads
1 km/PK -
350 m/PK
Intermediary Roads 500 m/PK
Minor Roads 500 m/PK
Luggage Auto/Auto Tipper - Segregated Waste
Small Commercial Establishments
(< 10 kgs)
Small Shops and Clinics
240 Units -
200 Units
Retail Units, Offices & Educational Institutions
67 Units
Small Markets & Temples 40 Units
Vegetable vendors 73 Units
Table 06: Comparison of Normative Standards
COMPARISON OF NORMATIVE STANDARDS

Executive Summary
25
Re-assessing Normative Standards: A Time and Motion Study
A BBMP and KUIDFC study
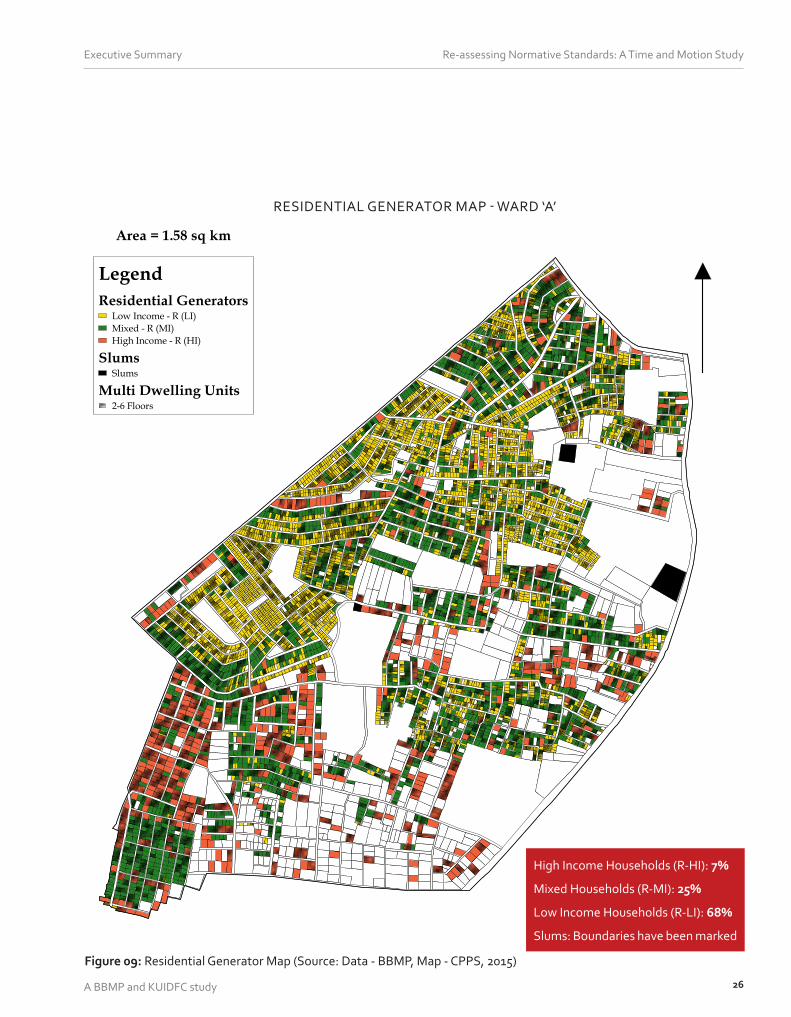
GIS mapping is a tool that can be used at different stages of planning for Bengaluru’s MSW Collection & Transportation System. The use of data to understand the spatial mapping of these generators identified by the study has resulted in the distribution of typologies as percentages, which then feeds into the estimation process.
The spatial mapping has been done ward wise for each of the 198 wards. As an example, the spatial mapping and its relation to estimation have been projected for a sample ward - Ward A. The three key maps that have been used for the process of estimation are as follows:
1. Residential Generator Map (Figure 09) - This map highlights the percentage distribution of household units within the ward.
• High Income Households (R-HI): 7%
• Mixed Households (R-MI): 25%
• Low Income Households (R-LI): 68%
• Slums: Boundaries have been marked
2. Commercial Generator Map (Figure 10) - This map is used to identify the spread of commercial units within the ward, and is used for the identification of roads with high commercial activity.
3. Road Typologies Map (Figure 11) - This map gives the distribution of road length to be swept within the ward limits
• Major Roads: 3.5 kms
• Intermediate Roads: 1.9 kms
• Minor Roads: 48 kms
1.3.4. SPATIAL MAPPING OF WASTE TYPOLOGIES
Executive Summary
26
Re-assessing Normative Standards: A Time and Motion Study
A BBMP and KUIDFC study
Figure 09: Residential Generator Map (Source: Data - BBMP, Map - CPPS, 2015)
0 250 500 750 1000 1250 1500 m
Residential GeneratorsLow Income - R (LI)
Mixed - R (MI)
High Income - R (HI)
SlumsSlums
Multi Dwelling Units2-6 Floors
Legend
Residential Generator MapWard No.185 - Yelachenahalli (Bommanahalli-Zone)
Area = 1.58 sq km
0 250 500 750 1000 1250 1500 m
Residential GeneratorsLow Income - R (LI)
Mixed - R (MI)
High Income - R (HI)
SlumsSlums
Multi Dwelling Units2-6 Floors
Legend
Residential Generator MapWard No.185 - Yelachenahalli (Bommanahalli-Zone)
Area = 1.58 sq km
RESIDENTIAL GENERATOR MAP - WARD ‘A’
High Income Households (R-HI): 7%
Mixed Households (R-MI): 25%
Low Income Households (R-LI): 68%
Slums: Boundaries have been marked

Executive Summary
27
Re-assessing Normative Standards: A Time and Motion Study
A BBMP and KUIDFC study
0 250 500 750 1000 1250 1500 m
Commercial StretchCommercial Stretch
Commercial GeneratorsCommercial
Residential/Commercial
Legend
Commercial Generators MapWard No.185 - Yelachenahalli (Bommanahalli-Zone)
Area = 1.58 sq km
Total Distance = 2.540 km
0 250 500 750 1000 1250 1500 m
Commercial StretchCommercial Stretch
Commercial GeneratorsCommercial
Residential/Commercial
Legend
Commercial Generators MapWard No.185 - Yelachenahalli (Bommanahalli-Zone)
Area = 1.58 sq km
Total Distance = 2.540 km
COMMERCIAL GENERATOR MAP - WARD ‘A’
Figure 10: Commercial Generator Map (Source: Data - BBMP, Map - CPPS, 2015)
Commercial stretch = 2.54 kms
5 sets of street litter bins (1 set @ 0.5 kms)

Executive Summary
28
Re-assessing Normative Standards: A Time and Motion Study
A BBMP and KUIDFC study
0 250 500 750 1000 1250 1500 m
Road TopologyMajor Road
Intermediate Road
Minor Road
Ward BoundaryWard Boundary
Legend
Road Topology MapWard No.185 - Yelachenahalli (Bommanahalli-Zone)
Area = 1.58 sq km
Figure 11: Road Typology Map (Source: Data - BBMP, Map - CPPS, 2015)
0 250 500 750 1000 1250 1500 m
Road TopologyMajor Road
Intermediate Road
Minor Road
Ward BoundaryWard Boundary
Legend
Road Topology MapWard No.185 - Yelachenahalli (Bommanahalli-Zone)
Area = 1.58 sq km
ROAD TYPOLOGY MAP - WARD ‘A’
Major Roads = 3.5 kms
Intermediate Roads = 1.9 kms
Minor Roads = 48 kms

Executive Summary
29
Re-assessing Normative Standards: A Time and Motion Study
A BBMP and KUIDFC study
1.3.5. USE OF NORMATIVE FOR ESTIMATION
To further demonstrate the use of the new normative standards, figure 12 shows the break-up and use of the norms from multiple sources and the methodology of their application in the estimation process of the tender. These have then been applied to the above discussed ward (Ward ‘A’) as an example that demonstrates the estimation process.
The estimation on the quanta of waste by stream and the coverage determines the number of vehicles
IDENTIFICATION OF TYPOLOGY (GENERATOR/ROAD)
WASTE GENERATION & COMPOSITION (%)
Residential Typology- Kgs/HH (pcg * no. of persons/HH) & W:D:S:R
Commercial Typology - Kgs/Unit & W:D:R
Road Typology - Kgs/Km & L:D:R
RATE OF COLLECTION
Residential Typology- HH/Hr
Commercial Typology - Units/Hr
Road Typology - Kms/Hr
VEHICLE CAPACITY
Wet Waste - Kgs
Dry Waste - Kgs
Leaf/Garden Waste - Kgs
VEHICLE COVERAGE
Generator Typology - HH/Vehicle Capacity
Road Typology - Kms/Vehicle Capacity
FREQUENCY OF COLLECTIONCOLLECTION TIME
CYCLE TIME
NUMBER OF CYCLES
COVERAGEResidential Typology - HH/day
Commercial Typology - Units/day
Road Typology - Kms/day
QUANTA CLEAREDVehicle Type - Kgs/dayFindings from Time & Motion Study
Findings from other Studies
LEGEND:
Derived Values
Input for the Tender (Challenging Normative Standards)
FACTORS CONSIDERED FOR CALCULATION
Figure 12: Application of New Normative Standards in the estimation and planning
required for both Primary and Secondary Collection and Transportation. The estimation process is shown in the form of three tables:
Part I: Primary Collection & Transportation (Table 07)
Part II: Secondary Collection & Transportation (Table 08)
Part III: Summary of Estimate (Table 09)

Executive Summary
30
Re-assessing Normative Standards: A Time and Motion Study
A BBMP and KUIDFC study
DESCRIPTIONNO OF
HOUSEHOLDS / UNITS / KMS
GENERATION NORMATIVE
QUANTA (tonnes)
COVERAGE NORMATIVE
VEHICLES/LABOUR
Total Households
13397 Households
16.72 Tonnes
17 Auto Tippers12 Luggage Autos (Alternate day collection)4 Push carts
29 Drivers33 Helpers/Collectors
Residential High Income (7%)
933 1.24 kgs/HH 1.16500 HH (Wet Cycle)400 HH (Dry Cycle)
2 Auto Tippers (Wet Cycle); 1 Luggage Auto (Dry Cycle)
Residential Mixed (25%)
3290 1.24 kgs/HH 4.081000 HH (Wet Cycle)900 HH (Dry Cycle)
3 Auto Tippers (Wet Cycle); 2 Luggage Auto (Dry Cycle)
Residential Low Income (68%)
8759 1.24 kgs/HH 10.86750 HH (Wet Cycle)500 HH (Dry Cycle)
12 Auto Tippers (Wet Cycle); 9 Luggage Auto (Dry Cycle)
Slum 415 1.50 kgs/HH 0.62 120 HH (All streams) 4 Push Carts (All streams)
Total Commercial Establishments
322 Units
1.16 Tonnes
3 Luggage Autos (Redeployed)
Category 1 192 2 kgs/Unit 0.4 200 Units 1 Luggage Auto (All streams)
Category 2 130 6 kgs/Unit 0.8 65 Units 2 Luggage Autos (All streams)
Category 3 0 10 kgs/Unit 0 40 Units -
Total Road Length
53.4 kms
0.9Tonnes
5-6 Auto Tippers (Redeployed)
62 Sweepers
Major Roads 3.5 30 kgs/km 0.1350 m/Sweeper10 km/Vehicle
10 Sweepers
Intermediate Roads
1.9 30 kgs/km 0.06500 m/Sweeper10 km/Vehicle
4 Sweepers
Minor Roads48 (only 24 kms
swept daily)30 kgs/km 0.72
500 m/Sweeper10 km/Vehicle
48 Sweepers
PART I: ESTIMATION FOR PRIMARY COLLECTION & TRANSPORTATION - WARD ‘A’
Table 07: Estimation of Vehicles and Manpower - Primary Collection and Transportation

Executive Summary
31
Re-assessing Normative Standards: A Time and Motion Study
A BBMP and KUIDFC study
DESCRIPTIONCOMPOSITION
(%)
ESTIMATED QUANTA
(kgs)
TOTAL QUANTA (tonnes)
VEHICLES/LABOUR
Wet Waste 12.3 Tonnes1 Compactor (10 Tonne)1 Compactor (5 Tonne)
2 Drivers2 HelpersOutside the Ward - to Integrated Yard *if there was a Bio-methanation Facility within the ward then the vehicle requirement would be:1 Compactor (10 Tonne)1 Driver1 Helper
Residential - High Income, Mixed & Low Income
70.6% 16.1 11.37
Residential Slum 74.5% 0.62 0.46
Commercial Category 1 35% 0.4 0.14
Commercial Category 2 (offices & godowns)
25% 0.6 0.15
Commercial Category 2 (Vendors)
91% 0.2 0.18
Commercial Category 3 75% 0 0
Dry Waste 4.8 Tonnes
1 Compactor (5 Tonne)
1 Driver1 HelperOutside the Ward - to aggregator at the Constituency Yard or Integrated Yard
Residential - High Income, Mixed, Low Income & Slum
24.5% 16.72 4.10
Commercial Category 1 65% 0.4 0.26
Commercial Category 2 (offices & godowns)
75% 0.6 0.45
Commercial Category 2 (Vendors)
9% 0.2 0.02
Commercial Category 3 25% 0 0
Sanitary Waste 0.8 Tonnes 2 Auto Tippers (1 Tonne) - redeployedInside the Ward - Lorry Point to Dry Waste Collection Centre (Collection Point)
Residential - High Income, Mixed & Low Income
4.9% 16.1 0.79
Residential Slum 1% 0.62 0.01
Inert Waste 0.9 Tonnes 1 Compactor (1 Tonne)
1 Driver1 HelperOutside the Ward - to Integrated Yard/Landfill
Roads (Major, Intermediate & Minor)
100% 0.9 0.9
PART II: ESTIMATION FOR SECONDARY COLLECTION & TRANSPORTATION - WARD ‘A’
Table 08: Estimation of Vehicles and Manpower - Secondary Collection and Transportation

Executive Summary
32
Re-assessing Normative Standards: A Time and Motion Study
A BBMP and KUIDFC study
TOTAL ESTIMATE
Total Quanta 18.8 Tonnes (per day)
Wet Waste 12.3
Dry Waste 4.8
Sanitary Waste 0.8
Inert Waste 0.9
No. of Primary Vehicles 29 Autos, 4 Push Carts
Auto Tippers 17
Luggage Autos 12
Push Carts 4
No. of Secondary Vehicles 4 Compactors
10 Tonne Compactors 1
5 Tonne Compactors 2
1 Tonne Compactors 1
Labour 133 Employees
Supervisors (3 Lorry Points) 3
Drivers 33
Helpers 37
Sweepers 62
PART III: SUMMARY OF ESTIMATE - WARD ‘A’
Table 09: Summary of Ward Estimate

Executive Summary
33
Re-assessing Normative Standards: A Time and Motion Study
A BBMP and KUIDFC study
1.3.6. CONCLUSION
The four part normative that has been established through the learnings of the Time and Motion study are not exhaustive for each generator typology or stream of waste. This however lays ground for the method of understanding these in order to plan for a better and more efficient MSW collection and transportation system.
The city adopting these for its new tender has kept a ratification period of three months from the roll-out date to check and ratify the norms proposed, as well as establish new norms through similar studies being conducted for other typologies and streams.
In addition to testing of the proposed norm, this three month period will look at collecting and ratifying base data on generators (including special needs specific to that ward), hence in the process creating a ‘Data Repository’ for city to have a better informed system. This will lay the basis for a closely monitored and accountable system.
As we move closer towards our vision of achieving a cleaner city amidst the challenges that come with rapid urbanisation and consumerism, it becomes crucial that normative standards are revised and assessed periodically. This enables the city to address the system in a way that helps better planning and accountability in the future.
THREE MONTH PILOT PHASE IN TENDER
A three month ‘ratification period’ has been included in the new tender, once the contract begins. During this time, the BBMP will further assess, ratify and establish the following:
• Proposed normative standards used for estimation
• Pilots conducted to help establish new normative standards for other streams & generators not captured (ex. Markets)
• Update and check base data on generators, leading to the creation of a data repository
• Special needs specific to wards will be identified and normative standards derived for that specific stream (ex. garden waste, bakery waste, etc.)

Cover
This document is an abridged version (Executive Summary) of the Time and Motion Study and is a referral document for the tender. The study explores the issues in the current Solid Waste Management (SWM) System in Bengaluru, and proposes new normative standards for stream-wise collection and transportation of Municipal Solid Waste in a decentralised manner.
The new tender includes door-to-door collection of waste from residential generators (independent homes and multi-dwelling units with < 50 units), small commercial generators (< 10 kgs) and street sweeping. The Time and Motion study reads the city spatially and classifies these generators and roads into typologies, which in turn are assigned normative standards. The proposed norm for Primary collection and transportation is divided into four parts - generation, composition, hand-over method and process. The norm for Secondary collection and transportation includes - drop-off destinations and method for transfer of waste. These norms have already been applied in the estimation and planning process for the ward collection and transportation tender released in 2015.
40km
20km
1 km 10 km
Rural
Urban