re-evaluating the kinetics of atp hydrolysis during initiation of dna
TRANSCRIPT
10870–10881 Nucleic Acids Research, 2015, Vol. 43, No. 22 Published online 3 November 2015doi: 10.1093/nar/gkv1154
Re-evaluating the kinetics of ATP hydrolysis duringinitiation of DNA sliding by Type III restrictionenzymesJulia Toth, Jack Bollins and Mark D. Szczelkun*
DNA–Protein Interactions Unit, School of Biochemistry, University of Bristol, Bristol BS8 1TD, UK
Received September 07, 2015; Revised October 16, 2015; Accepted October 19, 2015
ABSTRACT
DNA cleavage by the Type III restriction enzymes re-quires long-range protein communication betweenrecognition sites facilitated by thermally-driven 1Ddiffusion. This ‘DNA sliding’ is initiated by hydrol-ysis of multiple ATPs catalysed by a helicase-likedomain. Two distinct ATPase phases were observedusing short oligoduplex substrates; the rapid con-sumption of ∼10 ATPs coupled to a protein con-formation switch followed by a slower phase, theduration of which was dictated by the rate of dis-sociation from the recognition site. Here, we showthat the second ATPase phase is both variable andonly observable when DNA ends are proximal to therecognition site. On DNA with sites more distantfrom the ends, a single ATPase phase coupled to theconformation switch was observed and subsequentsite dissociation required little or no further ATP hy-drolysis. The overall DNA dissociation kinetics (en-compassing site release, DNA sliding and escapevia a DNA end) were not influenced by the secondphase. Although the data simplifies the ATP hydrol-ysis scheme for Type III restriction enzymes, ques-tions remain as to why multiple ATPs are hydrolysedto prepare for DNA sliding.
INTRODUCTION
The ATPase activity of helicases is significantly activatedupon substrate binding (i.e. to single or double-strandedDNA or RNA, depending on the enzyme). The classicalview is that all helicases can be defined as translocaseswhere the ATPase activity is required to maintain repeateddomain motions coupled to movement along the polynu-cleotide track (1). In turn this movement produces a func-tional outcome, such as duplex unwinding or remodelling ofan adjacent nucleoprotein complex. The Type III restrictionendonucleases (REs) such as the related enzymes EcoP15Iand EcoPI illustrate an additional molecular switch role for
Superfamily 2 helicase-like motors, where the ATPase ac-tivity is required to change protein conformation and initi-ate the long-range motion of the enzyme (2–9). There is noevidence that ATP hydrolysis is required for strand separa-tion (i.e. classical helicase activity). ATP-driven dissociationof EcoP15I from a site followed a simple single exponen-tial kinetics (4). In spite of that, the accompanying ATPaseactivity was surprisingly complex; multiple ATPs were hy-drolysed in two kinetically distinct burst phases. Here weinvestigated further the Type III ATPase activity, and pro-vide evidence for a simplified molecular switch model whereonly a single burst phase is necessary to drive the molecularswitch.
In the absence of ATP, Type III REs bind tightly totheir recognition sites (e.g. 5′-CAGCAG-3′ for EcoP15I or5′-AGACC-3′ for EcoPI). Using a short oligoduplex sub-strate (Figure 1A), pre-bound by EcoP15I, we initiated anATPase reaction by rapidly mixing with ATP and heparin(4). The heparin was included to trap any Type III enzymesthat dissociated from the DNA. Two phases of ATP hy-drolysis were observed: an initial rapid burst phase last-ing ∼1 s during which ∼10 ATPs were consumed; and asecond slower burst phase which decayed as a single ex-ponential with a time constant of ∼8 s, during which >20ATPs were consumed (Figure 1B). We were able to corre-late the first ATP burst with a protein conformation switchas changes in EcoP15I tryptophan fluorescence occurredover a similar timescale (4). The exponential rate constantof the second burst phase matched closely the exponen-tial rate constant for EcoP15I dissociation from a fluo-rescent version of the oligoduplex (reported as a changein anisotropy). By directly observing quantum dot-labelledEcoP15I on a ∼25 kilobase pair (kbp) DNA substrate usingsingle-molecule fluorescence microscopy, we showed thatATP hydrolysis-driven release from the site led to one di-mensional DNA diffusion (sliding) (Figure 1B). Sliding wasboth fast (∼16 × 106 random single nucleotide steps per sec-ond) and long-lived (the lifetime before dissociation frominternal sites––endo-dissociation––was ∼200 s). However,sliding of EcoP15I off the fluorescent oligoduplex via theDNA ends (exo-dissociation) would decrease the sliding
*To whom correspondence should be addressed. Tel: +44 117 3312158; Fax: +44 117 3312168; Email: [email protected]
C© The Author(s) 2015. Published by Oxford University Press on behalf of Nucleic Acids Research.This is an Open Access article distributed under the terms of the Creative Commons Attribution License (http://creativecommons.org/licenses/by/4.0/), whichpermits unrestricted reuse, distribution, and reproduction in any medium, provided the original work is properly cited.
Downloaded from https://academic.oup.com/nar/article-abstract/43/22/10870/1803720by gueston 15 March 2018

Nucleic Acids Research, 2015, Vol. 43, No. 22 10871
Figure 1. Models for ATPase-coupled conformation switching to a DNA sliding state by Type III restriction-modification enzymes. (A) EcoP15I specificoligoduplex substrate (6/38 P15I) used here, and previously (4). Arrowheads indicate the sites of cleavage. The nomenclature reflects the position of therecognition site in the sequence; e.g. the CAGCAG recognition sequence is 6 base pairs from the 5′ end and 38 base pairs from the 3′ end. (B) Dual phaseATPase cycles proposed previously based on single molecule and biochemical studies (3,4,9,20). Mod subunits are shown as light grey ellipsoids. Ressubunits are shown as a dark grey cee-shape (prior to the switch) or a dark grey circle (post-switch sliding state). The recognition site is a white box. (C)Alternative model where reversal of the conformation switch leads to the observed second burst phase of ATP hydrolysis. (D) Alternative model whererebinding to the site following initiation of sliding leads to the observed second burst phase of ATP hydrolysis. See main text for more details.
lifetime to microseconds (3,5,9,10). Exo-dissociation wasthus taken to be near instantaneous following release fromthe site. Hence, we correlated both the change in anisotropyand decay in the second ATPase burst phase as being the re-lease from the site into the sliding state (4). Dissociation viaa DNA end would only become rate-limiting with respectto the ATPase kinetics with site-to-end distances in excessof 12 kb.
We proposed that ATP binding and hydrolysis had twonucleoprotein remodelling roles (4): destabilizing the DNA-binding interface to allow release of the specific sequenceand access to adjacent non-specific sites; and, changing theprotein conformation to produce an undefined ‘DNA slid-ing’ state that can remain in contact with the DNA for tensof seconds whilst also allowing rapid and random transferbetween adjacent non-specific sites driven by thermal mo-tion. The change in conformation associated with the firstATPase burst could be one or other, or both, of these events.We suggested that the second ATPase burst phase was re-quired to maintain a stressed conformation until the en-zyme could release the site and start sliding (4,6). The dif-ferent ATP hydrolysis rates in each observed burst phasewere rationalized as different mechanochemical couplingefficiencies pre- and post-conformation switch. However, analternative view is that following the conformation switchthere is no necessity to consume any ATP to maintain thestressed state or to leave the site; i.e. only a single ATPaseburst is absolutely necessary for DNA sliding. The observedsecond ATPase phase may instead arise because of alterna-
tive, hidden events that require additional rounds of ATPhydrolysis, including: rebinding of the site following initia-tion of sliding, which has been directly observed in the sin-gle molecule sliding assay (Figure 1D) (4); and/or reversalof the conformation change (Figure 1C). In both cases, theobserved rate of the second phase would be slower thanthe first because only a fraction of enzymes would rebindand/or reverse.
To try to resolve the complexities of the Type III REATPase mechanism, we investigated whether the same, dualATPase phases and conformational switch were observedwith the related enzyme EcoPI on an oligoduplex substrate,or with EcoP15I using alternative, longer DNA substrates.To monitor dissociation from the longer DNA we devel-oped a surface plasmon resonance (SPR) assay to followDNA binding and dissociation by Type III REs. This as-say also allowed us to expose the enzyme–DNA complex toshort pulses of ATP to observe whether dissociation fromthe DNA required prolonged ATP hydrolysis. Our com-bined data is consistent with a simplified model where a sin-gle round of ATP hydrolysis is sufficient for the conforma-tional switch and for dissociation from the site. Moreover,the data is consistent with a model where continued ATP hy-drolysis is not required to maintain the sliding state but thatATP binding may be important in preventing irreversible re-binding to the recognition site.
Downloaded from https://academic.oup.com/nar/article-abstract/43/22/10870/1803720by gueston 15 March 2018
10872 Nucleic Acids Research, 2015, Vol. 43, No. 22
MATERIALS AND METHODS
DNA and proteins
EcoP15I, EcoPI and AddAHB were expressed andpurified as previously described (3,11). The fol-lowing oligonucleotides (from MWG-Biotech AG)were annealed in a 1:1 ratio to produce 50 bp du-plex substrates: 5′-TGGCTTCAGCAGACCGCAGATACCAAAACTGTCCTTCTATTGACAATTCG-3′ and 5′-CGAATTGTCAATAGAAGGACAGTTTTGGTATCTGCGGTCTGCTGAAGCCA-3′ for6/38 EcoP15I; 5′-TGGCTTAGACCACCGCAGATACCAAAACTGTCCTTCTATTGACAATTCG-3′ and 5′-CGAATTGTCAATAGAAGGACAGTTTTGGTATCTGCGGTGGTCTAAGCCA-3′ for6/38 EcoPI. To make pKA16.5, reverse PCR us-ing primers 5′-GACGAAGGCTTGAGCGAGGG-3′ and 5′-CGGGTGATGCTGCCAACTTACTG-3′ was used to delete a section of DNA betweenthe EcoP15I sites of pKA16 (4). The DNA forthe SPR experiments (89/206Bio P15I) was gener-ated by PCR from pKA16.5 using the primers 5′-GGATGTGCTGCAAGGCGATTAAG-3′ and 5′-biotin-AAAATGACCCAGAGCGCTGCC-3′. For the enddependence experiments, the DNA was generated by PCRfrom pKA16.5 using the following primers: 5′-CACAGATGCGTAAGGAGAAAATACCGCATCAGGCGCC-3′ and 5′- AAAATGACCCAGAGCGCTGCC-3′ (for206/206 P15I); 5′-TGGCTTCAGCAGACCGCAGATACCAAAACTGTCCTTCTATTGACAATTCG-3′ and 5′-AAAATGACCCAGAGCGCTGCC-3′ (for 6/206 P15I);5′-CACAGATGCGTAAGGAGAAAATACCGCATCAGGCGCC-3′ and 5′-CGAATTGTCAATAGAAGGACAGTTTTGGTATCTGCGGTCTGCTGAAGCCA-3′ for(206/38 P15I). The nomenclature of the DNA substratesreflects the position of the recognition site in the sequence,e.g. for the 6/38 P15I substrate, the CAGCAG recognitionsequence is 6 base pairs away from the 5′ end and 38 basepairs away from the 3′ end.
ATPase assay
We monitored phosphate release during the ATPase cy-cle using the phosphate binding protein (PBP) labelledwith N-[2-(1-maleimidyl)ethyl]-7-(diethylamino)coumarin-3-carboxamide (MDCC) as previously described (4). Flu-orescence intensity measurements were performed at 25 ±0.1◦C using an SF61-DX2 stopped-flow apparatus. In allATPase measurements, PBP-MDCC was added to both sy-ringes at 6 �M. On each day, prior to making experimentalmeasurements, the response of the PBP was calibrated usinga titration of phosphate standard (Supplementary FigureS1A) (4). The change in the phosphate concentration dur-ing the experiments was <1 �M and was thus within the lin-ear range. Reactions were initiated by mixing protein-DNAfrom one syringe with ATP and heparin from the other. Forexperiments in Figures 2 and 6, final reaction conditionswere 200 nM DNA, 25 nM EcoP15I or EcoPI, 4 mM ATPand 200 �M heparin in Buffer R+ (50 mM Tris–HCl pH8.0, 50 mM KCl, 10 mM MgCl2, 1 mM DTT, 100 �g/mlBSA). For experiments in Figure 3, final reaction conditions
were: 50 nM DNA, 25 nM EcoP15I, 4 mM ATP and 2.5 �Mheparin in Buffer R+.
Burst phase profiles were deconvoluted as follows and byfitting the functions to the traces using GraphPad Prism(Supplementary Figure S1B–D). Firstly, the backgroundsteady-state rate at times (t) > 45 s was fitted by linearregression and subtracted from the raw data. The secondburst phase of the corrected profile was fitted to an offsetsingle exponential function for t > 3.5 s:
y = (A2 · (1 − e−k2·t)) + A1 (1)
where A1 is the y-axis intercept and is taken as the amplitudeof the first burst phase, A2 is the exponential amplitude andis taken as the amplitude of the second burst phase, k2 is theexponential rate constant of the second burst phase. The ex-ponential component can be subtracted from the correctedprofile to give a visual representation of the burst phase.We have previously shown that k2 is very close in value tothe measured single exponential rate constant for dissoci-ation from an oligoduplex substrate (4). In other words,the second exponential burst represents the switch from anATP hydrolysing state (at the site) to a non-hydrolysing state(sliding or dissociated from the DNA). If we assume a con-stant ATP hydrolysis rate prior to the start of sliding, theATPase rate of the second burst phase can then be estimatedfrom the number of ATPs consumed during the lifetime ofthe second phase, using:
Rate = A2 · k2 (2)
The ATPase rate of the first burst phase was estimatedfrom a linear fit to the initial part of the profile (for t < 0.35s).
To compare profiles without a clear second ATPasephase, the data was fitted to:
y = (A1 · (1 − e−k1·t)) + m · t (3)
where k1 is the exponential rate constant of the first burst(an approximation of the lifetime of the state), A1 is ampli-tude of the burst phase, and m is the background steady-state ATPase rate. All errors we report are based on averagevalues from separate fits to repeat data and are not standarderrors of fits to averaged data.
Tryptophan fluorescence assay
We monitored conformational changes during the ATPasecycle using tryptophan fluorescence intensity measure-ments as previously described (4). Experiments were per-formed at 25 ± 0.1◦C using the SF61-DX2 stopped-flow,with λex = 297 nm (4 nm bandwidth) and a 320 nm (SchottWG320) band-pass filter. Reactions were initiated by mix-ing protein–DNA from one syringe with ATP from theother. For experiments in Figure 2, final reaction conditionswere: 1 �M DNA, 250 nM EcoPI, 4 mM ATP and 500 �Mheparin in Buffer R (50 mM Tris–HCl pH 8.0, 50 mM KCl,10 mM MgCl2, 1 mM DTT). For the experiment in Fig-ure 4, final reaction conditions were: 25 nM DNA, 50 nMEcoP15I, 4 mM ATP and 2.5 �M heparin in Buffer R.
Downloaded from https://academic.oup.com/nar/article-abstract/43/22/10870/1803720by gueston 15 March 2018

Nucleic Acids Research, 2015, Vol. 43, No. 22 10873
Figure 2. ATPase kinetics of EcoPI on a specific oligoduplex. (A) EcoPI specific oligoduplex substrate (6/38 PI) used here. Arrowheads indicate the sitesof cleavage. (B) Preformed EcoPI–oligoduplex complex (25 nM) was rapidly mixed with 4 mM ATP and 200 �M heparin, and the release of phosphatemeasured (Materials and Methods). Rebinding to the DNA was prevented by the heparin trap. The data was deconvoluted as described in Materials andMethods (4) and shown in Supplementary Figure S1B–D. The grey trace represents the measured unprocessed data from which the steady state correctedtrace (red line) is derived by subtracting a linear function (dashed line) fitted to the later stages of the grey trace. The corrected data (red) was fitted to Eq.(2) (dotted line). We can visualize the theoretical first burst phase (blue) by subtracting the exponential function from the corrected profile. (C) Kineticconstants determined for EcoPI on 6/38 PI and EcoP15I on 6/38 P15I. The number of ATPs consumed in the first and second bursts phases were obtainedfrom the A1 and A2 values, respectively, from fits to Eq. (1). The first burst phase ATPase rate was obtained using a linear fit to the initial part of the burst(Supplementary Figure S1D). The ATPase rate of the second phase was calculated using Eq. (2). Averages and standard deviations were calculated fromat least two repeats. (D) Measurement of EcoPI conformation change by tryptophan fluorescence measured in a stopped flow fluorimeter (Materials andMethods). The effect of DNA association was measured by mixing EcoPI with 6/38 PI (grey). The effect of DNA dissociation was measured by mixingpre-formed EcoPI–oligoduplex with ATP (black). Final reaction conditions were 1 �M DNA, 250 nM EcoPI, 4 mM ATP and 500 �M heparin. (E)Comparison of the complete (red) and burst (blue) ATPase profiles from panel B with the tryptophan fluorescence changes (black) from panel D.
Surface plasmon resonance assay
SPR experiments were carried out on a Biacore T200 in-strument (GE Healthcare) using streptavidin coated SeriesS sensor SA chips (BR-1005–31), at a data collection rate of10 Hz. Biotin-labelled DNA (89/206Bio P15I) was immo-bilized onto the surface by injection of 20–50 nM DNA inBuffer R+ supplemented with 0.5 M NaCl and using BufferR supplemented with 0.05% (v/v) Tween 20 as the runningbuffer, at a flow rate of 5 �l/min for 20–25 min. An in-series control channel without DNA immobilized was usedfor background correction in case any enzyme bound tothe dextran matrix non-specifically, and also for subtract-ing any bulk refractive index change during nucleotide/saltinjections.
Experiments were performed at 25 ± 0.1◦C using BufferR+ as the running buffer. To prevent problems with BSAprecipitation, an in-line filter was used on the buffer inlet
and the buffer changed after 4 h use. For the associationphases, 10–25 nM EcoP15I in running buffer was injectedfor 120 s at 30 �l/min. In end-capping experiments, 20 nMAddAHB was co-injected with the Type III enzyme. Fol-lowing protein-DNA association, non-specific complexeswere allowed to dissociate in running buffer. Once a steady-state level of binding was reached, 4 mM nucleotides or nu-cleotide analogs (ATP, ADP or AMP-PNP) were injected at30 �l/min in running buffer. Where indicated, 2.5 �M hep-arin was added to act as a trap for dissociated enzyme. Forthe short ATP-pulse experiments in Figure 7, the injectionrate was increased to 100 �l/min. After each experimentalcycle, the surface was regenerated using an injection of 1 MNaCl. Traces are averages of three repeats, except for thedata in Figures 5B, 7B and E where single measurementsare shown. Data was analysed by fitting the traces to singleexponential decay functions using GraphPad Prism (4).
Downloaded from https://academic.oup.com/nar/article-abstract/43/22/10870/1803720by gueston 15 March 2018

10874 Nucleic Acids Research, 2015, Vol. 43, No. 22
Figure 3. EcoP15I ATPase kinetics using longer DNA substrates. (A) Cartoons of the oligoduplex and longer DNA substrates. Biotin is represented asa red circle. (B) Preformed EcoP15I–DNA complexes (25 nM) as indicated were rapidly mixed with 4 mM ATP and 200 �M heparin, and the release ofphosphate measured (Materials and Methods). Rebinding to the DNA was prevented by a heparin trap. (C) Fitting of the uncorrected ATPase profiles toEq. (3) (upper graphs) and the residual differences between the experimental data and fits (lower graphs). Note that the residual plots are presented witha logarithmic time base to clearly show the deviations across three time decades. (D) Kinetic constants determined for the longer DNA substrates. Kineticvalues for the first and second burst phases of the 206/38 P15I and 6/206 P15I profiles were determined using deconvolution as in Figure 2. Second phasekinetics could not be readily deconvoluted for 89/206Bio P15I or 206/206 P15I (n.d. = not determined). Numbers of ATPs consumed were determinedusing Eq. (3). ATPase rates were determined using a linear fit (not shown). Averages and standard deviations were calculated from three repeats.
RESULTS AND DISCUSSION
EcoPI has a two phase ATPase cycle on an oligoduplex sim-ilar to that seen with EcoP15I, but with different apparentefficiencies in ATP coupling
To explore whether the EcoP15I-DNA interaction was un-usual in generating a dual phase ATPase profile, we first in-vestigated the activity of EcoPI on an oligoduplex substratewith the same up- and downstream DNA sequence (Figure2A). EcoPI is homologous to EcoP15I; the Res subunits(containing the helicase-like and nuclease domains) share∼90% identity whilst the Mod subunits (containing themethyltransferase and DNA target recognition domains)share >60% identity (with most differences being between
the Target Recognition Domains - TRDs) (12). Despite thesimilarities at the sequence level we and others have notedsome differences in enzyme properties (9,13–16). We anal-ysed EcoPI using millisecond time resolution stopped flowassays previously applied to EcoP15I (4): ATPase activitywas measured using a fluorescent phosphate binding pro-tein; changes in protein conformation were monitored usingtryptophan fluorescence (Materials and Methods). Bindingand dissociation of EcoP15I from its oligoduplex was pre-viously measured using a fluorescence anisotropy assay (4).Unfortunately, we were unable to obtain a measurable sig-nal change with this assay using EcoPI.
The ATPase reactions were initiated by rapidly mixing apre-incubated, saturated EcoPI–oligoduplex complex with
Downloaded from https://academic.oup.com/nar/article-abstract/43/22/10870/1803720by gueston 15 March 2018
Nucleic Acids Research, 2015, Vol. 43, No. 22 10875
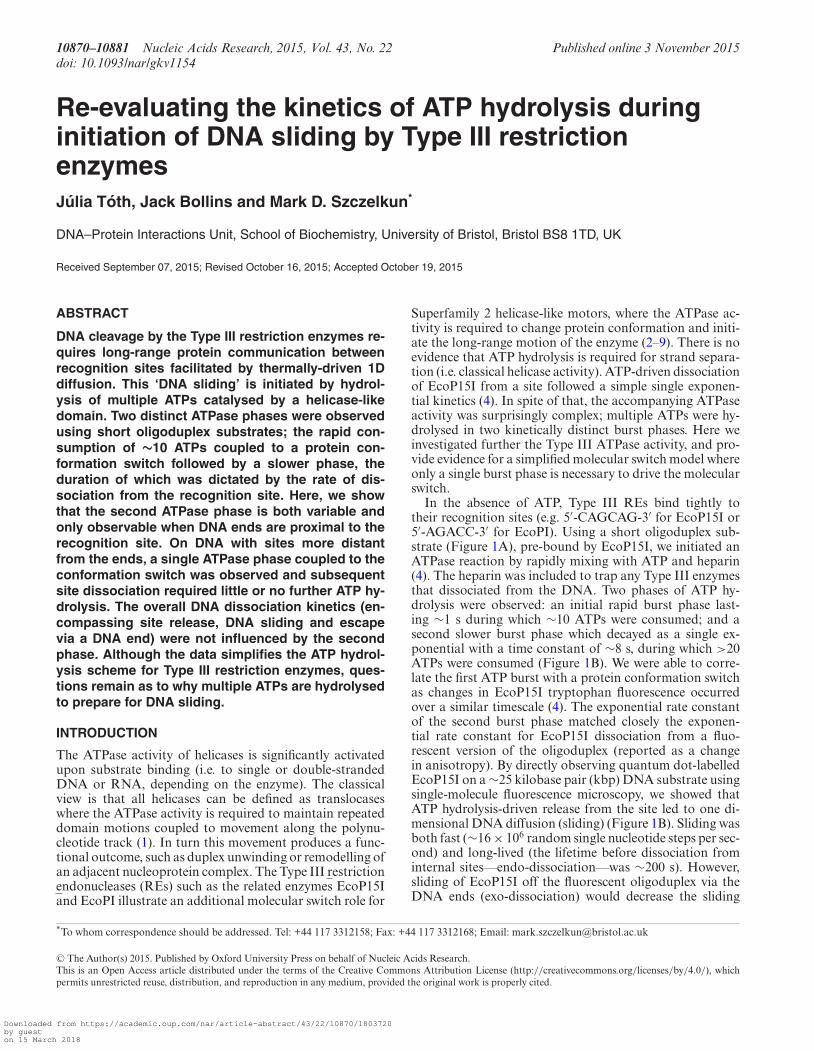
Figure 4. The ATPase burst kinetics match the change in tryptophan fluo-rescence measured using a longer DNA substrate. Comparison of the com-plete ATPase profile (black) from Figure 3C with the tryptophan fluores-cence change observed during EcoP15I dissociation from 206/206 P15I(grey). For the tryptophan fluorescence experiment, final reaction condi-tions were 25 nM 206/206 P15I, 50 nM EcoP15I, 4 mM ATP and 2.5 �Mheparin.
ATP and heparin (the latter as a trap to capture dissoci-ated enzymes and thus create single turnover kinetic con-ditions with respect to DNA binding). Incomplete trap-ping and DNA rebinding results in a linear steady-state ratewhich needed to be corrected before further analysis (Sup-plementary Figure S1B). The kinetics can be deconvolutedinto a rapid burst phase and a slower exponential burstphase (Materials and Methods). The corrected phosphaterelease profile shows clear evidence for two kinetics phasesanalogous to those seen previously with EcoP15I (Figure2B). The amplitudes of the first and second bursts––howmuch ATP is consumed during those states––could be esti-mated from the ordinate intercept and amplitude of the ex-ponential phase, respectively (Eq. (1), Supplementary Fig-ure S1C). The rate constant gave a measure of the lifetimeof the state (before it switches to DNA sliding). Therefore, alinear ATPase rate for the second phase could be estimatedbased on the lifetime and the number of ATPs consumedduring the lifetime (Eq. (2)). Note that the observed rate isactually decaying as the enzyme dissociates from its recog-nition site. The ATPase rate of the first phase was estimatedby a linear fit (Supplementary Figure S1D).
The rate and amplitude of the first EcoPI burst phasewere very similar to values seen with EcoP15I (Figure 2C).We also found that the kinetics of the EcoPI conforma-tion change as measured by tryptophan fluorescence (Fig-ure 2D) showed a close correspondence with the kinetics ofthe first burst (Figure 2E), as seen for EcoP15I (4). How-ever, the kinetics of the second phases were quite different,with EcoPI consuming a third as much ATP at a five-foldslower rate.
We showed previously for EcoP15I that the rate of theexponential, second burst phase corresponded to the rate-limiting dissociation from the DNA (which given the rapid1D sliding and short DNA length corresponded to the timeto escape from the site) (4). Although we could not measurethe dissociation kinetics of EcoPI directly, we could use the
exponential, second burst phase of the EcoPI ATPase pro-file to infer that the lifetime at the site is ∼11.5 s, which isalmost twice that of EcoP15I (Figure 2C). This is surprisingas previous results suggest that EcoPI is more weakly boundthan EcoP15I (9). The slower dissociation could be due tothe slower observed ATPase rate. Nonetheless, the differ-ence between EcoPI and EcoP15I in the number of ATPsconsumed in the second burst phase would imply that thisstage in the process does not require a fixed number of cou-pled ATP hydrolysis steps.
The kinetics of ATP hydrolysis by EcoP15I is influenced bythe proximity of DNA ends to the site
In the previous EcoP15I experiments, we chose to use ashort oligoduplex substrate (Figure 1A) so that we couldreadily compare the ATPase and tryptophan fluorescencedata with an anisotropy-based DNA dissociation assay (4).To examine if the DNA length was affecting the observedenzyme activity, we measured the EcoP15I ATPase kineticsusing longer linear DNA (Figure 3A), where the site waseither located centrally (206/206 P15I), or at distal posi-tions where either the upstream DNA length (6/206 P15I)or downstream DNA length (206/38 P15I) matched thosein the oligoduplex (6/38 EcoP15I, Figure 1A). Addition-ally, we tested a DNA substrate used subsequently in theSPR assay (89/206Bio P15I - see below). The ends of theDNA were left free of protein roadblocks (i.e. ‘uncapped’),so that sliding enzymes could dissociate and be trapped byheparin, so giving single turnover burst kinetics.
The phosphate release profiles clearly show that proxi-mal DNA ends affect the ATPase kinetics (Figure 3B-D).The profile for 206/38 P15I was clearly biphasic and simi-lar to that observed with 6/38 P15I (4), albeit with appar-ent differences in rates/amplitudes (Figures 2C and 3D). Incontrast, both 206/206 P15I and 89/206Bio P15I showedATPase reaction profiles that differed in appearance to theclear biphasic profiles of 6/38 P15I and 206/38 P15I. The6/206 P15I DNA showed an intermediate profile, where asecond phase was noticeably smaller than with 206/38 P15Ibut still more visibly present than the DNA with morecentrally-located sites. It therefore appeared that the loca-tion of DNA ends both up- and downstream of the EcoP15Isite in the oligoduplex could influence the shape of the ob-served ATPase profiles.
For 6/206 P15I and 206/38 P15I, where the reactionprofile could be clearly split into two phases, we wereable to apply the same deconvolution process as above(Materials and Methods). However, for 206/206 P15I and89/206Bio P15I, we were unable to identify and fit satis-factorily a second burst phase. To compare the differentprofiles, we attempted to fit the uncorrected data directlyto a single exponential plus steady state linear (to accountfor a low steady state which likely reflects DNA rebindingdue to the leakage from the heparin trap––Eq. (3), Mate-rials and Methods) (Figure 3C). For the 6/206 P15I and206/38 P15I profiles, plots of the residual differences be-tween the fitted and experimental data showed clear sys-tematic deviations, particularly during the first burst phase.The deviations were largest for 6/206 P15I which is moreplainly biphasic. For 206/206 P15I and 89/206Bio P15I we
Downloaded from https://academic.oup.com/nar/article-abstract/43/22/10870/1803720by gueston 15 March 2018

10876 Nucleic Acids Research, 2015, Vol. 43, No. 22
still observed systematic deviations but these were smallerthan the other substrates. Since we could not use the decon-volution process for these DNA, we used the amplitude ofthe exponential fit to estimate ATP consumption. The ini-tial ATPase rate was estimated from a linear fit, as above(Materials and Methods).
The amplitudes and rates determined for the longer DNAare compared in Figure 3D. The observed rates of the firstburst phases were similar for all the DNA, but with an el-evated burst amplitude where the DNA ends were moredistantly located from the site. In contrast, the ATPaserates and amplitudes of the second burst phase varied no-ticeably with the position of the site. For 6/206 P15I and206/38 P15I, the rates of the second burst phase exponen-tial were similar to that measured for the oligoduplex (Fig-ures 2C and 3D). We could interpret this as showing that therate of change from an ATP hydrolysing state at the site toa non-hydrolysing sliding state is similar on all these DNA.However, the number of ATPs consumed during this pro-cess varies from ∼13 to ∼5, dependent upon proximity ofDNA ends. For 206/206 P15I and 89/206Bio P15I we con-sidered the rates and amplitudes of the second phases asnominally zero in Figure 3D, although we note that we can-not completely exclude the hydrolysis of one or two ATPsafter the first phase due to detection limits in our assay.Being distant from a DNA end largely eliminates the con-sumption of ATP in the second phase. Despite not havinga measurable second ATPase burst, we demonstrate belowthat dissociation is as rapid on 89/206Bio P15I as on theoligoduplex. For the same reason we do not consider thelinear steady-state phase as representing a slow second ATPphase associated with slow DNA dissociation.
We also measured the change in EcoP15I tryptophan flu-orescence using 206/206 as a substrate (Figure 4). The ki-netics correlate closely with the first ATPase burst, as seenpreviously using the oligoduplex substrate (4). These datasuggest that the single phase of ATPase activity seen on206/206 P15I and 89/206Bio P15I is sufficient to generateand maintain the conformational change. It appears thatATP hydrolysis following the conformation change is onlyobserved when a downstream DNA end is proximal to therecognition site.
A surface plasmon resonance assay to measure dissociationof EcoP15I from uncapped and capped DNA
To correlate the ATPase and conformation change kinet-ics in Figures 3 and 4 with initiation of DNA sliding, wedeveloped an assay to follow DNA association and disso-ciation compatible with longer DNA substrates (Materi-als and Methods). We used an SPR-based assay which al-lows dissociation from DNA bound to the chip surface (viaa biotin–streptavidin linkage) to be followed in real timeand which also allows rapid exchange of buffer components(Figure 5A) (17,18). Reactions were corrected for back-ground binding using an in-series reference surface withoutDNA (Materials and Methods). Compared to the oligodu-plex anisotropy assay (4), the SPR assay has the advan-tage that we can monitor linear DNA of longer lengths andthat we can readily cap the free end of the DNA to ob-serve the effect of only allowing endo-dissociation. A DNA
Figure 5. The surface plasmon resonance assay to measure DNA associ-ation and dissociation by Type III restriction-modification enzymes. (A)Cartoon of the steps in the assay. The DNA used was 89/206Bio P15I. (B)Representative changes in response units (RU) during protein associationand dissociation. Coloured blocks show the continuous injection of theenzymes (grey), ATP (4 mM, red) or NaCl (green).
substrate with a single EcoP15I site (89/206Bio P15I) wasmade by PCR using one primer labelled with biotin (Fig-ure 3A) (Materials and Methods). Binding of the DNAto the streptavidin/dextran surface of the chip caps oneend of the DNA, preventing dissociation during slidingvia this end; the opposite end was either uncapped orcapped with a protein (see below). Following the initia-tion of sliding by ATP hydrolysis, exo-dissociation from un-capped 89/206Bio P15I would take <3 ms (4,10). There-fore, we can still use the rate of DNA dissociation via anend as a proxy for the rate of site release into the slid-ing. In other words, any observed differences between thedissociation rates from 6/38 P15I compared to uncapped89/206Bio P15I would reflect different events at the site,rather than differences in sliding lifetime.
Downloaded from https://academic.oup.com/nar/article-abstract/43/22/10870/1803720by gueston 15 March 2018
Nucleic Acids Research, 2015, Vol. 43, No. 22 10877
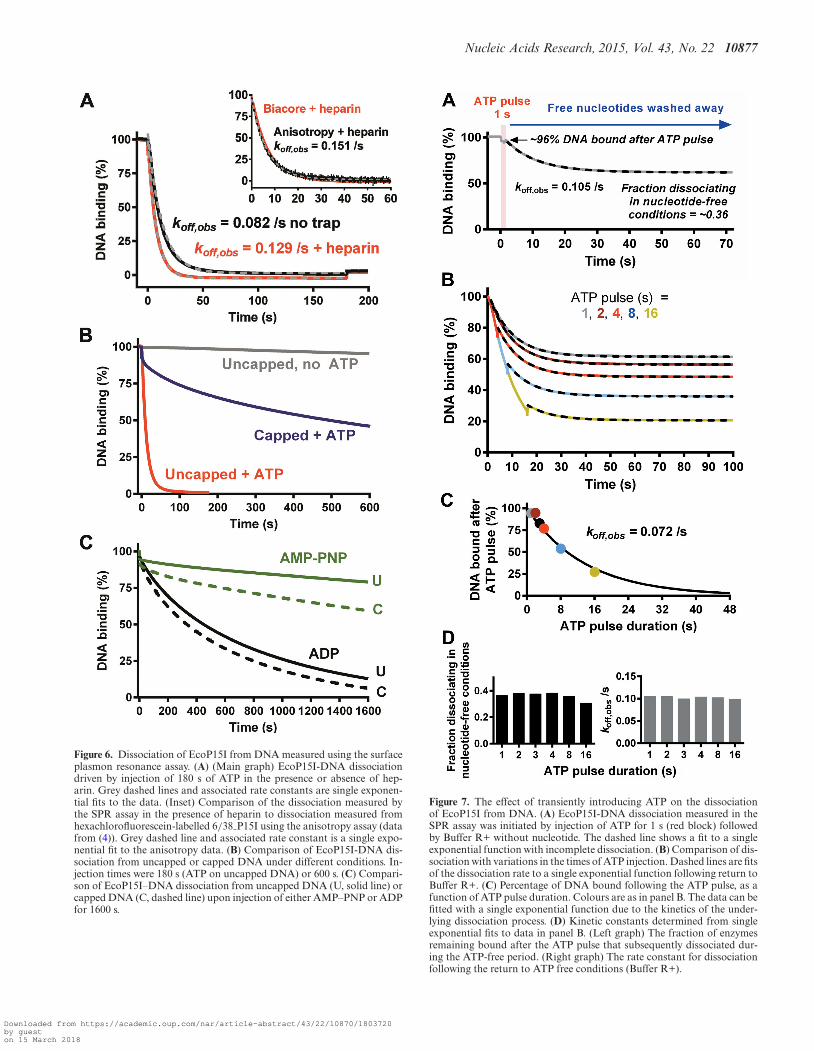
Figure 6. Dissociation of EcoP15I from DNA measured using the surfaceplasmon resonance assay. (A) (Main graph) EcoP15I-DNA dissociationdriven by injection of 180 s of ATP in the presence or absence of hep-arin. Grey dashed lines and associated rate constants are single exponen-tial fits to the data. (Inset) Comparison of the dissociation measured bythe SPR assay in the presence of heparin to dissociation measured fromhexachlorofluorescein-labelled 6/38 P15I using the anisotropy assay (datafrom (4)). Grey dashed line and associated rate constant is a single expo-nential fit to the anisotropy data. (B) Comparison of EcoP15I-DNA dis-sociation from uncapped or capped DNA under different conditions. In-jection times were 180 s (ATP on uncapped DNA) or 600 s. (C) Compari-son of EcoP15I–DNA dissociation from uncapped DNA (U, solid line) orcapped DNA (C, dashed line) upon injection of either AMP–PNP or ADPfor 1600 s.
Figure 7. The effect of transiently introducing ATP on the dissociationof EcoP15I from DNA. (A) EcoP15I-DNA dissociation measured in theSPR assay was initiated by injection of ATP for 1 s (red block) followedby Buffer R+ without nucleotide. The dashed line shows a fit to a singleexponential function with incomplete dissociation. (B) Comparison of dis-sociation with variations in the times of ATP injection. Dashed lines are fitsof the dissociation rate to a single exponential function following return toBuffer R+. (C) Percentage of DNA bound following the ATP pulse, as afunction of ATP pulse duration. Colours are as in panel B. The data can befitted with a single exponential function due to the kinetics of the under-lying dissociation process. (D) Kinetic constants determined from singleexponential fits to data in panel B. (Left graph) The fraction of enzymesremaining bound after the ATP pulse that subsequently dissociated dur-ing the ATP-free period. (Right graph) The rate constant for dissociationfollowing the return to ATP free conditions (Buffer R+).
Downloaded from https://academic.oup.com/nar/article-abstract/43/22/10870/1803720by gueston 15 March 2018
10878 Nucleic Acids Research, 2015, Vol. 43, No. 22
In a typical experiment (Figure 5A, upper panel), enzymewas injected over the chip to bind the DNA. Buffer flow wascontinuous, allowing dissociation and equilibration of bind-ing to a steady-state. Following a wash step, dissociation isthen initiated by injection of nucleotides such as ATP (at4 mM). Finally, the DNA-chip is regenerated using NaCland further experiments can be made. To measure dissoci-ation from capped DNA (Figure 5A, lower panel), we alsoincluded a helicase mutant of the end-processing enzymeAddAB (AddAHB), in which the Walker A motif of AddAhas been mutated (K36A) to prevent ATP hydrolysis (Ma-terials and Methods) (11,19). AddAHB binds tightly andspecifically to DNA ends and is unaffected by ATP (11,19).Dissociation of EcoP15I from this DNA must be via endo-dissociation.
Representative raw SPR profiles plotted as response unitsversus time are shown in Figure 5B (attempts to repeat sim-ilar assays using EcoPI were unsuccessful due to increasedbackground noise and low response signal):
(i) EcoP15I association and dissociation from uncappedDNA. Injection of EcoP15I caused an increase in re-sponse units corresponding to specific DNA bindingat the recognition site. The protein–DNA complexformed was relatively stable over the time course of thereaction. Subsequent injection of 4 mM ATP for 180 scaused rapid and near-complete dissociation from theDNA within ∼60 s. Addition of the nucleotide causeda reproducible refractive index shift in the responseunits, suggesting a difference in background responsefor the reference and reaction surfaces. Enzymes thatremained associated with the DNA and/or chip wereremoved by the salt wash, allowing the reaction to berepeated (again, note the observed drop in responseunits during salt injection due to a refractive index cor-rection anomaly).
(ii) Stable binding of AddAHB to DNA in the presence ofATP. Injection of AddAHB caused an increase in re-sponse units corresponding to DNA binding. A smallburst of dissociation leading to a steady state was ob-served following the switch to buffer alone. Althoughinjection of ATP resulted in a refractive index shift, fol-lowing the switch back to buffer, the level of AddAHBbinding was near constant. AddAHB association withthe DNA could be subsequently reversed by the saltwash.
(iii) EcoP15I association and dissociation from cappedDNA. Simultaneous injection of EcoP15I andAddAHB caused an elevated increase in responseunits corresponding to DNA binding by both en-zymes (and equivalent to the sum of response unitchanges for consecutive enzyme injections). Followingswitch to running buffer, a small re-equilibration wasobserved due to AddAHB dissociation. Subsequentinjection of ATP caused significantly slower proteindissociation from the DNA, consistent with slowerendo-dissociation of EcoP15I (4,20). The actualpercentage of DNA bound could be corrected bysubtracting the response units corresponding toAddAHB. Any enzymes remaining bound at the end ofthe reaction could be dissociated using the salt wash.
The dissociation profile from uncapped DNA measuredusing the SPR assay could be fitted to a single exponen-tial decay, with a rate constant of ∼0.08/s (Figure 6A).This value appeared slower than that measured using theanisotropy assay (∼0.15/s) (4). As one of the binding part-ners has to be immobilized, SPR measurements can be af-fected by the mass transfer effect (21–23). To bind the im-mobilized ligand, the analyte firstly has to transfer frombulk solution to the chip surface via diffusion and convec-tion. Where this transfer is slower than the analyte-ligandassociation rate, and the dissociation rate is slow, the so-lution near the interaction surface can become depleted offree analyte. This can limit both the observed on- and offrates. To test if our measurements were affected by masstransfer, we measured EcoP15I dissociation at flow rates be-tween 5–100 �l/min (data not shown). Mass transfer is in-fluenced by the flow rate whereas the intrinsic reaction rateis not. For all the measurements in this work, we applieda flow rate of 30 �l/min where the off rate became satu-rated. In addition, we reasoned that the observed rate maybe slower because following ATP addition and DNA disso-ciation, enzymes were re-associating with the immobilizedDNA. To counter this, we added heparin in the runningbuffer to trap dissociated enzyme. Accordingly, the dissoci-ation observed had a single exponential rate very similar tothat from the anisotropy assay (Figure 6A). Unfortunately,we found that addition of the heparin trap caused signifi-cant problems in run-to-run reproducibility. Subsequent re-actions were therefore undertaken without heparin unlessstated and thus must be compared to the slower apparentdissociation rate.
The similarity in the dissociation kinetics between longand short DNA (Figure 6A) rules out that the observeddifferences between the kinetic parameters of the secondATPase burst in Figures 2C and 3D are correlated withchanges in the rate of dissociation. i.e. the kinetics of siterelease are the same for both DNA. Instead it would appearthat the second phase of ATP hydrolysis is completely de-coupled from the dissociation process, and may just be anartefact of the proximity of DNA ends in the oligoduplex(see Discussion).
We measured the dissociation from uncapped and cappedDNA with a range of nucleotides (Figure 6B and C) asbefore (4). With ATP, dissociation from the capped DNAshowed a small rapid burst, followed by a slow dissocia-tion with a half-life in excess of 600 s. Single molecule andensemble assays have suggested an endo-dissociation life-time for EcoP15I and EcoPI of ∼200 s (4,20). The longerlifetime observed here most likely reflects mass-transport-dependent rebinding events in the absence of heparin. Thesmall rapid burst may be due to a subset of enzymes that dis-sociate directly from the site in an ATP-dependent manner.ATP-dependent direct dissociation without extensive DNAsliding was also observed in the single molecule assay (4).
Injection of either ADP or the non-hydrolysable ATPanalogue AMP–PNP produced dissociation kinetics simi-lar to those observed previously with the anisotropy assayand using oligoduplex 6/38 P15I (Figure 6C) (4). The kinet-ics on the capped and uncapped DNAs were similar in eachcase, suggesting that endo-dissociation events predominatewith these nucleotides. For AMP-PNP this is most likely
Downloaded from https://academic.oup.com/nar/article-abstract/43/22/10870/1803720by gueston 15 March 2018

Nucleic Acids Research, 2015, Vol. 43, No. 22 10879
because sliding does not occur and dissociation occurs di-rectly from the site. In contrast, ADP can support long-lived DNA sliding (4). Although ADP-sliding is slower thanATP-sliding (∼0.5 × 10⁶ random single nucleotide stepsper second), EcoP15I should still have reached the end ofuncapped 89/206Bio P15I within tens of milliseconds. Theslow dissociation observed may be because the ADP slidingstate binds tightly to DNA ends, favouring exit by endo-dissociation with a rate similar to capped DNA.
One second of ATP hydrolysis is sufficient for DNA dissoci-ation over at least 20 seconds
Since the SPR assay was conducted under continuous flowconditions, it allowed us to transiently introduce a reagentand then wash it away almost instantaneously with reactionbuffer. The initial ATPase phase and conformational switchis completed in ∼1 s (Figures 2E, 3B and 4) (4). Within thelimits of the Biacore T200 instrument, ATP can also be in-jected down to an incubation time of ∼1 s (Materials andMethods). Therefore, we could transiently introduce ATPto allow the majority of the first phase to be completed, in-stantaneously switch to running buffer without ATP to pre-vent any further ATP turnover, and observe the effect ondissociation. This modified assay also tested whether slid-ing requires ATP hydrolysis, as rapid dissociation from thesurface-bound uncapped DNA required that the enzymetravelled by 1D diffusion to the single free DNA end (us-ing millions of randomized single base pair steps).
The dissociation from uncapped DNA induced by a 1 spulse of ATP followed by nucleotide-free buffer is shown inFigure 7A. Dissociation during the 1s pulse is masked by therefractive index anomaly (see above), but can be measuredfrom the percentage of binding following the switch to re-action buffer. Although <4% of enzymes dissociated duringthe ATP pulse, a further third of the enzymes released fromtheir DNA during the nucleotide-free phase. The dissoci-ation in the absence of ATP followed a single exponential(dashed fitted line in Figure 7A), with a rate constant sim-ilar to that in the presence of ATP (Figure 6A). Thereforedissociation can continue at the same rate despite the ab-sence of ATP.
The reaction was repeated with varying ATP pulse times(Figure 7B). Although the dissociation profiles during the4, 8 or 16 s ATP pulses could be directly fitted to an expo-nential, and clearly overlay one another in Figure 7B, dis-sociation during the shorter pulses was too low to fit accu-rately (data not shown). Instead we plotted the percentageof DNA bound immediately after each ATP pulse againstthe pulse duration time (Figure 7C). The combined datafollows a single exponential decay with a kinetic constantconsistent with the expected rate of dissociation. Thereforechanging the pulse time has not affected the observed dis-sociation kinetics in the presence of ATP.
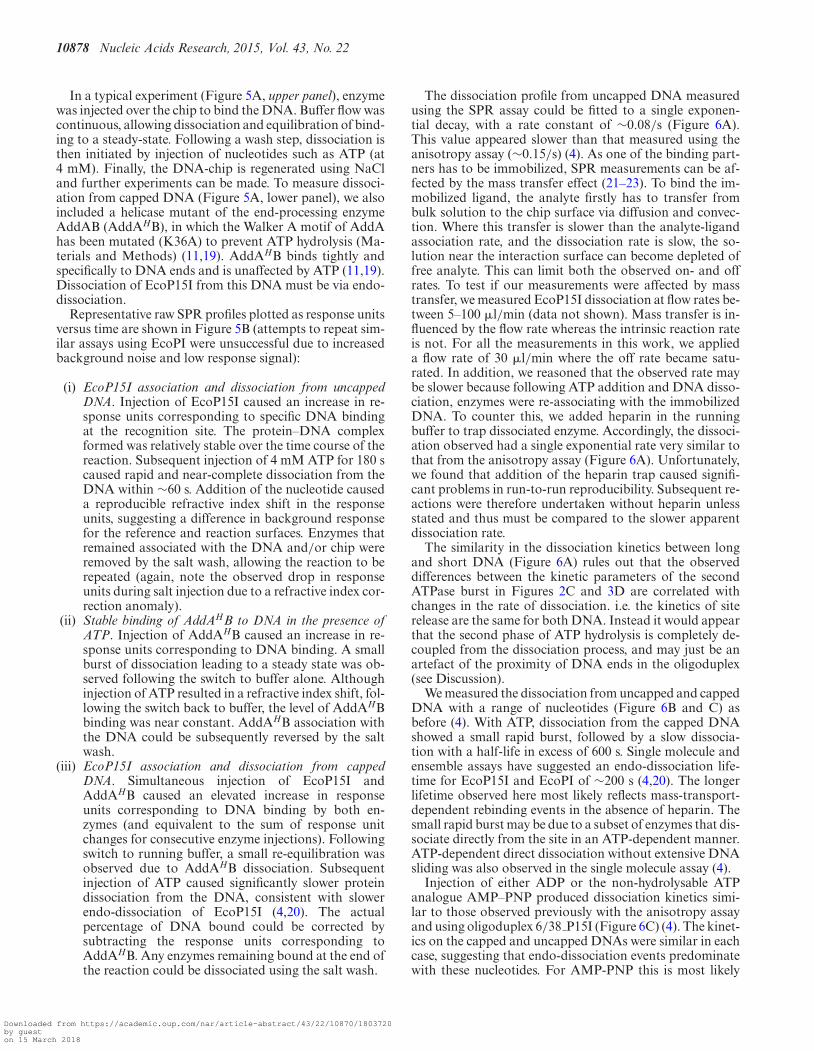
The dissociation profiles in nucleotide-free conditions fol-lowing each ATP pulse were individually fitted to a singleexponential decay (dotted lines in Figure 7A). The ampli-tudes and rate constants of the fits are presented in Figure7D. Regardless of the ATP exposure time, EcoP15I contin-ued to dissociate from the DNA at much the same rate onceATP was removed. As noted above for the 1 s pulse, the
rate of dissociation in nucleotide-free conditions was verysimilar to that observed when ATP was available through-out the dissociation process. The small relative decrease inthe fraction of enzymes that dissociated following the 16s pulse suggested that enzymes that remain bound to theDNA for longer times in the presence of ATP may have agreater chance of entering an irreversibly inhibited state.
In the above experiments, dissociation did not go to com-pletion. One reason could have been recognition site re-binding during the sliding process. Rebinding was first ob-served in single molecule experiments (4). The events werereversible, but ATP was present throughout these reactions.If ATP binding and/or hydrolysis were required to escapethe rebound state and return to sliding, then the lack ofavailable ATP following the pulses in Figure 7 may have pre-vented a return to the sliding state. An alternative reasonfor incomplete dissociation is that following release fromthe original DNA, mass-transport caused binding to newDNA. This may have been inefficient as we have evidencethat EcoP15I enzymes released from a DNA end are in astructural state that cannot associate with DNA and thatthis state has a lifetime of tens of seconds (4). To explorethe incomplete dissociation further, we observed the effectsof repeated pulses of one second of ATP interspersed withrunning buffer (Figure 8A).
Consecutive dissociation bursts could be initiated withsimilar single exponential rate constants each time (Figure8B, left panel). This suggests that at least a subset of the en-zymes have rebound to a site (either on the original DNA oron a new DNA) and dissociation can be re-initiated by theintroduction of ATP. The fraction of enzymes dissociatingdropped with each successive injection however (Figure 8B,right panel), suggesting that some of the enzymes accumu-lated in an irreversibly inhibited state, either on the DNAor on the surface. This inhibition does not appear to followa simple single exponential relationship with time. To testif the binding of other nucleotides could re-start sliding bythe rebound enzymes, we introduced a 1 s pulse of ATP, al-lowed equilibration to a steady state, and then followed with180 s pulses of AMP–PNP and ADP (Figure 8C). Each nu-cleotide produced dissociation kinetics similar to that seenfor EcoP15I bound to DNA without having seen ATP (Fig-ure 6C). For both nucleotides, the dissociation stopped assoon as the injection finished. A second 1 s pulse of ATPproduced the expected dissociation kinetics (Figure 8C).
CONCLUSIONS
We previously measured a dual ATPase cycle during the ini-tiation of sliding by EcoP15I on a short oligoduplex (4). Weshow here that this is not a unique feature of EcoP15I sinceEcoPI also had a dual ATPase cycle on an oligoduplex al-beit with different kinetics for the second burst phase. How-ever, we also demonstrate that the amplitude and rate of thesecond ATPase phase is dependent upon the nature of theDNA substrate and, most likely, dispensable for the initialinitiation of sliding. Although we cannot completely ruleout that a few ATPs are hydrolysed in a second phase, wedisfavour the models in Figure 1. Instead we suggest that theinitiation of DNA sliding by Type III RM enzymes requiresa single phase during which multiple ATPs are hydrolysed
Downloaded from https://academic.oup.com/nar/article-abstract/43/22/10870/1803720by gueston 15 March 2018
10880 Nucleic Acids Research, 2015, Vol. 43, No. 22
Figure 8. The effect of consecutive nucleotide additions on DNA associ-ation and dissociation by EcoP15I. (A) EcoP15I-DNA dissociation mea-sured in the SPR assay was initiated by consecutive injections of ATP for1 s (arrows) followed in each case by Buffer R+ without nucleotide. (B)Kinetic constants are shown from fits of the EcoP15I–DNA dissociationprofiles following each ATP pulse in panel A to an offset single exponentialfunction. The change in the amplitude as a function of total reaction timeappears approximately linear. (C) EcoP15I–DNA dissociation measuredin the SPR assay was initiated by consecutive injections of: ATP for 1 s(arrow) followed by Buffer R+; AMP–PNP for 180 s (grey block) followedby Buffer R+; ADP for 180 s (grey block) followed by Buffer R+; and, ATPfor 1 s (arrow) followed by Buffer R+. Kinetic rate constants and fractionalamplitudes are shown for the single exponential dissociation produced byeach ATP pulse.
leading to a conformation switch; further ATP hydrolysis isnot necessary for the switch, for dissociation from the siteor for the sliding process.
The second phase of ATP hydrolysis seen with oligodu-plexes, both here and previously (4), appears to be due tothe presence of DNA ends in proximity to the complex. Re-cently Gupta et al. published the co-crystal structure of aRes1Mod2 heterotrimer of EcoP15I bound to its specificrecognition site on a DNA with 3 bp upstream and 11 bpdownstream (24). It is possible that extending the upstream
DNA by 3 bp will allow an interaction with the ModB sub-unit via its TRD, which is swung away from the DNA inthe structure (the TRD of ModA making all the specificrecognition contacts at the site). However, the upstream endhad a rather modest effect in producing an extended secondphase compared to proximity of the downstream end. Sur-prisingly, on the 6/38 oligoduplexes and the longer 206/38DNA, the downstream end is 11 bp from the nearest cutsite, where the nuclease domain must bind, and is ∼27 bpaway from where the helicase-like domains interact. Sincethe nuclease domain is not fully resolved in the structure(24), we cannot confidently speculate on where or how theinteraction may occur. It is possible, for example, that theDNA wraps around the nuclease domain so that the down-stream end interacts with the complex despite being almostfour DNA turns from the site. We suggest that while futurestudies of Type III enzymes could empirically determine theeffect of local DNA ends, a more simple solution will be touse DNA substrates where the Type III sites are placed suf-ficiently far away from the ends that they do not influencethe kinetics.
Consistent with the necessity for only a single burst ofATP hydrolysis and with a sliding state that does not con-sume ATP, DNA dissociation in the SPR assay continuedfor up to sixty seconds after a one second pulse of ATP.However, compared to sliding in the continued presenceof ATP, dissociation was incomplete. The un-dissociatedproteins appear to return to their original recognition site-bound states, as inferred from the effects of subsequent ad-ditions of either ATP or other nucleotides. Fast dissocia-tion could be reinitiated by further ATP treatment but notby a non-hydrolysable ATP analogue, suggesting that an-other burst of ATP hydrolysis might be required. This con-trasts with previous data where the ATP hydrolysis kineticprofiles on capped and uncapped DNA were similar, sug-gesting that re-binding to the site observed directly by sin-gle molecule imaging does not induce significant hydrolysis(4). Continued ATP binding after the conformation switchmay play an important role in maintaining the sliding state,particularly when the enzyme re-visits a site. When ATP isremoved following the switch, the conformation may be ableto relax to a non-sliding state at the site, allowing essentiallyirreversible rebinding. The diffusion coefficient may also bealtered.
The EcoP15I-DNA structure was solved from crystalsgrown in the presence of AMP (24). Therefore, the pro-tein is likely to be in the pre-switch, non-sliding state. Itwas speculated that ATP hydrolysis causes a 40◦ rotationof the TRD of ModA so that it can release the recogni-tion site and directly contact the Pin domain of the C-terminal RecA fold of the helicase-like domain (RecA2).This would require rearrangement of the helicase-like do-main which may prevent further ATP hydrolysis. However,it is possible that ATP may still be able to bind in the cleftin a non-hydrolytic manner, to help maintain the TRD–pin interaction. We have also observed here, and previ-ously (4), variable effects of other nucleotides on dissocia-tion and formation of sliding conformations. These in turnmay reflect alternative arrangements of the helicase-like do-mains. It would be informative to solve the structures of al-ternative co-crystals: nucleotide-free, with ADP, with non-
Downloaded from https://academic.oup.com/nar/article-abstract/43/22/10870/1803720by gueston 15 March 2018
Nucleic Acids Research, 2015, Vol. 43, No. 22 10881
hydrolysable nucleotide analogues, and post-hydrolysis ofATP.
Although the data here simplifies the ATPase schemeof the Type III RM enzymes to a single catalytic burstof ATP hydrolysis, it still remains unclear why multipleATPs are consumed to produce the conformation changein the complex. Although other groups have presented datato support linear stepwise translocation over longer dis-tances (25–28), we have yet to find evidence for such move-ment during the initiation process or during long-rangecommunication itself (3,5,9,20). Instead we have speculatedthat the reason why multiple ATPs are consumed is dueto mechanochemical uncoupling (6), where the helicase re-leases ADP/phosphate before the conformational switchcan complete and another round of ATP binding/hydrolysismust take place to maintain the stressed state. The crystalstructure (24) now provides a framework to further inves-tigate the questions of why multiple ATPase cycles are re-quired, and of how the Res and Mod subunits rearrange toproduce a very efficient DNA sliding machine.
SUPPLEMENTARY DATA
Supplementary Data are available at NAR Online.
ACKNOWLEDGEMENTS
The authors thank Jasmina Dikic and Yogesh Gupta forcomments on the manuscript, and Sandra Greive for initialhelp with establishing the SPR assay.
FUNDING
Wellcome Trust Programme [084086]; NIH[1RO1GM111507-01]. Funding for open access charge:Wellcome Trust [084086 to M.D.S.].Conflict of interest statement. None declared.
REFERENCES1. Singleton,M.R., Dillingham,M.S. and Wigley,D.B. (2007) Structure
and mechanism of helicases and nucleic acid translocases. Annu. Rev.Biochem., 76, 23–50.
2. Peakman,L.J. and Szczelkun,M.D. (2004) DNA communications byType III restriction endonucleases–confirmation of 1D translocationover 3D looping. Nucleic Acids Res., 32, 4166–4174.
3. Ramanathan,S.P., van Aelst,K., Sears,A., Peakman,L.J., Diffin,F.M.,Szczelkun,M.D. and Seidel,R. (2009) Type III restriction enzymescommunicate in 1D without looping between their target sites. Proc.Natl. Acad. Sci. U. S. A., 106, 1748–1753.
4. Schwarz,F.W., Toth,J., van Aelst,K., Cui,G., Clausing,S.,Szczelkun,M.D. and Seidel,R. (2013) The helicase-like domains oftype III restriction enzymes trigger long-range diffusion along DNA.Science, 340, 353–356.
5. Schwarz,F.W., van Aelst,K., Toth,J., Seidel,R. and Szczelkun,M.D.(2011) DNA cleavage site selection by Type III restriction enzymesprovides evidence for head-on protein collisions following 1Dbidirectional motion. Nucleic Acids Res., 39, 8042–8051.
6. Seidel,R. and Szczelkun,M.D. (2013) Switching roles for a helicase.Cell cycle, 12, 3125–3126.
7. Szczelkun,M.D. (2013) Roles for helicases as ATP-dependentmolecular switches. Adv. Exp. Med. Biol., 767, 225–244.
8. Szczelkun,M.D. (2011) Translocation, switching and gating: potentialroles for ATP in long-range communication on DNA by Type IIIrestriction endonucleases. Biochem. Soc. Trans., 39, 589–594.
9. van Aelst,K., Toth,J., Ramanathan,S.P., Schwarz,F.W., Seidel,R. andSzczelkun,M.D. (2010) Type III restriction enzymes cleave DNA bylong-range interaction between sites in both head-to-head andtail-to-tail inverted repeat. Proc. Natl. Acad. Sci. U.S.A., 107,9123–9128.
10. Berg,H.C. (1993) Random Walks in Biology. Expanded edn.Princeton University Press, Princeton, N.J.
11. Yeeles,J.T. and Dillingham,M.S. (2007) A dual-nuclease mechanismfor DNA break processing by AddAB-type helicase-nucleases. J. Mol.Biol., 371, 66–78.
12. Roberts,R.J., Vincze,T., Posfai,J. and Macelis,D. (2015) REBASE–adatabase for DNA restriction and modification: enzymes, genes andgenomes. Nucleic Acids Res., 43, D298–299.
13. Moncke-Buchner,E., Rothenberg,M., Reich,S., Wagenfuhr,K.,Matsumura,H., Terauchi,R., Kruger,D.H. and Reuter,M. (2009)Functional characterization and modulation of the DNA cleavageefficiency of type III restriction endonuclease EcoP15I in itsinteraction with two sites in the DNA target. J. Mol. Biol., 387,1309–1319.
14. Peakman,L.J., Antognozzi,M., Bickle,T.A., Janscak,P. andSzczelkun,M.D. (2003) S-adenosyl methionine prevents promiscuousDNA cleavage by the EcoP1I type III restriction enzyme. J. Mol.Biol., 333, 321–335.
15. Peakman,L.J. and Szczelkun,M.D. (2009) S-adenosyl homocysteineand DNA ends stimulate promiscuous nuclease activities in the TypeIII restriction endonuclease EcoPI. Nucleic Acids Res., 37, 3934–3945.
16. Raghavendra,N.K. and Rao,D.N. (2005) Exogenous AdoMet and itsanalogue sinefungin differentially influence DNA cleavage byR.EcoP15I–usefulness in SAGE. Biochem. Biophys. Res. Commun.,334, 803–811.
17. Mendillo,M.L., Mazur,D.J. and Kolodner,R.D. (2005) Analysis ofthe interaction between the Saccharomyces cerevisiae MSH2-MSH6and MLH1-PMS1 complexes with DNA using a reversible DNAend-blocking system. J. Biol. Chem., 280, 22245–22257.
18. Fitzgerald,D.J., DeLuca,C., Berger,I., Gaillard,H., Sigrist,R.,Schimmele,K. and Richmond,T.J. (2004) Reaction cycle of the yeastIsw2 chromatin remodeling complex. EMBO J., 23, 3836–3843.
19. Yeeles,J.T., Gwynn,E.J., Webb,M.R. and Dillingham,M.S. (2011) TheAddAB helicase-nuclease catalyses rapid and processive DNAunwinding using a single Superfamily 1A motor domain. NucleicAcids Res., 39, 2271–2285.
20. Toth,J., van Aelst,K., Salmons,H. and Szczelkun,M.D. (2012)Dissociation from DNA of Type III restriction-modification enzymesduring helicase-dependent motion and following endonucleaseactivity. Nucleic Acids Res., 40, 6752–6764.
21. Schuck,P. (1997) Use of surface plasmon resonance to probe theequilibrium and dynamic aspects of interactions between biologicalmacromolecules. Annu. Rev. Biophys. Biomol. Struct., 26, 541–566.
22. Rich,R.L. and Myszka,D.G. (2011) Survey of the 2009 commercialoptical biosensor literature. J. Mol. Recognit., 24, 892–914.
23. Stockley,P.G. and Persson,B. (2009) Surface plasmon resonanceassays of DNA-protein interactions. Methods Mol. Biol., 543,653–669.
24. Gupta,Y.K., Chan,S.H., Xu,S.Y. and Aggarwal,A.K. (2015)Structural basis of asymmetric DNA methylation and ATP-triggeredlong-range diffusion by EcoP15I. Nat. Commun., 6, 7363.
25. Crampton,N., Roes,S., Dryden,D.T., Rao,D.N., Edwardson,J.M. andHenderson,R.M. (2007) DNA looping and translocation provide anoptimal cleavage mechanism for the type III restriction enzymes.EMBO J., 26, 3815–3825.
26. Crampton,N., Yokokawa,M., Dryden,D.T., Edwardson,J.M.,Rao,D.N., Takeyasu,K., Yoshimura,S.H. and Henderson,R.M.(2007) Fast-scan atomic force microscopy reveals that the type IIIrestriction enzyme EcoP15I is capable of DNA translocation andlooping. Proc. Natl. Acad. Sci. U.S.A., 104, 12755–12760.
27. Raghavendra,N.K. and Rao,D.N. (2004) Unidirectional translocationfrom recognition site and a necessary interaction with DNA end forcleavage by Type III restriction enzyme. Nucleic Acids Res., 32,5703–5711.
28. Reich,S., Gossl,I., Reuter,M., Rabe,J.P. and Kruger,D.H. (2004)Scanning force microscopy of DNA translocation by the Type IIIrestriction enzyme EcoP15I. J. Mol. Biol., 341, 337–343.
Downloaded from https://academic.oup.com/nar/article-abstract/43/22/10870/1803720by gueston 15 March 2018