re-examining the role of exports in
TRANSCRIPT

The Role of Exports in the Economy of Colonial North America:
New Estimates for the Middle Colonies
Peter C. Mancall (University of Southern California)
Joshua L. Rosenbloom (University of Kansas and NBER)
Thomas Weiss (University of Kansas and NBER)
Abstract
Economic historians of the eighteenth-century British mainland North American colonies have given considerable weight to the role of exports as a stimulus for economic growth. Yet their analyses have been handicapped by reliance on one or two time series to serve as indicators of broader changes rather than considering the export sector as a whole. Here we construct comprehensive export measures for the middle colonies. We find that aggregate exports did grow quickly but that this expansion failed to keep pace with population growth during much of the period under consideration. We argue this result challenges the export staples model on the role of foreign demand as a stimulus for economic growth. Instead, these results emphasize the impact of resource abundance and labor and capital scarcity as the defining characteristics of colonial economic growth. This research was funded in part by the National Science Foundation Grant SES-0317265.

1
Most interpretations of colonial economic growth lean heavily on the performance of
international exports. To some extent this comes out of necessity. “Almost the only data
available for income estimates are hard external trade figures and estimates of population,”
Jacob Price (1984, p. 19) noted. “Most conceivable methods of estimating income therefore
are likely to make the internal production of goods and services vary with the population and
leave external trade as the only independent variable besides population, hence the one that
has to bear the full burden of accounting for any changes in per capita income.”
Many scholars have stressed the causal role that exports have played as the primary
engine of economic growth for the colonies. According to the dominant theme found in
textbooks as well as scholarly works, enterprising Europeans arrived in North America and
through hard work and abundant land created a prosperous and burgeoning economy based on
the export of agricultural staples.1 The growth of external demand for colonial exports was
the crucial factor determining the pace of colonial economic growth.2
In their magisterial summary of the literature, McCusker and Menard (1984) noted
that “the idea that the export sector provides a useful point of departure for understanding the
economy of early British America is not new to these pages. That the staples thesis fits neatly
with many facts of the case and that it is valuable as an organizational device have long been
recognized. But the role of trade transcended even the suggestions of that model.”3 Marc
1 For example, Ratner, Soltow and Sylla (1993, p. 8) observed: “In the economy that evolved in the seventeenth and eighteenth centuries, staple commodities produced for export became the engine of growth as settlers capitalized on an abundance of resources and especially the fertility of the soil.” 2 Shepherd and Walton (1972, pp. 20-21), for example, stated that “demand plays a crucial role in our analysis of colonial development…[by raising] the price of natural-resource intensive goods, thus attracting mobile factors to the natural resource-abundant colonies. This effect, in conjunction with learning by doing and the reduction of risks which lowered production costs, expanded markets for colonial exports and sustained colonial development.” 3 McCusker and Menard (1984, p. 71). Although they do not articulate the nature of the linkage

2
Egnal opened the door to the possibility that factors other than exports influenced economic
growth, but exports were nonetheless the primary piece of evidence that he used to estimate
the actual rate of growth.4 And, as he argued more recently, even while acknowledging the
limitations of the staple thesis, “the export of primary products was the engine of growth for
the colonial economy…[and] the nature of these exports shaped the pattern of regional
development.” Egnal (1998, pp. 4-5)
Yet for all the interpretive weight that has been placed on the export sector, our
understanding of export performance in the colonial period remains relatively incomplete.
With the exception of recent work on exports from the Lower South (Mancall, Rosenbloom
and Weiss 2008), most past scholars have relied on a rather impressionistic and incomplete
analysis of trade performance by focusing on the rates of growth of one or two prominent
commodities, colonial trade with Great Britain, or other fragmentary indicators of trading
patterns, such as data on tonnage clearing various ports..5
between exports and colonial economic growth via the staple model, it appears that they have in mind the sort of model spelled out by Douglass North in his analysis of American economic growth in period after 1790. According to North, economic growth arose from the increased income that resulted from an increase in exports, the expansion of the domestic economy induced by that increased export income, and an increase in imports for consumption at very favorable terms of trade (North, 1961, p. 388). 4 Egnal (1975, p. 199) argued that per capita income increased between 1720 and 1775 because new techniques increased productivity, the terms of trade improved, and capital investment increased 5 In his analysis of Philadelphia’s commerce, Arthur Jensen (1963, p. 5) used the fact that total tonnage clearing Philadelphia increased from an annual average of 4,188 tons in the 1720s to 42,808 from 1768 to 1772 to argue that a number of contemporary observations about the rapid growth of Philadelphia’s trade were true. James Lyden, (1967, p. 401) looking at tonnage data from only the 1720s and 1730s, argued that “… the period after 1720 was one of very marked economic growth, at least for Pennsylvania.” In their summary of regional economic trends for the Middle Colonies, John J. McCusker and Russell R. Menard (1984, pp. 193-97) used shifts in the relative shares of tonnage bound for different destinations to illustrate differences in the development of the commercial communities in Philadelphia and other northern ports after 1750. They emphasized that while most of the growth for Boston and New York was in the coastal trade, much of the increased tonnage clearing Philadelphia was destined for the British Isles or other European ports. And, tonnage clearing for the West Indies and Southern Europe from Philadelphia was one of the quantitative indicators in Marc

3
The conclusions about the external trade of the Middle Colonies drawn by different
scholars from these data are surprisingly divergent. Egnal (1998, pp. 47-50) offers a
pessimistic assessment of the region’s economic fortunes in the first half of the eighteenth
century. “Lackluster sales of flour, bread, and other exports [before 1745],” he argued,
“slowed northern growth. At the heart of the problem was the downturn in the British West
Indies.6 In contrast, McCusker and Menard (1984, pp. 204-5) concluded that “the export
sector showed significantly more life after 1720, particularly toward the end of the decade.
Initially the gains owed little to the West Indian trade, then the largest Philadelphia
market….Rather they were achieved in the sale of wheat, flour, and bread to southern Europe
and Ireland, and through a strengthening coastal trade. These advances were considerable,
and Philadelphia’s external commerce, however measured, nearly tripled in size between
1720 and 1740.”7 They go on to argue that export growth continued through the end of the
colonial period. In their view the region’s lackluster performance before 1720 and more rapid
growth thereafter “seems a clear case of the export sector regulating the performance of the
economy as a whole”
Egnal’s (1998, p.49) account of economic trends in the northern colonies (i.e. the Middle colonies and New England). 6 It should be noted that not all of the data Egnal (1998) presents appears consistent with this conclusion. Per capita shipments of flour from Philadelphia did fall between 1728-32 and 1733-42. But tonnage clearing for the West Indies rose relatively steadily from the 1720s forward, dropping only briefly in the mid-1730s. 7 McCusker and Menard (1984, p. 204). They do not make clear the basis for these conclusions. The only source cited in this paragraph is for a 1741 quotation from John Reynall concerning the diverse destinations of Philadelphia’s exports. Nonetheless, it would appear that their argument rests on a reading of the ship clearance data for the 1720-1739 period, as their conclusions about this period closely mirror those of Lyden (1967).
4
As these disparate assessments make clear, the lack of a comprehensive and
continuous measure of the export sector’s performance has contributed to a lack of consensus
about the timing of its impact on the region’s economy and the magnitude of that impact.
Although most scholars seem to accept that exports influenced the region’s development, they
do not agree on whether this resulted in a sluggish, modest or robust rate of economic growth
for the Middle Colonies. This divergence of opinion reflects in part the incompleteness of the
evidence each scholar used. To date, no one has integrated all the tonnage data with the other
evidence available about the external trade of the Middle Colonies. 8
This paper presents new and more comprehensive measures of the overseas export
performance for the Middle Colonies (New York, New Jersey, Pennsylvania, and Delaware)
and compares them to similar measures for the Lower South. By combining the available
data for the Middle Colonies in a manner that is based on an explicit theoretical framework
we here present annual time series of total and per capita export volumes from c. 1700 to c.
1775.9 We also set the quantitative measures of trade in the context of the growth of the
overall size of the colonial economy, providing a basis on which to interpret the growth of
exports, something previous scholars often failed to do.
Our export series offers a new picture of the pace and timing of the Middle Colonies’
external trade over the entire colonial period. Aggregate exports from the Middle Colonies
8 Most of this data is summarized in John McCusker’s recent compilation of colonial trade statistics in Historical Statistics of the United States (2006),, although McCusker chose not to include the data on tonnage compiled by Lyden (1967) from reports in several Philadelphia newspapers for 1720 to 1739. 9 A complete enumeration of regional trade should include coastal exports, but the methods used to construct a time series for coastal trade are sufficiently different that we leave them to a separate paper. We note, however, that inclusion of estimates of the region’s trade with other mainland colonies does not appreciably alter the results we report here. We estimate that Middle Colony exports to other mainland colonies were in the range of approximately $1 to $2 per capita from the early 1700s through the end of the colonial period, and displayed little or no trend growth.
5
grew rapidly, increasing nearly 6-fold in real value between 1700 and the early 1770s.
Despite the long-run growth of exports from the region, there were substantial cyclical
variations in the volume of both aggregate and per capita exports over periods lasting up to 10
to 20 years. There were also significant shifts in the sources of regional exports, with
Pennsylvania experiencing much more export growth from 1720 through the 1750s and then
losing ground to New York.
The rapid growth of exports reflected the extensive demographic growth of the
colonial population of the mid-Atlantic region in the eighteenth century. Although the
region’s exports grew substantially faster than population for brief periods, over the long-run
exports did not keep pace with demographic change. Such a finding appears to be at odds
with the notion, central to the staples thesis, that the expansion of foreign demand shaped
colonial economic growth. We do not dispute the importance of exports as a source of
foreign earnings that enabled colonists to afford imported luxuries and manufactured goods
that they could not produce themselves. And it may still be the case that forward and
backward linkages played a role in the development of increasingly sophisticated colonial
economic institutions. But it appears that the importance of export earnings per person was
stable or diminishing over the course of the eighteenth century. This observation suggests
that the central features of the colonial economy were the transfer of natural resources from
Native Americans to Euro-Americans and the resulting extensive growth of the colonial
economy. These results suggest that more weight should be given to Malthusian forces rather
than the role of exports as the most important determinants of economic success in the
mainland colonies.10
10 See Smith (1980) for further discussion of the merits of the Malthusian perspective. Although

6
The Role of Exports in the Economy of the Middle Colonies
Although the Middle Colonies’ exports were less valuable than such southern staples
as tobacco, rice and indigo (see Table 1), the region’s fertile soil and abundant water
supported a productive agricultural sector that generated surpluses for export that figured
prominently in the region’s economy.11 From the outset, the region’s founders had assumed
that maritime commerce was essential to provide goods that could not be produced locally.
As a result, they searched for profitable exports (Jensen 1963, p. 2; McCusker and Menard
1984, p. 190). William Penn himself understood the need to situate cities on rivers draining
towards the Atlantic. In addition to placing Philadelphia at the confluence of the Delaware
and Schuylkill Rivers, which drained large portions of the northeastern portion of his patent,
he planned a second city on the Susquehanna so that farmers in the middle of the colony
would have access, via the Chesapeake, to the markets in the Atlantic basin. He also believed
that a city along the Susquehanna would draw commerce from New York as well as from
indigenous peoples, who would transport furs downstream.12 Those who acquired large
parcels of land in the middle and later decades of the century--such as the superintendent of
McCusker and Menard (1984) place much more emphasis on the staple export model, they do nonetheless acknowledge the relevance of Malthusian forces (ch. 1). 11 Despite a wealth of material on the Middle Colonies there has been no comprehensive overview of the region’s economic history. A number of studies have explored aspects of Philadelphia’s trading relationships, but less work has been done on New York. Despite some recent studies of New York, discussions of the extent and growth of regional trade remain sketchy and impressionistic. McCusker and Menard (1984, pp. 191-93) cited a number of studies that traced the history of trade through Philadelphia, but reported that the literature on New York’s trade was distinctly more limited, concluding that Harrington (1935) remained the best work on the subject of New York’s trade. One recent addition to the literature is Matson (1998). 12 On the placing of Philadelphia see Lemon (1972); on the planned second city see William Penn, “Some Proposals for a Second Settlement in the Province of Pennsylvania,” originally written in 1690, in Mancall (1996, 39-40).

7
Indian Affairs Sir William Johnson who established a bustling estate along the upper reaches
of the Susquehanna River, Samuel Wallis who became the most significant landlord in
central Pennsylvania (with a base of operations at Muncy, near the confluence of the two
branches of the Susquehanna), or William Cooper who busily promoted the development of
his lands near Lake Otsego—recognized that the Middle Colonies had become desirable
precisely because of the storied fertility of the lands there and the real prospects for new
settlers to establish themselves (Mancall 1991; Taylor 1996).
Merchants in Philadelphia and New York actively sought markets for these products
and took an increasingly active role in organizing regional trading patterns. As the century
progressed regional markets expanded in response to growing demand for grain in Southern
Europe and Great Britain, and merchants located in New York and even more so in
Philadelphia expanded their role in managing regional trade, forging a complex and dynamic
mercantile sector (McCusker and Menard 1984, pp. 194-97).
Residents of the Middle Colonies produced and exported a diverse array of products,
but grain production, as Coxe recognized for the post-Revolutionary era, dominated the
region’s exports. At the end of the colonial period bread and flour together with wheat made
up nearly two-thirds of the value of regional exports, but Indian corn, flaxseed, and beef and
pork also made a noticeable contribution to regional exports (see Table 2).13 In addition to
agricultural products the region also exported modest amounts of manufactures, including pig
and bar iron as well as a variety of wood products, such as staves, headings and shingles.
13 The evidence in Table 3 comes from the American Inspector General’s Reports which are discussed further below.

8
Together the ten enumerated products listed in Table 2 account for close to 90 percent of all
exports from these two colonies.
New York and Pennsylvania dominated exports from the Middle Colonies in these
years. Together they accounted for more than 96 percent of the value of regional exports (see
Table 3). But most of these exports were not bound for Great Britain. Instead, more than
three quarters of regional exports went either to the West Indies or Southern Europe. As a
result, the volume of exports from New York and Pennsylvania to Britain provides an
imperfect and distorted guide to the importance of trade in the region.
Measuring Colonial Exports
Virtually all of the quantitative evidence underlying discussions of the commodity
exports of the thirteen mainland British colonies are derived from data collected by imperial
officials. During the eighteenth century naval officers in American ports compiled quarterly
reports of all ships clearing and entering colonial ports along with details of the cargos they
carried. While a large number of these naval officers’ lists have been preserved, their
coverage for most ports is spotty and incomplete. 14
British customs inspectors compiled similar records of all arrivals in English and
Welsh ports beginning in 1696 and Scottish ports beginning in 1740. These data were
14 McCusker (2006) provides a good introduction to these data, but see also Price (1984). Louis Harper undertook the collection and systematic analysis of the naval officers list data, but much of this work remains only partially accessible in the Harper archives located at the University of California, Davis. Records for Charleston, in the Lower South, are relatively complete and have formed the basis for Clowse’s (1971) analysis of trade from this port. On the other hand, no data have survived for Philadelphia, apparently because the records were lost in a fire at the British Public Records Office during the nineteenth century. Data for other ports are available only for scattered years, or for only one or two quarters in some years, making it difficult to construct consistent and complete records of colonial exports. See Shepherd and Walton (1972, p. 167-75) for a compilation of some of these data and a discussion of what can be learned from them.
9
compiled at the time into annual ledgers listing the value of imports arriving from and exports
leaving for different trading areas. Rather than using current prices, however, the compilers
of these ledgers used a set of official values that reflected prices near the beginning of the
eighteenth century. As a result these series are best interpreted as fixed-price indexes of the
volume of trade (McCusker 2006, pp. 641-43).
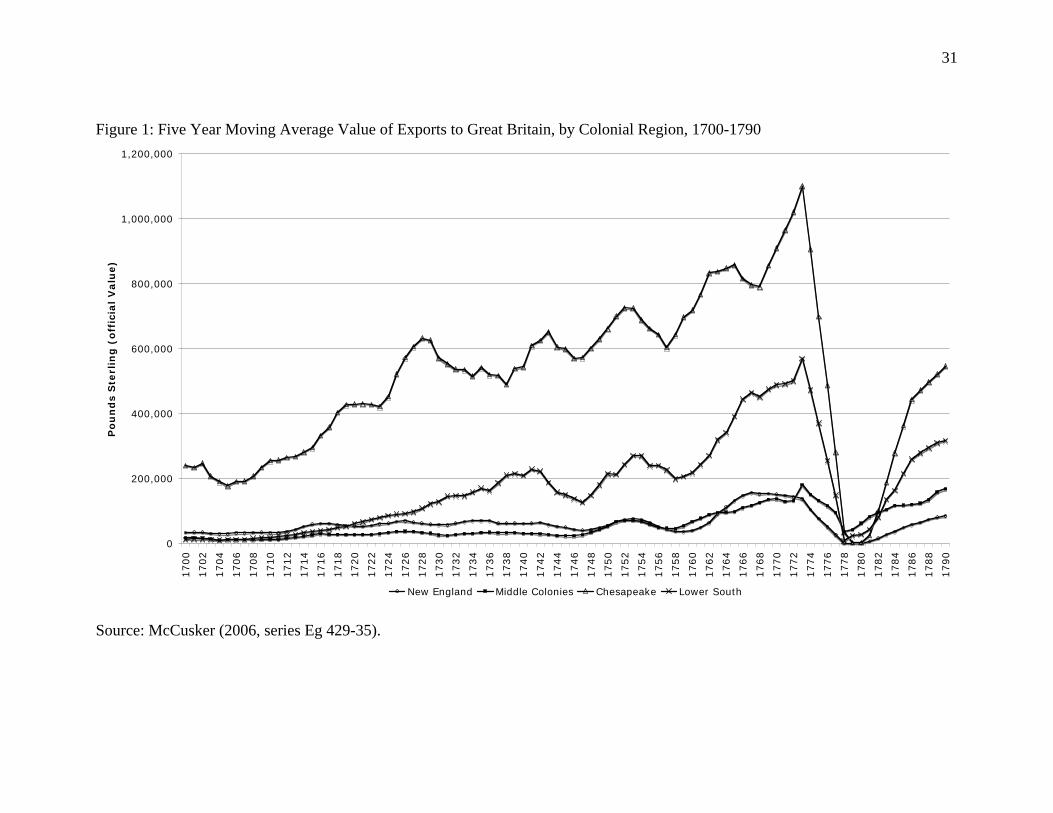
The data collected by British customs inspectors (summarized in Table 4 and Figure 1)
provide a convenient time-series of colonial exports to Britain, but do not provide evidence
about colonial exports to other areas, a limitation which is especially important for analyzing
the trade of the Middle Colonies which sent only a small fraction of their exports to British
ports. The extent of this limitation is clear in data collected in the American Inspector
General’s Ledgers for 1768-1772. These records, which were compiled by the American
Board of Customs, recorded the quantities of all commodities legally exported from and
imported into 42 colonial port districts throughout the British North American mainland from
January 5, 1768 through January 5, 1772. According to Shepherd and Walton (1972, p. 204)
these records “represent the only period for which we have data that purport to be a complete
coverage of colonial overseas trade.”
Shepherd (1969) and Shepherd and Walton (1972) have provided extensive analysis of
these data including compilation of estimates of the value of individual commodities exported
from different ports and the aggregation of these data into broader geographic regions. Table
1 summarizes data drawn from their work showing the breakdown of Colonial exports from
different regions between shipments bound for Great Britain and those bound for other
destinations. As this table makes clear, the bulk of southern exports were shipped to Britain,
though a large fraction of these shipments were then re-exported to other European

10
destinations. In contrast, however, shipments from the Middle Colonies and New England to
Great Britain made up only a small fraction of total exports from these regions.15
In contrast to the detailed picture of the Middle Colonies trade that can be constructed
for the end of the colonial period it is hard to find comprehensive quantitative estimates for
earlier years. A number of scholars have been able to piece together data on the quantities of
exports of specific commodities from Philadelphia for scattered years, but these data are too
sparse and inconsistent to allow a reconstruction of the volume of trade earlier in the century.
Helen Klopfer’s (1936) dissertation assembled data on exports of wheat, flour, bread, and
corn for most years after 1760, but before that she was able to obtain only scattered
observations for a few years. Lyden (1967) reports data for a few years in the early 1730s,
but these are not entirely consistent with those found in Klopfer’s work. Shepherd and
Williamson (1972, p. 170) summarized what can be gleaned about exports of bread and flour
from New York from the Naval Officers lists analyzed by Louis Harper. Their tables indicate
that with the exception of data for 1733-1735, there are only a few scattered years with usable
data. There are no data in this source for Philadelphia, as the records from this port appear to
have been destroyed at some point in the nineteenth century.
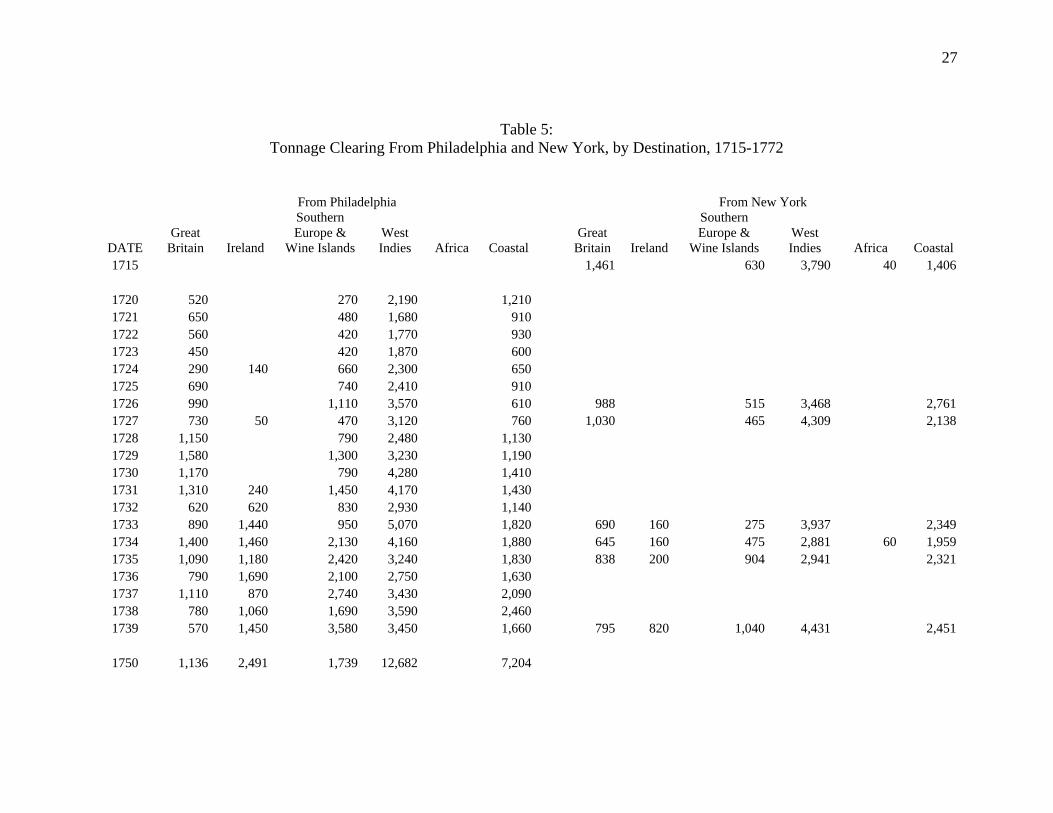
As a result, most of the analysis of trading patterns in the region’s major ports has
relied on information on the tonnage of ships clearing for different destinations, which are
available for a greater number of years.16 In Table 5 we report tonnage clearing Philadelphia
and New York in all of the years for which we could find data. As this table makes clear,
15 The value of exports per capita from each region illustrate the greater importance of exports to the economies of the Chesapeake and Lower South. The regional differences are especially pronounced when expressed per free person, suggesting the role of slavery in providing a higher standard of living of the free population in the southern colonies than elsewhere. 16 See in particular, Jensen (1962), Lyden (1967), McCusker and Menard (1984), Egnal (1998).

11
tonnage data are available for a number of years at the beginning of the century and for a long
stretch toward the end of the colonial period. Coverage in the middle years is somewhat
sparse, but there are observations for scattered years. These data illustrate both the rapid
growth in the volume of trade from the region and the shifting importance of different trading
regions. Trade with the West Indies was the single largest element of ship clearances
throughout the period, but its importance was diminishing in both New York and
Philadelphia, while coastal trade with other mainland colonies, and shipments to Southern
Europe were increasingly important. While trade with Great Britain initially accounted for
about 15 to 20 percent of tonnage clearing both ports, it fell sharply in the 1720s and 1730s.
The importance of exports to Britain began to rise in New York in the 1740s and in
Philadelphia in the 1750s, reaching new highs in the late 1760s, especially in New York.
New Estimates of Middle Colonies Exports 1700-1772
We have employed all the available data on tonnage and on the value of that tonnage
in trade to construct a set of estimates of export performance for the region spanning the years
from 1700 to 1774. We begin by using data from the American Inspector-General’s ledger
tabulated by Shepherd (1969) to establish the annual average value of commodity exports in
the years 1768-1772 from New York and Philadelphia to each of the five destination regions
enumerated in Table 3.17 Because our goal is to integrate export estimates with estimates of
regional income more generally, and to link these eighteenth century figures to those for the
17 To construct the base year values we used prices from Cole (1938) for eight of the region’s leading exports—all those listed in Table 2 except flaxseed—for which there was no data. After aggregating these values we inflated the resulting total to reflect the share of unenumerated exports

12
nineteenth century, we value regional exports in 1840 prices.18 We use these base year values
to calculate the average value per ton to each destination, and then we use the time series data
on tonnage to extrapolate exports for each region backward in time.
Because the tonnage data are not available continuously we interpolated tonnage
values for those years in which data are missing. To do this we first calculated the share of
tonnage clearing each port for each destination, and interpolated linearly between the
available years to fill in missing observations.19 Then we used the time series data on the
official value of exports from each colony to Britain to calculate total tonnage for years when
the tonnage data are missing. Since the export data to Britain are in value terms we derived
tonnage by assuming that the value per ton was constant and equal to its value in the base
years, 1768-1772.20 Total tonnage then equals tonnage bound for Britain divided by the
interpolated share of total tonnage clearing for Britain.
To obtain the regional total value of commodity exports in each year we sum the
values clearing for each destination, then we combine the values for New York and
Philadelphia, and inflate this total to account for exports from New Jersey and Delaware, on
the assumption that the share of regional exports from these two colonies was constant and
equal to its value in the base years.
18 Because the relative prices of different commodities affect their weight in the overall calculation shifts in relative prices could have an impact on the size of regional exports. In practice, however, relative commodity prices in 1840 were highly correlated with those in the 1770s, so the choice of base year prices has little impact on our estimates. 19 For the years prior to the earliest tonnage observations we assume that regional export shares were constant and equal to their average for the first 5 years of tonnage data for each port. 20 The assumption of a constant value per ton appears reasonable based on data for the years when tonnage and the value of exports to Britain are both available. If anything the value per ton appears to have fallen slightly over time. If this were the case then the assumption of a constant value per ton would tend to impart an upward bias to the growth of exports.

13
In addition to the visible trade in commodities, the American colonies also produced a
number of invisible service exports. These included earnings from goods carried on colonial
owned ships as well as charges for other commercial services such as insurance and
commissions. Based on estimates constructed by James F. Shepherd and Gary M. Walton
(1969) for 1768-1772, exports of shipping and commercial services from the Middle Colonies
generated income worth nearly 44 percent of the value of the region’s commodity exports.
Invisible earnings were highest in the trade with Great Britain and Ireland, where they reached
nearly 50 percent of the value of commodity exports, and lowest in the trade with Southern
Europe and the Wine Islands, where they amounted to 34 percent of the value of visible trade.
There are no data that would allow for direct estimates of invisible earnings for earlier
dates. In light of the growing role of colonial merchants in trans-Atlantic trade it seems likely
that the importance of invisible earnings was growing over time. For example, McCusker
(1972) found that the share of tonnage registered in Philadelphia owned by residents of the
Middle Colonies increased from about 55 percent in 1726-29 to approximately 80 percent by
1770-1775.21
These data are not adequate to estimate the impact of invisible earnings with any
accuracy. Nonetheless, they provide a basis for examining the sensitivity of estimates based
solely on commodity exports to the impact of including invisible earnings. We begin by
assuming that the ratio of invisible to visible exports to each destination remained constant at
its level in 1768-1772 and use these ratios along with our estimates of commodity exports by
destination to construct a series of invisible earnings in each year. We then adjust this figure 21 In 1726-29, Philadelphia residents owned 47 percent of registered tonnage, while residents of Delaware and New Jersey owned another 7.5 percent. Resident of all other North American colonies owned another 2.8 percent. At the end of the colonial period Philadelphia residents owned 76.6 percent of registered tonnage, while New Jersey and Delaware residents owned another 3 percent.

14
to reflect the changes in ownership over time. To do this we assume that the share of tonnage
owned within the region grew at a constant rate between the two dates covered by
McCusker’s data, and use this same rate to extrapolate the ownership series to earlier years.
Commodities formed the bulk of the region’s exports, and estimates of their value may
be more reliable than those for the export of services. In Table 6 we report our estimates of
the value of regional commodity exports as well as exports from New York and Pennsylvania,
the two colonies from which the bulk of regional exports were shipped. In addition the table
also reports population estimates. Figure 2 compares the time series behavior of regional
commodity exports to all destinations, commodity exports to Great Britain and regional
population. Over the entire colonial period the growth of total exports is similar to the
expansion in exports to Great Britain, but the timing of this growth is quite different. While
exports to Great Britain grew slowly until the mid to late 1740s and then surged dramatically,
total foreign exports grew strongly from the early 1720s through the mid-1750s, and then
fluctuated without any long term trend over the next two decades. So it would appear that
McCusker and Menard’s description of the region’s trade may have captured reasonably well
the general state of affairs between 1720 and 1740 or 1750. Indeed, they may have been too
modest in their claim that “Philadelphia’s external commerce, however measured, nearly
tripled in size between 1720 and 1740.” Real exports from Philadelphia in 1740 were roughly
six times larger than in 1720. New York did not fare quite so well, but nevertheless the
region’s exports in 1740 were at least four times what they had been in 1720. But their
generally favorable view of the period minimizes the slowing of growth and short-term
declines that occurred in the late 1720s and early 1730s. Further, their depiction of a
lackluster performance before 1720 overlooked the doubling of exports that occurred between

15
1710 or thereabouts and the early 1720s. Moreover, if the export sector were regulating the
performance of the economy, then they were subjecting the colonists to substantial variations
in well-being over the entire period.
Our export estimates shed new light as well on differences in the fortunes of the
region’s two primary exporters as highlighted in Figure 3, which decomposes total regional
exports by their source. At the beginning of the eighteenth century New York accounted for
over half of regional exports, and this share increased over the first two decades as
Pennsylvania’s exports fell off to very low levels in the 1710s. After 1715, however,
Pennsylvania’s exports began to climb. While the value of New York’s exports fluctuated
with little trend, Pennsylvania’s exports grew substantially through the 1750s, by which time
nearly three quarters of regional exports came from this colony. After this point, however,
Pennsylvania’s exports stagnated while New York exports grew relatively strongly. Thus by
the mid-1760s New York’s exports accounted for close to 40 percent of regional exports.
From Figure 2 it is apparent that although regional commodity exports grew
substantially during the colonial period they failed to keep pace with the growth of population
over the long term. In Figure 4 we make the relationship between exports and population
explicit by graphing commodity exports per capita. In Figure 4 we also examine the effect of
including our estimates of invisible earnings by plotting the combined value of visible and
invisible exports per capita. The first conclusion that emerges from this figure is that exports
per capita varied considerably over time. Commodity exports varied between $3 and $8 per
person from 1700 to 1730, then began to rise sharply, reaching a peak of $12 per person in the
early 1740s, falling back in the late 1740s and then rising to an even higher level in the early

16
1750s. Thereafter they fell sharply, dropping back into the $3 to $8 per capita range from
1755 through 1772.
Even including invisible earnings it is clear that the export sector constituted a
relatively small component of the regional economy. While we do not have regional per
capita income estimates for the Middle Colonies, Mancall and Weiss (1999, p. 26) have
estimated that per capita incomes grew from around $64 in 1700 to $68 in 1770 (both years
valued in 1840 prices). Thus regional exports peaked at a bit less than 20 percent of income,
but were typically closer to 10 percent of regional product.
Adding invisible earnings does not substantially change the time pattern of these
fluctuations, but it does produce a slight positive trend to the series. While the average value
of commodity exports from 1755 to 1772 ($4.80) was slightly lower than the average for 1700
to 1730 ($5.05); total—visible and invisible—exports per capita were just a bit higher in the
latter period than in the former one ($6.85 versus $6.51). Whether one looks at commodity
exports or at total exports, there was substantial extensive growth, but there is little evidence
of long-run growth in per capita terms. The more significant short-run fluctuations clearly
must have played a role in regional economic well-being and contributed to economic and
political tensions at times, but they could not have been a factor in producing any lasting
economic growth.
So far our discussion has concentrated on the real value of exports. By abstracting
from the effects of price changes we are able to identify changes in regional productivity that
are the source of rising living standards. But prices matter. Changes in the terms of trade--
shifts in the relative prices of exports to imports--are another avenue through which regional
trade may have affected regional economic activity.

17
Over most of this period, British prices were quite stable, but the prices of Middle
Colony exports fell from 1700 to 1720. Between 1720 and the early 1740s they fluctuated
without any clear trend, and then began to rise again, recovering all of the ground they had
lost from 1700 to 1720 by the time of the American Revolution. The impact of these
movements on regional terms of trade is shown in Figure 5, where we plot the ratio of a
weighted index of prices of major regional exports to the Schumpeter-Gilboy price index,
which represents movements of prices in Great Britain, the primary source of the region’s
imports. The effect of these movements in relative prices was to magnify the rise in exports
values in the early 1750s and to offset some of the subsequent drop in exports per capita in the
late 1750s. But there is no longer run effect.
Comparative Perspective on Middle Colony Exports
A comparison of the export performance of the Middle Colonies to that of the Lower
South sheds additional light on the distinctive role of external trade in each regional economy.
The economy of the Lower South emerged during the eighteenth century as one of the best
examples of staple export driven economic growth outside the West Indies, or so traditional
accounts would have it.22 By focusing on the rapid growth of the rice and indigo trades of the
Lower South, most scholars have concluded that standards of living for colonists in the region
must have been rising rapidly. But the conventional view of the region’s economic growth is
flawed in at least two important ways. First, by focusing on the dominant exports at the end of
the period, scholars have overstated the growth of regional exports. To some extent the rapid
22 See for example, McCusker and Menard, The Economy of British America, 1607-1789, ch. 8, and Egnal, New World Economies, pp. 4-5.

18
expansion of rice and indigo production in the colonial era was achieved by the transfer of
resources from the production of other, less profitable, goods, including naval stores and
deerskins. Second, and perhaps more importantly, most accounts have simply failed to note
that the growth of exports was paralleled by an even faster growth of regional population. As
a result, per capita export figures for the region fell over the colonial period rather than
increasing (see Mancall, Rosenbloom and Weiss 2008).
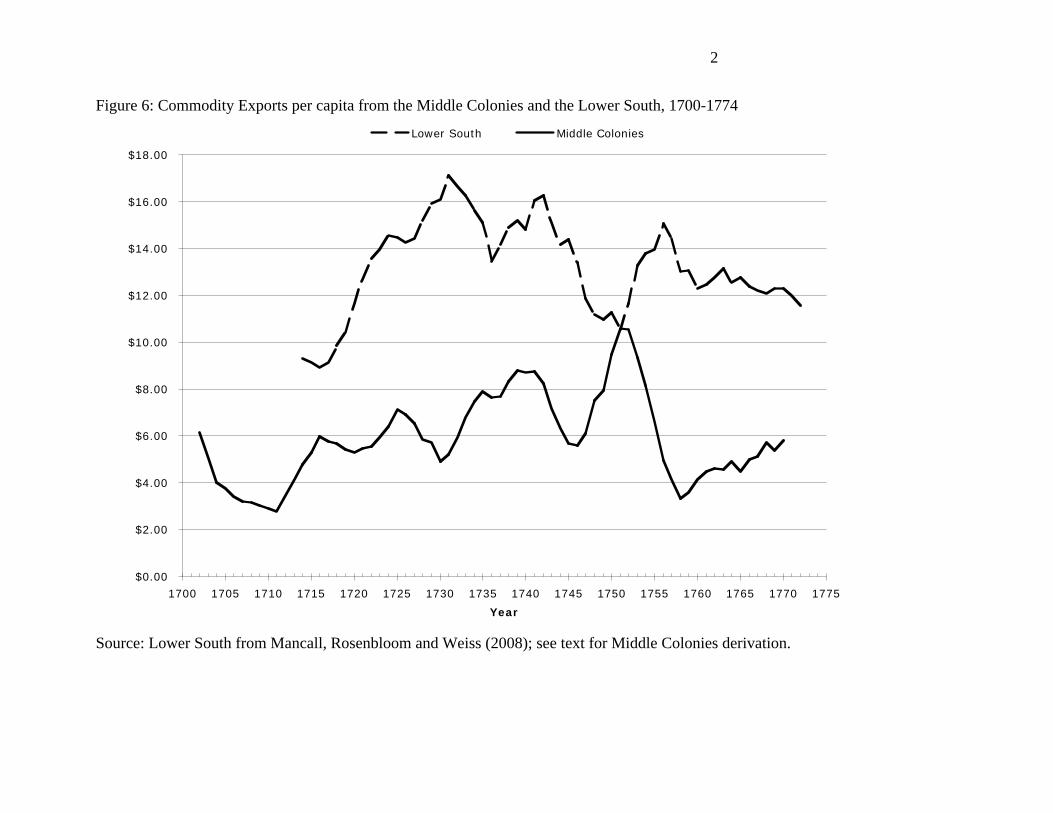
Consistent with the larger role of export staples in the economy of the Lower South,
exports per capita from the region were nearly twice as large as from the Middle Colonies,
averaging around $13 per person compared to an average of a bit more than $6 per person in
the Middle Colonies (see Figure 5). On the other hand, if account is taken of earnings from
invisible exports, the difference in the size of the foreign sector between the two regions
would be substantially diminished.
Despite the difference in the volume of exports between the two regions, in other
respects they appear quite similar. Although aggregate exports from the Lower South grew at
an average annual rate of 4.4 percent in the period 1712-1774, this was only slightly faster
than the growth of regional population, and after 1730 population growth actually outpaced
exports. Thus, after an initial burst of commercial expansion triggered by the widespread
cultivation of rice, exports per capita from the Lower South followed a gradually declining
trend. In the Middle Colonies, aggregate growth was somewhat slower, averaging 2.8 percent
per year, but again it closely paralleled population growth. Thus in both regions it appears
that export growth was primarily a reflection of extensive growth, and does not appear to have
been a driver of economic development.

19
Conclusions
Colonial economic historians have given considerable weight to the role of exports as
a stimulus for economic growth. In part this reflects the pragmatic fact that exports are one of
the few areas of the colonial economy for which reasonably sound and extensive quantitative
data are available. Yet, efforts to make use of these data have been handicapped by the way
in which they have been used in previous research. Scholars have tended to focus on the
behavior of one or two key commodities, taking them as indicators of broader changes
without placing them in the context of the export sector as a whole or comparing them to
changes in the overall scale of the colonial economy.
Evidence for the Middle Colonies presented here reveals that aggregate exports did
grow quickly, but that this growth failed to keep pace with population growth during much of
the period under consideration. Although the behavior of exports suggests that over shorter
periods of a decade or two exports may have contributed to fluctuations in economic activity,
the lack of a long-run trend seems inconsistent with the emphasis in the export staples model
on the role of foreign demand as a stimulus for economic growth. At a minimum one would
expect exports per capita to grow if such a model were applicable. It would seem that rather
than focusing on the role of external demand as the chief factor in colonial economic growth,
greater emphasis must be placed on the supply-side. This directs attention back to the
Malthusian approach, which emphasizes the impact of resource abundance and labor and
capital scarcity as the defining characteristics of colonial economic growth.
20
References
Clowse, Converse (1971). Economic Beginnings in Colonial South Carolina. Columbia:
University of South Carolina Press.
Coclanis, Peter (1989). The Shadow of a Dream Economic life and death in the South
Carolina low country, 1670-1920. New York: Cambridge University Press.
Cole, Arthur Harrison (1938). Wholesale Commodity Prices in the United States, 1700-1861.
Cambridge: Harvard University Press.
Egnal, Marc (1975). “The Economic Develoment of the Thirteen Colonies, 1720-1775.”
William and Mary Quarterly. 3rd series, 32, 191-222.
Egnal, Marc (1998). New World Economies: The Groth of the Thirteen Colonies and Early
Canada. New York and Oxford: Oxford University Press.
Harrington, Virginia (1935). The New York Merchant on the Eve of the Revolution. New
York: Columbia University Press.
Jensen, Arthur L. (1963). The Maritime Commerce of Colonial Philadelphia. Department of
History, Universit of Wisconsin. Madison: State Historical Society of Wisconsin.
Klopfer, Helen Louise (1936) “Statistics of Foreign Trade of Philadelphia, 1700-1860.” Ph.D.
diss. University of Pennsylvania.
Lemon, James (1972). The Best Poor Man’s Country (Baltimore).
Lyden, James(1967). “Philadelphia’s Commercial Expansion, 1720-1739.” Pennsylvania
Magazine of History and Biography 91, pp. 401-19.
Mancall, Peter C. (1991). Valley of Opportunity: Economic Culture along the Upper
Susquehanna, 1700-1800 (Ithaca).
Mancall, Peter C. ed. (1996). Land of Rivers: America in Word and Image (Ithaca).

21
Mancall, Peter C. and Thomas Weiss (1999). “Was Economic Growth Likely in Colonial
British North America?” Journal of Economic History 59, no. 1 (March), 17-40.
Mancall, Peter C., Joshua L. Rosenbloom and Thomas Weiss (2008). “Exports and the
Economy of the Lower South Region, 1720-1772.” Research in Economic History,
25, 1-68.
McCusker, John J. (1972). “Sources of Investment Capital in the Colonial Philadelphia
Shipping Industry.” Journal of Economic History 32, no. 1 (Mar.), 146-57.
McCusker, John J. (2006). “Colonial Statistics.” In Carter, Susan B. et al, eds. (2006).
Historical Statistics of the United States: Earliest Times to the Present (Cambridge
University Press), vol. 5.
McCusker, John J. and Russell R. Menard (1984). The Economy of British America, 1607-
1789: Needs and Opportunities for Study. Institute of Early American History and
Culture. Chapel Hill and London: University of North Carolina Press.
Nash, R. C. (1992). “South Carolina and the Atlantic Economy in the Late Seventeenth and
Eighteenth Centuries,” Economic History Review 45, .
North, Douglass C. (1961). “Early National Income Estimates of the U.S.,” Economic
Development and Cultural Change, 1961, vol. 9, part II.
Price, Jacob M. (1984). “The Transatlantic Economy.” In Jack P. Greene and J.R. Pole, eds.
Colonial British America: Essays in the New History of the Early Modern Era.
Baltimore and London: Johns Hopkins University Press, 18-42.
Ratner, Sidney, James H. Soltow and Richard Sylla (1993). The Evolution of the American
Economy: Growth, Welfare and Decision Making, 2nd ed. New York: MacMillan.

22
Schumpeter, Elizabeth Boody (1938). “English Prices and Public Finance, 1660-1822.”
Review of Economic Statistics 20, no. 1, (Feb.), 21-37.
Shepherd, James (1969). “Commodity Exports from the British North American Colonies to
Overseas Areas, 1768-1772: Magnitude and Patterns of Trade.” Purdue University,
Krannert Graduate School of Industrial Organization. Paper no. 258.
Shepherd, James F. and Gary M. Walton, (1969). “Estimates of ‘Invisible’ Earnings in the
Balances of Payments of the British North American Colonies, 1768-1772.” Journal
of Economic History 29, no. 2 (June), 230-63.
Shepherd, James F. and Gary M. Walton (1972). Shipping, Maritime Trade, and the
Economic Development of Colonial North America. Cambridge: Cambridge
University Press.
Shepherd, James F. and Samuel H. Williamson (1972). “The Coastal Trade of the British
North American Colonies, 1768-1772.” Journal of Economic History 32, no. 4 (Dec.),
783-810.
Smith, Daniel Scott (1980). “A Malthusian-Frontier Interpretation of United States
Demographic History before c. 1815.” In Urbanization in the Americas: The
Background in Comparative Perspective, eds. Woodrow Borah, Jorge Hardoy and
Gilbert A. Stelter. Ottawa.
Alan Taylor (1996) William Cooper’s Town: Power and Persuasion on the Frontier of the
Early American Republic (New York).

23
Table 1
Value of Exports and Exports per Capita by Source and Destination, 1768-1772
Exports To Population Source Great Britain Elsewhere Total Free Whites Total New England £76,975 £362,126 £439,101 565.7 581.1 Middle Colonies £68,369 £458,176 £526,545 521 555.9 Chesapeake £827,052 £219,831 £1,046,883 398.2 649.6 Lower South £394,030 £157,919 £551,949 189.4 344.8 Per Free White Per person Great Britain Elsewhere Total Great Britain Elsewhere Total New England £0.14 £0.64 £0.78 £0.13 £0.62 £0.76 Middle Colonies £0.13 £0.88 £1.01 £0.12 £0.82 £0.95 Chesapeake £2.08 £0.55 £2.63 £1.27 £0.34 £1.61 Lower South £2.08 £0.83 £2.91 £1.14 £0.46 £1.60
Source: McCusker and Menard (1984).

24
Table 2 Annual Average Value of Exports of Specified Commodities from
New York and Pennsylvania valued at Current and 1840 Prices, 1768-1772
New York Philadelphia
Commodity Units Quantity Current Value 1840 Value Quantity
Current value 1840 Value
Share of regional Exports
Bread and Flour tons 1,329 £14,385 $78,696 4,413 £46,690 $261,249 60.1% Beef and Pork bbl 583 £1,222 $8,450 825 £1,711 $11,965 2.9% Flaxseed bu 23,710 £4,275 NA 15,870 £2,917 NA 7.1% Grain—Indian corn bu 13,541 £1,404 $7,386 20,772 £2,040 $11,330 3.4% Grain—Wheat bu 13,042 £2,534 $13,890 24,872 £4,801 $26,489 7.2% Iron, bar tons 153 £2,308 $11,978 65 £952 $5,068 3.2% Iron, pig tons 184 £918 $6,029 204 £1,012 $6,664 1.9% Potash tons 89 £2,283 $9,922 7 £169 $750 2.4% Wood Products, Staves and headings 1000s 484 £1,450 $15,802 1,010 £2,999 $32,976 4.4% Rum, American gal 2,230 £152 $602 879 £294 $237 0.4% Value of enumerated products £30,778 $152,754 £63,289 $356,727 92.6% Total All products £34,724 $200,134 £66,861 $395,062 100.0%
Sources: Shepherd (1969); Cole (1938).

25
Table 3 Average Annual Value in Current Prices of Middle Colony Exports by Source and Destination, 1768-1772
From Great Britain Ireland
Southern Europe and
Wine Islands West Indies Africa Row Total New York 42,867.0 25,953.0 35,642.2 68,374.6 782.8 173,619.6 New Jersey 68.4 25.0 210.2 1,940.6 2,244.2 Pennsylvania 19,994.4 25,751.8 143,362.2 140,805.6 294.4 330,208.4 Delaware 3,589.8 12,489.2 16,079.0 Column Total 62,929.8 55,319.6 191,703.8 211,120.8 1,077.2 522,151.2 Percentage of Exports Originating in Each Colony (column percentages) New York 68.1 46.9 18.6 32.4 72.7 33.3 New Jersey 0.1 0.0 0.1 0.9 0.0 0.4 Pennsylvania 31.8 46.6 74.8 66.7 27.3 63.2 Delaware 0.0 6.5 6.5 0.0 0.0 3.1 100.0 100.0 100.0 100.0 100.0 100.0 Percentage of Exports Going to Each Destination (row percentages) New York 24.7 14.9 20.5 39.4 0.5 100.0 New Jersey 3.0 1.1 9.4 86.5 0.0 100.0 Pennsylvania 6.1 7.8 43.4 42.6 0.1 100.0 Delaware 0.0 22.3 77.7 0.0 0.0 100.0 Total 12.1 10.6 36.7 40.4 0.2 100.0
Source: Shepherd (1969).

26
Table 4
Value of Imports into England and Scotland by Source at Benchmark Dates, 1700-1790
Year Total New
England New York Pennsylvania Virginia and
Maryland Carolina Georgia 1700 395,070 41,486 17,567 4,608 317,351 14,058 0 1710 256,505 31,113 8,203 1,277 195,120 20,793 0 1720 575,824 49,269 16,836 7,929 439,054 62,736 0 1730 760,454 55,135 8,740 10,813 534,018 151,748 0 1740 770,562 74,690 21,498 15,643 390,032 267,775 924 1750 975,565 51,660 35,634 29,087 663,989 193,253 1,942 1760 1,150,493 39,808 34,366 22,846 859,038 182,237 12,198 1770 1,497,741 157,443 98,997 31,065 847,997 306,181 56,058 1780 98,247 2,232 67,840 8,699 15,296 1,929 2,251 1790 1,191,071 100,864 119,971 51,731 566,774 286,332 65,399 Average Annual Rates of Change 1700-1770 1.92 1.92 2.50 2.76 1.41 4.50 1700-1790 1.23 0.99 2.16 2.72 0.65 3.41
Notes and Sources: McCusker (2006, series EG 429-42, 443-60). For 1740 and later the figures are the sum of separate figures for England and Wales and Scotland. Prior to that imports to Scotland are imputed on the assumption that they grew at the same rate as imports to England and Wales.
27
Table 5: Tonnage Clearing From Philadelphia and New York, by Destination, 1715-1772
From Philadelphia From New York
DATE Great
Britain Ireland
Southern Europe &
Wine Islands West Indies Africa Coastal
Great Britain Ireland
Southern Europe &
Wine Islands West Indies Africa Coastal
1715 1,461 630 3,790 40 1,406
1720 520 270 2,190 1,210 1721 650 480 1,680 910 1722 560 420 1,770 930 1723 450 420 1,870 600 1724 290 140 660 2,300 650 1725 690 740 2,410 910 1726 990 1,110 3,570 610 988 515 3,468 2,761 1727 730 50 470 3,120 760 1,030 465 4,309 2,138 1728 1,150 790 2,480 1,130 1729 1,580 1,300 3,230 1,190 1730 1,170 790 4,280 1,410 1731 1,310 240 1,450 4,170 1,430 1732 620 620 830 2,930 1,140 1733 890 1,440 950 5,070 1,820 690 160 275 3,937 2,349 1734 1,400 1,460 2,130 4,160 1,880 645 160 475 2,881 60 1,959 1735 1,090 1,180 2,420 3,240 1,830 838 200 904 2,941 2,321 1736 790 1,690 2,100 2,750 1,630 1737 1,110 870 2,740 3,430 2,090 1738 780 1,060 1,690 3,590 2,460 1739 570 1,450 3,580 3,450 1,660 795 820 1,040 4,431 2,451
1750 1,136 2,491 1,739 12,682 7,204

28
From Philadelphia From New York
DATE Great
Britain Ireland
Southern Europe &
Wine Islands West Indies Africa Coastal
Great Britain Ireland
Southern Europe &
Wine Islands West Indies Africa Coastal
1754 2,085 1,615 725 6,486 130 2,076
1763 2,079 1,460 1,000 7,657 70 2,450 1764 2,952 1,882 1,087 8,221 140 1,495 1765 5,161 3,345 12,340 17,004 5,165 1,592 7,825 2,988 1766 1,830 4,830 4,455 14,053 300 10,834 4,907 3,480 8,385 3,090 1767 8,263 6,408 13,371 13,061 5,588 3,820 6,697 3,770 1768 4,134 3,482 7,255 12,119 0 8,116 5,130 2,522 2,360 7,220 35 3,754 1769 4,049 3,170 12,040 11,114 30 9,085 3,955 2,515 3,278 5,628 205 9,068 1770 3,208 4,791 10,940 14,043 0 12,370 4,665 2,692 2,920 7,244 98 5,655 1771 3,222 3,470 7,110 13,757 90 13,655 4,830 2,476 2,029 7,996 115 4,968 1772 3,123 2,491 8,415 16,081 20 12,872 4,280 1,610 2,449 8,249 260 8,859
Source: McCusker (2006); Lyden (1967).

29
Table 6: Exports from the Middle Colonies, 1700-1772
In Prices of 1840
Exports (1840 Prices) Population Year New York Philadelphia Middle Colonies New York Pennsylvania Middle Colonies 1700 $257,348 $172,997 $445,954 19,107 17,950 53,537 1701 $271,705 $195,973 $484,640 19,344 18,483 54,960 1702 $116,684 $155,615 $282,174 19,584 19,037 56,420 1703 $109,447 $193,721 $314,163 19,827 19,614 57,920 1704 $154,406 $91,229 $254,544 20,074 20,215 59,459 1705 $108,304 $49,143 $163,158 20,324 20,842 61,039 1706 $41,737 $158,055 $207,038 20,577 21,497 62,661 1707 $209,239 $29,509 $247,407 20,834 22,183 64,326 1708 $158,903 $79,591 $247,144 21,094 22,902 66,036 1709 $179,589 $23,164 $210,106 21,358 23,656 67,790 1710 $120,170 $47,942 $174,210 21,625 24,450 69,592 1711 $178,622 $1,427 $186,579 22,808 25,034 72,381 1712 $182,621 $55,225 $246,473 24,057 25,632 75,281 1713 $211,363 $6,683 $225,954 25,375 26,245 78,298 1714 $436,703 $99,976 $556,144 26,767 26,872 81,435 1715 $290,527 $205,021 $513,522 28,237 27,514 84,698 1716 $303,846 $194,959 $516,897 29,789 28,171 88,092 1717 $344,538 $168,905 $532,065 31,428 28,845 91,622 1718 $390,085 $209,789 $621,631 33,159 29,534 95,294 1719 $284,518 $246,431 $550,206 34,988 30,239 99,112 1720 $248,920 $312,952 $582,251 36,919 30,962 103,084 1721 $236,350 $243,909 $497,678 37,945 32,523 106,807 1722 $309,497 $237,531 $566,869 39,001 34,182 110,664 1723 $440,128 $361,805 $831,019 40,086 35,945 114,660 1724 $341,048 $350,549 $716,681 41,202 37,818 118,801 1725 $412,119 $481,973 $926,520 42,350 39,806 123,091 1726 $649,250 $247,549 $929,325 43,530 41,916 127,536 1727 $594,087 $532,906 $1,167,868 44,743 44,154 132,142 1728 $415,017 $408,193 $853,067 45,991 46,526 136,914 1729 $325,821 $203,976 $549,012 47,274 49,042 141,858 1730 $189,265 $393,901 $604,317 48,594 51,707 146,981 1731 $475,070 $502,777 $1,013,314 49,925 54,383 153,068 1732 $228,833 $482,729 $737,370 51,291 57,197 159,407 1733 $269,338 $940,714 $1,253,939 52,696 60,157 166,009 1734 $338,930 $938,880 $1,324,155 54,139 63,269 172,884 1735 $289,497 $1,183,004 $1,525,908 55,621 66,543 180,044 1736 $404,005 $1,400,345 $1,869,793 57,144 69,987 187,501 1737 $419,447 $849,893 $1,315,378 58,709 73,608 195,266 1738 $450,391 $789,287 $1,284,641 60,317 77,417 203,353 1739 $575,007 $1,020,162 $1,653,024 61,968 81,424 211,774 1740 $635,472 $1,868,950 $2,595,256 63,665 85,637 220,545

30
Exports Population
Year New York Philadelphia Middle Colonies New York Pennsylvania Middle Colonies 1741 $594,943 $2,109,468 $2,802,498 64,862 88,551 227,166 1742 $363,663 $1,037,320 $1,451,796 66,081 91,564 233,986 1743 $387,469 $1,154,594 $1,597,992 67,323 94,679 241,011 1744 $358,427 $885,695 $1,289,246 68,588 97,901 248,247 1745 $334,085 $1,190,637 $1,580,023 69,877 101,232 255,700 1746 $202,041 $1,831,600 $2,107,399 71,190 104,676 263,377 1747 $330,630 $439,050 $797,596 72,529 108,238 271,284 1748 $263,440 $1,397,298 $1,720,972 73,892 111,920 279,429 1749 $483,160 $1,665,056 $2,226,131 75,281 115,728 287,818 1750 $712,856 $3,094,341 $3,945,282 76,696 119,666 296,459 1751 $822,593 $2,272,888 $3,207,752 80,013 124,907 307,541 1752 $767,039 $2,511,397 $3,397,342 83,474 130,377 319,037 1753 $928,085 $2,871,566 $3,937,463 87,085 136,086 330,963 1754 $476,721 $2,050,918 $2,619,315 90,852 142,046 343,334 1755 $508,356 $1,957,261 $2,555,043 94,782 148,267 356,168 1756 $442,188 $1,107,149 $1,605,531 98,883 154,760 369,482 1757 $356,982 $715,432 $1,111,310 103,161 161,537 383,294 1758 $269,323 $991,067 $1,306,103 107,624 168,611 397,622 1759 $415,404 $958,341 $1,423,570 112,280 175,996 412,485 1760 $410,585 $901,366 $1,359,535 117,138 183,703 427,904 1761 $959,501 $1,441,283 $2,487,859 121,042 188,684 439,250 1762 $1,178,800 $1,305,316 $2,574,214 125,083 193,801 450,897 1763 $1,080,844 $1,222,879 $2,387,277 129,264 199,056 462,852 1764 $879,717 $1,084,947 $2,035,921 133,591 204,454 475,125 1765 $619,491 $705,186 $1,372,723 138,069 209,998 487,723 1766 $945,161 $2,635,026 $3,710,038 142,704 215,693 500,655 1767 $742,486 $1,022,003 $1,828,486 147,500 221,541 513,930 1768 $1,023,841 $2,828,649 $3,992,218 152,464 227,549 527,557 1769 $1,039,921 $1,536,416 $2,669,779 157,602 233,719 541,545 1770 $932,570 $2,202,410 $3,248,684 162,920 240,057 555,904 1771 $1,196,084 $1,995,186 $3,307,015 167,128 247,616 570,696 1772 $1,126,374 $2,122,794 $3,367,013 171,450 255,412 585,882
Source: Authors’ estimates. See text for explanation.
31
Figure 1: Five Year Moving Average Value of Exports to Great Britain, by Colonial Region, 1700-1790
0
200,000
400,000
600,000
800,000
1,000,000
1,200,000
1700
1702
1704
1706
1708
1710
1712
1714
1716
1718
1720
1722
1724
1726
1728
1730
1732
1734
1736
1738
1740
1742
1744
1746
1748
1750
1752
1754
1756
1758
1760
1762
1764
1766
1768
1770
1772
1774
1776
1778
1780
1782
1784
1786
1788
1790
Po
un
ds
Ste
rlin
g (
off
icia
l V
alu
e)
New England Middle Colonies Chesapeake Lower South Source: McCusker (2006, series Eg 429-35).

32
Figure 2: Five Year Moving Average of Index Values of Middle Colony Exports, Exports to Great Britain, and Population, 1700-1772
0
200
400
600
800
1000
1200
1700 1705 1710 1715 1720 1725 1730 1735 1740 1745 1750 1755 1760 1765 1770 1775
Year
Total Exports Population Exports to Great Britain
Notes and sources: Population is the sum of population in New York, New Jersey, Philadelphia, and Delaware. Data from McCusker (2006, series Eg 9-12), linearly interpolated between observations; Exports to Britain from McCusker (2006, series Eg 431-32), total exports based on authors’ calculations as described in text.

Figure 3: Exports from the Middle Colonies, by source, 1700-1772
$0
$500,000
$1,000,000
$1,500,000
$2,000,000
$2,500,000
$3,000,000
$3,500,000
1702
1704
1706
1708
1710
1712
1714
1716
1718
1720
1722
1724
1726
1728
1730
1732
1734
1736
1738
1740
1742
1744
1746
1748
1750
1752
1754
1756
1758
1760
1762
1764
1766
1768
1770
Year
Pennsylvania New York New Jersey & Delaware
Source: Author’s calculations, see text

Figure 4: Five Year Moving Average of Visible and Total Exports per capita from the Middle Colonies, 1700-1772
$0.00
$2.00
$4.00
$6.00
$8.00
$10.00
$12.00
$14.00
$16.00
$18.00
1700 1705 1710 1715 1720 1725 1730 1735 1740 1745 1750 1755 1760 1765 1770 1775
Visible Exports Visible & Invisible Exports
Source: see Figure 2.

1
Figure 5: Terms of Trade of the Middle Colonies
0
20
40
60
80
100
120
140
1700 1705 1710 1715 1720 1725 1730 1735 1740 1745 1750 1755 1760 1765 1770 1775
Year
Notes and sources: Import prices are an average of the three series reported in Schumpeter (1938); Export prices are a weighted average (weights in parentheses) of flour (.87), wheat (.10), and pork (.03) between 1720 and 1775, and of flour (.89) and wheat (.11) before 1720. All price data from McCusker (2006. Eg 252, 257, 259).
2
Figure 6: Commodity Exports per capita from the Middle Colonies and the Lower South, 1700-1774
$0.00
$2.00
$4.00
$6.00
$8.00
$10.00
$12.00
$14.00
$16.00
$18.00
1700 1705 1710 1715 1720 1725 1730 1735 1740 1745 1750 1755 1760 1765 1770 1775
Year
Lower South Middle Colonies
Source: Lower South from Mancall, Rosenbloom and Weiss (2008); see text for Middle Colonies derivation.