re: suggested improvements to the joint participation ... · miami, florida 33128 re: suggested...
TRANSCRIPT

Page 1 of 6
March 1, 2018
Mayor Carlos Giménez
Stephen P. Clark Center
111 N.W. 1st Street, 29th Floor
Miami, Florida 33128
RE: Suggested improvements to the Joint Participation Agreement between Florida Power
& Light and Miami-Dade County for wastewater reuse
Dear Honorable Mayor Carlos Giménez,
On behalf of the undersigned organizations, we submit the following comments related to Miami
Dade County’s draft Joint Participation Agreement (JPA) with the Florida Power & Light
Company (FPL) over the treatment and use of wastewater at FPL’s Turkey Point facility and the
draft resolution authorizing the execution of the JPA. On February 9, 2018 we had the
opportunity to meet with your staff after the deferral of the proposed JPA at the Chairman’s
Policy committee meeting on February 8, 2018. This letter is a follow up to our meeting and the
prior discussion.
We applaud both parties for identifying possible solutions to three pressing problems plaguing
Miami-Dade County – (1) the need to treat and reuse 117 million gallons per day (MGD) of
wastewater by 2025, as mandated by the 2008 Leah Schad Memorial Ocean Outfall legislation;
(2) the need to find a long-term, sustainable water supply for FPL’s Turkey Point facility, Miami
Dade County’s biggest water user; and (3) the need to deliver clean, fresh water to Biscayne Bay
and Biscayne National Park (via wetland rehydration through the Biscayne Bay Coastal
Wetlands and/or the Model Lands close to the South Dade Wastewater Treatment Plant).
While we remain optimistic about the potential of this comprehensive solution, several changes
must be made to the JPA to clarify goals for this partnership and to inform next steps for
discussion and design. County staff presented its document as an “agreement to discuss.” In fact,
the JPA is a legal document enforceable by injunction. Further, this agreement commits the
County to several actions, but omits requirements we believe to be imperative: strict water
quality standards for treated wastewater and specific measures to generate additional highly
treated wastewater for the purposes of ecological restoration. This agreement has the potential to
resolve multiple, long-term problems plaguing Biscayne Bay if the JPA adequately incorporates
the following considerations:
1. A commitment by Miami-Dade County to continue to seek decommissioning of Turkey
Point’s cooling canal system and implementing upgrades to the cooling technology, and to
maintain regulatory and operational control over the wastewater treatment facility and reuse
water.
2. Any reclaimed wastewater treated for use at the Turkey Point facility must meet non-
degradation water quality standards for release into Biscayne Bay.
3. A commitment to explore options to allocate a meaningful portion of treated wastewater for
Biscayne Bay restoration and wetland rehydration.

Page 2 of 6
The following information provides explanations to support the above.
1) A commitment by Miami-Dade County to continue to seek decommissioning of
Turkey Point’s cooling canal system and implementing upgrades to the cooling
technology, and to maintain regulatory and operational control over the wastewater
treatment facility and reuse water.
We acknowledge the County’s continued efforts to protect Biscayne Bay and the Biscayne
Aquifer from the massive amount of pollution emanating from Turkey Point. We urge the
County to continue regulating the facility to protect the surrounding environment from further
contamination. On July 19, 2016, Miami-Dade County passed a resolution urging you to seek a
commitment from FPL to discontinue the use of the Turkey Point cooling canal system (CCS) by
2033 and to replace the outdated, failing CCS with current cooling technologies, such as cooling
towers.1 The proposed JPA appears to conflict with this resolution: it excludes any reference to
the County’s goal of retiring the CCS. The County must maintain their commitment outlined in
the aforementioned resolution to have FPL end reliance on the cooling canals by 2033 and
upgrade the cooling technology, since reuse water can be used for other cooling technologies that
do not cause widespread pollution.
Currently, FPL is seeking support from Miami-Dade County for its 20-year Subsequent License
Renewal Application (SLRA) with the U.S. Nuclear Regulatory Commission (NRC) for Turkey
Point Reactor Units 3 and 4. If granted, the license would extend the operational life of these
units to 2053 for an additional twenty years beyond its current license. We remain concerned that
the JPA, in its current form, represents tacit support from the County for FPL’s proposed
relicensing plan without the County first having carefully reviewed the SLRA and accompanying
operational plans. In addition, as FPL proposes to use County reuse water for water supply in the
cooling canals presumably through the relicensing period, the County must urge FPL to switch
from using cooling canals to commonly used cooling technologies that are less polluting, such as
cooling towers. The County must maintain its regulatory authority and legal right to engage in
this license renewal process, which could include proposing required conditions of license
renewal, such as FPL updating Turkey Point’s cooling technology system.
We also have concerns that this arrangement may put Miami-Dade County in a position of
dependence on FPL to achieve compliance with the mandates of the 2008 Ocean Outfall
legislation. If FPL is for some reason unable to move forward with the partnership or an
agreement on partnership terms cannot be reached, the County may find itself without a partner
for wastewater reuse. We therefore urge the County to pursue alternative avenues to comply with
Ocean Outfall legislation. First, the County should restart discussions on the South Dade
Wastewater Reuse project, as outlined in the Comprehensive Everglades Restoration Plan
(CERP). This project includes a cost-share opportunity with the federal government and would
result in the use of treated wastewater for ecological restoration to the County’s benefit. Finally,
1 Resolution supporting the County Mayor in efforts to seek a commitment from Florida Power and Light Company
to discontinue use of the cooling canal system at the Turkey Point Power Plant, Miami Dade County Board of
County Commissioners, July 19, 2016. Available at
http://www.miamidade.gov/govaction/matter.asp?matter=161617&file=true&yearFolder=Y2016.
Page 3 of 6
we believe that the County must maintain regulatory and operational control over the wastewater
treatment facility and reuse water it generates. Any agreement with FPL must incorporate
language to ensure the County maintains such control.
2) Any reclaimed wastewater treated for use at the Turkey Point facility must meet
non-degradation water quality standards for release into Biscayne Bay.
As outlined in numerous ongoing studies and reports, most notably the 2015 tritium analysis
study by Dr. David Chin,2 the cooling canal system at Turkey Point has direct hydrologic
connections to the underlying class G-II Biscayne Aquifer and Biscayne Bay through
underground seepage via oolitic limestone and canal cuts. According to the County’s own
analysis, contaminated water from the cooling canals was detected in Biscayne Bay and
Biscayne National Park with elevated levels of ammonia, phosphorus, TKN, total nitrogen, and
chlorophyll a.3 All pollutants contained in waters added to the cooling canals are subject to
concentration via evaporation and eventual export into the Biscayne Aquifer and surface waters
of Biscayne Bay, an Outstanding Florida Water body (OFW), and Biscayne National Park. As
such, any water added to the cooling canals must meet water quality standards suitable for
release into Biscayne Bay.4
As written, the JPA could allow for further pollution of the Biscayne Aquifer, Biscayne Bay, and
Biscayne National Park because it does not require that reuse water to be used at Turkey Point
meet strict water quality standards. Wastewater is rich in nutrients such as nitrogen, phosphorus
and ammonia. Biscayne Bay is a phosphorus-limited system and is extremely sensitive to the
addition of excess nutrients. Increasing nutrient pollution in Biscayne Bay has the potential to
destabilize aquatic communities, such as seagrass beds, with increased turbidity, algal blooms,
epiphyte loads, and anoxia.5
Reuse water used in the cooling canal system (or for other beneficial uses such as wetland
rehydration) must be treated to the non-degradation water quality target standards for Class
III/Outstanding Florida Waters (OFW), requiring that discharges not degrade ambient water
quality at a discharge site. The Biscayne Bay Coastal Wetlands Rehydration Project Delivery
Team analyzed possible impacts of rehydrating the Biscayne Bay Coastal Wetlands with highly-
treated reclaimed wastewater, including potential effects to the ecosystem. The 2003 Treatment
Objectives Draft Report by the U.S. Army Corps of Engineers-South Florida Water Management
District identified target non-degradation standards for use in Biscayne Bay in Table 5.1 of the
report.6 The 2011 Biscayne Bay Coastal Wetlands Rehydration Pilot Project found that it was
possible to meet these non-degradation targets with highly treated wastewater. Target water
2 The Cooling-Canal System at the FPL Turkey Point Power Station, Chin, 2015, University of Miami.
3 Miami-Dade County Report on Biscayne Bay Water Quality Observations associated with the Turkey Point
Cooling Canal System Operations, March 7, 2016, Memorandum from Carlos A. Giménez, Mayor, to Chairman
Jean Monestime and Members, Board of County Commissions, p. 4. 4 As determined for Class III/Outstanding Florida Waters & the Biscayne Bay Coastal Wetlands Rehydration Pilot
Project: Pilot Plant Closeout Report. July 2011. Table 2-1. 5 Effects of Nutrient Enrichment on Seagrass Population dynamics: evidence and synthesis from the biomass–
density relationships, Cabaco, et al. 2013, Journal of Ecology DOI 10.1111/1365-2745.12134 6 U.S. Army Corps of Engineers & South Florida Water Management District, Treatment Objectives Draft Report,
September 25, 2003, Wastewater Reuse Pilot Project –Miami-Dade, p. 10.

Page 4 of 6
quality standards are enumerated in that report in Table 2-1.7 Water from the cooling canals
discharges directly into the Biscayne Aquifer and Biscayne Bay. Therefore, County reuse water
used by FPL to freshen the cooling canals must meet non-degradation standards for Biscayne
Bay.
The County has been proactive in holding FPL accountable for the widespread environmental
contamination caused by the cooling canals system at Turkey Point. It would be inconsistent for
the County to now allow FPL to add the County’s own wastewater to the cooling canals if that
water further contributes to the pollution of the Biscayne Aquifer and Biscayne Bay. We ask that
the County explicitly reference these water quality standards as a goal of the partnership in the
JPA.
3) A commitment to explore options to allocate a meaningful portion of treated
wastewater for Biscayne Bay restoration and wetland rehydration.
Biscayne Bay and Biscayne National Park are ecological treasures and significant contributors to
the economy of Miami-Dade County. However, Biscayne Bay is chronically starved for
freshwater, as are the surrounding wetlands that feed the Bay. Lack of freshwater flow has
caused damage to important habitats, including freshwater wetlands, mangrove forests, coral
reefs, tidal creeks, and near-shore ecosystems. Fish and wildlife, including threatened and
endangered species like the wood stork and American crocodile, are struggling to survive due to
severe habitat alteration. Furthermore, declining fish populations have harmed local fishing and
tourism industries. Restoring freshwater flow to the ecosystem, particularly through the Biscayne
Bay Coastal Wetlands (BBCW) project, will help to restore coastal wetlands and tributaries. It
will lower nearshore salinity levels and improve nursery habitat for fish and shellfish.
In addition to benefitting the health of local ecosystems, steps toward restoring Biscayne Bay
and Biscayne National Park will provide key economic and social gains for our communities. In
the wake of the spate of recent hurricanes that devastated many of our nation’s coastal areas, the
County must work to improve the resilience of our communities to future storm events. Healthy,
robust wetlands act as critical buffers between communities and the impacts of hurricanes and
storm surge. Restoring Biscayne Bay will help to improve shorelines and other coastal
ecosystems in southern Miami-Dade County, thus enhancing shoreline resiliency. Moreover,
increasing freshwater flow to coastal areas and contributing to aquifer recharge will help buffer
against saltwater intrusion, protecting the drinking water supply for nearly 8 million people in
South Florida.
Miami-Dade County has long been a champion of restoring Biscayne Bay, particularly through
supporting the BBCW project. Unfortunately, progress on the project, particularly in terms of
advancing planning for BBCW Phase II, has been stymied by an apparent absence of freshwater
needed for restoration. Using highly-treated wastewater from Miami-Dade County was always
considered to be an option but was tabled due to high cost estimates due to an energy-intensive
treatment process. However, with Miami-Dade County now considering a cost-share
arrangement with FPL to construct and operate a wastewater treatment facility, there is a huge
7 Miami-Dade County Water & Sewer Department, Biscayne Bay Coastal Wetlands Rehydration Pilot Project, Pilot
Plant Closeout Report, July 2011, p. 2-7.

Page 5 of 6
opportunity to reinitiate discussions as to how highly-treated wastewater from the County could
be used for ecological restoration. It is imperative that the JPA explicitly contemplate providing
a meaningful supply of additional reuse water for Biscayne Bay restoration and rehydration.
Further, we urge the County to reinitiate discussions with the U.S. Army Corps of Engineers
regarding the South Dade Wastewater Reuse project and BBCW, as authorized in CERP, to
identify potential avenues for using highly-treated wastewater for restoring Biscayne Bay and
achieving a federal cost share partner.
Overall, we believe that this agreement, if executed properly, truly has the potential to provide a
comprehensive solution to numerous problems by: 1) providing a sustainable, long-term water
supply and upgraded cooling technology system for Turkey Point, 2) meeting legal requirements
for County wastewater reuse, and 3) providing a clean, freshwater supply for the restoration of
Biscayne Bay and Biscayne National Park. However, in order to ensure a “win-win-win,” the
County must address the concerns outlined by this letter. We look forward to supporting a
revised agreement at the upcoming March 8, 2018 Chairman’s Policy Committee meeting. This
is an exciting opportunity and we see the potential for this agreement to benefit both the health of
Biscayne Bay and the future of Miami-Dade County.
Please find attached an Appendix which includes: (1) The Closed Cycle Cooling Tower
Feasibility Assessment for Turkey Point Nuclear Units 3 and 4, Bill Powers, July 2016, Powers
Engineering; (2) Treatment Objectives Draft Report, Keiser-Lopez, 2003, U.S. Army Corps of
Engineers-South Florida Water Management District; and (3) Class III/Outstanding Florida
Waters & the Biscayne Bay Coastal Wetlands Rehydration Pilot Project: Pilot Plant Closeout
Report, July 2011.
Please contact Laura Reynolds with any questions you may have regarding the content of this
communication, 786-543-1926 or [email protected].
Sincerely,
Alan Farago
Conservation Chair, Friends of the Everglades
Rachel Silverstein, Ph.D.
Executive Director & Waterkeeper, Miami Waterkeeper
Caroline McLaughlin Biscayne Program Manager, National Parks Conservation Association
Stephen A. Smith
Executive Director, Southern Alliance for Clean Energy

Page 6 of 6
Erin Clancy
Conservation Director, Tropical Audubon Society
cc: Chairman Esteban Bovo and the Miami-Dade Board of County Commissioners
Jack Osterholt, Deputy Mayor, Miami-Dade County, Regulatory and Economic Resources
Lee Hefty, Director, Miami-Dade County Division of Environmental Resources Management
Kevin Lynskey, Director, Miami-Dade County Water and Sewer Department
Abigail Price-Williams, County Attorney, Miami-Dade County
Dennis Kerbel, Assistant County Attorney, Miami-Dade County
Henry Gillman, Assistant County Attorney, Miami-Dade County
Appendix

Closed Cycle Cooling Tower Feasibility Assessment for Turkey Point Nuclear
Units 3 and 4
July 11, 2016
Prepared for:
Southern Alliance for Clean Energy
Prepared by:
Powers Engineering San Diego, California

i
Table of Contents
Page
I. Executive Summary ............................................................................................................... 1
II. Cooling Systems at U.S. Nuclear Power Plants ..................................................................... 3
A. Overview .......................................................................................................................... 3
B. Closed Cycle Canal Cooling System in Use on Turkey Point Nuclear Units 3 and 4 .... 4
C. Effect of Units 3 and 4 Uprates on Cooling Canal System Performance ....................... 6
III. Alternative Cooling System for Units 3 and 4 ....................................................................... 6
A. Cooling Tower Already in Use at Turkey Point – Unit 5 ................................................ 6
B. Cooling Towers Included with Proposed Units 6 and 7 .................................................. 9
C. Most Recent Large-Scale Cooling Tower Retrofit at U.S. Power Plant ........................ 11
D. Cooling Tower Energy Penalty ...................................................................................... 11
1. Steam Turbine Efficiency Potential Improvement by Conversion to Mechanical Draft Closed-Cycle Cooling Tower ............................................................................ 12
2. Closed-Cycle Cooling Pump and Fan Power Demand ............................................... 12
E. Cooling Tower Installed Cost ........................................................................................ 13
IV. Retrofit Cooling Tower Configurations for Units 3 and 4 ................................................... 18
A. General Location of Retrofit Cooling Towers ............................................................... 18
B. 54-Cell Back-to-Back Mechanical Draft Cooling Towers - Layout .............................. 19
C. 40-Cell Back-to-Back Mechanical Draft Cooling Towers - Layout .............................. 20
D. Additional Infrastructure Necessary for Units 3 and 4 Closed-Cycle Cooling Retrofits.......................................................................................................................... 21
1. Makeup Water Source – Reclaimed Water from MDWASD .................................... 21
2. Blowdown Discharge System – Zero Liquid Discharge ............................................ 25
3. Chemical Treatment of Circulating Cooling Water ................................................... 27
V. Closed-Cycle Cooling Retrofits Have Been Performed on a Number of U.S. Power Plants .................................................................................................................................... 28
VI. Other Closed Cycle Retrofits Have Encountered Space Limitations and Have Re-Utilized Existing Cooling System Equipment .............................................................. 29
VII. The NRC Does Not Consider the Circulating Cooling Water System as a Nuclear Safety-Related System ......................................................................................................... 30
VIII. Closed-Cycle Retrofits Do Not Require Extended Unscheduled Outages ......................... 31
IX. Achievable Timeline for Completing Units 3 and 4 Cooling Tower Project Is Four to Five Years ............................................................................................................................ 31

ii
A. 1,500 MW Brayton Point Station Cooling Towers - Permitting and Construction Completed in Less Than 4.5 Years ................................................................................ 31
B. Permitting Can Be Completed in Approximately One Year ......................................... 32
C. Construction Can Be Completed in Approximately Three Years ................................. 33
X. Conclusion ........................................................................................................................... 33
Attachments A: SPX Nuclear Plant Retrofit Comparison - 2009 B: SPX Design Considerations to Minimize Recirculation C: Palo Verde Nuclear Reclaimed Water System - APS 2011 D: Primer on Zero Liquid Discharge Technology E: Zero Liquid Discharge Case Study - 1,060 MW APS Redhawk

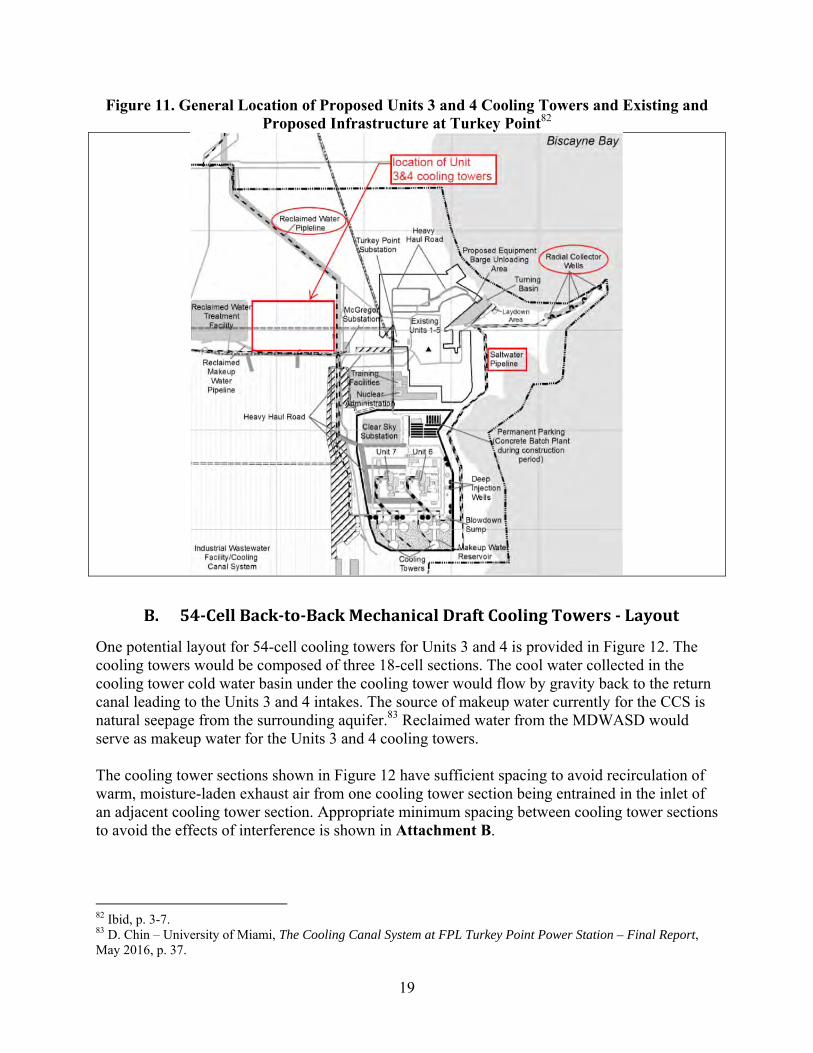
1
I. ExecutiveSummary Retrofit mechanical draft wet cooling towers for Turkey Point Units 3 and 4 are feasible and cost effective, even if they operate for as little as ten years. The annualized cost of the wet cooling towers would be approximately $59 to $79 million per year over a ten-year cost recovery term, depending on the type of cooling tower configuration selected. This compares to a gross annual revenue generated by Units 3 and 4 of approximately $500 million. The cost of electricity production for the FPL system as a whole, of which Units 3 and 4 provide about 10 percent of the annual delivered electricity, would increase about 1.5 to 2 percent with the addition of retrofit cooling towers on Units 3 and 4. The cooling tower investment would ensure the reliability of the Units 3 and 4 cooling systems through 2032 and 2033, the respective end dates of the current Units 3 and 4 operating licenses. Wet cooling towers for Units 3 and 4 can be operational within four years of submittal of applications for the necessary permits and approvals to proceed with Units 3 and 4 cooling tower retrofits, based on actual retrofits at operational large U.S. nuclear and fossil power plants. The design parameters of the wet inline cooling tower in use on 1,060 MW Turkey Point Unit 5, and the proposed round wet cooling towers on proposed nuclear units Units 6 and 7, serve as the basis for the retrofit cooling towers for Units 3 and 4 evaluated in this report. A 24-cell inline mechanical draft wet cooling tower is in operation at Turkey Point Unit 5. In addition, FPL has included round mechanical draft wet cooling towers in the design of proposed nuclear Units 6 and 7 at Turkey Point. The approximate capital cost of wet cooling towers for both Units 3 and 4 would be in the range of $220 to $310 million in 2016 dollars, depending on the size and design details of the towers selected. The cooling towers would be designed to reduce discharge (cold water) temperature 2 oF to 6 oF below the average maximum cooling canal system (CCS) discharge temperature of 93 oF. This would have the practical benefit of increasing the gross power output of Units 3 and 4. The proposed source of makeup water for the Units 3 and 4 cooling towers would be reclaimed water from the Miami-Dade Water and Sewer Department (MDWASD). The MDWASD treatment plant closest to Turkey Point, the South District Wastewater Treatment Plant (SDWWTP), currently injects approximately 101 million gallons per day (mgd) of treated wastewater to the Lower Floridan Aquifer. MDWASD by law must reduce its treated wastewater ocean outfall discharges by 60 percent, equivalent to 117.5 mgd, by 2025. MDWASD had intended to largely address this requirement by supplying 90 mgd to the proposed Turkey Point 6 and 7 nuclear project and the existing Unit 5 gas-fired power plant. However, FPL has postponed the start dates for proposed Units 6 and 7 to 2031 and 2032, eliminating this alternative as a viable compliance option for 2025. Reclaimed water would be the sole source of makeup water supply to Units 3 and 4 cooling towers. Onsite treated reclaimed water reservoirs at Turkey Point would assure the reliability of reclaimed water supply even if supply disruptions occurred at the SDWWTP. The largest nuclear plant in the country, 3,900 MW Palo Verde Nuclear near Phoenix, Arizona, has operated reliably

2
for 30 years using reclaimed water alone as the makeup water supply, combined with onsite reclaimed water reservoirs to assure supply reliability in the event of temporary supply interruptions. This successful application of reclaimed water as the exclusive makeup water supply for a nuclear plant is the model for makeup water supply to the Units 3 and 4 cooling towers. The current net loss of approximately 29 mgd of surface water in the CCS attributable to the removal of heat from the Units 3 and 4 circulating cooling water would no longer occur if reclaimed water is the source of makeup water supply. A certain level of continuous discharge from the circulating cooling water, known as “blowdown,” is necessary to prevent the build-up of scaling deposits in the cooling towers. A zero liquid discharge (ZLD) system would be utilized to treat blowdown from the Units 3 and 4 cooling towers to eliminate wastewater discharges. Use of reclaimed water as the makeup water source will allow for a highly concentrated, relatively low flow blowdown stream, as is done in actual practice at the Palo Verde Nuclear Plant in Arizona. This in turn will allow for a ZLD system of reasonable capital and operating cost to treat blowdown from the Units 3 and 4 cooling towers. The purified water produced by the ZLD system would be re-utilized as makeup water. Solid residue will be landfilled. Additional practical benefits of cooling towers for Units 3 and 4 would be the elimination of: 1) up to 100 mgd of fresh water pumping from the L-31E Canal to the CCS to reduce water temperature in the CCS, and 2) 14 mgd of Upper Floridan Aquifer pumping for salinity control in the CCS. Net power output of Units 3 and 4 may also increase if these units shift from the CCS to cooling towers, especially under summertime conditions, as cooling tower fan and water pumping demand may be more than offset by higher gross unit output from Units 3 and 4. In conclusion, the use of mechanical draft closed-cycle cooling towers on Turkey Point Units 3 and 4, combined with ZLD technology to eliminate cooling tower blowdown discharges, represents the best available technology for eliminating surface water thermal discharge impacts and hypersalinity impacts on the aquifer underlying the CCS.

3
II. CoolingSystemsatU.S.NuclearPowerPlants
A. Overview The U.S. EPA documented the distribution of combination (can operate as closed-cycle or once-through), closed-cycle, and once-through cooling systems at nuclear plants in the May 2014 316(b) Technical Development Document (TDD). The distribution of cooling system types in use at U.S. nuclear plants is shown in Table 1.
Table 1. Distribution of Cooling Systems at U.S. Nuclear Plants1
Combination cooling systems can operate as closed-cycle or once-through cooling systems depending on the position of the isolation valves and sluice gates. Examples of U.S. nuclear power plants utilizing a combination cooling system are Xcel Energy’s 1,100 MW Prairie Island Nuclear Generating Station (MN) and Entergy’s 605 MW Vermont Yankee Nuclear Power Plant (VT).2 The cooling towers at these two nuclear plants are shown in Figure 1.
1 EPA, Technical Development Document for the Final Section 316(b) Existing Facilities Rule, May 2014, Exhibit 4-10, p. 4-9. 2 ASA, Inc., Hydrothermal Modeling of the Cooling Water Discharge from the Vermont Yankee Power Plant to the Connecticut River – Final Report, ASA Report 02-088, prepared for Normandeau Associates, Inc., April 2004 (revision), p. 1.

4
Figure 1. Cooling Towers at Prairie Island Nuclear and Vermont Yankee a. Prairie Island Nuclear Generating Plant3
b. Vermont Yankee Nuclear Power Plant4
B. ClosedCycleCanalCoolingSysteminUseonTurkeyPointNuclear Units3and4
Circulating cooling water used at Turkey Point Units 3 and 4 is cooled in a closed cycle canal cooling system (CCS) that covers approximately 5,900 acres.5 The CCS is shown in Figure 2. Two thermal units that formerly relied on the CCS, Turkey Point Units 1 and 2, have been converted to synchronous condensers and no longer utilize the CCS.6 The heat load on the CCS from Units 3 and 4 has increased in recent years. The U.S. Nuclear Regulatory Commission (NRC) approved a 15 percent power uprate for Units 3 and 4 that was
3 Xcel Energy – Prairie Island Nuclear Generating Plant webpage: https://www.xcelenergy.com/energy_portfolio/electricity/nuclear/prairie_island. 4 Google Earth photograph of Vernon, VT and Vermont Yankee Nuclear. 5 NRC, Draft NUREG-2176, Volume I, February 2015, p. 2-7. 6 Ibid, p. 3-1.

5
completed by FPL in 2013, from 2,300 megawatt thermal (MWt) to 2,644 MWt.7,8 Net electric power output was increased from approximately 700 MW per unit to 816 MW per unit.9 The amount of heat that must be rejected in the cooling system is the difference between these two values, or 1,828 MWt. This is equivalent to 6,240 million Btu per hour (MMBtu/hr) that must be removed by the cooling system in the Unit 3 and the Unit 4 cooling towers.10 The current average gross evaporation rate from the CCS is 44.20 mgd.11 However, on average 15.52 mgd is replenished by rainfall.12 The net average CCS evaporation rate, when rainfall replenishment is accounted for, is 28.68 mgd.13
Figure 2. Turkey Point Unit 3 and 4 Closed Cycle Canal Cooling System14
7 NRC, Turkey Point Units 3 and 4 Issuance of Amendments Regarding Extended Power Uprate (TAC NOS. ME4907 and ME4908) – cover letter, June 15, 2012, p. 1. “The amendments increase the licensed core power level for Turkey Point Units 3 and 4 from 2,300 megawatts thermal (MWt) to 2,644 MWt.” 8 Ibid, p. 3-1. 9 Ibid, p. 3-1. “The net power output of Units 3 and 4 together increased from a nominal 1,400 MW(e) to 1,632 MW(e) as a result of the uprate.” 10 1,828 MW × (1,000 kW/MW) × (3,412 Btu/kW) = 6,240 MMBtu/hr. 11 D. Chin – University of Miami, The Cooling Canal System at FPL Turkey Point Power Station – Final Report, May 2016, p. 39. Available at: http://www.miamidade.gov/mayor/library/memos-and-reports/2016/05/05.12.16-Final-Report-on-the-Cooling-Canal-Study-at-the-Florida-Power-and-Light-Turkey-Point-Power-Plant-Directive-151025.pdf. 12 Ibid, p. 39. 13 Ibid, p. 39. 14 NRC, Draft NUREG-2176, February 2015, p. 3-3.

6
C. EffectofUnits3and4UpratesonCoolingCanalSystem Performance
Maximum circulating water temperature at the Units 3 and 4 discharge outfalls is 108 oF. Maximum water temperature near the intakes is typically about 93 oF.15 The NRC granted FPL’s 2014 request to increase the maximum intake water temperature for Unit 3 and 4 from 100 oF to 104 oF.16 The maximum daily average temperature at the discharge of the CCS and upstream of the Units 3 and 4 cooling water intakes was 101 oF on August 22, 2014.17 Temperatures in the CCS in the summer of 2014 were sufficiently elevated to prompt concern regarding the sustainability of the CCS as an adequate source of cooling water for Unit 3 and 4.18 Units 3 and 4 operated continuously through the summer of 2015 with a maximum intake temperature of 98.5 oF.19 The Unit 3 and 4 cold water intake temperature has increased by 4 oF on average since the uprate took place.20 Supplementary cooling was necessary in 2014 to stay within the allowable maximum intake water temperature.21 FPL is permitted to pump up to 100 million gallons per day (mgd) of fresh water from the L-31E Canal into the CCS to reduce temperature in the June 1 – November 30 period.22 The permit authorizes pumping from June 1 to November 30 in 2015 and 2016.23 FPL pumped an average of 30 mgd from the L-31E Canal over 94 days in 2015, from August 27 to November 30, 2015.24 There has been a steady increase in cooling canal system salinity since operation of the system began in 1973.25 Seepage from the cooling canal system into the Biscayne aquifer has increased the salinity of the aquifer for several miles inland.26 FPL has reached an agreement with Miami-Dade County to install a system of up to six wells to pump low salinity water at a rate of 14 mgd from the Upper Floridan Aquifer into the CCS in order to reduce the salinity in the CCS.27
III. AlternativeCoolingSystemforUnits3and4
A. CoolingTowerAlreadyinUseatTurkeyPoint–Unit5
15 D. Chin – University of Miami, The Cooling Canal System at FPL Turkey Point Power Station – Final Report, May 2016, p. 10. 16 Ibid, p. 18. 17 Ibid, p. 20. 18 Ibid, p. 19. 19 Ibid, p. 65. 20 Ibid, p. 1. 21 Ibid, p. 1. 22 Ibid, p. 3. 23 Ibid, p. 43. 24 Ibid, p. 66. 25 Ibid, p. 2. 26 Ibid, p. 2. 27 Ibid, p. 3.

7
Turkey Point Unit 5 is a 1,150 MW gas turbine combined cycle unit consisting of four gas turbines and one steam turbine generator that began operation in 2007. The cooling system is a wet cooling tower consisting of 24 cells in a back-to-back configuration as shown in Figure 3. The dimensions of the Unit 5 cooling tower are 96 feet width by 648 feet length.
Figure 3. Turkey Point Unit 5 24-Cell, Back-to-Back Wet Cooling Tower28
The initial design performance specifications for the Unit 5 cooling tower are provided in Table 2. The initial design specification called for a 22-cell cooling tower with width x length dimensions of 114 feet by 661 feet. The Unit 5 cooling tower that was built is a 24-cell cooling tower, as shown in Figure 3, with dimensions of 96 feet by 648 feet.
Table 2. Initial Design Performance Specifications for the Unit 5 Cooling Tower29 Parameter Value
Number of cells 22 Length, feet 661 Width, feet 114 Deck height, feet 51 Stack height, feet 65 Circulating water flow rate, gallons per minute 306,000 Design hot water temperature, oF 105.2 Design cold water temperature, oF 86.9 Range (difference between hot and cold water temperatures), oF 18.3 Approach temperature, oF30 6.9 Heat rejected, million Btu per hour 2,600
28 Google Earth photograph, downloaded by B. Powers. 29 FPL, Site Certification Application – Turkey Point Expansion Project, Volume 1 of 3, November 8, 2003, Table 3.4-3, p. 3-24; Figure 3.5-1, p. 3-34. 30 The design 1 percent summer wet bulb temperature for Miami, FL is 80 oF. See Ecodyne, Weather Data Handbook, 1980, p. 6-9. Therefore, the approach temperature, assuming no recirculation at the cooling tower, would be: cold water temperature – 1 percent summer design wet bulb temperature = 86.9 oF – 80 oF = 6.9 oF.

8
Evaporative loss in cooling tower, gallons per minute (gpm) 4,214 (6.1 mgd)
Blowdown flowrate, gpm 1,987 (2.9 mgd)
The total design makeup water flowrate for Unit 5 is 12.6 mgd.31 Makeup water for the Unit 5 cooling tower is well water pumped from the Upper Floridan Aquifer.32 However, FPL indicated at the permitting stage of the Unit 5 project that reclaimed water from the Miami-Dade Water and Sewer Department’s (MDWASD) South District Wastewater Treatment Plant would potentially become the source of makeup water for the Unit 5 cooling tower in the future.33 The design Unit 5 “range” for the circulating cooling water is 18.3 oF. Range is the increase in cooling water temperature as it passes through the surface condenser located below the steam turbine. The purpose of the surface condenser is to condense the low pressure steam exiting the steam turbine back to water for return to the steam generators in a closed-loop system. “Approach temperature” is a measure of how close the cooling tower gets the cold water to the 1 percent summer design ambient wet bulb temperature. The conservative design of the Unit 5 cooling tower results in a design cold water temperature significantly lower than the cold water temperature achieved by the CCS.34 This phenomenon is shown in Figure 4. The significance of this lower cold water temperature at peak conditions is that higher gross MW output can be achieved. Figure 4. Comparison of Peak Cold Water Temperatures – Unit 5 Cooling Tower and CCS
31 FPL, Site Certification Application – Turkey Point Expansion Project, Volume 1 of 3, November 8, 2003, Figure 3.5-1, p. 3-34. Design makeup water flowrate is 8,752 gpm (12.6 mgd). 32 Ibid, p. 3-11. 33 Ibid, p. 3-11. 34 The design cold water temperature is the 1 percent summer wet bulb temperature + the design approach temperature. In the case of the Unit 5 cooling tower, the 1 percent summer wet bulb temperature = 80 oF and the design approach temperature is 6.9 oF. Therefore the design cold water temperature for the Unit 5 cooling tower is: 80 oF + 6.9oF = 86.9 oF.

9
Most of the area covered by Unit 5 was marsh land prior to construction of the project, as shown in Figure 5a. Fill was added to increase the elevation of the area where the power block (gas turbines, steam turbine) and the cooling tower are located to an elevation of 14 feet, as shown in Figure 5b. The fill for the site was reclaimed from the limerock that was stockpiled along the CCS berms when the CCS was built.35
Figures 5a and 5b. Construction of Unit 5 Primarily Over Marsh Area36,37
B. CoolingTowersIncludedwithProposedUnits6and7 FPL has also proposed a mechanical draft wet cooling towers for proposed nuclear Units 6 and 7. These round mechanical draft cooling towers, three 12-cell round towers per unit, are shown in Figure 6, along with the general layout of the proposed Units 6 and 7 expansion project.
Figure 6. Round Mechanical Draft Cooling Towers Proposed for Units 6 and 7 (three each per unit)38
35 FPL, Site Certification Application – Turkey Point Expansion Project, Volume 1 of 3, November 8, 2003, p. 3-18. “Fill material will include materials such as limerock stockpiled along the existing cooling canal berms at the Turkey Point Power Plant. The existing stockpiles are the result of the construction and maintenance of the existing cooling canal system.” 36 Ibid, Table 3.4-3, pdf p. 166. 37 Ibid, pdf p. 172. 38 FPL, PSD Application to Florida DEP, 2009, pdf p. 63.

10
The design performance specifications for the proposed Units 6 and 7 cooling towers are provided in Table 3. The specifications shown in Table 3a are for one round tower of the three round towers that collectively serve as the circulating water cooling system for each nuclear unit.
Table 3a. Design Specifications for the Units 6 and 7 Cooling Towers (three per unit)39 Parameter Value
Number of round cooling towers per unit 3 Number of cells per round tower 12 Diameter, feet 246 Height, feet 67 Circulating water flow rate per round tower, gallons per minute 210,367 Design wet bulb temperature, oF40 83.9 Range (difference between hot and cold water temperatures), oF 24.4 Approach temperature, oF41 7.1 Design hot water temperature, oF 108.3 Design cold water temperature, oF 91.0 Heat rejected, million Btu per hour42 2,510 According to FPL’s current plans, the proposed Units 6 and 7 cooling towers may use either reclaimed water delivered by pipeline from MDWASD, or saltwater from radial wells on the Turkey Point site, or a combination of the two sources, as the cooling tower makeup water supply. The normal makeup water flow rates for reclaimed water and saltwater for the Units 6 and 7 cooling towers are shown in Table 3b.
Table 3b. Total Cooling Tower Evaporative Losses and Blowdown Rates for Proposed Units 6 and 7 Cooling Towers43
Reclaimed water, evaporative loss in cooling tower, gpm 28,800 (41.5 mgd)
Reclaimed water, blowdown flowrate, gpm 9,714 (14.0 mgd)
Saltwater, evaporative loss in cooling tower, gpm 28,800 (41.5 mgd)
Saltwater, blowdown flowrate, gpm 57,714 (83.1 mgd)
39 FPL, Turkey Point Units 6 & 7 COL Application Part 3 — Environmental Report – Revision 6, Table 3.4-2, p. 3.4-10. Note: Revision 7 was issued October 14, 2015 but did not include any changes to the Revision 6 Part 3 —Environmental Report. 40 Includes 3.3 oF (recirculating air) interference allowance. 41 The design 1 percent summer wet bulb temperature for Miami, FL is 80 oF. See Ecodyne, Weather Data Handbook, 1980, p. 6-9. Therefore, the approach temperature, assuming no recirculation at the cooling tower, would be: cold water temperature – 1 percent summer design wet bulb temperature = 86.9 oF – 80 oF = 6.9 oF. 42 FPL, Turkey Point Units 6 & 7 COL Application Part 3 — Environmental Report – Revision 6, p. 3.2-4. “The condenser rejects approximately 7.54E9 Btu/hour of waste heat to the circulating water system.” 7,540 million Btu per unit = 7,540 million Btu per hour ÷ 3 cooling towers = 2,510 million Btu per hour per cooling tower. 43 Ibid, p. 3.3-6, p.3.3-8.

11
The cooling towers for the proposed Units 6 and 7 are less conservatively designed than the cooling tower on Unit 5. The design cold water temperature for the proposed Units 6 and 7 cooling towers is 91 oF. In contrast, the design cold water temperature of the Unit 5 cooling tower is 87 oF. These two mechanical draft cooling tower designs represent the range of mechanical draft cooling tower performance that FPL has already employed at Turkey Point (Unit 5) or has proposed to employ (Units 6 and 7).
C. MostRecentLarge‐ScaleCoolingTowerRetrofitatU.S.PowerPlant Two retrofit natural draft hyperbolic cooling towers were completed in May 2012 at the 1,500 MW Brayton Point Station coal- and gas-fired power plant near Fall River, Massachusetts and are shown in Figure 6.44 These cooling towers each have a design circulating water flow rate of 400,000 gpm.45
Figure 6. Natural Draft Hyperbolic Cooling Towers at Brayton Point Station46
D. CoolingTowerEnergyPenalty
A mechanical draft cooling tower retrofit, compared to continued operation of the CCS, would introduce both a net energy gain in the form of higher gross output under design conditions, and a small energy penalty in the form of: 1) extra pumping power needed to pump cooling water through the cooling tower, and 2) electricity demand of large diameter fans in each cooling tower cell.
The U.S. EPA has evaluated these energy penalties as part of the process of establishing national regulations for cooling water intake structures. Both the EPA 316(b) 2001 Phase I Technical Development Document (TDD) for new plants and the 2002 Phase II TDD for existing plants include the average heat rate penalty, fan penalty, and pump penalty for nuclear, fossil fuel, and combined cycle plants.
44 Telephone communication between K. Rahe, Kiewit Infrastructure (Chicago office) and B. Powers, Powers Engineering, July 11, 2016 (Kiewit Infrastructure built the Brayton Point Station cooling towers.) 45 U.S. EPA Fact Sheet, Dominion Energy Brayton Point, LLC Closed Cycle Cooling Tower and Unit 3 Dry Scrubber/Fabric Filter Projects, p. 6. See: https://www.epa.gov/sites/production/files/2015-08/documents/debp-fact-sheet.pdf. 46 Photo downloaded from Dominion Brayton Point Power Station webpage in 2012 (the power plant was sold to Dynegy, Inc. in 2015 and the Dominion Brayton Point Power Station webpage is no longer operational).

12
1. SteamTurbineEfficiencyPotentialImprovementbyConversiontoMechanicalDraftClosed‐CycleCoolingTower
The design cold water temperature for the Unit 5 cooling tower is 87 oF. The typical average maximum cold water temperature produced by the CCS is 93 oF. The higher temperature means higher backpressure on the Units 3 and 4 steam turbines and less gross power output under design conditions. This phenomenon is shown in Figure 7 for Unit 2 of the Indian Point Energy Center in New York.47 The output of Indian Point Unit 2 drops from 976 MW at a cold water temperature of 85 ºF to 963 MW at a cold water temperature of 90 ºF. This is a 13 MW reduction in gross output, greater than 1 percent, due to the turbine efficiency penalty experienced as the cold water temperature rises.
Figure 7. Reduction in MW Output from Indian Point Unit 2 as Hudson River Temperature Increases48
2. Closed‐CycleCoolingPumpandFanPowerDemand
The 2002 Phase II TDD includes the average cooling tower fan energy penalty and pump energy penalty for nuclear, fossil fuel, and combined cycle plants.49 These energy penalties are shown in Table 4.
47 Powers Engineering does not have access to a similar curve for either Turkey Point Units 3 or 4. 48 Enercon, Conversion of Indian Point Units 2 & 3 to a Closed-Loop Cooling Water Configuration, Attachment 1- Economic and Environmental Impacts Associated with Conversion of Indian Point Units 2 and 3 to a Closed-Loop Condenser Cooling Water Configuration, June 2003, p. 21. 49 Ibid, Table 5-12, p. 5-23. The fan power energy penalties shown in Table 4 are for Plant #3 in (EPA TDD) Table 5-12 for a cooling tower with an approach temperature of 10 oF and a flowrate of 243,000 gpm. This is the one larger cooling tower example in Table 5-12. None of the other three cooling towers in Table 5-12 have circulating water flowrates above 30,000 gpm.

13
Table 4. EPA Estimates of Cooling Tower Pump and Fan Power Penalty Plant type Pump power energy
(%)
Fan power energy (%) Total pump and fan power energy (%)
Nuclear
0.57 0.56 1.13
Fossil fuel
0.45 0.45 0.90
Combined cycle
0.15 0.15 0.30
Mechanical draft cooling towers, either back-to-back or round, would have both booster pumps and fans, and associated pump and fan energy penalties. The average nuclear plant mechanical draft cooling tower pump and fan energy penalty would be 1.13 percent based on EPA data. A natural draft hyperbolic cooling tower, such as the natural draft cooling towers shown in Figure 4, would have no fan energy penalty, only a pump energy penalty. The cooling tower pump energy penalty estimated by the EPA for nuclear units is 0.57 percent.50 The advantages of a mechanical draft cooling tower is lower capital cost and lower height than a hyperbolic tower. The advantage of the hyperbolic tower is lower operating cost, as no fan power is required.
E. CoolingTowerInstalledCost The installed cost of the only cooling tower retrofit conducted to date on a U.S. nuclear unit, the 800 MW Palisades Nuclear in Michigan, was $68/kW in 1999 U.S. dollars. This is equivalent to approximately $98/kW in 2015 dollars.51 This retrofit project included the installation of higher head pumps to overcome the hydraulic resistance of the cooling tower(s).52 The two inline mechanical draft cooling towers at Palisades Nuclear are shown in Figure 8a and 8b. Applied to the 816 MW (each) Units 3 and 4 at Turkey Point, which are effectively the same capacity as the Palisades Nuclear unit, the equivalent cost in 2015 dollars would be about $80 million per unit for conventional inline mechanical draft cooling towers, or $160 million for both
50 EPA 2002 Phase II TDD, Table 5-15, Summary of Fan and Pumping Energy Requirements as a Percent of Power Output. 51 Chemical Engineering, Chemical Engineering Plant Cost Index, January 2008 and August 2015 editions. Annual index in 1999 = 390.6; annual index in 2015 = 560.7. Therefore, unit cooling tower retrofit price, adjusted from 1999 to 2015 = (560.7 ÷ 390.6) × $68/kW = $98/kW. 52 U.S. EPA, 2002 Phase II TDD, p. 4-5 (“The final installed cost of the project was $18.8 million (in 1973-1974 dollars), as paid by Consumers Energy. The key items for this project capital cost included the following: two wood cooling towers (including splash fill, drift eliminators, and 36-200 hp fans with 28 ft blades); two circulating water pumps; two dilution water pumps; startup transformers; yard piping for extension of the plant’s fire protection system; modifications to the plant screenhouse to eliminate travelling screens and prepare for installation of the dilution pumps; a new discharge pump structure with pump pits; a new pumphouse to enclose the new cooling tower pumps; yard piping for the circulating water system to connect the new pumphouse and towers; switchgear cubicles for the fans; roads, parking lots, drains, fencing, and landscaping; and a chemical additive and control system.”).

14
units.53 This $160 million capital expense, when amortized over ten years at standard investor-owned utility cost recovery rates, equates to an annual cost of $41 million for both units.54 By way of comparison, the annual revenue generated by Units 3 and 4 is approximately $500 million per year.55 The annual electricity output of Units 3 and 4, at approximately 13,296 gigwatt-hours per year (GWh/yr),56 represents about 10 percent of FPL’s electricity sales in 2015 of 122,756 GWh/yr.57 Assuming an annual FPL revenue stream from energy sales of approximately $5 billion, the energy charge component of a FPL residential customer’s bill would increase about four-fifths of 1 percent with the addition of a $41 million per year capital recovery charge for retrofit cooling towers for Units 3 and 4. Mechanical draft cooling tower retrofit costs at non-nuclear plants are in general agreement with the cost of the Palisades Nuclear cooling tower retrofit. The estimated cost of Georgia Power’s Plant Yates cooling tower retrofit in 2003, a 40-cell back-to-back conventional mechanical draft tower with a design circulating water flowrate of 460,000 gpm, was $75 million.58,59 This project included the addition of a booster pump station. The total cost of the Plant Yates retrofit would be about $105 million adjusted to 2015 dollars.60 Plant Yates is located in Georgia and the plant site has a similar 1 percent summer design wet bulb temperature, 79 oF, to Miami at 80 oF.61 The Plant Yates back-to-back cooling tower is shown in Figures 9a and 9b.
53 $98/kW × 2 × 816,000 kW = $160 million. 54 Energy, Economics, and Environment, Inc. (E3), 33% Renewable Portfolio Standard Calculator 2009 Public Version, “Resource Characterizations” worksheet, cell V71, annualized IOU capital cost factor over 10-year = 0.256. Therefore the annualized cost of the $160 million cooling tower investment would be: $160 million × 0.256 = $41 million per year. 55 2 × 816 MW × 0.93 × 8,760 hr/yr × $37.50/MW-hr [average NERC-reported 2011-2015 FL on-peak day-ahead spot electricity price, Florida (2011-2013) and Southern (2014-2015) regions] = $499 million/yr. Source of 0.93 capacity factor: capacity factor assumed by FPL for proposed Units 6 and 7. Source of 2010-2015 FL average wholesale electricity price: NERC “state of the market” PowerPoint summaries, 2011 through 2015. Note – NERC transitioned to reporting annual average Florida and Southern regional spot electricity prices to Southern regional spot prices only in the 2014 state of the market report. 56 2 × 816 MW × 0.93 × 8,760 hr/yr = 13,295,578 MWh/yr (13,296 GWh/yr) 57 FPL, Ten Year Power Plant Site Plan, 2016-2025, April 2016, p. 29. “Net Energy for Load (NEL) is projected to reach 125,062 GWh in 2025, an increase of 2,306 GWh from the actual 2015 value.” Therefore, FPL supplied: 125,062 GWh – 2,306 GWh = 122,756 GWh in 2015. 58 EPA Region 1, Memorandums on conversion of Yates Plant Units 1-5 to closed-cycle cooling, January and February 2003. The original cost estimate for the Plant Yates cooling tower was $75 million. The estimate was revised to $87 million to address wetland remediation, remediation of old asbestos landfill where towers were to be constructed, and reinforcement of concrete cooling water conduits. 59 T. Cheek - Geosyntec Consultants, Inc. and B. Evans – Georgia Power Company, Thermal Load, Dissolved Oxygen, and Assimilative Capacity: Is 316(a) Becoming Irrelevant? – The Georgia Power Experience, presentation to the Electric Power Research Institute Workshop on Advanced Thermal Electric Cooling Technologies, July 8, 2008, p. 18. Plant Yates cooling tower retrofit cost was $83 million, operational in 2004. 60 Chemical Engineering, Chemical Engineering Plant Cost Index, January 2008 and August 2015 editions. Annual index in 2004 = 444.2; May 2015 index = 560.7. Therefore, unit cooling tower retrofit price, adjusted from 2004 to 2015 = (560.7 ÷ 444.2) × $83 million = $105 million (2015 dollars). 61 Ecodyne, Weather Data Handbook, 1980, p. 6-10 (Newnan, GA).

15
Figure 8a. Mechanical Draft Cooling Towers at Palisades Nuclear – Perspective View62
Figure 8b. Mechanical Draft Cooling Towers at Palisades Nuclear – Plan View63
Figure 9a. Plant Yates 40-Cell Back-to-Back Cooling Tower – Perspective View64
62 Palisades Nuclear webpage: http://palisadespowerplant.com/. 63 Google Earth photograph, overlays by B. Powers. 64 T. Cheek – Geosyntec, Inc., Thermal Load, Dissolved Oxygen, and Assimilative Capacity; Is 316(a) Becoming Irrelevant? – The Georgia Power Experience, presentation to the Electric Power Research Institute Workshop on Advanced Thermal Electric Cooling Technologies, May 8, 2008, p. 18.

16
Figure 9b. Plant Yates 40-Cell Back-to-Back Cooling Tower – Plan View65
The original design of the Turkey Point Unit 5 cooling tower was a 22-cell tower designed to reject 2,600 MMBtu of heat from the circulating cooling water at design conditions.66 The design specifications for this cooling tower were provided in the 2003 site certification application for Unit 5. FPL ultimately built a 24-cell cooling tower, as shown in Figure 3.67 Approximately 6,240 MMBtu of heat must be rejected from the circulating cooling water of Units 3 and 4 (each).68 A linear scale-up of the original 22-cell Unit 5 cooling tower design, to maintain the same design performance while rejecting 6,240 MMBtu/hr of heat, would require a 54-cell back-to-back cooling tower.69 The round mechanical draft cooling towers for the proposed Units 6 and 7 are less conservatively designed than the Unit 5 cooling tower. There is proportionately less circulating water flowing through the Unit 6 and 7 cooling towers. This is reflected in the 24.4 oF design range of the Units 6 and 7 cooling towers, compared to the design range of the Unit 5 cooling tower of 18.3 oF. An increase in the design range of retrofit cooling towers for Units 3 and 4 from 18.3 oF to 24.4 oF, to achieve cooling tower performance similar to the design performance of the proposed Units 6 and 7 cooling towers, would reduce the size of the Units 3 and 4 cooling towers from 54 cells to 40 cells each.70 The design approach temperature would increase incrementally from approximately 7 oF to 8 or 9 oF with the 40-cell back-to-back cooling tower, an increase in approach temperature of 1 to 2 oF.71 SPX Thermal Equipment and Services (SPX), the principal manufacturer of utility-scale cooling towers in North America, provided Powers Engineering with a cost estimate for back-to-back conventional and plume-abated cooling towers for nuclear applications. The generic SPX Thermal Equipment and Services cost estimate is provided in Attachment A. The cost estimate 65 Google Earth photograph, June 12, 2016 download. 66 See Table 2. 67 FPL, Site Certification Application – Turkey Point Expansion Project, Volume 1 of 3, November 8, 2003, Table 3.4-3, p. 3-24; Figure 3.5-1, p. 3-34. 68 See p. 6, footnote 10. 69 (6,240 MMBtu/hr ÷ 2,600 MMBtu/hr) × 22 cells = 53 cells. The total number of cells is rounded to the nearest even number, 54 cells, for consistency with the back-to-back cooling tower design. 70 53 cells ÷ (24.4 oF/18.3 oF) = 39.8 cells. 71 SPX Cooling Technologies, Cooling Tower Information Index, 1986, Figure 5 (tower size factor vs range variance) and Figure 6 [tower size factor vs approach (oF)], pp. 3-4.

17
is based on a circulating cooling water flowrate of 830,000 gpm and heat rejection of 8,300 million Btu per hour (MMBtu/hr) at a West Coast location. The cost estimate assumes premium hardware and California seismic requirements. The SPX-estimated capital cost for a fresh water 54-cell back-to-back mechanical draft cooling tower, composed of three tower sections of 18-cells each and based on the design specifications of the Unit 5 cooling tower, is $145 million (in 2009 dollars).72 The capital cost of this cooling tower in 2015 dollars would be $156 million.73 The cost of two of these cooling towers, for Units 3 and 4, would be approximately $310 million (in 2015 dollars). The annualized cost over ten years of this capital investment would be about $79 million per year.74 The cost of energy production from Units 3 and 4, assuming use of the 54-cell cooling towers, would increase about $5.90/MWh ($0.0059/kWh), with the addition of retrofit cooling towers, or about 16 percent assuming a base case wholesale electricity price of $37.50/MWh.75 The cost of electricity production for the FPL system as whole, of which Units 3 and 4 provide about 10 percent of the annual delivered electricity, would increase about 2 percent with the addition of retrofit cooling towers on Units 3 and 4.76 The interpolated SPX cost estimate for a 40-cell back-to-back cooling tower, assuming a linear cost relationship, is approximately $108 million (in 2009 dollars). The capital cost of this cooling tower in 2015 dollars would be $116 million.77 The 40-cell cooling tower design for Units 3 and 4 is based on the performance specifications for the proposed Units 6 and 7 cooling towers. The cost of two of these cooling towers, for Units 3 and 4, would be approximately $230 million (in 2015 dollars). The annualized cost over ten years of this capital investment would be about $59 million per year.78 The cost of energy production from Units 3 and 4, assuming use of the 40-cell cooling towers, would increase about $4.40/MWh ($0.0044/kWh), with the addition of retrofit cooling towers, or about 12 percent assuming a base case wholesale electricity price of $37.50/MWh.79 The cost of electricity production for the FPL system as whole, of which Units 3 and 4 provide about 12
72 SPX estimates that the non-cooling tower infrastructure cost is approximately three times the cost of the wet cooling tower. These costs include: site preparation, basins, piping, electrical wiring and controls. The cost of a 54-cell wet back-to-back cooling tower is estimated by SPX at $36.4 million. The associated infrastructure cost = 3 x $36.4 million = $109.2 million. Therefore, the total project cost would be: $36.4 million + 109.2 million = $145.6 million. 73 Chemical Engineering, Chemical Engineering Plant Cost Index, January 2008 and August 2015 editions. Annual index in 2009 = 521.9; May 2015 index = 560.7. Therefore, unit cooling tower retrofit price, adjusted from 2009 to 2015 = (560.7 ÷ 521.9) × $145 million = $156 million (2015 dollars). 74 $310 million × 0.256 = $79 million per year. 75 $79 million per year ÷ 13,296,000 MWh per year = $5.94/MWh. This is approximately 16 percent of $37.50/MWh. 76 The primary charges on the customer bill are: 1) transmission and distribution charge, and 2) energy charge. The energy charge is typically the lesser of these two primary charges. 77 Ibid. The unit cooling tower retrofit price, adjusted from 2009 to 2015 = (560.7 ÷ 521.9) × $108 million = $116 million (2015 dollars). 78 $230 million × 0.256 = $59 million per year. 79 $59 million per year ÷ 13,296,000 MWh per year = $4.44/MWh. This is approximately 12 percent of $37.50/MWh.

18
percent of the annual delivered electricity, would increase about 1.5 percent with the addition of retrofit cooling towers on Units 3 and 4.
IV. RetrofitCoolingTowerConfigurationsforUnits3and4
A. GeneralLocationofRetrofitCoolingTowers The one area on the Turkey Point site that has ample space for the Units 3 and 4 mechanical draft cooling towers is adjacent to the Units 3 and 4 discharge canal and is not designated for potential use in the proposed Units 6 and 7 project. This area is shown as a red rectangle in Figure 10. This area is to the immediate east of the site designated as the reclaimed water treatment facility for the Units 6 and 7 cooling towers.80
Figure 10. Proposed Location of Units 3 and 4 Mechanical Draft Cooling Towers81
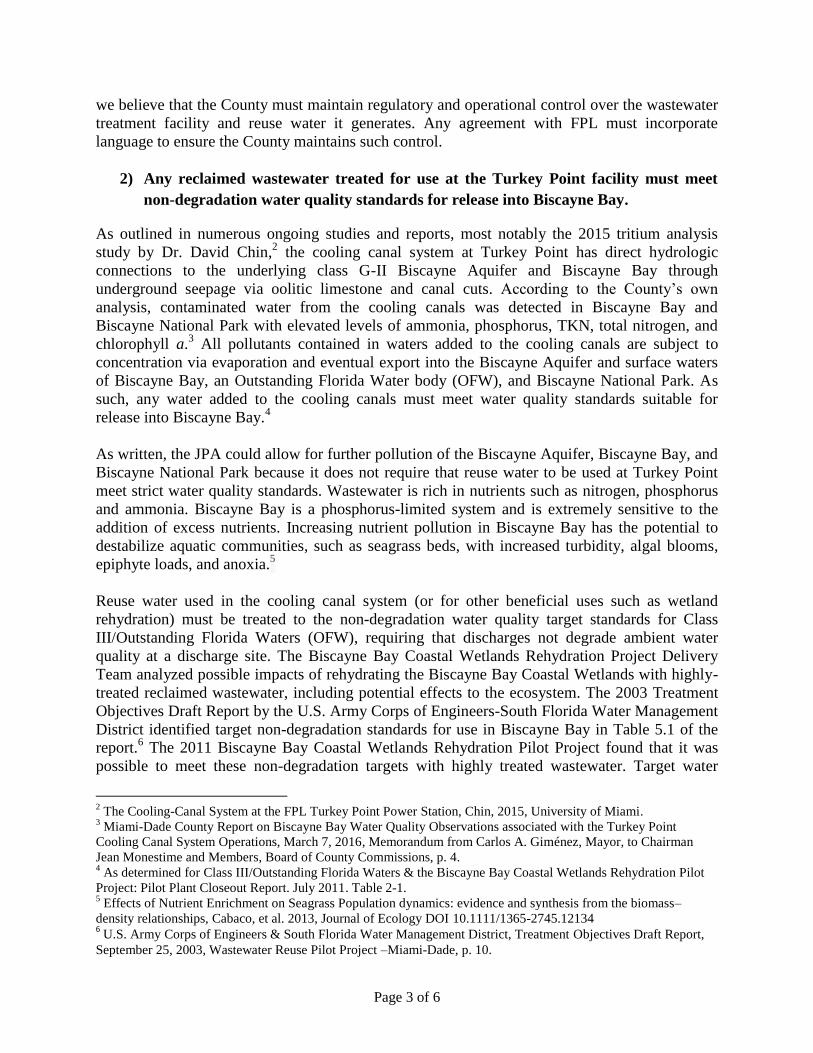
A more detailed view of the proposed location of the Units 3 and 4 cooling towers, as well as existing and proposed infrastructure, is shown in Figure 11.
80 The water supply being treated would be treated wastewater from the Miami-Dade Water and Sewer Department delivered by pipeline to the location. The proposed pipeline is shown in Figure 11. 81 NRC, Draft NUREG-2176, Volume I, February 2015, p. 3-3.
19
Figure 11. General Location of Proposed Units 3 and 4 Cooling Towers and Existing and Proposed Infrastructure at Turkey Point82
B. 54‐CellBack‐to‐BackMechanicalDraftCoolingTowers‐Layout
One potential layout for 54-cell cooling towers for Units 3 and 4 is provided in Figure 12. The cooling towers would be composed of three 18-cell sections. The cool water collected in the cooling tower cold water basin under the cooling tower would flow by gravity back to the return canal leading to the Units 3 and 4 intakes. The source of makeup water currently for the CCS is natural seepage from the surrounding aquifer.83 Reclaimed water from the MDWASD would serve as makeup water for the Units 3 and 4 cooling towers. The cooling tower sections shown in Figure 12 have sufficient spacing to avoid recirculation of warm, moisture-laden exhaust air from one cooling tower section being entrained in the inlet of an adjacent cooling tower section. Appropriate minimum spacing between cooling tower sections to avoid the effects of interference is shown in Attachment B.
82 Ibid, p. 3-7. 83 D. Chin – University of Miami, The Cooling Canal System at FPL Turkey Point Power Station – Final Report, May 2016, p. 37.

20
Figure 12. 54-Cell Back-to-Back Mechanical Draft Cooling Towers
C. 40‐CellBack‐to‐BackMechanicalDraftCoolingTowers‐Layout
A potential layout for 40-cell cooling towers for Units 3 and 4 is provided in Figure 13. The cooling towers would each be composed of one 40-cell cooling tower in a 2×20 back-to-back configuration. This would be the same cooling tower design used at Plant Yates and shown in Figures 9a and 9b.
Figure 13. 40-Cell Back-to-Back Mechanical Draft Cooling Towers84
84 Google Earth photograph, overlays added by B. Powers.

21
D. AdditionalInfrastructureNecessaryforUnits3and4Closed‐Cycle CoolingRetrofits
1. MakeupWaterSource–ReclaimedWaterfromMDWASD Cooling tower makeup water supply would come from reclaimed wastewater provided by the MDWASD. Makeup water is necessary to replace water evaporated in the cooling tower(s) and removed from the circulating water system as blowdown. The reliability of the reclaimed water supply would be assured by constructing treated reclaimed water reservoirs at Turkey Point to assure two-to-three weeks of onsite reclaimed water supply in case of outages at the SDWWTP. This is the reclaimed water supply model that has been used successfully at the 3,900 MW Palo Verde Nuclear plant in Arizona for 30 years. See Attachment C for a detailed description of the Palo Verde Nuclear reclaimed water system. The MDWASD treatment plant closest to Turkey Point, the South District Wastewater Treatment Plant (SDWWTP)about 9 miles north, injects approximately 101 mgd of treated wastewater into the Lower Floridan Aquifer.85,86 The SDWWTP would be the source of reclaimed water supply to Turkey Point. The concept of using MDWASD reclaimed water as cooling tower makeup water supply at Turkey Point is well established. Reclaimed water is the sole source of makeup water supply at Palo Verde Nuclear. Reclaimed water is identified by FPL as the primary source of makeup water for the proposed Units 6 and 7 cooling towers.87 FPL also identified its intention to potentially transition its Unit 5 cooling tower makeup water supply from the Upper Floridan Aquifer to reclaimed water at some point in the future.88 Use of MDWASD reclaimed water as the makeup water supply for the proposed Units 3 and 4 cooling towers would contribute to the resolution of a regional treated wastewater discharge disposal challenge and eliminate evaporative losses of surface water in the CCS due to heated discharge water from Units 3 and 4. MDWASD is required by Florida statute to reuse 60 percent of its ocean outfall discharge by 2025.89 This is equivalent to 117.5 mgd of reuse.90 The 2013
85 Ecology & Environment, Inc., MDWASD Reuse Feasibility Update – Chapter 3: Future Conditions, April 2007, p. 3-6. “The SDWWTP is required to upgrade their treatment to produce effluent meeting FDEP HLD (High Level Disinfection) requirements. The upgrades were deemed necessary following an indication that the deeper Floridan Aquifer (Boulder Zone), where the SDWWTP effluent is injected, is possibly leaking upwards into the Upper Floridan. Since the Upper Floridan is defined as a USDW (Underground Source of Drinking Water) by the EPA, FDEP requires that the SDWWTP effluent meets HLD standards to ensure that any migration of the injected fluid into the Upper Floridan will not have negative impacts on the water quality of the USDW.” 86 E-mail communication between Bertha Goldberg, Assistant Director MDWASD, and Laura Reynolds, Conservation Concepts, LLC, July 7, 2016. 87 FPL, Turkey Point Units 6 & 7 COL Application Part 3 — Environmental Report – Revision 6, p. 3.2-6. 88 FPL, Site Certification Application – Turkey Point Expansion Project, Volume 1 of 3, November 8, 2003, p. 3-11. 89 Chapter 403.086(9)(c)(1), F.S. “(c)1. Each utility that had a permit for a domestic wastewater facility that discharged through an ocean outfall on July 1, 2008, must install, or cause to be installed, a functioning reuse system within the utility’s service area or, by contract with another utility, within Miami-Dade County, Broward County, or Palm Beach County by December 31, 2025. For purposes of this subsection, a “functioning reuse system” means an environmentally, economically, and technically feasible system that provides a minimum of 60 percent of a facility’s

22
MDWASD compliance plan proposed that 90 mgd would be utilized by FPL at Turkey Point for proposed Units 6 and 7.91 However, FPL has officially delayed the Units 6 and 7 project until 2031-2032.92 Therefore the primary MDWASD reuse strategy for 2025 compliance, directing the treated wastewater for use in the Units 6 and 7 cooling towers, is no longer an alternative. An advantage of using MDWASD reclaimed water as Units 3 and 4 cooling tower makeup water is its low salinity. The low salinity of this water supply allows the cooling tower blowdown flowrate to be minimized. This in turn would reduce the quantity of cooling tower wastewater requiring disposal.93 FPL has proposed constructing a reclaimed water treatment facility at Turkey Point to prepare the reclaimed water for use as circulating water system cooling tower makeup for proposed Units 6 and 7.94 The estimated cost of the reclaimed water treatment plant to treat 90 mgd, and the dedicated reclaimed water pipeline from the SDWWTP that would be paid for by Miami-Dade County, is about $400 million.95 The 90 mgd includes reclaimed water supply for the existing Unit 5 cooling tower. The pipeline cost is about $80 million of the $400 million total capital cost.96 This treatment facility could also be constructed, at smaller scale, to treat reclaimed water for use in the Units 3, 4, and 5 cooling towers. The capital cost of the reclaimed water plant, if sized to serve Units 3, 4, and 5 cooling towers, would be in the range of $140 million.97 It would continue
baseline flow on an annual basis for irrigation of public access areas, residential properties, or agricultural crops; aquifer recharge; groundwater recharge; industrial cooling; or other acceptable reuse purposes authorized by the department.” 90 Telephone communication between Bertha Goldberg, P.E., Assistant Director MDWASD, and Laura Reynolds, Conservation Concepts, LLC, July 7, 2016. 91 Ibid. 92 Ibid. 93 FPL, Turkey Point Units 6 & 7 COL Application Part 3 — Environmental Report – Revision 6, p. 3.3-1. 94 Ibid, p. 3.3-3. “The makeup water for the circulating water cooling towers would be treated to prevent biofouling in the raw water supply piping to the circulating water cooling towers. Additional treatment for biofouling, scaling, and suspended matter, with biocides, antiscalants, and dispersants would be performed as needed for the circulating water system and service water system. . . Cooling water chemistry would be controlled by the addition of chemicals and maintaining the proper cycles of concentration.” 95 Miami-Dade County Memorandum, Resolution Authorizing Execution of a Joint Participation Agreement with Florida Power & Light Company to Develop a Reclaimed Water System to Serve the Company’s Turkey Point Facility, R-813-10, July 20, 2010, pp. 1-2. “This agreement represents a significant cost savings to the County within the overall context of reuse mandates. It should be noted that FP&L costs to design, procure and manage the construction of the pipeline plus construction of the additional treatment facilities to reduce nutrient content of the reclaimed water before it is used for cooling are estimated to exceed $400 million for this project. Other options for the County to satisfy WUP requirements, such as ground water replenishment could cost the County at least $300 million more than the option to provide reclaimed water to FP&L . . . The amount payable by the County (for the pipeline) is capped at $78 million (in January 2010) with maximum escalation of 4% per year . . . The attached JPA allocates up to 90 mgd of reclaimed water . . . to cool FP&L’s existing gas powered plant (Unit 5) and the two proposed nuclear power units (Units 6 and 7).” 96 Ibid. 97 Unit 5 cooling tower average evaporative loss = 4,214 gpm (6.1 mgd). See footnote 106. Projected Units 3 and 4 cooling towers evaporative loss (combined) = 20,250 gpm (29.2 mgd). Total evaporative loss in Units 3, 4, and 5 cooling towers = 6.1 mgd + 29.2 mgd = 35.3 mgd . Assume all blowdown water is recycled to makeup water. Therefore approximate reclaimed water average need = 35 mgd. Assume 15 percent additional makeup water needed to meet peak demand, or a peak makeup water demand of 40 mgd. Assuming linear relationship between

23
to be available for use or expansion if proposed Units 6 and 7, or some other steam turbine generator technology, is built at the site to replace Units 3 and 4 when the operating licenses for these units expire in 2032 and 2033.98 MDWASD currently disposes of the treated wastewater by deep well injection at the SDWWTP,99 with the associated high operations and maintenance costs of deep well injection. The cost of treatment of the reclaimed water to the level needed for use in the Units 3 and 4 cooling towers would in part be offset by eliminating the cost of deep well injection of this wastewater. Treated reclaimed water storage reservoirs would also be needed if reclaimed water is the sole source of makeup water for the Units 3 and 4 cooling towers. At Palo Verde Nuclear a reserve reclaimed water supply is maintained in two onsite storage reservoirs. The total storage volume of the two reservoirs is 1.16 billion gallons.100 Makeup water consumption is 43,000 gpm on average (61.9 mgd).101 The storage reservoirs hold about 19 days of makeup water supply at average usage conditions.102 The two storage reservoirs cover 45 acres and 65 acres respectively.103 Turkey Point would require about 665 million gallons of reclaimed water storage to provide 19 days of makeup water supply to Units 3, 4, and 5 cooling towers at average makeup water demand conditions.104 Figure 13 shows two potential locations for reclaimed water storage reservoirs near the proposed Units 3 and 4 cooling tower locations. These two reservoirs, at approximately 40 acres and 60 acres respectively, would provide about 650 million gallons of reclaimed water storage if dredged to a uniform depth of 20 feet.105 This would be sufficient storage to approximately equal the 19 days of stored reclaimed water supply maintained in the two storage reservoirs at Palo Verde Nuclear. Unit 5 draws about 12.6 mgd on average from the Upper Floridian Aquifer for use as makeup water for the Unit 5 cooling tower.106 Another 14 mgd of Upper Floridian Aquifer water is also supplied to the CCS for salinity control.107 This water is brackish, with an average total dissolved
reclaimed water treatment plant size and capital cost, a 40 mgd treatment plant would cost: (40 mgd/90 mgd) × $320 million = $142 million (2010 dollars). 98 Turkey Point Unit 3 NRC webpage, license expires 07/19/2032: http://www.nrc.gov/info-finder/reactors/tp3.html; Turkey Point Unit 4 NRC webpage, license expires 04/10/2033: http://www.nrc.gov/info-finder/reactors/tp4.html. 99 Ecology & Environment, Inc., MDWASD Reuse Feasibility Update – Chapter 3: Future Conditions, April 2007, p. 3-6. 100 B. Lotts – APS, Water and Energy in Arizona - Palo Verde Water Reclamation Facility, PowerPoint presented at 2011 Ground Water Protection Council Annual Forum, Atlanta, September 24-28, 2011, p. 11. 101 Ibid. 43,000 gpm × 60min/hr × 24 hr/day = 61.9 mgd. 102 1,160 million gallons ÷ 61.9 million gallons/day = 18.7 days. 103 B. Lotts, p. 21. 104 35 million gallons/day × 19 days = 665 million gallons. 105 [100 acres/(640 acres/mile2)] × (27,878,400 feet2/mile2) × 20 feet × (7.5 gallons/ft3) = 653.4 million gallons. 106 FPL, Site Certification Application – Turkey Point Expansion Project, Volume 1 of 3, November 8, 2003, Figure 3.5-1, p. 3-34. Design makeup water flowrate is 8,752 gpm (12.6 mgd). 107 Ibid, p. 3.

24
solids (TDS) content of 1,911 ppm.108 The pumping of 14 mgd from the Upper Floridan Aquifer for CCS salinity control can be discontinued when the Units 3 and 4 cooling towers are operational, as makeup water for these cooling towers will be MDWASD reclaimed water and the CCS will no longer be used for cooling. 54-cell cooling tower alternative: A supply of 8,752 gpm from the Upper Floridian Aquifer is the makeup water demand for the designed 309,000 gpm circulating water flowrate of the Unit 5 cooling tower.109 Of this amount, 8.9 mgd (6,201 gpm) is required to make up cooling tower evaporative and blowdown losses.110 The design heat rejection of the Unit 5 cooling tower is 2,600 MMBtu/hr. The design heat rejection of each 54-cell cooling tower for Units 3 and 4 would be 6,240 MMBtu/hr. Therefore the design circulating water flowrate for the Unit 3 and Unit 4 cooling towers assuming a linear scale-up in flowrate, to achieve the Unit 5 cooling tower performance specifications, would be 742,000 gpm each.111 The makeup water flowrate for the Unit 3 and Unit 4 cooling towers to replace evaporation and blowdown losses would be 14,890 gpm each if scaled-up directly from Unit 5 cooling tower design flowrates.112 Of this makeup water flowrate, 68 percent (10,125 gpm per unit) evaporates in the cooling towers and 32 percent (4,765 gpm per unit) is blowdown.113 About 20,250 gpm (29 mgd) of the total makeup water supply for the Units 3 and 4 cooling towers would be lost to evaporation in the towers.114 By way of comparison, the net average evaporation rate of the CCS is approximately 28.7 mgd.115 The Units 3 and 4 cooling tower(s) evaporation rate would be about the same as the net evaporation rate in the CCS. The amount of makeup water is driven by the evaporation rate in the cooling tower(s) and the blowdown rate. The use of low salinity reclaimed water as makeup water supply instead of brackish well water supply can substantially reduce the rate of blowdown necessary to avoid excessive scale buildup in the cooling towers. The amount of blowdown would depend on the “cycles of concentration” maintained in the circulating cooling water.116 Maximizing the cycles of concentration in the circulating cooling water would reduce the makeup water needed to
108 FPL, Site Certification Application – Turkey Point Expansion Project, Volume 1 of 3, November 8, 2003, Table 3.5-1, p. 3-26. 109 Ibid, Figure 3.5-1, p. 3-34. Note that the Unit 5 cooling tower circulating water flowrate is identified as both 306,000 gpm and 309,000 gpm in the source document. 110 FPL, Site Certification Application – Turkey Point Expansion Project, Volume 1 of 3, November 8, 2003, Figure 3.5-1, p. 3-34. The average “evaporation and drift” (4,214 gpm) and blowdown (1,987 gpm) rates for the Unit 5 cooling tower sum to 6,201 gpm. 6,201 gpm = 6,201 gpm × 60 min/hr × 24 hr/day × (1 mgd/106 gallons-day) = 8.9 mgd. 111 (6,240 MMBtu/hr ÷ 2,600 MMBtu/hr) × 309,000 gpm = 742,000 gpm. 112 (742,000 gpm ÷ 309,000 gpm) × 6,201 gpm = 14,890 gpm. 14,890 gpm × 60 min/hr × 24 hr/day = 21.4 mgd. 113 FPL, Site Certification Application – Turkey Point Expansion Project, Volume 1 of 3, November 8, 2003, Figure 3.5-1, p. 3-34. Percentages are derived from the design makeup water evaporation and drift (4,214 gpm), and blowdown (1,987 gpm) average rates for the Unit 5 cooling tower. Evaporation and drift loss replacement is 68 percent of the total (10,125 gpm), and blowdown is 32 percent of the total (4,765 gpm). 114 10,125 gpm × 2 = 20,250 gpm. 20,250 gpm × 60 min/hr × 24 hr/day= 29.2 mgd. 115 D. Chin – University of Miami, The Cooling Canal System at FPL Turkey Point Power Station – Final Report, May 2016, p. 39. 116 Water Technology Report, Cycles of Concentration, March 30, 2015: https://watertechnologyreport.wordpress.com/tag/cycles-of-concentration/. “Cycles of concentration (COC) is defined by the ratio of the dissolved solids in the tower water to the dissolved solids in the makeup.”

25
replace blowdown. This would also minimize the blowdown flowrate. This is discussed in more detail in the discussion of the blowdown treatment system. FPL is currently permitted to pump up to 100 mgd of fresh water from the L-31E Canal into the CCS to reduce temperature in the June 1 – November 30 period.117 Fresh water pumping from the L-31E Canal to the CCS would no longer be needed if use of the CCS for heat rejection is discontinued in favor of retrofit Units 3 and 4 cooling towers. 40-cell tower alternative: Cooling towers for Units 3 and 4 that are sized based on the Units 6 and 7 cooling tower performance specifications would require 25 percent less makeup water. Total circulating water flowrate per cooling tower would be reduced from 742,000 gpm to 557,000 gpm.118 However the makeup water flowrate to replace evaporative loss in the Units 3 and 4 cooling towers would remain approximately 29 mgd, as the same amount of heat would need to be rejected via evaporation as in the 54-cell cooling tower alternative. The makeup water needed to replace blowdown would be minimized by maximizing the cycles of concentration in the circulating cooling water.
2. BlowdownDischargeSystem–ZeroLiquidDischarge The circulating cooling water will have to be continuously blown down to prevent a build-up of solids in the cooling towers. The precipitation of solids degrades the thermal efficiency of the cooling system. Use of reclaimed water as the makeup water source will allow for production of a highly concentrated, relatively low-flow blowdown stream. This has been done in actual practice for thirty years at the 3,900 MW Palo Verde Nuclear in Arizona.119 Secondary treated municipal wastewater is from the City of Phoenix is utilized as cooling tower makeup water.120 The cooling towers are operated on average at 24 cycles of concentration at Palo Verde.121 Lime soda softening and soda ash softening are used to remove scaling agents such as hardness, alkalinity, ortho-phosphate, and silica.122 Average makeup water total dissolved solids (TDS) concentration is about 1,000 parts per million (ppm).123,124 In contrast, the TDS of MDWASD treated wastewater is substantially lower at approximately 375 ppm.125 Circulating cooling water TDS at Palo Verde is about 24,000 ppm.126 117 Ibid, p. 3. 118 742,000 gpm × (18.3 oF/24.4 oF) = 557,000 gpm. 119 J. Maulbetsch, M. DiFilippo, Performance, Cost, and Environmental Effects of Saltwater Cooling Towers, CEC-500-2008-043, prepared for California Energy Commission - Public Interest Energy Research Program, January 2010, pp. 39-40 (C.6 Palo Verde Nuclear Generating Station). 120 Ibid, p. 39. 121 Ibid, p. 40. 122 Ibid, p. 39. 123 Ibid, p. 40. 124 ppm = milligram per liter (mg/l). 125 V. Walsh – MDWASD, Tracing Vertical and Horizontal Migration of Injected Fresh Wastewater into a Deep Saline Aquifer using Natural Chemical Tracers, 20th Salt Water Intrusion Meeting, June 2008, p. 2. 126 J. Maulbetsch, p. 40. The 24,000 ppm TDS concentration in the Palo Verde cooling tower(s) blowdown is about 70 percent of the TDS concentration in seawater (~35,000 ppm).

26
This high degree of concentration will allow for a zero liquid discharge (ZLD) system of reasonable capital and operating cost to treat the blowdown from the Units 3 and 4 cooling towers. Almost all the water in the blowdown, greater than 95 percent, is recycled in the ZLD system as purified water and available for reuse.127 The purified water produced by the ZLD system would be re-utilized as makeup water to the Units 3 and 4 cooling towers. Solid residue produced by the ZLD process would be landfilled. ZLD technology can be used to treat cooling system blowdown discharges from Units 3 and 4 cooling towers as an alternative to deep well injection. ZLD uses reverse osmosis and crystallizers to recycle cooling tower blowdown to produce clean water and a solid salt cake residue as end products.128 A brief primer on ZLD technology and cost is presented in Attachment D. A description of the ZLD system in use on the Arizona Public Service 1,060 MW Redhawk combined-cycle power plant is provided in Attachment E. Units 3 and 4 cooling towers will produce a total of about 900 gpm (1.3 mgd) of cooling tower blowdown at 24 cycles of concentration, using the same design ratio of blowdown flowrate to total makeup water flowrate as is used in the Palo Verde Nuclear cooling towers.129 The installed capital cost of a ZLD treatment system capable of treating 900 gpm of cooling tower blowdown is approximately $32 million in 2016 dollars, based on an extrapolation of the capital cost of the ZLD system in use at the 1,100 MW APS Redhawk power plant.130 The primary operating cost of the ZLD system is electric power. A 900 gpm system would have an electric power demand of approximately 5,500 kW,131 equivalent to an annual power cost of about $2 million per year.132 Round-the-clock operator costs and maintenance costs would add another $1 million per year in annual operating costs.133 As noted, more than 95 percent of the blowdown water processed in the ZLD system could be reused as makeup water. In addition, the Unit 5 cooling tower blowdown, averaging 1,987 gpm, is directed to the existing Units 3 and 4 discharge canal.134 The circulating water in the discharge canal would pass through the Units 3 and 4 cooling towers. As a result, the design of the ZLD system must take into account the additional TDS burden imposed by the Unit 5 cooling tower blowdown. The additional TDS burden from the Unit 5 blowdown would result in a “composite” makeup water
127 E-mail from Stephen Heal - Vice President Sales & Marketing, Veolia Water Technologies, to B. Powers, Powers Engineering, July 5, 2016. 128 Global Water Intelligence, From zero to hero – the rise of ZLD, December 2009. See also Attachment D. 129 (volumetric flow of total makeup water)/(volumetric flow of blowdown) = cycles of concentration (CoC). Therefore, (evaporative loss + blowdown flow)/(blowdown flow) = CoC. (20,250 gpm + 900 gpm)/900 gpm = 23.5. And 900 gpm × 60 min/hr × 24 hr/day= 1.27 mgd. 130 E-mail from Stephen Heal - Vice President Sales & Marketing, Veolia Water Technologies, to B. Powers, Powers Engineering, July 4, 2016. 131 Ibid. 132 5,500 kW × (1 MW/1,000 kW) × $37.50/MW-hr × 8,760 hr/yr = $1.81 million/yr. 133 Stephen Heal, July 4, 2016. 134 GeoTrans, Inc., Draft Feasibility Study to Assess Engineering Options for Stopping Western Migration of Saline Water and Decreasing Cooling Canal System Concentrations, Turkey Point Plant, Florida – Attachment 1, August 11, 2010, , pdf p. 33.

27
TDS to the Units 3 and 4 cooling towers of less than 1,000 ppm.135 As a result, it is reasonable to assume 24 cycles of concentration are achievable in the Units 3 and 4 circulating cooling water, based on the 24 cycles of concentration achieved at Palo Verde with a makeup water TDS concentration of about 1,000 ppm. ZLD technology is cost-effective and would eliminate cooling tower blowdown discharges from the Units 3 and 4 cooling towers. Use of ZLD would also reduce makeup water demand proportionate to the amount of water recycled onsite by use of the ZLD system. In the case of a 900 gpm ZLD system to treat blowdown from Units 3 and 4 cooling towers, almost all of the 900 gpm of purified water produced by the ZLD process, about 1.3 mgd,136 could be reused as makeup water for the cooling towers.
3. ChemicalTreatmentofCirculatingCoolingWater The chemical treatment applied to circulating cooling water serving the Units 3 and 4 cooling towers will follow the protocol used by FPL on Unit 5 circulating cooling water:137
Intermittent shock chlorination or other oxidizing or non-oxidizing biocides will be used to prevent biofouling of the heat rejection system. A chlorine solution will be feed into the cooling water. A scale inhibitor will be fed to the circulating water system to control the formation of calcium carbonate scales. These scales can adhere to heat transfer surfaces and impair cooling condenser performance. Sulfuric acid will be added to the circulating water system to reduce alkalinity in the circulating water makeup, thus reducing the likelihood of scale formation. In addition, a polymer may be added to the circulating water system to help hold suspended solids in suspension. Cooling tower makeup water will be pretreated by chemical softening prior to addition to the cooling tower basin.
135 Total reclaimed water makeup for evaporative loss in Units 3 and 4 cooling towers = 20,250 gpm @ TDS of 375 ppm. Design blowdown discharge from Unit 5 = 1,987 gpm @ ~5,700 ppm (3 cycles of concentration. See FPL, Site Certification Application – Turkey Point Expansion Project, Volume 1 of 3, November 8, 2003, Figure 3.5-1, p. 3-34). The additional TDS in the Unit 5 blowdown would add in effect a maximum of about 560 ppm per gpm to the reclaimed water makeup supply: 1,987 gpm/20,250 gpm = x ppm/ 5,700 ppm. 5,700 ppm × (1,987 gpm/20,250 gpm) = 559 ppm. Therefore, the maximum TDS concentration in Units 3 and 4 makeup water supply, accounting for the Unit 5 cooling tower blowdown TDS contribution, is: 375 ppm + 559 ppm = 934 ppm. This composite Units 3 and 4 makeup water TDS concentration of 934 ppm is approximately equivalent to the Palo Verde makeup water TDS concentration of about 1,000 ppm. 136 900 gpm × 60 min/hr × 24 hr/day = 1.29 mgd. 137 FPL, Site Certification Application – Turkey Point Expansion Project, Volume 1 of 3, November 8, 2003, p. 3-14.
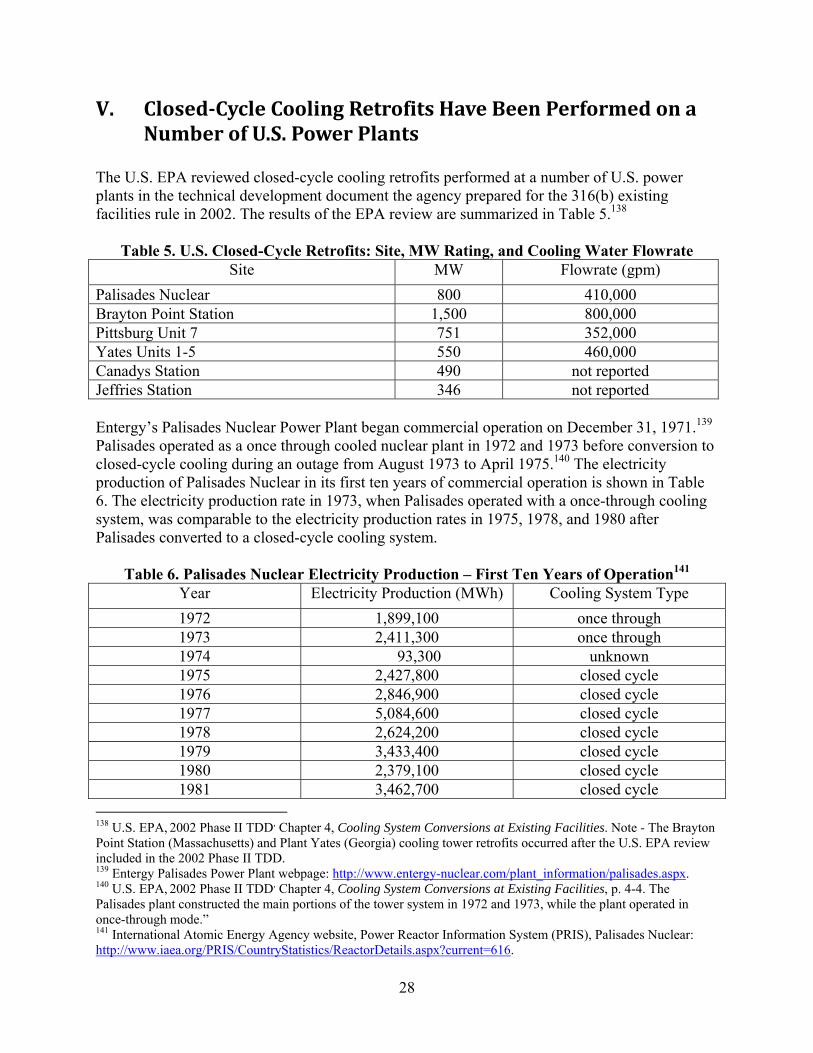
28
V. Closed‐CycleCoolingRetrofitsHaveBeenPerformedona NumberofU.S.PowerPlants The U.S. EPA reviewed closed-cycle cooling retrofits performed at a number of U.S. power plants in the technical development document the agency prepared for the 316(b) existing facilities rule in 2002. The results of the EPA review are summarized in Table 5.138
Table 5. U.S. Closed-Cycle Retrofits: Site, MW Rating, and Cooling Water Flowrate Site
MW Flowrate (gpm)
Palisades Nuclear 800 410,000 Brayton Point Station 1,500 800,000 Pittsburg Unit 7 751 352,000 Yates Units 1-5 550 460,000 Canadys Station 490 not reported Jeffries Station 346 not reported Entergy’s Palisades Nuclear Power Plant began commercial operation on December 31, 1971.139 Palisades operated as a once through cooled nuclear plant in 1972 and 1973 before conversion to closed-cycle cooling during an outage from August 1973 to April 1975.140 The electricity production of Palisades Nuclear in its first ten years of commercial operation is shown in Table 6. The electricity production rate in 1973, when Palisades operated with a once-through cooling system, was comparable to the electricity production rates in 1975, 1978, and 1980 after Palisades converted to a closed-cycle cooling system.
Table 6. Palisades Nuclear Electricity Production – First Ten Years of Operation141 Year
Electricity Production (MWh) Cooling System Type
1972 1,899,100 once through 1973 2,411,300 once through 1974 93,300 unknown 1975 2,427,800 closed cycle 1976 2,846,900 closed cycle 1977 5,084,600 closed cycle 1978 2,624,200 closed cycle 1979 3,433,400 closed cycle 1980 2,379,100 closed cycle 1981 3,462,700 closed cycle
138 U.S. EPA, 2002 Phase II TDD, Chapter 4, Cooling System Conversions at Existing Facilities. Note - The Brayton Point Station (Massachusetts) and Plant Yates (Georgia) cooling tower retrofits occurred after the U.S. EPA review included in the 2002 Phase II TDD. 139 Entergy Palisades Power Plant webpage: http://www.entergy-nuclear.com/plant_information/palisades.aspx. 140 U.S. EPA, 2002 Phase II TDD, Chapter 4, Cooling System Conversions at Existing Facilities, p. 4-4. The Palisades plant constructed the main portions of the tower system in 1972 and 1973, while the plant operated in once-through mode.” 141 International Atomic Energy Agency website, Power Reactor Information System (PRIS), Palisades Nuclear: http://www.iaea.org/PRIS/CountryStatistics/ReactorDetails.aspx?current=616.

29
The NRC reported the following causes for the Palisades August 1973 to April 1975 outage:142 An outage was initially estimated for 3 months to repair [the plant’s steam generators]. Internal reactor problems and a waste gas release investigation prolonged the outage into 1974. The new cooling towers were completed and placed in operation and the turbine‐ generator was overhauled.... [Consumers Power] filed a suit against several vendors for startup problems with the condenser, [steam generators], and core internals. Turbine repairs and condenser‐retubing extended the outage even further.
According to an article in the October 1974 issue of Nuclear News, Consumers Power had said that the outage was “due principally to steam generator corrosion and damage caused by vibration of the reactor core internals, as well as defective main condenser design and tubing.” As a result, Consumers Power sued Bechtel Corporation and four other companies who helped to build the Palisades nuclear plant because “equipment supplied [in 1966 and 1967] was defective” and that defective equipment had not been promptly and adequately repaired.143
VI. OtherClosedCycleRetrofitsHaveEncounteredSpace LimitationsandHaveRe‐UtilizedExistingCoolingSystem Equipment
Some of the cooling tower retrofits listed in Table 7 encountered space limitations and incorporated to a degree some components of the existing once-through cooling system. Space limitations are not an issue if the Units 3 and 4 cooling towers are located as shown in Figures 11 and 12. A brief description of the details of each of the closed-cycle retrofits examined by the EPA is provided in Table 7.144
Table 7. Issues Encountered on U.S. Closed-Cycle Cooling Retrofits Site Issues
Palisades Nuclear
New equipment, in addition to the two cooling towers, included two circulating water pumps, two dilution water pumps, startup transformers, a new discharge pump structure with pump pits, a new pump house to enclose the new cooling tower pumps, and yard piping for the circulating water system to connect the new pump house and towers.
Yates Units 1-5
Back-to-back 2×20 cell cooling tower. 1,050 feet long, 92 feet wide, 60 feet tall. Design approach is 6 oF. Cooling tower return pipes discharge into existing intake tunnels. Circulating pumps replaced with units capable of overcoming head loss in cooling tower. Condenser water boxes reinforced to withstand higher system hydraulic pressure. Existing discharge tunnels blocked. New concrete pipes connect to discharge tunnels and transport warm water to cooling tower.
142 NRC, Nuclear Power Plant Operating Experience Summary, NUREG/CR-6577, p. 243. 143 D. Schlissel – Synapse Energy Economics, letter report regarding closed-cycle cooling conversion outage duration re EPA’s NODA for Phase II Cooling Water Intake Regulations, submitted to Riverkeeper, Inc., May 30, 2003, p. 2. 144 Ibid.

30
Pittsburg Unit 7
Cooling towers replaced spray canal system. Towers constructed on narrow strip of land between canals, no modifications to condenser. Hookup time not reported.
Canadys Station
Distance from condensers to towers ranges from 650 to 1,700 feet. No modifications to condensers. Hookup completed in 4 weeks.
Jefferies Station
Distance from condensers to wet towers is 1,700 feet. No modifications to condensers. Two small booster pumps added. Hookup completed in 1 week.
VII. TheNRCDoesNotConsidertheCirculatingCoolingWater SystemasaNuclearSafety‐RelatedSystem Under the U.S. Nuclear Regulatory Commission (NRC) regulatory regime, the circulating water system at an operating nuclear plant is not considered a “safety related” system because it functions on the non-nuclear side of the facility, separate from the emergency core cooling system and other plant safety systems.145 The NRC’s review of the operability of a plant’s circulating water system is generally focused on the question of whether a failure of this system could affect a safety-related component or system.146 For example, Bechtel determined in September 2014, at the request of the California State Water Resources Control Board and under contract to plant owner Pacific Gas & Electric, that no NRC license amendment process would be triggered by the conversion from once-through cooling to closed-cycle cooling at 2,200 MW Diablo Canyon nuclear plant on the California coast. Bechtel concluded that any NRC review process, if any was initiated by the NRC, would be conducted in parallel with state permit reviews and would not introduce additional delay in the project schedule:147
Although we believe that the 10 CFR 50.59 process required to make any plant modification would not result in the need for a licensing amendment, it is likely that the U.S. Nuclear Regulatory Commission (USNRC) would be involved in reviewing this change, which may result in a detailed regulatory review process. It is assumed that any USNRC review would be conducted in parallel with the various state permit reviews.
In the case of Turkey Point Units 3 and 4, the modifications would be substantially less intrusive than the proposed cooling tower retrofit project at Diablo Canyon. In the case of Turkey Point, the conversion would be from one type of closed-cycle cooling, the CCS, to cooling towers. The
145 See NUREG-0800, Standard Review Plan for the Review of Safety Analysis Reports for Nuclear Power Plants, Revision 3, March 2007, Section 10.4.5, available at http://www.nrc.gov/reading-rm/doc-collections/nuregs/staff/sr0800/, last accessed August 16, 2012. 146 Ibid. 147 Bechtel Power Corporation, Addendum to the Independent Third-Party Final Technologies Assessment for the Alternative Cooling Technologies or Modifications to the Existing Once-Through Cooling System for Diablo Canyon Power Plant Addressing the Installation of Saltwater Cooling Towers in the South Parking Lot, September 17, 2014, p. 5.

31
intake and discharge structures at Turkey Point Units 3 and 4 would not be modified, as shown in Figures 12 and 13.
VIII. Closed‐CycleRetrofitsDoNotRequireExtended UnscheduledOutages Much of the work related to a closed-cycle retrofit can be carried out while the power generation units are online. Hook-up of the cooling tower requires an outage. The duration of the two retrofits for which detailed information is available, Canadys and Jefferies Station, was four weeks or less. The Yates Unit 1-5 conversion was accomplished without any additional outage time for the retrofit. However, the retrofit was apparently carried out during a time of low power demand when Units 1-5 could be offline for extended periods without impacting the dispatch schedule of the plant.148 The EPA assessed the outage time required for a cooling tower retrofit at a nuclear plant in its 2002 TDD:149
The Agency estimates for the flow-reduction regulatory options considered that the typical process of adjoining the recirculating system to the existing condenser unit and the refurbishment of the existing condenser (when necessary) would last approximately two months. Because the Agency analyzed flexible compliance dates (extended over a five-year compliance period), the Agency estimated that plants under the flow reduction regulatory options could plan the cooling system conversion to coincide with periodic scheduled outages, as was the case for the example cases. For the case of nuclear units, these outages can coincide with periodic inspections (ISIs) and refueling. For the case of fossil-fuel and combined-cycle units, the conversion can be planned to coincide with periodic maintenance. Even though ISIs for nuclear units last typically 2 to 4 months, which would extend equal to or beyond the time required to connect the converted system, the Agency estimates for all model plants one month of interrupted service due to the cooling system conversion.
All Units 3 and 4 cooling tower construction activities can proceed with Units 3 and 4 online.
IX. AchievableTimelineforCompletingUnits3and4Cooling TowerProjectIsFourtoFiveYears
A. 1,500MWBraytonPointStationCoolingTowers‐Permittingand ConstructionCompletedinLessThan4.5Years
Permitting and construction of the Units 3 and 4 cooling towers and associated infrastructure can occur in four to five years based on the actual permitting and construction timelines for the
148 EPA Region 1, Memorandums on conversion of Yates Plant Units 1-5 to closed-cycle cooling, January and February 2003. 149 2002 TDD, p. 2-9. The EPA provided a longer nuclear plant outage estimate for cooling tower conversions in the 2011 TDD for the proposed 316(b) regulation. However, EPA provided no new substantive information in the 2011 TDD to support a longer outage estimate for nuclear plants.

32
cooling tower retrofit at 1,500 MW Brayton Point Station. The EPA Region 1 December 2007 order addressing the conversion of Brayton Point Station from once-through cooling to closed-cycle cooling towers established regulatory timelines for: 1) acquiring necessary permits and approvals, and 2) construction.150 A maximum of 15 months was allocated in the order to acquire the permits and approvals and issue a notice to proceed with cooling tower engineering and procurement.151 The order also stipulated that within 36 months of obtaining all permits and approvals, the cooling towers had to be fully operational.152 Dominion Energy was given 52 months by EPA Region 1 to complete the cooling tower conversion project, from January 2008 to May 2012. The two hyperbolic cooling towers at Brayton Point Station, shown in Figure 7, had to be operational by May 13, 2012.153 The total project timeline, from initiating work on permits and approvals to operational cooling towers, was 53 months. There is no technical or administrative reason that the permitting and construction of the Units 3 and 4 cooling tower project should take any longer than the permitting and construction of the Brayton Point Station cooling towers.
B. PermittingCanBeCompletedinApproximatelyOneYear In addition to the Brayton Point Station cooling towers, other large-scale power projects with major environmental issues have been permitted in approximately one year. The California Energy Commission consistently completed combined National Environmental Policy Act/California Environmental Quality Act application reviews and approvals for construction of utility-scale solar thermal projects in the 2009-2010 timeframe in twelve to thirteen months.154 These projects each covered thousands of acres of undeveloped public land with substantial endangered species issues. In contrast, the proposed Units 3 and 4 cooling towers and associated infrastructure would largely be located on either previously developed land or land designated for development on the Turkey Point site. Also, the purpose of the project would be to reduce impacts on marine and subterranean ecosystems, by reducing MDWASD ocean outfall discharges and the impacts of
150 U.S. Environmental Protection Agency Region I - New England, Docket 08-007, In the matter of Dominion Energy Brayton Point, LLC, Brayton Point Power Station, Somerset, Massachusetts, NPDES Permit No. MA0003654Proceedings under Section 309(a)(3) of the Clean Water Act, as amended, Findings and Order for Compliance, December 17, 2007. 151 Ibid, p. 5. “By January 2, 2008, commence the process to obtain all permits and approvals . . . Within five days of obtaining all permits and approvals or April 6, 2009, whichever is later, issue the Notice to Proceed with Engineering and Procurement for cooling tower construction to Dominion's contractor.” 152 Ibid, p. 6. “Within 36 months of obtaining all permits and approvals, (Dominion Energy must) complete tie-in of all condenser units such that all permit limits are met.” 153 EPA Region 1, NPDES Permit No. MA0003654 - Authorization (issued to Dominion Energy Brayton Point, LLC) to Discharge Under the National Pollutant Discharge Elimination System, February 29, 2012. 154 1,000 MW Blythe Solar Power Project, application filed August 24, 2009, approved September 15, 2010: http://www.energy.ca.gov/sitingcases/blythe_solar/index.html; 250 MW Genesis Solar Energy Project, application filed August 31, 2009, approved September 29, 2010: http://www.energy.ca.gov/sitingcases/genesis_solar/index.html; 250 MW Abengoa Mojave Solar Project Power Plant, application filed Aug. 10, 2009, approved Sept. 8, 2010: http://www.energy.ca.gov/sitingcases/abengoa/index.html.

33
hypersaline seepage from the CCS into the underlying aquifer. The permit to construct the Units 3 and 4 cooling towers can be obtained in one year if it is a state and county priority to issue the permit.
C. ConstructionCanBeCompletedinApproximatelyThreeYears Other large-scale cooling tower retrofits in addition to Brayton Point Station have been constructed in approximately three years. Two examples are Palisades Nuclear and Plant Yates. Palisades Nuclear began procurement and construction of retrofit cooling towers in mid-1971 and the cooling towers were operational in mid-1974.155 These cooling towers are shown in Figures 8a and 8b.Georgia Power received regulatory approval to install the 40-cell back-to-back cooling tower at Plant Yates in August 2001 and the cooling tower was operational in 2004.156,157
These cooling towers are shown in Figures 9a and 9b.
X. Conclusion Closed-cycle mechanical draft cooling towers are a feasible and cost-effective alternative to the CCS, even if Units 3 and 4 operate for as little as ten years with the cooling towers in operation. A conversion to cooling towers would eliminate: 1) the transfer of up to 100 mgd of water from the L-31E Canal to the CCS for water temperature control purposes, and 2) the pumping of 14 mgd of Upper Floridan Aquifer supply for salinity control in the CCS. Use of MDWASD reclaimed wastewater as cooling tower makeup water would also reduce the environmental impacts of the current MDWASD of deep well injection at its SDWWTP, and provide Units 3 and 4 with a low salinity makeup water supply. This in turn would allow for a cost-effective ZLD system that would eliminate wastewater discharges from the Units 3 and 4 cooling towers. The use of mechanical draft cooling towers with ZLD technology at Turkey Point Units 3 and 4 represents the best available technology for eliminating surface water thermal discharge impacts and hypersalinity impacts on the aquifer underlying the CCS.
155 EPA, 2002 TDD, p. 4-3. Procurement and construction of the cooling tower system began in mid- to late-1971. The cooling towers became operational in May 1974. 156 Georgia Department of Natural Resources, response letter re Georgia Power Company, Plant Yates Consent Order No. EPD-WQ-3742, NPDES Permit No. GA0001473, Coweta County, Georgia, August 16, 2001. “We (Georgia DNR) concur with your choice to construct an evaporative cooling tower.” 157 T. Cheek - Geosyntec Consultants, Inc. and B. Evans – Georgia Power Company, Thermal Load, Dissolved Oxygen, and Assimilative Capacity: Is 316(a) Becoming Irrelevant? – The Georgia Power Experience, presentation to the Electric Power Research Institute Workshop on Advanced Thermal Electric Cooling Technologies, July 8, 2008, p. 18. Plant Yates cooling tower became operational in 2004.

Attachment A
Nuclear Plant Retrofit Comparison for Powers Engineering 9-June-2009 Case 1A Case 2A Case 1B Case 2B Water Salt Salt Fresh Fresh Type ClearSky BTB Wet BTB ClearSky BTB Wet BTB Cells 3x22=66 3x18=54 3x20=60 3x18=54 Footprint 3@529x109 3@433x109 3@481x109 3@433x109 Rough Budget $115.6 million $38.6 $109.1 $36.4 Basis: 830,000 gpm at 108-88-76. Plume point is assumed at 50 DB/90% RH. Low clog film type fill is used for all of the selections, assuming any fresh water used would likely be reclaimed water of some sort. Low clog fill has been used successfully in various sea water applications. Intake screens would be required for the make-up sea water to limit shells, etc. Make-up for the ClearSky tower would be approximately 80-85% of the wet tower make-up on an annual basis. Budget is tower only, not including basins. Infrastructure cost is estimated by some at 3 times the cost of the wet tower, including such things as site prep, basins, piping, electrical wiring and controls, etc. Sub-surface foundations such as piling can add significantly, and may be necessary for a seacoast location. The estimates above are adjusted for premium hardware and California seismic requirements, which are a factor in the taller back-to-back (BTB) designs both for wet and ClearSky. These are approximate comparisons. Both the wet towers and ClearSky towers could likely be optimized more than what has been estimated here, and may have to be tailored to actual site space in any event. ClearSky has pump head like a wet tower, is piped like a wet tower, and has higher fan power than a wet tower to accommodate the increased air flow and pressure drop. Coil type wet dry towers would cost significantly more, with premium tube (titanium for sea water, and possibly for reclaimed water) and header materials. An appropriate plenum mixing design has yet to be developed, but would also require non-corrosive materials and high pressure drop on the air side. No coil type BTB wet dry towers are likely to be proposed.

Bill Powers
From: [email protected]: Tuesday, June 09, 2009 9:27 AMTo: [email protected]: Nuclear Comparison
Page 1 of 1
6/14/2009
Bill, A comparison of wet and ClearSky back to back towers for a reference duty is included in the attached summary.
Paul Lindahl, LEED AP Director, Market Development SPX Thermal Equipment & Services 7401 W 129th St Overland Park, KS 66213 TEL 913.664.7588 MOB 913.522.4254 [email protected] www.spxcooling.com www.balcke-duerr.com/
The information contained in this electronic mail transmission is intended by SPX Corporation for the use of the named individual or entity to which it is directed and may contain information that is confidential or privileged. If you have received this electronic mail transmission in error, please delete it from your system without copying or forwarding it, and notify the sender of the error by reply email so that the sender’s address records can be corrected.

Attachment B

tundamentalsfrorn &e fnmfudge srxd experience
of th entire SHK Cooling Tet*rnohgis staff.
Edlted by.!drn C. Hen$ky
SECOND EtsMON
PnHiehed bf$Plt tuling Tee$rn@i6 lne.
&rerhnd Farlq l(ansas USA
gFxffissrlt-|f, rl TEGiltol"oslEt

Copl6igft0 m9br
StrCsoBrg:lWbqkraA[ &ft}r'nss€nsd
Thh book rlr finy part l|trrto* mH nst hc rWm*rca0in ary {mn utlt.*rt mffian pame*{on d the prrbH*r.
Pthgd in lfio t*tfoad fua Ef Alrtorirn

1 Tower Length
*\'"
g'(}(}ID
fl
$ector of no lfiterference
eril;-I
*rrF.s
SECTION I
"!/r Tcwer l-sngth
coOcoc
Fi$*re $7 - ftoper onbnta&or at t*wers in a pevailing langitudinatwind. {Raquries refatively minimal tower size adjustrneof l0cornperrsafe fr raarculafiixt and i*tefi*rence efecg.)
The % sf tswar length separation ts pnirnarilya functisn of Itxe tower's Fhyaical cfraracterietics
/'loccoccl,/,/
Ftgure 38 * ftoper *rienaffan sf tawers in a pra,.eiling iroadsrde wind. {Requires *igrificanfiy greater tarryer size adjusrrnert foccroponsate {or rwircalation end foiff{erence effecta}
Icccocol ./Y
3/. Tower Length
usE(}'aed]
$ector of no tnterference
fE\ts\*\_ cB-a-\{}
2V

Attachment C

Water and Energy in Arizona
Bob Lotts Arizona Public Service Company
Outline
91st Avenue Wastewater Treatment Plant
Palo Verde Water Reclamation Facility (WRF)

91st Avenue WWTP

91st Avenue Statistics • Capacity 204.5 MGD
• 229,000 AF/year • Treating 135 MGD
• 152,000 AF/year • 65,000 AF/year to Palo Verde
• Palo Verde receives and additional 5,000 to 10,000 AF/year from the cities of Tolleson and Goodyear
• 30,000 AF/year to Buckeye Irrigation • 28,500 AF/year to Tres Rios Wetlands
An acre foot of water = 325,851 gallons

Palo Verde Nuclear Generating Station Water Reclamation Facility

Nuclear Plant Water Use
24
Primary Loop
Secondary Loop
Tertiary Cooling Loop

Water in the Desert
Because of its desert location, Palo Verde is the only nuclear power facility that uses 100 percent reclaimed water for cooling. Unlike other nuclear plants, Palo Verde maintains “Zero Discharge,” meaning no water is discharged to rivers, streams or oceans.

Water Reclamation Facility
The Palo Verde Water Reclamation Facility (WRF), is a 90 MGD tertiary treatment plant that reclaims treated secondary effluent from the cities of Phoenix, Scottsdale, Tempe, Mesa, Glendale and Tolleson.

Conveyance System
Phoenix-area Water
Treatment Plants
28.5 miles of gravity flow with 100-foot elevation drop, 8 miles pumped flow with 150-foot elevation increase
8 miles of 66” pressure flow pipe 22.5 miles of 96”
gravity flow pipe
6 miles of 114” gravity flow
pipe
Hassayampa Pump Station

Inspection and Maintenance of 36-mile Pipeline

CHEMICAL SOLIDS HANDLING
ON SITE LANDFILL
INFLUENT FROM WWTP
PUMP STATION
Cooling Water Treatment Systems
COOLING TOWERS
STORAGE 1.16 B Gals
TRICKLINGFILTERS
PUMP STATION
Cold Process Lime and Soda Ash Softening for
Reduction in Scaling Potential
GRAVITY FILTRATION
100 tons/day average
43 KGPM Average 60 KGPM Summer 28 KGPM Winter
CHEMICAL STORAGE, MIX AND ADDITION
SYSTEMS
Lime Slurry
Soda Ash
Carbon Dioxide
Sulfuric Acid
Processing WWTP Effluent

Trickling Filters
Treatment of the secondary effluent begins with biological de-nitrification to remove ammonia, which takes place in the Trickling Filters.
This process involves treated effluent trickling down over a biological growth maintained on plastic media.
12

1st Stage Solids Contact Clarifiers
After the addition of the Slaked Lime to the influent of the 1st Stage Solids Contact Clarifiers elevating the pH to 11.2, hardness causing minerals settle to the bottom of the Clarifier in the form of a heavy sludge.
This sludge is raked to the middle of the Clarifier and pumped from the system for recycle and disposal.
13

2nd Stage Solids Contact Clarifiers
In the Second Stage Clarifiers, the pH is lowered to 10.2 by the addition of Carbon Dioxide Gas.
This pH drop and the addition of Soda Ash solution causes the precipitation of additional Calcium and further reduces hardness.
14

Gravity Filters
The effluent from the 2nd Stage SCC flows to a common header where the pH is adjusted to 9.2 and goes to the 24 Mixed Media Gravity Filters.
These Mixed Media Filters contain a layer of Anthracite Coal over a layer of Sand.
They serve as a final polishing process to remove particulate Calcium.
15
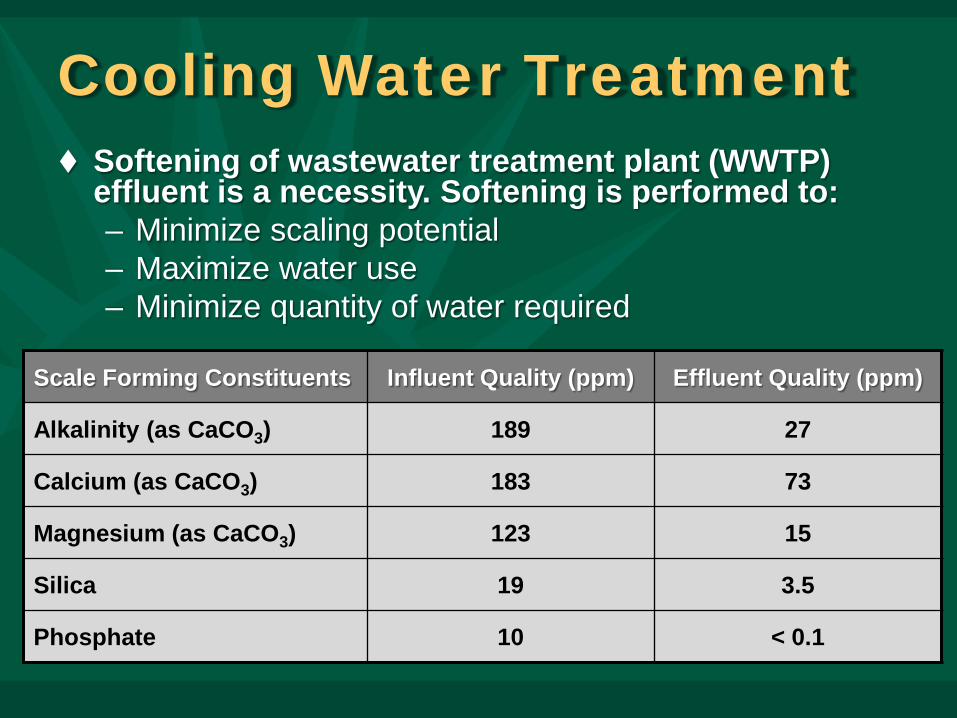
Cooling Water Treatment Softening of wastewater treatment plant (WWTP)
effluent is a necessity. Softening is performed to: – Minimize scaling potential – Maximize water use – Minimize quantity of water required
Scale Forming Constituents Influent Quality (ppm) Effluent Quality (ppm)
Alkalinity (as CaCO3) 189 27
Calcium (as CaCO3) 183 73
Magnesium (as CaCO3) 123 15
Silica 19 3.5
Phosphate 10 < 0.1


Water Use 2010 cooling water Intensity
– 778 gallons/MWh • 10 yr avg. = 764 gals/MWh
2010 cooling water use – 74,560 acre feet
• 10 yr avg. = 66,538 acre feet – 25 billion gallons
» ≈ 38,000 Olympic-sized swimming pools
» ≈ 100 Empire State Buildings
Cooling Water cycles – 23.3 - 5 year average
• 25,000 – 29,000 TDS PPM

2010 Water Use by Type
Groundwater 19%
Surface Water 18%
Effluent 63%
Ground water
3%
Effluent 97%
19
Total APS 2010 Water Use = 119,692 AF
Palo Verde 2010 Water Use = 74,560

Site Aerial Photo
• Cooling Tower Blowdown (Annual Rate) – 950 Million Gallons – 2,900 Acre Feet – ~4% of the treated water
• Evaporation Rate 60-72 inches/yr – 3,250 - 3,900 AF/yr
• Note redundancy in impoundments, allows for relining in 20 years

Groundwater Monitoring Approximately 50 on-site
monitoring wells
Located down-gradient of structures that contain water and at the site boundary
Palo Verde has installed many more wells than required allowing for early leak detection capabilities
21

Ancillary WRF Systems Domestic Water
– Reverse osmosis units fed from on site wells to provide all potable water needs.
– All WRF Operations personnel are required to have State Certification through Arizona Department of Environmental Quality (ADEQ).
Demineralized Water – Mixed bed demineralizer utilized to meet high purity
water requirements for the site.
Sodium Hypochlorite Generation – Electrolytic cells used to produce bleach from brine.

Attachment D

3/14/2014 From zero to hero – the rise of ZLD | Global Water Intelligence - Archive: Global Water Intelligence
http://www.globalwaterintel.com/archive/10/12/market-insight/from-zero-to-hero-the-rise-of-zld.html 1/11
From zero to hero – the rise of ZLD
Subscription required
As a guest you can read up to 3 full articles before a subscription is required.You can read a further 2 articles for free.Subscribe Now (/subscribe-now/), Sign up for a Free Trial (/free-trial/), Log In (/accounts/login/)
Regulatory drivers are ensuring that zero liquid discharge is gaining in popularity. Capital andoperating costs can still prove prohibitive, as Gord Cope discovers.
If there was ever a Holy Grail of water recovery and reuse in an industrial plant, then it is undoubtedly zeroliquid discharge, or ZLD. While it may be difficult and expensive to achieve, zero liquid discharge is easy todefine.
(http://www.veoliawaterst.com/)
From: Vol 10, Issue 12 (December 2009) (/archive/10/12/)Category: Market insight (/archive/10/12/market-insight/)Country:Related Companies: Aquatech (/company/aquatech/), Enel (/company/enel/), General Electric (GE)(/company/general-electric-ge/), HPD (/company/hpd/), Resources Conservation Company(/company/resources-conservation-company/), Royal Dutch Shell (/company/royal-dutch-shell/) andSiemens Water Technologies (/company/siemens-water-technologies/)
(/)
Quick search

3/14/2014 From zero to hero – the rise of ZLD | Global Water Intelligence - Archive: Global Water Intelligence
http://www.globalwaterintel.com/archive/10/12/market-insight/from-zero-to-hero-the-rise-of-zld.html 2/11
“A ZLD system means that no liquid waste leaves the boundary of the facility,” says Keith Minnich, Veolia’svice president of water solutions and technologies. “Technically, that could mean you have a big pond insidethe fence, but the term usually refers to a mechanical system of an evaporator and a crystallizer.”
There are thousands of evaporator/ crystallizer thermal systems in use around the world, serving a widevariety of sectors. Chemical plants use them to make chloride for feedstock in the plastics industry. The foodand beverage industry produces powdered coffee and milk. But relatively few of these systems (a total ofjust over 100 worldwide), are designed purely as ZLD systems, in which the purpose is to recover and reuseas much water as possible.
Although dozens of regional companies supply various components for evaporation and crystallization, theZLD niche is dominated by three major players: Aquatech, GE Power and Water, and HPD, a subsidiary ofVeolia. “HPD is the largest evaporation and crystallization company in the world,” says Minnich. “We haveclose to 700 systems in many different sectors: pulp and paper, salt, chemical processing, oil and gas,biofuels, and power generation. Many of these installations are not ZLD systems; they are part of a systemused to produce an industrial product.” In all, total capital investment in ZLD systems around the world isestimated to be between $100-200 million per year.
Most industrial processes create a wastewater stream. This can be bleed from boilers, blowdown fromcooling towers, or saline water from crude oil extraction. Reverse osmosis and other membranetechnologies can cut the stream by 80% or more, but a facility inevitably still ends up with a significant flow ofconcentrated liquid waste.
Generally speaking, the smaller the volume, the easier it is to dispose of. “In conventional processes, youtypically get sludge with 30 to 40% solids, whereas in a ZLD system the solids content ranges between 85and 95%, thus providing a much lower volume and dryer sludge,” says Anant Upadhyaya, senior vicepresident of corporate growth at Aquatech, which entered the ZLD space in 2000 through its acquisition ofAqua-Chem. “Why not minimize the wastewater by recovering and reusing water, which is essentially whatthe ZLD process does?”
The ZLD process creates solid waste using two devices – evaporators and crystallizers. Evaporators, whichcan concentrate brines up to 250,000 ppm TDS, are designed to be extremely energyefficient by usingmechanical vapour recompression, or VPR. “If you were to simply boil water on a stove, it would take 1,000Btus to boil one pound of water,” says Minnich. “But if you use VPR, it only takes 30 Btus.” In the VPRevaporator process, water is heated until it boils at 100°C. The vapour goes into a centrifugal compressorwhich compresses it slightly, making the temperature rise. The boiling takes place on a thin-film heat transfersurface, where steam condenses on one side and water boils on the other side.
When the brine concentration exceeds 250,000 ppm TDS, it is pumped under high pressure from theevaporator to a forced circulation crystallizer. The brine is released into a vessel where the pressure falls, theremaining water boils off and the salts crystallize. This salt is still slightly damp, but conforms to EPA soliddisposal standards. The salt cake, which is a fraction of the original waste stream, is then disposed of inlandfill.

3/14/2014 From zero to hero – the rise of ZLD | Global Water Intelligence - Archive: Global Water Intelligence
http://www.globalwaterintel.com/archive/10/12/market-insight/from-zero-to-hero-the-rise-of-zld.html 3/11
There are several drivers for the adoption of ZLD. “Water is a resource that is getting scarce in manygeographic locations,” says Upadhyaya. “In many locations in the US, the Middle East, Africa, India andChina, less than 5% of wastewater is presently recovered. With water becoming so scarce, the very first thingthat comes to mind is: why are we wasting so much? The first inclination is to recover and recycle.”
A second motivator is the growing social responsibility of recycling and reuse. “The EU has many countrieswith limited resources,” says Upadhyaya. “Those circumstances have led to a compulsion toward minimumwastage, maximum reuse. Twenty years ago, there was little of that in North America, but now we recyclebottles, newspapers and plastics. Society deems it worthwhile to do so, and technologies have evolved tomake economic recycling possible.”
A third driver is economics. As potable water becomes scarcer in many jurisdictions, its price rises. Inaddition, as regulations on the discharge of waste fluids into open waterways become more stringent,treatment costs rise. Customers look at the potential for savings, comparing the cost of ZLD to the cost offresh water and the savings on sludge disposal. Regulation represents the biggest incentive by far. “Nobodyputs in a ZLD unless they have to, because it’s very expensive,” says Tim Cornish, marketing manager forHPD. “It’s driven by discharge regulations.”
Don’t pass the saltIt was US federal regulatory pressure that gave birth to the ZLD sector. “Back in the 1970s, they were havinga salinity problem in the Colorado River,” says Minnich.
“As a result, regulations were created prohibiting discharge of cooling tower blowdown into the river.Evaporation-based technology was developed to recover the water and concentrate the salt. The distillateevaporated and was returned to the power plant, and the highly concentrated brine went to a crystallizerwhere it was processed into salt cake. The systems would handle 500-2,000 GPM. There were dozensbuilt.”
Since then, many state jurisdictions have added salt discharge restrictions to their own statutes. “In placeslike Colorado, Arizona and California, they are regulating discharge to the point where it’s almost ZLD,” saysCornish.
Increasingly, the decision to install ZLD is made for a combination of reasons. Italy derives a significantamount of electricity from coal, and in addition to boiler blowdown, coal-fired power plants must also dealwith liquid waste generated from flue gas scrubbers. “When plants burn coal, flue gases are discharged intothe atmosphere,” says Upadhyaya. “Years ago, we realized that the gases were very acidic, toxic andcaused damage. Regulations were then mandated that the flue gases be scrubbed, and contaminantstransferred from vapour to liquid phase. This produced a high amount of wastewater requiring complextreatment.” Enel, a large power utility in Italy, wanted to address this issue. “Their vision was to be compliantwith the ideology of environmental conservation. They wanted to set an example of environmentalstewardship and social responsibility.”

3/14/2014 From zero to hero – the rise of ZLD | Global Water Intelligence - Archive: Global Water Intelligence
http://www.globalwaterintel.com/archive/10/12/market-insight/from-zero-to-hero-the-rise-of-zld.html 4/11
Enel had other motives, too. Water in some plant locations was scarce, and opposition vocal. “When youinclude ZLD in a greenfield application, you obviate the need for the permitting of liquid disposal,” saysUpadhyaya. “This puts you on the fast track for regulatory approval in sensitive environment zones. In theend, they decided having the ZLD approach was worth it to them.”
Aquatech supplied equipment to five of Enel’s coal-fired facilities. “Each plant has a custom-designedtreatment train,” says Upadhyaya. “In one of the plants, the main equipment consisted of two de-calcifiersand two brine concentrators. They handled 1,744m3/d, recovering 1,555m3/d, which left less than 200m3/dof solids.”
Zero has its minusesThe main disadvantage to ZLD is its capital cost. A large industrial facility with a traditional wastewatertreatment system costing approximately $20 million can recover and reuse up to 80% of its liquid wastestreams. The 1,000 GPM (3.8m3/ min) evaporator and crystallizer system necessary to capture the last 20%can, however, double that cost.
A second factor is the operating budget. Although ZLD systems are built from corrosion-resistant titaniumand highnickel stainless steel and don’t require a lot of repair, energy costs are high. “Evaporators andcrystallizers use a lot of electricity,” says Minnich. “A desalination plant might use 2-4 kWh/m3, but thesesystems use 20-40 kWh/m3.”
As a result, very few municipalities – which generally have high wastewater flows with low TDSconcentrations – use ZLD unless forced to by unusual circumstances. “There are inland municipaldesalination plants,” says Minnich. “They use groundwater with 2,500-15,000 ppm TDS to produce drinkingwater. These plants produce a waste brine stream with approximately 80,000 ppm dissolved solids.Environmentally acceptable brine disposal can be a problem. Not only that, there is still a lot of water left inthe brine. ZLD using evaporation and crystallization is expensive, and municipalities don’t want to pay thecost. VWS has a process called Zero Discharge Desalination (ZDD), which can recover 97% of the water fedto an inland desalination plant, compared to the typical 80%. This technology uses electrodialysis and issuitable for municipal applications.”
Even when circumstances such as regulation and scarcity oblige industry to adopt ZLD, great care is takento limit its role. According to Siemens Water Technologies, which recently installed a ZLD system at anautomotive plant in Mexico, the first step is a water audit to identify the sources and types of wastewatergenerated in a facility in terms of flow and TDS content.
Some sources generate high concentrations of organic compounds, salts, metals and suspended solids.Others are relatively clean, such as condensate and stormwater, and require little cleaning. Secondly, theaudit identifies points where fresh water and make-up water are used, and in what quantities and qualities.Some applications do not require water to be treated to a potable standard, for example fire water, utilitywater, process water and cooling water. By matching appropriate water requirements and waste streams,the amount of wastewater that ultimately enters the ZLD system can be greatly diminished.
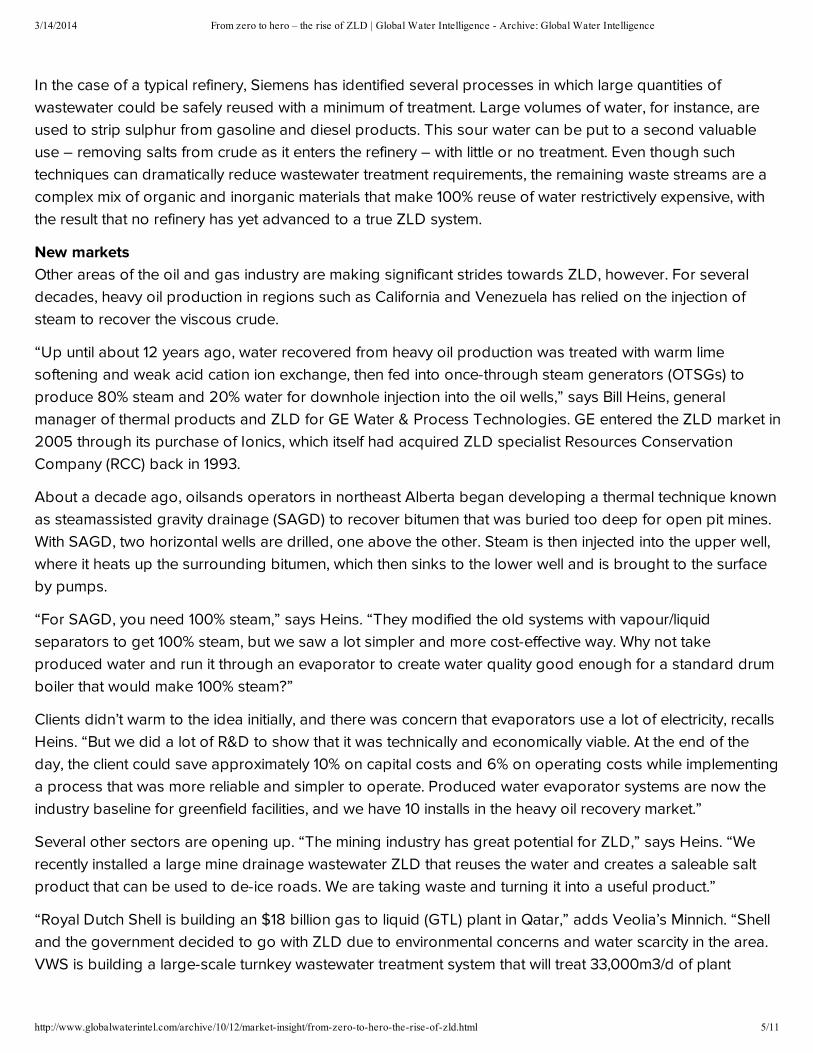
3/14/2014 From zero to hero – the rise of ZLD | Global Water Intelligence - Archive: Global Water Intelligence
http://www.globalwaterintel.com/archive/10/12/market-insight/from-zero-to-hero-the-rise-of-zld.html 5/11
In the case of a typical refinery, Siemens has identified several processes in which large quantities ofwastewater could be safely reused with a minimum of treatment. Large volumes of water, for instance, areused to strip sulphur from gasoline and diesel products. This sour water can be put to a second valuableuse – removing salts from crude as it enters the refinery – with little or no treatment. Even though suchtechniques can dramatically reduce wastewater treatment requirements, the remaining waste streams are acomplex mix of organic and inorganic materials that make 100% reuse of water restrictively expensive, withthe result that no refinery has yet advanced to a true ZLD system.
New marketsOther areas of the oil and gas industry are making significant strides towards ZLD, however. For severaldecades, heavy oil production in regions such as California and Venezuela has relied on the injection ofsteam to recover the viscous crude.
“Up until about 12 years ago, water recovered from heavy oil production was treated with warm limesoftening and weak acid cation ion exchange, then fed into once-through steam generators (OTSGs) toproduce 80% steam and 20% water for downhole injection into the oil wells,” says Bill Heins, generalmanager of thermal products and ZLD for GE Water & Process Technologies. GE entered the ZLD market in2005 through its purchase of Ionics, which itself had acquired ZLD specialist Resources ConservationCompany (RCC) back in 1993.
About a decade ago, oilsands operators in northeast Alberta began developing a thermal technique knownas steamassisted gravity drainage (SAGD) to recover bitumen that was buried too deep for open pit mines.With SAGD, two horizontal wells are drilled, one above the other. Steam is then injected into the upper well,where it heats up the surrounding bitumen, which then sinks to the lower well and is brought to the surfaceby pumps.
“For SAGD, you need 100% steam,” says Heins. “They modified the old systems with vapour/liquidseparators to get 100% steam, but we saw a lot simpler and more cost-effective way. Why not takeproduced water and run it through an evaporator to create water quality good enough for a standard drumboiler that would make 100% steam?”
Clients didn’t warm to the idea initially, and there was concern that evaporators use a lot of electricity, recallsHeins. “But we did a lot of R&D to show that it was technically and economically viable. At the end of theday, the client could save approximately 10% on capital costs and 6% on operating costs while implementinga process that was more reliable and simpler to operate. Produced water evaporator systems are now theindustry baseline for greenfield facilities, and we have 10 installs in the heavy oil recovery market.”
Several other sectors are opening up. “The mining industry has great potential for ZLD,” says Heins. “Werecently installed a large mine drainage wastewater ZLD that reuses the water and creates a saleable saltproduct that can be used to de-ice roads. We are taking waste and turning it into a useful product.”
“Royal Dutch Shell is building an $18 billion gas to liquid (GTL) plant in Qatar,” adds Veolia’s Minnich. “Shelland the government decided to go with ZLD due to environmental concerns and water scarcity in the area.VWS is building a large-scale turnkey wastewater treatment system that will treat 33,000m3/d of plant

3/14/2014 From zero to hero – the rise of ZLD | Global Water Intelligence - Archive: Global Water Intelligence
http://www.globalwaterintel.com/archive/10/12/market-insight/from-zero-to-hero-the-rise-of-zld.html 6/11
effluents. It uses physical chemical-membrane, biological and thermal ZLD systems to recover all of thewater for reuse in the plant. It produces a dry salt that is disposed of on site.”
POET, the world’s largest producer of ethanol, recently installed a ZLD system in its 34 million gallons peryear (353m3/d) Bingham Lake, Minnesota, facility. The production of one gallon of ethanol normally usesabout 3.5 gallons (13.25 litres) of water. POET had already met all state discharge regulations, but wanted toeliminate discharge completely. Their new system recycles about 20 million GPY (207m3/d) of treatedwastewater that was formerly discharged into the drought-prone agricultural district.
ZLD also has great potential in the development of shale gas. “Shale gas recovery uses a lot of water tofracture the rock,” says GE’s Heins. “The water comes back up with up to 15,000 ppm TDS. Traditionally,they take that water and haul it far away for disposal. That’s very expensive. We’re looking at onsitetreatment and reuse in fracturing to minimize or eliminate the need to haul it. We are poised to deliver ourfirst system to the field. There are dozens of shale basins in North America, and regulations are pushingtoward treating the fracture water.”
R&D sumsThe fact that operating costs are high naturally means that R&D in the ZLD arena has been directed towardsfinding alternatives to energy-intensive evaporator/ crystallizer systems. “There have been attempts to usereverse osmosis-based technology for power plant ZLD systems, but they just haven’t been very effective,”says Minnich. “The membranes foul faster than they are supposed to.”
Progress has been made in lowering capital costs, however. “When we started out seven years ago, we hada total installed cost factor of 5.0,” says Heins. “That meant that a $10 million unit cost $50 million afterinstallation. Now, we’re on our fourth generation modular design, and we’ve reduced the total installed costfactor down to 1.8-2.0. A $10 million unit now costs $18-$20 million total installed. That makes producedwater evaporation a lot more economically viable.”
Although the recession has had a negative impact on many sectors of the economy, ZLD has not sloweddramatically. In fact, industry analysts predict a cumulative annual growth rate for recovery/ reuse systems inexcess of 200% over the next decade, of which a significant portion could be accounted for by ZLDcapacity. “The economic and regulatory climate is such that ZLD or near zero discharge is going to continueto grow rapidly,” says Cornish. “We see great potential.”
0 1Like9 0 0Reddit

Attachment E

WATER TECHNOLOGIES
Zero Liquid Discharge (ZLD) SystemPower Industry | Case Study
Project Description
The Client’s Needs
Arizona Public Service Redhawk Power StationArlington, AZ USA
The Redhawk Power Station is comprised of two 2x1 combined cycle natural gas-fired units to produce a total of 1,060 MW of electrical power. Critical to the planning and permitting of this facility was the source and utilization of water and the environmental impact of the station with respect to liquid emissions.
Based upon these issues, Redhawk was designed to use reclaimed municipal effluent from the nearby Palo Verde Nuclear Generating Station for its process water requirements. What is unique about this source of water is that it’s supplied by several neighboring City of Phoenix municipal treatment facilities with their associated seasonable variability. The plant would also be designed to utilize well water as a contingency and achieve in either case, high-quality water for continuous reuse throughout the plant.
The second critical aspect is the permitted requirement as a Zero Liquid Discharge facility. As regulated, no aqueous waste can be discharged from site operations into the environment. The wastewater treatment system must be designed to remove contaminants and recycle high-quality water back into the process.
This closed loop integration of the overall water cycle must be achieved over the complete range of feed water conditions as well as support plant operations. The treatment system must produce of high-purity water, maintain cooling tower conditions for high availability, and comply with the Zero Liquid Discharge mandate.
APS (Arizona Public Service) has been a leading provider of electricity and energy products and services to the Western United States for over a century.
With power plants located throughout the Southwestern United States, APS provides natural-gas, coal and nuclear generated electrical power to the region.

Zero Liquid Discharge (ZLD) System
Project & Technology Solutions
Veolia Water TechnologiesPlainfield, IL USA Getxo, Vizcaya, Spain tel +1 815 609-2000 tel +34 94 491 40 92www.veoliawatertechnologies.com/hpdevaporation • [email protected]
Turnkey Scope of SupplyVeolia was the sole point of responsibility in providing a design-build solution for the complete wastewater portion of the plant which included:
• All major process equipment• Mechanical erection• Buildings• Utility piping and valves• Electrical hardware and cabling• Overall control system• Insulation and painting• Structural support and access steel• Training of staff, commissioning and start-up
support
The ResultsThe turnkey project was efficiently completed and the wastewater treatment plant commissioned by Veolia Water Technologies in the promised time frame.
Since the commissioning of the integrated ZLD system in 2002, the Redhawk Power Station has successfully accomplished the goal of effectively recycling the waste created by cooling tower blowdown and producing high-quality water while adhering to the Zero Liquid Discharge mandate.
The Zero Liquid Discharge (ZLD) System had to reclaim water resources and reject waste properly as an integrated component of the power station. APS selected Veolia Water Technologies to design and build a process system utilizing HPD® evaporation and crystallization technologies, which were the key elements in the overall design.
The evaporator was designed to receive 450 gpm of high-salinity blowdown from the cooling towers. The compressor-driven HPD evaporator pre-concentrates the brine and produces high-purity distillate for recycling to the cooling tower and service water system.
Concentrate from the evaporator is advanced to a forced circulation crystallizer where the salts that form the impurities are crystallized and sent to a centrifuge for dewatering. The HPD crystallizer is also compressor driven and produces distillate that is combined with that of the evaporator for recycle.

US ARMY CORPS OF ENGINEERS SSOOUUTTHH FFLLOORRIIDDAA WWAATTEERR MMAANNAAGGEEMMEENNTT DDIISSTTRRIICCTT
TTRREEAATTMMEENNTT OOBBJJEECCTTIIVVEESS DDRRAAFFTT RREEPPOORRTT SSEEPPTTEEMMBBEERR 2255,, 22000033
Wastewater Reuse Pilot Project -Miami-Dade
Project Managers
John Keiser, U.S. Army Corps of Engineers Jose L. Lopez, SFWMD
COMPREHENSIVE EVERGLADES RESTORATION PLAN

Treatment Objectives Report October 3, 2003
- 2 -
Table of Contents
1. Introduction. 2. Objectives 3. Background information
3.1 Miami-Dade Wastewater Treatment Facilities Performance Report and Potential for M-D Influent/Effluent Changes
3.2 Review of Existing Reports/Studies 3.3 Regulations Report 3.4 Receiving Water Quality Report
4. Treatment Objectives 5. Conceptual Treatment Process 6. Summary

Treatment Objectives Report October 3, 2003
- 3 -
1. Introduction Task 37-2230 of the Wastewater Reuse Pilot Project Project Management Plan (PMP) established the preparation and distribution of a Treatment Objective Report for the pilot project. This report provides a useful frame of reference and basis for comparison to be used in the technology research contract for the selection and design of treatment trains. As the final water quality objectives are not available until the discharge permits are received, the water treatment objectives shall be designed in accordance with permits and any applicable stringent regulatory requirements, including narrative antidegradation standards for Outstanding Florida Waters, during the PPDR phase. The environmental staff and PDT members will review and comment on the Treatment Objective Report prepared by District Project Manager, and the document shall be presented at a PDT meeting.
2. Objective
The goal of this report is to develop treatment objectives that can be used by the PDT for evaluation and comparison of various advanced wastewater treatment technologies. This report includes summary data compiled from other more detailed reports on existing wastewater quality, general regulatory requirements, and long-term monitoring of Biscayne Bay surface waters. These results were used to guide development of numerical targets to address narrative antidegradation standards for Biscayne Bay, an Outstanding Florida Water, which will ultimately receive the reclaimed water generated during the pilot project..
3. Background information As noted in the Work Breakdown Schedule of the PMP there are four precedent tasks to the Treatment Objective Report:
Miami-Dade Wastewater Treatment Facilities Performance Report and Potential for M-D Influent/Effluent Changes report (Tasks 37- 2210 and 37-2200)
Review of Existing Reports/Studies (Task 37-2180) Regulations Report (Task 37-2200) Receiving Water Quality Report (Task 37-3475)
3.1 Miami-Dade Wastewater Treatment Facilities Performance Report and Potential for M-D Influent/Effluent Changes report
This report reviews the existing information provided by the Publicly Owned Treatment Works (POTWs) and DERM, and identifies the physical, chemical and biological characteristics of the influent and effluent wastewater of the three regional POTWs operated by the Miami-Dade Water & Sewer Department (MDWASD). Understanding the characteristics of the wastewater and the performance of the existing wastewater treatment facilities, currently in operation in Miami-Dade, provides a basis for determining appropriate and cost effective tertiary treatment

Treatment Objectives Report October 3, 2003
- 4 -
technologies for reclaimed water. The South Miami-Dade District Wastewater Treatment (SMDWWT) Facility consists of influent screening, four (4) aerated grit chambers, six (6) oxygenation trains, two (2) cryogenic oxygen plants, six (6) final clarifiers, a chlorination system, an effluent pump station to seventeen (17) deep injection wells, and residuals stabilization by six (6) primary and (6) secondary digesters followed by sludge two (2) dewatering centrifuges and composting facilities. The facility discharges to deep injection wells and has a NPDES permit covering emergency bypasses and disposal of solid residuals. Table 1 summarizes the available information on influent and effluent characteristics of this facility and assesses its removal capabilities.
Table 1. Average values for BOD-5, CBOD-5 and TSS at the SMDWWT Facility
Influent Effluent Removal (%) Testing Period
BOD-5 (mg/L) 99.6 10.4 89 January 1985 to
June1999
CBOD-5 (mg/L) 126.1 5.3 96 October 1995 to July
2002
TSS (mg/L) 104.0 13.3 86 January 1985 to July
2002 pH 7.4-6.7 7.0-6.4 January 2001 to
September 2002 Total Nitrogen (mg/L) 30.9 18.3 41 Total P (mg/L) 4 1.3 67 There is no current information at the SMDWWT Facility on Ammonia-N, nitrate-N, TKN and Ortho-P influent and effluent concentrations. A Letter Report prepared by the Project Managers and Miami-Dade Water and Sewer Department (MDWASD) engineering staff, confirmed that MDWSA is not predicting any changes to the quality of the wastewater influent into the three wastewater treatment plants (WWTPs) in the next 20 years. The MDWASD updated Facilities Master Plan projects that the SMDWWT Facility will be expanded from 112.5 MGD to 131.25 MGD by 2020. In addition, as a result of a draft Consent Order with the Florida Department of Environmental Protection (FDEP), the MDWASD will upgrade the current treatment process at SMDWWTP Facility by adding High Level Disinfection (HLD), or equivalent, within 5 years (excluding the time it takes for permitting). The process to be added (most likely filtration and chlorination) is to meet the performance requirements stated in Chapter 62-600.440, FAC.
3.2 Review of Existing Reports/Studies The “Summary of reviews for existing reports and Studies” report, dated May 29, 2003 report reviews state regulations and background water quality data for canals and groundwater, and summarizes conceptual design treatment goals for receiving sites or point of discharge (e.g., Canals, Ground Water, Aquifer Storage and Recovery, Public Access Reuse Sites, Agricultural Irrigation

Treatment Objectives Report October 3, 2003
- 5 -
Sites, Wetlands) of reuse alternatives. Table 2 contains the summary of the treatment goals for receiving waters, categorized as canals, ground Water, Aquifer Storage and Recovery, Public Access Reuse Sites, Agricultural Irrigation Sites, and Wetlands Table 2- Summary of Conceptual Design Treatment Goals for receiving waters in Florida
Parameter Conceptual Design Treatment Goal Canal and Other Surface Water Discharge TSS 5.0 mg/L Disinfection High Level TN 1.0 mg/L TP 0.010 mg/L Chemical Feed Facilities for Coagulants, etc.
Required
Ground Water (Deep Injection Wells) CBOD5 20 mg/L TSS 20 mg/L Aquifer Storage and Recovery TSS 5 mg/L Chemical Feed Facilities for Coagulants, etc.
Required
Primary and Secondary Drinking Water Standards
Required, except standard for asbestos shall not apply.
Total Organic Carbon (TOC)
3.0 mg/L (monthly avg.) 5.0 mg/L (single sample)
Total Organic Halogen (TOX)
0.2 mg/L (monthly avg.) 0.3 mg/L (single sample)
Multiple Barrier Treatment Processes
Required
Public Access Reuse TSS 5.0 mg/L Disinfection High Level Nitrate (NOx-N) 10 mg/L Chemical Feed Facilities for Coagulants, etc.
Required
Agricultural Irrigation TSS 5.0 mg/L Disinfection High Level Nitrate (NOx-N) 10 mg/L Chemical Feed Facilities for Coagulants, etc.
Required
Wetlands TSS 5.0 mg/L Disinfection High Level TN 1.0 mg/L TP 0.010 mg/L Chemical Feed Facilities for Coagulants, etc.
Required
Outstanding Florida Waters (OFWs) All parameters No degradation of ambient water quality
(See Table 5 below)

Treatment Objectives Report October 3, 2003
- 6 -
3.3 Regulation Report
Chapter 62-611, F.A.C., provides State regulations and standards for domestic wastewater discharges to wetlands. Essentially, this rule controls (1) the quality and quantity of wastewater which may be discharged to wetlands and (2) the quality of water discharged from wetlands to contiguous surface waters. It also provides water quality, vegetation, and wildlife standards that provide protection of other wetland functions and values, and establishes permitting procedures and extensive monitoring requirements for wastewater discharges to wetlands.
A facility may discharge domestic wastewater to a wetland if a permit is issued pursuant to Chapter 62-611, F.A.C. Additionally, certain facilities may discharge to wetlands through an “experimental wetland exemption” upon issuance of an Order (usually in the form of a permit) in accordance with Rule 62-600.120(3), F.A.C. In either case a wastewater permit application must be submitted. Since the proposed project is considered “pilot”, it may be able to be permitted under the “experimental wetland exemption” criteria of Rule 62-600.120(3), F.A.C. The stated intent of Rule 62-600.120(3), F.A.C., is to “encourage experiments which are designed to lead to the development of new information regarding low-energy approaches to the advanced treatment of domestic wastes and to encourage the conservation of wetlands and fresh waters.” In either case a domestic wastewater permit application must be submitted. Chapter 62-611, F.A.C., classifies natural wastewater wetlands based on the level of treatment provided by the wastewater facility. A treatment wetland must receive a minimum of secondary treatment with nitrification; whereas, a receiving wetland must receive effluent that has been treated to advanced wastewater treatment standards. Certain classes of natural wetlands are prohibited for use as wastewater wetlands. Wetlands within Outstanding Florida Waters (OFWs), Class I waters, and areas designated as areas of critical state concern as of October 1, 1985, are all not allowed to be used as treatment wetlands, but can be used as receiving wetlands. For the pilot project, the wastewater wetland will be regarded as a receiving wetland and should not be considered part of the treatment train. Table 3.1 provides the average annual concentrations for a receiving wetland (Chapter 62-611, F.A.C., specifically Section 62-611.420, F.A.C).
Table 3.1 Annual Average Concentrations for receiving wetlands (Chapter 62-611, F.A.C., specifically Section 62-611.420, F.A.C)
Parameters Limits (mg/L) CBOD-5 5
TN 3 TSS 5 TP 1

Treatment Objectives Report October 3, 2003
- 7 -
Chapter 62-611, F.A.C., limits the quantity of wastewater allowed to be discharged to a wetland permitted under the rule. Per Rule 62-611.350(1), F.A.C., natural unaltered wetlands may receive hydraulic loading rates up to two inches per week (equivalent to 128.90 acres per mgd), while natural hydrologically altered wetlands may receive hydraulic loading rates up to six inches per week (equivalent to 42.967 acres per mgd). In addition to limitations on the quality of wastewater allowed to be discharged to wetlands, Chapter 62-611, F.A.C., sets forth minimum requirements on the quantity of wastewater allowed to be discharged to wetlands permitted under the rule. Limitations on total nitrogen and total phosphorus loading rates to treatment wetlands are established in Rule 62-611.400(2), F.A.C. Table 3.2 Loading rates Limits for treatment wetlands Type of Wetland Total N (g/m2/yr) Total P (g/m2/yr) Natural unaltered treatment wetland 25 3 Hydrologically altered treatment wetland
75 9
Regardless of these allowable maximums, the applicant must provide the Department with reasonable assurance that all other Department rules, including the qualitative design criteria, water quality standards and criteria, and the biological criteria in Chapter 62-611, F.A.C., will be met including the antidegradation policy requirements associated with Outstanding Florida Waters in Rules 62-4.242 and 62-302.300, F.A.C. .
Rule 62-611.450(1), F.A.C., limits the discharge from both natural treatment and receiving wetlands to 3.0 mg/L total nitrogen, 0.2 mg/L total phosphorus, and 0.02 mg/L un-ionized ammonia, unless a Water Quality Based Effluent Limitations (WQBELs) has have been established, or phosphorus has been shown not to be a limiting nutrient on the downstream waters. However, Rule 62-611.450(2) also notes that the applicant shall provide the Department with reasonable assurance that the discharge from a treatment or receiving wetland shall not cause or contribute to violations of water quality criteria contained in Chapter 62-302, F.A.C. in contiguous waters, downstream waters, including a lake, estuary or lagoon, or Outstanding Florida Waters. In addition to the above requirements, the reclaimed water will need to meet other discharge limitations established by procedures within Chapter 62-650, F.A.C. (see Rule 62-610.555(4)(f), F.A.C.). Specifically, the reclaimed water will also need to meet any water quality based effluent limitations (WQBELs) to ensure compliance with state water quality standards in the receiving surface water. For most surface waters in Florida, the WQBEL analysis probably will result in limitations on Total Nitrogen (TN) more stringent than the 10-mg/L limit. A complete listing of surface water quality standards are contained within Rule 62-302, F.A.C. As is true for any new or expanded surface water discharge, the Antidegradation Policy in Rules 62-4.242 and 62-302.300, F.A.C. also applies (see Rule 62-610.555(4)(f), F.A.C.). This includes the public interest and reuse feasibility tests and represents a significant constraint on any new or expanded surface water discharge. It is important to note that, in light of the foregoing, it would be very difficult to permit any new or expanded surface water discharge that does not qualify for

Treatment Objectives Report October 3, 2003
- 8 -
classification as “reuse.” Criteria for categorizing projects as either “reuse” or “effluent disposal” are contained within Rule 62-610.810, F.A.C. In addition to the foregoing requirements, Rule 62-610.555(4)(f), F.A.C. requires that reuse recharge projects be designed and operated such that the ground water standards in Chapter 62-520, F.A.C. will be met at the point or points where the reclaimed water/surface water mixture enters the ground water system. The ground water standards are, for the most part, the primary and secondary drinking water standards. The main difference is that Chapter 62-520, F.A.C., establishes a ground water standard for total coliforms of 4 per 100 mL in lieu of the primary drinking water standards for coliform organisms. Depending on a number of factors (location of the points of entry into the ground water system, quality of the reclaimed water, and others), this may result in additional treatment needs at the wastewater treatment facility. 3.4 Receiving WQ Report Table 4 summarizes the mean and median values of the parameters of interest for both the FIU and DERM datasets for Biscayne Bay. These data have been used to establish numerical targets that describes typical or prevailing water quality conditions near the western shore of Biscayne Bay, as an approach to meeting the OFW “antidgradation” standard. This table also includes the target antidegradation concentrations published in the Biscayne Bay Partnership Initiative (BBPI) Survey Team reports in 2001, for total Ammonia- N, Nitrate+Nitrite, and Total Phosphorus.

Treatment Objectives Report October 3, 2003
- 9 -
Table 4. Summary of FIU and M-D DERM median values for water quality parameters assessed.
Parameter
Units
Pooled Mean Conc.
MEDIAN CONCENTRATIONS
BBPI Target Conc.
Nearshore/ Alongshore Inshore
Total Ammonia-N
FIU DERM mg/L
0.014 0.071
0.016 0.05
0.013 *
0.02 0.05
TOC FIU
DERM mg/L 3.0 *
4.7 *
3.9 * NA
Chl-A FIU
DERM mg/L 0.33 0.62
0.30 0.34
0.20 * NA
Nitrate+Nitrite FIU
DERM mg/L 0.03 0.220
0.042 0.02
0.014 * 0.01
TP FIU
DERM mg/L 0.006 0.006
0.006 0.004
0.005 * 0.005
TKN FIU
DERM mg/L 0.22
* 0.36
* 0.26
* NA Total Nitrogen
FIU DERM mg/L
0.27 *
0.38 *
0.26 * NA
Turbidity FIU
DERM NTU 0.8 1.1
0.5 0.5
0.5 * NA
DO FIU
DERM mg/L
6.6 5.90
7.3 6.43
6.7 * NA
Total Coliform FIU
DERM cfu/100 ml
* 144
* <10
* * NA
Salinity FIU
DERM ppt 32.9 28.0
27.5 27.5
31.3 * NA

Treatment Objectives Report October 3, 2003
- 10 -
4. Treatment Objectives
As stated in the PMP, the pilot project and indeed the final project treatment objectives may go beyond the minimum requirements specified in Florida's rules (notably in Chapters 62-600, 62-610, and 62-611, F.A.C.) because of Water Quality Based Effluent Limits (WQBEL) / Total Maximum Daily Load (TMDL) considerations and because the ultimate receiving waters of tidal wetlands and Biscayne Bay are Outstanding Florida Waters. Therefore, the narrative antidegradation requirements associated with Outstanding Florida Waters must be met. The degree or level of treatment required shall depend upon:
1) Antidegradation targets. 2) The nature and quality of the ultimate receiving water. 3) Federal/State and local regulations. 4) Quantity and quality of flow from the treatment plant.
Table 5 summarizes these treatment objectives:
Table 5.1- Statute/Rule and Antidegradation targets as Treatment Objectives for the Selection of the Treatment Technologies
Parameter Range Statute/Rule
targets Antidegradation
targets BOD-5 5 mg/L TOC 3 mg/L COD 10 mg/L TSS 5 mg/L Total Residual Chlorine
0.01 mg/L
Total Ammonia- N 0.02 –0.05 mg/L(depends on
method of collection and analysis)
Nitrite/Nitrate-N 0.01 mg/L TKN 0.22 mg/L Total Nitrogen 3 0.27 mg/L Ortho-P 0.002 mg/L Total P 1 0.005 mg/L Fecal coliforms Total coliform
<10 cfu/100 mL <10 CFU/100 ml
Dissolved Oxygen 5.0-7.3 Turbidity 0.5 NTU Salinity Shall not change
salinity in test site by more than 5 ppt
pH 6.5-7.5 (*) Heavy Metals See Table 5.2

Treatment Objectives Report October 3, 2003
- 11 -
Parameter Range Statute/Rule targets
Antidegradation targets
EPOC Lowest possible levels(**)
Cryptosporidium and Giardia
Lowest possible levels(**)
(*) Appropriate limits for pH in the estuarine zone will require further evaluation. (**) Even though, currently there are no established numerical criteria or antidegradation
targets for these parameters, available information shall be gathered on removal efficiency of various treatment technologies and detectable levels after advanced treatment for these parameters for comparative assessment. In practical terms, the objective would be to identify the technology that reduces such contaminants to the lowest level.
Table 5.2 Treatment Objectives and MDLs/PQLs for metals of interest Heavy Metals Except for those listed with **
Methodology Required or Equivalent
Required MDL (ug/L)
Required PQL (ug/L)
Sea Water Composition
(ug/L) 1,2
Target Levels (ug/L)
Aluminum** EPA 200.9 7.8 30 10 10 Antimony EPA 200.9 0.8 3 0.5 0.8 Arsenic, tot EPA 200.9 0.5 2 3 3 Barium** EPA 200.7 1 4 30 30 Cadmium EPA 200.9 0.05 0.2 0.1 0.1 Chromium, total EPA 200.9 0.1 0.4 0.05 0.1 Copper EPA 200.9 0.7 3 3 3 Iron EPA 200.7 7 30 10 10 Lead EPA 200.9 0.7 3 0.03 0.7 Manganese EPA 200.9 0.3 1 2 2 Mercury, total EPA 1631C 0.0001 0.0005 0.03 0.03 Mercury, methyl EPA 1630 Draft 0.00002 0.00005 0.03 Nickel EPA 200.9 0.6 2 2 2 Selenium** EPA 200.9 0.6 2 4 4 Silver EPA 200.9 0.5 2 0.04 0.5 Thallium EPA 200.9 0.7 3 < 0.01 0.7 Tin EPA 200.9 1.7 7 3 3 Zinc EPA 200.7 2 8 10 10 Bolded Metals:
Indicates typical parameters monitored in waste water
Bolded and Italic Metals

Treatment Objectives Report October 3, 2003
- 12 -
Metal added because it was part of the Class III Surface Water FDEP Rule
Italic Metals: Total Mercury is monitored in waste water and it is part of the Class III Surface Water FDEP Rule. Methyl and total mercury at low levels are not, but were added to be consistent with current District monitoring. 1 - Geological Survey Water-Supply Paper 1473, Study and Interpretation of the Chemical Characteristics of Natural Water, Second Edition, p. 11 (1971) 2 - Horne R.A. , Marine Chemistry The Structure of Water and the Chemistry of the Hydrosphere, Wiley-Interscience, 1969
5. Conceptual Treatment Processes As noted in Tables 1 and 2, the average effluent concentrations for CBOD, TSS, TN and TP at the SMDWWT Facility all exceed the conceptual treatment goals for discharging to a receiving wetland. Therefore, additional treatment of the effluent will be necessary to meet the discharge requirements. Table 6 summarizes this information and shows the average effluent BOD, CBOD, TSS, TN and TP concentrations at the South Miami-Dade Facility and the required removal efficiencies necessary to achieve the treatment objectives for receiving wetlands and more stringent Outstanding Florida Waters
Table 6. Treatment Requirements and Removal Efficiencies for BOD, CBOD, TSS, TN, TP
South District Effluent
Wetland Treatment Objectives
Required Removal
Efficiency
Outstanding Florida Water
Treatment Objective
Required Removal Efficiency
BOD 10.4 mg/L ------- ------- CBOD 5.3 mg/L 5 mg/L 5.7%
TSS 13.3 mg/L 5 mg/L 62.5% TN 18.3 mg/L 3 mg/L 83.6% 0.27 mg/L 98.5% TP 1.3 mg/L 1 mg/L 23.1% 0.005 mg/L 99.6%
As shown in this Table, additional treatment for nutrient removal in order to meet over and discharge requirements to prevent degradation of Biscayne Bay is required. Based on a review of the data available, the PDT has determined that the following nutrient discharge requirements are appropriate to protect conditions in Outstanding Florida Water and Biscayne Bay: 0.27 mg/L for TN and 0.005 mg/L for TP. This indicates that for TN, there is over a one magnitude reduction needed and the TP requirement for an Outstanding Florida Water is 200 times less than the TP requirements for a wetland that is not connected to an OFW. Treatment objectives shall also address the removal of other parameters, such as ammonia nitrogen and nitrate/nitrite nitrogen (0.02 mg/L and 0.01 mg/L respectively), metals, pathogens, turbidity, and EPOCs.

Treatment Objectives Report October 3, 2003
- 13 -
Under a separate task (Task 37-2380, Section 7.3.3.1.7.3 of the PMP), it will be necessary to compare the use and to evaluate the additional costs for several advanced biological, physical and chemical nutrient removal systems, filtration and disinfection technologies to achieve the treatment objectives of discharging the secondary treated to a receiving wetland and an Outstanding Florida Water.
6. Summary. As indicated in Task 37-2240, Section 37-7.3.3.1.5 of the Project Management Plan, this report presents the treatment objectives for discharging into different classifications of receiving waters. This report demonstrates that the most stringent of these treatment objectives is discharging to an Outstanding Florida Water and that in order to achieve the treatment objectives, additional treatment of the effluent will be necessary. The evaluation, selection and cost comparison on advanced treatment technologies that will meet the Treatment Objectives as outlined in this report will be assessed in a separate report.


Table of Contents
BBCWRP – Pilot Plant Closeout Report – Final Draft i
TABLE OF CONTENTS Section Page
1.1 Introduction .................................................................................................... 1-1
1.2 Project Background ...................................................................................... 1-1
2.1 Process Configuration ................................................................................... 2-1
2.2 Installation, Startup, and Decommissioning ................................................... 2-1
2.3 Experimental Trains ....................................................................................... 2-3
2.4 Water Quality Target ..................................................................................... 2-4
3.1 Membrane Bioreactor System ....................................................................... 3-1
3.2 Reverse Osmosis System.............................................................................. 3-3
4.1 Concentration Balance ................................................................................. 4-1
4.2 Pilot Influent Water Quality ............................................................................ 4-1
4.3 Nutrient Removal ........................................................................................... 4-2
4.3.1 MBR Nutrient Removal Results ...................................................... 4-2
4.3.2 RO Nutrient Removal Results ......................................................... 4-6
4.4 Microconstituent Results ................................................................................. 4-7
5 Conclusion ........................................................................................................ 5-1
List of Tables
Table Number
Title Page
2-1 BBCWRPP Treated Water Targets for Data Evaluation 2-5
3-1 Operational Parameters for the MBR Pilot System 3-1
3-2 Operational Parameters for the RO System 3-3
4-1 BBCWRPP Pilot Plant – Concentration Balance at Feed Flow 4-1
4-2 SDWWTP Secondary Effluent Water Quality 4-1
4-3 Microconstituent Sampling Events for Duration of Pilot 4-7
4-4 Train A Microconstituent Removal 4-9
4-5 Train C Microconstituent Removal 4-11

Table of Contents
BBCWRP – Pilot Plant Closeout Report– Final Draft ii
List of Figures
Figure Number
Title Page
2-1 BBCWRPP Process Flow Diagram 2-2
2-2 BBCWRP Pilot 2-3
2-3 Train A – Proposed Process Configuration 2-3
2-4 Train C – Proposed Process Configuration 2-3
3-1 Trans-membrane Pressure and Temperature for the MBR Pilot System
3-2
3-2 Flux and Temperature Corrected Specific Flux of the MBR Pilot System
3-2
3-3 Net Operating Pressure and Temperature for the RO System 3-4
3-4 Flux and Temperature Corrected Specific Flux of the RO System 3-4
4-1 Ammonia Removal by MBR System 4-2
4-2 Nitrate Removal by MBR System 4-3
4-3 Nitrate Removal by MBR System After 3,000 Hours 4-4
4-4 Phosphorus Removal by MBR System 4-5
4-5 Phosphorus Removal by MBR System after 3,000 Hours of Operations
4-5
4-6 Total Nitrogen Removal by RO System 4-6
4-7 Total Phosphorus Removal by RO System 4-7

Table of Contents
BBCWRP – Pilot Plant Closeout Report– Final Draft iii
Attachments Attachment A
• Monthly Operations Progress Reports
• Daily Water Quality and Operational Data (CD)
• Summary of Monthly Microconstituent Water Quality Results (CD)
Attachment B
• Certified Laboratory Reports (CD)

This Page
Intentionally
Left Blank

Section 1 Introduction
BBCWRP – Pilot Plant Closeout Report– Final Draft Page 1-1
1.1 INTRODUCTION Miami-Dade Water and Sewer Department (MDWASD), was tasked with implementing the Biscayne Bay Costal Wetlands Rehydration Project (BBCWRP) to determine its feasibility for enhancing or restoring estuarine ecosystems. The BBCWRP forms part of the South Florida Water Management District (SFWMD) Water Use Permit (WUP) No. RE-ISSUE 13-00017-W limiting condition 43. The purpose of the BBCWRP is to evaluate the potential effects of rehydrating the Biscayne Bay Coastal Wetlands with highly treated reclaimed water. This would involve evaluating options for treating secondary effluent from the South District Wastewater Treatment Plant (SDWWTP) to produce reclaimed water and investigate potential impacts to the ecosystem. The feasibility of the BBCWRP would be determined by MDWASD in consideration and coordination with the project stakeholders formed by SFWMD, Florida Department of Environmental Protection (FDEP) and Biscayne National Park (BNP). Important milestones to be undertaken are development of a pilot testing program including the design and implementation of a pilot treatment plant. Following the pilot testing program, it is anticipated that the parties shall agree on the water quality treatment required and the feasibility of this project.
1.2 PROJECT BACKGROUND
The MDWASD tasked MWH Americas, Inc. (MWH) with engineering services for the planning, design, construction oversight, and operation of an advanced wastewater treatment pilot plant and the evaluation of the achieved water quality. This pilot plant is also referred as Biscayne Bay Costal Wetlands Rehydration Pilot Plant (BBCWRPP). Completed milestones through the end of operations of the pilot plant include:
• Technical Memorandum 1 - Water Quality Evaluation, May 2009
• Technical Memorandum 2 – Process Technology Assessment, May 2009
• Technical Memorandum 3 – Preliminary Engineering Report Rev1 June 2010
• Pilot Plant Testing and Water Quality Monitoring – August 2010
• Pilot Design, Permitting, Construction and Startup – October 2010
• Pilot Plant Operations, Sampling and Laboratory Tests – November 1, 2010 through April 7, 2011
The pilot plant processes were designed and constructed for providing water quality data prior and after treatment for comparison to proposed water quality targets defined in technical memorandum 1 and for establishing trends and variations. The pilot was anticipated to contain three process treatment trains A, B, and C described in Section 2. These treatment trains were intended to provide highly treated water for laboratory testing of parameters listed in the monitoring plan and for aquatic toxicity tests to be performed by Florida International University. The resulting water quality data is intended to be part of supporting data for MDWASD and its Stakeholder to determine the feasibility of the BBCWRP.

Section 1 - Introduction
BBCWRP – Pilot Plant Closeout Report– Final Draft Page 1-2
The pilot plant initiated it official operations on November 1, 2010 after the startup and training process of approximately three weeks. The operations and monitoring of the pilot plant was continued through April 7, 2011. Water samples were collected and analyzed for Trains A and C during the time of operation. It should be noted that due to MDWASD unprecedented budgetary limitations, MWH was instructed to stop operations. The pilot plant was shut down and decommissioned at the end of its fifth month of operations, seven months short of the planned testing scheduled. This report is intended to provide a summary of water quality achieved based on operational and water quality data collected throughout the period of operations.

Section 2
Configuration and Water Quality Targets
BBCWRP – Pilot Plant Closeout Report– Final Draft Page 2-1
2.1 PROCESS CONFIGURATION
As a result of a technology evaluation, along with a comprehensive literature and process review, a number of treatment processes were identified as viable for pilot testing. The additional treatment of the SDWWTP secondary effluent will further reduce concentrations of BOD5, TSS, nitrogen, phosphorus, and microconstituents. The pilot plant was designed to receive un-chlorinated secondary clarifier effluent. The pilot design flow of highly treated water is 25 gallons per minute. A process flow diagram (PFD) and process and instrumentation diagrams (P&IDs) have been prepared to illustrate the process configuration of the pilot plant. The PFD is shown in Figure 2-1 illustrating the main line process train and the bypass trains. Secondary effluent from the SDWWTP will be obtained from the secondary clarifier effluent channels and pumped to an equalization tank at the pilot site. This effluent will then flow through a MBR, which will perform nitrification denitrification, chemical phosphorus removal and MF/UF filtration. This effluent will be sent through RO units (for C) for additional solids removal and disinfection (either ultraviolet/peroxide or ozone disinfection or ozone combined with hydrogen peroxide) for the removal of microconstituents. Samples will be taken throughout the process train to assist in the evaluation of the treatment processes.
2.2 INSTALLATION, STARTUP, AND DECOMMISSIONING
The pilot plant was installed within the SDWWTP. MDWASD staff made available the conveyance of the secondary effluent to the pilot site as well as installation of service connections for power and potable water and other ancillary requirements. Vendors for the different treatment units provided installation, startup and training requirements for proper operation of their systems. Pall Corporation was the vendor providing the membrane bioreactor (MBR) system. The Advanced Oxidation Processes (AOP) was provided by Trojan Technologies (UV/peroxide reactor) and APTWater (Ozone/peroxide also known as HiPOx). MDWASD provided the RO unit, which was rehabilitated and reconfigured for this project. Figure 2-2 shows the pilot site after installation was completed. The BBCWRPP startup was initiated by “seeding” the membrane bioreactor (MBR) pilot unit with nitrified mixed liquor from Marathon, FL MBR package plant. After seeding the system, the MBR pilot unit was operated for three weeks to achieve the steady state for the bioreactor and to determine optimum chemical dosing rates. The BBCWRPP initiated its decommissioning activities April 11, 2011 concluding with the vendors removing the corresponding treatment units on April 28, 2011. MDWASD disconnected and removed services and other features as required for closure of the permit filed with the Building Department. Inventory of instruments, equipment and remaining chemicals was taken and property belonging to MDWASD was turned over.

Section 2 – Configuration and Water Quality Targets
BBCWRP – Pilot Plant Closeout Report– Final Draft Page 2-2
This Page
Intentionally
Left Blank

Section 2 – Configuration and Water Quality Targets
BBCWRP – Pilot Plant Closeout Report– Final Draft Page 2-3
Figure 2-1 BBCWRPP Process Flow Diagram

Section 2 – Configuration and Water Quality Targets
BBCWRP – Pilot Plant Closeout Report– Final Draft Page 2-4
This Page
Intentionally
Left Blank

Section 2 – Configuration and Water Quality Targets
BBCWRP – Pilot Plant Closeout Report– Final Draft Page 2-5
Figure 2-2 BBCWRP Pilot
2.3 EXPERIMENTAL TRAINS
The pilot plant treatment trains sampled and tested during the five month operations are Trains A and Train C. Train A is comprised of a MBR sequential process for nitrification, denitrification, chemical phosphorus removal and microfiltration/ultrafiltration (MF/UF) within the MBR system, followed by the AOP side streams of UV/Peroxide and Ozone/Peroxide as shown in Figure 2-3. Train C includes the MBR system followed by the RO unit and the AOP side streams as shown in Figure 2-4. It should be noted that train B was not tested.
Figure 2-3 Train A – Proposed Process Configuration
Figure 2-4 Train C – Proposed Process Configuration
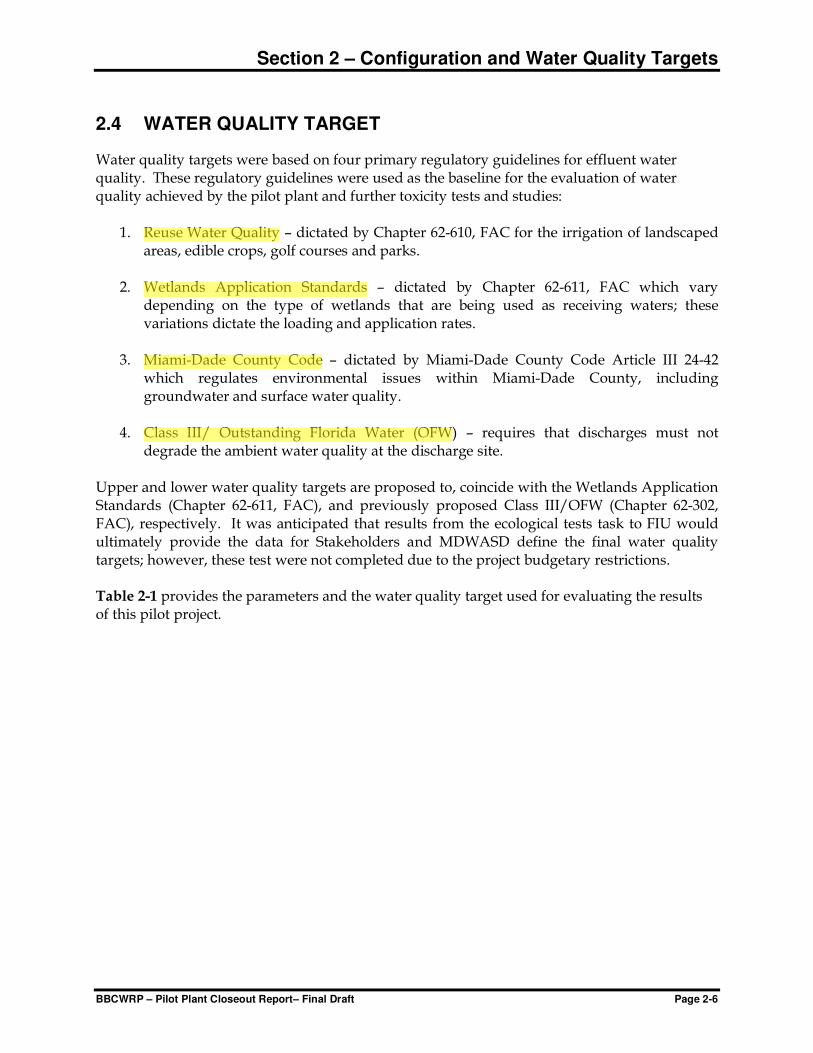
Section 2 – Configuration and Water Quality Targets
BBCWRP – Pilot Plant Closeout Report– Final Draft Page 2-6
2.4 WATER QUALITY TARGET
Water quality targets were based on four primary regulatory guidelines for effluent water quality. These regulatory guidelines were used as the baseline for the evaluation of water quality achieved by the pilot plant and further toxicity tests and studies:
1. Reuse Water Quality – dictated by Chapter 62-610, FAC for the irrigation of landscaped areas, edible crops, golf courses and parks.
2. Wetlands Application Standards – dictated by Chapter 62-611, FAC which vary depending on the type of wetlands that are being used as receiving waters; these variations dictate the loading and application rates.
3. Miami-Dade County Code – dictated by Miami-Dade County Code Article III 24-42 which regulates environmental issues within Miami-Dade County, including groundwater and surface water quality.
4. Class III/ Outstanding Florida Water (OFW) – requires that discharges must not degrade the ambient water quality at the discharge site.
Upper and lower water quality targets are proposed to, coincide with the Wetlands Application Standards (Chapter 62-611, FAC), and previously proposed Class III/OFW (Chapter 62-302, FAC), respectively. It was anticipated that results from the ecological tests task to FIU would ultimately provide the data for Stakeholders and MDWASD define the final water quality targets; however, these test were not completed due to the project budgetary restrictions. Table 2-1 provides the parameters and the water quality target used for evaluating the results of this pilot project.

Section 2 – Configuration and Water Quality Targets
BBCWRP – Pilot Plant Closeout Report– Final Draft Page 2-7
Table 2-1 BBCWRPP Treated Water Targets for Data Evaluation
Parameter Units Reuse / Wetlands Application1
Class III / OFW1
TSS mg/L 5 3.5
CBOD5 mg/L 5 N/A
Total Nitrogen as N mg/L 3 0.27
Total Phosphorous as P mg/L 1 0.005
Fecal Coliform #/100 ml <1.0 <1.0
Total Ammonia as N mg/L 21 0.02 – 0.052
Nitrate/Nitrite as N mg/L N/A 0.01
TKN mg/L N/A 0.22
Ortho-Phosphate as P mg/L N/A 0.002
Dissolved Oxygen mg/L N/A 5.0 – 7.3
Turbidity NTU N/A 0.5
Salinity mg/L N/A Note 3
pH range SU N/A 6.5-7.5
Microconstituents ng/L N/A Note 4
Cryptosporidium and Giardia Note 5 N/A Note 4 1. Effluent requirements are based on annual average conditions except for Ammonia as N which is
based on monthly averages. 2. Treated water targets would depend on the method of sample collection and analysis. 3. Background salinity shall not change by more than 5 parts per thousand. 4. There are no established numerical criteria or anti-degradation data. 5. Reporting units for Cryptosporidium is ocysts/L and for Giardia is cysts/L.

This Page
Intentionally
Left Blank

Section 3
Operational Performance
BBCWRP – Pilot Plant Closeout Report– Final Draft Page 3-1
3.1 MEMBRANE BIOREACTOR SYSTEM
The MBR pilot system was operated for a period of approximately 4500 hours as part of Train A and Train C. Table 3-1 presents the operational parameters for the MBR system. The target gross membrane flux was 14.3 gallons per square foot per day (gfd), although the system was operated between 11 to 15 gfd depending on the operational conditions at the site. The system was operated at a target solid retention time (SRT) of 16 days, total hydraulic retention time (HRT) of 5.3 hours and the anoxic volume constituted 28% of the total volume. The specific air demand for the membrane system was calculated at 12 scfm/1000 ft2 of membrane area.
Table 3-1 Operational Parameters for the MBR Pilot System
Figure 3-1 presents the trans-membrane pressure (TMP) and temperature whereas Figure 3-2 presents the membrane flux and temperature corrected specific flux for the MBR system. During the start-up, the system was operated at a flux of 11.2 gfd for the first 270 hours of operation. Following that, the flux was increased to 14.2 gfd and was maintained at that rate for most of the study period. The maintenance cleanings, also referred to enhanced flux maintenance (EFM), on the membranes were scheduled to occur on a weekly basis or if the TMP
Parameter Value
Manufacturer Pall
Model Aria MBR
Bioreactor
SRT (days) 16
Active tank volumes
Aerobic 4,130
Anoxic 2,550
Membrane 2,500
HRT, total (hours) 5.3
Aerobic MLSS (mg/L) 8,000
Process air (scfm) 30 - 50
Membrane scouring air (scfm) 40
Membrane Filtration
Active membrane area (ft2) 3,228
Gross filtrate flow-rate (gpm) 32
Length of filtration cycle (minutes) 9
Length of relaxation cycle (seconds) 60
Length of backwash cycle (seconds) 0
Net filtrate flow-rate (gpm) 28.8
Gross membrane flux (gfd) 14.3
Feed water recovery (%) 90
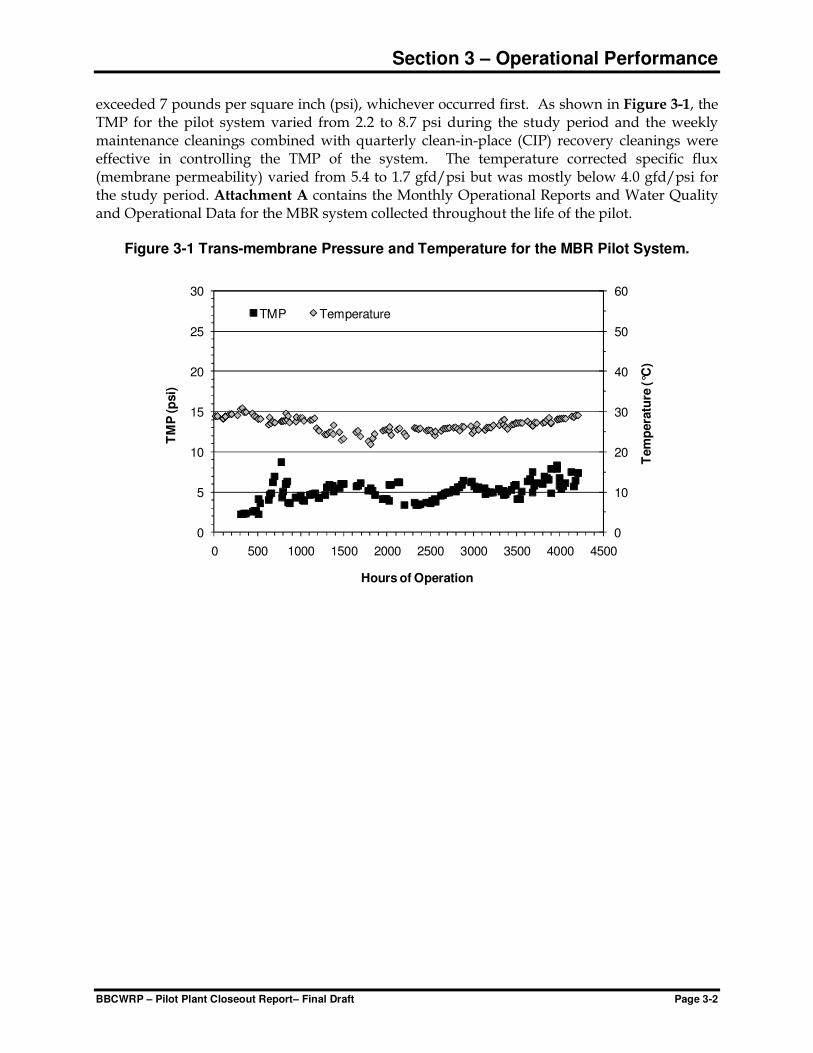
Section 3 – Operational Performance
BBCWRP – Pilot Plant Closeout Report– Final Draft Page 3-2
exceeded 7 pounds per square inch (psi), whichever occurred first. As shown in Figure 3-1, the TMP for the pilot system varied from 2.2 to 8.7 psi during the study period and the weekly maintenance cleanings combined with quarterly clean-in-place (CIP) recovery cleanings were effective in controlling the TMP of the system. The temperature corrected specific flux (membrane permeability) varied from 5.4 to 1.7 gfd/psi but was mostly below 4.0 gfd/psi for the study period. Attachment A contains the Monthly Operational Reports and Water Quality and Operational Data for the MBR system collected throughout the life of the pilot.
Figure 3-1 Trans-membrane Pressure and Temperature for the MBR Pilot System.
0
10
20
30
40
50
60
0
5
10
15
20
25
30
0 500 1000 1500 2000 2500 3000 3500 4000 4500
Tem
pera
ture
(°C
)
TM
P (p
si)
Hours of Operation
TMP Temperature

Section 3 – Operational Performance
BBCWRP – Pilot Plant Closeout Report– Final Draft Page 3-3
Figure 3-2 Flux and Temperature Corrected Specific Flux of the MBR Pilot System
3.2 REVERSE OSMOSIS SYSTEM
The RO pilot system was operated intermittently based on project needs to collect samples for Train C. The operational parameters for the RO system are presented in Table 3-2. The system was operated as a two-stage system with total feed water recovery of 75%. The pilot system consisted of five vessels, each of which contained seven RO membrane elements. Anti-scalant (at a dose of 3 mg/L) was added to the MBR effluent before being fed to the RO system. Concentrate from Stage 1 (three vessels) was fed to the second stage (two vessels) and combined permeate (from Stage 1 and Stage 2) was utilized as a feed to the advanced oxidation pilot systems. Figure 3-3 presents the net operating pressure and temperature whereas Figure 3-4 presents the flux and the temperature corrected specific flux for the RO system. The net operating pressure for the RO system varied from 74 to 141 psi during the study period. While operating at the target flux, the net operating pressure stayed between 96 to 103 psi, which is typical of RO systems operating on municipal wastewater. The temperature corrected specific flux for the RO system was observed to be fairly stable at 0.08 gfd/psi throughout the study period. Attachment A contains the Monthly Operational Reports and Water Quality and Operational Data for the RO system collected throughout the life of the pilot.
Table 3-2 Operational Parameters for the RO System
0
5
10
15
20
25
0
5
10
15
20
25
0 500 1000 1500 2000 2500 3000 3500 4000 4500
Sp
ecif
ic F
lux @
20°C
(g
fd/p
si)
Flu
x (g
fd)
Hours of Operation
Flux Specific Flux at 20 deg C

Section 3 – Operational Performance
BBCWRP – Pilot Plant Closeout Report– Final Draft Page 3-4
Parameter Value
Manufacturer Dow
Model FilmTec
Total number of RO vessels 5
Number of elements per vessel 7
Number of elements in first stage 21
Number of elements in second stage 14
Membrane area per element (ft2) 78
Total membrane area (ft2) 2730
Array 3:2
1st Stage permeate flux (gfd) 12.5
Total system recovery (%) 75

Section 3 – Operational Performance
BBCWRP – Pilot Plant Closeout Report– Final Draft Page 3-5
0.00
0.10
0.20
0.30
0.40
0
5
10
15
20
0 200 400 600 800 1000
Sp
ecif
ic F
lux @
20°C
(g
fd/p
si)
Flu
x (g
fd)
Hours of Operation
Flux Specific Flux at 20 deg C
Figure 3-3 Net Operating Pressure and Temperature for the RO System
Figure 3-4 Flux and Temperature Corrected Specific Flux of the RO System
0
10
20
30
40
50
0
50
100
150
200
250
0 200 400 600 800 1000
Tem
pe
ratu
re (°C
)
Net O
pera
tin
g P
ressu
re (
psi)
Hours of Operation
Net Operating Pressure Temperature

Section 4
Water Quality Results
BBCWRP – Pilot Plant Closeout Report– Final Draft Page 4-1
4.1 CONCENTRATION BALANCE
A design concentration balance of the proposed treatment process was developed based on the secondary effluent characteristics of the SDWWTP and common removal rates evaluated for this project. Results are presented in Table 4-1. The actual performance of the treatment processes during the pilot study will depend on site specific conditions, water quality of the influent flow stream, and performance of the process units during pilot operation.
Table 4-1 BBCWRPP Pilot Plant – Concentration Balance at Feed Flow
Treatment Process Ammonia
(NH3-N)
(mg/L)
Nitrate/Nitrite
(NOx-N)
(mg/L)
Total
Nitrogen
(mg/L)
Total
Phosphorus
(mg/L)
SDWWTP Secondary Effluent 25 0.75 27 2.7
MBR System
with Chem-P Removal 0.5 0.5 3 0.07
without Chem-P Removal 0.5 0.5 3 <1
Reverse Osmosis 0.05 0.02 0.3 – 0.15 0.005
Advanced Oxidation Process
(without RO)
0.5 0.5 1.85 0.1 – 0.05
4.2 PILOT INFLUENT WATER QUALITY Pilot influent water was piped directly from the SDWWTP Secondary Effluent. Water Quality of this source is presented in Table 4-2.
Table 4-2
SDWWTP Secondary Effluent Water Quality
Parameter Unit
Number of
Samples
Median
Concentration ±
Standard Deviation
cBOD mg/L 83 4 ± 1
TSS mg/L 78 5 ± 2
NH3 mg/L - N 99 29 ± 7
NO3 mg/L - N 95 0.1 ± 1.4
TP mg/L - P 100 2.8 ± 1.3
Alkalinity
mg/L as
CaCO3 33 247 ± 35
pH - 90 6.7 ± 0.3
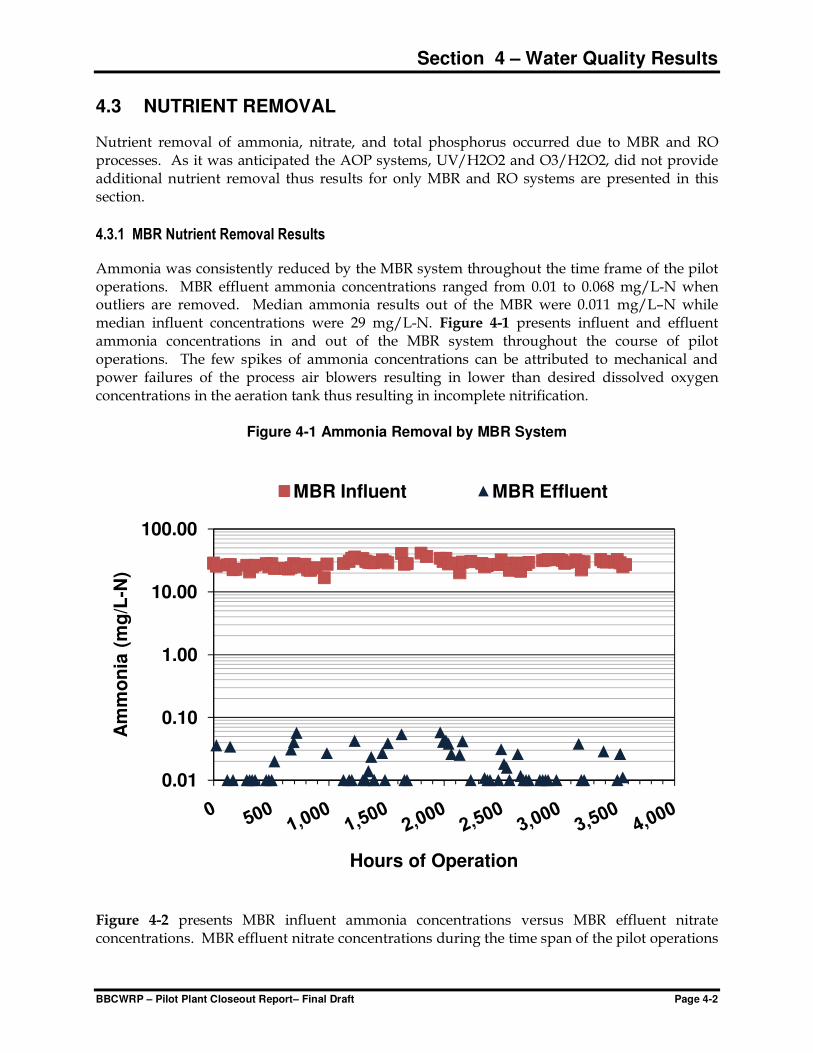
Section 4 – Water Quality Results
BBCWRP – Pilot Plant Closeout Report– Final Draft Page 4-2
4.3 NUTRIENT REMOVAL
Nutrient removal of ammonia, nitrate, and total phosphorus occurred due to MBR and RO processes. As it was anticipated the AOP systems, UV/H2O2 and O3/H2O2, did not provide additional nutrient removal thus results for only MBR and RO systems are presented in this section.
4.3.1 MBR Nutrient Removal Results
Ammonia was consistently reduced by the MBR system throughout the time frame of the pilot operations. MBR effluent ammonia concentrations ranged from 0.01 to 0.068 mg/L-N when outliers are removed. Median ammonia results out of the MBR were 0.011 mg/L–N while median influent concentrations were 29 mg/L-N. Figure 4-1 presents influent and effluent ammonia concentrations in and out of the MBR system throughout the course of pilot operations. The few spikes of ammonia concentrations can be attributed to mechanical and power failures of the process air blowers resulting in lower than desired dissolved oxygen concentrations in the aeration tank thus resulting in incomplete nitrification.
Figure 4-1 Ammonia Removal by MBR System
Figure 4-2 presents MBR influent ammonia concentrations versus MBR effluent nitrate concentrations. MBR effluent nitrate concentrations during the time span of the pilot operations
0.01
0.10
1.00
10.00
100.00
Am
mo
nia
(m
g/L
-N)
Hours of Operation
MBR Influent MBR Effluent

Section 4 – Water Quality Results
BBCWRP – Pilot Plant Closeout Report– Final Draft Page 4-3
ranged from 0.02 to 6.2 mg/L-N while the median nitrate concentration was 0.1 mg/L-N when outliers are removed. Several spikes did occur, however, between 1,000 and 1,500 hours as well as between 2,000 and 3,000 hours of operations. These spikes are attributed to insufficient MicroCg dosing that occurred during those periods. Other operational and maintenance upsets did occur, however, more stable operations where MBR effluent nitrate concentrations remained consistently below 1 mg/L-N occurred after 3,000 hours of operation. Figure 4-3 illustrates this stability of operations after 3,000 hours with the exception of only one minor spike which occurred at 3,216 hours.
Figure 4-2 Nitrate Removal by MBR System
0
10
20
30
40
50
Co
nc
en
tra
tio
n (
mg
/L-N
)
Hours of Operation
MBR Influent Ammonia MBR Effluent Nitrate
Insufficient MicroCg dosing

Section 4 – Water Quality Results
BBCWRP – Pilot Plant Closeout Report– Final Draft Page 4-4
Figure 4-3 Nitrate Removal by MBR System After 3,000 Hours
Phosphorus removal was obtained by MBR treatment with majority of samples occurring below the reuse/wetlands application goal of 1 mg/L-P. MBR effluent total phosphorus concentrations ranged from 0.01 to 13.1 mg/L-P with the median concentration of 0.09 mg/L-P when outliers are removed. Few spikes did occur over the course of the pilot, however, these spikes were attributed to insufficient dosing of PACl. Overall phosphorous results for MBR influent and effluent are presented in Figure 4-4. More consistent operations were achieved after 3,000 hours of operations and Figure 4-5 illustrates influent and effluent concentrations on a logarithmic scale over this period.
0
10
20
30
40
50
60
70
80
Co
nc
en
tra
tio
n (
mg
/L-N
)
Hours of Operation
MBR Influent Ammonia MBR Effluent Nitrate

Section 4 – Water Quality Results
BBCWRP – Pilot Plant Closeout Report– Final Draft Page 4-5
Figure 4-4 Phosphorus Removal by MBR System
Figure 4-5 Phosphorus Removal by MBR System after 3,000 Hours of Operations
0.0
1.0
2.0
3.0
4.0
5.0
6.0
7.0
To
tal P
ho
sp
ho
rus (m
g/L
-P)
Hours of Operation
MBR Influent MBR Effluent
Reuse/Wetlands Application Goal - 1.0 mg/L-P
0.01
0.10
1.00
10.00
100.00
To
tal P
ho
sp
ho
rus (m
g/L
-P)
Hours of Operation
MBR Influent MBR Effluent
Reuse/Wetlands Application Goal - 1.0 mg/L-P

Section 4 – Water Quality Results
BBCWRP – Pilot Plant Closeout Report– Final Draft Page 4-6
4.3.2 RO Nutrient Removal Results
The RO system consistently reduced nitrogen out of the MBR system to levels below the reuse/wetlands application goal of 3.0 mg/L-N. RO effluent total nitrogen (TN) concentrations ranged from 0.2 to 1.3 mg/L-N with a median concentration of 0.42 mg/L-N. There were a total of six incidences where samples reduced nitrogen levels to below the Class III/OFW goal of 0.27 mg/L-N. Refer to Figure 4-6 for an illustration of total nitrogen concentrations in MBR and RO system effluents. Total phosphorus (TP) concentrations were also further reduced by RO treatment. RO effluent TP concentrations ranged from 0.002 to 0.003 mg/L-N with a median effluent concentration of 0.002 mg/L-P. RO system TP results consistently exceeded the Class III/OFW treatment goal of 0.005 mg/L-P. Figure 4-7 depicts total phosphorus concentrations of MBR and RO system effluents.
Figure 4-6 Total Nitrogen Removal by RO System
0.10
1.00
10.00
100.00
Co
nc
en
tra
tio
n (
mg
/L-N
)
Hours of Operation
MBR Effluent TN RO Effluent TN
Class III/OFW Goal - 0.27 mg/L-N
Reuse/Wetlands Application Goal - 3.0 mg/L-N

Section 4 – Water Quality Results
BBCWRP – Pilot Plant Closeout Report– Final Draft Page 4-7
Figure 4-7 Total Phosphorus Removal by RO System
4.4 MICROCONSTITUENT RESULTS A total of six microconstituent sampling events took place throughout the five and a half months of pilot testing. Each sampling event consisted of sampling for either Train A or Train C. Table 4-3 shows the dates and specific sample points (refer to Figure 2-1 for location) where samples were collected for testing.
Table 4-3 Microconstituent Sampling Events for Duration of Pilot
Sample Date
Sample
Point 1
Sample
Point 2
Sample
Point 3
Sample
Point 4
Sample
Point 5
Train
Equivalency
Wednesday, November 17, 2010 X X
X X A
Tuesday, December 21, 2010 X X
X X A
Monday, February 07, 2011 X X
X X A
Tuesday, February 09, 2010
X X X C
Monday, March 07, 2011 X X X X X C
Wednesday, March 09, 2011
X X A
Four sampling events were performed for Train A while two sample events (February 9th and March 7th) for Train C. As laboratory results were showing consistency on daily operational
0.001
0.010
0.100
1.000
10.000
Co
nc
en
tra
tio
n (
mg
/L-P
)
Hours of Operation
MBR Effluent TP RO Effluent TP
Class III /OFW Goal - 0.005 mg/L-P
Reuse/Wetlands Application Goal - 1.0 mg/L-P

Section 4 – Water Quality Results
BBCWRP – Pilot Plant Closeout Report– Final Draft Page 4-8
water quality results from sample points 1 and 2; it was decided that on weeks where two sampling events occurred within days of each other, sample points 1 and 2 would not be collected as these are common to both experimental Trains A and C. Due to limited data points on microconstituents, a detailed analysis of results could not be achieved. However, the data does present information that was used to determine some over arching differences between Train A and Train C. Refer to Tables 4-4 and 4-5 for microconstituent data for specific categories of microconstituents along with representative parameters of each category for Train A and Train C, respectively. Table 4-4 shows that for Train A, the MBR is capable of reducing microconstituents, although the AOP systems further reduce majority of parameters. Train C on the other hand (refer to Table 4-5) indicates that majority of parameters are fully reduced to levels of non detect by the RO process. The only exceptions shown in Table 4-5 are 4-methylphenol, bis phenol A, and gemfibrozil where hits were detected in RO effluent but where fully reduced to levels of non detect by the AOP systems. For the complete list of reported parameters for each sampling event refer to Attachment A –
Monthly Microconstituent Water Quality Results for both Trains A and C. Attachment B contains the certified laboratory reports for all tests performed during the life of the pilot. It should be noted that constituents reported as non-detect (ND) reflect that the constituent was analyzed but not detected.

Section 4 – Water Quality Results
BBCWRP – Pilot Plant Closeout Report– Final Draft Page 4-9
Table 4-4 Train A Microconstituent Removal
Parameter
Meth
od
Min
imu
m R
ep
orti
ng
Lim
it
Un
its
Membrane
BioReactor
(MBR) Influent
MBR
Permeate AOP Effluent (UV/H2O2) AOP Effluent (Ozone/H2O2)
SP1 SP2 SP4 SP5
Min
Rep
ort
ed
Med
ian
Rep
orte
d
Max R
ep
orte
d
Min
Rep
ort
ed
Med
ian
Rep
orte
d
Max R
ep
orte
d
Min
Rep
ort
ed
Med
ian
Rep
orte
d
Max R
ep
orte
d
Min
Rep
ort
ed
Med
ian
Rep
orte
d
Max R
ep
orte
d
Chlorination By Products
1,4-Dioxane EPA 522 0.50 ug/L 0.72 0.81 0.89 0.61 0.64 0.67 - ND - 0.53 0.53 0.53
Industrial By Products
2,6-di-tert-butylphenol USGS 4MOD 25.0 ng/L 44 46 62 - ND - - ND - - ND -
4-Methylphenol EPA 625 5.0 ug/L - ND - - ND - - ND - - ND -
4-Methylphenol USGS 4MOD 25.0 ug/L 100 160 410 58 440 2800 71 316 560 45 45 45
Bis Phenol A (BPA) USGS 4MOD 25.0 ng/L 260 380 420 26 61 96 29 31 33 31 31 31
BPA LC-MS-MS 10.0 ng/L 110 420 580 21 80.5 140 12 12 12 130 130 130
Phenol EPA 625 3.0 ug/L - ND - - ND - - ND - - ND -
Phenol USGS 4MOD 50.0 ng/L 160 170 260 320 760 1200 130 185 240 - ND -
Antibiotics
Amoxicillin (semi-quantitative) LC-MS-MS 20.0 ng/L 230 780 820 460 525 590 66 368 670 43 127 210
Sulfamethoxazole LC-MS-MS 5.0 ng/L 310 490 820 82 92 180 7.2 15 130 100 215 330
Trimethoprim LC-MS-MS 5.0 ng/L 180 300 760 20 160 640 19 22 25 9 59 110
Pharmaceuticals
Acetaminophen LC-MS-MS 5.0 ng/L 85 98 110 - ND - - ND - 18 18 18
Caffeine LC-MS-MS 10.0 ng/L 520 1900 8100 6.4 14 800 6.9 26 35 13 24 370
Caffeine by GCMS LLE LC-MS-MS 25.0 ng/L 450 540 2500 200 200 200 - ND - 61 61 61
Caffeine by method 525mod EPA 525.2 0.05 ug/L 0.6 0.67 2.5 0.23 0.23 0.23 0.06 0.06 0.06 0.07 0.07 0.07
Carbamazepine LC-MS-MS 5.0 ng/L 100 120 150 87 120 250 25 56 87 48 48 48
Fluoxetine LC-MS-MS 10.0 ng/L 44 68 92 27 41.5 56 24 24 24 22 176 330
Gemfibrozil LC-MS-MS 5.0 ng/L 590 1900 2000 480 540 780 12 74 450 7.3 189 370
Ibuprofen LC-MS-MS 20.0 ng/L 79 2340 4600 16 158 300 69 69 69 30 31.5 33
Iopromide LC-MS-MS 5.0 ng/L 200 200 200 150 150 150 150 150 150 6.2 78 150
Hormones
Estradiol LC-MS-MS 1.0 ng/L 24 24 24 - ND - - ND - - ND -
Estrone LC-MS-MS 1.0 ng/L - ND - - ND - - ND - - ND -
Progesterone LC-MS-MS 1.0 ng/L - ND - - ND - - ND - - ND -
Pesticides
4-Nonyl Phenol USGS 4MOD 25.0 ng/L - ND - - ND - - ND - - ND -
4-nonylphenol - semi
quantitative LC-MS-MS 100 ng/L 570 2235 3900 130 565 1000 - ND - 140 140 140
Alpha-Chlordane EPA 525.2 0.05 ug/L - ND - - ND - - ND - - ND -
Alpha Chlordane USGS 4MOD 25.0 ng/L - ND - - ND - - ND - - ND -
Carbaryl EPA 531.2 0.50 ug/L - ND - - ND - - ND - - ND -
Carbaryl USGS 4MOD 50.0 ng/L 210 210 210 - ND - - ND - - ND -
Chlorpyrifos EPA 531.2 25.0 ng/L - ND - - ND - - ND - - ND -
Chlorpyrifos (Dursban) EPA 525.2 0.05 ug/L - ND - - ND - - ND - - ND -
DEET LC-MS-MS 2.00 ng/L 17 69 120 5 28 51 2.5 33 64 7.9 8.8 28
DEET USGS 4MOD 2.00 ng/L 83 100 320 81 130 190 30 70 110 29 62 62
Diazinon USGS 4MOD 25.0 ng/L - ND - - ND - - ND - - ND -
Diazinon (Qualitative) EPA 525.2 0.10 ug/L - ND - - ND - - ND - - ND -
Dieldrin EPA 608 0.10 ug/L - ND - - ND - - ND - - ND -
Dieldrin EPA 505 0.01 ug/L - ND - - ND - - ND - - ND -
Dieldrin EPA 525.2 0.20 ug/L - ND - - ND - - ND - - ND -
Dieldrin USGS 4MOD 0.01 ng/L - ND - - ND - - ND - - ND -
Methyl Parathion USGS 4MOD 25.0 ug/L - ND - - ND - - ND - - ND -
Personal Care Product
Triclosan LC-MS-MS 10.0 ng/L 140 260 380 26 78 130 22 22 22 22 22 22
Triclosan USGS 4MOD 10.0 ng/L 280 360 620 69 90 110 67 67 67 - ND -
Flame Retardant
TDCPP USGS 4MOD 50.0 ng/L 310 320 620 330 370 380 340 365 400 200 295 420
Triphenylphosphate USGS 4MOD 25.0 ng/L 86 100 150 25 31.5 38 - ND - - ND -
Tris (2-chloroethyl) phosphate USGS 4MOD 50.0 ng/L 130 160 390 150 170 190 130 175 240 84 140 230
Tris (2-butoxyethyl) phosphate USGS 4MOD 200 ng/L 940 1600 5800 230 1565 2900 1500 1500 1500 830 830 830
* Based on data obtained from sample events held on November 17, December 21, 2010 and February 7, March 9, 2011.

This Page
Intentionally
Left Blank

Section 4 – Water Quality Results
BBCWRP – Pilot Plant Closeout Report– Final Draft Page 4-10
Table 4-5 Train C Microconstituent Removal
Parameter
Meth
od
Min
imu
m R
ep
orti
ng
Lim
it
Un
its
Membrane
BioReactor (MBR)
Influent
MBR
Permeate
Reverse
Osmosis
Permeate
AOP Effluent
(UV/H2O2)
AOP Effluent
(Ozone/H2O2)
SP1 SP2 SP3 SP4 SP5
Min
Rep
ort
ed
Med
ian
Rep
orte
d
Max R
ep
orte
d
Min
Rep
ort
ed
Med
ian
Rep
orte
d
Max R
ep
orte
d
Min
Rep
ort
ed
Med
ian
Rep
orte
d
Max R
ep
orte
d
Min
Rep
ort
ed
Med
ian
Rep
orte
d
Max R
ep
orte
d
Min
Rep
ort
ed
Med
ian
Rep
orte
d
Max R
ep
orte
d
Chlorination By Products
1,4-Dioxane EPA 522 0.50 ug/L 1.2 1.2 1.2 1.1 1.1 1.1 - ND - - ND - - ND -
Industrial By Products
2,6-di-tert-butylphenol USGS 4MOD 25.0 ng/L - ND - - ND - - ND - - ND - - ND -
4-Methylphenol EPA 625 5.0 ug/L - ND - - ND - - ND - - ND - - ND -
4-Methylphenol USGS 4MOD 25.0 ug/L 240 240 240 250 250 250 63 63 63 - ND - - ND -
Bis Phenol A (BPA) USGS 4MOD 25.0 ng/L 400 400 400 340 340 340 28 28 28 - ND - - ND -
BPA LC-MS-MS 10.0 ng/L - ND - - ND - - ND - - ND - - ND -
Phenol EPA 625 3.0 ug/L - ND - - ND - - ND - - ND - - ND -
Phenol USGS 4MOD 50.0 ng/L 180 180 180 - ND - - ND - - ND - - ND -
Antibiotics
Amoxicillin (semi-
quantitative) LC-MS-MS 20.0 ng/L 450 450 450 1100 1100 1100 - ND - - ND - - ND -
Sulfamethoxazole LC-MS-MS 5.0 ng/L 550 550 550 510 510 510 - ND - - ND - - ND -
Trimethoprim LC-MS-MS 5.0 ng/L 470 470 470 340 340 340 - ND - - ND - - ND -
Pharmaceuticals
Acetaminophen LC-MS-MS 5.0 ng/L 83 83 83 - ND - - ND - - ND - 11 11
Caffeine LC-MS-MS 10.0 ng/L 6600 6600 6600 5800 5800 5800 - ND - 9.1 9.1 9.1 6.2 6.2 6.2
Caffeine by GCMS LLE LC-MS-MS 25.0 ng/L 6400 6400 6400 1400 1400 1400 - ND - - ND - - ND -
Caffeine by method 525mod EPA 525.2 0.05 ug/L 7.1 7.1 7.1 1.7 1.7 1.7 - ND - - ND - - ND -
Carbamazepine LC-MS-MS 5.0 ng/L 110 110 110 110 110 110 - ND - - ND - - ND -
Fluoxetine LC-MS-MS 10.0 ng/L 71 71 71 52 52 52 - ND - - ND - - ND -
Gemfibrozil LC-MS-MS 5.0 ng/L 3000 3000 3000 1400 1400 1400 18 18 18 - ND - - ND -
Ibuprofen LC-MS-MS 20.0 ng/L 310 310 310 150 150 150 - ND - - ND - - ND -
Iopromide LC-MS-MS 5.0 ng/L 11 11 11 13 13 13 - ND - - ND - - ND -
Hormones
Estradiol LC-MS-MS 1.0 ng/L 25 25 25 4.3 4.3 4.3 - ND - - ND - - ND -
Estrone LC-MS-MS 1.0 ng/L 17 17 17 - ND - - ND - - ND - - ND -
Progesterone LC-MS-MS 1.0 ng/L - ND - - ND - - ND - - ND - - ND -
Pesticides
4-Nonyl Phenol USGS 4MOD 25.0 ng/L - ND - - ND - - ND - - ND - - ND -
4-Nonylphenol - semi
quantitative LC-MS-MS 100 ng/L - ND - - ND - - ND - - ND - - ND -
Alpha-Chlordane EPA 525.2 0.05 ug/L - ND - - ND - - ND - - ND - - ND -
Alpha Chlordane USGS 4MOD 25.0 ng/L - ND - - ND - - ND - - ND - - ND -
Carbaryl EPA 531.2 0.50 ug/L - ND - - ND - - ND - - ND - - ND -
Carbaryl USGS 4MOD 50.0 ng/L - ND - - ND - - ND - - ND - - ND -
Chlorpyrifos EPA 531.2 25.0 ng/L - ND - - ND - - ND - - ND - - ND -
Chlorpyrifos (Dursban) EPA 525.2 0.05 ug/L - ND - - ND - - ND - - ND - - ND -
DEET LC-MS-MS 2.00 ng/L - ND - - ND - - ND - - ND - - ND -
DEET USGS 4MOD 2.00 ng/L 300 300 300 240 240 240 - ND - - ND - - ND -
Diazinon USGS 4MOD 25.0 ng/L - ND - - ND - - ND - - ND - - ND -
Diazinon (Qualitative) EPA 525.2 0.10 ug/L - ND - - ND - - ND - - ND - - ND -
Dieldrin EPA 608 0.10 ug/L - ND - - ND - - ND - - ND - - ND -
Dieldrin EPA 505 0.01 ug/L - ND - - ND - - ND - - ND - - ND -
Dieldrin EPA 525.2 0.20 ug/L - ND - - ND - - ND - - ND - - ND -
Dieldrin USGS 4MOD 0.01 ng/L - ND - - ND - - ND - - ND - - ND -
Methyl Parathion USGS 4MOD 25.0 ug/L - ND - - ND - - ND - - ND - - ND -
Personal Care Product
Triclosan LC-MS-MS 10.0 ng/L 450 450 450 160 160 160 - ND - - ND - - ND -
Triclosan USGS 4MOD 10.0 ng/L 340 340 340 160 160 160 - ND - - ND - - ND -
Flame Retardant
TDCPP USGS 4MOD 50.0 ng/L 330 330 330 390 390 390 - ND - - ND - - ND -
Triphenylphosphate USGS 4MOD 25.0 ng/L 82 82 82 59 59 59 - ND - - ND - - ND -
Tris (2-chloroethyl)
phosphate USGS 4MOD 50.0 ng/L
190 190 190 190 190 190 - ND - - ND - - ND -
Tris (2-butoxyethyl)
phosphate USGS 4MOD 200 ng/L
4100 4100 4100 2800 2800 2800 - ND - - ND - - ND -
* Based on data obtained from sample events held on February 9 and March 7, 2011.

This Page
Intentionally
Left Blank

Section 5
Conclusion
BBCWRP – Pilot Plant Closeout Report Page 5-1
The goal of this pilot project was to evaluate the performance of various advanced treatment technologies and to obtain water quality data achieved by these technologies during 12 months of operations. However, due to MDWASD unprecedented budget limitations, the operations were limited to five and a half months. The data collected during this period would form part of the supporting information for MDWASD and the project Stakeholders determine the feasibility of rehydrating the Biscayne Bay Coastal Wetlands for enhancing or restoring estuarine ecosystems. Based on the pilot test results it was demonstrated that all the treatment processes tested could be viable options for full scale implementation. Testing during this short period indicated that Train C (MBR, RO, AOP) would likely achieve removal to low level of nutrients that would potentially comply with proposed water quality targets. Based on the data collected during the period of operations the following can be concluded:
• MBR achieved median effluent ammonia, nitrate and total phosphorus concentrations of 0.03 mg/L-N, 1.3 mg/L-N and 0.15 mg/L-P respectively. Based on these results, Train A achieved nutrient removal level for meeting the Reuse/Wetlands application per Chapter 62-611.420 Discharge Limits to Treatment and Receiving Wetlands.
• RO achieved median effluent total nitrogen and total phosphorous concentrations of 0.35 mg/L-N and 0.002 mg/L respectively. These results show that the Class III/OFW water quality targets were achieved consistently for total phosphorous, however not achieved consistently for total nitrogen.
Water quality results for microconstituents show that Train A and Train C are successful at reducing microconstituent levels. Train A showed some reduction by the MBR process followed by further reduction by APO systems. Train C, however, with the application of RO process provided further reduction for these most of the compounds to non-detect levels were achieved. The AOP processes further reduced levels to non-detects for those parameters that showed hits in RO effluent. It should be noted that investigation of the potential effects of microconstituent to the natural environment was not included as part of this evaluation. Further evaluation, testing and cost benefit analyses would likely be assessed prior to determining the feasibility of this project.

This Page
Intentionally
Left Blank

Attachment A
Attachment A Monthly Pilot Operations, Sampling, Water Quality Report

Attachment A
Monthly Water Quality and Operations Report

2937 SW 27th Avenue TEL 786 313 5505 Suite 107 FAX 786 313 5506 Miami, Florida 33133 www.mwhglobal.com
December 20, 2010 Mr. James Ferguson, P.E. Miami-Dade Water and Sewer Department 23200 SW 97th Avenue, Suite 1 Miami, Florida 33190 Subject: Agreement No. 08MWHA007
OCI Project No. E08-WASD-02A Work Order No. 4 BBCWRPP - Pilot Operations, Water Quality Reports, Laboratory and Stakeholder Management and Coordination Monthly Pilot Operations and Water Quality Report
Dear Mr. Ferguson: MWH Americas, Inc. (MWH) is pleased to submit the first monthly Summary Report for the Biscayne Bay Coastal Wetlands Rehydration Pilot Project (BBCWRPP) Operations and Water Quality Monitoring. This summary report covers the reporting period from November 1, 2010, at 07:30 hours through December 13, 2010, at 17:00 hours.
I. DAILY OPERATIONS SUMMARY The BBCWRPP startup was initiated by “seeding” the membrane bioreactor (MBR) pilot unit with nitrified mixed liquor from the Marathon MBR package plant. After seeding the system, the MBR pilot unit was operated for three weeks to achieve the steady state for the bioreactor and to determine optimum chemical dosing rates. Once the steady-state was achieved, the pilot plant initiated official operations starting November 1, 2010. Chemical phosphorous removal started November 8th, by dosing poly-aluminum chloride (PACl) to the MBR Anoxic tank. Trains C was initially operated from November 2 through November 8, however a switch to Train A was made due to reduced production of the MBR filtrate. Train A has been operated since November 8, through the end of this reporting period. It should be noted that, on November 22, the MBR pilot system experienced mechanical problems with the Aeration Tank #1 blower. A temporary bypass was piped to run the MBR pilot with Aeration Tank #2 blower until a replacement blower arrives. Refer to the enclosed daily operations summaries prepared by the field operator. The pilot site was not manned on Thanksgiving Day. Replacement blower was installed the first week of December.

December 20, 2010 Miami-DadeWASD / BBCWRPP Page 2 of 7 Monthly Summary Report No. 1
II. DAILY AND WEEKLY WATER QUALITY SAMPLING SUMMARY Figures 1 and 2 show removal of ammonia, nitrate and total phosphorus achieved during the start-up period for the MBR system. As shown, the MBR pilot system achieved complete nitrification and almost complete denitrification with effluent ammonia and nitrate concentrations below 0.1 and 0.5 mg/L-N respectively. The effluent total phosphorus concentration was measured below 0.5 mg/L-P during this period. Following the start-up period, the RO, ozone and the UV systems were brought into operation and additional planned water quality sampling was initiated.
Figure 1 – Ammonia and Nitrate removal during the Start-Up Period
Figure 2 – Total Phosphorus removal during the Start-Up Period
0.001
0.010
0.100
1.000
10.000
100.000
10/11 10/13 10/15 10/17 10/19 10/21 10/23 10/25 10/27 10/29
Ammon
ia (m
g/L‐N)
MBR Influent Ammonia MBR Effluent Ammonia MBR Effluent Nitrate
0.01
0.10
1.00
10.00
10/11 10/13 10/15 10/17 10/19 10/21 10/23 10/25 10/27 10/29
Total Pho
spho
rus (m
g/L‐P)
MBR Influent MBR Effluent

December 20, 2010 Miami-DadeWASD / BBCWRPP Page 3 of 7 Monthly Summary Report No. 1
During this reporting period, water quality was monitored through online instruments, field testing with handheld instrument and laboratory tests. The daily and weekly water quality monitoring provides a direct correlation of the performance of the pilot treatment units as well as the level of treatment that can be achieved during different operational conditions. A tabulated spreadsheet was prepared to record and analyze this data (refer to electronic spreadsheet BBCWRPP Water Quality Operations Data_12292010_KEH.xlsx). Please note that the latest version of this electronic file will be submitted with these reports, thus water quality data will extend further than this progress report. The graphical representations of key water quality parameters are shown in the figures below. Figures 3 and 4 show the ammonia removal observed in the MBR, RO, ozone and the UV systems. As shown in Figure 3, the MBR pilot unit achieved complete nitrification for most of the reporting period with the exception of few spikes observed in effluent ammonia concentration when the mechanical and power failures of the process air blower resulted in lower than desired dissolved oxygen concentration in the aeration tank. As shown in Figure 4, the effluent ammonia concentration observed in the ozone and UV system effluents were similar to that observed in the MBR system effluent as expected, since these systems are not expected to provide any significant ammonia removal. Figures 5 and 6 demonstrate nitrate removal observed in the pilot systems evaluated during operation of Train A. As shown in Figure 5, the effluent nitrate concentrations for the MBR systems were observed mostly below 1 mg/L-N until November 22nd as expected. But from November 23rd to December 13th, the MBR effluent nitrate concentration spiked above 10 mg/L-N. The project team inspected the MicroCg dosing system and found that the chemical was not being dosed at sufficient rate. The project team adjusted the MicroCg dosing and since December 15th, the effluent nitrate concentration has reduced to below 0.1 mg/L-N as desired. Figures 7 and 8 present the total phosphorus removal observed in the pilot systems during the reporting period. As shown, the MBR system was able to achieve good phosphorus removal with effluent total phosphorus concentrations observed below 0.5 mg/L-P for most of the samples. Insufficient dosing of PACl in some instances resulted in spikes in effluent phosphorus concentration but the issue with the chemical dosing was resolved as soon as the project staff noticed it.

December 20, 2010 Miami-DadeWASD / BBCWRPP Page 4 of 7 Monthly Summary Report No. 1
Figure 3 – Influent and Effluent Ammonia Concentrations for the MBR System
Figure 4 – Ammonia Concentrations in the RO, UV and Ozone System Effluents
0.001
0.010
0.100
1.000
10.000
100.000
10/19 10/29 11/8 11/18 11/28 12/8 12/18 12/28
Ammon
ia (m
g/L‐N)
MBR Influent Ammonia MBR Effluent Ammonia
Process blower failure
0.001
0.010
0.100
1.000
10.000
10/19 10/29 11/8 11/18 11/28 12/8 12/18 12/28
Ammon
ia (m
g/L‐N)
RO Effluent UV/H2O2 Effluent O3/H2O2 Effluent

December 20, 2010 Miami-DadeWASD / BBCWRPP Page 5 of 7 Monthly Summary Report No. 1
Figure 5 – Influent Ammonia and Effluent Nitrate Concentrations for the MBR
System
Figure 6 – Effluent Nitrate+Nitrite Concentrations for the RO, Ozone and the UV
Systems
0.010
0.100
1.000
10.000
100.000
10/19 10/29 11/8 11/18 11/28 12/8 12/18 12/28
Concen
tration (m
g/L‐N)
MBR Influent Ammonia MBR Effluent Nitrate
Insufficient MicroCg dosing
0.010
0.100
1.000
10.000
100.000
10/19 10/29 11/8 11/18 11/28 12/8 12/18 12/28
Nitrate + Nitrite (m
g/L‐N)
RO Effluent UV/H2O2 Effluent O3/H2O2 Effluent

December 20, 2010 Miami-DadeWASD / BBCWRPP Page 6 of 7 Monthly Summary Report No. 1
Figure 7- Influent and Effluent total Phosphorus Concentrations for the MBR System
Figure 8 – Effluent Phosphorus Concentrations for the RO, Ozone and the UV Systems
0.00
0.01
0.10
1.00
10.00
100.00
10/19 10/29 11/8 11/18 11/28 12/8 12/18 12/28
Total Pho
spho
rus (m
g/L‐P)
MBR Influent MBR Effluent
0.001
0.010
0.100
1.000
10.000
100.000
10/19 10/29 11/8 11/18 11/28 12/8 12/18 12/28
Total Pho
spho
rus (m
g/L‐P)
RO Effluent UV/H2O2 Effluent O3/H2O2 Effluent

December 20, 2010 Miami-DadeWASD / BBCWRPP Page 7 of 7 Monthly Summary Report No. 1
III. MONTHLY WATER QUALITY SAMPLING SUMMARY Monthly microconstituent sampling took place on November 16, 2010. This sampling event took place from 9:30 AM to 4:00 PM. Composites and grab samples for MBR influent (MBR in), MBR filtrate (MBR out), UV/Peroxide effluent (UV/H2O2), and Ozone/Peroxide (O3/H2O2) effluent were taken. Test results have three to four weeks turn around; therefore these results will be reported during next month. If you should have any questions or require additional information, please do not hesitate to contact me at (954) 846-0401. Respectfully submitted,
MWH Americas, Inc. Yurfa Glenny Project Manager cc. Attachments: Daily Operational Logs Month No.1
Provisional Daily and Weekly Water Quality Results

2937 SW 27th Avenue TEL 786 313 5505 Suite 107 FAX 786 313 5506 Miami, Florida 33133 www.mwhglobal.com
January 20, 2011 Mr. James Ferguson, P.E. Miami-Dade Water and Sewer Department 23200 SW 97th Avenue, Suite 1 Miami, Florida 33190 Subject: Agreement No. 08MWHA007
OCI Project No. E08-WASD-02A Work Order No. 4 BBCWRPP - Pilot Operations, Water Quality Reports, Laboratory and Stakeholder Management and Coordination Monthly Pilot Operations and Water Quality Report
Dear Mr. Ferguson: MWH Americas, Inc. (MWH) is pleased to submit the second monthly Summary Report for the Biscayne Bay Coastal Wetlands Rehydration Pilot Project (BBCWRPP) Operations and Water Quality Monitoring. This summary report covers the reporting period from December 1, 2010, at 07:30 hours through December 31, 2010, at 17:00 hours.
I. DAILY OPERATIONS SUMMARY During the reporting period, the operational performance of Train A was evaluated due to limited availability of the MBR filtrate flow. The MBR, Ozone and UV systems were operated at target net flow rates of 25, 11, and 10 gpm respectively for first half of the reporting period. The MBR system experienced severe membrane fouling during the second half of the reporting period, following which the system flow rate was reduced to 20 gpm to ensure that the trans-membrane pressure does not exceed the maximum allowable pressure until a recovery clean is performed on the membranes. Reduced filtrate flow production from the MBR system also required reducing the flow-rate to the UV system from 10 to 8 gpm during the second half of the reporting period. Two maintenance cleans or enhanced flux maintenance (EFM) cleans were performed on the MBR system (on 12/10 and 12/19) but the membrane permeability did not recover. Following this, the project team decided to conduct a recovery clean (CIP). Since the CIP required presence of Pall’s staff on site, it was planned to be conducted in early January. The process air blower for the MBR system failed on December 15th, following which the system was operated on spare blower. The system is currently operating on a spare
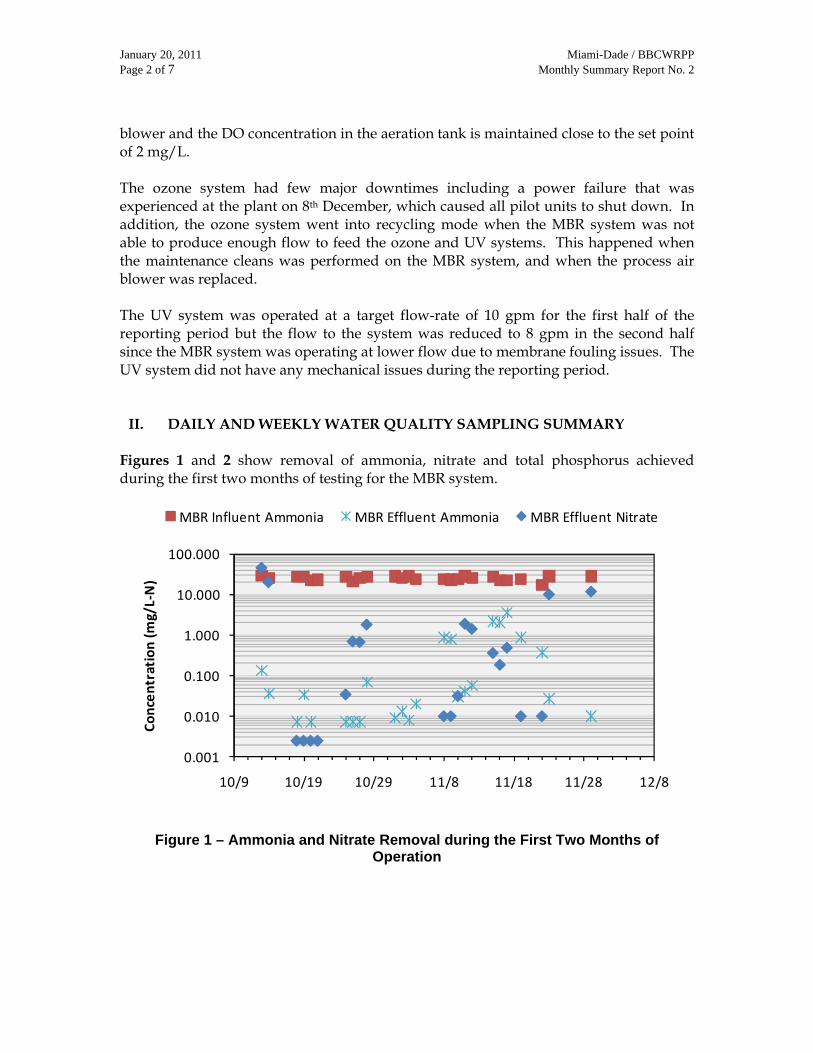
January 20, 2011 Miami-Dade / BBCWRPP Page 2 of 7 Monthly Summary Report No. 2
blower and the DO concentration in the aeration tank is maintained close to the set point of 2 mg/L. The ozone system had few major downtimes including a power failure that was experienced at the plant on 8th December, which caused all pilot units to shut down. In addition, the ozone system went into recycling mode when the MBR system was not able to produce enough flow to feed the ozone and UV systems. This happened when the maintenance cleans was performed on the MBR system, and when the process air blower was replaced. The UV system was operated at a target flow-rate of 10 gpm for the first half of the reporting period but the flow to the system was reduced to 8 gpm in the second half since the MBR system was operating at lower flow due to membrane fouling issues. The UV system did not have any mechanical issues during the reporting period.
II. DAILY AND WEEKLY WATER QUALITY SAMPLING SUMMARY Figures 1 and 2 show removal of ammonia, nitrate and total phosphorus achieved during the first two months of testing for the MBR system.
Figure 1 – Ammonia and Nitrate Removal during the First Two Months of Operation
0.001
0.010
0.100
1.000
10.000
100.000
10/9 10/19 10/29 11/8 11/18 11/28 12/8
Concen
tration (m
g/L‐N)
MBR Influent Ammonia MBR Effluent Ammonia MBR Effluent Nitrate

January 20, 2011 Miami-Dade / BBCWRPP Page 3 of 7 Monthly Summary Report No. 2
Figure 2 – Total Phosphorus Removal during the First Two Months of Operation
During this reporting period, water quality was monitored through online instruments, field testing with handheld instrument and laboratory tests. The daily and weekly water quality monitoring provides a direct correlation of the performance of the pilot treatment units as well as the level of treatment that can be achieved during different operational conditions. A tabulated spreadsheet was prepared to record and analyze this data. Please note that the latest version of this electronic file will be submitted with these reports, thus water quality data will extend further than this progress report. The graphical representations of key water quality parameters are shown in the figures below. Figures 3 and 4 show the ammonia removal observed in the MBR, ozone and UV systems. As shown in Figure 3, the MBR pilot system achieved complete nitrification during the reporting period with effluent ammonia concentration measured below 0.1 mg/L-N. The effluent ammonia concentrations on December 27th and 28th were measured above typical levels but returned to normal values on December 29th. As shown in Figure 4, the effluent ammonia concentration observed in the ozone and UV system effluents were similar to that observed in the MBR system effluent as expected, since these systems are not expected to provide any significant ammonia, nitrate or phosphorus removal.
0.01
0.10
1.00
10.00
100.00
10/9 10/19 10/29 11/8 11/18 11/28 12/8
Total Pho
spho
rus (m
g/L‐P)
MBR Influent MBR Effluent

January 20, 2011 Miami-Dade / BBCWRPP Page 4 of 7 Monthly Summary Report No. 2
Figure 3 – Influent and Effluent Ammonia Concentrations for the MBR System
Figure 4 – Ammonia Concentrations in the RO, UV and Ozone System Effluents
Figures 5 and 6 demonstrate nitrate removal observed in the pilot systems evaluated during operation of Train A. As shown in Figure 5, the effluent nitrate concentrations were measured at much higher than expected levels for most of the reporting period. Once the project team received the lab results for ammonia and nitrate for the first week of the reporting period, the MicroCg dosing was increased on 14th December to account
0.010
0.100
1.000
10.000
100.000
11/28 12/3 12/8 12/13 12/18 12/23 12/28 1/2
Ammon
ia (m
g/L‐N)
MBR Influent Ammonia MBR Effluent Ammonia
0.010
0.100
1.000
10.000
11/28 12/3 12/8 12/13 12/18 12/23 12/28 1/2
Ammon
ia (m
g/L‐N)
UV/H2O2 Effluent O3/H2O2 Effluent

January 20, 2011 Miami-Dade / BBCWRPP Page 5 of 7 Monthly Summary Report No. 2
for higher feed ammonia concentration and to reduce the effluent nitrate concentrations to desired levels. The average ammonia concentration in the feed water during the first two months was observed at 25.1 mg/L-N whereas that during the reporting period was observed at 30.6 mg/L-N. Following the increase in MicroCg dosing, the effluent nitrate concentration was lowered to desired level by 20th December, but it spiked again in few days. On 7th January, it was found that MicroCg pump was clogged and the chemical was not being dosed. This could explain spikes in effluent nitrate concentration observed at the end of the reporting period. The project team is now monitoring the MicroCg feed rate twice a week and will adjust the MicroCg dosing over next few weeks to achieve complete denitrification. Figures 7 and 8 demonstrate phosphorus removal observed in the MBR, ozone and UV systems. As shown in Figure 7, the phosphorus removal by the MBR system varied significantly with phosphorus concentration in the MBR effluent samples measured below 0.5 mg/L-P for about half of the samples. During the reporting period, the phosphorus concentration in the feed water varied from 1.8 to 4.5 mg/L-P with average concentration of 2.9 mg/L-P.
Figure 5 – Influent Ammonia and Effluent Nitrate Concentrations for the MBR
System
0.010
0.100
1.000
10.000
100.000
11/28 12/3 12/8 12/13 12/18 12/23 12/28 1/2
Concen
tration (m
g/L‐N)
MBR Influent Ammonia MBR Effluent Nitrate

January 20, 2011 Miami-Dade / BBCWRPP Page 6 of 7 Monthly Summary Report No. 2
Figure 6 – Effluent Nitrate+Nitrite Concentrations for the RO, Ozone and the UV
Systems
Figure 7 – Influent and Effluent Total Phosphorus Concentrations for the MBR
System
0.010
0.100
1.000
10.000
100.000
11/28 12/3 12/8 12/13 12/18 12/23 12/28 1/2
Nitrate + Nitrite (m
g/L‐N)
UV/H2O2 Effluent O3/H2O2 Effluent
0.00
0.01
0.10
1.00
10.00
11/28 12/3 12/8 12/13 12/18 12/23 12/28 1/2
Total Pho
spho
rus (m
g/L‐P)
MBR Influent MBR Effluent

January 20, 2011 Miami-Dade / BBCWRPP Page 7 of 7 Monthly Summary Report No. 2
Figure 8 – Effluent phosphorus concentrations for the RO, ozone and the UV
Systems III. MONTHLY WATER QUALITY SAMPLING SUMMARY Monthly microconstituent sampling took place on December 21, 2010. This sampling event took place from 9:30 AM to 4:00 PM. Composites and grab samples for MBR influent (MBR in), MBR filtrate (MBR out), UV/Peroxide effluent (UV/H2O2), and Ozone/Peroxide (O3/H2O2) effluent were taken. Provisional November sampling results were we submitted to the Stakeholders. If you should have any questions or require additional information, please do not hesitate to contact me at (954) 846-0401. Respectfully submitted,
MWH Americas, Inc. Yurfa Glenny Project Manager cc. Attachments: Daily Operational Logs Month No.2
Provisional Daily and Weekly Water Quality Results
0.001
0.010
0.100
1.000
10.000
11/28 12/3 12/8 12/13 12/18 12/23 12/28 1/2
Total Pho
spho
rus (m
g/L‐P)
UV/H2O2 Effluent O3/H2O2 Effluent

2937 SW 27th Avenue TEL 786 313 5505 Suite 107 FAX 786 313 5506 Miami, Florida 33133 www.mwhglobal.com
March 2, 2011 Mr. James Ferguson, P.E. Miami-Dade Water and Sewer Department 23200 SW 97th Avenue, Suite 1 Miami, Florida 33190 Subject: Agreement No. 08MWHA007
OCI Project No. E08-WASD-02A Work Order No. 4 BBCWRPP - Pilot Operations, Water Quality Reports, Laboratory and Stakeholder Management and Coordination Monthly Pilot Operations and Water Quality Report
Dear Mr. Ferguson: MWH Americas, Inc. (MWH) is pleased to submit the third monthly Summary Report for the Biscayne Bay Coastal Wetlands Rehydration Pilot Project (BBCWRPP) Operations and Water Quality Monitoring. This summary report covers the reporting period from January 1, 2011, at 07:30 hours through January 31, 2011, at 17:00 hours.
I. DAILY OPERATIONS SUMMARY During the reporting period, the operational performance of only Train A was evaluated due to limited availability of the MBR filtrate flow. The MBR, Ozone and UV systems were operated at flow rates of 20-28, 11, and 10 gpm respectively for the reporting period. The MBR system experienced severe membrane fouling during the second half of the previous reporting period, following which the system flow rate was reduced to 20 gpm to ensure that the trans-membrane pressure does not exceed the maximum allowable pressure until a recovery clean is performed on the membranes. Following the recovery clean, the system flow-rate was increased to 28.2 gpm. The following operations and maintenance issues occurred during this reporting period:
1) 5th January 2011 – Ozone system shut down due to insufficient feed water available from the MBR system. System was restarted on the same day.
2) 7th January 2011 – Operator found out that MicroCg (carbon source) was not being dosed to the bioreactors due to clogging inside the chemical dosing pump.

March 2, 2011 Miami-Dade WASD / BBCWRPP Page 2 of 8 Monthly Summary Report No. 3
Following this, the chemical dosing pump was cleaned and MicroCg dose (flow-rate) was measured and adjusted.
3) 11th January 2011 – A membrane recovery clean was conducted on the MBR system, which required the system to be shut down. During the recovery clean, mixed liquor from the membrane tank was drained accidentally, which reduced the mixed liquor concentration in the bioreactors to 3620 mg/L. To increase the MLSS concentration to desired levels, sludge wasting was temporarily discontinued. The desired MLSS concentration of 8,000 mg/L was achieved by 28th January 2011. The ozone and UV systems were also shutdown while the recovery cleaning was conducted on the MBR system.
4) 18th January 2011 – Feed water pump for the MBR system did not have enough capacity to produce required flow, which resulted in low water level in the anoxic tank level and subsequent shutdown of the pilot system. Feed water flow-rate to the MBR system was reduced to 27 gpm to avoid any further shutdown until the replacement pump arrives.
Figure 1 shows the TSS and VSS concentrations measured in the bioreactors of the MBR system. As shown, the MLSS concentrations as well as VSS (as % of TSS) concentrations in the bioreactor stabilized (at about 85%) by early November after the initial start-up period. But following that, the MBR system experienced several operational issues including process blower failure, clogging of coarse bubble diffusers (for membrane scour air) and, clogging of MicroCg dosing pump. These maintenance issues resulted in multiple shutdowns during the months of December and January causing upsets in the bioreactor, which is evident from VSS concentration (as % of TSS) measured in the bioreactors (Figure 1). As shown, the VSS concentration in the bioreactor varied from 50-90% during the months of December and January. The MLSS concentration also reduced dramatically during mid January, when mixed liquor from the membrane tank was drained accidentally. The ozone and UV systems had few downtimes; once when the MBR system was not able to produce enough flow to feed these systems and second time when the recovery cleaning was conducted on the MBR system. The RO system was not utilized during this reporting period.
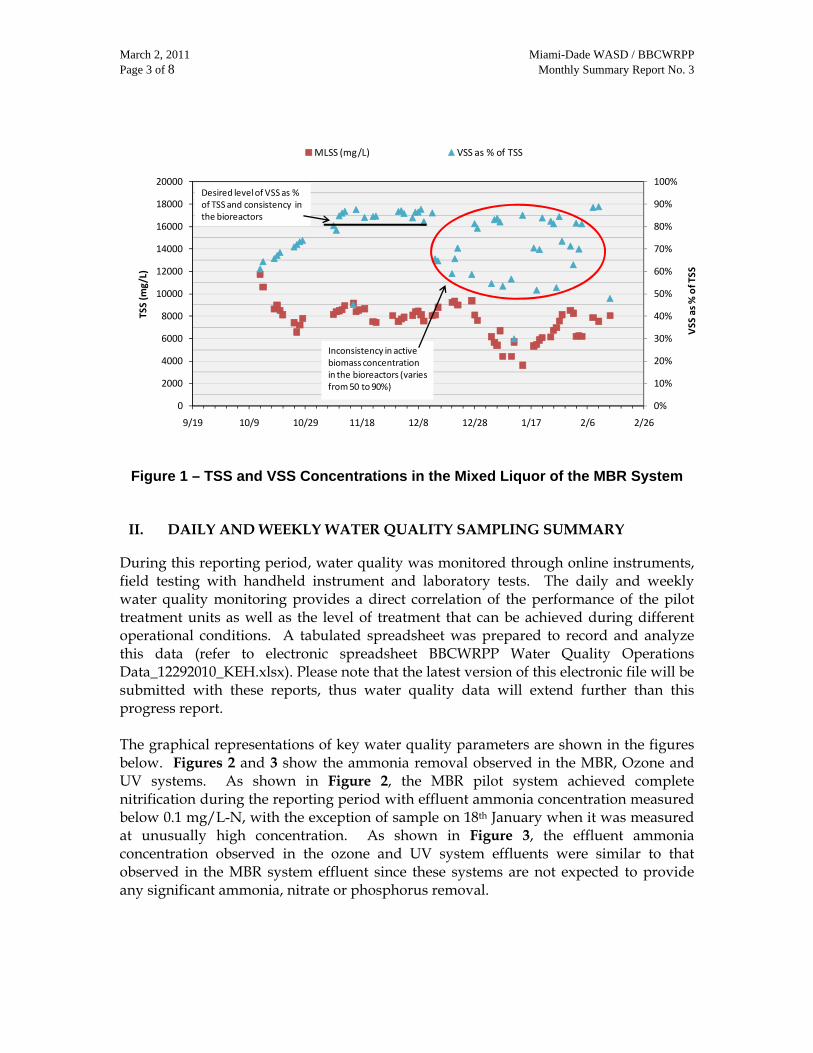
March 2, 2011 Miami-Dade WASD / BBCWRPP Page 3 of 8 Monthly Summary Report No. 3
Figure 1 – TSS and VSS Concentrations in the Mixed Liquor of the MBR System
II. DAILY AND WEEKLY WATER QUALITY SAMPLING SUMMARY During this reporting period, water quality was monitored through online instruments, field testing with handheld instrument and laboratory tests. The daily and weekly water quality monitoring provides a direct correlation of the performance of the pilot treatment units as well as the level of treatment that can be achieved during different operational conditions. A tabulated spreadsheet was prepared to record and analyze this data (refer to electronic spreadsheet BBCWRPP Water Quality Operations Data_12292010_KEH.xlsx). Please note that the latest version of this electronic file will be submitted with these reports, thus water quality data will extend further than this progress report. The graphical representations of key water quality parameters are shown in the figures below. Figures 2 and 3 show the ammonia removal observed in the MBR, Ozone and UV systems. As shown in Figure 2, the MBR pilot system achieved complete nitrification during the reporting period with effluent ammonia concentration measured below 0.1 mg/L-N, with the exception of sample on 18th January when it was measured at unusually high concentration. As shown in Figure 3, the effluent ammonia concentration observed in the ozone and UV system effluents were similar to that observed in the MBR system effluent since these systems are not expected to provide any significant ammonia, nitrate or phosphorus removal.
0%
10%
20%
30%
40%
50%
60%
70%
80%
90%
100%
0
2000
4000
6000
8000
10000
12000
14000
16000
18000
20000
9/19 10/9 10/29 11/18 12/8 12/28 1/17 2/6 2/26
VSS
as %
of TSS
TSS (m
g/L)
MLSS (mg/L) VSS as % of TSS
Inconsistency in active biomass concentration in the bioreactors (varies from 50 to 90%)
Desired level of VSS as % of TSS and consistency in the bioreactors

March 2, 2011 Miami-Dade WASD / BBCWRPP Page 4 of 8 Monthly Summary Report No. 3
Figure 2 – Influent and Effluent Ammonia Concentrations for the MBR System
Figure 3 – Ammonia Concentrations in the UV and Ozone System Effluents
Figures 4 and 5 demonstrate the nitrate removal observed in the pilot systems evaluated during operation of Train A. As shown in Figure 4, the effluent nitrate concentrations were measured at much higher than expected levels for most of the reporting period, primarily due to upsets caused during the operational and maintenance issues experienced during most of the reporting period. As mentioned in the operations summary, MicroCg (carbon source for denitrifiers) was not being dosed in early January due to clogging of the chemical dosing pump. Following that, a recovery clean was
0.01
0.10
1.00
10.00
100.00
12/28 1/2 1/7 1/12 1/17 1/22 1/27 2/1 2/6
Ammon
ia (m
g/L‐N)
MBR Influent Ammonia MBR Effluent Ammonia
0.010
0.100
1.000
10.000
12/28 1/2 1/7 1/12 1/17 1/22 1/27 2/1 2/6
Ammon
ia (m
g/L‐N)
UV/H2O2 Effluent O3/H2O2 Effluent

March 2, 2011 Miami-Dade WASD / BBCWRPP Page 5 of 8 Monthly Summary Report No. 3
performed, during which a significant volume of mixed liquor was accidentally drained and mixed liquor concentration was reduced dramatically. It took two weeks to achieve the desired MLSS concentration in the bioreactors. Once these issues were resolved, denitrification efficiency of the MBR system increased gradually and the effluent nitrate concentration was reduced from peak concentration of 18.6 mg/L-N on 24th January to 2.6 mg/L-N on 28th January. The average ammonia concentration in the feed water during the reporting period was measured at 28.4 mg/L-N. Figures 6 and 7 demonstrate phosphorus removal observed in the MBR, ozone and UV systems. As shown in Figure 6, the phosphorus removal by the MBR system varied significantly with phosphorus concentration in the MBR effluent samples measured below 0.3 mg/L-P for about half of the samples. During the reporting period, the phosphorus concentration in the feed water varied from 1.6 to 3.0 mg/L-P with average concentration of 2.3 mg/L-P. It should be noted that the pilot system is not designed to automatically adjust the chemical dosing based on the influent water quality.
Figure 4 – Influent Ammonia and Effluent Nitrate Concentrations for the MBR
System
0.010
0.100
1.000
10.000
100.000
12/28 1/2 1/7 1/12 1/17 1/22 1/27 2/1 2/6
Concen
tration (m
g/L‐N)
MBR Influent Ammonia MBR Effluent Nitrate

March 2, 2011 Miami-Dade WASD / BBCWRPP Page 6 of 8 Monthly Summary Report No. 3
Figure 5 – Effluent Nitrate Concentrations for the Ozone and the UV Systems
Figure 6 – Influent and Effluent Total Phosphorus Concentrations for the MBR
System
0.01
0.10
1.00
10.00
100.00
12/28 1/2 1/7 1/12 1/17 1/22 1/27 2/1 2/6
Nitrate (m
g/L‐N)
UV/H2O2 Effluent O3/H2O2 Effluent
0.01
0.10
1.00
10.00
12/28 1/2 1/7 1/12 1/17 1/22 1/27 2/1 2/6
Total Pho
spho
rus (m
g/L‐P)
MBR Influent MBR Effluent

March 2, 2011 Miami-Dade WASD / BBCWRPP Page 7 of 8 Monthly Summary Report No. 3
Figure 7 – Effluent Phosphorus Concentrations for the Ozone and the UV Systems III. MONTHLY WATER QUALITY SAMPLING SUMMARY Monthly microconstituent sampling took place on December 21, 2010. This sampling event took place from 9:30 AM to 4:00 PM. Composites and grab samples for MBR influent (MBR in), MBR filtrate (MBR out), UV/Peroxide effluent (UV/H2O2), and Ozone/Peroxide (O3/H2O2) effluent were taken. Test results have three to four weeks turn around and are shown on the Monthly_Data_Final April 2011.xlsx spreadsheet. These are also available on the project SharePoint site at https://fastplay.mwhtools.com/sites/miamidade/SitePages/Home.aspx If you should have any questions or require additional information, please do not hesitate to contact me at (954) 846-0401. Respectfully submitted,
MWH Americas, Inc. Yurfa Glenny Project Manager cc. Attachments: Daily Operational Logs Month No. 3
0.010
0.100
1.000
10.000
12/28 1/2 1/7 1/12 1/17 1/22 1/27 2/1 2/6
Total Pho
spho
rus (m
g/L‐P)
UV/H2O2 Effluent O3/H2O2 Effluent

March 2, 2011 Miami-Dade WASD / BBCWRPP Page 8 of 8 Monthly Summary Report No. 3
Provisional Daily and Weekly Water Quality Results Spreadsheet

2937 SW 27th Avenue TEL 786 313 5505 Suite 107 FAX 786 313 5506 Miami, Florida 33133 www.mwhglobal.com
April 20, 2011 Mr. James Ferguson, P.E. Miami-Dade Water and Sewer Department 23200 SW 97th Avenue, Suite 1 Miami, Florida 33190 Subject: Agreement No. 08MWHA007
OCI Project No. E08-WASD-02A Work Order No. 4 BBCWRPP - Pilot Operations, Water Quality Reports, Laboratory and Stakeholder Management and Coordination Monthly Pilot Operations and Water Quality Report
Dear Mr. Ferguson: MWH Americas, Inc. (MWH) is pleased to submit the third monthly Summary Report for the Biscayne Bay Coastal Wetlands Rehydration Pilot Project (BBCWRPP) Operations and Water Quality Monitoring. This summary report covers the reporting period from February 1, 2011, at 07:30 hours through February 28, 2011, at 17:00 hours.
I. DAILY OPERATIONS SUMMARY During the reporting period, the operational performance of Train A and Train C was evaluated. Train C, with RO in operation, was continually tested from February 8th to February 24th while Train A was tested during the beginning and end of the month. The MBR, RO, Ozone and UV systems were operated at flow rates of 28-29, 21-22, 10-11 and 10 gpm respectively for the reporting period. The following operations and maintenance issues occurred during this reporting period:
1) The UV system was shut down temporarily on 4th February to clean the lamps.
2) Severe foaming was observed in the MBR system on 14th February which required shut down of the RO, ozone and UV systems.
3) The MBR system shut down multiple times from 28th February to 2nd March due to lack of feed water in the equalization tank. Due to maintenance issues at the South District WWTP, the pumps delivering water to the equalization tank were not able to draw sufficient secondary effluent.

April 20, 2011 Miami-Dade WASD / BBCWRPP Page 2 of 7 Monthly Summary Report No. 4
Figure 1 presents the TSS and VSS concentrations measured in the bioreactors of the MBR system. The MLSS concentration in the anoxic tank was maintained at the target concentration of 8,000 mg/L during the reporting period. Due to rise in trans-membrane pressure (TMP) of the MBR system, maintenance cleaning (EFM) was performed on 11th February. This required the MBR system to shut down temporarily but the maintenance clean was not found to be effective. As a result, a second maintenance clean was performed on 14th February, which helped recover the membrane permeability. These multiple cleaning events may have resulted in upset of biomass, which was evident from severe foaming observed in the bioreactor tanks on 14th February and a drop in active biomass concentration in the anoxic tanks (low volatile solids concentration). As a result of severe foaming, the RO, ozone and UV systems were shut down temporarily.
Figure 1 – TSS and VSS Concentrations in the Mixed Liquor of the MBR System
II. DAILY AND WEEKLY WATER QUALITY SAMPLING SUMMARY During this reporting period, water quality was monitored through online instruments, field testing with handheld instrument and laboratory tests. The daily and weekly water quality monitoring provides a direct correlation of the performance of the pilot treatment units as well as the level of treatment that can be achieved during different operational conditions. A tabulated spreadsheet was prepared to record and analyze this data (refer to electronic spreadsheet BBCWRPP Water Quality Operations
0%
20%
40%
60%
80%
100%
0
4000
8000
12000
16000
20000
VSS
as %
of T
SS
Con
cent
ratio
n (m
g/L)
Hours of Operation
Anoxic Tank MLSS VSS as % of TSS
Maintenance cleanings performed on MBR

April 20, 2011 Miami-Dade WASD / BBCWRPP Page 3 of 7 Monthly Summary Report No. 4
Data_06072011_KEH.xlsx). Please note that the latest version of this electronic file will be submitted with these reports, thus water quality data will extend further than this progress report. The graphical representations of key water quality parameters are shown in the figures below. Figures 2 and 3 show the ammonia removal observed in the MBR, Ozone and UV systems. As shown in Figure 2, the MBR pilot system achieved complete nitrification from 1st February to 14th February but following the maintenance cleanings and foaming issues, effluent ammonia concentration spiked to 9 mg/L-N and gradually declined to normal levels on 22nd February. As shown in Figure 3, the effluent ammonia concentration observed in the reverse osmosis (RO) permeate were measured at the detection limit of 0.01 mg/L-N for most of the reporting period but slightly higher ammonia concentrations were observed for RO permeate when the feed (MBR filtrate) concentration increased from 14th to 21st February. For feed ammonia concentration varying from 2.7-8.7 mg/L-N, the RO system provided 94-99% rejection of ammonia (RO permeate ammonia concentration below 0.5 mg/L-N), indicating that RO could serve as a polishing step for meeting stringent total nitrogen limits in the event of upset in bioreactor basins of the MBR system. The ammonia concentration in the ozone and UV system effluents were similar to that observed in the RO system effluent since these systems are not expected to provide any significant ammonia, nitrate or phosphorus removal.
Figure 2 – Influent and Effluent Ammonia Concentrations for the MBR System
0.01
0.10
1.00
10.00
100.00
2/1 2/6 2/11 2/16 2/21 2/26 3/3
Ammon
ia (m
g/L‐N)
MBR Influent Ammonia MBR Effluent Ammonia

April 20, 2011 Miami-Dade WASD / BBCWRPP Page 4 of 7 Monthly Summary Report No. 4
Figure 3 – Ammonia Concentrations in the RO, UV and Ozone System Effluents
Figures 4 and 5 demonstrate the nitrate removal observed in the pilot systems evaluated during operation of Train A and C. As shown in Figure 4, denitrification efficiency of the MBR system varied during the reporting period with effluent nitrate concentrations varying from 0.01 to 7.7 mg/L-N. Since MicroCg (external carbon source) was added a constant rate and the feed ammonia concentration stayed below 35 mg/L-N throughout the reporting period, it is likely that DO carryover from the aeration tank may have resulted in these fluctuations in the effluent nitrate concentrations. Effluent nitrate concentrations were measured mostly below 1 mg/L-N for the second half of the reporting period. The nitrate concentrations in the RO permeate were measured below 0.2 mg/L-N and when the feed (MBR filtrate) nitrate concentration varied from 4.3 to 7.7 mg/L-N, the RO system provided 97.5 to 99.8% rejection of nitrate. Figures 6 and 7 demonstrate phosphorus removal observed in the MBR, RO, ozone and UV systems. As shown in Figure 6, MBR effluent phosphorus concentration was measured below 30 µg/L for majority of the samples collected during the reporting period but occasional spikes of up to 0.75 mg/L were observed. The influent total phosphorus concentration varied from 2.1 to 5.3 mg/L during this period. The RO effluent phosphorus concentrations were measured mostly at the detection limit of 2 µg/L while those for the effluents from the advanced oxidation processes were measured similar to MBR effluent or RO effluent depending on the feed to these processes.
0.01
0.10
1.00
10.00
2/1 2/6 2/11 2/16 2/21 2/26 3/3
Ammon
ia (m
g/L‐N)
RO Effluent UV/H2O2 Effluent O3/H2O2 Effluent

April 20, 2011 Miami-Dade WASD / BBCWRPP Page 5 of 7 Monthly Summary Report No. 4
Figure 4 – Influent Ammonia and Effluent Nitrate Concentrations for the MBR
System
Figure 5 – Effluent Nitrate Concentrations for the RO, Ozone and the UV Systems
0.01
0.10
1.00
10.00
100.00
2/1 2/6 2/11 2/16 2/21 2/26 3/3
Concen
tration (m
g/L‐N)
MBR Influent Ammonia MBR Effluent Nitrate
0.01
0.10
1.00
10.00
100.00
2/1 2/6 2/11 2/16 2/21 2/26 3/3
Nitrate (m
g/L‐N)
RO Out UV/H2O2 O3/H2O2

April 20, 2011 Miami-Dade WASD / BBCWRPP Page 6 of 7 Monthly Summary Report No. 4
Figure 6 – Influent and Effluent Total Phosphorus Concentrations for the MBR
System
Figure 7 – Effluent Phosphorus Concentrations for the RO, Ozone and the UV
Systems
0.01
0.10
1.00
10.00
100.00
2/1 2/6 2/11 2/16 2/21 2/26 3/3
Total Pho
spho
rus (m
g/L‐P)
MBR Influent MBR Effluent
0.001
0.010
0.100
1.000
1/27 2/1 2/6 2/11 2/16 2/21 2/26 3/3
Total Pho
spho
rus (m
g/L‐P)
RO Effluent UV/H2O2 Effluent O3/H2O2 Effluent

April 20, 2011 Miami-Dade WASD / BBCWRPP Page 7 of 7 Monthly Summary Report No. 4
III. MONTHLY WATER QUALITY SAMPLING SUMMARY Monthly microconstituent samplings took place on February 7 and 9, 2011. Train A was sampled on February 7th and composites and grab samples for MBR influent (MBR in), MBR filtrate (MBR out), UV/Peroxide (UV/H2O2) effluent, and Ozone/Peroxide (O3/H2O2) effluent were taken. Train C was sampled on February 9th and composites and grab samples only for RO permeate (RO out), UV/Peroxide (UV/H2O2) effluent, and Ozone/Peroxide (O3/H2O2) effluent were taken while MBR influent and filtrate samples were assumed to have no change since sampled only 2 days prior during the sampling event on February 7th. The sampling events each took place from approximately 9:30 AM to 4:00 PM. Test results are shown on the Monthly_Data_Final April 2011.xlsx spreadsheet and are available on the SharePoint site at https://fastplay.mwhtools.com/sites/miamidade/SitePages/Home.aspx. If you should have any questions or require additional information, please do not hesitate to contact me at (954) 846-0401. Respectfully submitted,
MWH Americas, Inc. Yurfa Glenny Project Manager cc: Attachments: Daily Operational Logs Month No. 4
Provisional Daily and Weekly Water Quality Results

2937 SW 27th Avenue TEL 786 313 5505 Suite 107 FAX 786 313 5506 Miami, Florida 33133 www.mwhglobal.com
May 30, 2011 Mr. James Ferguson, P.E. Miami-Dade Water and Sewer Department 23200 SW 97th Avenue, Suite 1 Miami, Florida 33190 Subject: Agreement No. 08MWHA007
OCI Project No. E08-WASD-02A Work Order No. 4 BBCWRPP - Pilot Operations, Water Quality Reports, Laboratory and Stakeholder Management and Coordination Monthly Pilot Operations and Water Quality Report
Dear Mr. Ferguson: MWH Americas, Inc. (MWH) is pleased to submit the third monthly Summary Report for the Biscayne Bay Coastal Wetlands Rehydration Pilot Project (BBCWRPP) Operations and Water Quality Monitoring. This summary report covers the reporting period from March 1, 2011, at 07:30 hours through April 7, 2011, at 17:00 hours.
I. DAILY OPERATIONS SUMMARY During the reporting period, the operational performance of Train A and Train C was evaluated. Train C, with RO in operation, was tested from 4th to 11th March and then from 24th March to 1st April while Train A was tested for the rest of the month. The MBR, RO, Ozone and UV systems were operated at flow rates of 27-29, 17-22, 10.8 and 10-15 gpm respectively for the reporting period. The ozone system was decommissioned on 9th March and later shipped back to the supplier. Following decommissioning of the ozone system, the UV system was operated at a higher flow rate (15 gpm) since excess RO effluent was available. The following operations and maintenance issues occurred during this reporting period:
1) The MBR system shut down multiple times from 28th February to 2nd March due to lack of feed water in the equalization tank. Due to maintenance issues at the South District WWTP, the pumps delivering water to the equalization tank were not able to draw sufficient secondary effluent.
2) The UV system had an alarm on 3rd March stating that the auto wiping mechanism for the lamps was not functioning. Trojan Technologies was notified about this alarm, following which a technician from Trojan Technologies visited the site for troubleshooting.

May 30, 2011 Miami-Dade WASD / BBCWRPP Page 2 of 7 Monthly Summary Report No. 5
Figure 1 presents the TSS and VSS concentrations measured in the bioreactors of the MBR system. The MLSS concentration in the anoxic tank of the MBR system was maintained close to the target concentration of 8,000 mg/L during the reporting period while the VSS as % of TSS was observed to vary from 70-90%.
Figure 1 – TSS and VSS Concentrations in the Mixed Liquor of the MBR System
II. DAILY AND WEEKLY WATER QUALITY SAMPLING SUMMARY During this reporting period, water quality was monitored through online instruments, field testing with handheld instrument and laboratory tests. The daily and weekly water quality monitoring provides a direct correlation of the performance of the pilot treatment units as well as the level of treatment that can be achieved during different operational conditions. A tabulated spreadsheet was prepared to record and analyze this data (refer to electronic spreadsheet BBCWRPP Water Quality Operations Data_06072011_KEH.xlsx). Please note that the latest version of this electronic file will be submitted with these reports, thus water quality data will extend further than this progress report. The graphical representations of key water quality parameters are shown in the figures below. Figures 2 and 3 show the ammonia removal observed in the MBR, RO, Ozone and UV systems. As shown in Figure 2, the MBR pilot system achieved complete nitrification for most of the reporting period with effluent ammonia concentrations
0%
20%
40%
60%
80%
100%
0
4000
8000
12000
16000
20000
VSS
as %
of T
SS
Con
cent
ratio
n (m
g/L)
Hours of Operation
Anoxic Tank MLSS VSS as % of TSS

May 30, 2011 Miami-Dade WASD / BBCWRPP Page 3 of 7 Monthly Summary Report No. 5
below 1 mg/L-N. Due to high trans-membrane pressure (TMP), a maintenance cleaning was performed on MBR system on 25th March but the TMP reached 6.6 psi in next two days, which required another maintenance cleaning on 29th March. During this period, the system also lost nitrification and the effluent ammonia concentrations were measured at 19.7 and 20.4 mg/L-N on the samples collected on 28th and 29th March, respectively. The MBR system was able to achieve complete nitrification on 5th April. As shown in Figure 3, the ammonia concentrations observed in the RO effluent were lower than MBR effluent, as expected and measured below 0.1 mg/L-N for most of the reporting period. When the MBR effluent ammonia concentrations increased to 19.7 and 20.4 mg/L-N on 28th and 29th March, respectively, the RO effluent ammonia concentrations were measured at 1.1 and 1.0 mg/L-N, respectively, indicating ammonia removal efficiency of 95%. The ammonia concentrations in the ozone and UV system effluents were similar to that observed in the MBR system effluent or RO system effluent (depending on the feed water to these systems) since these systems are not expected to provide any significant ammonia, nitrate or phosphorus removal.
Figure 2 – Influent and Effluent Ammonia Concentrations for the MBR System
0.01
0.10
1.00
10.00
100.00
3/1 3/6 3/11 3/16 3/21 3/26 3/31 4/5
Ammon
ia (m
g/L‐N)
MBR Influent Ammonia MBR Effluent Ammonia

May 30, 2011 Miami-Dade WASD / BBCWRPP Page 4 of 7 Monthly Summary Report No. 5
Figure 3 – Ammonia Concentrations in the RO, UV and Ozone System Effluents
Figures 4 and 5 demonstrate the nitrate removal observed in the pilot systems evaluated during operation of Train A and C. As shown in Figure 4, the MBR system achieved complete denitrification during most of the reporting period with effluent nitrate concentrations measured below 0.5 mg/L-N. Nitrate concentrations in the RO effluent were measured below those measured in the MBR effluent as the RO system is typically expected to provide greater than 80% rejection of nitrate. Figures 6 and 7 demonstrate phosphorus removal observed in the MBR, RO, ozone and UV systems. As shown in Figure 6, phosphorus concentration in MBR effluent was measured below 100 µg/L for most of the reporting period while the influent concentration varied from 1.64 to 10.7 mg/L. The RO system was able to remove phosphorus to levels below the method’s detection limit of 2 µg/L.
0.01
0.10
1.00
10.00
3/1 3/6 3/11 3/16 3/21 3/26 3/31 4/5
Ammon
ia (m
g/L‐N)
RO Effluent UV/H2O2 Effluent O3/H2O2 Effluent

May 30, 2011 Miami-Dade WASD / BBCWRPP Page 5 of 7 Monthly Summary Report No. 5
Figure 4 – Influent Ammonia and Effluent Nitrate Concentrations for the MBR
System
Figure 5 – Effluent Nitrate Concentrations for the RO, Ozone and the UV Systems
0.01
0.10
1.00
10.00
100.00
3/1 3/6 3/11 3/16 3/21 3/26 3/31 4/5
Concen
tration (m
g/L‐N)
MBR Influent Ammonia MBR Effluent Nitrate
0.01
0.10
1.00
10.00
100.00
3/1 3/6 3/11 3/16 3/21 3/26 3/31 4/5
Nitrate (m
g/L‐N)
RO Effluent UV/H2O2 Effluent O3/H2O2 Effluent

May 30, 2011 Miami-Dade WASD / BBCWRPP Page 6 of 7 Monthly Summary Report No. 5
Figure 6 – Influent and Effluent Total Phosphorus Concentrations for the MBR System
Figure 7 – Effluent Phosphorus Concentrations for the RO, Ozone and the UV
Systems
0.01
0.10
1.00
10.00
100.00
3/1 3/11 3/21 3/31
Total Pho
spho
rus (m
g/L‐P)
MBR Influent MBR Effluent
0.001
0.010
0.100
1.000
10.000
100.000
3/1 3/11 3/21 3/31
Total Pho
spho
rus (m
g/L‐P)
RO Effluent UV/H2O2 Effluent O3/H2O2 Effluent

May 30, 2011 Miami-Dade WASD / BBCWRPP Page 7 of 7 Monthly Summary Report No. 5
III. MONTHLY WATER QUALITY SAMPLING SUMMARY Monthly microconstituent samplings took place on March 7 and 9, 2011. Train C was sampled on February 7th and composites and grab samples for MBR influent (MBR in), MBR filtrate (MBR out), RO permeate (RO out), UV/Peroxide (UV/H2O2) effluent, and Ozone/Peroxide (O3/H2O2) effluent were taken. Train C was sampled on February 9th and composites and grab samples only for UV/Peroxide (UV/H2O2) effluent, and Ozone/Peroxide (O3/H2O2) effluent were taken while MBR influent and filtrate samples were assumed to have no change since sampled only 2 days prior during the sampling event on March 7th. The sampling events each took place from approximately 9:30 AM to 4:00 PM. Test results are shown on the Monthly_Data_Final April 2011.xlsx spreadsheet and are available on the SharePoint site at https://fastplay.mwhtools.com/sites/miamidade/SitePages/Home.aspx. If you should have any questions or require additional information, please do not hesitate to contact me at (954) 846-0401. Respectfully submitted,
MWH Americas, Inc. Yurfa Glenny Project Manager cc. Attachments: Daily Operational Logs Month No. 5
Provisional Daily and Weekly Water Quality Results

Attachment A
CD
Water Quality and Operations Data
Monthly Microconstituent Data

Attachment B
Attachment B Laboratory Reports

Attachment B
CD
MWH Laboratories
Water Quality Data Reports

Miami-Dade County Water and Sewer Department
MWH Americas, Inc.
Nova Consulting, Inc.
P r o j e c t T e a m