reaction engineering of direct coal liquefaction
TRANSCRIPT

Energies 2009, 2, 976-1006; doi:10.3390/en20400976
energies ISSN 1996-1073
www.mdpi.com/journal/energies
Article
Reaction Engineering of Direct Coal Liquefaction
Ken K. Robinson
Mega-Carbon Company, 5N553 Jens Jensen Lane, St. Charles, IL 60175, USA;
E-Mail: [email protected]; Tel.: +1-630-513-7454; Fax: +1-630-513-7454
Received: 14 October 2009 / Accepted: 23 October 2009 / Published: 29 October 2009
Abstract: Direct coal liquefaction has been studied and practiced since the 1930s. It was
used in Germany during World War II to produce synthetic fuels when there was no oil
allowed into the country. Since then, it has been studied in the United States and many
different technologies have been investigated. Since the US is rich in coal resources, this is
one way to be energy independent. Most of the development activity occurred in the 1980s
and numerous technologies were studied, the most notable of these being H-Coal, Exxon
Donor Solvent, Solvent Refined Coal, and Two Stage Liquefaction. The key elements of
these technologies, particularly the reaction/reactor scheme, are discussed in this review.
Keywords: coal; liquefaction; reactors; kinetics; catalysis; deactivation; reaction
engineering
1. Introduction
1.1. A Brief History of Coal Liquefaction
Interest in coal liquefaction has seen several high and low periods over the last 60 years. Direct coal
liquefaction starts just prior to World War II by Germany, continues through the 1950s and 1960s with
the research by the U.S. Bureau of Mines, and then hit an extensive pace following the Arab oil
embargo of 1973. Since the early 1980s, interest has waned due to the decrease in crude oil prices, but
the invasion of Kuwait by Iraq in 1990 caused the world to reevaluate their position and think about a
national energy policy which will provide incentives to develop U.S. natural resources. The largest
source of liquid hydrocarbons is crude oil and the United States has found and used up the cheap
domestic crude that it once had. When demand exceeds supply, or a political or military action in one
of the oil producing countries happens, the price of crude oil will increase. This stimulates alternative
OPEN ACCESS

Energies 2009, 2
977
fuel options to produce liquid hydrocarbons from domestic energy resources such as coal. Coal
liquefaction would be an attractive option for the United States due to the vast coal reserves.
In late 2008, Shenhua, China’s top coal producer, conducted trial operations of a 1 million-ton/year
(16,300 barrel/day) direct coal to liquid (CTL) production line producing quality diesel, naphtha and
oil. As a key component of the national energy strategy, the Shenhua direct CTL project is based in
coal-rich Inner Mongolia This trial run made China the only country in the world to have achieved key
technologies for 1 million-ton-scale direct CTL production. The trial ended after 300 hours, but
Shenhua made improvements so it could conduct a 1,000-hour trial the following month. However, in
June 2009, China announced that the commercial plant had been put on hold due to concerns of
economics and greenhouse gas emissions [1]. This CTL facility was reported to cost $1.46 billion.
Before discussing direct coal liquefaction, it is important to briefly acknowledge the role of indirect
coal liquefaction, consisting of coal gasification to synthesis gas (hydrogen and carbon monoxide)
with subsequent conversion to liquid fuels via Fischer-Tropsch synthesis. Sasol runs an indirect coal
liquefaction facility in South Africa and produces 160,000 barrels per day [2]. Robinson and Tatterson
updated the economics of co-production of diesel fuel and electricity via integrated gasification
combined cycle (IGCC) and identified a number of situations which produce a very attractive return on
investment, particularly when the byproduct carbon dioxide is captured and sold for enhanced oil
recovery [3,4]. Robinson and Tatterson [4] estimated an indirect coal liquefaction plant producing
9,000 barrels per day of diesel would cost $1.85 billion or $205,000/daily barrel. The China direct
liquefaction plant is in the range of $90,000/daily barrel for the capital investment, but it should be
noted that it would probably be comparable to the indirect liquefaction capital costs if constructed in
the U.S.
In a 1988 article, Lumpkin [5] said ―the economics derived early in the 1980s established the price
of transportation fuels from coal liquefaction at $80 per barrel or higher. However there have been
dramatic improvements in the technology since 1983 that have not been widely appreciated. Recent
designs and cost estimates show that a 60% decrease in the cost of liquid fuels from coal relates to
about $35/barrel for crude oil‖. When crude oil is priced at $70–80/barrel (2009 dollars), direct coal
liquefaction can achieve a reasonable return on investment, but product price guarantees need to be
provided so that risk is reduced and investors are willing to provide money for the very high capital
investment on a commercial plant Direct liquefaction involves the addition of hydrogen to coal in a
solvent slurry at elevated temperature and pressure. The solvent provides a convenient transportation
medium for the coal and enhances heat and mass transfer during chemical reaction. In many processes,
the solvent shuttles hydrogen from the gas phase to the coal and is called a donor solvent. The elevated
temperature cracks the coal molecules by thermally rupturing carbon-carbon linkages and increases the
rate of reaction. High pressure keeps the solvent and products in the liquid phase, prevents coke
build-up on the reactor walls and catalyst surface, and promotes hydrogenation by maintaining a high
partial pressure of hydrogen. Catalysts are normally used to increase the rates of the desirable reactions
which include cracking, hydrogenation, and removal of oxygen, nitrogen, and sulfur.
Coal consists of complex macromolecules without repeating monomer units that are built primarily
of carbon and hydrogen but also consist of significant amounts of oxygen, nitrogen, and sulfur. The
constituent units tend to be mostly substituted aromatics or hydroaromatics and the degree of
condensation increases as the coal matures. Coal has a hydrogen-to-carbon ratio which is significantly

Energies 2009, 2
978
less that petroleum; converting coal into liquids requires either the addition of substantial amounts of
hydrogen or the removal of excess carbon.
The coal time line for the 20th century [6] helps to trace the major events that have occurred in our
recent history. Direct coal liquefaction technology developed from work on hydrogenating coal tar by
Bergius in Germany in the 1920s [7]. A major improvement was the development of sulfur-resistant
hydrogenation catalyst by Pier in BASF’s laboratories in Ludwigshaven, Germany in 1924. The first
German brown coal was hydrogenated in 1929. In the 1930s, several plants were built in Germany,
and one in Billingham, England. The original Bergius plants consisted of liquid-phase hydrogenation
of coal/recycle slurry followed by vapor-phase hydrogenation of middle oils. Both hydrogenation
reactors operated with catalyst and pressures of 5,000–10,000 psig.
German capacity increased to the point that during World War II, eight additional plants were built
in Germany. In 1943, the installed capacity was over 100,000 BSD in 15 plants processing about
50,000 tons of dry coal per day. The US Bureau of Mines tested the German technology after World
War II in a 200 barrel per day pilot plant. All of these efforts were technically successful, but could not
compete economically with inexpensive petroleum from the Middle East in the early 1950s.
Second generation technology came along in the late 1970s and early 1980s. The U.S. pilot plants
to develop these processes included:
1. SRC-II (solvent refined coal) in Tacoma, Washington and Wilsonville, Alabama
2. EDS (Exxon Donor Solvent) in Baytown, Texas
3. H-Coal in Catlettsburg, Kentucky.
Both the SRC-II and EDS process depended on a donor solvent for hydrogen during the
liquefaction and used the minerals in the coal for a catalyst. EDS did use a catalytic stage to hydrotreat
part of the recycle solvent in a second reactor but no catalyst was used in the coal liquefaction unit.
The H-Coal process was developed by Hydrocarbon Research Inc. (HRI) and was derived from their
H-Oil process for petroleum resid upgrading. The basis of the process was a novel catalytic reactor in
which the catalyst was ebullated in the liquid phase, similar to the more familiar gas-phase fluidized
bed processes used in the petroleum industry. The advantage of this type reactor is that the reactor
contents are well mixed helping to alleviate the excessive heat release associated with coal liquefaction
plus the ability to add and withdraw catalyst from the reactor while it is operating so that the catalyst
activity is maintained at a relatively high and constant level. The U.S. Department of Energy (DOE)
and a consortium of industrial sponsors built a 250 ton per day pilot plant at Catlettsburg, Kentucky
which ran from June 1980 to January 1983. The plant was a technical success and confirmed yields by
smaller scale equipment and a wide variety of mechanical equipment was tested including ebbulation
pumps, pressure letdown and block valves, and hydroclones to concentrate the solids-containing
product. Although the process was not economic, two developments promised further cost reductions.
The first was a new catalyst developed by Amoco researchers with a unique bimodal pore size
distribution resulting in less catalyst deactivation, and most importantly higher liquid yields. The
second improvement came from Chevron Research, a two stage liquefaction scheme which lowered
hydrogen consumption by tailoring reaction conditions in each stage to favor the reactions of coal
dissolution, hydrogenation of the donor solvent. thermal/catalytic conversion of the high molecular
weight species (residuum) and removal of sulfur, nitrogen, and oxygen. Finally, a six ton per day pilot
plant at Wilsonville, AL sponsored by Southern Company, Electric Power Research Institute, the US

Energies 2009, 2
979
Department of Energy, and Amoco was operated in the 1980s. It was a two stage Solvent Refined Coal
process and achieved some major success with the incorporation of a catalytic reactor to hydrogenate
the donor solvent and critical solvent deashing, developed by Kerr-McGee. Unlike the earlier SRC
process development, it was operated to make a much lighter product slate of distillate and/or syncrude
with two basic modes, integrated two stage liquefaction (ITSL) and double integrated two stage
liquefaction (DITSL).
1.2. Process Overview of Coal Liquefaction
Direct coal liquefaction refers to the direct reaction of coal with hydrogen to form liquids. The
hydrogen reacts with oxygen, sulfur, and nitrogen in coal to remove them as water, hydrogen sulfide,
and ammonia. The hydrogen is also required to hydrogenate the donor solvent which in turn transfers
hydrogen to the dissolved coal thereby substantially increasing the H/C ratio of the coal as it is
liquefied. One of the key differences between coal and petroleum is the much lower H/C atomic ratio
of coal (0.7 vs 1.5 for petroleum, see Table 3). Consequently the conversion of coal to petroleum-like
products requires direct hydrogen addition and this adds considerable expense to the product.
The ideal technology for direct coal liquefaction for gasoline production would:
- produce only C5-400 °F products which contain no nitrogen, oxygen, or sulfur hydrocarbon gases
- produce no light since these gases consume large amounts of hydrogen
- produce aromatic liquid for octane requirements to reduce hydrogen consumption
- remove oxygen from coal by carbon rejection to carbon oxides rather than hydrogenation
None of the current coal liquefaction processes accomplish this. Second-generation liquefaction
processes now under development are descendants of the classic Bergius technology. Most involve,
more or less, catalyzed interactions between molecular hydrogen and coal-oil slurries of elevated
pressure and temperature. The new processes (2,500 psi, 800–850 °F) are different: (1) they operate at
less severe conditions; (2) they place a great deal of emphasis on H transfer from the slurry oil to the
coal; (3) careful attention is paid to producing process-derived solvent to recycle to the front end of the
process for slurrying the coal. The following table lists these ―second-generation‖ processes and how
they compare:
Table 1. Coal liquefaction process summary.
Name Reactor Type Demonstration Unit Capacity, TPD
H-Coal ebullated bed w/recycle Catlettsburg, KY 200
Exxon Donor
Solvent
plug-flow dissolver + catalytic solvent
hydrotreater Baytown, TX 250
SRC I & II plug-flow preheater/dissolver Tacoma, WA and
Wilsonville, AL
50
6
Two stage
liquefaction
plug-flow preheater/dissolver &
ebullated bed hydrotreater Wilsonville, AL 6
Energies 2009, 2
980
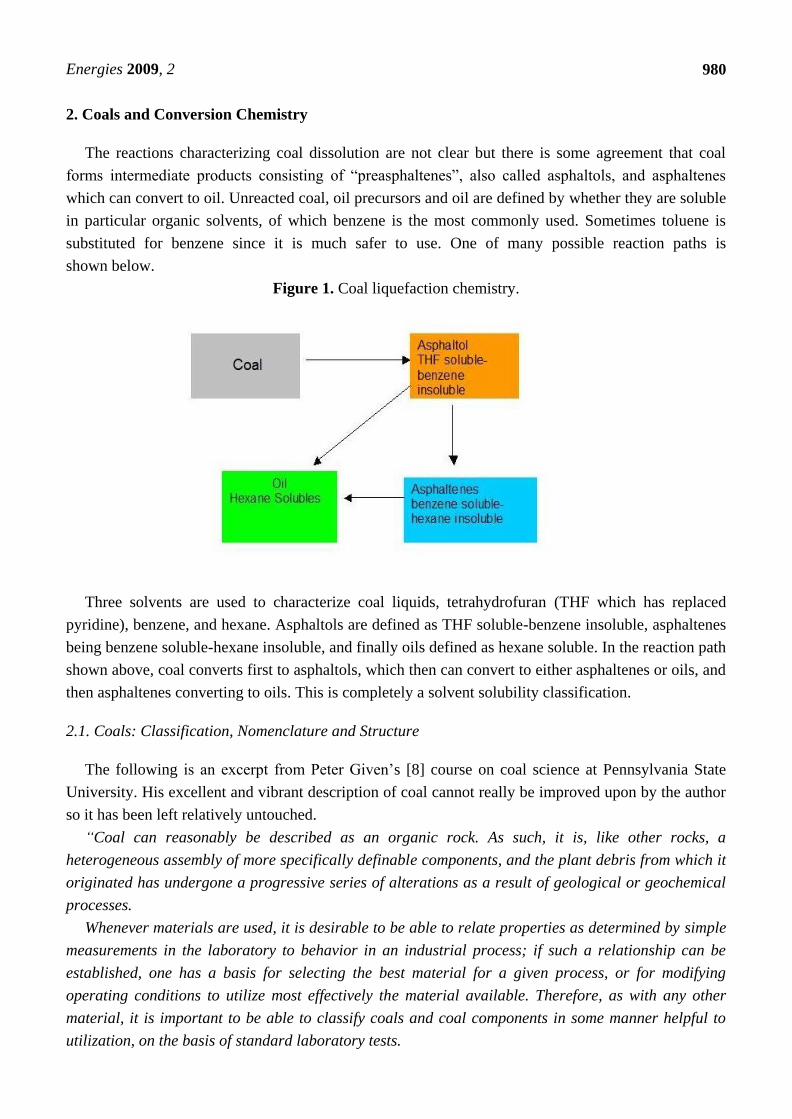
2. Coals and Conversion Chemistry
The reactions characterizing coal dissolution are not clear but there is some agreement that coal
forms intermediate products consisting of ―preasphaltenes‖, also called asphaltols, and asphaltenes
which can convert to oil. Unreacted coal, oil precursors and oil are defined by whether they are soluble
in particular organic solvents, of which benzene is the most commonly used. Sometimes toluene is
substituted for benzene since it is much safer to use. One of many possible reaction paths is
shown below.
Figure 1. Coal liquefaction chemistry.
Three solvents are used to characterize coal liquids, tetrahydrofuran (THF which has replaced
pyridine), benzene, and hexane. Asphaltols are defined as THF soluble-benzene insoluble, asphaltenes
being benzene soluble-hexane insoluble, and finally oils defined as hexane soluble. In the reaction path
shown above, coal converts first to asphaltols, which then can convert to either asphaltenes or oils, and
then asphaltenes converting to oils. This is completely a solvent solubility classification.
2.1. Coals: Classification, Nomenclature and Structure
The following is an excerpt from Peter Given’s [8] course on coal science at Pennsylvania State
University. His excellent and vibrant description of coal cannot really be improved upon by the author
so it has been left relatively untouched.
“Coal can reasonably be described as an organic rock. As such, it is, like other rocks, a
heterogeneous assembly of more specifically definable components, and the plant debris from which it
originated has undergone a progressive series of alterations as a result of geological or geochemical
processes.
Whenever materials are used, it is desirable to be able to relate properties as determined by simple
measurements in the laboratory to behavior in an industrial process; if such a relationship can be
established, one has a basis for selecting the best material for a given process, or for modifying
operating conditions to utilize most effectively the material available. Therefore, as with any other
material, it is important to be able to classify coals and coal components in some manner helpful to
utilization, on the basis of standard laboratory tests.

Energies 2009, 2
981
There are at least seven characteristics of coals that are or may be relevant to their behavior in
conversion processes: rank, geological history, mineral content, trace element distribution,
petrographic composition, chemical structural parameters and pore structure. The coal “series”
allows coals to be classified by the carbon content as:
peat ---→ lignite ---→ sub-bituminous ---→ bituminous ---→anthracite
When we study coals, what we see in nature is an apparently continuous series of alterations from
living plant material through dead material, peat, lignite, sub-bituminous and bituminous coals and
anthracite to graphite. The process of alteration from the peat stage onward is called metamorphism,
and the term “rank” is used in the scientific literature to signify the degree of alteration or
metamorphism. Rank is of such importance in defining the properties of coals that we must discuss it
at some length.”
For simplicity, Table 2 makes it appear that coals are distributed along a single development line. In
fact any plot of a coal property against a measure of the degree of metamorphism is a band, rather than
a line. That is, there have evidently been a number of related pathways by which plant debris has been
progressively altered and passed along the coal series. Nevertheless, the degree of alteration is of
overriding importance in determining what set of properties a coal will have. If you are going to use a
coal, its rank is always the first thing that you want to know about it.
The A.S.T.M. system used for commercial purposes in the U.S., and the International Systems used
in Europe, depend upon volatile matter to classify the higher rank coals, and calorific values for the
lower, which is fair enough as far as it goes. These properties are used to classify coals into about ten
categories, as shown in Table 3.
Table 2. ASTM classification of coal.
Class Group Fixed
Carbon, maf
Volatile
Matter, maf
Heating
Value, BTU/lb
Anthracite metaanthracite
anthracite
semianthracite
>98
92–98
86–92
<2
2–8
8–14
Bituminous low-volatile
med volatile
high volatile A
high volatile B
high volatile C
78–86
69–78
<69
14–22
22–31
>31
>14,000
Subbituminous subbituminous A
subbituminous B
subbituminous C
10,500–11,500
9,500–10,500
Lignitic lignite A
lignite B
6,300–8,300
<6,300
People sometimes speak of a coal as being, for example, of high volatile A bituminous rank, as if
the statement uniquely defined the rank. It would be more accurate and less liable to lead to
misconceptions if one spoke of a coal as being in a certain rank range. Each rank category in fact

Energies 2009, 2
982
covers a portion of the total rank range, and the high volatile A category in particular contains coals of
considerably different degrees of metamorphism (e.g., the carbon content may be between about 80%
and 87%, and the oxygen content between 11% and 4%).
A further characteristic of coals that may be of practical importance is their geological history.
Coals are known in almost every state of this nation, though in some states the deposits are too small
to be of much commercial significance. There were two principal coal-forming periods, the coals of
the central and western states being much younger than those of the eastern and southeastern states.
This means that coals on different sides of the continent were derived from plants of quite different
type, since a great deal of evolution occurred in the 150 million years between the Carboniferous and
the Cretaceous. Moreover, for any one geological age, coals were deposited in a number of distinct
basins in different parts of the country, and experienced distinctly different geological histories.
Table 3. Values of coal properties in different rank ranges.
High Vol
Bituminous Bituminous
Lignite Subbit. B A
Med
Volatile
Low
Volatile Anthracite Petroleum
% C (ash free) 65–72 72–76 78–80 80–87 89 90 93 83–87
% H 4.5 5 5.5 5.5 4.5 3.5 2.5 10–14
% O 30 18 10 10–4 3–4 3 2 0.1–1.5
H/C, atomic 0.77 0.8 0.82 0.8 0.6 0.46 0.32 1.7
% O as OH 15–10 12–10 ? 7–3 1–2 0–1 0
Aromatic C
atoms % of
total C
50 65 ? 75 80–85 85–90 90–95
Av. no.
benzene
rings/layer
1–2
2–3 2–3 2–3 5 >25
Vol.
Matter, % 40–50 35–50
31–40 31–20 20–10 <10
Reflectance,
%, Vitrinite 0.2–0.3 0.3–0.4 0.6 0.6-1.0 1.4 1.8 4
Calorific
value, maf
free, BTU/lb.
7000 10000 13500 14500 15000 15800 15200
2.2. Sulfur in Coal
When coal is analyzed carefully for both major and trace constituents, almost every element will be
found. About the only exceptions are the highly radioactive elements that are made artificially and
some of the noble gases. Of the roughly 80 elements found in coal, the one besides carbon having the
most significant effect on coal use is sulfur. When coal or coal liquids are burned, the sulfur oxides
formed cause air pollution if allowed to escape into the environment. The sulfur in coal has caused the
spending of millions of dollars on equipment and processes to capture the sulfur oxides or to reduce
the sulfur content of coal before it is burned. Sulfur occurs in coal in three forms:

Energies 2009, 2
983
1. organic sulfur, which is a part of the molecular composition of the coal itself;
2. pyritic sulfur, which occurs in the mineral pyrite and some related minerals; and
3. sulfate sulfur, which is mostly iron sulfates.
In most coals, sulfate sulfur is a small fraction of the total sulfur content. In low-rank coals, organic
sulfur may contribute half or more of the total sulfur, but in most bituminous coals, the majority of the
sulfur is pyritic sulfur.
2.3. Inorganic Constituents in Coal
Coal contains a rich variety of inorganic constituents. Mineral grains in coal can sometimes be seen
with the unaided eye and are easily seen through a microscope. When coal is burned it leaves behind
the inconsumable inorganic residue known as ash. The ash is the product of reactions or
transformations of the inorganic components of coal caused by the high temperatures of the
combustion process.
Several sources contribute inorganic material to coal. The first is the coal-forming plants
themselves. Most plants contain at least small amounts of inorganic substances; that is why burning
logs in a fireplace always leave some ash. However, some plants concentrate significant quantities of
inorganic material. For example, the scouring rushes concentrate enough silica in their cell walls to
give them a gritty texture that pioneers found useful for cleaning cooking utensils or scouring floors.
The scouring rushes are examples of the last surviving genus (the horsetails) of a class of plants that
were prevalent in the coal swamps of the Carboniferous period. Some of the inorganic components of
coal were in the original plant material.
During the diagenetic stage of coal formation, as the organic sediments were accumulating in the
swamps, ample opportunities occurred for inorganic debris to be deposited by either water currents or
wind. This debris would settle into the organic sediments and become part of the coal that eventually
formed. Clay particles are deposited into coal in this way. Minerals transported into the coal-forming
environment by wind or water are called detrital minerals.
Although all types of inorganic material in coal are important, either because of their deleterious
effects in coal processing or because of their adverse environmental impact and potential health
hazards, the relative abundance of different inorganic constituents makes it appropriate to distinguish
between major and minor constituents.
1. The major constituents are clay minerals (aluminosilicates), which occur mostly as illite,
kaolinite, montmorillonite, and mixed illite-montmorillonite and commonly make up as much as 50%
of the total mineral matter contents;
2. carbonate minerals, principally calcite (CaCO3), siderite (FeCO3), dolomite (FeCO3-MgCO3),
and ankerite (2CaCO3-MgCO3-FeCO3), but frequently also present as variously composed mixed
carbonates of Ca, Mg, Mn, and Fe;
3. sulfides, which are mainly present as pyrite and marcasite (i.e., dimorphs of FeSx, which only
differ in crystal habit), but which have also been reported in the form of galena (PbS) and sphalerite
(ZnS); and
4. silica, which is ubiquitous as quartz and usually accounts for up to 20% of all mineral matter.

Energies 2009, 2
984
2.4. Coal Liquefaction Catalysis
Catalysis plays an important role in coal liquefaction and has led to important technical advances
and improved economics for producing liquid synfuels. A catalyst is defined as a substance which
accelerates or changes the course of a chemical reaction without being consumed itself. The influence
of the catalyst on liquefaction rate is actually not very noticeable since many of the liquefaction
reactions take place in the absence of the catalyst. It is generally believed that some of the minerals
(i.e., pyrite) present in coal provide a catalytic function, particularly for bituminous coals. However,
once the coal has been initially liquefied, a catalyst will help to hydrocrack the coal liquid constituents,
remove sulfur, nitrogen, and oxygen as hydrogen sulfide, ammonia, and water and rehydrogenate the
hydrogen donor solvent.
The way in which one makes catalyst improvements is not straight-forward. A heterogeneous
catalyst is generally preferred in coal liquefaction since separation of products from the catalyst is
simplified. However, mixing of a soluble catalyst with the coal slurry provides intimate contacting at
the molecular scale.
2.5. The Porous Structure of Catalysts
Coal liquefaction catalysts are highly porous materials, and typically show some aspects of pore
diffusion control. Molecular transport in pores depends on the size of the pore. We can categorize
pores as follows:
1. Bulk flow–Large pores
2. Ordinary diffusion–Large pores
3. Knudsen diffusion–Small pores
The relative balance of the surface reaction rate to the diffusion rate establishes the concentration
profile in the catalyst particle. If diffusion is rapid or surface reactions slow, then the concentration of
reactant will not drop very sharply as we travel down the pore. On the other hand, a slow diffusion rate
or fast surface reaction will produce a sharp concentration gradient in the catalyst particle; then the
reaction on the external surface is much higher than in the particle interior.
The table below lists the properties of some catalysts developed by Amoco and W.R. Grace under
an EPRI contract [9] The ―bimodal‖ pore size distribution is characterized by the inclusion of
macropores greater than 1,000 Å in diameter.
This inclusion of these larger transport pores is important for activity maintenance and a higher
catalyst effectiveness factor. The mean diameter of the smaller pores (APD) should be around 120 Å to
accommodate the large coal-derived molecules.

Energies 2009, 2
985
Table 4. Catalyst inspection data for coal liquefaction catalysts.
Composition,
wt%
Average Pore
Diameter
Surface
Area PV PV of 103–105Å ABD
Catalyst CoO MoO3 Å m2/g cc/g % of total g/cc
Bimodal Catalysts
Cyanamid HDS-
1442A 3.1 13.2 58 323 0.64 26.1 0.567
CoMo-120 APD 3.2 16.2 122 154 0.6 11.1 0.665
Mo-120 APD — 14.9 123 167 0.65 9.6 0.656
Unimodal Catalysts
CoMo-120 APD 3 15.5 115 162 0.62 4.7 0.733
CoMo-120 APD 0.5 16 121 160 0.64 3.2 0.723
2.6. Selection of the Appropriate Rate Equations for Modeling
The rate equations for catalytic hydroliquefaction can take many forms, depending on which step or
steps are slowest and rate controlling. The rate equations for these various situations are listed below:
2.6.1. External mass transport limitations
Hydrogen transfer controls at bubble interface
When the transport of hydrogen gas from bubbles to the bulk liquid is the slowest step the rate
equation is:

Energies 2009, 2
986
The interfacial area of the gas bubbles, ai, is a critical parameter in this case. If the gas bubbles are
large, we can increase reaction rate by better dispersion of the gas into the liquid phase, to produce
smaller bubbles (increasing interfacial area, ai). Obviously there is a practical limit, because an
unstable foam will eventually develop as bubble size is decreased.
Film resistance effects at catalyst surface
When the catalyst is functioning well and the catalytic rate fast, the external mass transfer may be
the rate limiting step. As soon as the reactants reach the external catalyst surface, they react. This
causes the film around the catalyst particle to limit transport of fresh reactant to the surface and, in turn,
to control the overall reaction rate.
2.6.2. Catalytic reaction controls
If the reaction at the catalyst surface is the slowest step in the catalytic process, then one of the
following equations may apply for the reaction rate.

Energies 2009, 2
987
2.6.3. Pore diffusion limitations
The effectiveness factor discussed earlier is the ratio of the diffusion affected rate to the
non-diffusion rate or effectiveness factor, η = r'/r. Thus to account for pore diffusion limitations, the
effectiveness factor is included in the rate equation as a multiplier of the catalytic rate constant. If we
begin to include other transport effects, the effectiveness factor will still be associated with the
catalytic rate constant. Referring back to the case where film resistance effects were present at the
catalyst surface we would use, the effectiveness factor as follows:
Energies 2009, 2
988
3. Approach for Coal Liquefaction Reactor Design
Fulton [10] has pointed out that reactor design for a heterogeneous catalyst involves two major
phases. First, the researcher collects experimental reaction-rate data that are free of heat- and mass-
transfer effects (i.e., intrinsic kinetic data). Second, the design engineer combines the intrinsic rate
with the specific-heat and mass-transfer effects appropriate to the plant-sized reactor to be designed.
In the second phase, the design of a commercial liquefaction reactor, the design engineer must take
into account the variety of heat-transfer, mass-transfer and reaction phenomena that occur.
In the first phase, the generation of intrinsic reaction-rate data, the researcher must:
1. Build and operate the reactor to minimize axial and radial transport (intrareactor) effects; e.g.,
isothermal operation is highly desirable. We should define time ―zero‖ (no long heat-up) in batch
reactor test by using a charging bomb, to inject the reactants into the reactor after heat-up.
2. Operate the reactor at a mixing rate large enough to eliminate heat- and mass-transfer gradients
between the catalyst particle and the bulk fluid (particle-fluid or interphase).
3. Use catalyst particles small enough to eliminate the influence of intraparticle heat and
mass gradients.
With these precautions taken, the observed reaction rate will most likely be the intrinsic rate–i.e.,
the true catalytic reaction rate. As a result, the researcher needs methods for determining whether
transport effects are influencing the laboratory data. The ―limiting criteria‖ allow the researcher to
calculate or experimentally determine whether these transport effects are important. They, in turn,
guide the researcher to reactor operating conditions that will provide data free from transport effects.
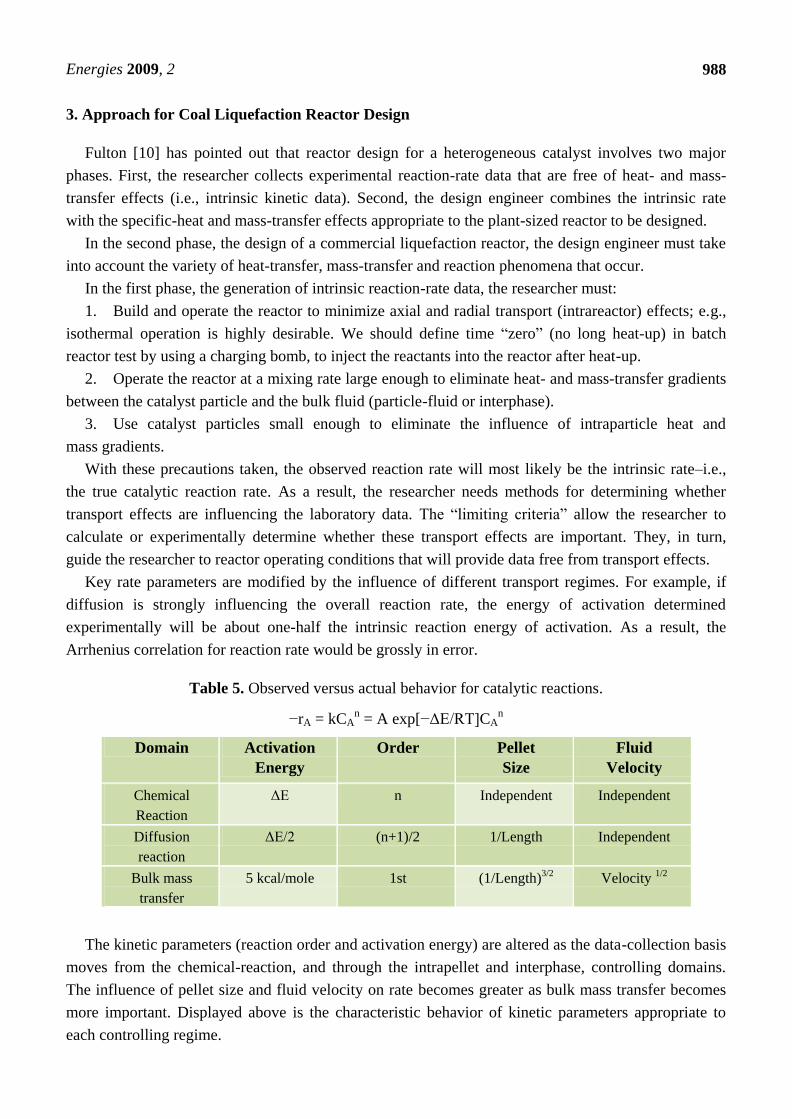
Key rate parameters are modified by the influence of different transport regimes. For example, if
diffusion is strongly influencing the overall reaction rate, the energy of activation determined
experimentally will be about one-half the intrinsic reaction energy of activation. As a result, the
Arrhenius correlation for reaction rate would be grossly in error.
Table 5. Observed versus actual behavior for catalytic reactions.
−rA = kCAn = A exp[−ΔE/RT]CA
n
Domain Activation
Energy
Order Pellet
Size
Fluid
Velocity
Chemical
Reaction
ΔE n Independent Independent
Diffusion
reaction
ΔE/2 (n+1)/2 1/Length Independent
Bulk mass
transfer
5 kcal/mole 1st (1/Length)3/2 Velocity 1/2
The kinetic parameters (reaction order and activation energy) are altered as the data-collection basis
moves from the chemical-reaction, and through the intrapellet and interphase, controlling domains.
The influence of pellet size and fluid velocity on rate becomes greater as bulk mass transfer becomes
more important. Displayed above is the characteristic behavior of kinetic parameters appropriate to
each controlling regime.
Energies 2009, 2
989
3.1. Catalyst Deactivation
In general, catalyst deactivation occurs by three mechanisms, (1) sintering of the supported metals
on the surface, (2) poisoning by compounds which strongly and irreversibly adsorb on to the active
sites and (3) fouling, where coke forms on the surface of the catalyst which limits access to the active
metals and also reduces the diameter of the pores, eventually leading to pore mouth plugging.
Coking, sintering and ash deposition all contribute to catalyst deactivation in coal liquefaction, the
degree depending upon the coal type and processing conditions. Used catalyst characterizations are
described below for work in pilot plant studies at Amoco [9]. Studies on spent catalysts from the
Wilsonville pilot plant [11] give insight on catalyst deactivation. It should be noted that the catalyst
was in the second of two stages and not directly exposed to the initial coal liquefaction environment, in
the first stage dissolver.
The catalyst used in all three runs was Shell 324 M with 12.4 wt % Mo, 2.8 wt % Ni and 2.7 wt % P
on an alumina support. Catalyst samples were withdrawn periodically throughout each run with only
minor (5%) catalyst additions to the hydrotreater. All samples were Soxhlet extracted with
tetrahydrofuran and dried under vacuum at 100 °C prior to characterization and activity testing. A
portion of each extracted sample was regenerated by slowly heating to 500 °C in a muffle furnace in
air. Regeneration removed the carbonaceous deposits but did not affect the contaminant metals.
Studies of both aged and regenerated catalysts enable separation of the effects of both carbonaceous
deposits and contaminant metals. The types of processing options practiced at Wilsonville include:
Run 242 ITSL integrated two stage liquefaction (interstage deashing)
Run 246 DITSL doubly integrated two stage liquefaction (two recycle streams)
Run 247 RITSL reconfigured integrated two stage liquefaction (post 2nd stage deashing)
Characterization of the catalysts included studies of the buildup of carbonaceous deposits and
contaminant metals as well as changes in physical properties. Quantitative carbon analyses show that
the carbon buildup is very rapid in samples from all three runs. Catalysts from Wilsonville run 246
attain a carbon content of 7.3 wt % during DITSL processing which then increases to 9.0 wt % during
ITSL processing. Catalysts from Wilsonville run 242 (ITSL processing) attain a carbon content of
9.3 wt % after about 133 lb resid/lb catalyst which then remains constant throughout the remainder of
the run. Samples from Wilsonville run 247 with RITSL processing attain the highest carbon content of
10.8 wt %, which decreases twice during the run to values of ~10 wt % after 100 lb resid/lb catalyst
and to 8.9 wt % after 300 lb resid/lb catalyst. These two decreases in carbon are correlated with
temperature increases in the reactor from 680 to 700 °F and from 700 to 710 °F, respectively. The
carbon contents in catalyst samples from these three runs are correlated with the quantity of heavy
resid and unconverted coal in the hydrotreater feed. DITSL processing has the lightest feed whereas
RITSL processing has the heaviest feed because deashing, (which normally removes some
unconverted coal and heavy resid) was performed after the 2nd stage catalytic hydrotreater.
Many contaminant metals are deposited on the catalyst during coal liquefaction processing.
However, iron and titanium are the most abundant. The lowest Ti content was observed on the run 246
catalysts which processed subbituminous coal. This result is in agreement with previous studies on
catalysts from single stage direct coal liquefaction processes which showed that Wyodak coal resulted
in lower Ti buildup than Illinois No. 6 coal. Since the Wyodak coal and Illinois No. 6 coal have similar

Energies 2009, 2
990
Ti contents, the difference must be due to the presence of Ti phases in the subbituminous coal that are
less reactive with the catalyst than those of the bituminous coal.
3.2. Catalyst Design for Coal Liquefaction
The design of a coal liquefaction catalyst is an extremely challenging problem. Due to the large heat
release associated with coal liquefaction, the reactor contents should be mixed sufficiently so that
temperature gradients are maintained at some acceptable level. This usually means, we use a
commercial reactor (typified by the ebullated H-Coal type) with a recycle pump to circulate the exit
steam back to the reactor inlet.
This sets the physical constraint on the catalyst, its geometry, density, and abrasion resistance. The
catalyst particles are suspended in the upwardly flowing coal liquid. The particles have two key forces
acting on them, the buoyant force of the coal liquid they displace and the frictional drag from the
flowing liquid. Typically, extrudates about 1/8‖ in diameter are used in the H-Coal reactor. In contrast,
the H-Oil reactor (for petroleum resid upgrading) can use the smaller 1/16‖ particles with little trouble
since the liquid is less dense and provides less buoyant force for a given volumetric displacement. The
minimum fluidization velocity [12] can be estimated as:
The second aspect is activity of the catalyst. This implies a highly porous support which provide
plenty of active surface. We select the particular combination of catalytic metals based on which of the
reactions we need to promote.
Levy and Cusumano [13] have noted, ―Before a material is tested for catalytic coal liquefaction, its
chances of survival in the liquefaction environment should be examined. The presence of H2S poses
the most severe problem. A large number of compounds that may ordinarily be considered promising
candidates sulfide in this environment. It is therefore fruitless to spend considerable effort in the
testing of these materials. Compounds that are expected to resist sulfidation include a number of
oxides, nitrides, borides and silicides.‖
Finally we must consider catalyst stability or how well it survives the coal liquefaction environment.
Pore structure, specifically a bimodal pore size distribution of macro (>1,000 Å diam) and meso
(20 Å < d < 600 Å) pore is the key to acceptable activity maintenance. Coking of the catalyst causes a
rapid initial decline in the activity. Then a more gradual deactivation occurs due to sintering and

Energies 2009, 2
991
additional coking. The inclusion of macropore volume is accomplished in the catalyst forming step
such as extrusion. The drawback of the macropores is that the catalyst is ―softer‖ and can sometimes
grind up when it is in the reactor being ebullated. Thus, there is a practical upper limit (25% of total)
of macropore volume that one aims to stay under.
In summary, design of a coal liquefaction catalyst represents a balance of properties. The type of
reactor, coal type, reaction severity, and desired product quality will all enter into the design of the
catalyst. As a base point, the properties of the Amocat™ family of catalysts is given below for use in
catalytic hydroliquefaction of coal. They have enjoyed considerable success in Wilsonville, AL and
the H-Coal pilot plant at Catlettsburg, KY.
Table 6. Catalysts used in pilot plant studies.
Catalyst Name Amocat™ 1A Amocat™ 1B Amocat™ 1C
Composition, wt %
MoO3 16 ± 0.9 16 ± 0.9 16 ± 0.9
CoO 3 ± 0.4
NiO
3 ± 0.4
CaO ≤0.1 ≤0.1 ≤0.1
SO4 ≤0.5 ≤0.5 ≤0.5
Al2O3 balance balance balance
Surface Properties
BET Surface Area, M2/g 170 min ────────────────>
Pore Volume, cc/gm
(<1200 Å diam) 0.65 min ────────────────>
Total pore volume, cc/gm 70.82 ────────────────>
Pore size distribution bimodal ────────────────>
Total pore volume in
macropores (>1200 Å
diam), %
18 ± 5 ────────────────>
Pore Volume in micropores
<40 Å diam) <2 ────────────────>
Physical Properties
Shape extrudate ────────────────>
Size, in. 1/16–1/10 ────────────────>
Bulk density, compacted,
lb/ft2 37 ± 3 ────────────────>
Fines content, 16 mesh,
wt % <1 ────────────────>
Suggested Use
Liquefaction X X X
Desulfurization X
Denitrogenation
X
Aromatic saturation X
X

Energies 2009, 2
992
Liquefaction catalyst performance should almost always be measured in a continuous flow reactor.
Catalyst life is a critical factor in coal liquefaction and fresh catalyst activity is only important to
establish where the catalyst starts out. Coke deposits rapidly on the catalyst the first few days that it is
on-stream and then a more gradual increase occurs. Catalyst is usually evaluated for at least 10 days
and preferably around 30. A Continuous Stirred Tank Reactor (CSTR) high pressure autoclave is
preferred and these are described by Autoclave Engineers [14].
4. Commercial/Pilot Plant Reactor Design and Scale-Up
The design of larger liquefaction reactors provides a significant challenge since heat release is
substantial and the flow regime deviates from the ideals of plug flow and perfect mixing. We will
examine the commercial reactors in increasing order of complexity.
4.1. Exxon Donor Solvent (EDS) Reactor
The liquefaction reactor used in the EDS process is a network of tubes with no catalyst inside. Coal
slurry and hydrogen gas are introduced in the inlet with a nominal residence time of 30–45 minutes.
The key issue is establishing the coal slurry residence time since gas bubbles occupy some fraction of
the reactor volume (gas holdup, εg, + liquid holdup, εl = 1). Although hydrogen is consumed along the
length of the reactor, light gases are also formed, so it is not easy to predict the gas and liquid
holdup volumes.
The ―axial dispersion‖ model, a one-parameter model, is a good approximation for the EDS reactor.
Its flow regime has a small deviation from plug flow conditions. The reactor coils are immersed in a
heat transfer fluid so that the temperature rise along the length of the reactor can be controlled by
transferring heat out. The material and energy balances are the following:

Energies 2009, 2
993
The above equation is used for every reaction of interest and the set of equations are solved
simultaneously with a numerical differential equation solver. The estimation of the Dispersion
coefficient can be accomplished by the following equation by Shah [15].
Liquid and gas holdup are also estimated from formulas in Shah's book.

Energies 2009, 2
994
Liquid Holdup, εg
This sets the superficial velocity (ul = Q/εlA)and, in turn the residence time (τ = L/ul) of the liquid
in the reactor.
4.2. H-Coal Reactor
The H-Coal reactor is rather unique and called an ebullated bed catalytic reactor. A recycle pump,
located either internally or externally, circulates the reactor fluids down through a central downcomer
and then upward through a distributor plate and into the ebullated catalyst bed. The reactor is usually
insulated well and operated adiabatically.
Figure 2. H-Coal reactor.

Energies 2009, 2
995
Frequently the reactor mixing pattern is defined as backmixed, but this is not strictly true. A better
description of the flow pattern is plug flow with recycle or dispersed plug flow with recycle. For plug
flow with recycle, we use a model as shown below in Figure 3.
Figure 3. Recycle reactor.
Then one can develop the following two equations, one for a first order reaction and the other for
second order kinetics in a plug flow reactor with recycle. The equations for the axial dispersion model
are modified appropriately to account for recycle conditions.
The schematic above in Figure 3, shows the key elements of recycling a portion of the exit stream
with the feed stream and how that affects the feed concentration(s). The recycle increases the
superficial velocity, u, and changes the feed concentration due to dilution with the product stream.
Although the H-Coal reactor is loaded with catalyst, not all of the reactions are catalyzed; some are
thermal reactions, like thermal cracking, which depend on liquid holdup and not on how much catalyst
is present. Thus the material balance equations need to be divided into two categories, one set for the
non-catalytic thermal reactions and another set for the catalytic reactions. A convenient parameter to
use is the thermal/catalytic ratio, T/C, which is the ratio of liquid holdup to catalyst volume. In a
commercial ebullated bed, this ratio is close to 1.0 under ebullation conditions. Consequently the
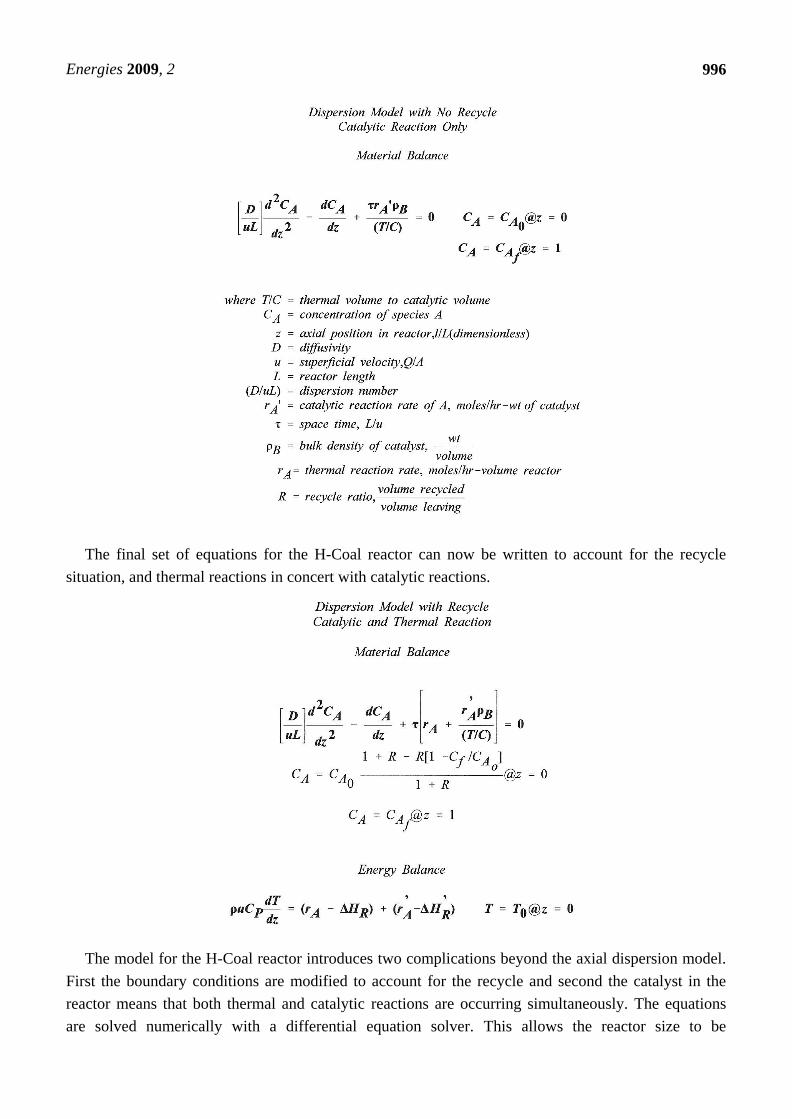
material balance equations for the catalytic reactions with no recycle is:
Energies 2009, 2
996
The final set of equations for the H-Coal reactor can now be written to account for the recycle
situation, and thermal reactions in concert with catalytic reactions.
The model for the H-Coal reactor introduces two complications beyond the axial dispersion model.
First the boundary conditions are modified to account for the recycle and second the catalyst in the
reactor means that both thermal and catalytic reactions are occurring simultaneously. The equations
are solved numerically with a differential equation solver. This allows the reactor size to be

Energies 2009, 2
997
determined by integrating along dimensionless distance z until concentration of A, CA, equals the
desired final concentration, CAf.
Table 7. Liquefaction reactor guide.
Reactor Type Positive Negative Best Application
Research and Development Scale
Micro-batch
- Inexpensive - Moderate mixing - Coal screening
- Small feed charge - Difficult product work-
up
- Catalyst
screening
Stirred Batch autoclave
- Good mixing/contacting - More expensive
- Product work-up no problem - Hard to set time zero
Mahoney-Robinson continuous stirred
autoclave (spinning basket)
- Excellent mixing, bubble
dispersion
- Smaller catalyst charge - Catalyst aging
- Expensive - Coal comparison
- Heavy feeds may not
work well
- Kinetic studies
Robinson-Mahoney continuous stirred
autoclave (stationary basket)
- Handles heavy viscous feeds - Expensive - Kinetic studies
- Holds most catalyst - Catalyst life
studies
Trickle Bed - Simple to operate - Isothermal operation
difficult
- Catalyst aging
- Simple to design - Flow maldistribution
common
- Coal liquid
upgrading
Demonstration/Commercial Scale
H-Coal - Extensive operating history. - Tricky to operate - Commercial
operations
- Handles exothermic reactions
well
Exxon EDS - Simpler operation - Heat release hard to
control
- Commercial
operation
- Hydrogen starvation
possible
Two-stage - Better control of reactions - More complex to
operate
- Commercial
operations
- Improved yield of distillates
- Builds on H-Coal technology
4.3. Pilot Plant Processes
The following section contains ―short-form‖ process descriptions for some of the leading
technologies in direct coal liquefaction. There are no direct coal liquefaction processes currently in
commercial use. China has one which has been fully designed and is under construction. Not only are
the production costs expensive, the disposal of waste streams is also a big issue. For example, the
residue cannot be burned in a conventional boiler due to its high ash content (~23 %) and sulfur level.
Options have included gasification to generate hydrogen but current thinking leans toward fluid bed
combustion for process heat. Natural gas and process-derived fuel gas appear to be the better raw
materials for generating hydrogen for use in the process.

Energies 2009, 2
998
The four processes described in this section include:
1. H-Coal Process
2. Exxon Donor Solvent (EDS)
3. Solvent Refined Coal (SRC I & II)
4. Two Stage Liquefaction
4.3.1. Process: H-Coal
Description: Direct catalytic hydroliquefaction process developed by HRI, Inc using a novel
ebullated bed reactor [16]. Typical reactor conditions are 3,000 psi, 850 °F, and 75 lb coal/hr-ft3 for
fuel oil mode or 30 lb coal/hr-ft3 for syncrude mode.
- Background:
Patented process (US 3,321,393) developed by HRI, Inc.
Extension of H-Oil process for residuum hydrotreatment.
Bench scale and process development unit (PDU) operated at the Trenton, NJ laboratories.
H-Coal Pilot plant (200 TPD syncrude or 600 TPD fuel oil mode) built and operated at
Catlettsburg, KY.
- Operator: Ashland Synthetic Fuels, Inc.
- Cost: $320 MM
- Participants: US Department of Energy(DOE), Kentucky Department of Energy, Ashland
Oil, Electric Power Research Institute (EPRI), Mobil Oil, Standard Oil (Ind), Conoco Coal
Development, Ruhrkohle AG
- Process Schematic:
Figure 4. H-Coal process.
Reactor Conditions:
Total Pressure 3,000 psi Slurry Concentration 38%
Temperature 845 °F Space Velocity 32 lb coal/hr-ft3

Energies 2009, 2
999
Table 8. Process Yields for H-Coal Process.
Process Yields (lb/lb mf coal) Illinois
Bituminous
Wyoming
Subbituminous
Product Syncrude Fuel Oil Syncrude
H2 (5.3) (3.4) (6.2)
H2O, CO, CO2 7.1 6.5 20.0
H2S, NH3 3.6 2.2 1.6
C1-C3 11.2 6.8 12.3
Naphtha (C4-204 °C) 18.7 13.4 25.8
Fuel Oil (204-524 °C) 29.1 20.8 18.6
Bottoms (524 °C+) 35.6 53.7 27.9
TOTAL 100 100 100
Table 9. Liquefaction catalysts for H-Coal process.
Name Amocat 1ATM
Amocat 1BTM
Cyanamid HDS 1442A
Composition 3% CoO/10% MoO3 10% MoO3 3.3% CoO/14.7% MoO3
Surface Area (m2/g) 154 167 323
Average Pore Diameter (Å) 123 122 58
Pore Distribution bimodal bimodal bimodal
Size, inches diam 1/16 1/16 1/16
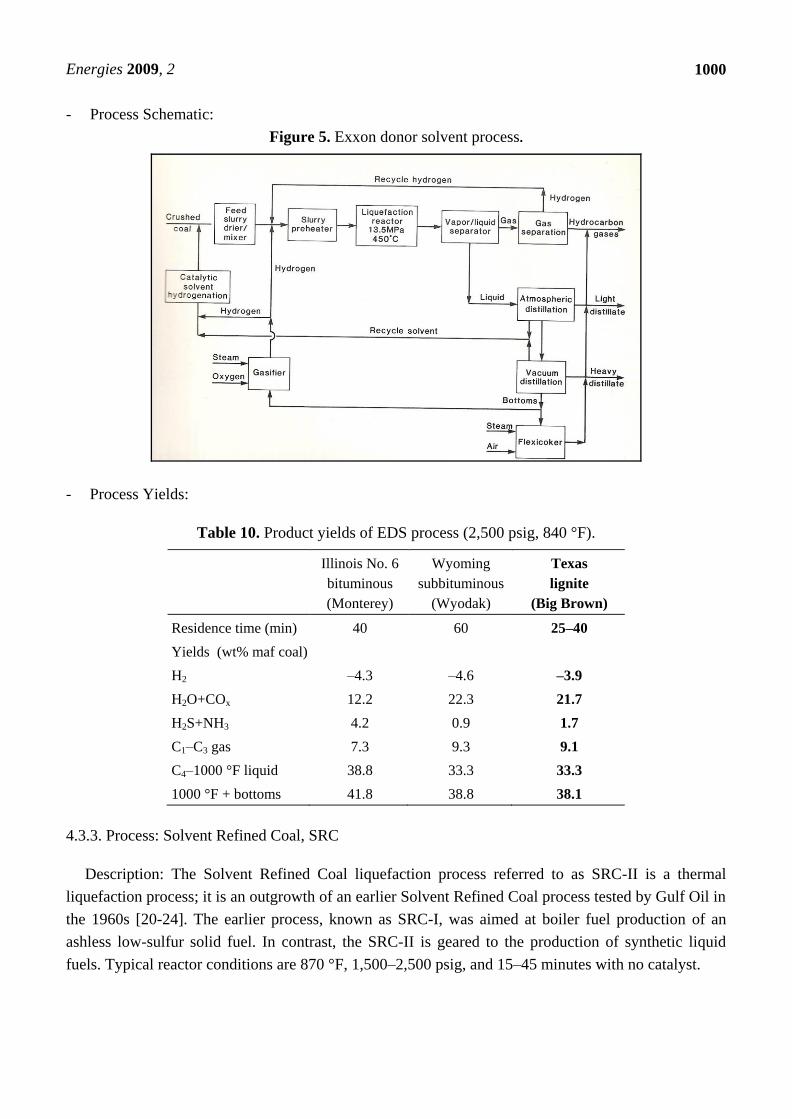
4.3.2. Process: Exxon Donor Solvent (EDS)
Description: The Exxon donor solvent (EDS) process was developed by Exxon Research and
Engineering (ER&E) and is a thermal liquefaction process where the donor solvent is catalytically
hydrotreated in a fixed bed reactor external to the liquefaction zone [17-19]. Typical liquefaction
reactor conditions are 840 °F and 2,000–3,000 psia with 45 minutes residence time.
- Background:
Process developed by Exxon Research and Engineering
Two pilot plants (75 lb/day) and a third (1 ton/day) at Baytown Research
Development Division in Houston, TX set the design scale-up basis
Larger EDS process (250 ton/day) built and operated at Baytown, TX
- Operator: Exxon
- Cost: $341 MM
- Participants: US Department of Energy (DOE), Exxon, Electric Power Research Institute
(EPRI), Japan Coal Liquefaction Development Company, Phillips Coal Company,
Anaconda Minerals Company, Ruhrkohle AG, ENI (Italian National Oil Company)
Energies 2009, 2
1000
- Process Schematic:
Figure 5. Exxon donor solvent process.
- Process Yields:
Table 10. Product yields of EDS process (2,500 psig, 840 °F).
Illinois No. 6
bituminous
(Monterey)
Wyoming
subbituminous
(Wyodak)
Texas
lignite
(Big Brown)
Residence time (min) 40 60 25–40
Yields (wt% maf coal)
H2 –4.3 –4.6 –3.9
H2O+COx 12.2 22.3 21.7
H2S+NH3 4.2 0.9 1.7
C1–C3 gas 7.3 9.3 9.1
C4–1000 °F liquid 38.8 33.3 33.3
1000 °F + bottoms 41.8 38.8 38.1
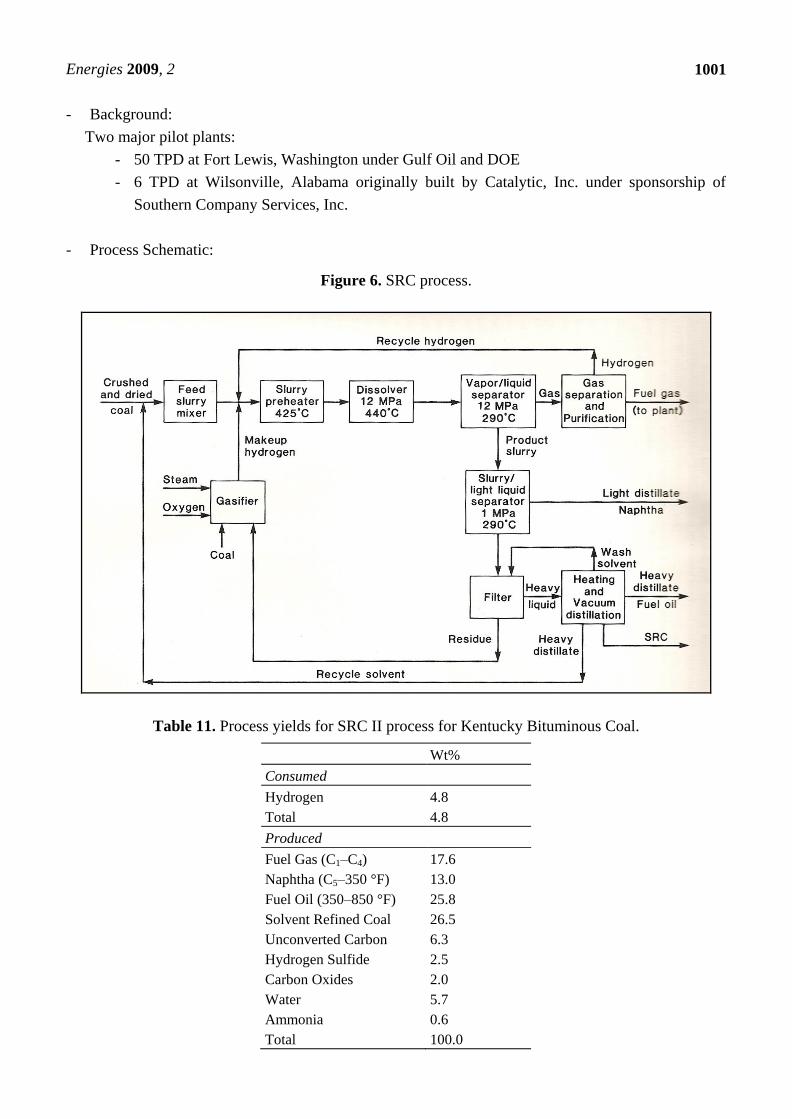
4.3.3. Process: Solvent Refined Coal, SRC
Description: The Solvent Refined Coal liquefaction process referred to as SRC-II is a thermal
liquefaction process; it is an outgrowth of an earlier Solvent Refined Coal process tested by Gulf Oil in
the 1960s [20-24]. The earlier process, known as SRC-I, was aimed at boiler fuel production of an
ashless low-sulfur solid fuel. In contrast, the SRC-II is geared to the production of synthetic liquid
fuels. Typical reactor conditions are 870 °F, 1,500–2,500 psig, and 15–45 minutes with no catalyst.
Energies 2009, 2
1001
- Background:
Two major pilot plants:
- 50 TPD at Fort Lewis, Washington under Gulf Oil and DOE
- 6 TPD at Wilsonville, Alabama originally built by Catalytic, Inc. under sponsorship of
Southern Company Services, Inc.
- Process Schematic:
Figure 6. SRC process.
Table 11. Process yields for SRC II process for Kentucky Bituminous Coal.
Wt%
Consumed
Hydrogen 4.8
Total 4.8
Produced
Fuel Gas (C1–C4) 17.6
Naphtha (C5–350 °F) 13.0
Fuel Oil (350–850 °F) 25.8
Solvent Refined Coal 26.5
Unconverted Carbon 6.3
Hydrogen Sulfide 2.5
Carbon Oxides 2.0
Water 5.7
Ammonia 0.6
Total 100.0

Energies 2009, 2
1002
4.3.4. Process: Two Stage Coal Liquefaction
Description: Compared to SRC-I & SRC II, two-stage liquefaction tightly couples the dissolver and
catalytic hydrotreater so that the time between the two stages is minimized. Ash removal occurs after
the second catalytic stage rather than interstage deashing. This accomplishes higher liquid yields with
less hydrogen consumption with two stages operating at different temperature. Second stage always
has catalyst in it but the first stage can be either catalytic or thermal. Typical reactor conditions are
2,500 psig, 2/1 Slurry Oil/Coal, 45–70 lbs/hr-ft3 cat (each stage), 650–775 °F first stage and
810–825 °F second stage [25].
- Background:
Original concept introduced by Chevron Research in late 70s (US)
Pilot plant tests by HRI, Inc. in mid 80’s with exceptional success noted by high distillate
and low residuum yields.
Wilsonville pilot plant operating as SRC was modified to tightly couple the 1st stage
dissolver with 2nd stage H-Oil hydrotreater in 1986–1987 and called RITSL (Reconfigured
Integrated Two-Stage Liquefaction) operating mode.
Two stage process under some debate with high/low and low/high temperature staging not
showing yields too different. HRI favored a low/high staging while Amoco prefered
high/low to favor aromatic saturation in 2nd stage.
6 TPD at Wilsonville, Alabama originally built by Catalytic, Inc. under sponsorship of
Southern Company Services, Inc eventually set up as:
Sponsors Participants
US Department of Energy Catalytic, Inc.
Electric Power Research Institute Kerr-McGee Corporation
Amoco Corporation Hydrocarbon Research, Inc.
Southern Company Services, Inc.
Integration of H-Oil hydrotreater into process employed at Wilsonville so that some of
recycle slurry oil came from catalytic hydrotreater; it led to the process being called
two-stage liquefaction with the standard integrated mode (ITSL) and double integrated
mode (DITSL).
Critical Solvent Deashing (CSD) by Kerr-McGee eliminated filters and allowed recycle of
heavy residue as major component of slurry oil.

Energies 2009, 2
1003
- Process Schematic for Two Stage Liquefaction (ITSL at Wilsonville, AL):
Figure 7. Two stage liquefaction.
Table 12. Process yields for Wilsonville Pilot Plant- two stage Mode- Illinois Bituminous Coal.
ITSL DITSL
Run No. 246F 246G 246A 246B 246C 246DE
Yield* (% maf coal)
C1–C3 gas (total gas) 8(19) 9(19) 7(17) 6(14) 5(13) 9(17)
Water 12 11 12 11 12 12
C4+ distillate 51 53 51 50 49 55
Resid 3 1 –2 –1 0 –1
Hydrogen consumption –5.1 –5.4 –5.0 –4.6 –4.1 –5.4
Hydrogen efficiency
(lb C4 + dist/lb H2 consumed
10.0 9.8 10.3 11.0 12.0 10.2
Distillate selectivity
(lb C1–C3/lb C4+ dist)
0.17 0.18 0.14 0.12 0.10 0.15
Energy content of feed coal
rejected to ash concentrate.(%)
22–24 22–24 26–29 29–32 30–35 21–24

Energies 2009, 2
1004
Table 13. Catalytic two-stage liquefaction process (HRI tests). Wyodak coal yields and
process performance. Run 227-22.
Process Yields Range
(lb/lb mf coal)
Representative
Yield (lb/lb mf coal)
Yield, w % m.a.f. coal
C1-C3 5–9 8.1
C4-390 °F 17–27 25.0
390-650 °F 30–47 36.5
650-975 °F 0–11 4.2
975 °F+ Resid 0–5 1.9
Unconverted Coal 7–21 10.7
H2O, CO, CO2 17–23 20.0
H2S, NH3 1.4–1.8 1.6
Hydrogen
Consumption
6.3–8.1 8.1
C4-975 °F Liquid 54–68 65.7
Process performance
Coal Conversion 83–92 89.3
975 °F+ Conversion 74–90 87.4
Hydrogen Efficiency 8–9 8.2
Table 14. RITSL yield structures (thermal/catalytic) (Wilsonville pilot plant). Illinois
Bituminous Coal.
Run No. 247C-II 247D 247E**
Yield* (%maf coal)
C1–C3 gas (total gas) 7(12) 6(12) 5(11)
Water 10 9 11
C4+ distillate 60 62 61
Resid 5 3 3
Hydrogen consumption –6.1 –6.1 –6.3
Hydrogen efficiency
(lb C4+ dist/lb H2 consumed)
9.8 10.2 9.7
Distillate selectivity
(lb C1–C3/lb C4+ dist)
0.11 0.10 0.09
Energy content of feed coal
rejected to ash conc. (%)
22 22 22
* elementally balanced yield structures
** catalytic stage feed sensitivity studies

Energies 2009, 2
1005
5. Conclusions
Direct coal liquefaction has advanced from its early beginnings in Germany in the 1940s and can
now be viewed as a viable option in the synfuel picture when crude oil prices are in the $70–80 per
barrel range. Compared to indirect liquefaction schemes such as coal gasification/Fischer-Tropsch
synthesis, this process makes a much different product slate with naphtha being produced instead of
diesel fuel. The energy efficiency is much higher but the process is much more difficult to operate due
to the abrasive nature of the coal slurry that erodes pressure letdown valve, the need to stay in donor
solvent balance to slurry the coal feed with, and the very difficult solids separation from the liquid
product. Still, the advantages of primarily a gasoline product and higher energy efficiency give it some
very attractive aspects and it will move forward under some situations, most likely in countries like
China, which has huge coal resources.
References
1. China launches first coal-to-liquids project. China Daily, January 6, 2009.
2. Barta. Patrick South Africa has a way to get more oil; Make it from coal. WSJ 2006, CCXLVIII, 1.
3. Robinson, K.K.; Tatterson, D.F. Fischer-Tropsch oil-from-coal promising as a transport fuel. Oil
Gas J. 2007, 105, 20-31.
4. Robinson, K.K.; Tatterson, D.F. Economics on Fischer-Tropsch coal-to-liquids method updated.
Oil Gas J. 2008, 106, 22-25.
5. Lumpkin, R.E. Recent progress on the direct liquefaction of coal. Science 1988, 239, 873-877.
6. Schlesinger, M.D. Past Trends in Synthetic Fuels R&D. PETC/TR-80/4, Department of Energy:
Pittsburgh, PA, USA, 1980.
7. Fischer, F. The Conversion of Coal Into Oils; Van Nostrand Company: New York, NY, USA,
1925.
8. Given, P.H. Course Notes-Coal Origins and Characteristics; Penn State University: University
Park, PA, USA, 1986.
9. Kim, D.; Robinson, K.K.; Gutberlet, L.C.; Bertolacini, R.J. Catalyst development for coal
liquefaction. EPRI Contract 408 (1): Report AF-1235; EPRI: Palo Alto, CA, USA, 1979.
10. Fulton, J.W. Testing the catalyst. Chem. Eng. 1986, 93, 71-77.
11. Stohl, F.; Stevens, H. Catalyst deactivation in direct coal liquefaction. a comparative study of
wilsonville runs. In Proceedings of the 10th Annual EPRI Contractor’s Conference on Clear
Liquid and Solid Fuels, Palo Alto, CA, USA, 1985.
12. Kuni, D.; Levenspiel, O. Fluidization Engineering Journal; Wiley & Sons: Hoboken, NJ,
USA, 1969.
13. Levy, R.B.; Cusumano, J.A. New Materials for Coal Liquefaction. Liquid Fuels from Coal;
Academic Press: New York, NY, USA, 1977.
14. Autoclave Engineers Bulletin 1200. Autoclave Catalytic Reactor Selection Guide. 1990.
15. Shah, Y.T. Reaction Engineering in Direct Coal Liquefaction; Addison-Wesley: Boston, MA,
USA, 1981.
16. Merdinger, M.; Comolli, A. Recent Developments in the Processing of Western Coal in the
H-Coal Process. Sixth Annual EPRI Contractor’s Conference, Palo Alto, CA, USA, 1982.

Energies 2009, 2
1006
17. Epperly, W.R.; Plumlee, K.W.; Wade, D.T. Exxon donor solvent coal liquefaction process:
Development program status VI. Chem. Eng. Prog. 1981, 5, 73-79.
18. Hsia, S.J. Liquefaction of Low Rank Coals with the Exxon Donor Solvent Coal Liquefaction
Process. In Proceedings of the 11th Biennial Lignite Symposium, San Antonio, TX, USA,
June 1981.
19. Ansell, L.L.; Tauton, J.W.; Trachte, K.L. Bottoms recycle studies in the EDS process
development, In Proceedings of the 5th Electric Power Research Institute Contractor’s
Conference on Coal Liquefaction, Palo Alto, CA, USA, May, 1980.
20. Nalitham, R.V. An experimental evaluation of the residence time distribution in the wilsonville
dissolver using radioactive tracers. In Proceedings of the 10th Annual EPRI Contractors’
Conference on Coal Liquefaction, Palo Alto, CA, USA, 23–25 April, 1985.
21. Moniz, M.J. Process studies of integrated two-stage coal liquefacton at wilsonville. In
Proceedings of the 9th Annual EPRI Contractors’ Conf on Coal Liquefaction, Palo Alto, CA,
USA, 8–10 May, 1984.
22. Gir, S.; Rhodes, D.E. Recent developments in the integrated two-stage coal liquefaction program
at Kerr-McGee corporation. In Proceedings of DOE Direct Coal Liquefaction Contractors’
Review Meetings, Palo Alto, CA, USA, November, 1983.
23. Rao, A.K. Recent developments in two-stage coal liquefaction at Wilsonville. In Proceedings of
DOE Direct Coal Liquefaction Contractors’ Review Meeting, Palo Alto, CA, USA,
November 1983.
24. Moniz, M.J.; Nalitham, R.V. An assessment of the impact of delayed deashing and subbituminous
coal processing on hydrotreating catalyst performance. In Proceedings of the 10th Annual EPRI
Contractors’ Conference on Coal Liquefaction, Palo Alto, CA, USA, April, 1985.
25. Comolli, A.G.; MacArthur, J.B.; McCleary J.B. Two-stage catalytic conversion of wyodak coal.
In Proceedings of the 10th Annual EPRI Contractor’s Conference on Clean Liquid and Solid
Fuels, Palo Alto, CA, USA, October, 1985.
© 2009 by the authors; licensee Molecular Diversity Preservation International, Basel, Switzerland.
This article is an open-access article distributed under the terms and conditions of the Creative
Commons Attribution license (http://creativecommons.org/licenses/by/3.0/).