choosing color palettes for statistical graphics -...
TRANSCRIPT
Choosing Color Palettesfor Statistical Graphics
Achim Zeileis Kurt Hornik
http://statmath.wu-wien.ac.at/∼zeileis/
Overview
• Motivation
– Statistical graphics and color– Color vision and color spaces
• Palettes (in HCL space)
– Qualitative– Sequential– Diverging
• Software
Motivation: Statistical graphics
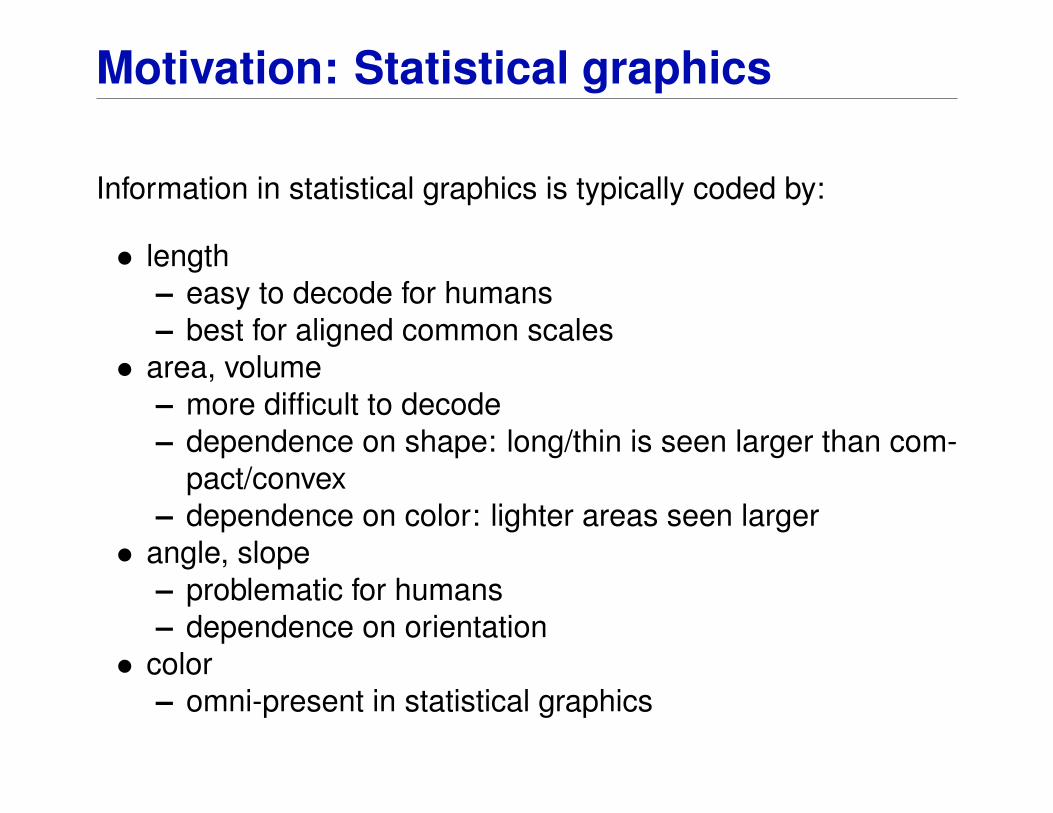
Information in statistical graphics is typically coded by:
• length– easy to decode for humans– best for aligned common scales
• area, volume– more difficult to decode– dependence on shape: long/thin is seen larger than com-
pact/convex– dependence on color: lighter areas seen larger
• angle, slope– problematic for humans– dependence on orientation
• color– omni-present in statistical graphics
Motivation: Statistical graphics
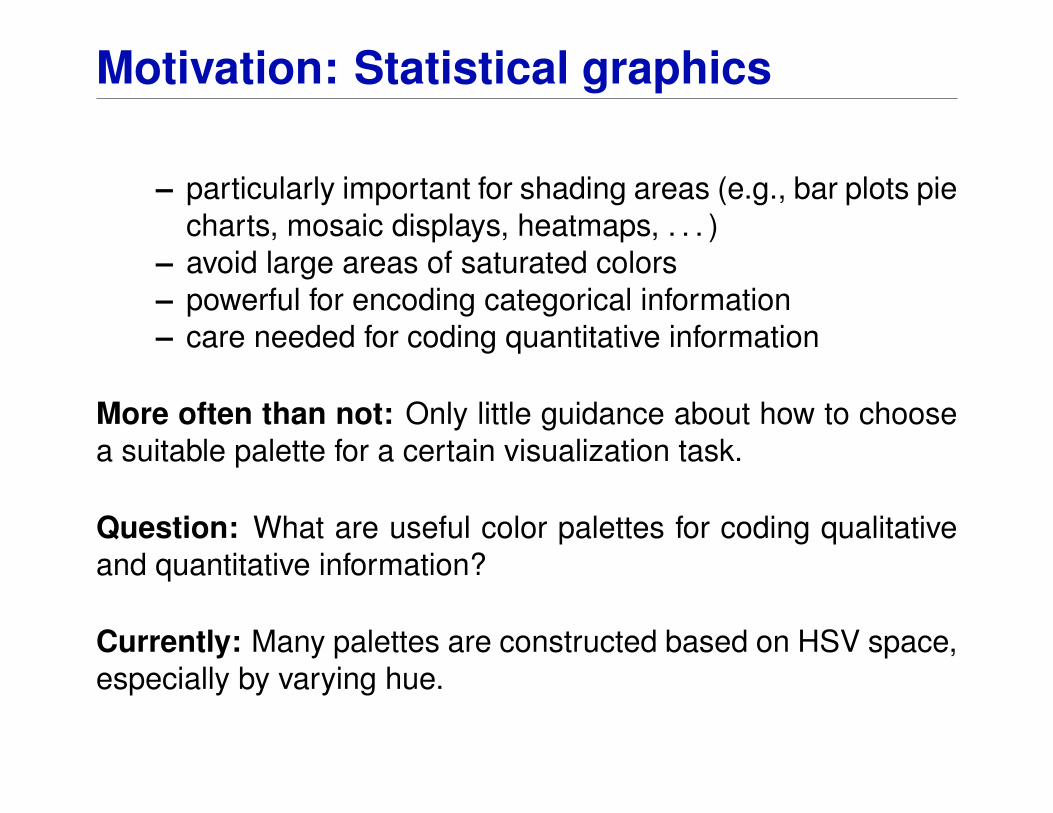
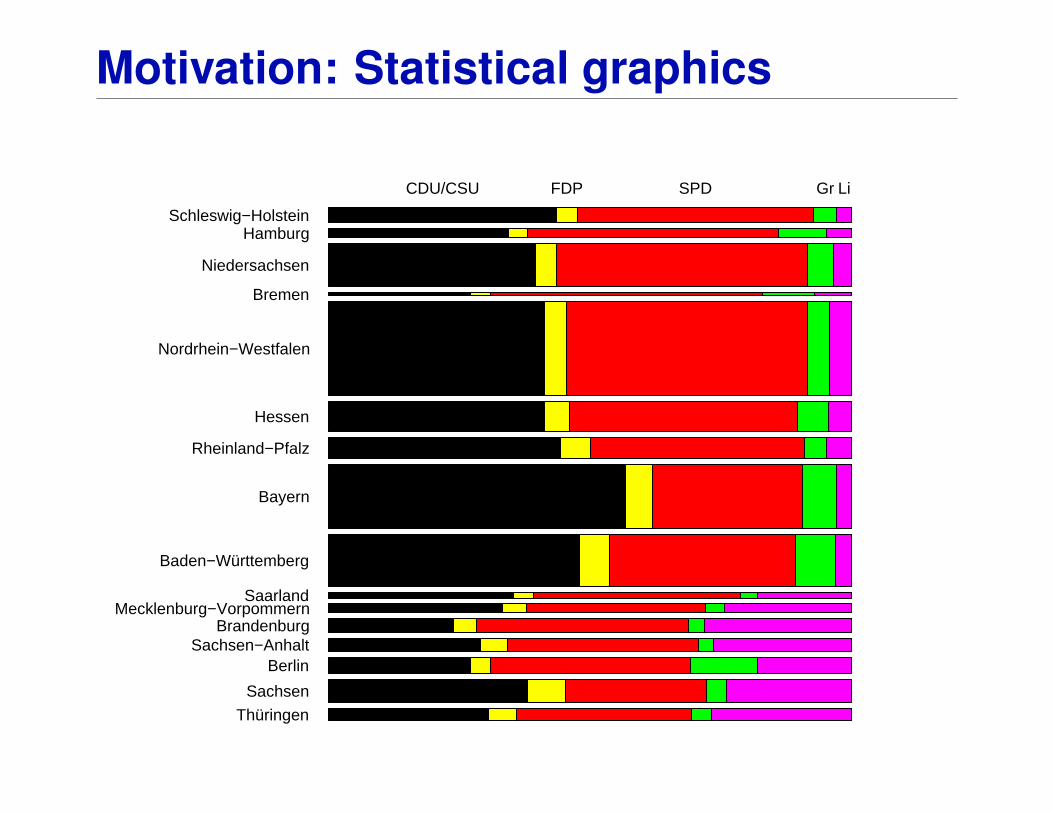
– particularly important for shading areas (e.g., bar plots piecharts, mosaic displays, heatmaps, . . . )
– avoid large areas of saturated colors– powerful for encoding categorical information– care needed for coding quantitative information
More often than not: Only little guidance about how to choosea suitable palette for a certain visualization task.
Question: What are useful color palettes for coding qualitativeand quantitative information?
Currently: Many palettes are constructed based on HSV space,especially by varying hue.
Motivation: Statistical graphics
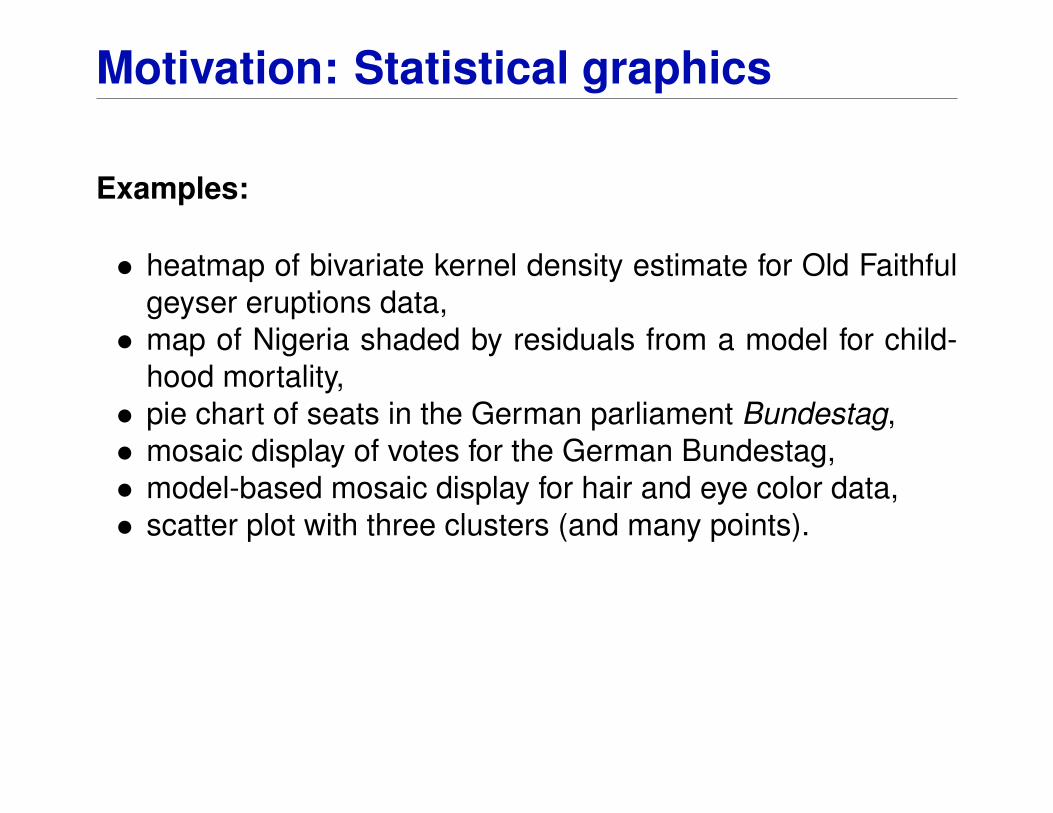
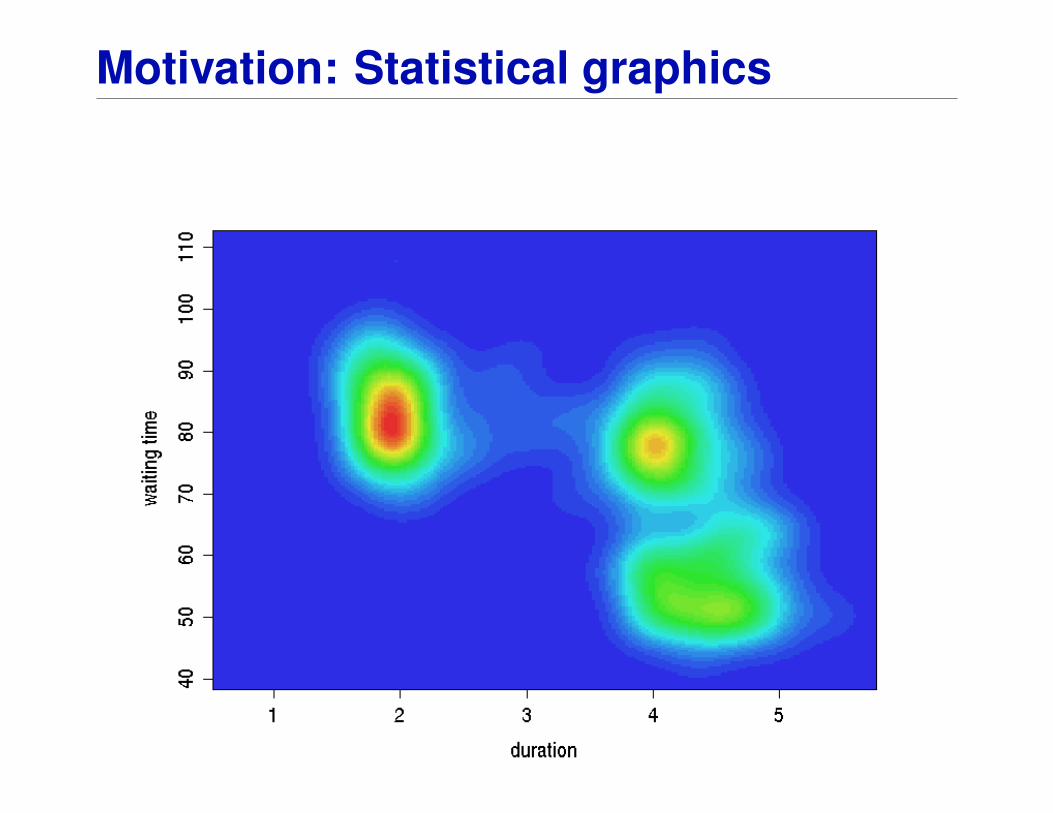
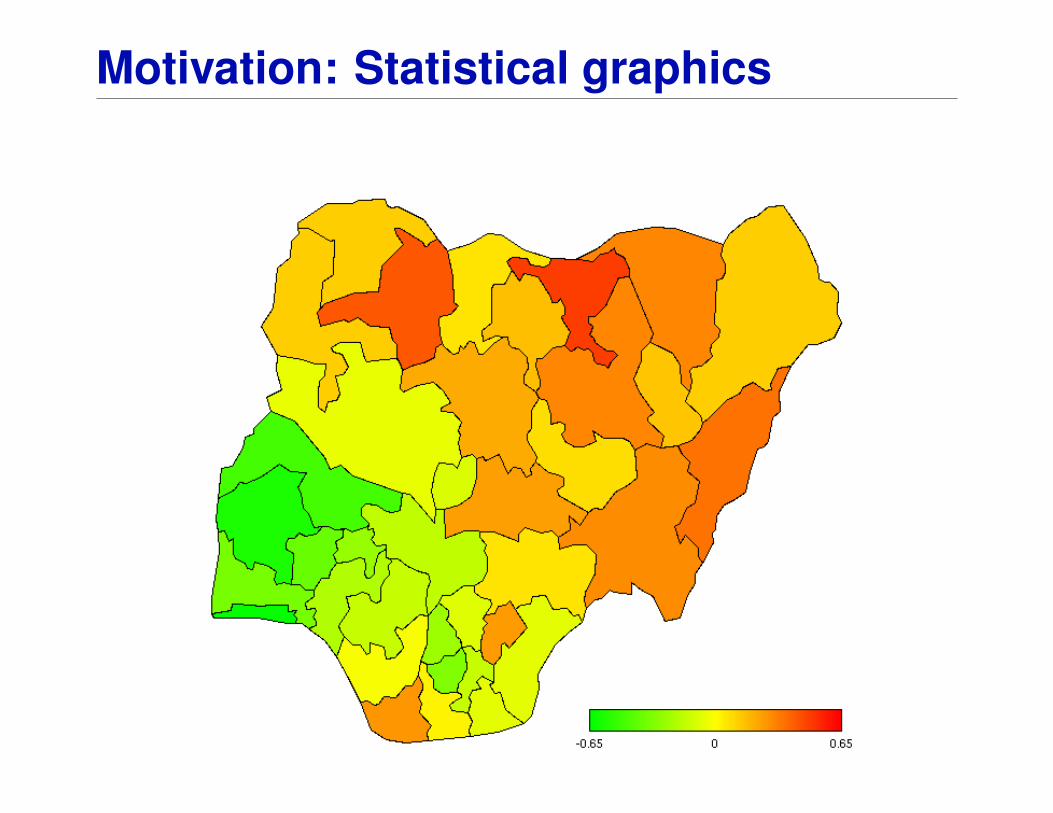
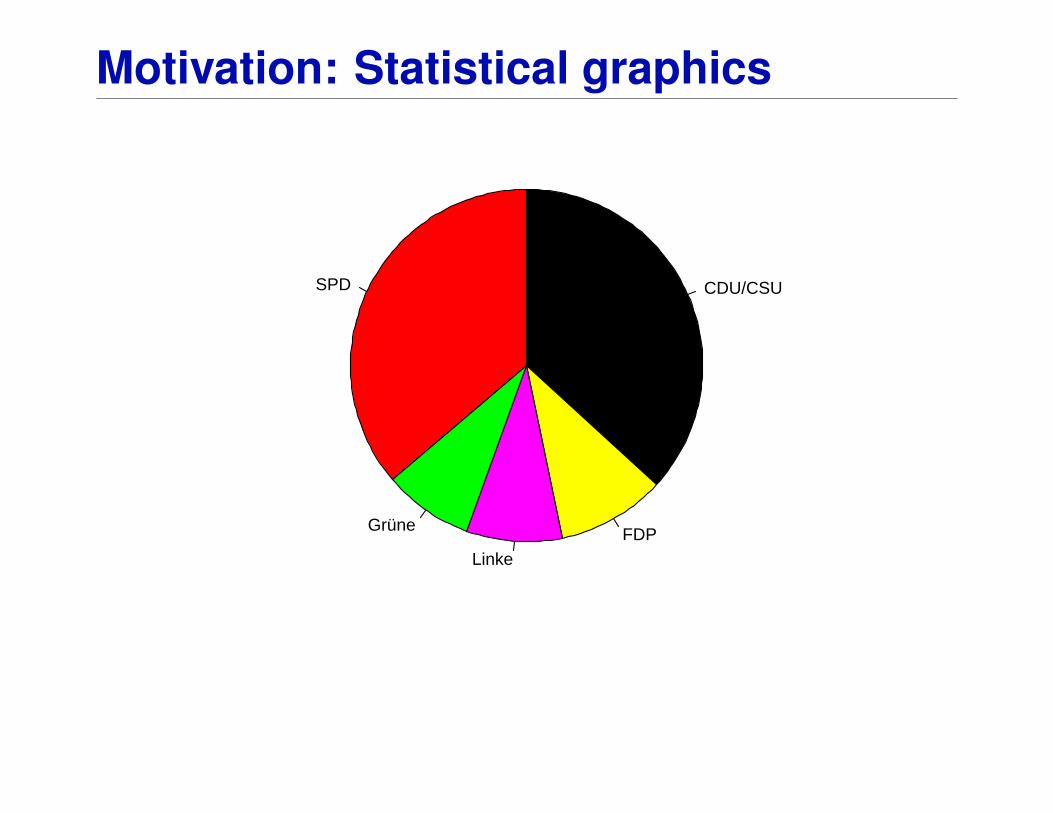
Examples:
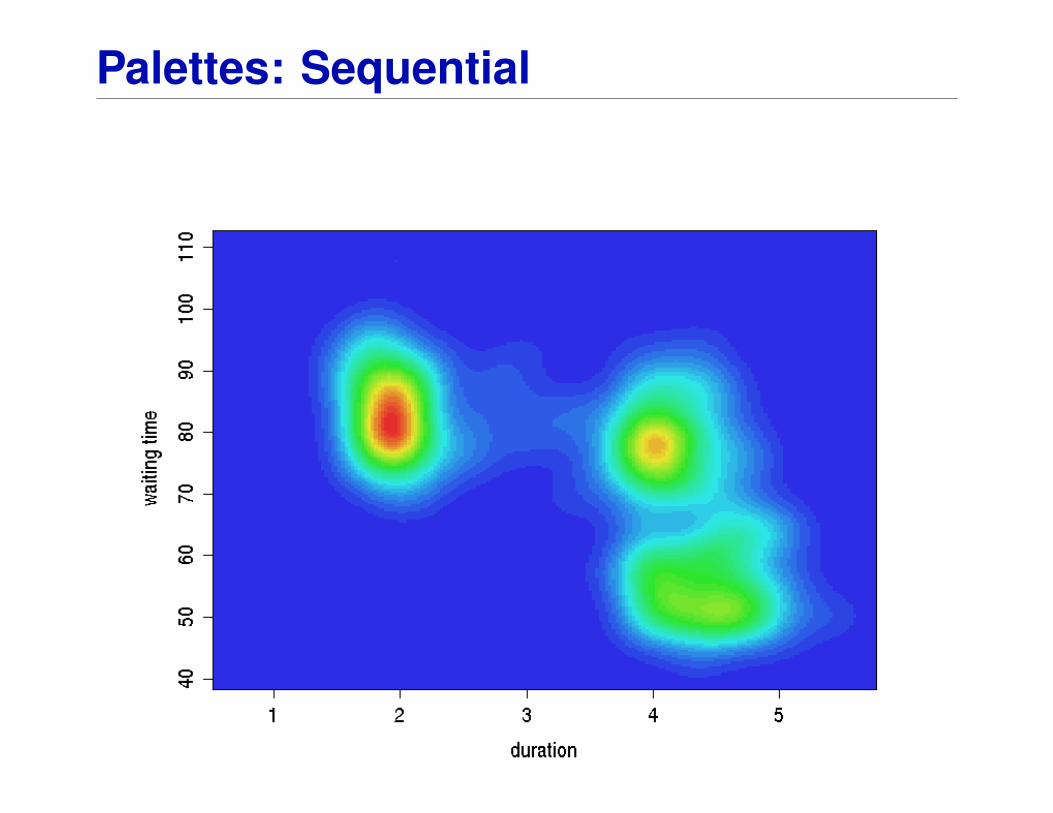
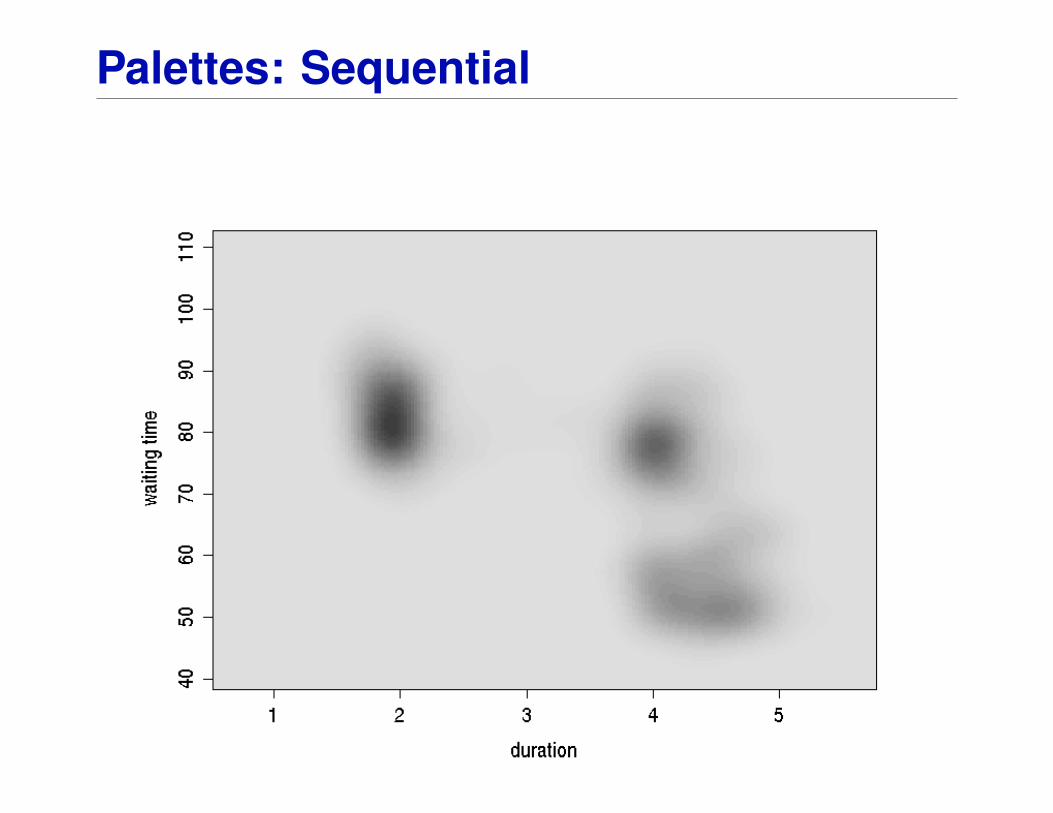
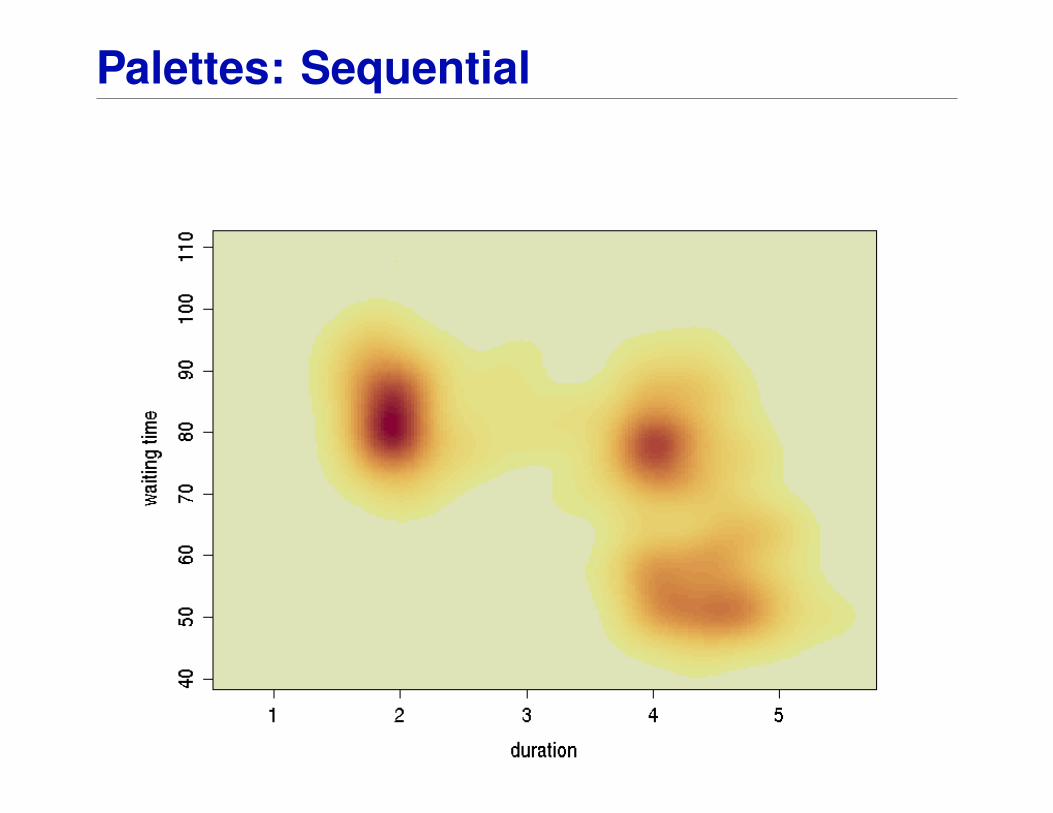
• heatmap of bivariate kernel density estimate for Old Faithfulgeyser eruptions data,
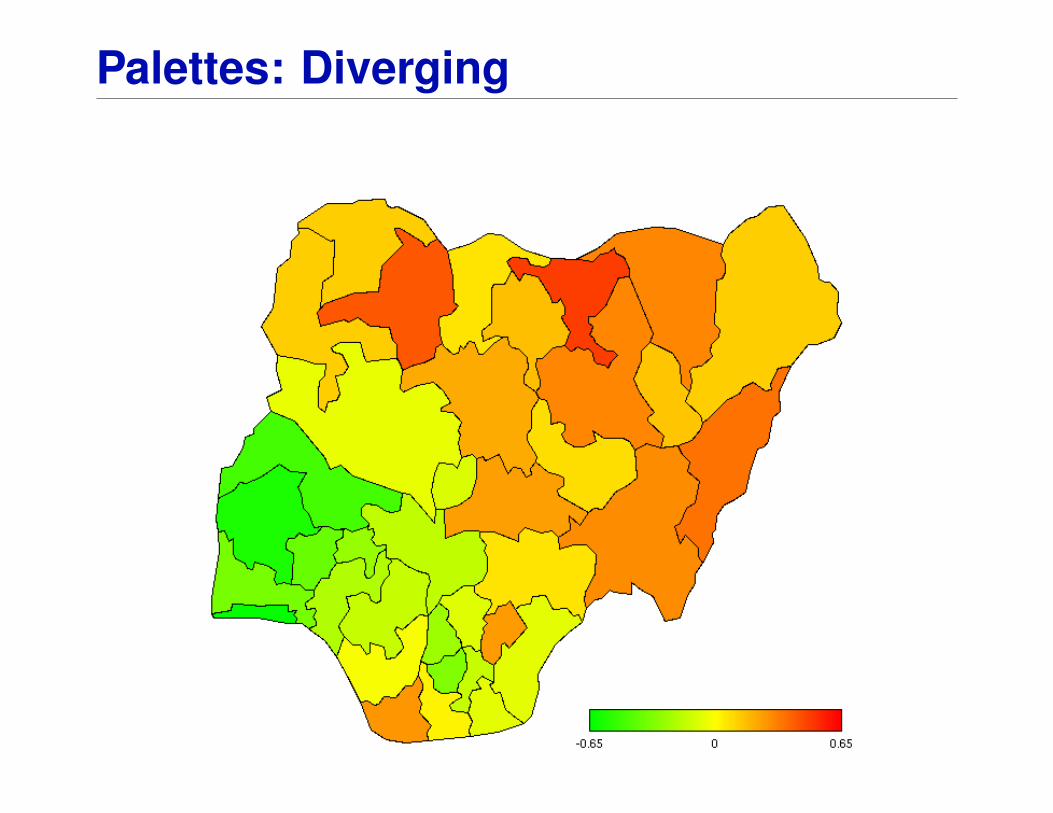
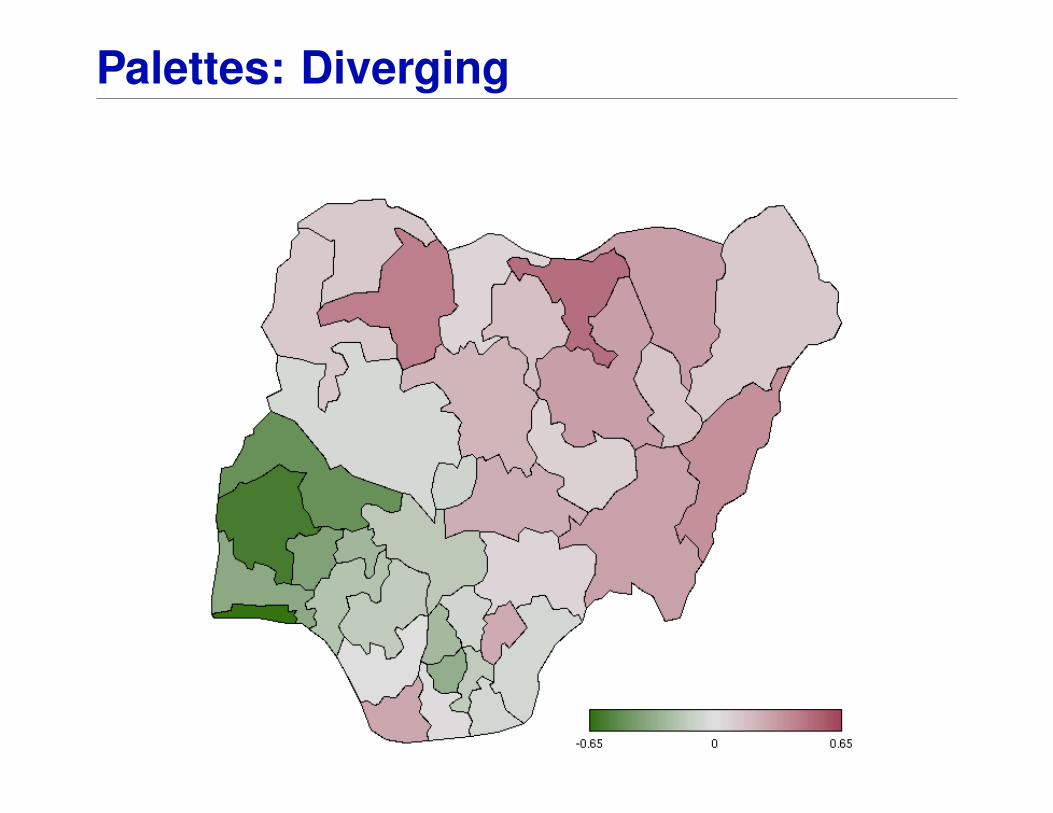
• map of Nigeria shaded by residuals from a model for child-hood mortality,
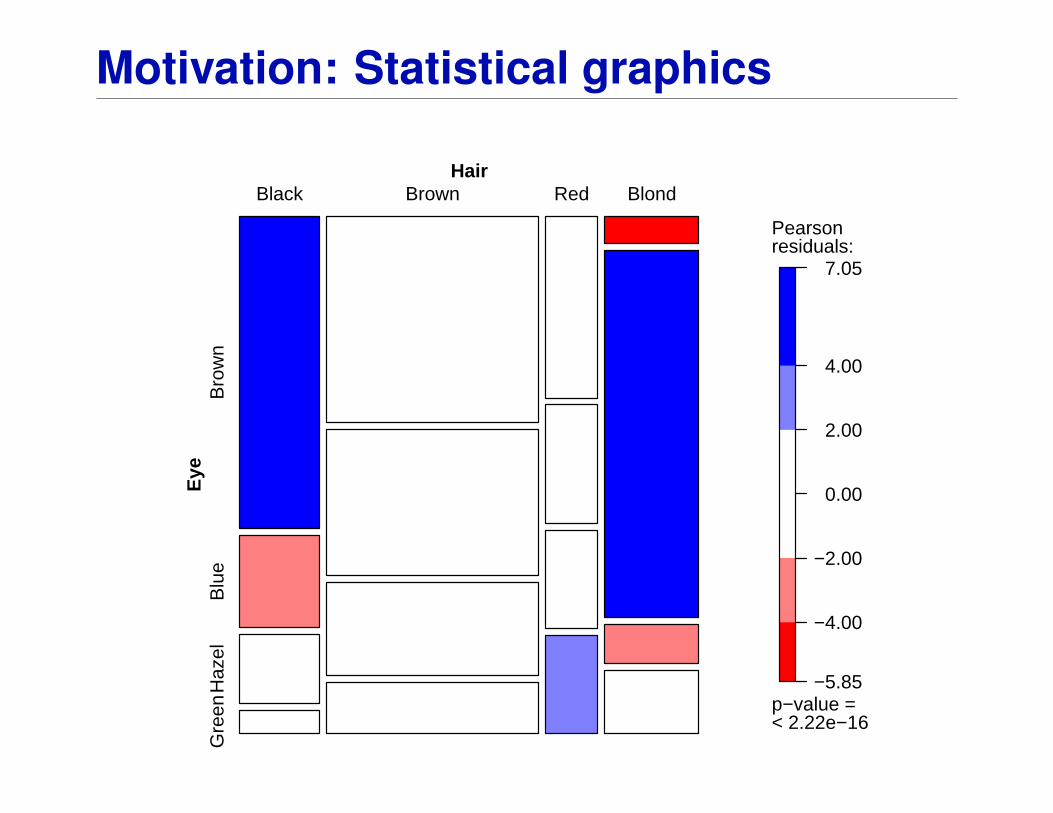
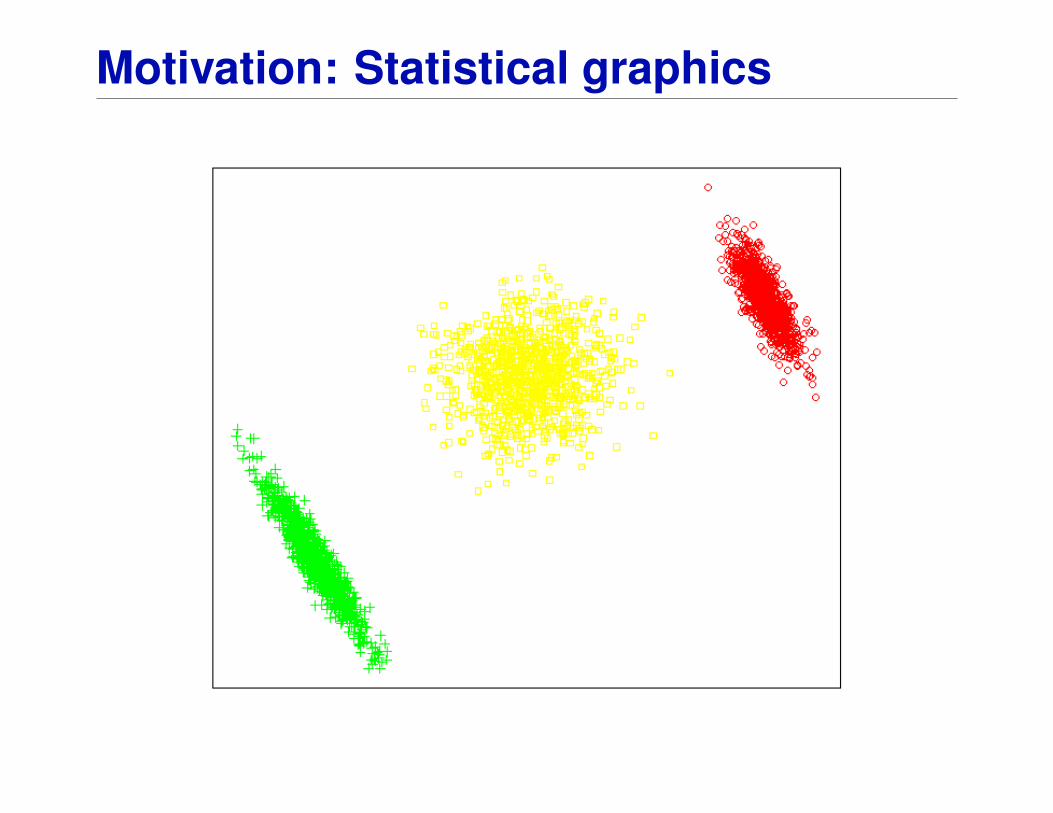
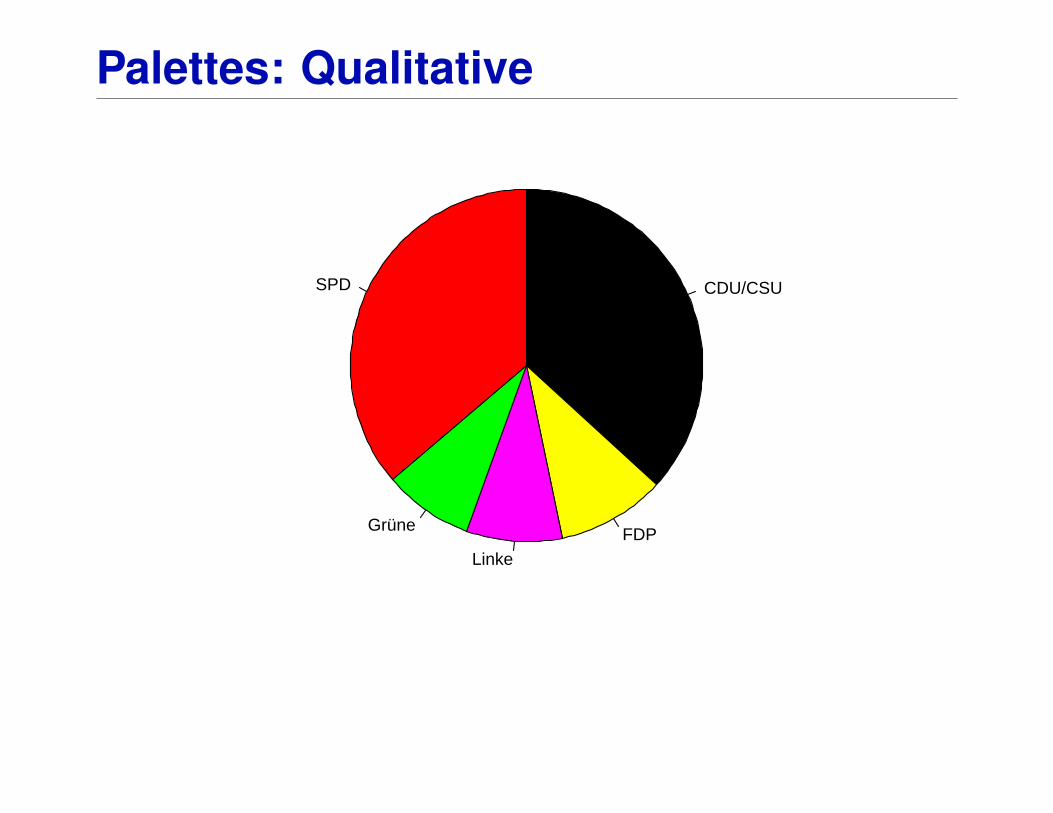
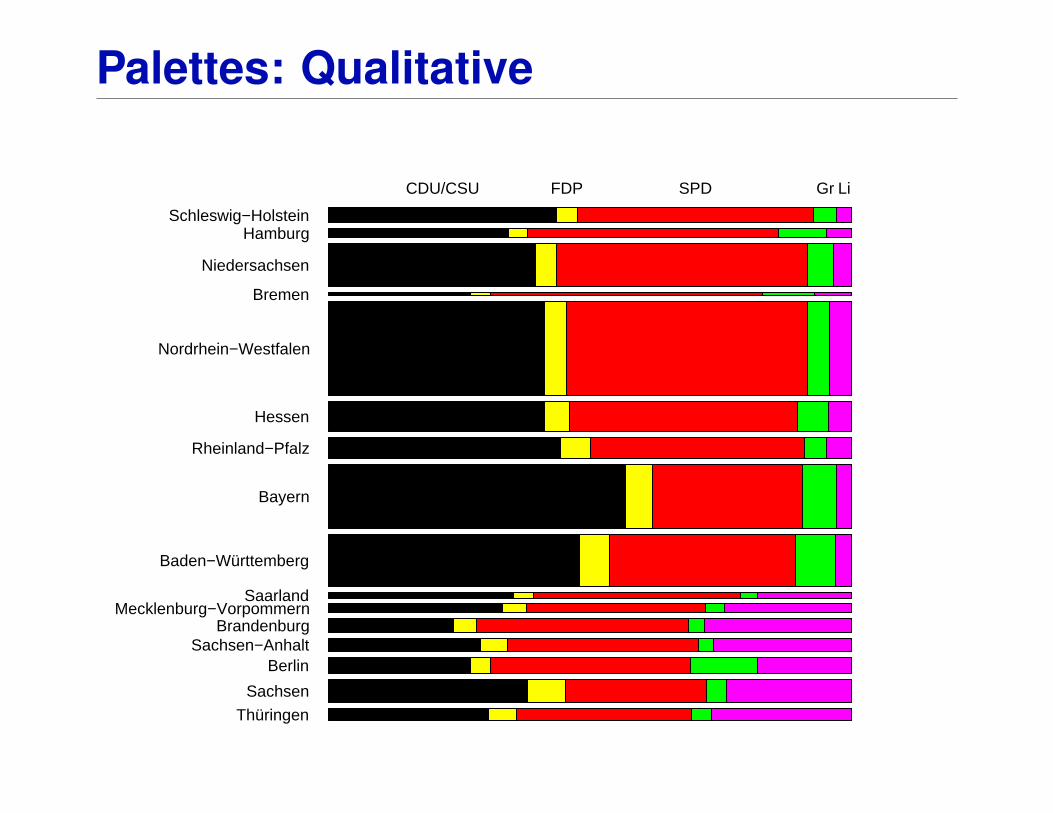
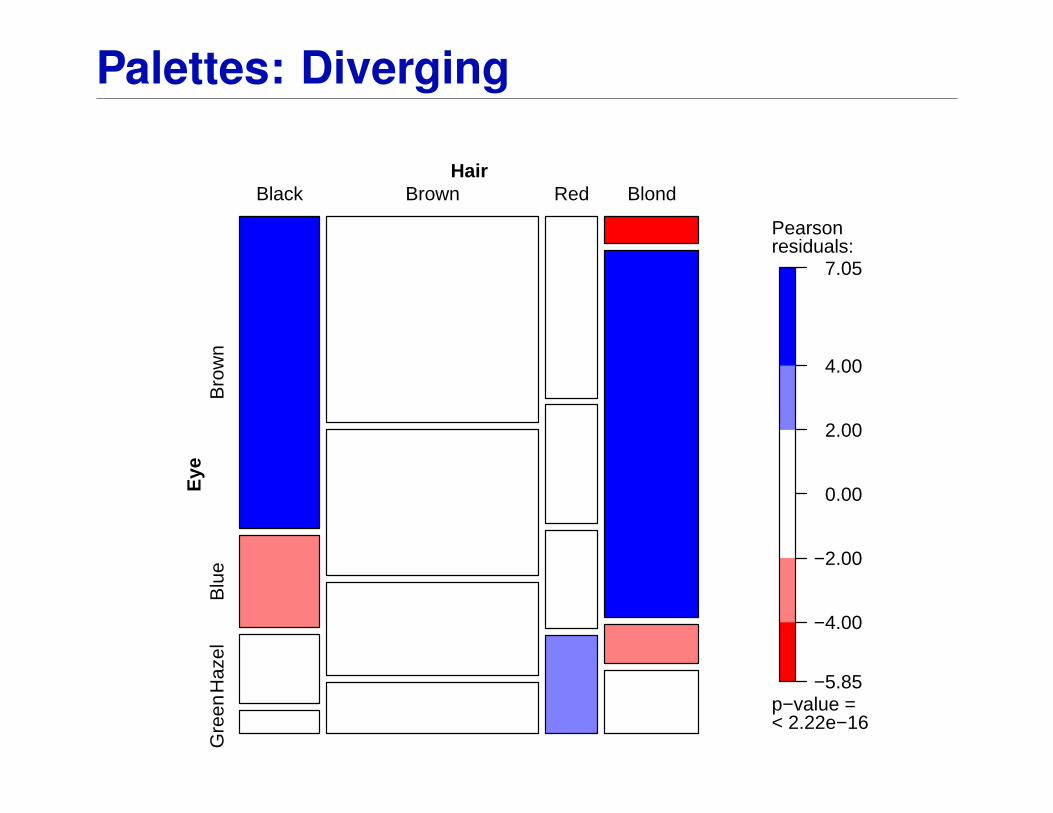
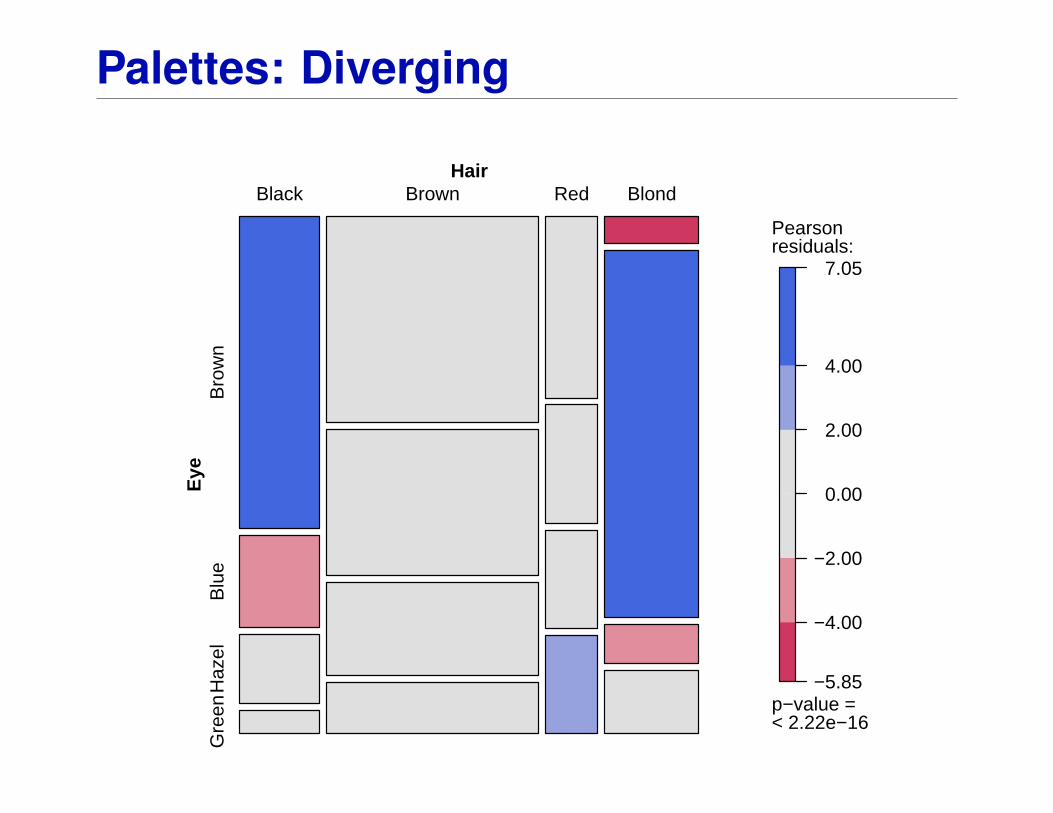
• pie chart of seats in the German parliament Bundestag,• mosaic display of votes for the German Bundestag,• model-based mosaic display for hair and eye color data,• scatter plot with three clusters (and many points).
Motivation: Statistical graphics
Motivation: Statistical graphics
Motivation: Statistical graphics
CDU/CSU
FDPLinke
Grüne
SPD
Motivation: Statistical graphics
Thüringen
Sachsen
BerlinSachsen−Anhalt
BrandenburgMecklenburg−Vorpommern
Saarland
Baden−Württemberg
Bayern
Rheinland−Pfalz
Hessen
Nordrhein−Westfalen
Bremen
Niedersachsen
HamburgSchleswig−Holstein
CDU/CSU FDP SPD Gr Li
Motivation: Statistical graphics
−5.85
−4.00
−2.00
0.00
2.00
4.00
7.05
Pearsonresiduals:
p−value =< 2.22e−16
HairE
yeBlack
Gre
enH
azel
Blu
eB
row
nBrown Red Blond
Motivation: Statistical graphics

Motivation: Statistical graphics
Problems:
• Flashy colors: good for drawing attention to a plot but hard tolook at for a longer time.
• Large areas of saturated colors: can produce distractingafter-image effects.
• Unbalanced colors: light and dark colors are mixed; or “pos-itive” and “negative” colors are difficult to compare.
• Quantitative variables are often difficult to decode.
Motivation: Statistical graphics
Solutions:
• Use pre-fabricated color palettes (with fixed number ofcolors) designed for specific visualization tasks: Color-Brewer.org (see Brewer, 1999).
Problem: little flexiblity.
• Selecting colors along axes in a color space whose axes canbe matched with perceptual axes of the human visual sys-tem.
Leads to similar palettes compared to ColorBrewer.org butoffers more flexibility via a general principle for choosingpalettes.
Color vision and color spaces
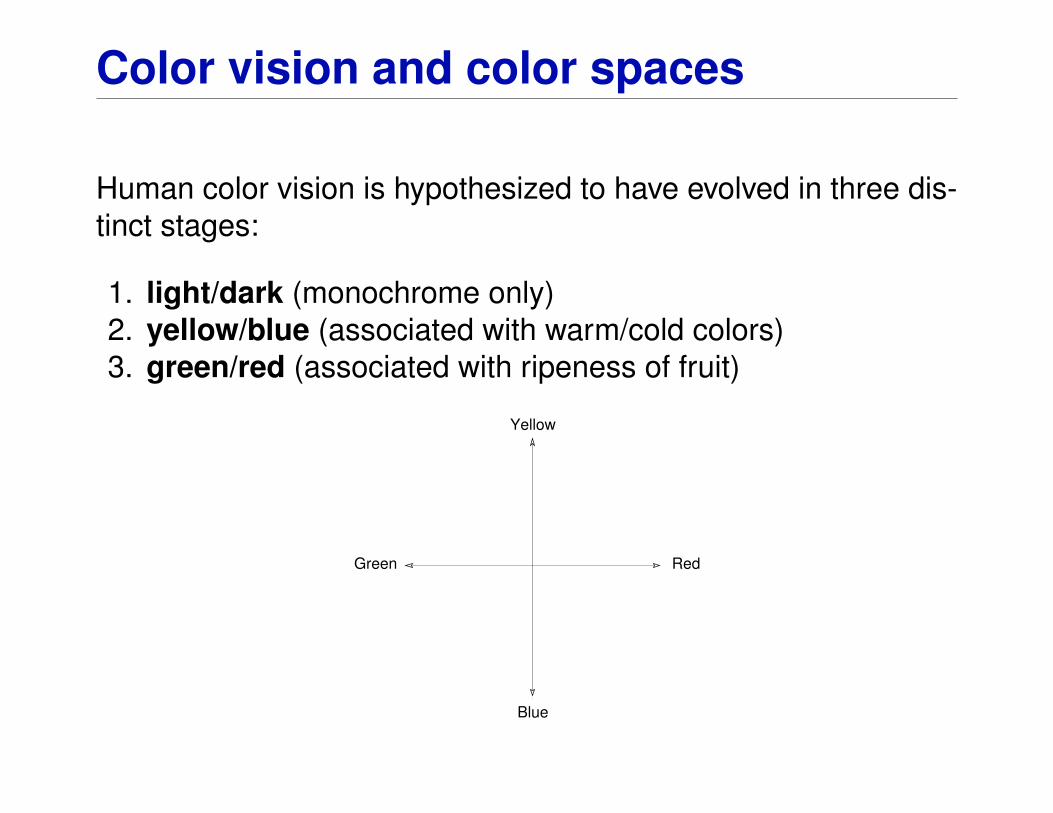
Human color vision is hypothesized to have evolved in three dis-tinct stages:
1. light/dark (monochrome only)2. yellow/blue (associated with warm/cold colors)3. green/red (associated with ripeness of fruit)
Yellow
Green Red
Blue
Color vision and color spaces
Due to these three color axes, colors are typically described aslocations in a 3-dimensional space, often by mixing three primarycolors, e.g., RGB or CIEXYZ.
Physiological axes do not correspond to natural perception ofcolor but rather to polar coordinates in the color plane:
• hue (dominant wavelength)• chroma (colorfulness, intensity of color as compared to gray)• luminance (brightness, amount of gray)
Perceptually based color spaces try to capture these three axesof the human perceptual system, e.g., HSV or HCL.
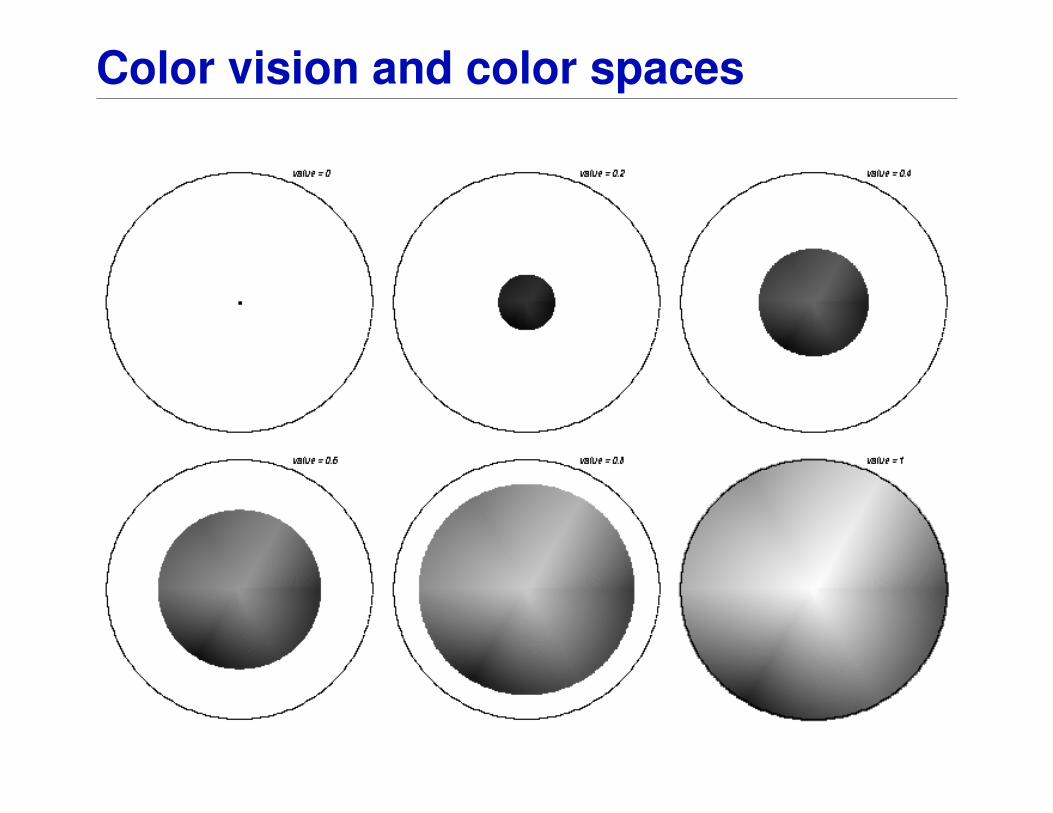
Color vision and color spaces
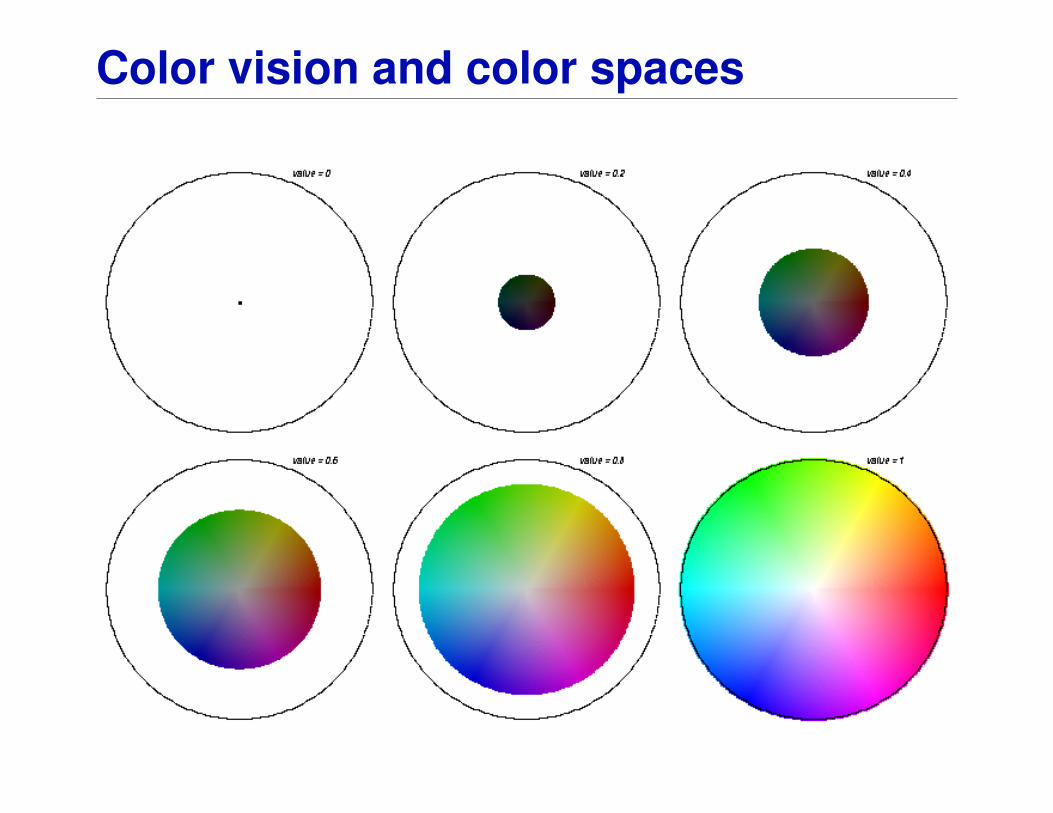
HSV space is a standard transformation of RGB space imple-mented in most computer packages.
Specification: triplet (H, S, V ) with H = 0, . . . ,360 andS, V = 0, . . . ,100, often all transformed to unit interval (e.g., inR).
Shape: cone (or transformed to cylinder).
Problem: dimensions are confounded, hence not really percep-tually based.
Color vision and color spaces
Color vision and color spaces
Color vision and color spaces
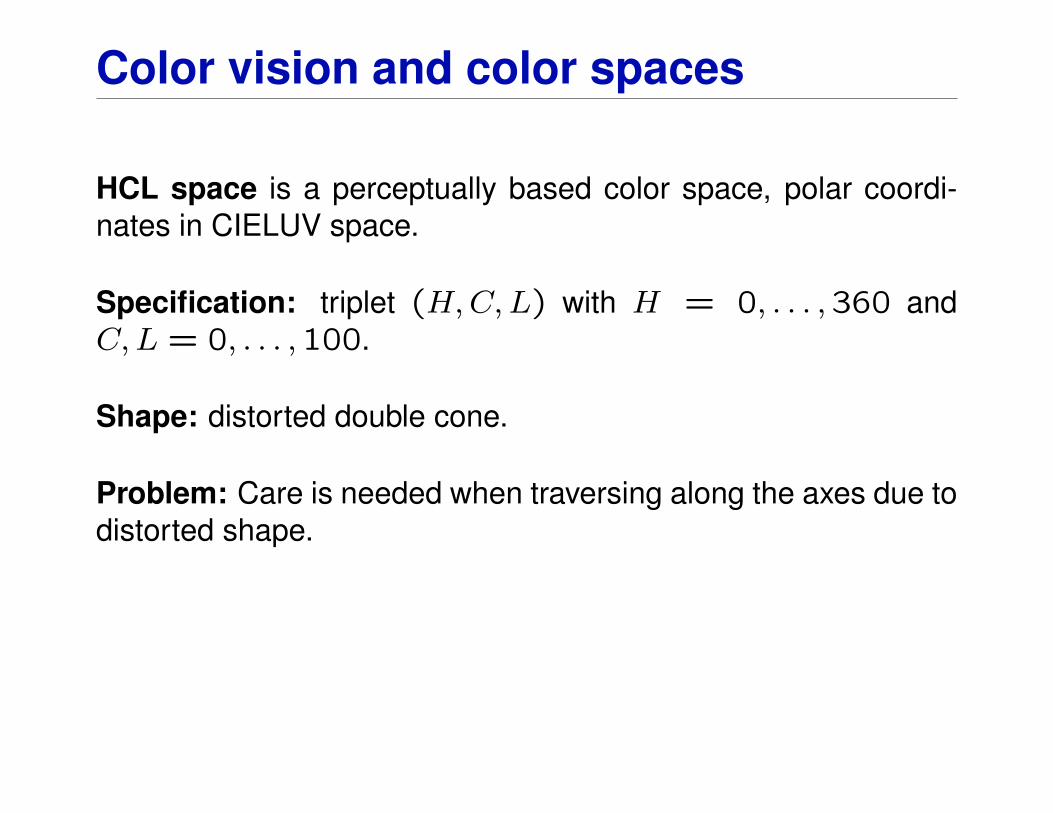
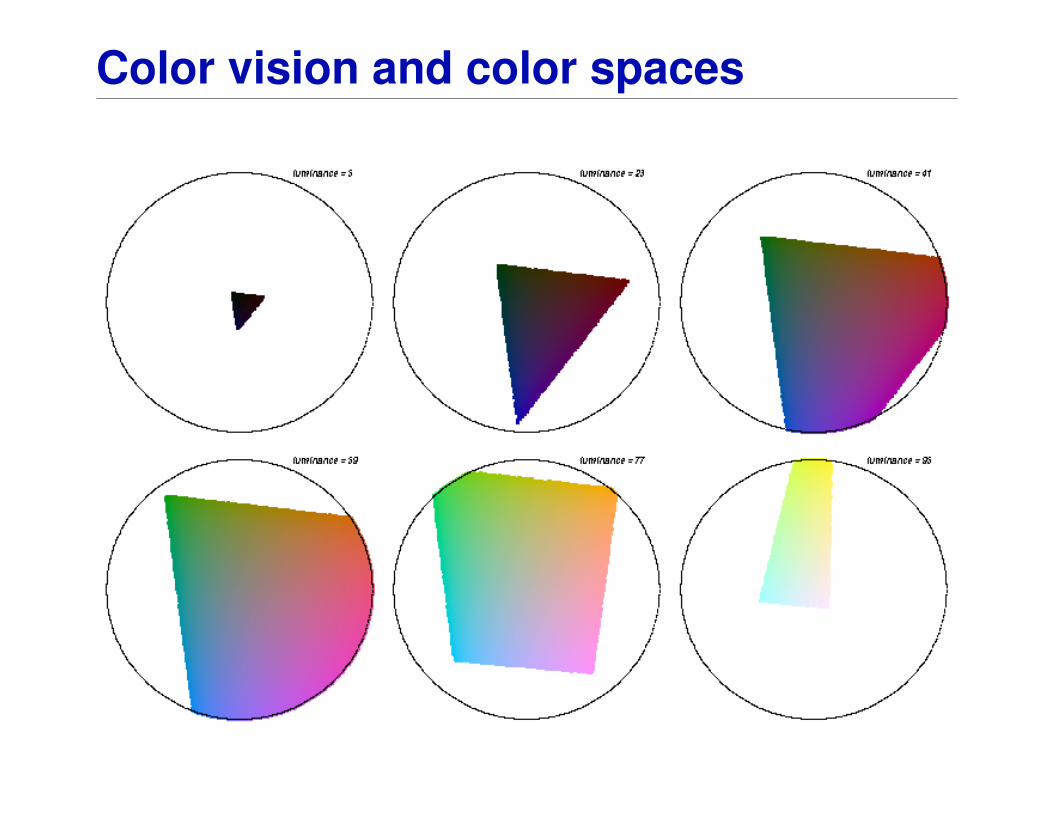
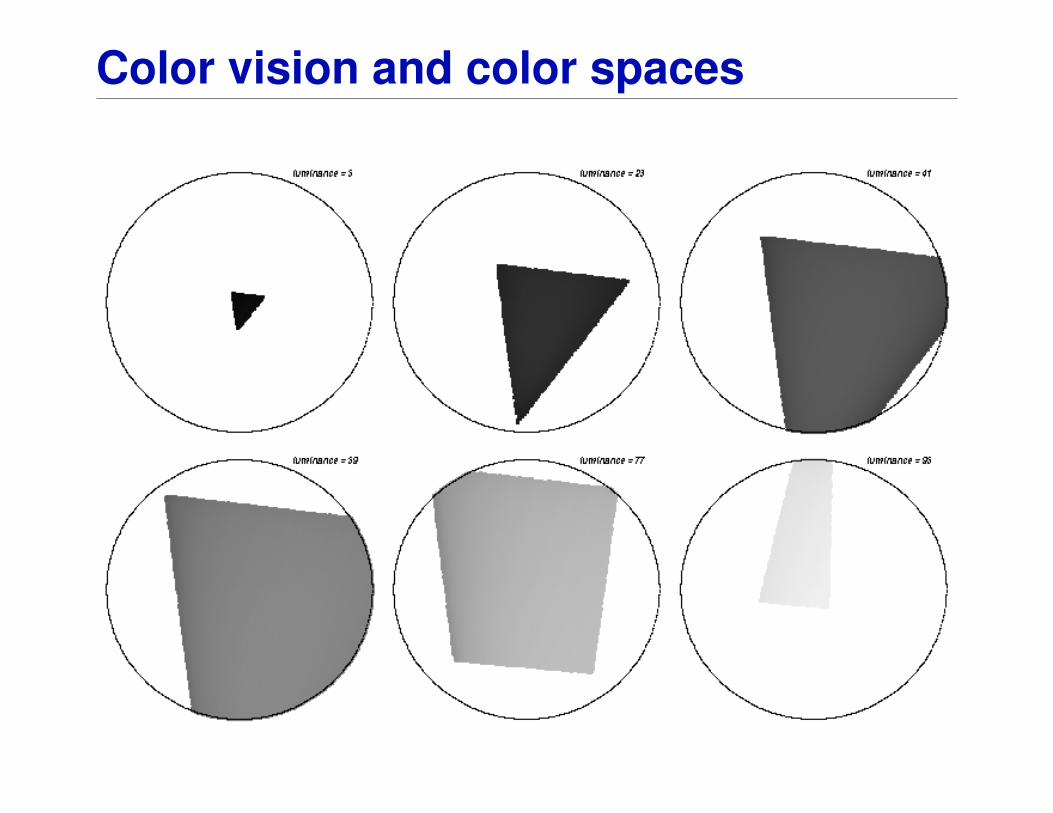
HCL space is a perceptually based color space, polar coordi-nates in CIELUV space.
Specification: triplet (H, C, L) with H = 0, . . . ,360 andC, L = 0, . . . ,100.
Shape: distorted double cone.
Problem: Care is needed when traversing along the axes due todistorted shape.
Color vision and color spaces
Color vision and color spaces
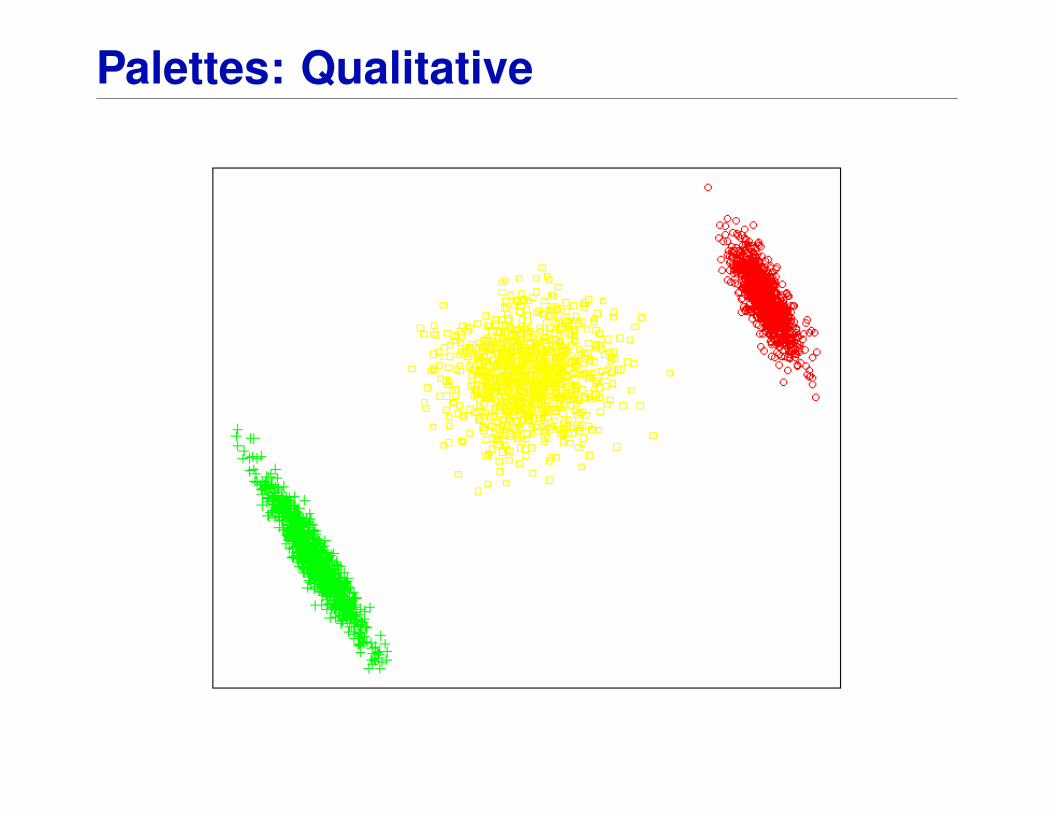
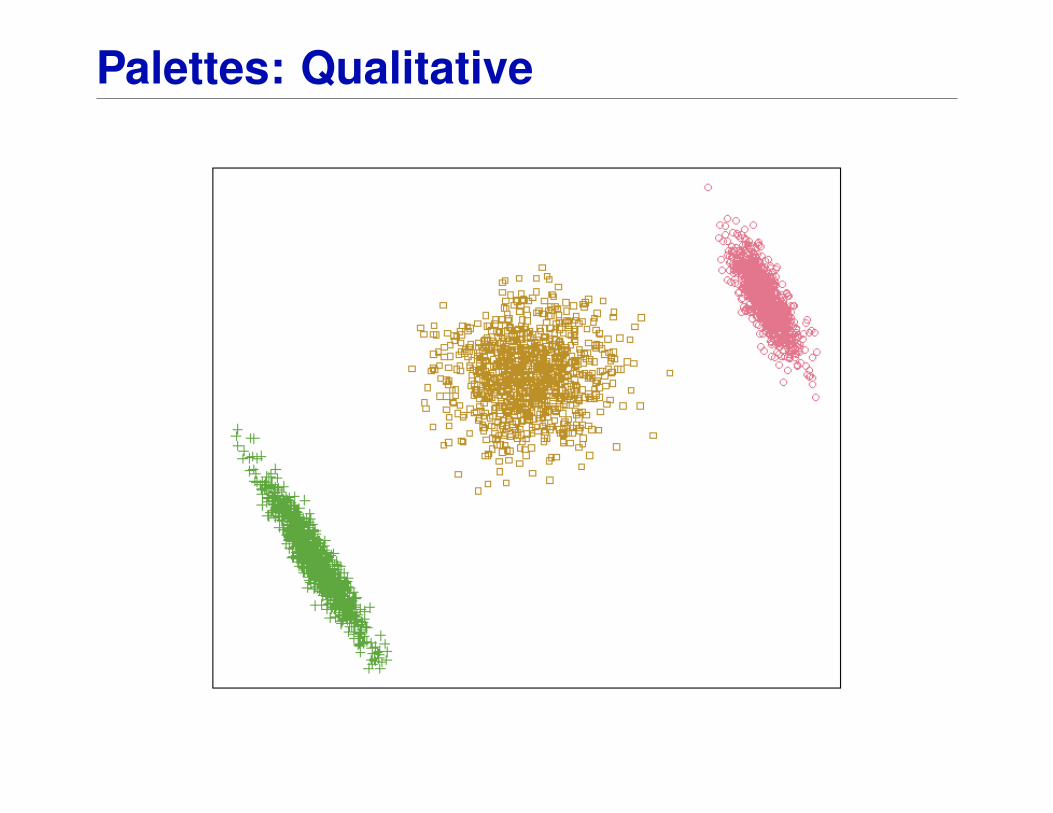
Palettes: Qualitative
Goal: Code qualitative information.
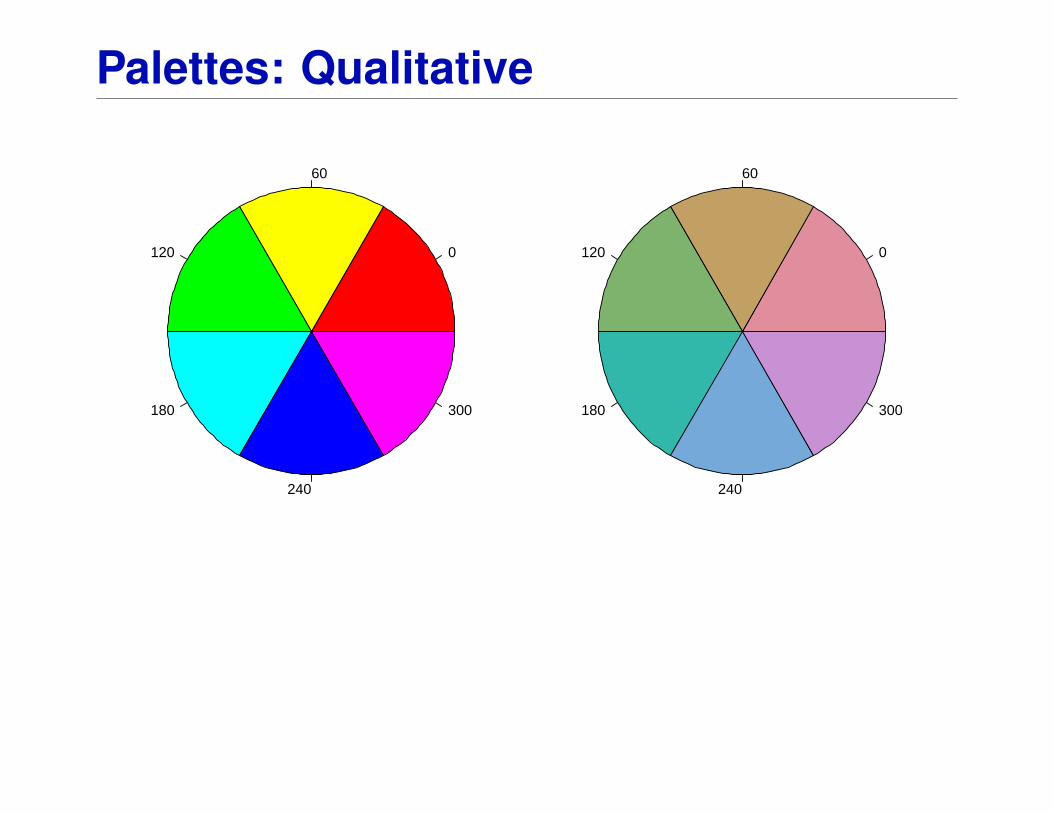
Solution: Use different hues for different categories.Keep chroma and luminance fixed, e.g.,
(H,50,70)
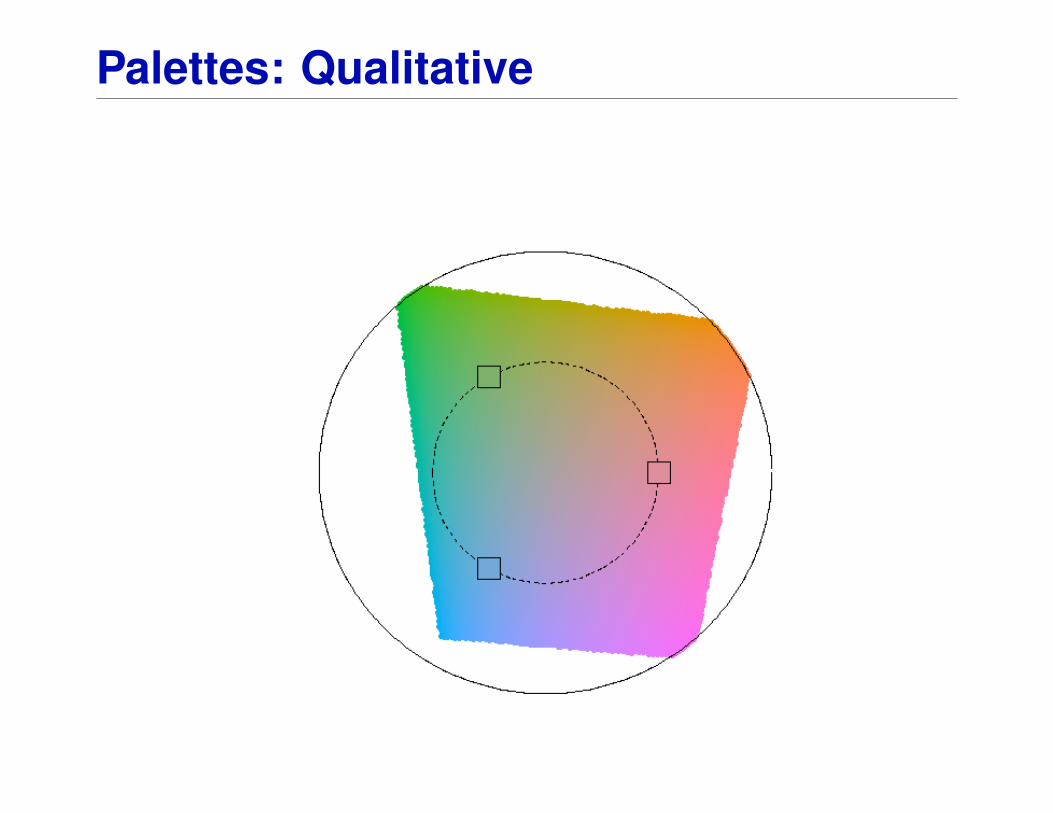
Remark: The admissible hues (within HCL space) depend onthe values of chroma and luminance chosen.
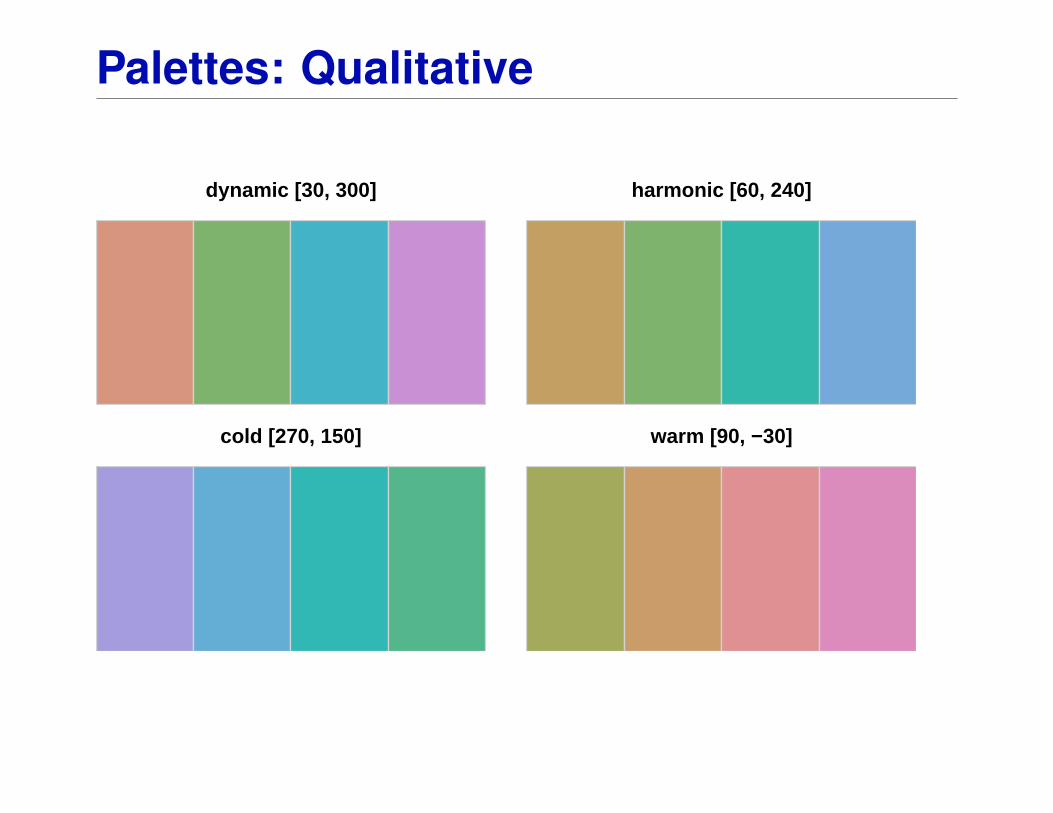
Hues can be chosen from different subsets of [0,360] to createdifferent “moods” or as metaphors for the categories they code(see Ihaka, 2003).
Palettes: Qualitative
Palettes: Qualitative
0
60
120
180
240
300
0
60
120
180
240
300
Palettes: Qualitative
dynamic [30, 300] harmonic [60, 240]
cold [270, 150] warm [90, −30]
Palettes: Qualitative
CDU/CSU
FDPLinke
Grüne
SPD
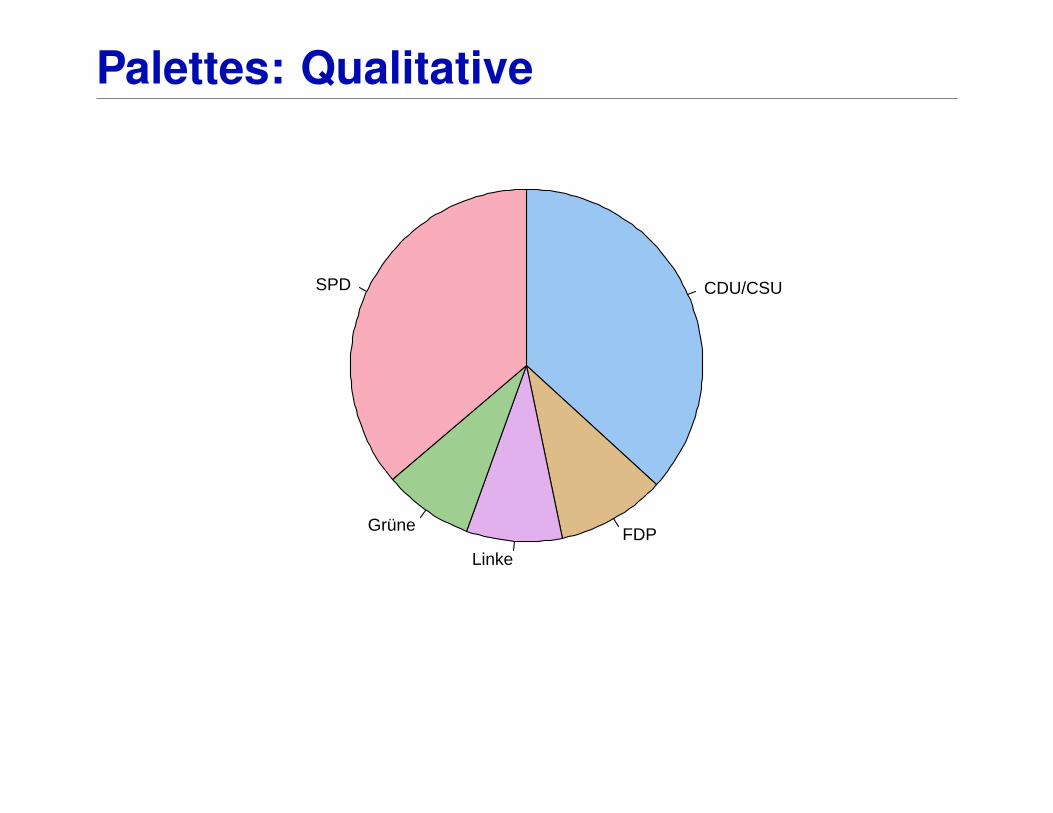
Palettes: Qualitative
CDU/CSU
FDPLinke
Grüne
SPD
Palettes: Qualitative
Thüringen
Sachsen
BerlinSachsen−Anhalt
BrandenburgMecklenburg−Vorpommern
Saarland
Baden−Württemberg
Bayern
Rheinland−Pfalz
Hessen
Nordrhein−Westfalen
Bremen
Niedersachsen
HamburgSchleswig−Holstein
CDU/CSU FDP SPD Gr Li
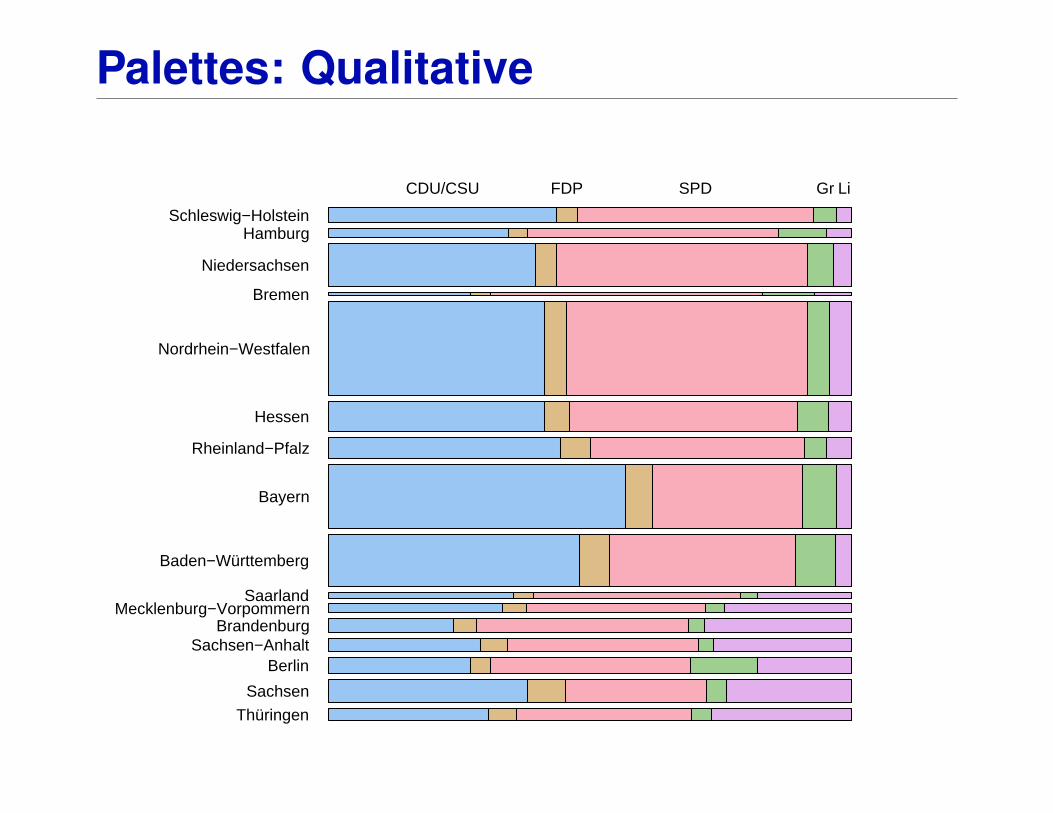
Palettes: Qualitative
Thüringen
Sachsen
BerlinSachsen−Anhalt
BrandenburgMecklenburg−Vorpommern
Saarland
Baden−Württemberg
Bayern
Rheinland−Pfalz
Hessen
Nordrhein−Westfalen
Bremen
Niedersachsen
HamburgSchleswig−Holstein
CDU/CSU FDP SPD Gr Li
Palettes: Qualitative
Palettes: Qualitative
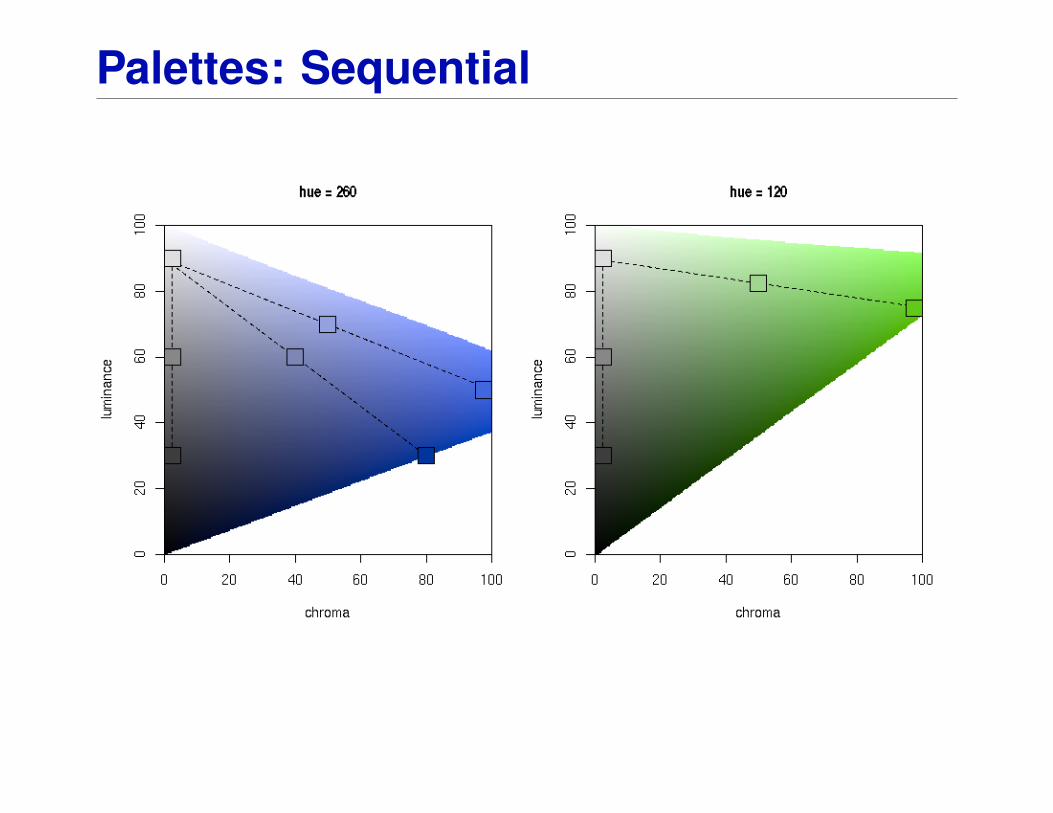
Palettes: Sequential
Goal: Code quantitative information. Intensity/interestingness iranges in [0,1], where 0 is uninteresting, 1 is interesting.
Solution: Code i by increasing amount of gray (luminance), nocolor used, e.g.,
(H,0,90− i · 60)
The hue H does not matter, chroma is set to 0 (no color), lumi-nance ranges in [30,90], avoiding the extreme colors black andwhite.
Modification: In addition, code i by colorfulness (chroma).Thus, more formally:
(H,0 + i · Cmax, Lmax − i · (Lmax − Lmin)
for a fixed hue H.
Palettes: Sequential
Palettes: Sequential
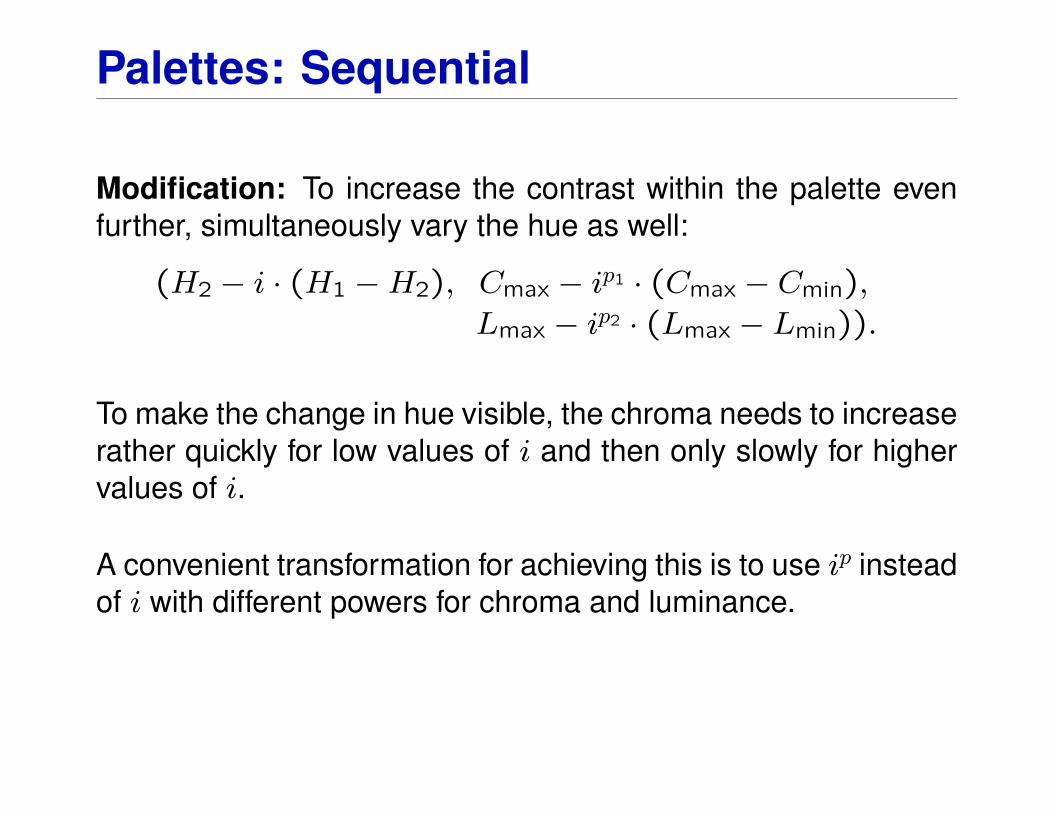
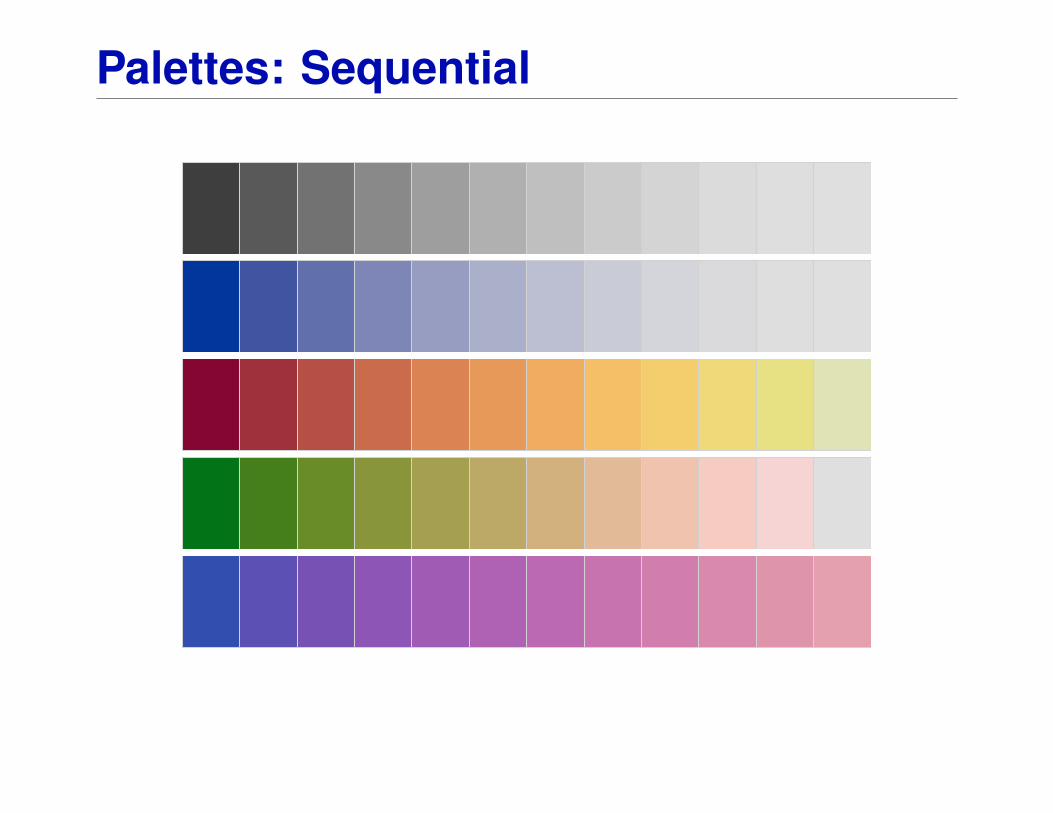
Modification: To increase the contrast within the palette evenfurther, simultaneously vary the hue as well:
(H2 − i · (H1 −H2), Cmax − ip1 · (Cmax − Cmin),Lmax − ip2 · (Lmax − Lmin)).
To make the change in hue visible, the chroma needs to increaserather quickly for low values of i and then only slowly for highervalues of i.
A convenient transformation for achieving this is to use ip insteadof i with different powers for chroma and luminance.
Palettes: Sequential
Palettes: Sequential
Palettes: Sequential
Palettes: Sequential
Palettes: Diverging
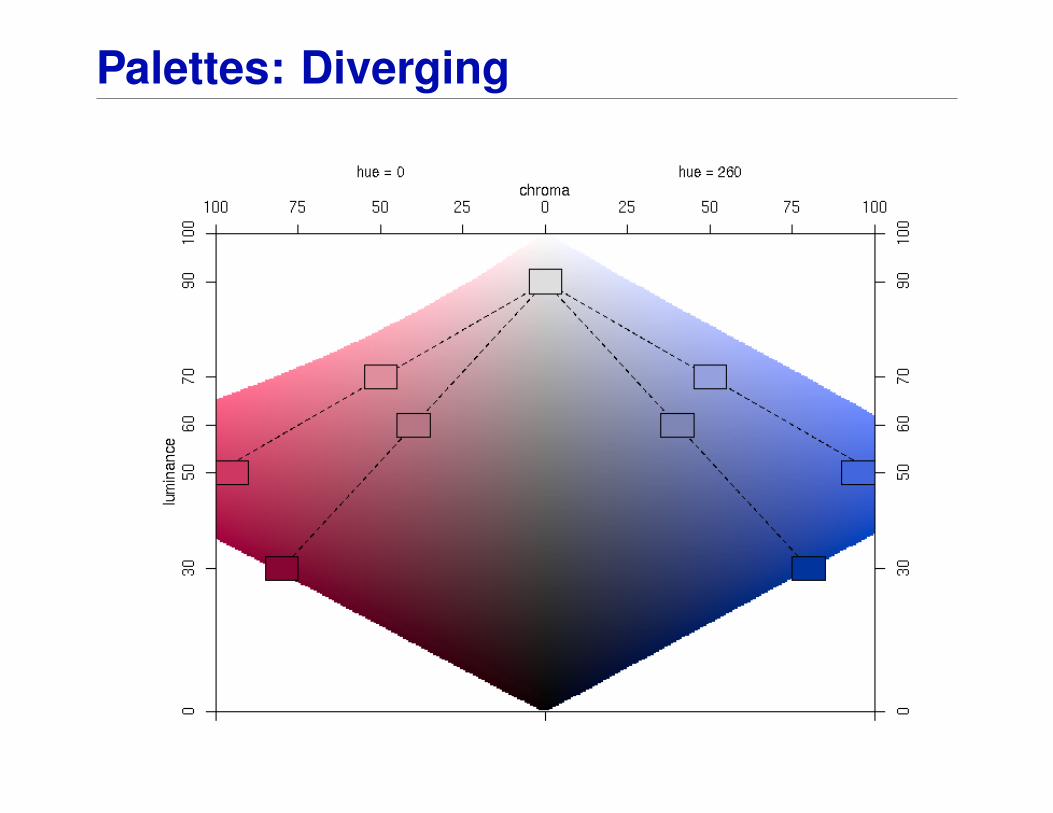
Goal: Code quantitative information. Intensity/interestingness iranges in [−1,1], where 0 is uninteresting, ±1 is interesting.
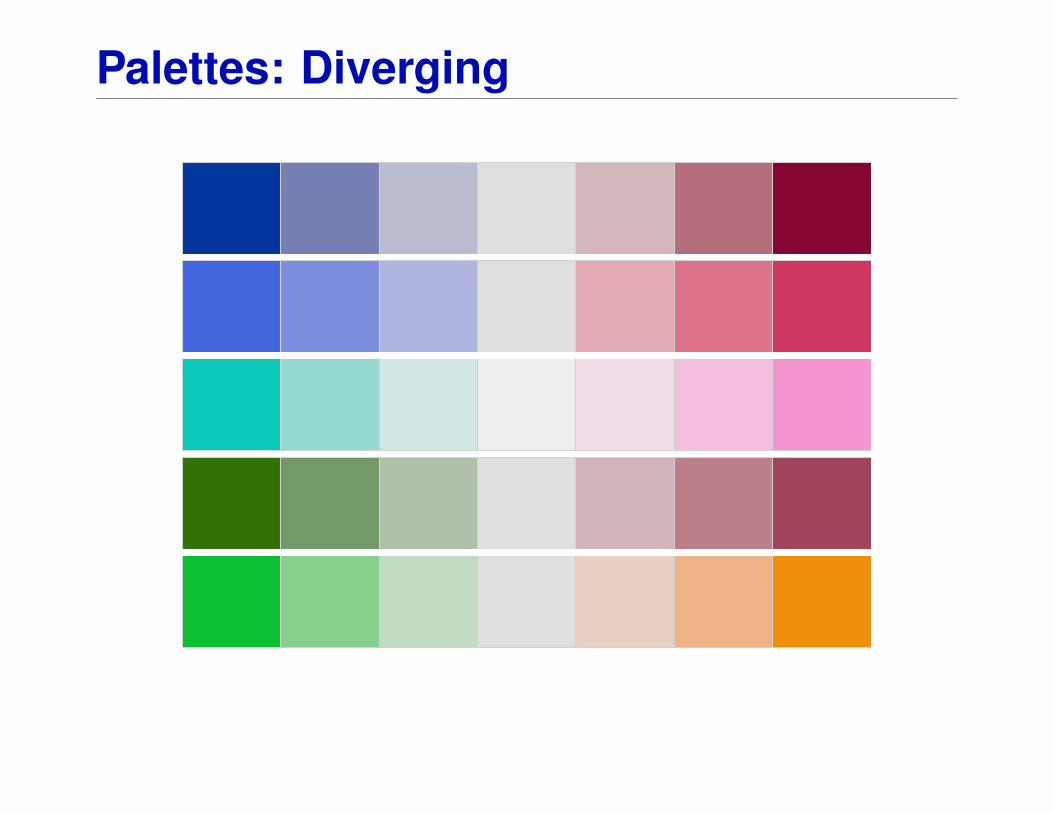
Solution: Combine sequential palettes with different hues.
Remark: To achieve both large chroma and/or large luminancecontrasts, use hues with similar chroma/luminance plane, e.g.,H = 0 (red) and H = 260 (blue).
Palettes: Diverging
Palettes: Diverging
Palettes: Diverging
Palettes: Diverging
Palettes: Diverging
−5.85
−4.00
−2.00
0.00
2.00
4.00
7.05
Pearsonresiduals:
p−value =< 2.22e−16
HairE
yeBlack
Gre
enH
azel
Blu
eB
row
nBrown Red Blond
Palettes: Diverging
−5.85
−4.00
−2.00
0.00
2.00
4.00
7.05
Pearsonresiduals:
p−value =< 2.22e−16
HairE
yeBlack
Gre
enH
azel
Blu
eB
row
nBrown Red Blond
Software
Implementing HCL-based palettes is not difficult:
• If HCL colors are available, our formulas are straightforwardto implement.
• If not, HCL coordinates typically need to be converted toRGB coordinates for display. Formulas are available, e.g.,in Wikipedia (2006ab).
R has an implementation of various color spaces (includingHCL) in Ross Ihaka’s colorspace package. Based on this, ourvcd package provides rainbow_hcl(), sequential_hcl(),heat_hcl(), and diverge_hcl().
For documentation and further examples, see ?rainbow_hcl
and vignette("hcl-colors", package = "vcd").
References
Brewer CA (1999). “Color Use Guidelines for Data Representation.” In “Proceedingsof the Section on Statistical Graphics, American Statistical Association,” Alexandria, VA,55–60.
Ihaka R (2003). “Colour for Presentation Graphics.” In K Hornik, F Leisch, A Zeileis (eds.),“Proceedings of the 3rd International Workshop on Distributed Statistical Computing,”Vienna, Austria, ISSN 1609-395X, URL http://www.ci.tuwien.ac.at/Conferences/DSC-2003/Proceedings/.
Wikipedia (2006a). “HSV Color Space — Wikipedia, The Free Encyclopedia.” URL http://en.wikipedia.org/wiki/HSV color space. Accessed 2006-09-14.
Wikipedia (2006b). “Lab Color Space — Wikipedia, The Free Encyclopedia.” URL http://en.wikipedia.org/wiki/Lab color space. Accessed 2006-09-14.
Zeileis A, Hornik K (2006). “Choosing Color Palettes for Statistical Graphics.” Report 41,Department of Statistics and Mathematics, Wirtschaftsuniversitat Wien, Research ReportSeries. URL http://epub.wu-wien.ac.at/.
Zeileis A, Meyer D, Hornik K (2007). “Residual-based Shadings for Visualizing (Condi-tional) Independence.” Journal of Computational and Graphical Statistics, forthcoming.