consumer cooperative movement in indiacccindia.org.in/07_chapter.pdfthe first consumer cooperative...
TRANSCRIPT

CHAPTER I1
CONSUMER COOPERATIVE MOVEMENT IN INDIA
2.1 Introduction
The basic aim of the cooperative movement is to achieve the
advancement of the members concerned and to protect them from exploitation.
With this purpose different types of cooperatives have been formed. Consumer
cooperatives are organised to serve as the best custodians of the unorganised
consumers by supplying quality products and services at reasonable prices and
in correct weights. The first consumer cooperative society was established by
Rochdale P~oneers in the year 1844 in Manchester in England. A batch of
twenty eight weavers in Rochadle formed the 'Rochdale Society of Equitable
Pioneers on 2 4 ~ October 1844 and started business on 21 December 1844 to set
an example to the world by making collective purchases and distribution of
consumer goods for cash at reasonable prices and bonus was declared at the end
of the year against the purchases made. The period that England passed through
(during the Industrial Revolution) when the Rochdale Society had been founded
was popularly known as the "hungry forties" (Cole, 1944)'.
Over the years, England and Sweden which are the forerunners of the
consumer cooperative movement in the world has proved that consumers
cooperatives can serve as effective guardian and spokesman of the consumers. . Some of the contributory factors for the successful working of consumer
I Cole, G.D.H. (1944) A Century ~f~('ooprrotion, George Allen and Unwin Limited for the Cooperative Union Limited. Oxford. p I

cooperatives were identified as the involvement of responsive members with a
spirit of cooperation, uniformity of needs and preferences of consumers due to
better standard of Iivmg and the positive attitude of the governments with a
well-desrgned and supportive legal framework for the development of people's
organisations like consumer cooperatives.
2.2 Consumer Cooperative Movements in Asia
Pradit Machima (1994)' suggests that consumer cooperative movements
in Asian countries can be classified into three groups - strong, medium, and
weak. Strong movements compr~sing Japan and Singapore have high standard
of living among the consumers. The countries which have consumer
cooperatives with medium performance are South Korea, Malaysia, Thailand,
Sri Lanka and parts of India. The weak movements include Bangladesh, parts
of India, Indonesia, Pakistan, Philippines and Vietnam, where socio-economic
conditions are not conducive to consumer cooperative development. Further,
organisationally, the consumer cooperatives in Asia can be divided into five
main categories, as follows:
1. Purely consumer cooperatives They are organised or owned by members
comprising general public and widely exist in Japan, Singapore and
Thailand
2. Multi-purpose cooperatives: Their activities are mixed such as credit, farm
supply, marketing, processing. consumer activities, insurance etc. This type
of cooperatives exist in Sri Lanka, Vietnam, Indonesia and South Korea
2 Pradit Machima (1994) "Consumer Cooperative Movements in Asia", I C A N C T Sub- regional Seminar on ('onslrmer Cooperative. Bombay 24' April to 3rd May 1994, p.25-26.

where consumer cooperatives are not in existence but are organized or
operated as a unit or section of agricultural cooperatives.
3. Institutional cooperatives: Institutional cooperatives are those cooperatives
which are organized among workers, employees or civil servants or m e d
forces, who work in the same organization or institution. They exist in many
countries like Bangladesh, India, Indonesia, Japan, Malaysia, Philippines, Sri
Lanka and Thailand.
4. Student/ University Cooperatives: The student/university cooperatives were
organlsed by the students and teachers as members and these societies
prowde student related artlcles for students and teachers. These societies
also help to cultivate cooperativisam among students. These societies are
very popular in almost all Asian countries except Sri Lanka and Vietnam.
5. Village and rural cooperatives: The ultimate objective of village and rural
cooperative is to supply essential articles to the rural people and thus serve
the rural areas. Among the Asian countries, it is widely spread and popular
only in lndia.
2.3 Consumer Cooperative Movement in lndia
In lndia the erstwhile Madras state was the pioneer in the field of
cooperative movement. The first consumer cooperative society was set up in
Madras, namely 'The Triplicane Urban Cooperative Society Limited' in 1904
with the prime aim of supplying necessities of life to its members and it has
grown up as one of the largest consumer cooperative societies in lndia'. With

the passing of Cooperative Credit Societies Act, 1904, the Madras state gave
registration to the Triplicane Urban Cooperative Society followed by the
registration to the Coimbatore Cooperative Society in 1906. However the
consumer cooperatives got legal recognition only after the enactment of the
Cooperative Societies Act of 19 12, which repealed the Cooperative Credit
Societies Act of 1904. Further, the Cooperative Societies Act, 1912 abolished
the dishnct~on between the rural and urban societies and in its place a new basis
for classificahon, namely limited and unlimited liability societies were
introduced.
As a consequence of the above mentioned measures the number of
cooperative stores which was 23 in 1912 rose to 78 at the close of the World
War 1'. The post World War I period witnessed high prices and scarcity for
essent~al goods and commodities. The inevitable result was a fillip to
cooperative consumers stores which continued their upward march till 192 1.
In 1919, on the basis of Montogue-Chelmsford reforms, cooperation
became a provincial subject and accordingly state laws were passed
subsequently to enable the state governments to effectively administer the
cooperatives organised for various economic activities.
The consumer cooperative movement received great stimulus after the
transfer of administrative powers and control of cooperative societies to popular
ministries in the provinces of lndia. In a country like lndia inhabited by 315
millions of people there were only 596 consumer cooperative stores (1920) as
against 37.000 agricultural and non-agricultural credit cooperatives in the
4 Sapre A.R. (1993 ) op.cit.. p.27.

country.' With the sole exception of Madras province where primary stores
were established in rural areas, the cooperative store movement in lndia was
concentrated in both urban and semi-urban areas. In the initial years, the
consumer cooperative movement received sufficient support and patronage from
the consumers
In the succeeding paragraphs, an attempt is made to evaluate the progress
of consumer cooperatives in lndia spread over a four tier structure consisting of
primary socletles. district wholesale societies, state level federations and
national level federat~on. While discussing the progress it is appropriate to
explain from top to bottom, but the available data on consumer cooperatives is
very comprehensive only for priniary societies. Further, the district, state and
national level societies were started little late also. Hence, considering the
convenience for explanation, we have followed bottom to top sequence.
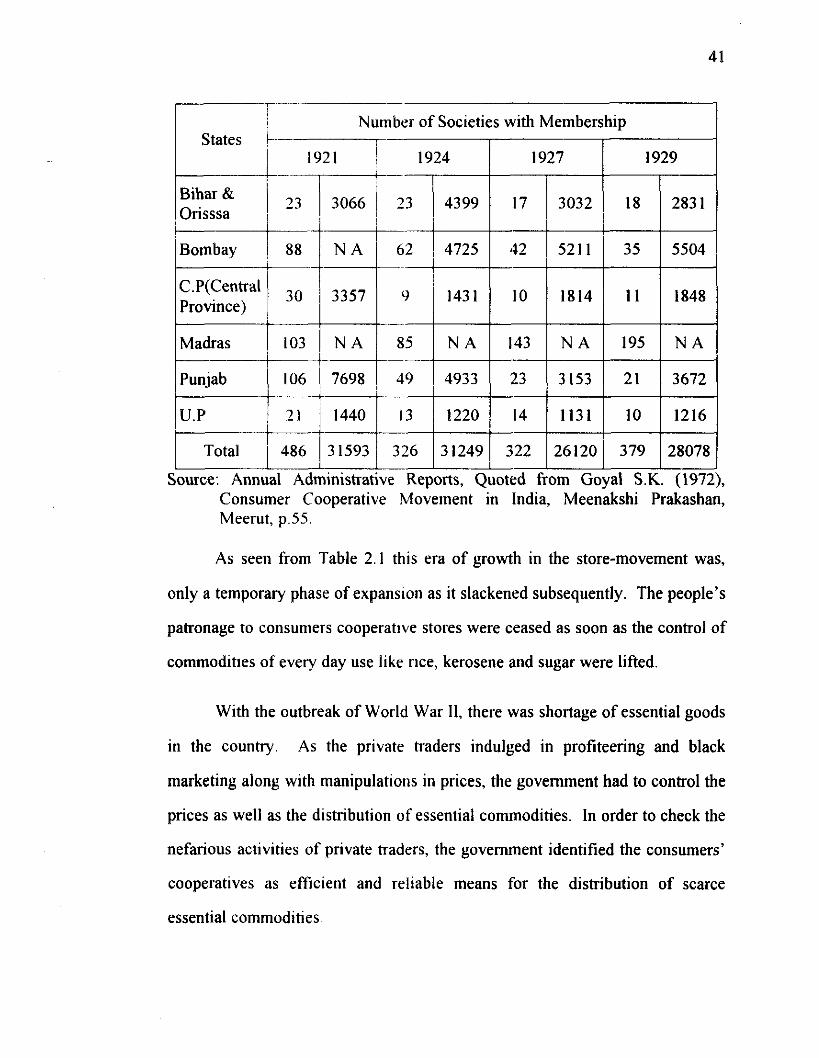
Progress of Primary Consumer Cooperative Societies in lndia
Table 2.1 Progress of Primary Consumer Cooperative Societies during the post World
War I Period (I92 1 to 1929)
Number of Societies with Membership
1927 1929
Memb ership ership ershlp ership
Assam 2283 20 2475
-----.
Contd ...
5 Kulkami K.R (1962). Theory and Procrice qf Couperotion in India and Abroad. Vol. IV, Cooperators' Book Depot. Dadar. Bombay. P.38
! j Number of Societies with Membership
1 1921 -.L-?---
Bihar & Orisssa / 23 1 3066 23 / 4399 / I7 1 3032 / 18 / 2831 /
c'p(centra', 30 13357 1 9 11431 1 10 11814 1 l l 1 1 8 4 8 1 Province)
-
Punjab 106 1 7698 3 153 3672
U.P +-T- I 21 I1440 13 1220 1131 1216 --
ource: Annual A d r n ~ n ~ s t r a t i v ~ ~ e ~ o r t s , Quoted from Goyal S.K. (1972), Consumer Cooperative Movement in India, Meenakshi Prakashan, Meerut, p.55
As seen from Table 2.1 this era of growth in the store-movement was,
only a temporary phase of expans~on as it slackened subsequently. The people's
patronage to consumers cooperative stores were ceased as soon as the control of
commod~ties of every day use like rice, kerosene and sugar were lifted.
With the outbreak of World War 11, there was shortage of essential goods
in the country. As the private traders indulged in profiteering and black
marketing along with manipulations in prices, the government had to control the
prices as well as the distribution of essential commodities. In order to check the
nefarious activities of private traders, the govenunent identified the consumers'
cooperatives as efficient and reliable means for the distribution of scarce
essential commodities.

After the outbreak of World War 11, the consumer cooperative movement
made sign~ficant progress. During 1943 rationing was introduced in many
provinces of lndia. The provincial govemments issued instructions to Collectors
of districts to encourage the consumers' cooperative stores by grant of necessary
licenses and quotas. The progress made by the consumers' cooperative stores in
lndia during the World War 11 and post- war period is presented in Table 2.2
Table 2.2
Number of Primary Consumers' Cooperative Stores and Membership in Primary Consumers' Stores in lndia During World War 11 (1940 to 1945)
i 2 a w a g i s : 2 .- States t; , g I .
o i w ~1 C % : - ! %
L o 1 I P ~ Z
Bihar
icentra' Province 1 30 1812i 1 29 1 I 9 3 3 30 122291 63 N A / 1131 N A 1281 ( N A
The progress of primary consumers' cooperative stores in the post World
War I1 period can be assessed by the statistics given in Table 2.3. It is seen that
71600
N A
N A
between 1946-47 and 1949-50, the number of societies increased by 74.58 per
of Cooperative Registrars, Quoted from Goyal S K (1972) Consumer Cooperative Movement in India, Meenaksh~ Prakashan, Meerut, p.62
21300C
N A
9475
938
33
132
1191
33
155
343000
3849
12283
1286
N A
I59
408000
N A
13537
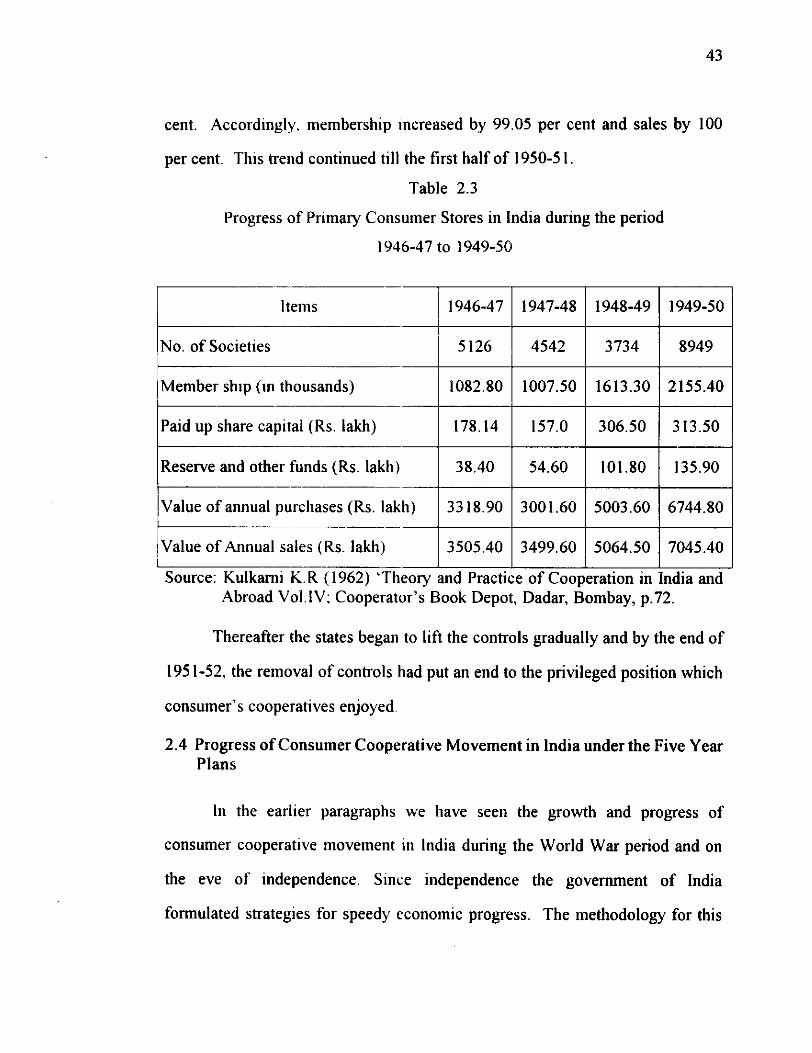
cent. Accordingly. membership increased by 99.05 per cent and sales by 100
per cent. T h ~ s trend continued till the first half of 1950-5 I.
Table 2.3
Progress of Pr~mary Consumer Stores in India during the period
1946-47 to 1949-50
Items -
No. of Soc~eties --
Member shlp (in thousands)
Paid up share capital (Rs. lakh) -
Reserve and other funds (Rs. lakh)
Value of annual purchases (Rs. lakh) 1 3318.90 1 3001.60 1 5003.60 1 6744.80 / Value of Annual sales (Rs. lakh) -3505401 3499.60 i 5064.50 j 7045.40 1 Source: Kulkarni ~ . R ( 1 9 6 2 ) 'Theory knd PractiLe of Cooperation in india and I
Abroad Vol.lV; Cooperator's Book Depot, Dadar, Bombay, p.72.
Thereafter the states began to lift the controls gradually and by the end of
195 1-52, the removal of controls had put an end to the privileged position which
consumer's cooperatives enjoyed
2.4 Progress of Consumer Cooperative Movement in lndia under the Five Year Plans
In the earlier paragraphs we have seen the growth and progress of
consumer cooperative movement in lndia during the World War period and on
the eve of independence. Since independence the govenunent of lndia
formulated strategies for speedy economic progress. The methodology for this

speedy development was the launching of Five Year Plans. Five Year Plans
strategies touched up on all sectors where cooperatives is also not an exemption.
The First Five Year Plan document pointed out that in urban areas special
significance must be attached to consumer cooperatives. But no targets were
laid down and no specific financial outlay was envisaged in the First and
Second Five Year Plans for this purpose. The reversion to decontrol and the
consequent functioning of free economy has also adversely affected the
consumer cooperative movement in India. As a result, the number of primary
consumer cooperative stores fell from 9757 in 1950-51 to 7050 in 1960-61, and
the membership from 18.45 lakh to 13.41 lakh, both recording a fall of 27 per
cent. The total sales made by these stores also declined from Rs.81.87 crore in
1950-5 1 to Rs.44.23 crore in 1960-61, the rate of fall being 45 per cent6.
In November 1960, the National Cooperative Development and
Warehousing Board appointed a Committee under the chairmanship of Natesan
to review the exlstlng status of the consumer cooperatives and to suggest
measures for the speedy development of the consumers' movement during the
Third Plan period. The Committee suggested for organization of 50 wholesale
stores and 2200 primary stores and made a number of recommendations
regarding organization, structure, pattern of consumer cooperatives, size and
viability, the need for strong wholesale stores, improvement of managerial
efficiency, business techniques and govenunent assistance.
The Chinese aggression (1962) led to the declaration of emergency
which resulted in an economic cris~s. The increase in agricultural and industrial

production alone could not solve the problem of scarcity of several essential
commodities The problem was not only one of production but distribution also.
Hence the problem was how to streamline the distribution of scarce resources.
The government took initiative in the organisation of consumer's cooperatives
all over the country, with a view to hold the price line of essential commodities
by offering to participate in share capital and provide managerial assistance and
other various subsidies. (Himachalam, 1991)'.
Besides the consumer cooperatives organised by the public in the urban
areas, a number of specialised consumer cooperatives have also been organised.
In 1962, the Minishy of Labour and Employment formulated a scheme for
organisatlon of consumer cooperative stores among industrial workers in the
private and public sector undertakings, employing more than 300 persons.
According to this scheme, employers were expected to make available financial
assistance to the store and also to provide accommodation to the stores either
free or at nominal rent. Up to the end of 1965-66, 1675 primary stores were set
up under the scheme in India. Another category of specialised consumer
cooperative stores consists of consumer cooperative stores organised for the
employees of the lndian Railways. There were 345 stores for railway
employees at the end of 1965-66 (Government of india, Administrative Reforms
Commission. 1968)'.
The devaluation of the lndian rupee by 36.5 per cent in June 1966 created
adverse psychological impact on the trade and the prices of all the goods started
rising indiscriminately. The government of lndia introduced an accelerated
7 Himachalam, D. (I99 I) < ) / ~ c i t . , p. 18. "ovemment of India (1968), Admmisrrotiv~. Kc:f&-rns Commission Report of' the Working
Grorrp on ('oopc.rotron. New Delhl. p. 127.

programme for strengthening consumers' cooperative movement in the country
by organising central stores in all the districts not covered during the Third Five
Year Plan penod. T h ~ s programme envisaged setting up of 101 new wholesale
stores and 2000 prlmary stores 01. branches, 50 departmental stores to cover all
important cities and towns with a population of about 2 lakhs, setting up of
consumer cooperative stores in universities and colleges, strengthening of
National and State Level Federations, building up of a system of
institutionallsed purchases, streamlining of supply arrangements and training of
supervisory staff and other personnel with the assistance of the govenunent.
(Himachalam, 199 1 )"
During the Fourth Five Year Plan period, a countrywide network of
consumer cooperatives has been built up. By the end of June 1974, there were
400 central wholesale consumer cooperatives, 14 State Federations of consumer
cooperatives and the National Cooperative Consumers' Federation at the apex
level." During the Fifth Plan, a Centrally Sponsored Scheme was formulated to
organize new department stores arid to strengthen the wholesale stores and the
state consumer federations. The Plan document emphasized that "if the
consumer cooperatives are well organized and run as efficient and economically
uable units, they can sell goods at fair and reasonable prices or even below the
market rates. and enlist mass support and participation of consumers"". The
Sixth Five Year Plan envisaged measures to strengthen the state federations and
measures to expand the activities of the National Cooperative Consumers'
9 Himachalam, D. (1 99 1 ) op. crl, p. 19. LO Mathur B.S (1991) o l ) . c i ~ . p.323. I1 Government of India ( 1973) Reporr ( I / /he Working Group on Coopernlion (F'ryh Five Yenr
Plnn), Nen. Delhi. p 10 1

Federation to procure supplies directly from manufacturers. The Central outlay
for the consumers' cooperatives during the Sixth Five Year Plan was Rs.56
crore. In order to support the consumers' cooperative movement, the
government of lndia entered into agreements with selected manufacturing
companies to make available 20 per cent of their manufactured articles through
the cooperative network.
The Seventh Five Year Plan proposed to increase the number of
departmental stores from 330 to 430 by the end of the period. It was also
proposed to increase the number of consumer cooperative outlets from 3 1,960 to
32,660 by the end of the Seventh Plan period. The National Cooperative
Development Corporation has extended Rs.98 crore till the end of the Seventh
Plan period as assistance to the consumer cooperatives. The main emphasis in
the Seventh Plan was to expand the coverage and intensity of consumer
cooperatives to backward and hi114 areas.
Eventhough there is coverage on cooperation in the Eighth and Ninth
Five Year Plan documents, the discussion is thin and scattered compared to the
earlier seven Five Year Plans. Hence in the immediate paragraph an attempt is
made to summarise the progress of consumer cooperative movement in lndia till
the end of the Seventh Plan with the help of available statistics.
The progress of primary consumer cooperative stores in lndia during the
period 1960-6 1 to 1988-89 is presented in Table 2.4. As evident from the table
2.4 the number of primary consumer cooperative stores in the counhy recorded
an average annual growth of 6.3 per cent during the period 1960-89. The
membership of primary consumers' cooperative stores in the country increased

from 13.40 lakh in 1960-61 to 70.40 lakh in 1988-89; signifying an increase in
the membership per store from 190 to 3 1 I . The total share capital of primary
consumers' cooperative stores in the country increased from Rs.2.49 crore in
1960-61 to Rs.34.99 crore in 1988-89, the rate of annual growth being 13.40 per
cent. Total sales made by prima~y consumer cooperative stores in the country
during the period 1960-6 1 was Rs.44.20 crore which rose to Rs. 1 177.40 crore
during the year 1988-89. The average annual sales per primary consumer
cooperative store in the country increased from Rs.62,670 in 1960-61 to
Rs.3,84,880 in 1988-89 recording an increase of 5.14 times.
Table 2.4
Progress of Primary Consumer Cooperative Stores (1960-89) in lndia
Membership in '000 (Rs. in '000)
-- -. I
At the end of ea Descriptions
Number
Membership
Share capital (Rs.) Total sales (Rs.)
Stores in profit (No) Stores in loss (No) Fair price shops in cooperative sector(no.)
Source: National cooperatives in lndia 1960-61 to 1988-89 (2"* Plan -71h Plan). Data Series, New Delhi, p.58-65.

The profitability of priina~y consumer cooperative stores in the country
increased during the period from 38.60 per cent in 1960-61 to 43.60 per cent in
1988-89. During the year 1988-89, total number of fair price shops in the
country stood at 3.53.798. As there were 83,544 fair price shops in the
cooperative sector, cooperative f a ~ r price shops constituted 23.60 per cent of the
total fair price shops in the country. The serious attempts to strengthen the
network of consumer cooperatives under the Five Year Plans through the
Centrally Sponsored Schemes as a consequence of Chinese aggression have
contributed for these achievements.
In the above paragraphs we examined the progress of primary consumer
cooperative stores at the national level. The various support measures also
helped the growth of consumer cooperative movement at the state level.
Available data suggest that the movement improved both in the number of
stores and membership over the years (See tables 2.6 and 2.7). The available
data also helped to classify the states into three levels, high performing, low
performing and average performing based on the number of consumer
cooperative stores (See table 2.51. From table 2.5 it is seen that eight states
came in the category of high performing led by Tamil Nadu and followed by
Bihar and Maharashtra. In the average performing category also there were
eight states including Kerala state

Table 2.5
Primary Consumer Cooperative Stores State wise number of cooperative Stores. (1988-89)
Average
Tamil Nadu .Ow
( Bihar 2847 Laksha Dweep 16 Himachal 239 Pradesh
/ Maharashtra 2650 / Pondicheny 2: 1 1 Kerala 380 1 I
West Bengal 2605
Uttar Pradesh 1785
Kamataka 1625
Andhra Pradesh 1 157 1 lamriiu B 50 Orissa 808 1 / Kashm~r I I I
I I
Gujarat 1425
I Goa 78 1 I
Andarnan 39
Sikk~m 36
Meghalaya 41
Arunaclial 96 Pradesh
Assam 422
Delhi 570
Rajastan 624
Havana 44
1 Tr~pura 1 1 1 1 I -- 1
Source: Nat~onal Cooperative Un~on of India, Analytical study of consumer cooperatives rn lndia 1960-6 1 to 1988-89 (2" Plan - 7th Plan), Data senes. p 3
Madhya Pradesh 763

Table 2.6
State-w~se Details of Pnmary Consumers Cooperative Stores in lndia dunng the per~od 1960-6 1 to 3 988-89
(Number of Stores)
Figures in Actual - - 7 - 1 7
85-86 86-87 87-88 88-89
961 1001 932 1113 1157
70 130 92 96
Assam 365 298 303 422 1-
Bihar 1915 2741 2600 2847
Mizoram --
Orissa

Rajasthan i 402 1 655 544 / 681 1 6'77 1 664 1 532 1 624 1 624 (
Tamil Nadu
Tripura ---4-~i.M3 5
93 9) 97 1 loo 9) 1 I
Andamans t 1 9 1 31 1 38 1 37 1 36 1 36 1 36 1 36 1 39 1 --- -
Delhi 168 370 313 455 711 711 570 570 - -
I 4 4 3 5 7 7 7 7 6 7 7 6 1 1 7 8 1 Goa, Daman & 1 Diu I
- .+- Lakshadeep
Pondicher~
Chand~garh I
Dadar 1 1 1 1 1 1 5 1 5 1 6 1 8 1 ; 1 4- I
Goa I -4- Daman& DIU i
i - I L I
.ource: National Cooperative Unlon of India, Analytical study of consumer cooperatives in India 1960-6 1 to 1988-89 (2nd Plan - 7'h Plan), Data senes, p 58
Total i70W 39081 I5797 16701 17727 18542 21913 22647

Table 2.7
Membership in Primary Consumers Cooperative Stores in India during the period 1960-6 1 to 198 1-89
State1U.T
Andhra Pradesh
Bihar
Gujarat
l~aryana
Himachal Pradesh
Madhya Pradesh
Mizoram --
Contd

~p
Source: National Cooperative Union of India, Analytical study of consumer cooperatives in India 1960-61 to 1988-89 (2"* Plan - 7'h Plan), Data series, p.59.
. 0 1 5 7 77-78 W-85
Sikkim 1 14500
X5-X
2213
686689
10354
394813
533377
10403
/ 229000
703073
8822
467395
536811
10422
158852
25126
1846
66342
7120
686
---A- Tamil Nadu 1 321091 / 555835 715764 802897
86-87
0
715764
8849
221398
399470
9337
96705
I
+ -
Total ~1340707i2929987 6806027
7552
365389
I
476000
11339
3- ~ r i ~ u r a 1240 71391 884"
7038616
87-88
13000
1441000
11000
394000
541000
11000
182000
, f- Uttar ! 149 126i 11459 13
I Pradesh , 1 - I
299451 15123
5943357
88-W
14000
1272934
11812
209378
543711
10572
182000
22000
48000
19340
1000
2000
-
221398
22134
18400
6935
700
3592725
25150
26343
19340
1000
850
- 7901
I
1025
13569
195
292
Goa, Daman I 1 Ill95 & Diu
--- .. +- Lakshadccp i I
.-A-
Pandicheri i 4 5 11474
W.Benga1
Andarnans -
Delhi
l5121i 16813 ;
--
1025 12241 ,
i35(,uj 40109
Chadigarh
Dadar
Goa
I -+-
195 -
292 a
-+- ! -
i I-
I ---+-
-.
6809
338
Daman 11: 1 i Diu I
- i

2.5 The Progress of Consumer Cooperative Movement in India in the 1990's
The Eighth Five Year Plan proposed to promote and strengthen consumer
cooperatives to supply public distribution items and to build up a strong
consumer protection movement both in the urban and rural areas. While the
earlier Five Year Plans aimed at consolidating the consumer cooperative
movement, the Eighth Plan emphasised the need to involve consumer
cooperatives in mamtaming the price line and providing quality products to the
consumers at reasonable rates. During this Plan period it was proposed to cover
10,000 Primary Agricultural Cooperative Societies (PACS), Large-sized Multi
Purpose Societies (LAMPS) and Farmers' Service Societies (FSS) to undertake
distribution of consumer articles in the rural areas and to achieve an estimated
retail rural sales of Rs.4,400 crore by the terminal year of the Eighth Plan
(1997).
Table 2.8 shows that there are fluctuations in the growth of primary
consumer cooperative societies during the period 89-90 to 98-99. In 91-92
substantial growth was achieved in the number of stores, recording an increase
of 17.27 per cent. But, the sales turnover during this period increased only by
11.89 per cent. This may be due to the shift in consumer preferences towards
private Waders and supermarkets as a consequence of globalisation,
liberalisation and privatisation. In the later years, the sales volume increased,
but it cannot be attributed to the rise in unit sales, unless we know the price
factor and the rate of' inflation.

Table 2.8
Details of primary consumer cooperative stores in lndia during n~neteen nineties
Year I Ilo. of Stores I Total sales I I ln thousand) / (Rs. ~n Million /
Source: 1) National Cooperative Union of lndia (2000), Vision 2005, lndian Cooperative Movement. A profile, seventh edition, p.7.
2) Ram lqbal Singh (2000). Development of consumers cooperative movement- its future needs in the light of global changes in the economy, lndian consumer cooperator, Vo1.27, No. 2&3, April- September. P.5.

Figure 2.1
The growth of primary consumer cooperative stores in lndia during nineteen nineties
-- ~~~~ ~ .~ No. of Stores (fin hwsand) OTotal sales (Rs. in 4
~ p~~~
~ ~ ~~~-~ ~. ~
~~ ~~ -~~. ~ .- -2
So far we have reviewed the progress of consumer cooperative
movement in lndia with the support of available statistics on primary consumer
cooperative societies. In the succeeding paragraphs an attempt is made to
examine the growth of consumer cooperatives at the district, state and national
levels. As mentioned earlier, this discussion is presented after the discussion on
primary societies, because time series data for a lengthy span is available only
for primary consumer cooperative societies
2.6 District Wholesale Consumers' Cooperative Stores in lndia
The objective of wholesale consumers' cooperative stores is to secure the
economies of large-scale operations. As the primary stores were not in a
position to obtain the economies of wholesale buying, the wholesale stores were
organised in lndia. During World War I1 it was realised that a wholesale agency
with larger financ~al resources, more efficient management and greater business

ability would be more suitable to undertake the work of wholesale purchasing
from the producers and supply it to the primaly stores. Hence, attempts were
made to organlse District Cooperative Wholesale Stores with the object of
coordinating the purchases of primary stores in a district by making bulk
purchases from the producers or suppliers at proper time and then functioning as
central distributing agencies for their affiliated primary stores. (Goyal, 1972)'~.
During the perlod of controls, the wholesale stores acted as procurement
agencies for the government and d~stributed food grains to the primaries
Table 2.9
Progress of Consumer's Cooperative Wholesale Stores in India - ( 1949-50 to 1959-60
N o of Membership Sales I wholesale stores (Thousands) (Rs. lakh)
Source: Reports of the Reserve Bank of India, (various issues).
'' Goyal. S K (1972). ('on.strmer ('oq,eroirve Movemen1 In Ind~ci. Mcnakshi Prakashan. Merut . p 66

An All lndia Seminar on <:onsurners' Cooperation, convened by the All
lndia Cooperative Union (now National Cooperative Union of India) held at
Bombay m September 1960 recommended that wholesale societies may be
established in all the districts where there are about fifty retail primaries in order
to undertake the work of bulk purchases, manufacturing, processing, distribution
etc. The seminar also suggested that the district societies should also open
branches in those areas where there are no primary stores which may be
converted into primary stores later on.
The progress in the number of wholesale/central consumers' cooperative
stores in India is presented in Table 2.10.
Table 2.10
Progress of CentralIWholesale consumer cooperative stores in lndia during the period 1960-6 1 to 1988-89
Total number of stores
Pradesh Jamrnu & Kashmir
9 9 9 9
Karnataka
Kerala I I 12 I I I I Contd .

I Madhya I
: Pradesh I
1 Maharashtra ! I / 33 / 40 ) 68 83 1 I00 1 93 1 103 1 1 1 1 I -4-
Meghalaya ! I
I Man~pur -- M~zoram I 2
Puniab I6 15 16 16 16 16 16
a a s a n
- PI 1 1 8 - 1 I9 1 2 ; 12: 12: 12: 1 2 ; I Slkkim
i ~ r i ~ u r a I 1 ~ 1 1 ' ~ 1 I + -~
Utter Pradesh
9 4 1 52 54 57 60 60 60 60
W.Benga1 8 23 29 29 28 28 28 29 29
Source: National Cooperative Union of India, Analytical study of consumer cooperatives in India 1960-6 1 to 1988-89 (2nd Plan - 7Ih Plan) -Data series. New Delhi p. 127

As evident from Table 2.10, the number of wholesale/central consumer
cooperatwe stores in lndia increased from 75 in 1960-61 to 631 in 1988-89. In
the year 1988-89. Maharashha state had the maximum number of wholesale
stores - ( I I I stores) followed by Bihar (92 stores) and Uttar Pradesh (60 stores).
The progress made by wl~olesale stores since 1989-90 is presented in
Table 2.1 l
Table 2.1 I
Within the period of eight years (1989-90 to 1996-97), the total sales of
Progress of Wholesale Consumers' Cooperatives in India (1989-90 to 1996-97)
whole stores in India has recorded an increase of 80.14 per cent. But the
93-94
No.of Whole sale stores 635 , 756
++ Total sales 1 158 1 1228 / 1232 1247 1552
C . - - - - b + Per cent of profit making 1 37 45 stores
percentage of profit making stores has declined from 47 per cent in 1989-90 to
37 per cent in 1992-93, later improved to 48.50 per cent in 1995-96 and by the
Source: National cooperative Union of India (2000), Vision 2005, Indian Cooperative Movement: A Profile. seventh edition, New Delhi, p.21.
94-95
666
1632
46
end of 1996-97, the number of profit rnaking wholesale stores declined to 44.30
per cent. The frequent fluctuations in the profitability of wholesale consumers
95-96
676
cooperative stores is due to frequent changes in the policy towards consumer
96-97
, 696
cooperatives and the resultant consequences.
1952 / 2086
48.5 44.3

2.7 State cooperative Consumer's Federation
All lndia Semmar on Consumer's Cooperation (1960) recommended
that, at the state level, there shouid be an apex marketing and supply society to
coordinate the activities of district supply and marketing societies and to assist
them in the procurement of supplies and development of consumers'
cooperatives. They should also engage themselves in the inter-state and import
trade. In order to brmg about an integration and close link between the
consumers, marketing, processing and industrial cooperatives, all of them
should be the members of the district society also.
The main functions of State Consumer's Cooperative Federation are:
Promote consumer cooperatives in the respective state.
a Procure bulk quantity of consumer goods and supply to member institutions.
Assist and guide member institutions for facilitating their working.
a Act as agent of govenunent for distribution of essential consumer items.
a Liaison with government and other financing institutions
The progress of state cooperative consumer federations in India is
presented in Table 2.12.
From table 2.12 it is seen that at present there are 29 state level
federations in the country. This includes federations exclusively for the states
and a few federations for the ur~ion territories. Their membership position

which stood at 1578 in 1973-74 ~ncreased by 10.73 times in 1999 and reached
17942. Similarly total sales also recorded an increase of 17.87 times over the
years.
Table 2.12
Progress of State Cooperative Consumers' Federations in India (1973-74 to 1998-99)
(Amount Rs. lakh) .-
Number 29 29 29 +-
Membership 1578
8 1.07
i-
Source: ( I ) National Cooperative Union of lndia, Analytical study of consumer cooperatives in India, 2"* Plan - 7Ih Plan, Data Series, New Delhi, p. 135.
(2) National Cooperative Union of lndia (2000), Vision 2005, lndia Cooperative Movement: A Profile, p.28.
These trends exhibit the public support and popularity enjoyed by the
State Cooperative Consumer Federations. The government participation which
stood at 71.93 per cent in 197:3-74 reached the maximum in 1988-89 (87.36)
and came down to 74.70 in 1994-95 and later improved to 81.07 in 1998-99.

2.8 The National Cooperative Consumers' Federation of lndia Limited (NCCF)
The NCCF. which was organised by the state level federations in 1965,
started functioning from January 1966. The National Cooperative Consumers'
Federation of lndia Limited (NCCF) the apex body of consumer cooperatives in
the country 1s govenied by the Multi-State Cooperative Societies Act, 1984. The
main objectives of the NCCF are to provide support to the member's in
particular and other consumer cooperatives in general for distribution of
consumer goods of daily use besides rendering technical guidance and
assistance for improving and increasing their operational and managerial
efficiency. The commercial operations of the NCCF are undertaken through its
headquarters at New Delhi and 32 brancheslsub branches/processing units
(1 999) located in different parts of' the country
The business turnover of National Cooperative Consumers Federation is
presented in Table 2.13
Table 2.13
Sales turnover of National Cooperative C:onsumers Federation (1974-75 to 1991-92
(Rs. crore)
1 Year / Sales Turnover 1
1988-89 1 W::: 1 199 1-92 -
Source: (1) Natioanl Cooperative Union of lndia, Analytical study of consumers cooperatives in lndia 2"d plan-7"' Plan, Data Series, p. 183.
(2) Government of lndia (1993), Cooperative movement in lndia - A statlst~cal profile, p.87

Table 2.13 shows that the business turnover of the National Cooperative
Consumers Federat~on declined since 1984-85. Since 1983-84, it started
incumng losses. The main reasons attributed were uneconomic business deals,
higher admrnlstratrve and establ~shment expenses and witl~drawal of the scheme
of distr~but~on of controlled cloth (Ram Iqbal Singh, 2000)': In later years, as a
result of the rnrtratron of varlous measures such as divers~ficat~on of commerc~al
activities, reduct~on in administrative cost by relieving the surplus staff through
voluntary retirement scheme, closing down of loss making branches and
adoption of various austerity measures etc. the NCCF started showing
improvement from 1993-94 onwards
The NCCF has achieved a record sales of Rs.403.79 crore and earned a
net profit of Rs.4.44 crore during the year 2000-2001 as compared to the sales
turnover of Rs.3 12.19 crore and net profit of Rs.2.78 crore achieved during the
year 1999-2000.'" The increased sales turnover during 2000-2001 resulted in a
gross margin of Rs. 16.17 crore as against Rs. 13.20 crore during the previous
year. The total expenditure of the Federation during 2000-2001 was of the order
of Rs.12.53 crore as compared to Rs. 12.59 crore in the previous year. The
reduction in expenditure was on account of the savings in interest cost due to
settlement of loans and consequential reduction in the loan liability,
In the year 2000, the government of India has introduced "sarvapriya" a
National Scheme for distribution of a few consurner goods of daily use such as
pulses of different varreties, salt, tea, toilet soap and detergent cake, edible oil
l 3 Ram Iqbal Singh (2000) '.Welcon~e Address on the Inaugural function of the 34' Annual Meeting of the gcneral body of NCCF"'. lndinn Consitmer Cooperoror, October- December 2000. P.22.
I 4 NCCF (200 1 ) Annirrrl /{epor/ (!fNrirrr~nol ('oo/)erorive ('onsirmers ' I~tderorion oj'Indin,fi~r /he Annirrrl General Hod), Meeting hcld on 30-1 0-200 1

and exercise note books through the network of 4,50,000 ration shops, retail
outlets of cooperatives and Civil Supplies Corporations all over the counhy for
the benefit of people living below the poverty line. The NCCF has been
nominated as a nodal agency to execute the schemeI5.
Consultancy and Promotional Cell (CPC)
The NCCF, as a National Federation has also been providing consultancy
services to the consumer cooperatives since 1972 for improving their
operational and managerial efficiency through its Conslutancy & Promotional
Cell (CPC) set up with the financial support of the Central Government. The
technical guidance is being provided in the field of management accounting
system, wholesale and retail management, setting up of self-service department
stores, education and training including preparation of project reports for
modemising retail operations and rehabilitation of sick and weaker consumer
cooperatives through its Regional Offices at New Delhi, Kolkatta, Chennai, and
Mumbai.
The remaining section of this chapter is earmarked for discussing the
origin, growth and the current status of the consumer cooperative movement in
Kerala. As mentioned earlier, the consumer cooperative movement in the state
is of a three-tier structure consistiog of primary stores, district wholesale stores
and the state level federation.
2.9 Consumer Cooperative Movement in Kerala
The present Kerala State was formed on I" November 1956 by
amalgamat~ng two pr~ncely states, Travancore and Cochin and the Malabar
" The H~ndir (2000) ..Reforms in PDS". i0Ih July. Kochi. p.5
district under Madras presidency The first consumers' cooperative society in
Travancore was the Thiruvananthapuram Cooperative Distribution Society Ltd.
which was registered in 1914. Soon consumers' cooperatives were registered in
several taluks in the Travancore state. The movement did not show vitality and
strength in normal times but when the World War I1 broke out and the system of
control was introduced, the people both in urban and rural areas recognised the
benefits of the consumers' stores (Goyal, 1972)".
The first consu~ners' cooperative store in Cochin was registered in 1917.
The growth of consumer cooperative societies in Cochin state also got a real
fillip with the outbreak of World War 11. Whereas in the pre-World War 1 years
the number of stores in Cochin state stood at 18, in 1932 it was 51 and in 1947 it
rose to 124(Goyal. 1972)".
2.10 Primary Consumer Cooperatives in Kerala
As we did in the case of national scenario, at the state level also the
discussion on progress of consuirier cooperative movement should start with
primary level societies. But availability of basic information relating to primary
societies was a very difficult task and hence the discussion is arranged at two
levels based on data availability. In the first phase, we have data from 1956 to
1977 but not at regular intervals. The second phase consists of data from 1982-
83 to 1994-95 at regular intervals. Secondary data on consumer cooperatives in
Kerala since 1994-95 are not yet available (2001) due to various reasons. Little
scattered information was available for 1998 from the joint statement issued by

the Department of' Cooperativt:~, Government of Kerala and the State
Cooperative Un~on, Kerala.
Table 2.14 gives the progress of consumer cooperative movement in
Kerala between 1956 and 1977.
Table 2.14
Progress of P r ~ m a ~ y Consumer Cooperative societies in Kerala (1956-1977) (Rs. lakh)
p.94. (2) Government of India (1968), Report of the Working Group -
Cooperation, Administrative Reforms Commission, p. 124.
I Particulars 1956 1957 1960
Number of 181 stores
38852
Paid-up share 1 5.71 7.05 capital (Rs. in; lakhs) ! -+-
(Rs. lakh)
(Rs. lakh) i
(3) Government of Kerala, Handbook on Cooperative Movement in Kerala, Registrar of Cooperative Societies, (various issues).
Table 2.14 shows that there was a decline in the number of primary
Source:(]) Annual Reports, quoted from Goyal S.K. (1972), Consumer Cooperative Movement in India, Meenakshi Prakashan Meerut,
1966
294
78068
19.65
N.A
673.04
consumer cooperative stores in 1960 mainly due to liquidation. However, the
sales turnover of the primary consumer cooperative stores in the state recorded
1970
336
1 1 1189
33.01
94.55
1066.55
steady increase throughout the period. Regarding the membership in primary
1977
325
134140
54.37
N. A
1655.41

consumer cooperative stores, the average number of members per store was 134
1n 1956, which ~ncreased to 229 in 1957 and later fall to 215 in 1960. From
1966 to 1977 there was growth in the average number of members in primary
consumer cooperative stores in Kerala. In 1976-77, the average membership in
a primary consumer cooperative store in Kerala was 413
The progress made by the primary consunler cooperative stores from the
years 1982-83 to 1987-88 is presented in Table 2.15.
Table 2.15
Progress of primary cooperative stores in Kerala (1982-83 to 1987-88)
No. of Branches
No of profit earning stores
No of societies
Source: Government of Kerala, Handbook on Cooperative Movement in Kerala. Registrar of Cooperative Societies, (various issues).
Table 2.15 shows that except in the year 1985-86 there was consistent
increase in the number of primary consumer cooperative stores. In 1983-84
there was an increase in the number of members over the previous year, but the

succeeding two years has recorded a decline in membership. The average
membersh~p in a prnnary store which stood at 484 members in 1982-83 declined
to 458 members in 1987-88. The. average paid up capital of the primary stores
increased from Rs.0.28 lakh in 1982-83 to Rs.0.38 lakh in the year 1987-88.
The sales turnover dur~ng the period 1982-83 to 1987-88 increased by 55.89 per
cent. The cost of management has also recorded an increase of 74.88 per cent
over the period of six years. Regarding profitability, 37.32 per cent of the
primary stores in Kerala had generated profit in 1982-83, but in 1987-88 the
number of profit makmg societie!~ declined to 32 per cent. On the other hand
the number of dormant societies has increased from 19.37 per cent to 32.25 per
cent.
The progress of primary c:onsumer cooperative stores from 1988-89 to
1994-95 is presented in Table 2.16. The progress in the number of primary
consumers' cooperative stores in Kerala as shown in Table 2.16 reveals that
there was 113.73 per cent growth in the primary consumers' cooperative
societies over the period of seven years from 1989 to 1995. In 1989,
Thiruvananthapuram district, (16.34 per cent) had the maximum number of
primary consumers' stores, followed by Kannur district (15.90 per cent).
During the year 1992-93, there was a significant expansion in the primary stores
in Kerala. As conipared to 1991-92 there was more than 100 per cent increase
in the number of primary stores in ldukki, Thrissur, Kozhikode, K a ~ u r and
Kasargode districts during the year 1992-93. One of the probable reasons for
this trend may be the political tactics to capture the governance of cooperative
socie~teis as a consequence of polltical changes at the state level administration.

Table 2.16
Progress in number of Primary Consumers' Cooperative Stores in Kerala ( 1988-89 to 1994-95)
Name of D~strict
1990-9 1 199 1-92 1992-93 1993-94 1994-95 --- I Th~ruvananthap 75
uram I 76 I 78 127 I
130 1 140
Source: Govenunent of ~e ra l aTHand Book on Cooperative Movement in Kerala, Registrar of Cooperative Societies, Kerala (Various issues).
Since 1993, Kannur district tops in the list of primary consumers stores
having 171 stores accounting for 17.43 per cent of the total primala, stores
during 1994-95, followed by Thiruvananthapuram district with 140 stores which

accounts for 14.27 per cent of the total primary stores in 1995. Wayanad district
with 1.83 per cent and Pathanan~thitta district with 2.34 per cent of the total
primary stores had the lowest pos~tion in 1995
Table 2.17 Primary Consumer Cooperative Stores in Kerala - Progress in Membership
( 1988-89 to 1994-95) -- I-- / n I
(Membership in '000)
Name of I
D~shict
-+--
Kottayam 1 9 . 4 6 9.19 -- C--
-
Ernakulam 29.03 29.94 -- Kozhikode 1 15.40 16.94 I 16.63 16.49 18.20 19.38 19.48
-1--
Wayanad ! 3.00 3 . 303 3.66 3.71 4.13 4.23 -c--
Kannur 1 42.60 44.58 45.96 46.89 52.15 52.17 54.01 t-- -
Kasargode i 8.91 9.06 1 9.04 9.34 9.44 10.54 10.23 A- -
Total 1 213.43 205.54 21 1.39 209.21 242.82 255.66 268.63
Source: ~ o v e r n r n e n t o f ~ e r a l c Hand Book on Cooperative Movement in Kerala, Registrar of Cooperative Societies, Kerala. (Various issues)

As evident from table 2.17, the membership in primary consumers'
cooperative societies increased from 2.13 lakh in 1988-89 to 2.68 lakh in 1994-
95. However, the average number of membership in primary stores in Kerala
declined from 464 in 1988-89 to 273 in 1994-95. From 1988-89 to 1994-95
Kannur district had the maximu~n number of members, followed by Ernakulam
and Thiruvananthapuram districts. The average number of members in primary
stores in these districts also declined since 1992-93; the year in which there was
great Increase in the number of primary stores in Kerala. In 1991-92, the
average number of members in a primary consumers' store in Kannur district
was 609 which exceeded the state average of 406 members. In 1994-95, while
the state average declined to 273, the average membership in primary
consumers' stores i n Kannur d~shict also declined to 3 16. The decline in the
number of members in primary consumers' cooperative societies is likely to
affect the smooth functioning of people's organisations like consumers'
cooperatives.
Table 2.18 explains that the average paid up capital of a primary
consumers' society in 1988-89 .was Rs.32,961. In 1994-95, it declined to
Rs.25.368. The narrowing capital base of the primary consumers' cooperative
societies indicate the weakening of the consumers cooperative movement in
Kerala. The district wise analysis of total paid up capital reveals that Ernakulam
district had the maximum paid up capital in primary consumer cooperative
stores in Kerala. The average paid up capital in Ernakulam district was Rs. 1.21
lakh in 1995 as against the state average of Rs.0.25 lakh. The ldukki district
with 83 prlmary stores in 1995 had the lowest average paid up share capital of
Rs.0.06 lakh, which was Rs.0.09 lakh in 1989.

Table 2.18 Total pa~d up cap~tal of prtmary consumer cooperative stores in Kerala
( 1988-89 to 1994-95)
I Thiruvananthag I I warn
' 17.54 / 17.61 1 8 . 8 8 1 19.07 ! 23.57 / 25.10 / 29.36 / I
--- (Rs. lakh) Name of i 8 9 9 0 9 - 1992- 1993- 1994- District 1 89 91
ldukki 2.90 2 . 9 2 i 3.11 1 2 . 9 3 1 5 . 2 1 1 5 . 2 8 1 4 . 6 0 1
-+-- 92
Wayanad I 369 1 4.01 1 4.93 i 4.98 1 6.25 1 8.65 1 7.52 1
13.02
4.10
4.84
13.84
' 10.28
3.41
3.1 1
13.94
Kollam 1 10.03 10.16 / 11.41
P a t h a n a m t h i t t < i e 3.78
93
Alappuzha 1 2.25
_____t__ Ernakulam 1 ::r] 4072 4;:
The total sales turnover made by the prinnaly consumers' cooperative
15.18
4.16
5.78
14.44
2.17
53.50
10.04
9.69
15.22 -
18.08
Kannur 28.00 -t--
Kasargode
Total
stores had also recorded steady growth except i n tile year 1992-93. As shown in
94
20.23 '
4.19
6.83
14.33 1- -
Kottayam 1 I I 90 1 10.79 1 11.57 I-
10.30
1 1 . 1 1
13.62
Thrissur 10.23 1 8.97 ----- 1 ::ti 7.72 1 7.76 Palakkad
Table 2.19, the sales tunlover of Ks.953 1 . 1 1 lakh in 1994-95 was 143.26 per
95
58.95
10.04
10.99
15.24
19.97
Malappuram 9.60 --
Kozhikode 12.01 13.46
Source: on cooperative Movement in Kerala, Registrar of Cooperative Societies, Kerala. (Various issues)
29.68
5.49
cent higher than the turnover of Rs.3918.02 lakh achieved in 1988-89.
58.01
14.44
10.98
15.08
21.12 3
11.65
15.22 --- -
35.62
6.55
30.71
6.42
248.86
33.06
7.06
181.98 1 214.49 234.50

Table 2.19
Total sales turnover in the primary consumers' cooperative stores in Kerala ( 1988-89 to 1994-95)
(Amount Rs. lakh)
Name of District
1 199 1-92 1992-93 1993-94 1994-95
Thiruvanantha- puram
878.36 249.98 216.09 353.13
C-- Kollam 289.47 279.87 356.67 458.26
Pathanamthitta 28.15 22.55 75.89 61.20 66.28
Alappuzha 38.03 56.83 75.19 76.02 86.48
Kottayam
ldukki 10.91 2 6 . 1 7 35.57 37.00 36.71
Emakulam 769.03 789.03 785.55 1061.86 1523.09
Thrissur 1694.68 1627.17 2145.23 2332.43 --
Palakkad 188.30 181.55 233.36 262.99
Kozhikode
Wayanad +- Kannur
Total I
Source: Government of Kerala, Handbook on Cooperative Movement in Kerala, Registrar of Cooperative Societies, Thiruvananthapuram, (various issues).

The profitab~lity of the primary consumers' cooperative societies in each
district is available from Table 2.20.
Table 2.20
The percentage share of profit niaking primary consumer cooperative stores (1988-89 to 1994-95)
Alappuzha
District 1988-89 1989-90
ri:~:anth{~~+~ puram - -
Kollam / 12 50 20 00
Palakkad 354s 1 29.03 j 25.81 1 15.15 1 17.50 1 9.09 1 18.87 1 I --I-
199 1-92
23.08
14.55
1990-9 1
28.95
12.73
1--
Kottayaln 1 1 0 q ~ ! 22.58 4--- --
Kozhikode I
Wayanad 27 27 1 33 33 40.00 25.00 35.29 16.67
Kannur 52 63 33 77 15.98 16.96 14.62
1992-93
12.60
9.62
ldukki 12.12 8.82 7.23 3.61 9.64
Emakulam 47.37 46.15 45.83 42.86 35.42
Thrissur 26.09 25.00 15.52 5.26 15.52
12.90
Total 28.54 27.79 1 31.35 1 22.91 1 15.23 1 19.58 / 25.79 1 - L -- 1-1
1993-94
17.69
5.56
3.03
Kasargode 1176 JF- 4-
Source: Government of Kerala, Handbook on Cooperative Movement in Kerala, Regist~ar of Cooperative Societies, (Various issues).
1994-95
32.86
30.63
11.43
11.76
8.82
7.41 10.94 10.77 10.45

The percentage of profit laakmg primary stores had shown variations
during the period 1988-89 to 1994-95. 31.35 per cent of the prilnary stores in
the state earned profit during 1990-91. But in the year 1992-93 the share of
profit making societies declined to just 15.23 per cent. Among the districts,
Kozhikode distr~ct had the maximum number of profit making stores, viz. 57.89
per cent in 1988-89. Ernakulam and Kannur districts had the second and third
position respectlveiy. In 1994-9:5 also, Kozhikode district continued its lead
over other districts in the number of profit making primary consumers'
cooperative societies. with 67.33 per cent of the total stores running on profit.
With 35.42 per cent stores runni~ug on profit, Ernakulam district stood second,
while Thiruvananthapuram district with 32.86 per cent of the total primary
stores earnmg profits, recorded tht: thlrd position.
As mentioned earlier, till March 2001, the Handbook on Cooperative
Movement in Keraia, published by the Registrar of Cooperative Societies, was
released only up to 1994-95 and hence later statistics are not available. But
certain details relating to 1998 published by the Department. of Cooperation,
Government of Kerala and the State Cooperative Union, Kerala are available.
According to these documents, the status of primary consumer's cooperative
societies were as given in table 2.2: 1
As compared to 1995, there was a fall in the number of primary
consumers' cooperative societies from 981 to 915. The number of members
also reduced from 2.68 lakh in 1995 to 2.53 lakh in 1998. However, there was
some marginal improvement in the average number of members. The average
number of members increased from 273 in 1995 to 277 in 1998.

Table 2.2 1
Status of Pr~mary Consumers Cooperative Societies in Kerala as on 3 1-3-1998
I-- -
1 No.of Pr~lnary Consumer's Societies
253496
Share capital : Total (Rs. lakh) C -.
Government (Rs. lakh) I 152 1 Value of sale of consumer goods (Rs. lakh) 1 28509 ( Profit maklng societies (number)
Profit made by societies (Ks. lakh)
Loss maklng societies (number) I 508 / Loss made by societies (Rs. lakh) 1 500 1
/ Number of societies without profit or loss 1 312 1 Source: Government of Kerala, Department of Cooperation and the State
Cooperative Union, KeraYa (Pamphlet).
Total paid up capital of the primary consumers' cooperative societies has
remarkably increased from Rs.249 lakh in 1995 to Rs.871 lakh in 1998. The
percentage of government's contribution to the share capital of primary societies
has fallen from 35.16 in 1995 to 17.45 in 1998, in the wake of liberalisation
process. The sales turnover achieved by the primary stores rose to Rs.285.09
crore in 1998. recording an increase of 199.12 per cent as compared to 1995.
The number of profit making stores as a percentage of total number of primary
consumer's cooperative stores reduced from 25.79 per cent in 1995 to 10.38 per
cent in 1998. The fall in the nu~nber of profit making societies even after a
notable increase in the sales tunlover may be due to the increase in
establishment expenses and fall in unit profit margin. The percentage of

dormant soc~eties has declined fro111 36.29 in 1995 to 34.09 in 1998. Out of 915
primary consumers societies, 558 societies, constituting 55.52 per cent of the
total number of socletles were running on loss in 1998.
Evaluating the performance of primary consumers' cooperative societies
in Kerala, it is felt that while the number of societies are on an increase, the
number of profit making societies and the rate of profit are declining over the
years. Naturally, this requires more detailed thinking and analysis which is
attempted in the later chapters.
2.11 District Wholesale Consumers' Cooperative Stores in Kerala
Along with primary societies, district wholesale stores were also started
in Kerala. In the earlier years. they had effective linkages with the primary
societies but later they became exclusive stores even doing retail business
through their various branches.
The progress of district wholesale consumer cooperative stores in Kerala
between 1956 and 1985 is available from table 2.22. Developments since 1985
are explained later. From this table it is seen that the number of stores stood at
two in 1956. increased to 10 within a span of ten years and later became 1 1 in
1985. The membership position which stood at 288 in 1956 reached 49000 in
1974 and later declined to 32000 i n 1985. A point to be noted here is the erratic
variations in the membership position. For instance, the number of members
which was 288 in 1956 increased to 1147 in 1957 and later declined to 263 in
1960. The erratlc variations in riiembership may be due to the changing
preferences and attitudes of the members towards the store.

Table 2.22
District Wholesale Consumers Cooperative Stores in Kerala (1956-1985)
(Rs. lakh) - 1960 1966 1974 1978 1985
umber of I 10 10 1 1 I I
embership 288 1147 263 31000 49000 44000 32000
Rs. lakh)
Rs. lakh)
Cooperative Moverner~t in lndia, Meenakshi Prakashan Meerut, p.94.
(2) National Cooperative Union of lndia, Analytical Study of Consumers' Cooperatives in lndia 1960-6 1 to 1988-89, Data series, New Delhi, p. 129-132.
(3) Government of Kerala, Handbook on Cooperative Movement in Kerala. Registrar of Coloperative Societies, (various issues).
An important indicator in order to assess the performance of consumer
cooperative store is its sales tunlover. Data relating to the sales turnover
suggest that there is notable increa:se in the sales turnover over the years. But a
judgement on sales performance cannot be arrived immediately because sales
turnover is a function of multiple factors

Table 2.23
Performance of wholesale Consumer's Cooperative Stores in Kerala ( 1985-86 to 1994-95
Share capital by
Working 1 79 I 06 W,7.10 974,
Amount of
i No, of loss 1 , ,(, making stores I
I I I I
-- Amount 7 188.92 (Rs. lakh)
.. ---i
No.of socict~cs 1 i or loss I
I I
Source: Govenunent of Kerala, Handbook on cooperative movement in Kerala, Registrar of Cooperative Societies (various issues).
485.48
0
13
354.62
0
I I
784.31
2
10
330.10
I
10 10
234.77
I
132.21
1

The number of wholesale consumer's cooperative stores in Kerala has
increased from 12 in 1985-86 to 14 in 1990-9 1, as a result of re-organisation of
the state Into 14 revenue districts. The trends regarding the number of branches
managed by the distr~ct wholesale stores reveal that since 1989-90 there was
gradual decline in the number of branches. The growth in the membership of the
wholesale stores was maximum during the year 1987-88 as the average number
of members in a store increased from 2897 in 1986-87 to 3557 in 1987-88. With
the format~on of two new wholesale stores, the average number of members in a
store decreased to 3 128 in 1990-9 I
Total paid-up share capitel and the contribution by the government
towards the share capital of the stores have recorded continued growth. The
average paid up share capital of a wholesale store increased from Rs. 14.82 lakh
in 1985-86 to Rs.20.31 lakh in 1989-90 and to Rs.27.84 lakh in 1994-95. The
percentage of the share capital cor~tribution by the govenunent towards the total
paid up capital of the wholesale stores increased from 88.74 per cent in 1985-86
to 90.54 per cent in 1990-91, but later declined to 83.89 per cent in 1994-95.
The participation by the government in the total paid up share capital of the
wholesale stores is still strong in Kerala compared to the national average of
14.30 per cent (Herath 1999)".
Total sales turnover continued to decline since 1985-86 to 1988-89. In
1985-86, the total sales turnover was Rs.2571.79 lakh, which declined to
Rs. 1878.42 lakh in 1988-89. The sales turnover was maximum during the year
1993-94,in which it reached Rs.2'732.06 lakh. It is surprising to observe that
I n Herath W.U. (1999) Hccent 7'rend.s c!f uon.s,rmer C'oopernrion in Asin and the I1noijic_ ICAROAP. Nc\v Dclhi P 63.

not a s~ngle store could make profit in 1985-86 and 1987-88. This may be due
to the mismatch between sales turnover and establishment cost. Since 1992-93,
three stores were able to maintair~ profits, but the maximum average profit per
store was only a nominal amount of Rs. 1.35 lakh. The number of loss making
stores and the ~nc~dence of loss per store is high as compared to the profit
making wholesale stores in Kerala The number of loss making stores varied in
between 10 and 13 during the period of study. The average amount of loss in a
wholesale store was maximum during the year 1991-92.
2.12 The Kerala State Cooperative Consumers' Federation Limited (KSCCF, also known as Consumerfed)
The apex federation, Consumerfed was registered and started its
functioning in 1965. The objectiv~es of KSCCF as per bylaw are primarily to
coordinate and facilitate the working of affiliated societies and to assist in the
production, organisation and development of consumer cooperatives in Kerala.
Table 2.24
Progress of Kerala State Cooperative Consumers' Federation Limited 1'374- 1989)
Part~culars
Paid-uo share caoital 124.80 125.96 172.40
State government's contribution1 6.50 1 60.36 1 61.52 1 107.85 1 Itowards the share ca~ltal
Working capital
Sales turnover
Net profitfloss Source: (1) National Cooperative Union of India, Analytical Study of
Consumers' Cooperative in India 1960-61 to 1988-89, Data Series, New Delhi, p. 177.182.
(2) Government of Kerala, Handbook on Cooperative Movement in Kerala, Registrar of Cooperative Societies, (various issues).

The paid-up share capital of Kerala State Cooperative Consumers'
Federation ~ncreased by 19.13 t~lnes during the period 1974-1989. The state
government's contribution to the share capital was 72.14 per cent in 1974,
which later declined to 48.37 per cent in 1981 but further improved to 62.56 per
cent in 1989. Though there was a decline in the share of the state government in
the paid-up capital of Consumerfed, the contribution by the govenunent to the
Kerala Cooperative Consumer's Federation has recorded an increase of 9.29
times in 198 1 and 16.59 times in 1989, over the period from 1974. The sales
turnover made by the Consumerfed in 198 1 recorded a growth of 153.61 per
cent over the seven year period from 1974. In 1985 and 1989 the sales turnover
recorded a fall compared to the sales turnover made in 198 1. Later developments are ava~~lable from Table 2.25.
Table 2.25 Average monthly sales of Consumerfed during the period 1990-91 to 1997-98
(Rs. Lakh)
1 1 i I Growth rate in I
1 1997-98 1 724878 604.06 149.35
Source: Annual Reports of Keral,a State Cooperative Consumers' Federation (Various years).
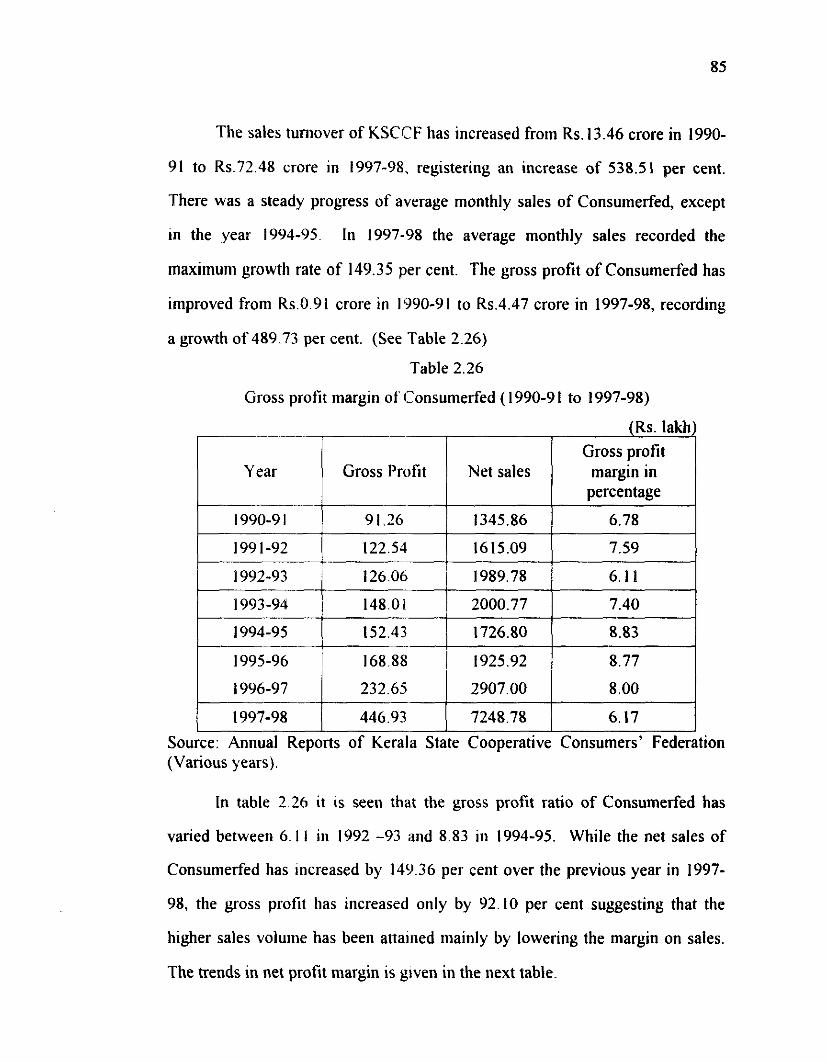
The sales turnover of KSCCF has increased from Rs. 13.46 crore in 1990-
91 to Rs.72.48 crore in 1997-98, registering an increase of 538.51 per cent.
There was a steady progress of average monthly sales of Consumerfed, except
in the year 1994-95 In 1997-98 the average monthly sales recorded the
maximum growth rate of 149.35 per cent. The gross profit of Consumerfed has
improved from Rs.0.91 crore in 1990-9 1 to Rs.4.47 crore in 1997-98, recording
a growth of 489.73 per cent. (See Table 2.26)
Table 2.26
Gross profit margin of Consumerfed ( 1990-91 to 1997-98)
Rs. lakh
r e a r Gross Profit Net sales margin in percentage
In table 2 26 it is seen that the gross profit ratio of Consumerfed has
1997-98
varied between 6.11 in 1992 -93 and 8.83 in 1994-95. While the net sales of
Consumerfed has increased by 149.36 per cent over the previous year in 1997-
Source: Annual Reports of Kerala State Cooperative Consumers' Federation (Various years).
446.93
98, the gross profit has increased only by 92.10 per cent suggesting that the
higher sales volume has been attai~led mainly by lowering the margin on sales.
7248.78
The trends in net profit margin is given in the next table
6.17 1

Table 2.27
Net profit margin of Consumerfed ( 1990-9 1 to 1997-98)
(Rs. lakh)
1 Year Net profit margin
1 996-97 4 5 5 1 2907.00 1 0.16
1997-98 14.43 7248.78 0.20
Source: Annual Reports of Kerala State Cooperative Consumers' Federation (Various years).
The trends reveal that the incidence of net loss as a percentage of sales
was maximum during the year 1990-91, being 1.06 per cent of net sales. The
Consumerfed continued to incur net loss during the two subsequent years and
also in 1995-96. These facts reassure our earlier claim that the rate of profit of
the Consumerfed is gradually declining as in the case of primary stores due to a
fall in the rate of sales turnover followed by an escalating rate of establishment
cost.
In this chapter we have examined the growth of consumer cooperative
movement in India at the macro level. Initially the growth in the movement for
the entire country was examined. later followed by the state level discussion.
The macro analys~s reveals that the consumer cooperative movement in the
country is making a steady progress over the years. Eventhough these are the
facts at the nat~onal level or even at the state level, the store-wise performance

may be different. Individual sto,res may be struggling due to various reasons
including the threat from globalisation, liberalisation and privatisation. It is also
felt that there are regional differences in the performance of primary consumers'
cooperative stores also. For instance, over the years, the number of primary
consumer cooperative stores in the northern region steadily increased, while the
growth in the southern region IS very low. Hence it is appropriate to examine
the financial perfomance of selected stores at the regional level in order to get a
more detailed picture.