development of stimuli-responsive degradable block ... · sensitive degradable micelles having...
TRANSCRIPT

Development of Stimuli-Responsive Degradable Block Copolymer
Micelles as Smart Drug Delivery Nanocarriers
Behnoush Khorsand Sourkohi
A Thesis
in
the Department
of
Chemistry and Biochemistry
Presented in Partial Fulfillment of the Requirements
for the Degree of Master of Science (Chemistry) at
Concordia University
Montréal, Québec, Canada
July 2013
© BEHNOUSH KHORSAND SOURKOHI, 2013

CONCORDIA UNIVERSITY
School of Graduate Studies
This is to certify that the thesis prepared
By: Behnoush Khorsand Sourkohi
Entitled: Development of Stimuli-Responsive Degradable Block Copolymer Micelles as
Smart Drug Delivery Nanocarriers
and submitted in partial fulfillment of the requirements for the degree of
Master of Science (Chemistry)
complies with the regulations of the University and meets the accepted standards with
respect to originality and quality.
Signed by the final examining committee:
Chair
Examiner
Examiner
Supervisor
Approved by
2013
Chair of Department or Graduate Program Director
Dean of Faculty
Dr. Judith Kornblatt
Dr. Christine DeWolf
Dr. Peter D.Pawelek
Dr. John Oh
iii
Abstract
Polymer-based drug delivery systems offer the potential to increase the
bioavailability of drug molecules without leaving toxic byproducts in the body. In
particular, micellar aggregates based on amphiphilic block copolymers (ABPs) consisting
of a hydrophobic core and a hydrophilic corona can enable the physical encapsulation of
poorly water-soluble drugs. These micelles possess several advantages as drug delivery
carriers due to their colloidal stability and tunable sizes with narrow size distribution. In
addition, their physicochemical properties and small size enable passive tumor targeting
through the enhanced permeability and retention effect. Also their chemical flexibility
allows them to be tailored for active targeting. One additional benefit of using ABP-based
micelles is that they can be engineered to incorporate stimuli-responsive moieties to
control release of encapsulated drugs as a result of micellar degradation in response to
external triggers such as pH, thiols and temperature. With this knowledge, ABP micelles
can be designed with the ability to respond to stimuli that are inherently present in living
systems and release their payload before being evacuated from the body. Presence of pH
and redox gradients within the body makes them ideal stimuli in the design and
development of stimuli-responsive degradable micelles for controlled release of
therapeutics.
For better understanding of the structure-property relationship between
morphological variance and stimuli-responsive degradation, we have developed new pH-
sensitive degradable micelles having pendant t-butyl groups, as well as reductively
degradable ABP micelles with single disulfide linkages positioned in the center of
triblock copolymers, or with pendant disulfides positioned on the hydrophobic block.
iv
They were synthesized by atom transfer radical polymerization, a dynamic controlled
radical polymerization method enabling the synthesis of copolymers with narrow
molecular weight distributions and pre-determined molecular weights. Aqueous self-
assembly of ABPs resulted in colloidally stable spherical micelles capable of
encapsulating hydrophobic model drugs at above critical micellar concentration. Various
analytical methods were used to characterize ABPs and their micelles. The resulting
micelles in aqueous solutions were destabilized in response to acidic conditions or
reductive conditions, which suggests the possibility of enhanced release of encapsulated
compounds. Results show that degradable ABPs of varying architectures and designs,
upon the proper stimuli, will be dissociated at different rates, leading to a wide range of
morphologies and sustained release rates of the encapsulated molecules.
v
Acknowledgements
First and foremost, I would like to thanks my supervisor Dr. John Oh, for his
guidance, patience, support, and enthusiasm in working towards my M.Sc here at
Concordia. During the time I spent writing my thesis, his assistance and support were
irreplaceable and I appreciate that beyond words. He has been instrumental to my growth
as a researcher and to achieving my academic goals, and I am grateful for the
opportunities for learning and development that have been afforded to me over the last
two years.
I would also like to thank my committee members Dr. Christine DeWolf and Dr.
Peter D. Pawelek, for their continued support and guidance, as they were helpful and
supportive during each committee meeting in guiding my project with great suggestions
and ideas. Their advice has allowed me to overcome many difficulties and have made me
a better scientist. Their combined critical minds have provided me with the ability to
examine and solve problems in new ways.
Additionally, I would like to thank Dr. Louis Cuccia, who was a constant,
pleasant presence throughout my time at Concordia. I have appreciated his kindness,
support, and faith.
I was also extremely fortunate to have such amazing lab partners; working with
them has been a great experience. I could not have wished for a better group of people
with which to spend my time. Andrew, Samuel, Alexander, Nare, Nicky, Priya, Kaiwan,
Yasaman, Soyoung - thank you so much. I especially would like to thank Samuel
Aleksanian, who I shared many unforgettable times with and for all of his kindness and
vi
help, both inside and outside the lab, and for the fun times we have had. I would also like
to thank Dr. Nicky Chan, for time and effort he has extended to me to improve and
proofread my thesis. His vast knowledge of polymer chemistry has been both
inspirational and exciting. I would also like to thank Avid Hassanpour for her friendship
and for the fun and unforgettable times we have had.
I would like to thank my partner Pooya Rahimian for his amazing support,
kindness, and tremendous love and for always being in my corner. Finally, I would like to
thank my mom Nadereh, my dad Alireza and my brother Behnam, for always having
faith in me and encouraging me during hard times. They have always supported
everything that I have done, and have been the most significant mentors in my life.
Words cannot describe how much I appreciate the love and support you have given me.
These people each have taught me to be strong on my way to achieve my dreams and
goals.

vii
Dedication
This thesis is dedicated to my parents Nadereh and Alireza, who have enlightened my
journey on this earth with their endless love.
viii
Contribution of Authors
The bulk of the research in this thesis was conducted independently under the
supervision of Dr. John Oh at Concordia University. The material presented in Chapters
3, 4, and 5 have been accepted and published in a variety of well-respected, peer
reviewed journals.
Dr. Rolf Schmidt, in the Centre for NanoScience Research at Concordia
University, performed AFM measurements for the research presented in Chapter 4, Dr.
Qian Zhang performed the polymer synthesis presented in Chapter 5, and Danièle Gagné
and Christian Charbonneau, from the research group at the Université de Montréal
performed the flow cytometry and confocal laser scanning microscopy. The preparation
and editing of this thesis and of the aforementioned manuscripts were conducted under
the supervision of Dr. John Oh.
ix
Table of Contents
Contribution of Authors ............................................................................................................ viii
List of Figures ........................................................................................................................... xiii
List of Tables .......................................................................................................................... xviii
List of Abbreviations ................................................................................................................ xix
Chapter 1 .......................................................................................................................................... 1
Introduction .................................................................................................................................. 1
1.1. Brief overview of the research ......................................................................................... 1
1.2. Drug delivery in general .................................................................................................. 1
1.2.1. Pharmacokinetics of drug delivery .................................................................................. 1
1.2.2. Routes to elimination of drugs from the body ................................................................. 2
1.2.3. Drug targeting strategies .................................................................................................. 3
1.3. Polymeric-based drug delivery nanocarriers .................................................................... 4
1.4. Amphiphilic block copolymer micellar aggregates ......................................................... 5
1.4.1. Micelle stability ............................................................................................................... 8
1.4.2. Micelle size .................................................................................................................... 10
1.5. Stimuli-responsive degradation (SRD) strategy ............................................................ 10
1.5.1. pH-responsive degradable micelles ............................................................................... 13
1.5.2. Redox-responsive degradable micelles .......................................................................... 15
1.6. Scope of the thesis ......................................................................................................... 18
Chapter 2 ........................................................................................................................................ 20
Methodology: Synthesis and Characterization ...................................................................... 20
2.1. Brief description............................................................................................................. 20
2.2. Synthesis and characterization of well-defined ABPs ................................................... 20
2.2.1 ATRP as a means to synthesize well-defined ABPs ...................................................... 20
2.2.2. Molecular weight determination by gel permeation chromatography (GPC) ................ 23
2.3. Aqueous micellization and characterization .................................................................. 25
2.3.1. Preparation of micellar aggregates in aqueous solution ................................................. 25
2.3.2. Determination of critical micellar concentration (CMC) ............................................... 26
x
2.3.3. Characterization of size and morphology of micellar aggregates .................................. 27
2.4. Cellular interaction of ABP-based micelles ................................................................... 29
2.4.1. Cell viability................................................................................................................... 29
Chapter 3 ........................................................................................................................................ 33
pH-Responsive Degradable Micelles ......................................................................................... 33
3.1. Introduction .................................................................................................................... 33
3.2. Experimental section ...................................................................................................... 35
3.3. Synthesis of HO-POEOMA-Br macroinitiator .............................................................. 35
3.4. Synthesis of HO-POEOMA-b-PtBMA ABP ................................................................. 37
3.5. Hydrolytic cleavage of t-butyl groups in HO-ABPs ...................................................... 38
3.6. Aqueous micellization of HO-ABPs .............................................................................. 39
3.7. Destabilization of HO-ABP micellar aggregates in acidic condition ............................ 41
3.8. Physical encapsulation of model drug ........................................................................... 42
3.9. Biotinconjugation with biotin and Avidin-HABA assay ............................................... 44
3.10. Noncytotoxicity of HO-ABP micelles ........................................................................... 45
3.11. Conclusions .................................................................................................................... 46
Chapter 4 ........................................................................................................................................ 48
Thiol-Responsive Mono-Cleavable Micelles ....................................................................... 48
4.1. Introduction .................................................................................................................... 48
4.2. Experimental section ...................................................................................................... 50
4.3. Synthesis of ss-(PAP-Br)2 macroinitiator (MI) .............................................................. 50
4.4. Synthesis of ss-ABP2 triblock copolymer ...................................................................... 53
4.5. Aqueous micellization of ss-ABP2 ................................................................................. 54
4.6. Reductive cleavage of disulfide linkages in ss-ABP2 .................................................... 55
4.7. Reductively-degradable ss-ABP2 micellar aggregates ................................................... 56
4.8. Conclusions .................................................................................................................... 58
Chapter 5 ........................................................................................................................................ 60
Glutathione-Responsive Micelles Having Pendant Disulfide Linkages .............................. 60
5.1. Introduction .................................................................................................................... 60
5.2. Experimental section ...................................................................................................... 63
5.3. Synthesis and aqueous micellization of PEO-b-PHMssEt ............................................. 63
5.4. Redox-trigger destabilization of PEO-b-PHMssEt micellar Aggregates ....................... 64
5.5. Preparation of DOX-loaded micelles ............................................................................. 66
xi
5.6. GSH-triggered release of DOX from DOX-loaded micelles ......................................... 69
5.7. GSH-responsive intracellular release of DOX upon degradation .................................. 70
5.8. In vitro cytotoxicity of DOX-loaded micelles ............................................................... 72
5.9. Conclusions .................................................................................................................... 73
Chapter 6 ........................................................................................................................................ 75
Conclusion and Future Works .................................................................................................. 75
Appendix A .................................................................................................................................... 80
Experimental Section of Chapter 3 ...................................................................................... 80
A.1. Materials ........................................................................................................................ 80
A.2. Synthesis and purification of 2-hydroxyethyl-2´-bromoisobutyrate (OH-iBuBr) ......... 80
A.3. Synthesis of HO-POEOMA-Br macroinitiator (HO-MI) .............................................. 81
A.4. Synthesis of HO-POEOMA-b-PtBMA (HO-ABP) block copolymer ........................... 82
A.5. Aqueous micellization by solvent evaporation .............................................................. 82
A.6. Determination of CMC using a NR probe ..................................................................... 83
A.7. Hydrolytic cleavage of t-butyl groups of PtBMA blocks in acidic conditions .............. 83
A.8. pH-responsive destabilization of HO-ABP micelles at low pH ..................................... 83
A.9. Loading of NR into HO-ABP micelles .......................................................................... 84
A.10. Bioconjugation of HO-ABP with biotin ........................................................................ 84
A.11. Avidin-HABA binding assay studies ............................................................................. 85
A.12. MTT cell viability assay ................................................................................................ 85
A.13. Supporting figures .......................................................................................................... 86
Appendix B .................................................................................................................................... 89
Experimental Section of Chapter 4 ...................................................................................... 89
B.1. Materials ........................................................................................................................ 89
B.2. Synthesis of bis[2-(2-bromoisobutyryloxy)ethyl] disulfide (SS-DBr) .......................... 89
B.3. Synthesis of ss-(PAP-Br)2 macroinitiators ..................................................................... 90
B.4. Synthesis of ss-ABP2 triblock copolymers .................................................................... 90
B.5. Aqueous micellization by solvent evaporation .............................................................. 91
B.6. Determination of CMC of ss-ABP2 in water by tensiometry ......................................... 91
B.7. Degradation of ss-ABP2 triblock copolymers and micelles ........................................... 92
B.8. Supporting figures .......................................................................................................... 93
Appendix C .................................................................................................................................... 94
Experimental Section of Chapter 5 ...................................................................................... 94
xii
C.1. Materials ........................................................................................................................ 94
C.2. Aqueous micellization by dialysis method .................................................................... 94
C.3. Preparation of DOX-loaded micelles ............................................................................. 95
C.4. Determination of loading level of DOX using UV/Vis spectroscopy ............................ 95
C.5. GSH-triggered destabilization of PEO-b-PHMssEt micelles ........................................ 96
C.6. GSH-triggered release of DOX from DOX-loaded micelles ......................................... 96
C.7. Cell viability using MTT assay ...................................................................................... 96
C.8. Intracellular DOX release and HeLa cells viability ....................................................... 97
C.9. Cellular uptake using flow cytometry and Confocal laser scanning microscopy (CLSM)
97
C.9.1. Flow cytometry .............................................................................................................. 97
C.9.2. Confocal laser scanning microscopy (CLSM) ............................................................... 98
C.10. Supporting figures .......................................................................................................... 98
References ................................................................................................................................ 101
List of publications .................................................................................................................. 105
xiii
List of Figures
Figure 1.1. Controlled versus uncontrolled release profile of drugs after administration. 2
Figure 1.2. Passive and active targeting of nanocarriers. ................................................... 4
Figure 1.3. Different self-assembled structures formed by ABPs dictated by packing
parameter, P. ....................................................................................................................... 7
Figure 1.4. Structure of a self-aggregated micelle from diblock copolymers. ................... 8
Figure 1.5. Schematic illustration of the process of micelle formation and the concept of
CMC. ................................................................................................................................... 9
Figure 1.6. Stimuli-responsive degradation of ABP micelles for controlled release of
encapsulated hydrophobic drugs. ...................................................................................... 11
Figure 1.7. Stimuli responsive ABP micelles with different location of cleavable linkage
(X). The figure is slightly modified from the reference (A and B represent polymer
blocks and b represent blocks). ......................................................................................... 12
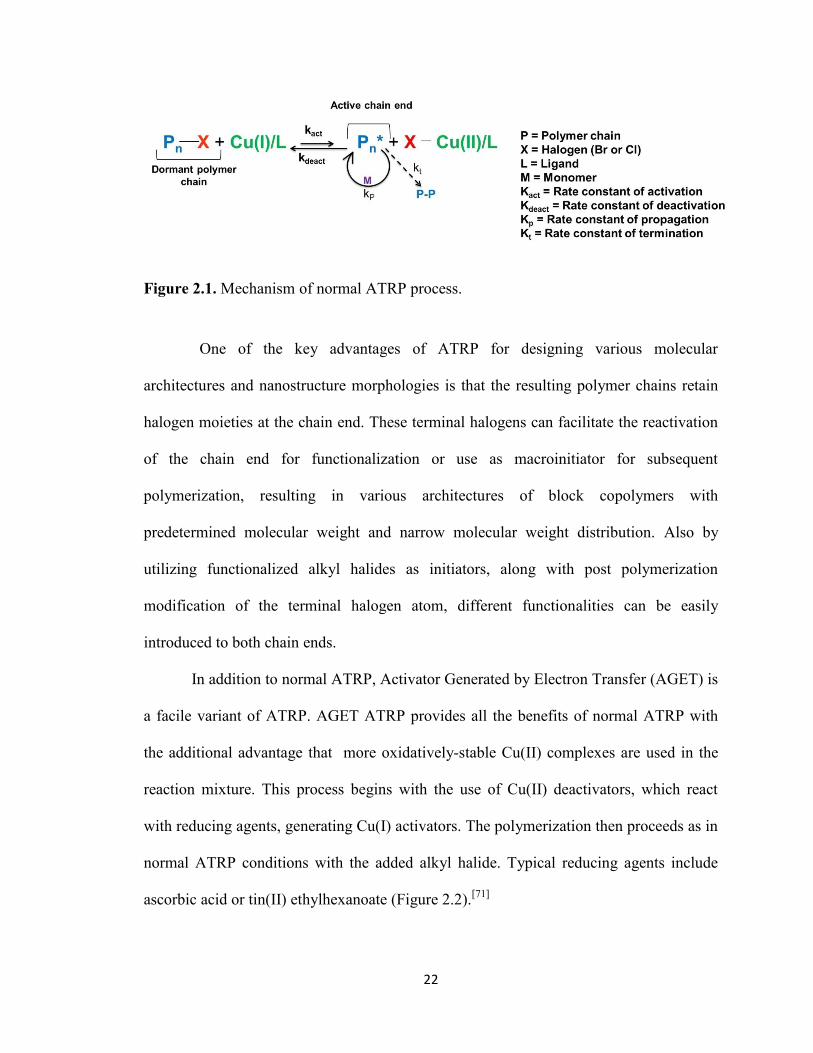
Figure 2.1. Mechanism of normal ATRP process. ........................................................... 22
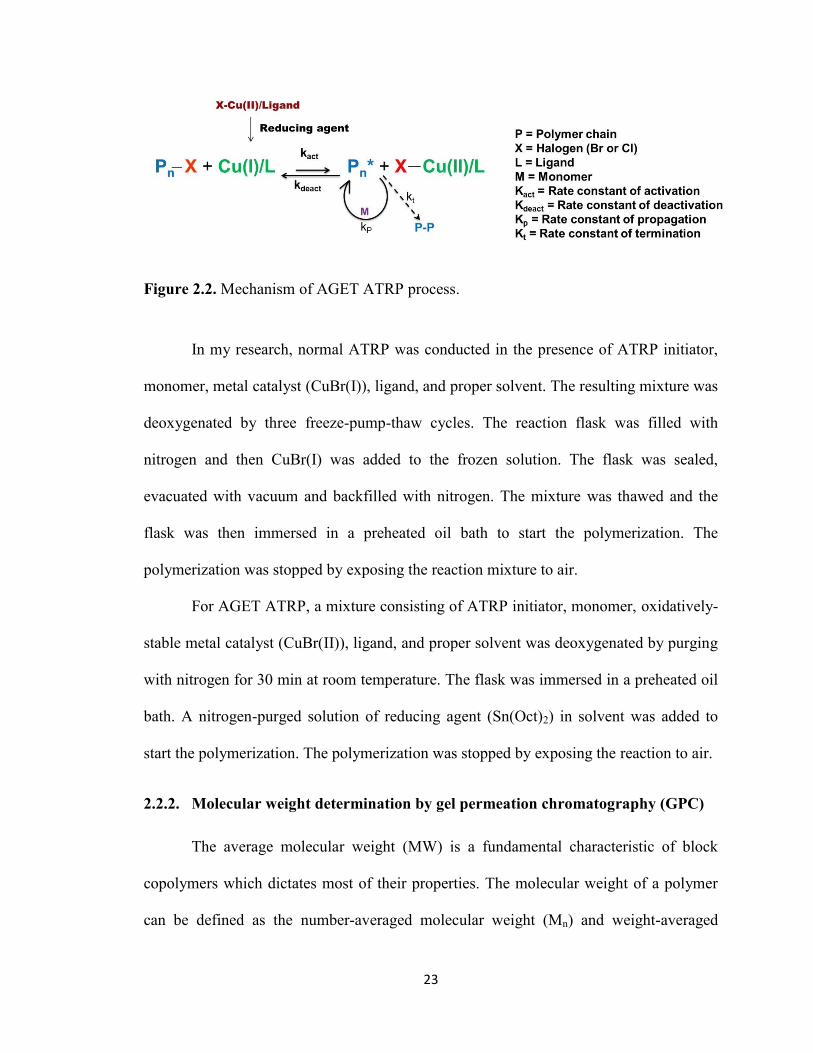
Figure 2.2. Mechanism of AGET ATRP process. ........................................................... 23
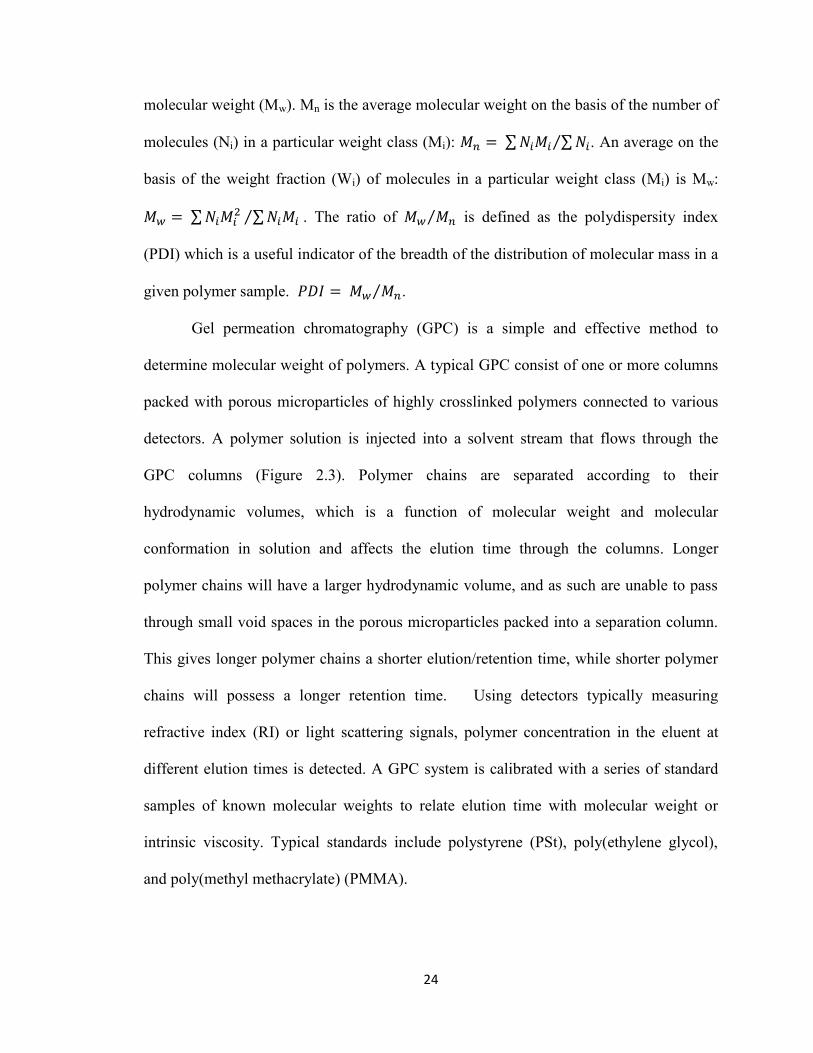
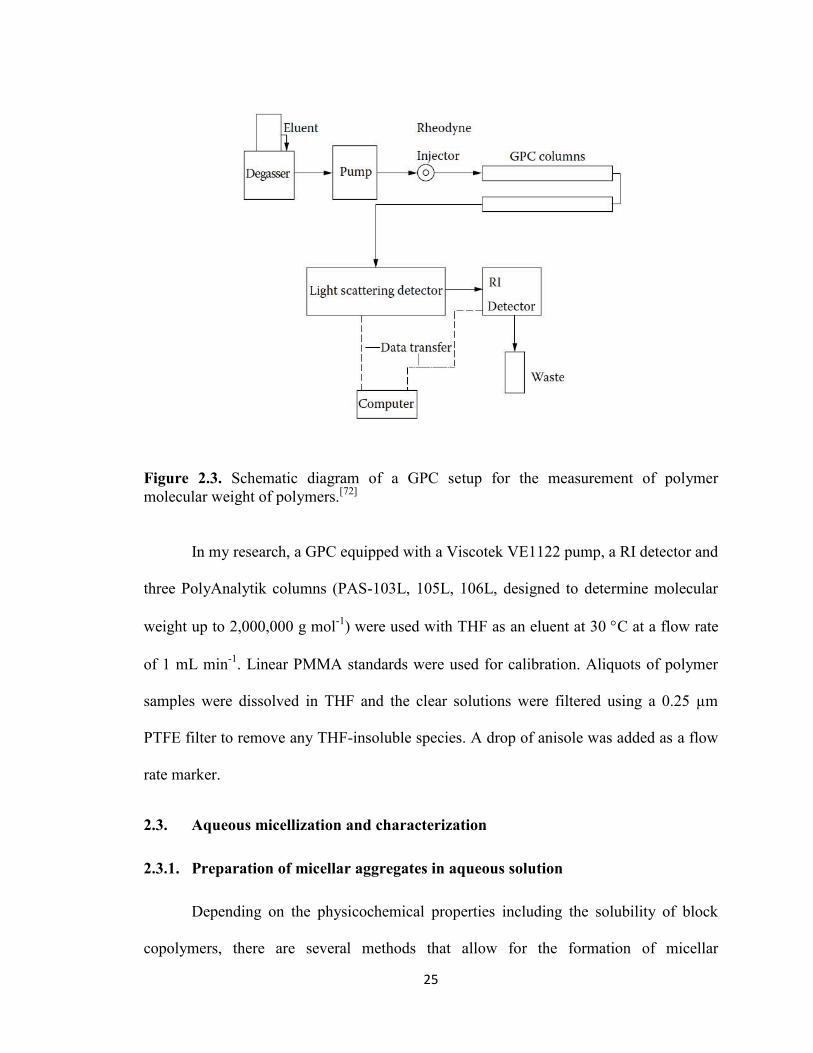
Figure 2.3. Schematic diagram of a GPC setup for the measurement of polymer
molecular weight of polymers. ......................................................................................... 25
Figure 2.4. Structures of MTT tetrazolium salt and its formazan product....................... 30
Figure 2.5. Absorption spectra of MTT and commercially prepared MTT-formazan
dissolved in DMSO. Also shown is the spectrum of MTT-formazan produced by
incubation of L-DAN cells with MTT (5 mg ml-1
) for 4 h. .............................................. 31
Figure 3.1. Synthesis of HO-ABPs by consecutive ATRP of OEOMA and tBMA in the
presence of a HO-terminated ATRP initiator (HO-iBuBr), as well as aqueous
xiv
micellization and acid-triggered dissociation of HO-ABP micelles as contolled drug
delivery nanocarriers (bpy: 2,2′-bipyridyl, PMAA: poly(methacrylic acid)). .................. 35
Figure 3.2. GPC traces of HO-ABP and HO-POEOMA-Br MI. ..................................... 38
Figure 3.3. 1H-NMR spectra of HO-MI (a), HO-ABP before (b), and after (c) hydrolytic
cleavage of PtBMA block in the presence of trifluoroacetic acid. ................................... 39
Figure 3.4. Evolution of fluorescence spectra (a) and fluorescence intensity at 480 nm (b)
of NR for aqueous mixtures consisting of NR with various amounts of HO-ABP to
determine CMC to be 6.3 μg mL-1
. ................................................................................... 40
Figure 3.5. DLS diagram and TEM image (inset) with scale bar = 100 nm (a) and
diameter over concentration (b) of HO-ABP micelles. .................................................... 41
Figure 3.6. DLS diagrams (a) and digital images (b) of HO-ABP micelles at pH = 7, 5,
and 3 after 4 days. ............................................................................................................. 42
Figure 3.7. Schematic illustration of bioconjugation of HO-ABP with biotin to form
biotin-conjugated ABP (a) and UV–Vis spectra of Avidin–HABA complex before and
after addition of biotinylated micelles in aqueous solution (b). ........................................ 45
Figure 3.8. Viability of HEK293T and HeLa cells cultured with HO-ABP micelles for 48
hrs. ..................................................................................................................................... 46
Figure 4.1. Illustration of synthesis, aqueous micellization, and degradation of mono-
cleavable brush-like ss-ABP2 triblock copolymers labeled with single disulfides in the
middle blocks (PMDETA : N,N,N′,N′′,N′′-pentamethyldiethylenetriamine, Bu3P:
tributylphosphine ). ........................................................................................................... 50
xv
Figure 4.2. Kinetic plot (a) and evolution of molecular weight and molecular weight
distribution of ss-(PAP-Br)2-1 and ss-(PAP-Br)2-3 (b). The straight line in (b) is the
theoretically predicted molecular weight over conversion. .............................................. 52
Figure 4.3. GPC traces (a) and 1H-NMR spectra in CDCl3 (b) of ss-(PAP-Br)2 and ss-
ABP2. ................................................................................................................................ 54
Figure 4.4. Surface pressure versus concentration of ss-ABP2 to determine CMC by
tensiometry. ....................................................................................................................... 55
Figure 4.5. GPC traces of ss-ABP2 before and after reductive cleavage of disulfide
linkages in the presence of Bu3P. ...................................................................................... 56
Figure 4.6. For ss-ABP2 symmetric triblock copolymers, DLS diagrams based on %
volume and AFM images with the size = 10 µm × 10 µm before (a and b) and after (c and
d) addition of DTT defined as DTT/disulfide = 1/1 in water (insets; digital images of
micellar dispersions in water). .......................................................................................... 58
Figure 5.1. Preparation of well-controlled PEO-b-PHMssEt via ATRP (PMDETA:
N,N,N′,N′,N′′-pentamethyldiethylenetriamine). ............................................................... 62
Figure 5.2. Illustration of PEO-b-PHMssEt micelles as effective intracellular drug
delivery nanocarriers exhibiting enhanced release of DOX in response to GSH in cancer
cells. .................................................................................................................................. 63
Figure 5.3. DLS diagram of PEO-b-PHMssEt micelles prepared using dialysis method in
water. ................................................................................................................................. 64
Figure 5.4. Evolution of DLS diagrams (volume %) of PEO-b-PHMssEt micellar
aggregates in aqueous buffer solution as control and in 10 mM aqueous GSH buffer
solution over time. ............................................................................................................ 66
xvi
Figure 5.5. DLS diagram (a) and TEM images (b) of DOX-loaded micelles of PEO-b-
PHMssEt at 2.5 mg/mL concentration prepared by dialysis method (inset of (a): digital
picture of DOX-loaded micellar dispersion)..................................................................... 67
Figure 5.6. A typical UV/Vis spectrum of DOX-loaded micelles after the removal of
water, compared with that of free DOX (19.5 µmol mL-1
) in DMF. ................................ 68
Figure 5.7. Release of DOX from DOX-loaded micelles in 10 mM aqueous GSH
solution buffered with KH2PO4 at pH = 7.0, and aqueous KH2PO4 buffer solution at pH =
7.0 as a control. ................................................................................................................. 70
Figure 5.8. Flow cytometric histograms of HeLa cells incubated with DOX-loaded PEO-
b-PHMssEt micelles for 2 hrs. .......................................................................................... 71
Figure 5.9. CLSM images of HeLa cells incubated with DOX-loaded PEO-b-PHMssEt
micelles for 24 hrs. The images from left to right show cell nuclei stained by DAPI
(blue), DOX fluorescence in cells (red), overlays of two images, and differential
interference contrast (DIC) image. Scale bar = 20 µm. .................................................... 72
Figure 5.10. Viability of HeLa cells incubated with different amounts of empty micelles,
DOX-loaded micelles, and free DOX for 48 hrs. Data are presented as average ± standard
deviation (n = 12). ............................................................................................................. 73
Figure A.1. For HO-MI-3, kinetic plot (a) and evolution of molecular weight and
molecular weight distribution over conversion (b) for ATRP of OEOMA in acetone at
47 °C under [OEOMA]0/[HO-iBuBr]0/[CuBr]0/[bpy]0 = 50/1/0.5/1; OEOMA/acetone =
1.5/1 wt/wt. The dotted lines in (a) are linear fits, and the straight lines in (b) are the
theoretically predicted molecular weight over conversion. .............................................. 86
xvii
Figure A.2. UV spectra of different concentrations of NR in THF to determine its
extinction coefficient at max = 527 nm. ........................................................................... 87
Figure A.3. An example of UV spectra of HO-ABP and NR-loaded HO-ABP micelles
dissolved in THF. .............................................................................................................. 87
Figure A.4. DLS diagram of an example of NR-loaded HO-ABP micelles in water. ..... 88
Figure B.1. 1H-NMR spectra of SS-DBr after (a) and before (b) precipitation from
hexane (purification). ........................................................................................................ 93
Figure C.1. Evolution of z-average diameter of PEO-b-PHMssEt micelles in aqueous 10
mM GSH solution over time. ............................................................................................ 98
Figure C.2. UV absorbance at λ= 497 nm of free DOX in outer water during extensive
dialysis. ............................................................................................................................. 99
Figure C.3. Overlaid UV spectra (a) and absorbance at λmax = 480 nm (b) of DOX at
various concentrations (µmol L-1
) in DMF to construct a calibration curve. ................... 99
Figure C.4. Absorption (––) and emission (- - -) spectra of 0.01 mg mL–1
free DOX, and
emission spectrum of 0.2 mg mL–1
micellar-encapsulated DOX (····), all in aqueous
solution. ........................................................................................................................... 100
Figure C.5. Absorption spectra of MTT and commercially prepared MTT-formazan
dissolved in DMSO. Also shown is the spectrum of MTT-formazan produced by
incubation of L-DAN cells with MTT (5 mg ml-1
) for 4 h. ............................................ 100
xviii
List of Tables
Table 1.1. pH sensitive linkages and their hydrolytic products. ...................................... 14
Table 3.1. Characteristics for ATRP of OEOMA in the presence of OH-iBuBr at 47 ºC in
acetonea ............................................................................................................................. 36
Table 3.2. Encapsulation of NR in HO-ABP micelles at different weight ratios of
NR/HO-ABP. .................................................................................................................... 43
Table 4.1. Characteristics of ss-(PAP-Br)2 difunctional macroinitiatorsa ........................ 51
Table 5.1. Loading level of DOX for DOX-loaded PEO-b-PHMssEt micelles prepared
by dialysis method over 5 days. ........................................................................................ 69
xix
List of Abbreviations
ABPs Amphiphilic block copolymers
AFM Atomic force microscopy
AGET Activator generated by electron transfer
ATRP Atom transfer radical polymerization
BPY 2,2′-bipyridyl
Br-iBuA 2-bromoisobutyric acid
Bu3P Tributylphosphine
CLSM Confocal laser scanning microscopy
CMC Critical micellar concentration
CRP Controlled radical polymerization
DAPI 4',6-diamidino-2-phenylindole
Dav Average diameter
DCC
DCU
N,N´-dicyclohexyl carbodiimide
Dicyclohexyl urea
DDS
Dex-LA
Drug delivery systems
Dextran-lipoic acid
DH Hydrodynamic diameter
DIC Differential interference contrast
DLS Dynamic light scattering
DMAP N,N-dimethylaminopyridine
DMEM
DMSO
Dulbecco’s modified eagle medium
Dimethyl sulfoxide
DOX Doxorubicin
xx
DTT Dithiothreitol
EDC
EGFR
1-ethyl-3-(3-dimethylaminopropyl)carbodiimide
Epidermal growth factor receptor
EPR Enhanced permeability and retention
Et3N Triethylamine
EthD-1 Ethidium homodimer
FBS Fetal bovine serum
GPC Gel permeation chromatography
GSH Glutathione
HABA 2-(4-hydroxyphenylazo)benzoic acid
HEK293T Human embryonic kidney 293T
HEMI N-(2-hydroxyethyl) maleimide
IV Intravenous
KHP Potassium hydrogen phthalate
LA
LE
L-lactide
Loading efficiency
Mn Number-average molecular weight
MTC 2-(2,4-dinitrophenylthio)ethyl-5-methyl-2-oxo-1,3-dioxane-5-
carboxylate
MTT
MTS
3-(4,5-dimethylthiazol-2-yl)-2,5-diphenyltetrazolium bromide
3-(4,5-dimethylthiazol-2-yl)-5-(3-carboxymethoxyphenyl)-2-(4-
sulfophenyl)-2H-tetrazolium
Mw Weight-average molecular weight
NMP Nitroxide-mediated polymerization
NMR Nuclear magnetic resonance
xxi
NR Nile red
PAA Poly(aspartic acid)
PAMAM polyamidoamine
PAP Poly(oligo(propylene oxide) monononylphenyl ether acrylate
PC Polycarbonate
PCL Poly(ε-caprolactone)
PDI Polydispersity
PEEP Poly(ethyl ethylene phosphate)
PEO Polyethylene oxide
PES Polyester
PHMssEt Disulfide-labeled polymethacrylate
PHPMA poly(N-2-hydroxypropyl methacrylamide)
PMDETA
PMAA
N, N, N’, N’’, N’’-Pentamethyldiethylenetriamine
poly(methacrylic acid)
PMMA Poly(methyl methacrylate)
POEOMA
PSt
Poly oligo(ethylene glycol) monomethyl ether methacrylate
Polystyrene
PtBMA poly(t-butyl methacrylate)
RAFT Reversible addition fragmentation transfer
RES
RI
Reticuloendothelial system
Refractive index
SRD stimuli-responsive degradation
SS-DBr
TBST
Bis[2-(2-bromoisobutyryloxy)ethyl] disulfide difunctional initiator
Tris-buffered saline tween-20
TEM Transmission electron microscopy
xxii
THF Tetrahydrofuran
UV/Vis Ultraviolet Spectroscopy
1
Chapter 1
Introduction
1.1. Brief overview of the research
My master research is aimed at developing self-assembled micellar aggregates of
well-controlled amphiphilic block copolymers (ABPs) with stimuli-responsive
degradation (SRD) properties. In response to external stimuli these micelles exhibit
enhanced release of encapsulated biomolecules including anticancer drugs, thus offering
versatility as multi-functional drug delivery nanocarriers. Several of new ABPs having
disulfide and pendant acid-labile linkages were synthesized by atom transfer radical
polymerization (ATRP). They were then characterized for aqueous micellization,
controlled release and cellular interactions.
1.2. Drug delivery in general
1.2.1. Pharmacokinetics of drug delivery
The science of drug delivery can be described as the application of chemical or
biological science to control in vivo location of drug molecules for clinical benefits.
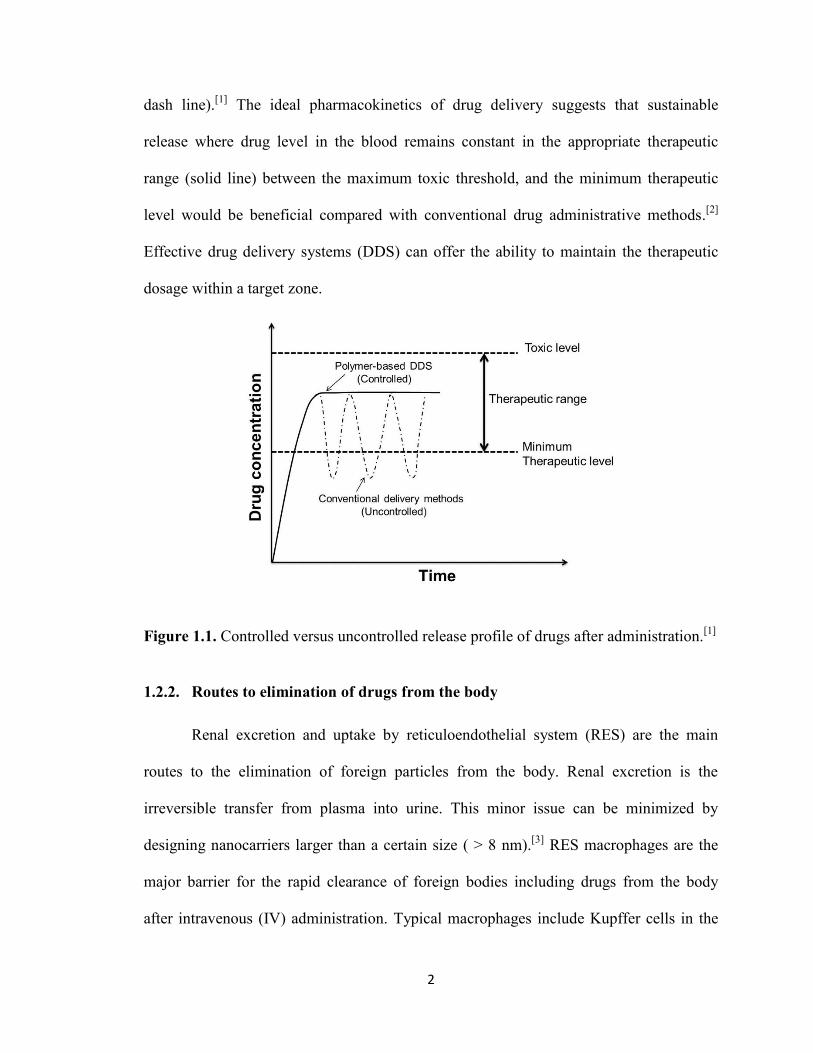
Figure 1.1 illustrates the release profile of drugs by conventional delivery methods such
as injection. When drugs are administrated the drug level abruptly reaches a peak in the
blood. However, most of the dose is wasted as only a small fraction of the dose actually
hits relevant receptors over time. The drug level then decreases to below the minimum
therapeutic level, which represents an ineffective dose until the next administration (dot-
2
dash line).[1]
The ideal pharmacokinetics of drug delivery suggests that sustainable
release where drug level in the blood remains constant in the appropriate therapeutic
range (solid line) between the maximum toxic threshold, and the minimum therapeutic
level would be beneficial compared with conventional drug administrative methods.[2]
Effective drug delivery systems (DDS) can offer the ability to maintain the therapeutic
dosage within a target zone.
Figure 1.1. Controlled versus uncontrolled release profile of drugs after administration.[1]
1.2.2. Routes to elimination of drugs from the body
Renal excretion and uptake by reticuloendothelial system (RES) are the main
routes to the elimination of foreign particles from the body. Renal excretion is the
irreversible transfer from plasma into urine. This minor issue can be minimized by
designing nanocarriers larger than a certain size ( > 8 nm).[3]
RES macrophages are the
major barrier for the rapid clearance of foreign bodies including drugs from the body
after intravenous (IV) administration. Typical macrophages include Kupffer cells in the
3
liver and fixed macrophages in the spleen, which recognize opsonin proteins.[4]
Opsonins
are the blood proteins that help macrophages recognize foreign bodies in the blood.[5]
DDS coated with opsonins are removed from blood circulation through a process known
as opsonization. The extent of opsonization is influenced by size and surface properties of
DDS. Large particles and particles with hydrophobic surfaces are rapidly removed by
RES macrophages.[6]
1.2.3. Drug targeting strategies
The idea of drug targeting was suggested nearly 100 years ago by Paul Ehrlich,
who proposed a hypothetical ‘magic bullet’ to improve drug delivery in the body.[7]
There
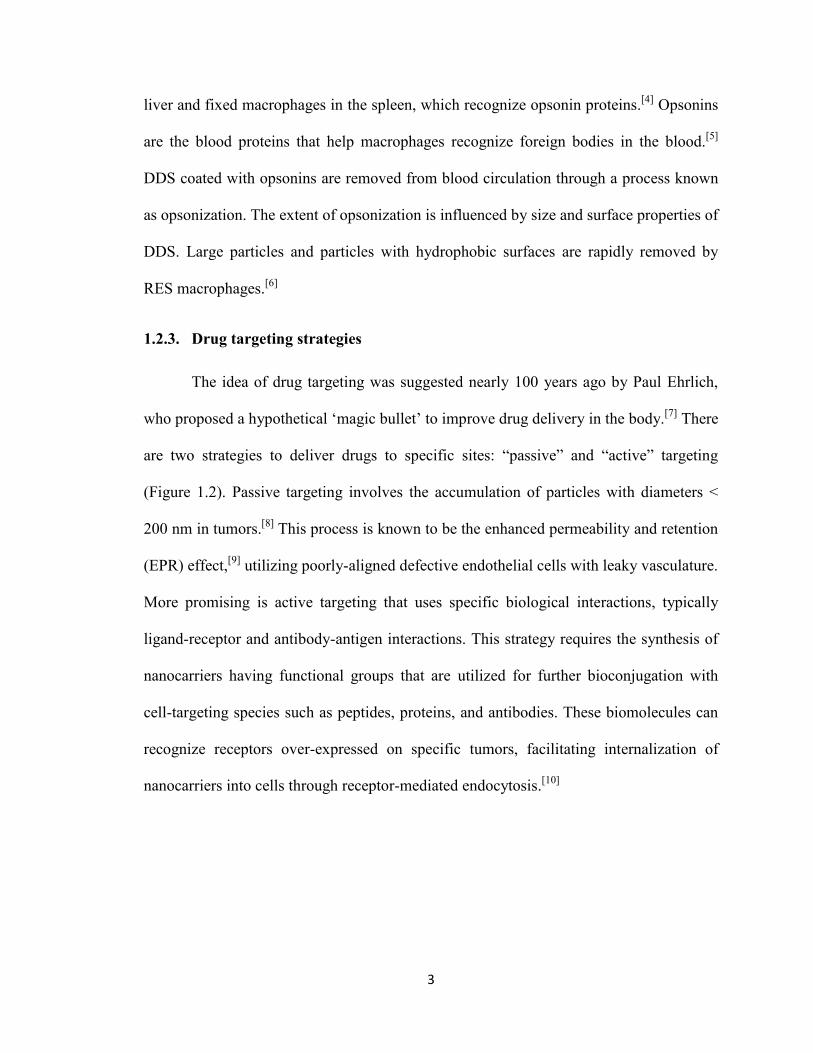
are two strategies to deliver drugs to specific sites: “passive” and “active” targeting
(Figure 1.2). Passive targeting involves the accumulation of particles with diameters <
200 nm in tumors.[8]
This process is known to be the enhanced permeability and retention
(EPR) effect,[9]
utilizing poorly-aligned defective endothelial cells with leaky vasculature.
More promising is active targeting that uses specific biological interactions, typically
ligand-receptor and antibody-antigen interactions. This strategy requires the synthesis of
nanocarriers having functional groups that are utilized for further bioconjugation with
cell-targeting species such as peptides, proteins, and antibodies. These biomolecules can
recognize receptors over-expressed on specific tumors, facilitating internalization of
nanocarriers into cells through receptor-mediated endocytosis.[10]
4
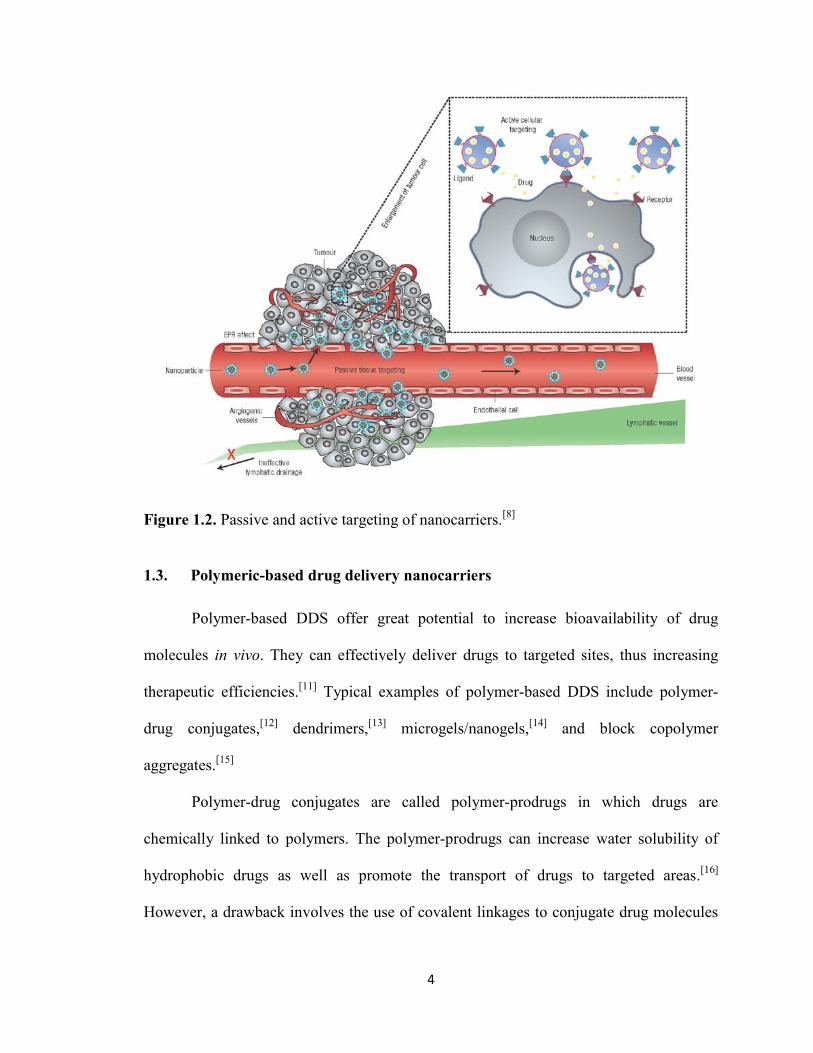
Figure 1.2. Passive and active targeting of nanocarriers.[8]
1.3. Polymeric-based drug delivery nanocarriers
Polymer-based DDS offer great potential to increase bioavailability of drug
molecules in vivo. They can effectively deliver drugs to targeted sites, thus increasing
therapeutic efficiencies.[11]
Typical examples of polymer-based DDS include polymer-
drug conjugates,[12]
dendrimers,[13]
microgels/nanogels,[14]
and block copolymer
aggregates.[15]
Polymer-drug conjugates are called polymer-prodrugs in which drugs are
chemically linked to polymers. The polymer-prodrugs can increase water solubility of
hydrophobic drugs as well as promote the transport of drugs to targeted areas.[16]
However, a drawback involves the use of covalent linkages to conjugate drug molecules
5
to polymer chains. These stable bonds are not easily cleaved to release drugs. To
circumvent this issue, labile linkages such as disulfides have been used.[17]
Dendrimers are well-defined highly branched macromolecules. Typical examples
include polyamidoamine (PAMAM) modified with neutral moieties,[18]
polyaryl ether
and poly(ethylene oxide) (PEO)-based dendrimers.[19]
They exhibit unique morphological
and physical properties, high biocompatibility and water solubility, thus offering potential
as candidates for polymer-based DDS. However, the synthesis of well-defined multi-
generation dendrimers remains challenging.
Microgels are a class of hydrogels that are submicron sized crosslinked particles.
When the size of microgels is in a nanometer range, they are known as nanogels. These
microgels/nanogels possess all features of hydrogels, including tunable chemical and
physical structures, good mechanical properties, high water content and biocompatibility.
Further, they exhibit tunable size, large surface area for bioconjugation, and hydrophilic
interior network.[20]
They are suitable for encapsulation of hydrophilic drugs.
My thesis focuses on the design and development of effective micellar aggregates
based on amphiphilic block copolymers (ABPs), which will be explained in greater
detail.
1.4. Amphiphilic block copolymer micellar aggregates
In recent years, ABP-based micelles have been extensively explored for
pharmaceutical applications. The rapid development of ABP-based micelles is because of
their ability to form various types of nanoparticles with desirable properties as effective
drug nanocarriers. These promising properties of ABPs are initiated as a result of their
chemical flexibility and ability to form nanostructure with various morphologies.
6
ABPs consist of covalently attached hydrophobic and hydrophilic blocks, which
can be obtained by polymerization of more than one type of monomers. Typical polymers
include polyesters,[21]
poly(amino acid) derivatives,[22]
and polymethacrylate as
hydrophobic block hydrophilic blocks; and PEO, PEO analogues, and polysaccharides as
hydrophilic block.[23]
As a result of the amphiphilic nature, ABPs undergo self-assembly
to form micellar aggregates with various morphologies in aqueous solution. This is to
minimize energetically unfavorable interaction of hydrophobic surfaces with water.[24]
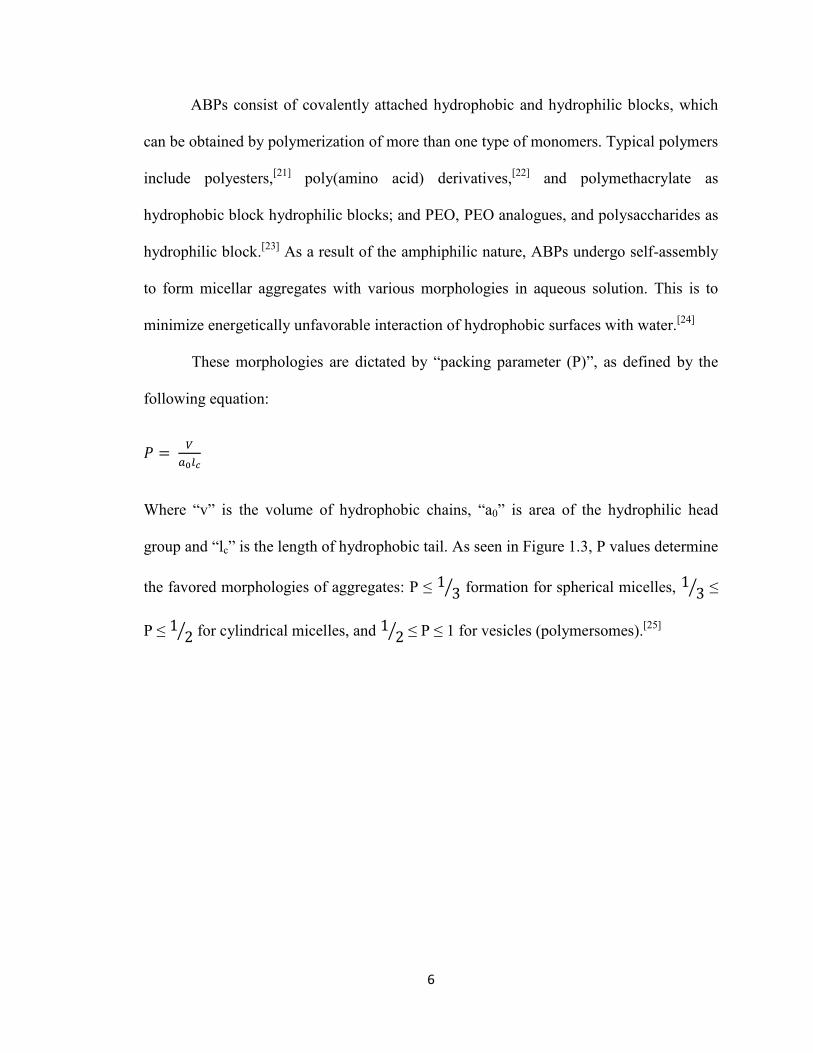
These morphologies are dictated by “packing parameter (P)”, as defined by the
following equation:
Where “v” is the volume of hydrophobic chains, “a0” is area of the hydrophilic head
group and “lc” is the length of hydrophobic tail. As seen in Figure 1.3, P values determine
the favored morphologies of aggregates: P ≤ ⁄ formation for spherical micelles, ⁄ ≤
P ≤ ⁄ for cylindrical micelles, and ⁄ ≤ P ≤ 1 for vesicles (polymersomes).[25]
7
Figure 1.3. Different self-assembled structures formed by ABPs dictated by packing
parameter, P.[15]
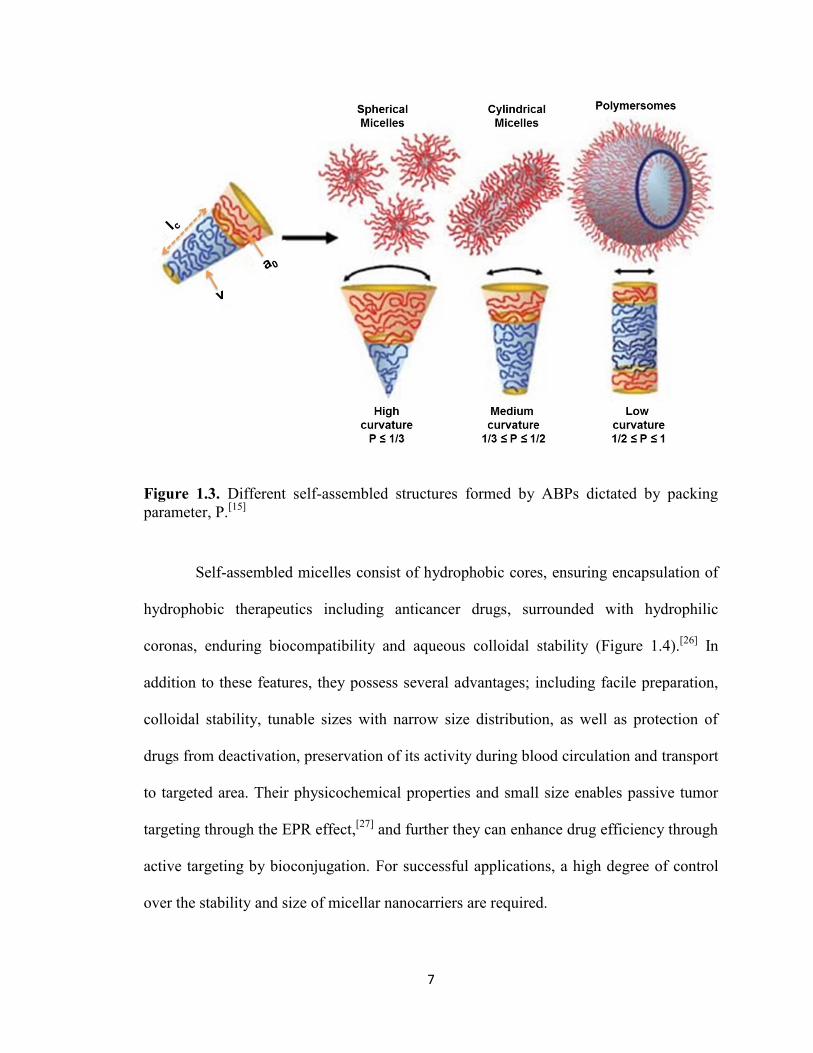
Self-assembled micelles consist of hydrophobic cores, ensuring encapsulation of
hydrophobic therapeutics including anticancer drugs, surrounded with hydrophilic
coronas, enduring biocompatibility and aqueous colloidal stability (Figure 1.4).[26]
In
addition to these features, they possess several advantages; including facile preparation,
colloidal stability, tunable sizes with narrow size distribution, as well as protection of
drugs from deactivation, preservation of its activity during blood circulation and transport
to targeted area. Their physicochemical properties and small size enables passive tumor
targeting through the EPR effect,[27]
and further they can enhance drug efficiency through
active targeting by bioconjugation. For successful applications, a high degree of control
over the stability and size of micellar nanocarriers are required.
8
Figure 1.4. Structure of a self-aggregated micelle from diblock copolymers.[28]
1.4.1. Micelle stability
The stability of micellar systems can be evaluated in terms of thermodynamic and
kinetic stability. Thermodynamic stability of micelles reflects how micelles form or
dissociate at different concentrations. From this point of view, micelle stability can be
measured by critical micellar concentration (CMC), which is the concentration at which
micellar aggregates first appear. At concentrations below CMC, the existence of polymer
chains as unimers or single polymer chains is thermodynamically favored. Upon the
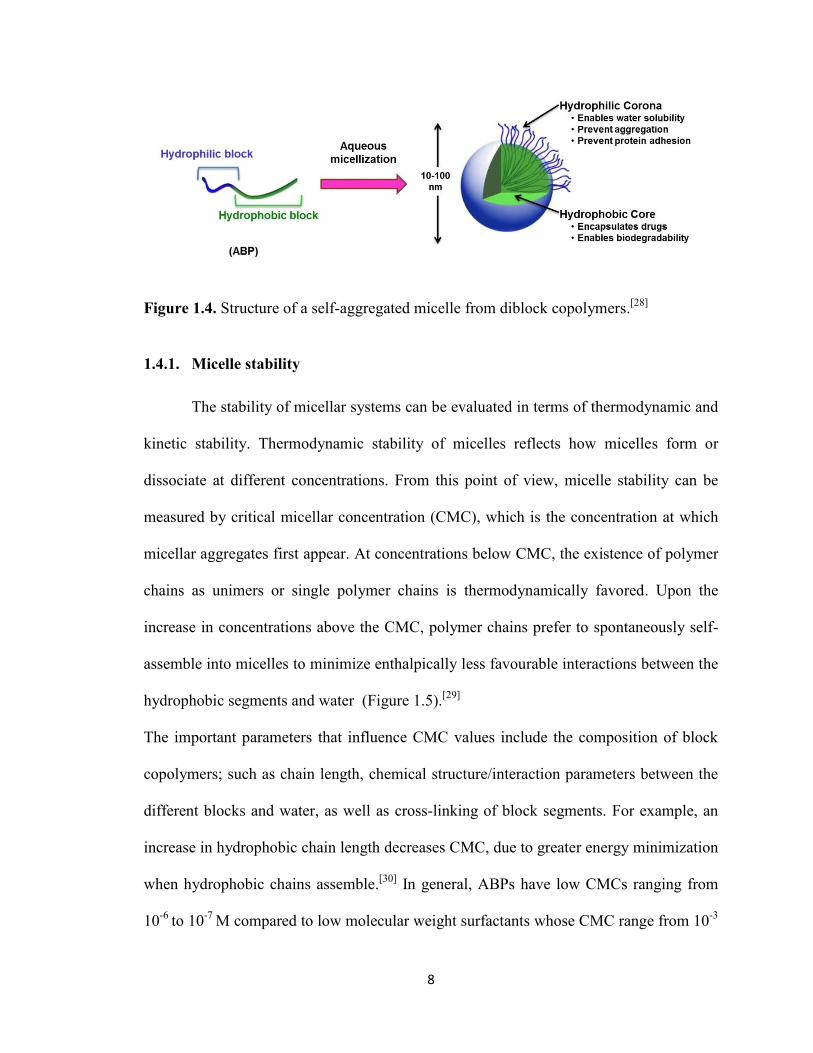
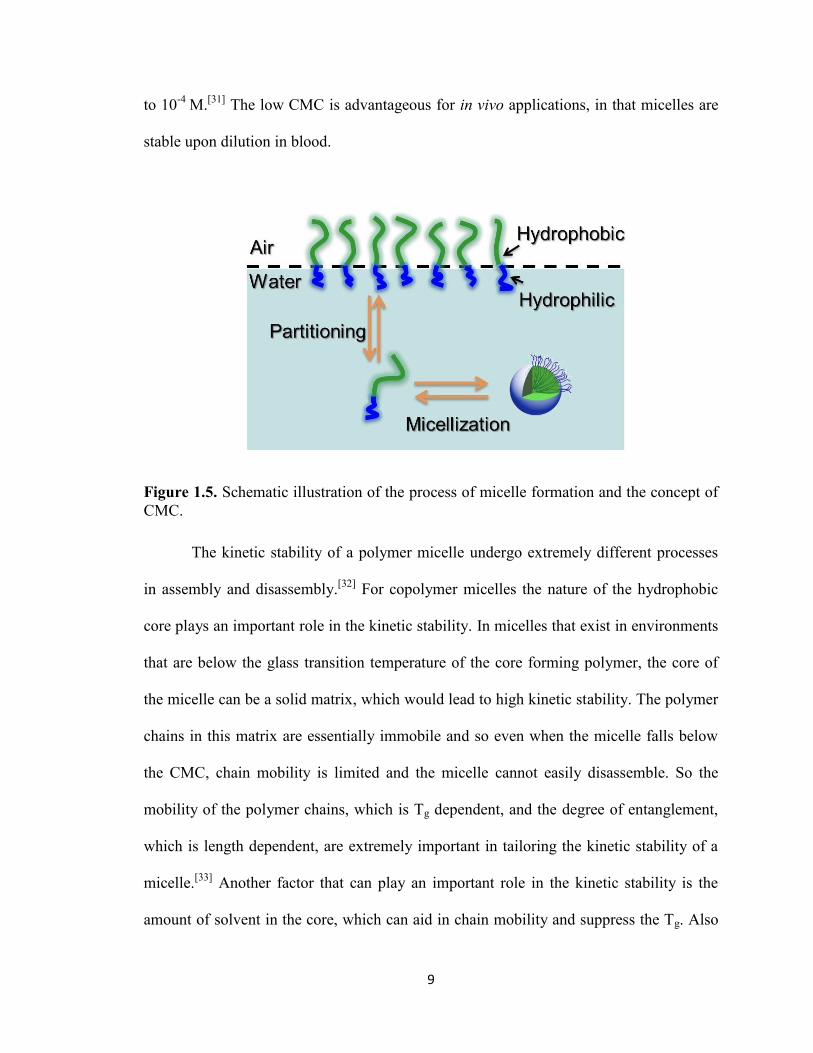
increase in concentrations above the CMC, polymer chains prefer to spontaneously self-
assemble into micelles to minimize enthalpically less favourable interactions between the
hydrophobic segments and water (Figure 1.5).[29]
The important parameters that influence CMC values include the composition of block
copolymers; such as chain length, chemical structure/interaction parameters between the
different blocks and water, as well as cross-linking of block segments. For example, an
increase in hydrophobic chain length decreases CMC, due to greater energy minimization
when hydrophobic chains assemble.[30]
In general, ABPs have low CMCs ranging from
10-6
to 10-7
M compared to low molecular weight surfactants whose CMC range from 10-3
9
to 10-4
M.[31]
The low CMC is advantageous for in vivo applications, in that micelles are
stable upon dilution in blood.
Figure 1.5. Schematic illustration of the process of micelle formation and the concept of
CMC.
The kinetic stability of a polymer micelle undergo extremely different processes
in assembly and disassembly.[32]
For copolymer micelles the nature of the hydrophobic
core plays an important role in the kinetic stability. In micelles that exist in environments
that are below the glass transition temperature of the core forming polymer, the core of
the micelle can be a solid matrix, which would lead to high kinetic stability. The polymer
chains in this matrix are essentially immobile and so even when the micelle falls below
the CMC, chain mobility is limited and the micelle cannot easily disassemble. So the
mobility of the polymer chains, which is Tg dependent, and the degree of entanglement,
which is length dependent, are extremely important in tailoring the kinetic stability of a
micelle.[33]
Another factor that can play an important role in the kinetic stability is the
amount of solvent in the core, which can aid in chain mobility and suppress the Tg. Also
10
the kinetic stability of micelles depends on the size of hydrophobic block and mass ratio
of hydrophilic to hydrophobic blocks.[34]
1.4.2. Micelle size
Micelle size is an important property which largely influences the circulation time
and organ distribution of DDSs. The size of micelles is controlled by several factors such
as the length of core forming block and corona forming block.[34]
Polymer based DDS
usually range in size from 10 to 100 nm, and as such are less susceptible to RES
clearance. They are also small enough to pass through small capillaries in the body (those
less than 5 µm), giving them access to small capillaries.[35]
Further, their size falls within
the optimal range for circulation and retention within tumor tissue by the EPR effect.
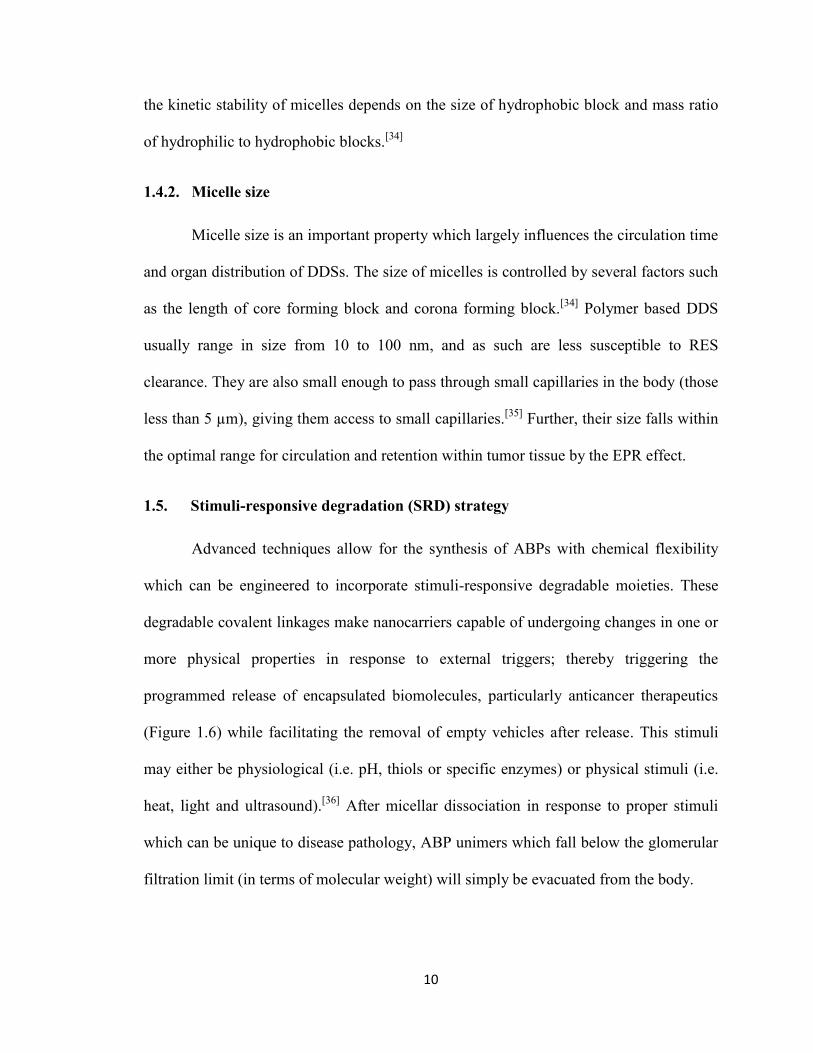
1.5. Stimuli-responsive degradation (SRD) strategy
Advanced techniques allow for the synthesis of ABPs with chemical flexibility
which can be engineered to incorporate stimuli-responsive degradable moieties. These
degradable covalent linkages make nanocarriers capable of undergoing changes in one or
more physical properties in response to external triggers; thereby triggering the
programmed release of encapsulated biomolecules, particularly anticancer therapeutics
(Figure 1.6) while facilitating the removal of empty vehicles after release. This stimuli
may either be physiological (i.e. pH, thiols or specific enzymes) or physical stimuli (i.e.
heat, light and ultrasound).[36]
After micellar dissociation in response to proper stimuli
which can be unique to disease pathology, ABP unimers which fall below the glomerular
filtration limit (in terms of molecular weight) will simply be evacuated from the body.
11
Figure 1.6. Stimuli-responsive degradation of ABP micelles for controlled release of
encapsulated hydrophobic drugs.[17]
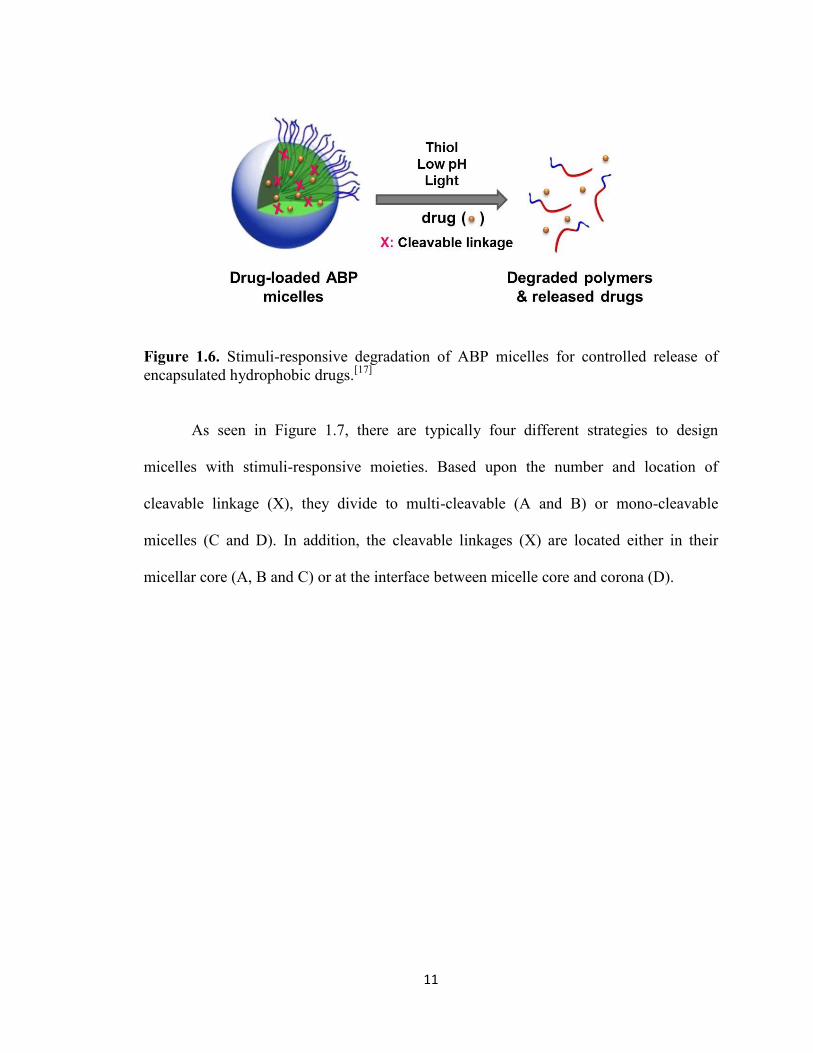
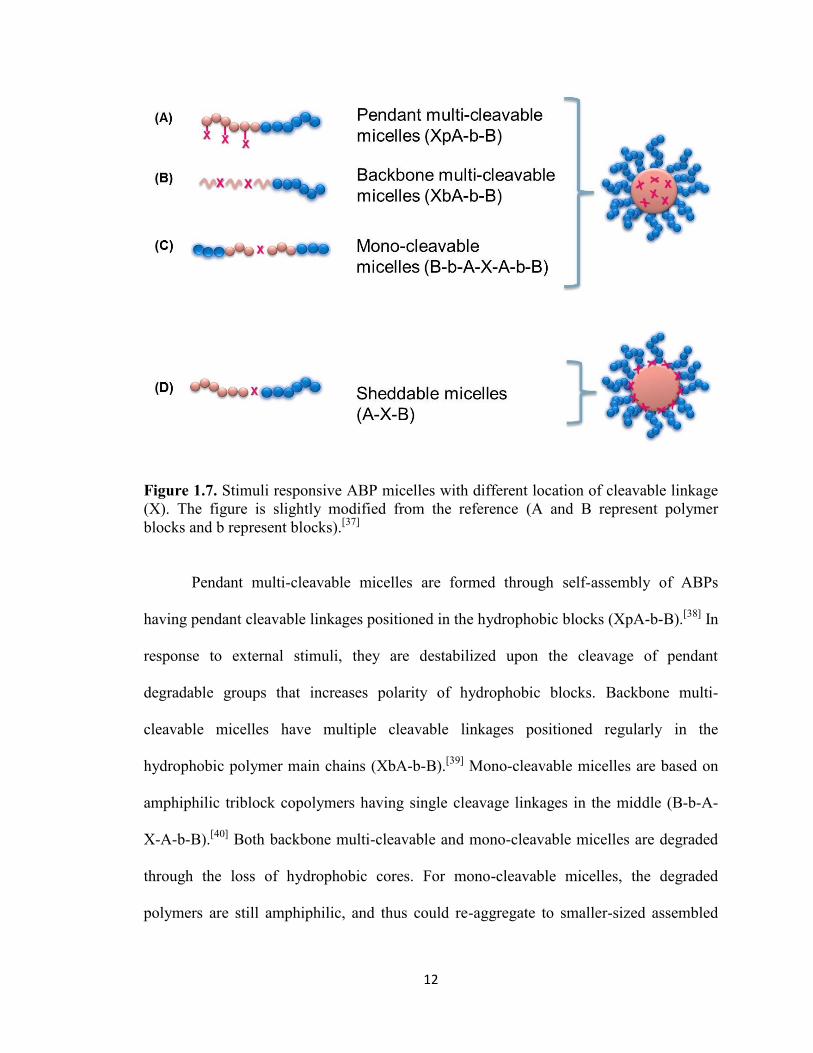
As seen in Figure 1.7, there are typically four different strategies to design
micelles with stimuli-responsive moieties. Based upon the number and location of
cleavable linkage (X), they divide to multi-cleavable (A and B) or mono-cleavable
micelles (C and D). In addition, the cleavable linkages (X) are located either in their
micellar core (A, B and C) or at the interface between micelle core and corona (D).
12
Figure 1.7. Stimuli responsive ABP micelles with different location of cleavable linkage
(X). The figure is slightly modified from the reference (A and B represent polymer
blocks and b represent blocks).[37]
Pendant multi-cleavable micelles are formed through self-assembly of ABPs
having pendant cleavable linkages positioned in the hydrophobic blocks (XpA-b-B).[38]
In
response to external stimuli, they are destabilized upon the cleavage of pendant
degradable groups that increases polarity of hydrophobic blocks. Backbone multi-
cleavable micelles have multiple cleavable linkages positioned regularly in the
hydrophobic polymer main chains (XbA-b-B).[39]
Mono-cleavable micelles are based on
amphiphilic triblock copolymers having single cleavage linkages in the middle (B-b-A-
X-A-b-B).[40]
Both backbone multi-cleavable and mono-cleavable micelles are degraded
through the loss of hydrophobic cores. For mono-cleavable micelles, the degraded
polymers are still amphiphilic, and thus could re-aggregate to smaller-sized assembled
13
structures. While all these type of micelles are designed to have cleavable linkages in the
hydrophobic cores, sheddable micelles contain cleavable linkages at the interfaces of
hydrophobic cores and hydrophilic coronas being shed upon the cleavage of cleavable
groups.[17]
In the following section, the development of pH and thiol-responsive degradable
block copolymer micelles are reviewed which are of interests to my research.
1.5.1. pH-responsive degradable micelles
pH-sensitive systems have been widely studied because of pH gradients within
the body.[41]
For example, at organ level, along gastrointestinal (GI) tract, pH changes
from acidic in the stomach (pH = 2) to more basic in the intestine (pH > 7). At tissue
level, tumor tissue exhibits slightly acidic pH (5.0 to 6.5). In the subcellular compartment
level, endosomes and lysosomes are also in acidic pH (5.0 to 5.5).[41]
While stable in
normal physiological conditions, pH-sensitive degradable micelles are destabilized in
acidic environment leading to site-specific release of encapsulated drugs in a controlled
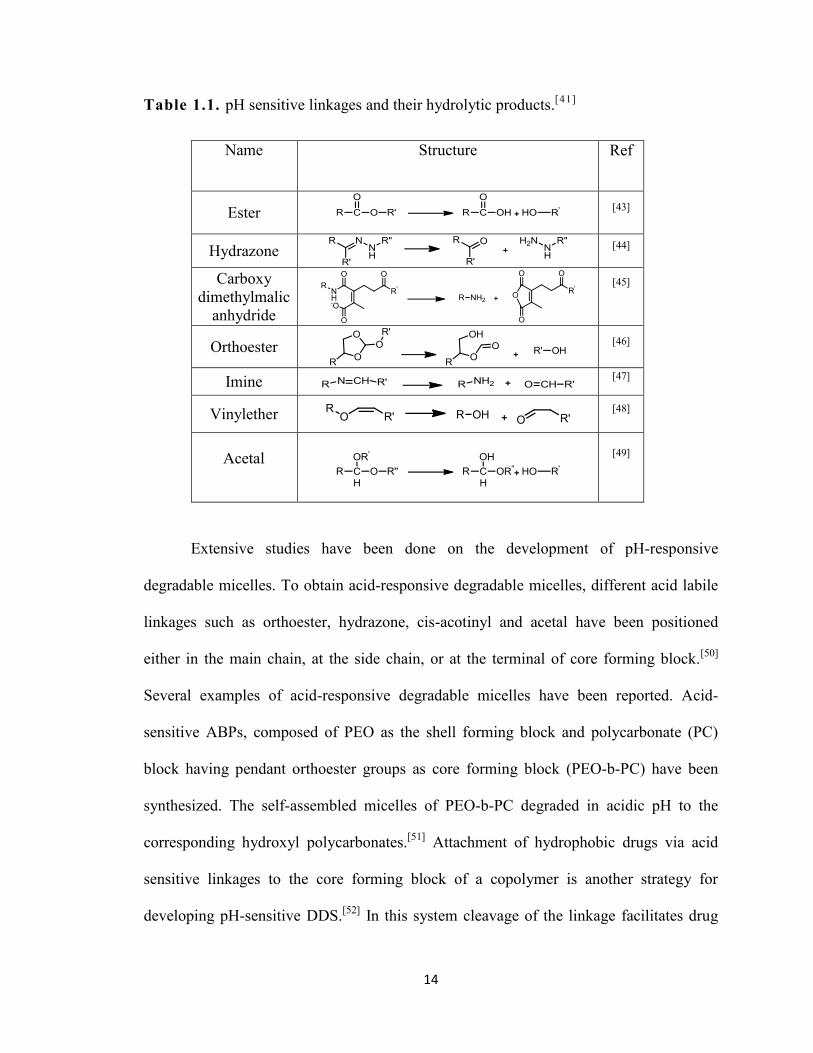
manner. The sensitivity of pH-responsive ABP micelles results from their “titratable”
groups (pKa from 3-11), which undergoes ionization upon changing the pH[42]
or from
their labile linkages which are cleaved under mild acidic conditions ( pH < 6). Table 1.1,
summarizes pH-sensitive covalent linkages as well as their corresponding hydrolytic
products.
14
Table 1.1. pH sensitive linkages and their hydrolytic products.[41]
Name Structure Ref
Ester [43]
Hydrazone
[44]
Carboxy
dimethylmalic
anhydride
[45]
Orthoester
[46]
Imine [47]
Vinylether
[48]
Acetal
[49]
Extensive studies have been done on the development of pH-responsive
degradable micelles. To obtain acid-responsive degradable micelles, different acid labile
linkages such as orthoester, hydrazone, cis-acotinyl and acetal have been positioned
either in the main chain, at the side chain, or at the terminal of core forming block.[50]
Several examples of acid-responsive degradable micelles have been reported. Acid-
sensitive ABPs, composed of PEO as the shell forming block and polycarbonate (PC)
block having pendant orthoester groups as core forming block (PEO-b-PC) have been
synthesized. The self-assembled micelles of PEO-b-PC degraded in acidic pH to the
corresponding hydroxyl polycarbonates.[51]
Attachment of hydrophobic drugs via acid
sensitive linkages to the core forming block of a copolymer is another strategy for
developing pH-sensitive DDS.[52]
In this system cleavage of the linkage facilitates drug
15
release. For example pH-sensitive drug delivery nanocarriers was developed by
conjugating doxorubicin (DOX) to the end group of PEG-PLA through an acid sensitive
hydrazone or cis-aconityl bond.[53]
pH-sensitivity of cis-aconityl bonds was actually 10
times higher than hydrazone linkages, but cleavage of this linkage form chemically
modified DOX after release; whereas through cleavage of hydrazone bonds, DOX could
be released without any change in therapeutic properties. Also another acid-sensitive
ABP micelle was developed by grafting DOX to a PEO-polyaspartate through hydrazone
linkages. Upon cleavage of hydrazone linkages, the release of DOX was enhanced when
decreasing the pH value from 7.4 to 3.0.[54]
Recently acetals as acid-labile linkages have
been exploited for design of pH-responsive micelles.[49]
In particular,
trimethoxybenzylidene acetals attached either to the side chain of poly(aspartic acid)
(PAA) segment of PEG-PAA block copolymers[49]
or to the periphery of dendron of
PEG-dendritic block copolymers showed unique sensitivity toward mildly acidic pH.[52]
Micellar aggregates were effectively disrupted due to the hydrolysis of acetals and thus
enhanced release of encapsulated Nile Red (NR) or DOX under mildly acidic conditions.
1.5.2. Redox-responsive degradable micelles
The existence of reduction potential gradients between intracellular and
extracellular compartments makes reductive electron transfer an ideal stimulus in design
and development of redox-responsive degradable nanomaterials for drug delivery
applications.[55]
Disulfides are cleaved in reducing environments or through disulfide-
thiol exchange reaction. Disulfide-thiol chemistry is especially applicable for in vivo drug
delivery applications due to the presence of glutathione (GSH), a low molecular weight
tripeptide containing a pendant thiol group that is found in extracellular fluids at a
16
concentration of ≈10 µM.[56]
GSH exist at higher level in cytosol (≈10 mM).[57]
More
importantly, the cytosolic level of GSH in some tumor cells is several times higher than
in normal cells.[58]
This large difference in GSH concentration between healthy and
cancerous cells can be used to selectively deliver anti-cancer therapeutics to affected
areas.
A number of disulfide-containing polymeric micelles have been extensively
explored as controlled delivery nanocarriers of anticancer drugs. For example, disruption
of a shell-sheddable micelle consisting of poly(ethylene glycol)-ss-poly(ε-caprolactone)
(PEG-ss-PCL) in a reductive environment resulted in 60% DOX release within 4 hrs, as
compared to 20% DOX release over one month from PEG-b-PCL.[59]
Also recently,
dextran-block-poly(ε-caprolactone) diblock copolymers containing a disulfide bond
between hydrophilic and hydrophobic segments was developed. In the absence of a
reducing environment, only 27% of the loaded DOX was released over 11 hrs, as
compared to almost 100% discharge in a reducing environment.[60]
In a very similar case,
a thiol-responsive shell detachable block copolymer composed of PCL block and
poly(ethyl ethylene phosphate) (PEEP) block having single disulfide in middle of blocks
(PCL-ss-PEEP) was synthesized. The PCL-ss-PEEP micelles exhibited the fast cleavage
of disulfide linkages in response to GSH, taking 2 hrs to reach almost complete drug
release.[61]
Redox-responsive micelles formed from hyperbranched multi-arm
copolyphosphates having disulfides were synthesized. The disulfide linkages were
cleaved in the presence of dithiothreitol (DTT), enhancing the release of encapsulated
DOX.[62]
Thiol-responsive micelles of poly(amido-amine) labeled with disulfides and
grafted with PEO exhibited the slow cleavage of disulfide linkages in response to DTT,
17
taking > 120 hrs to reach > 80% degradation.[39]
Redox-responsive micelles based on
polyester-based polymethacrylate ABPs (ssPES-b-POEOMA or ssABPs, OEOMA:
oligo(ethylene glycol) monomethyl ether methacrylate) having disulfide linkages
repeatedly positioned on polyester backbones (ssPES) were synthesized. The reductive
cleavage of disulfide linkages in reducing conditions resulted in the degradation of ssPES
homopolymers. With the increasing amounts of disulfide linkages in ssPES–OH and
reducing agents their degradation rate was significantly enhanced.[63]
In order to increase the stability of micelles against premature dissociation of
micelles, cross-linked micelles have been developed. However, such a covalent
crosslinking strategy can limit the release rate of encapsulated drugs. In order to
overcome this drawback, introduction of stimuli-responsive cleavable linkages have been
proposed. Recently, a block copolymer consisting of pendant disulfide-labeled
methacrylate (PHMssEt) and PEO (PEO-b-PHMssEt) was synthesized. This copolymer
self-assembled to form micellar aggregates, which can undergo disulfide core-
crosslinking in the presence of catalytic amounts of DTT (< 1 eq). Micelles were
destabilized and released the NR by increasing the concentration of DTT (5 eq DTT).[64]
The brief review of literatures demonstrates that stimuli-responsive degradable
micelles can be made as successful proof of concepts. These examples are merely a
glance at the various numbers of novel and efficient strategies to synthesize versatile
stimuli-responsive degradable micelles toward drug delivery. Smart micelles can be made
from surprisingly simple polymers, although this may be due to a reluctance to utilize
more complex polymeric structures due to fear of unknown toxicity and regulatory
delays. Standardization of polymers used might actually aid in commercialization, as
18
more effort will be devoted to finding a simple synthesis process, making it easier to
make micelles that meet current good manufacturing practices. Regardless of all the
improvements in the design of stimuli-responsive degradable micelles as DDSs, there is
still a need to better understand the structure–property relationship between
morphological variance and stimuli-responsive degradation in order to optimize the
design of polymeric nanocarriers. A more thorough understanding of the use and
placement of different stimuli responsive degradation triggers will help promote the
efficiency of DDSs. In addition, implementation of more precise triggers, such as those
which response to specific biomolecules will further enhance the effectiveness of targeted
delivery, and is an ongoing area of research.
1.6. Scope of the thesis
My master research will be presented in the following four chapters. Chapter 2
describes the methodology for the synthesis and characterization of stimuli-responsive
degradable ABPs and their self-assembled structures, as well as their cellular interactions.
Chapter 3 is devoted to the synthesis of a hydroxyl-terminated pH-responsive
degradable ABPs and evaluation of its effectiveness as micellar drug carriers. Well-
defined hydroxyl-terminated poly(oligo(ethylene oxide) monomethyl ether
methacrylate)-b-poly(t-butyl methacrylate) (OH-POEOMA-b-PtBMA) was synthesized.
The pendant tert-butyl groups of these ABPs were cleaved in acidic conditions, resulting
in pH-triggered destabilization of the micelles in aqueous solution. Their facile
bioconjugation was demonstrated by conjugation with biotin. The competitive assay
results suggest that > 93% polymer chains in micelles were conjugated with biotin
molecules.
19
Chapter 4 explores a novel brush-like triblock copolymers consisting of a
hydrophobic polymethacrylate block having pendant oligo(propylene oxide) and a
hydrophilic polymethacrylate block having pendant oligo(ethylene oxide) (ss-(PAP-b-
POEOMA)2). Thiol-responsive disulfide linkages were positioned in the middle of the
triblock copolymers, thus resulting in the formation of the mono-cleavable micelles by
self-assembly in aqueous solution. The cleavage of the disulfide linkages in micellar
cores in response to thiols resulted in dissociation of micelles to smaller-sized assembled
structures in water.
Chapter 5 describes self-assembly of a thiol-responsive pendant multi-cleavable
micelles consisting of a pendant disulfide-labeled polymethacrylate core (PHMssEt) and
a hydrophilic poly(ethylene oxide) (PEO) corona (PEO-b-PHMssEt) block copolymer. In
response to cellular GSH, the cleavage of pendant disulfide linkages of these PEO-b-
PHMssEt ABPs resulted in the destabilization of these micelles, which enhanced the
release of encapsulated doxorubicin (DOX) of anticancer drug. Their cellular interactions
including intracellular viability after cellular uptake were examined.
Finally, chapter 6 consists of concluding remarks and suggestions for future
works.
20
Chapter 2
Methodology: Synthesis and Characterization
2.1. Brief description
This chapter describes the methodology of synthesis and characterization of well-
defined amphiphilic block copolymers (ABPs) and their aqueous micellar aggregates for
biological and biomedical applications. Different techniques and instruments employed in
my research are also briefly described. The detailed experimental procedure for chapter 3,
4 and 5 are summarized in appendix A, B and C.
2.2. Synthesis and characterization of well-defined ABPs
2.2.1 ATRP as a means to synthesize well-defined ABPs
In order to synthesize polymers with complex macromolecular architectures such
as block copolymers for drug delivery applications, it is crucial to have strict control over
molecular weight, molecular weight distribution, and chemical composition of polymer
chains. Traditionally, living anionic polymerization has allowed for synthesis of well-
controlled block copolymers with narrow molecular weight distribution (Mw/Mn <
1.1).[65]
This polymerization requires the growth of all polymer chains at the same time
with no undesirable side reactions such as chain transfer or irreversible termination.[66]
However, carbon-centered terminal anions exhibit a high sensitivity to traces of
impurities. Such high sensitivity renders anionic polymerization incompatible with
several functional monomers and is difficult to implement industrially. Alternatively,
21
controlled radical polymerization (CRP) techniques have been recently developed,
combining the control of anionic polymerization as well as the versatility of conventional
free radical polymerization. They work based upon two main principles: (1) reversible
termination, as demonstrated by nitroxide-mediated polymerization (NMP)[67]
and atom
transfer radical polymerization (ATRP);[68]
and (2) reversible transfer, utilized in
reversible addition fragmentation chain transfer (RAFT) polymerization.[69]
In this thesis,
most block copolymers were synthesized by ATRP.
ATRP was independently discovered by Mitsuo Sawamoto[70]
and Krzysztof
Matyjaszewski[68]
in 1995. This technique works through the end-capping of a polymer
chain with halogen which can reversibly undergo homolytic cleavage (Figure 2.1). The
mechanism of normal ATRP involves the transfer of halogen atoms from dormant
polymer chains (Pn-X) to transition metal complexes (Cu(I)/L) as activators, yielding
active chain ends (Pn* radicals) and deactivators (X-Cu(II)/L). These (Pn*) radicals
species can undergo propagation with the rate constant of propagation (kp), to grow
polymeric chains. Alternatively, the radical species can be deactivated by halogen
transfer from deactivators to yield dormant species (Pn-X). This reversible equilibrium
process of activation and deactivation is shifted towards deactivation, as the rate constant
of deactivation is much larger than the rate constant of activation (kdeact >> kact). This
shift can minimize the concentration of radicals and chain transfer reactions, thus
suppressing bimolecular irreversible termination.
22
Figure 2.1. Mechanism of normal ATRP process.
One of the key advantages of ATRP for designing various molecular
architectures and nanostructure morphologies is that the resulting polymer chains retain
halogen moieties at the chain end. These terminal halogens can facilitate the reactivation
of the chain end for functionalization or use as macroinitiator for subsequent
polymerization, resulting in various architectures of block copolymers with
predetermined molecular weight and narrow molecular weight distribution. Also by
utilizing functionalized alkyl halides as initiators, along with post polymerization
modification of the terminal halogen atom, different functionalities can be easily
introduced to both chain ends.
In addition to normal ATRP, Activator Generated by Electron Transfer (AGET) is
a facile variant of ATRP. AGET ATRP provides all the benefits of normal ATRP with
the additional advantage that more oxidatively-stable Cu(II) complexes are used in the
reaction mixture. This process begins with the use of Cu(II) deactivators, which react
with reducing agents, generating Cu(I) activators. The polymerization then proceeds as in
normal ATRP conditions with the added alkyl halide. Typical reducing agents include
ascorbic acid or tin(II) ethylhexanoate (Figure 2.2).[71]
23
Figure 2.2. Mechanism of AGET ATRP process.
In my research, normal ATRP was conducted in the presence of ATRP initiator,
monomer, metal catalyst (CuBr(I)), ligand, and proper solvent. The resulting mixture was
deoxygenated by three freeze-pump-thaw cycles. The reaction flask was filled with
nitrogen and then CuBr(I) was added to the frozen solution. The flask was sealed,
evacuated with vacuum and backfilled with nitrogen. The mixture was thawed and the
flask was then immersed in a preheated oil bath to start the polymerization. The
polymerization was stopped by exposing the reaction mixture to air.
For AGET ATRP, a mixture consisting of ATRP initiator, monomer, oxidatively-
stable metal catalyst (CuBr(II)), ligand, and proper solvent was deoxygenated by purging
with nitrogen for 30 min at room temperature. The flask was immersed in a preheated oil
bath. A nitrogen-purged solution of reducing agent (Sn(Oct)2) in solvent was added to
start the polymerization. The polymerization was stopped by exposing the reaction to air.
2.2.2. Molecular weight determination by gel permeation chromatography (GPC)
The average molecular weight (MW) is a fundamental characteristic of block
copolymers which dictates most of their properties. The molecular weight of a polymer
can be defined as the number-averaged molecular weight (Mn) and weight-averaged
24
molecular weight (Mw). Mn is the average molecular weight on the basis of the number of
molecules (Ni) in a particular weight class (Mi): ∑ ∑ ⁄ . An average on the
basis of the weight fraction (Wi) of molecules in a particular weight class (Mi) is Mw:
∑ ∑ ⁄ . The ratio of ⁄ is defined as the polydispersity index
(PDI) which is a useful indicator of the breadth of the distribution of molecular mass in a
given polymer sample. ⁄ .
Gel permeation chromatography (GPC) is a simple and effective method to
determine molecular weight of polymers. A typical GPC consist of one or more columns
packed with porous microparticles of highly crosslinked polymers connected to various
detectors. A polymer solution is injected into a solvent stream that flows through the
GPC columns (Figure 2.3). Polymer chains are separated according to their
hydrodynamic volumes, which is a function of molecular weight and molecular
conformation in solution and affects the elution time through the columns. Longer
polymer chains will have a larger hydrodynamic volume, and as such are unable to pass
through small void spaces in the porous microparticles packed into a separation column.
This gives longer polymer chains a shorter elution/retention time, while shorter polymer
chains will possess a longer retention time. Using detectors typically measuring
refractive index (RI) or light scattering signals, polymer concentration in the eluent at
different elution times is detected. A GPC system is calibrated with a series of standard
samples of known molecular weights to relate elution time with molecular weight or
intrinsic viscosity. Typical standards include polystyrene (PSt), poly(ethylene glycol),
and poly(methyl methacrylate) (PMMA).
25
Figure 2.3. Schematic diagram of a GPC setup for the measurement of polymer
molecular weight of polymers.[72]
In my research, a GPC equipped with a Viscotek VE1122 pump, a RI detector and
three PolyAnalytik columns (PAS-103L, 105L, 106L, designed to determine molecular
weight up to 2,000,000 g mol-1
) were used with THF as an eluent at 30 C at a flow rate
of 1 mL min-1
. Linear PMMA standards were used for calibration. Aliquots of polymer
samples were dissolved in THF and the clear solutions were filtered using a 0.25 µm
PTFE filter to remove any THF-insoluble species. A drop of anisole was added as a flow
rate marker.
2.3. Aqueous micellization and characterization
2.3.1. Preparation of micellar aggregates in aqueous solution
Depending on the physicochemical properties including the solubility of block
copolymers, there are several methods that allow for the formation of micellar
26
aggregates. These methods include direct dissolution, solvent evaporation and dialysis
method. Direct dissolution involves dissolving copolymer directly in water. This
procedure is applicable for moderately hydrophobic copolymers.[24]
Both, solvent
evaporation and dialysis methods are accomplished by using organic solvents. The
solvent evaporation method is based on dissolving block copolymers in a volatile organic
solvent. Water is then slowly added to the solvent to form micelles, and evaporation of
the solvent results in the formation micellar aggregates. The Dialysis method involves
dissolving copolymers in water miscible organic solvents followed by extensive dialysis
against water. Eventually, organic solvents are replaced with water, triggering self-
assembly to form micelles.[73]
2.3.2. Determination of critical micellar concentration (CMC)
CMC is the concentration at which micellar aggregates first appear. At the CMC,
a distinct transition of several physical properties is observed due to the formation of
micellar aggregates. Typical methods to determine CMC of block copolymers include
tensiometry[74]
and fluorescence spectroscopy.[75]
Tensiometery utilizes the measure of surface tension of aqueous polymer
solutions. At low concentrations, the surface tension does not change; however with an
increasing concentration, it abruptly increases. Upon further increase, the tension slowly
increases. This increase is visible on a plot of surface pressure versus solution
concentration. Using this method the CMC is determined as the concentration when the
transition of pressure occurs.
Also fluorescence spectroscopy has widely been used to determine the CMC of
polymeric micelles. Nile Red (NR) is a fluorescent probe typically used to determine
27
CMC. It generally excites at 485 nm and emits at 525 nm. Its fluorescence is strongly
influenced by the polarity of its environment. In this method, the change in fluorescence
intensity of NR at various concentrations of the polymer is monitored.[76]
This
characterization method works based upon the fact that as a result of poor water solubility
of NR, its fluorescence emission is significantly lower in water; however, when NR is
entrapped in the hydrophobic micellar core, its fluorescence becomes much more
intense.[76]
The CMC can be easily estimated from changes of the NR fluorescence
intensity as a function of micellar concentration. The transition onset of fluorescence
intensity is defined as the CMC.
In my research, CMC of amphiphilic block copolymers in water have been
determined using both methods. A DeltaPi Surface Tensiometer from Kibron was
calibrated using air and water at room temperature and used to measure the change in
surface tension of different polymer solutions. Alternatively, the fluorescence spectra of
various polymer solutions containing NR were recorded on a Varian Cary Eclipse
fluorescence spectrometer.
2.3.3. Characterization of size and morphology of micellar aggregates
Dynamic light scattering (DLS) is a common technique for determining the size
of particles in colloidal dispersions. DLS measures the intensity of light scattered by
particles in dispersions at a given angle upon radiation of light. Brownian motion of
particles in solution causes changes in scattered light intensity. Analysis of these intensity
fluctuations allows for the determination of hydrodynamic diameter of particles through
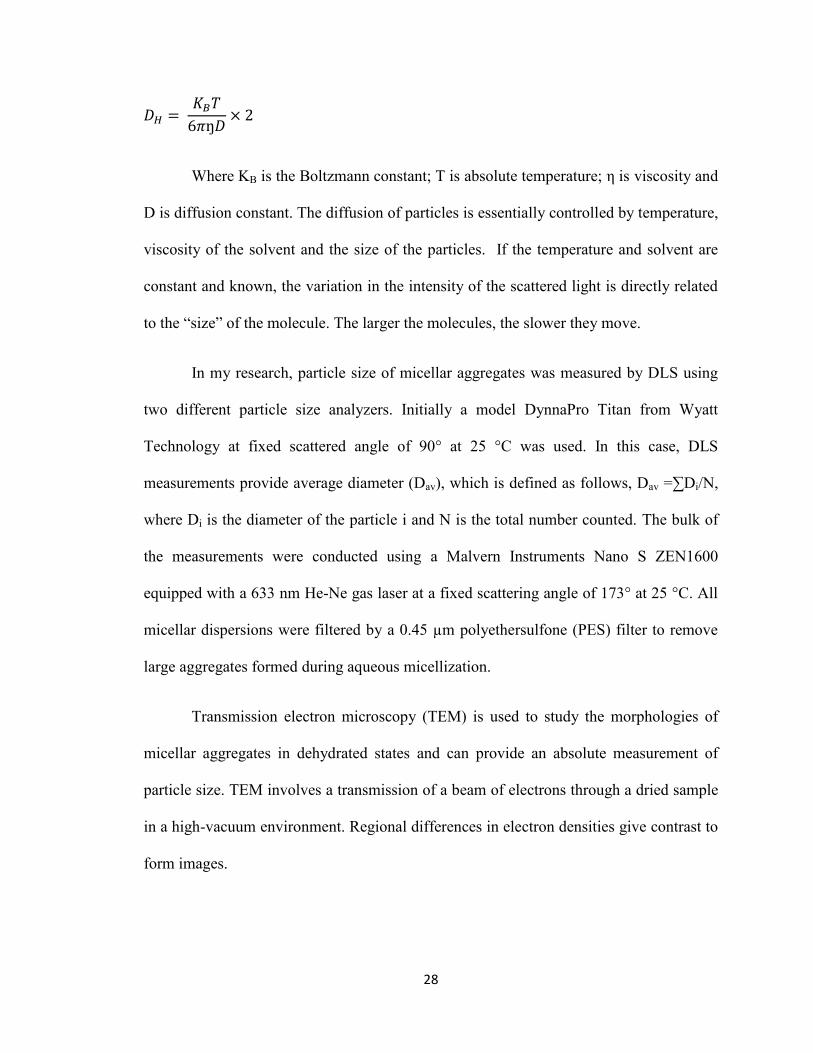
the Stokes-Einstein equation.
28
Where KB is the Boltzmann constant; T is absolute temperature; η is viscosity and
D is diffusion constant. The diffusion of particles is essentially controlled by temperature,
viscosity of the solvent and the size of the particles. If the temperature and solvent are
constant and known, the variation in the intensity of the scattered light is directly related
to the “size” of the molecule. The larger the molecules, the slower they move.
In my research, particle size of micellar aggregates was measured by DLS using
two different particle size analyzers. Initially a model DynnaPro Titan from Wyatt
Technology at fixed scattered angle of 90° at 25 °C was used. In this case, DLS
measurements provide average diameter (Dav), which is defined as follows, Dav =∑Di/N,
where Di is the diameter of the particle i and N is the total number counted. The bulk of
the measurements were conducted using a Malvern Instruments Nano S ZEN1600
equipped with a 633 nm He-Ne gas laser at a fixed scattering angle of 173° at 25 °C. All
micellar dispersions were filtered by a 0.45 µm polyethersulfone (PES) filter to remove
large aggregates formed during aqueous micellization.
Transmission electron microscopy (TEM) is used to study the morphologies of
micellar aggregates in dehydrated states and can provide an absolute measurement of
particle size. TEM involves a transmission of a beam of electrons through a dried sample
in a high-vacuum environment. Regional differences in electron densities give contrast to
form images.

29
In my research, TEM images were taken using a Philips CM200 HR-TEM,
operated at 200 kV electrons and equipped with thermionic LaB6 cathode filament, anti-
contamination cold finger, Genesis EDAX system, and AMT V600 2k × 2K CCD
camera. The point-to-point resolution and the line resolution of the machine are 0.24 nm
and 0.17 nm, respectively. To prepare specimens, samples were dropped onto the TEM
copper grids (400 mesh, carbon coated), then grids were dried in air. In this case, particle
size was analyzed using ImageJ program.
2.4. Cellular interaction of ABP-based micelles
2.4.1. Cell viability
For biomedical applications polymeric materials should be non-toxic to cells. A
variety of methods to estimate cell viabilities are available ranging from the most routine
trypan blue dye exclusion assay to highly complex analysis of individual cells using
RAMAN microscopy.[77]
The cost, speed, and complexity of equipment required play an
important role in determining the assay used.
Trypan blue is a simple method to determine cell viability. Trypan blue is
normally excreted from live cells. If cells take up trypan blue, they are considered non-
viable. Cell viability is calculated as the ratio of number of viable cells to the total
number of cells within the grids on the counting cell slide (hemocytometer).[78]
Tetrazolium-based assays are standard colorimetric methods, including 3-(4,5-
dimethylthiazol-2-yl)-2,5-diphenyltetrazolium bromide (MTT) and 3-(4,5-
dimethylthiazol-2-yl)-5-(3-carboxymethoxyphenyl)-2-(4-sulfophenyl)-2H-tetrazolium
(MTS) assays. Tetrazolium-based assays have several advantages over other methods,
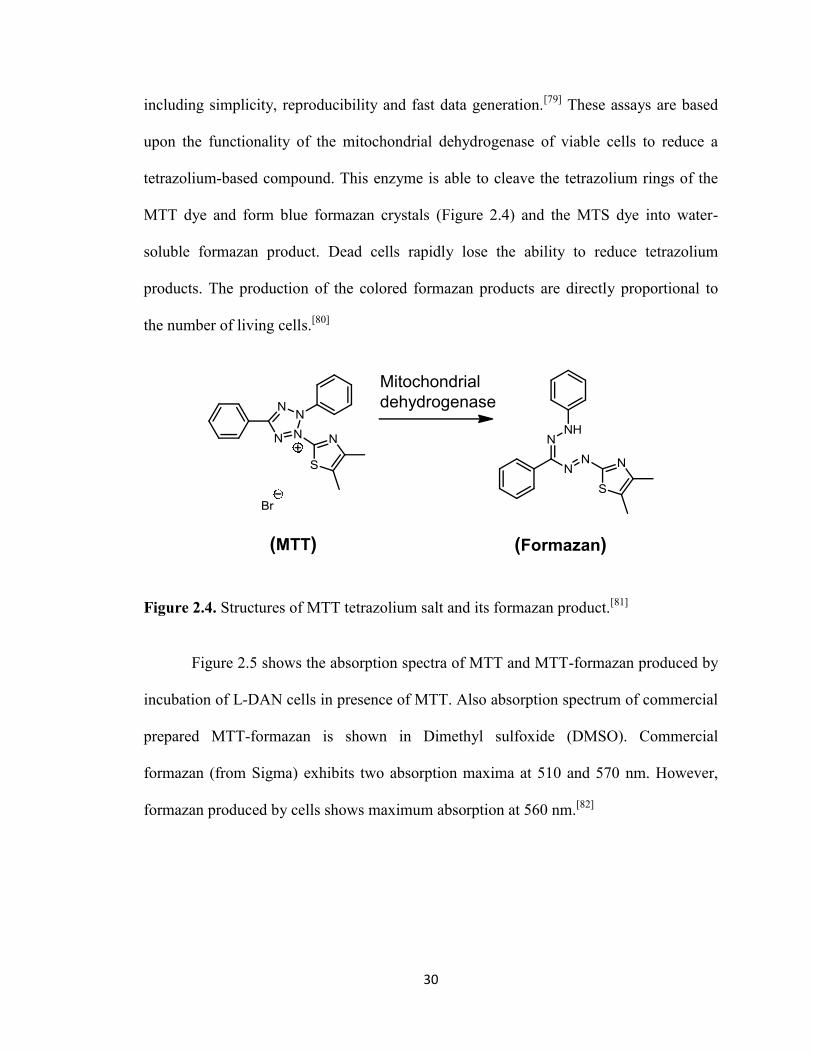
30
including simplicity, reproducibility and fast data generation.[79]
These assays are based
upon the functionality of the mitochondrial dehydrogenase of viable cells to reduce a
tetrazolium-based compound. This enzyme is able to cleave the tetrazolium rings of the
MTT dye and form blue formazan crystals (Figure 2.4) and the MTS dye into water-
soluble formazan product. Dead cells rapidly lose the ability to reduce tetrazolium
products. The production of the colored formazan products are directly proportional to
the number of living cells.[80]
Figure 2.4. Structures of MTT tetrazolium salt and its formazan product.[81]
Figure 2.5 shows the absorption spectra of MTT and MTT-formazan produced by
incubation of L-DAN cells in presence of MTT. Also absorption spectrum of commercial
prepared MTT-formazan is shown in Dimethyl sulfoxide (DMSO). Commercial
formazan (from Sigma) exhibits two absorption maxima at 510 and 570 nm. However,
formazan produced by cells shows maximum absorption at 560 nm.[82]
(MTT) (Formazan)
Mitochondrial
dehydrogenase
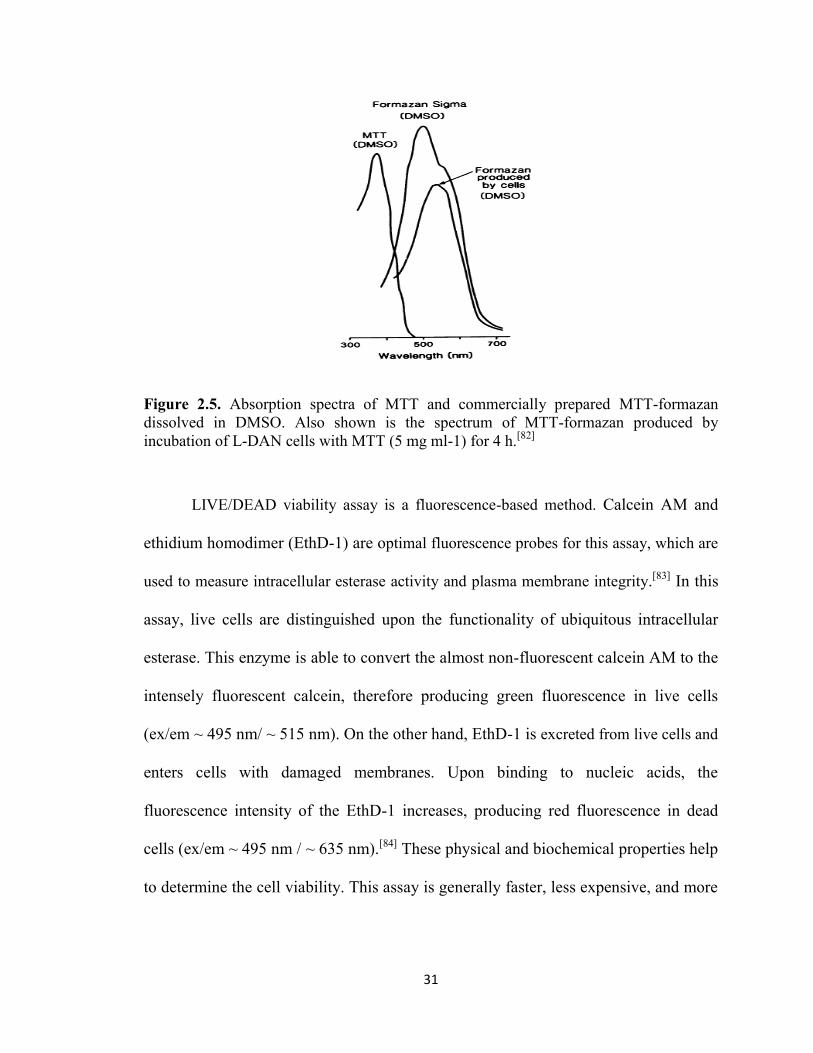
31
Figure 2.5. Absorption spectra of MTT and commercially prepared MTT-formazan
dissolved in DMSO. Also shown is the spectrum of MTT-formazan produced by
incubation of L-DAN cells with MTT (5 mg ml-1) for 4 h.[82]
LIVE/DEAD viability assay is a fluorescence-based method. Calcein AM and
ethidium homodimer (EthD-1) are optimal fluorescence probes for this assay, which are
used to measure intracellular esterase activity and plasma membrane integrity.[83] In this
assay, live cells are distinguished upon the functionality of ubiquitous intracellular
esterase. This enzyme is able to convert the almost non-fluorescent calcein AM to the
intensely fluorescent calcein, therefore producing green fluorescence in live cells
(ex/em ~ 495 nm/ ~ 515 nm). On the other hand, EthD-1 is excreted from live cells and
enters cells with damaged membranes. Upon binding to nucleic acids, the
fluorescence intensity of the EthD-1 increases, producing red fluorescence in dead
cells (ex/em ~ 495 nm / ~ 635 nm).[84] These physical and biochemical properties help
to determine the cell viability. This assay is generally faster, less expensive, and more
32
accurate than alternative methods. However it is more complicated than tetrazolium-
based assays and requires fluorescence microscope.
In my research, cell viability was measured using a CellTiter 96 Non-Radioactive
Cell Proliferation Assay kit (MTT, Promega). Measurements were performed according
to manufacturer’s instruction. Briefly, MTT solution (15 μL) was added into each well.
DMSO (100 μL) was added into each well in order to dissolve the formed formazan blue
crystals, and then the absorbance at λ = 570 nm was recorded using a Powerwave HT
Microplate Reader (Bio-Tek). Each concentration was repeated 12 times. Cell viability
was calculated as the percent ratio of absorbance of mixtures with micelles to control
(cells only).
33
Chapter 3
pH-Responsive Degradable Micelles
3.1. Introduction
pH-sensitive ABP micelles have been widely studied because of pH gradients in
normal and pathophysiological states.[41]
While stable in normal physiological conditions,
pH-sensitive micelles are destabilized in acidic environments, such as the interior of
tumors. Such destabilization facilitates the release of encapsulated drugs in a controlled
manner.[85]
Current strategies toward the development of pH-responsive micelles involve
the synthesis and aqueous micellization of acid-sensitive ABPs. Most these strategies are
achieved by either incorporating “titratable” groups, such as amines[86]
or carboxylic
acids[87]
into the copolymers, or utilizing labile linkages, such as hydrazones[53]
or ortho
esters.[52]
The latter is my strategy of interest.
A convenient method to prepare pH-responsive degradable micelles involves the
incorporation of pendant pH-sensitive cleavable groups into a hydrophobic block.
Hydrolytic cleavage of these groups in acidic environment increases the polarity of the
hydrophobic block, causing the micelles to be destabilized. The development of acid-
sensitive copolymers consisting of PEO as the hydrophilic block and different
hydrophobic blocks functionalized with pendant ortho ester moieties have been reported.
Typical hydrophobic blocks include poly(aspartic acid) (PAA),[88]
polylysine (PLL)
dendrons,[52]
and poly(methacrylamide).[89]
Despite these advances, the developments of
34
new types of pH-responsive degradable micelles are needed to better understand
structure-property relationship between morphological variance and pH responsive
degradation.
This chapter describes new hydroxyl-terminated ABPs having pendant pH-
sensitive t-butyl groups, consisting of hydrophilic poly(oligo(ethylene oxide)
monomethyl ether methacrylate) (POEOMA) and hydrophobic poly(t-butyl methacrylate)
(PtBMA) blocks. These HO-terminated POEOMA-b-PtBMA block copolymers (HO-
ABPs) were synthesized by consecutive atom transfer radical polymerization (ATRP) of
OEOMA and tBMA in the presence of a HO-functionalized bromine initiator (OH-
iBuBr). Figure 3.1 shows the synthetic scheme and rational design of HO-ABPs as
potential drug delivery nanocarriers. First, POEOMA was chosen as the hydrophilic
block because of its high water solubility and as a biocompatible analog of linear PEO, a
material approved by the FDA for clinical use.[90]
Second, PtBMA as core-forming block
enables the encapsulation of hydrophobic therapeutics. Also it is potentially degradable
through hydrolytic cleavage of pendant t-butyl groups to water-soluble poly(methacrylic
acid) (PMAA) in acidic conditions. Third, since tBMA was commercially available, the
synthesis of new monomers having pendant cleavable groups is not required. Fourth, in
order to prove a facile bioconjugation of HO-ABPs with cell targeting biomolecules,
here, terminal OH groups were conjugated with biotin (vitamin H) for the synthesis of
biotin-terminated ABPs.
This chapter comprises material published in Journal of Polymer Science Part A:
Polymer Chemistry, 2013, 51, 1620-1629. Part of this text is adapted from the original
source material.
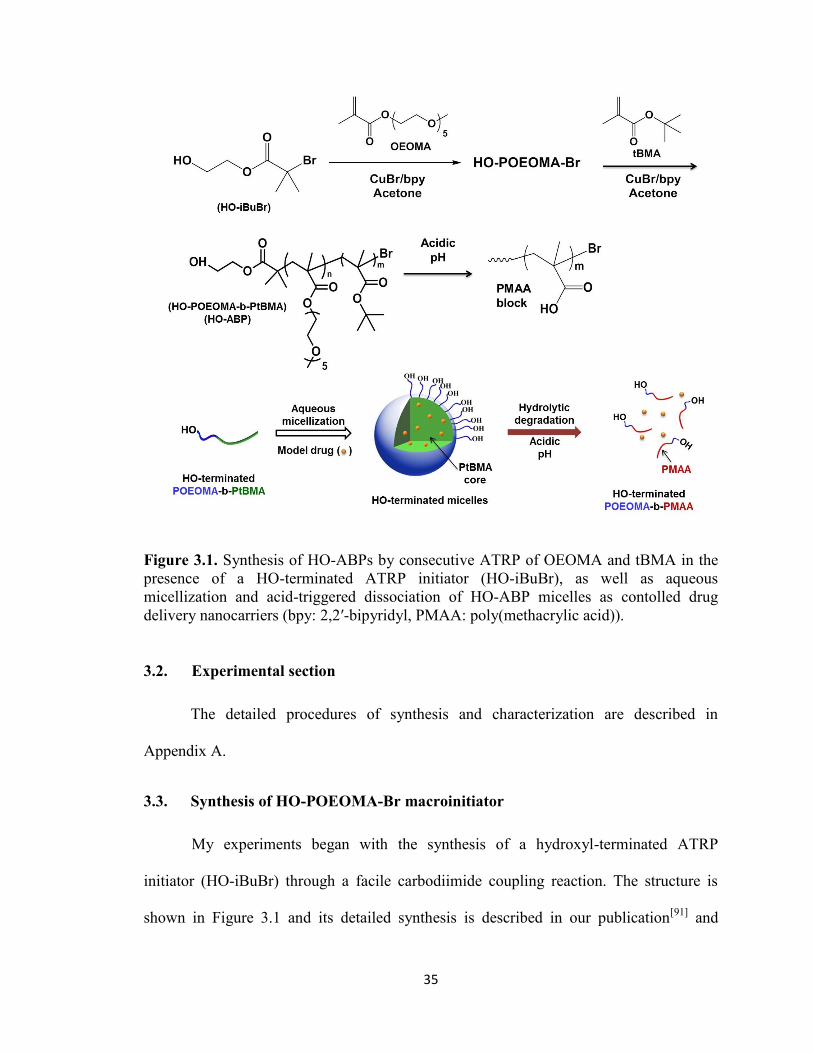
35
Figure 3.1. Synthesis of HO-ABPs by consecutive ATRP of OEOMA and tBMA in the
presence of a HO-terminated ATRP initiator (HO-iBuBr), as well as aqueous
micellization and acid-triggered dissociation of HO-ABP micelles as contolled drug
delivery nanocarriers (bpy: 2,2′-bipyridyl, PMAA: poly(methacrylic acid)).
3.2. Experimental section
The detailed procedures of synthesis and characterization are described in
Appendix A.
3.3. Synthesis of HO-POEOMA-Br macroinitiator
My experiments began with the synthesis of a hydroxyl-terminated ATRP
initiator (HO-iBuBr) through a facile carbodiimide coupling reaction. The structure is
shown in Figure 3.1 and its detailed synthesis is described in our publication[91]
and
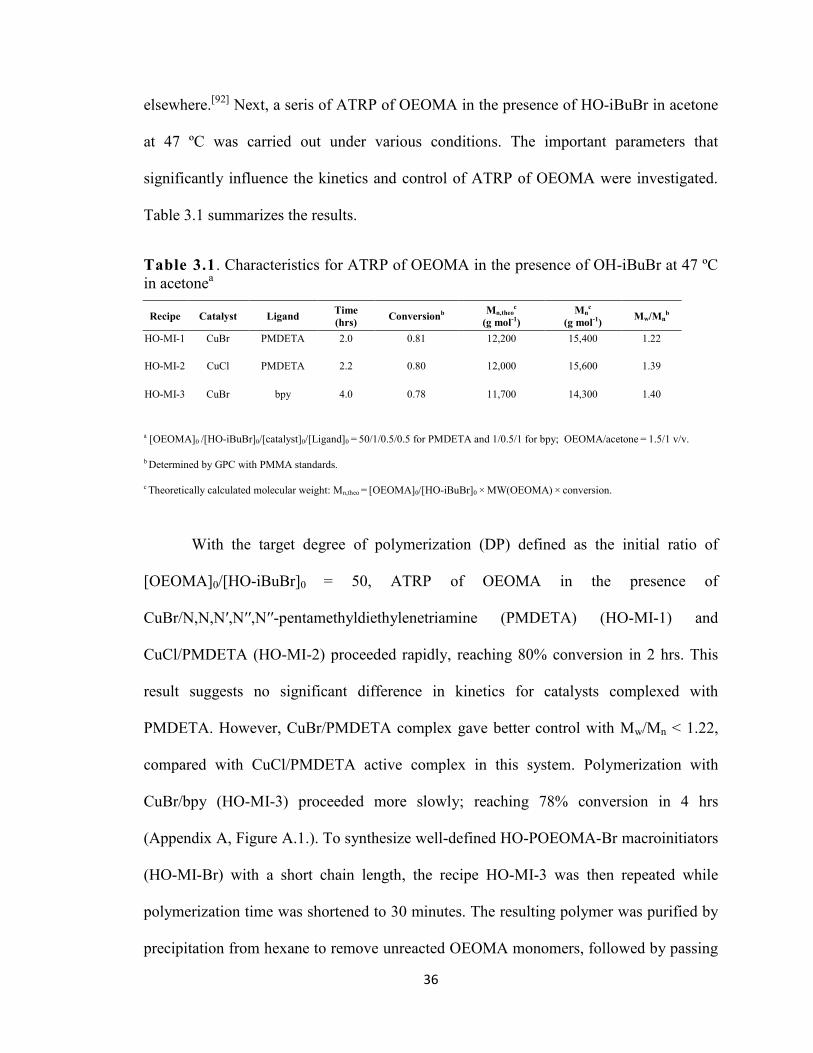
36
elsewhere.[92]
Next, a seris of ATRP of OEOMA in the presence of HO-iBuBr in acetone
at 47 ºC was carried out under various conditions. The important parameters that
significantly influence the kinetics and control of ATRP of OEOMA were investigated.
Table 3.1 summarizes the results.
Table 3.1. Characteristics for ATRP of OEOMA in the presence of OH-iBuBr at 47 ºC
in acetonea
Recipe Catalyst Ligand Time
(hrs) Conversionb
Mn,theoc
(g mol-1)
Mnc
(g mol-1) Mw/Mn
b
HO-MI-1 CuBr PMDETA 2.0 0.81 12,200 15,400 1.22
HO-MI-2 CuCl PMDETA 2.2 0.80 12,000 15,600 1.39
HO-MI-3 CuBr bpy 4.0 0.78 11,700 14,300 1.40
a [OEOMA]0 /[HO-iBuBr]0/[catalyst]0/[Ligand]0 = 50/1/0.5/0.5 for PMDETA and 1/0.5/1 for bpy; OEOMA/acetone = 1.5/1 v/v.
b Determined by GPC with PMMA standards.
c Theoretically calculated molecular weight: Mn,theo = [OEOMA]0/[HO-iBuBr]0 × MW(OEOMA) × conversion.
With the target degree of polymerization (DP) defined as the initial ratio of
[OEOMA]0/[HO-iBuBr]0 = 50, ATRP of OEOMA in the presence of
CuBr/N,N,N′,N′′,N′′-pentamethyldiethylenetriamine (PMDETA) (HO-MI-1) and
CuCl/PMDETA (HO-MI-2) proceeded rapidly, reaching 80% conversion in 2 hrs. This
result suggests no significant difference in kinetics for catalysts complexed with
PMDETA. However, CuBr/PMDETA complex gave better control with Mw/Mn < 1.22,
compared with CuCl/PMDETA active complex in this system. Polymerization with
CuBr/bpy (HO-MI-3) proceeded more slowly; reaching 78% conversion in 4 hrs
(Appendix A, Figure A.1.). To synthesize well-defined HO-POEOMA-Br macroinitiators
(HO-MI-Br) with a short chain length, the recipe HO-MI-3 was then repeated while
polymerization time was shortened to 30 minutes. The resulting polymer was purified by
precipitation from hexane to remove unreacted OEOMA monomers, followed by passing
37
it through a column filled with basic aluminum oxide to remove residual Cu species. The
gel permeation chromatography (GPC) results indicate that the resulting HO-POEOMA-
Br had molecular weight, Mn = 9,500 g mol−1
with molecular weight distribution as
narrow as Mw/Mn = 1.22 (Figure 3.2). 1H-NMR was used to determine the DP (Figure
3.3a). A NMR signal at 1.4 ppm corresponds to two methyl protons (a) and the singlet
appeared at 3.3 ppm corresponds to methoxy protons. From the integral ratio of peaks
[(b/3)/(a/6)] (Figure 3.3a), the DP of HO-POEOMA-Br (HO-MI-Br) was determined to
be 19.
3.4. Synthesis of HO-POEOMA-b-PtBMA ABP
In the presence of the dried, purified HO-POEOMA19-Br MIs, ATRP of tBMA
was conducted in acetone at 47 °C under the conditions of [tBMA]0/[HO-POEOMA-
Br]0/[CuBr]0/[bpy]0 = 200/1/0.5/1. The GPC trace evolved to a higher molecular weight
region with Mn = 20,800 g mol−1
and Mw/Mn = 1.24 (Figure 3.2). From the integral ratio
of [(c/9)/(b/3)] with the DP = 19 for HO-POEOMA-Br, the 1H-NMR integration was
used to determine the DP of the PtBMA block to be 67 (Figure 3.3b). The GPC and 1H-
NMR results suggest the successful synthesis of well-controlled HO-POEOMA19-b-
PtBMA67 (HO-ABP) with narrow molecular weight distribution (Mw/Mn < 1.24).
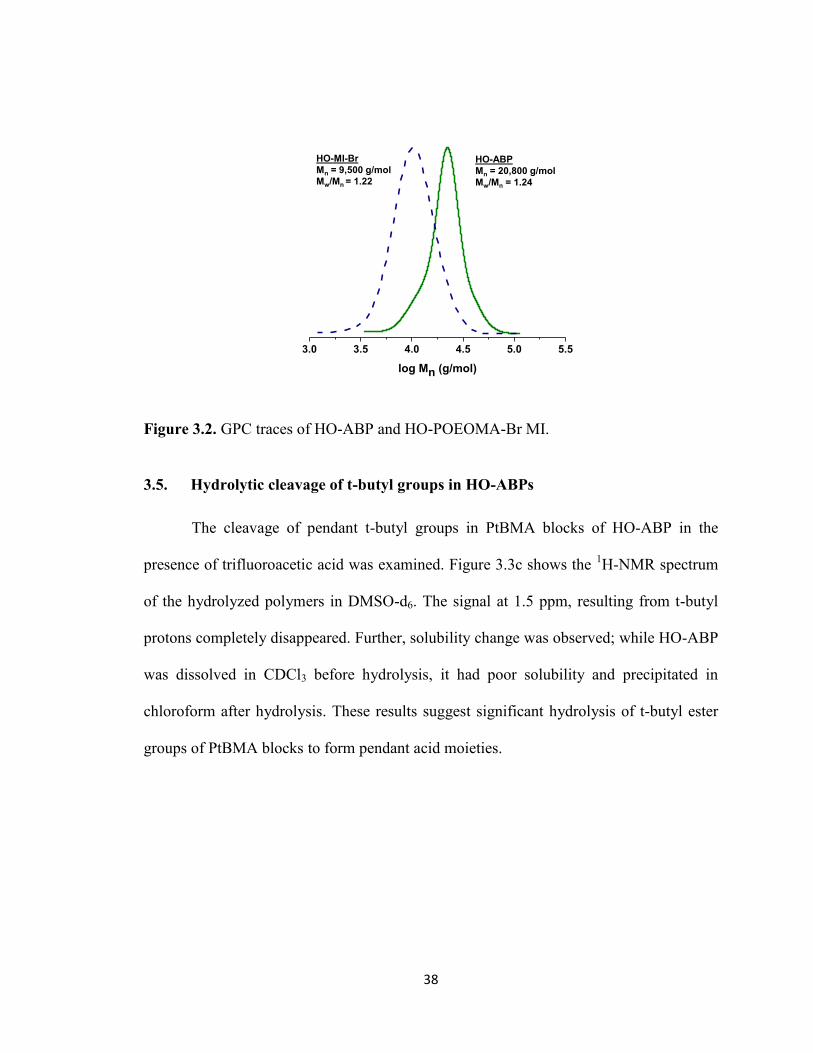
38
Figure 3.2. GPC traces of HO-ABP and HO-POEOMA-Br MI.
3.5. Hydrolytic cleavage of t-butyl groups in HO-ABPs
The cleavage of pendant t-butyl groups in PtBMA blocks of HO-ABP in the
presence of trifluoroacetic acid was examined. Figure 3.3c shows the 1H-NMR spectrum
of the hydrolyzed polymers in DMSO-d6. The signal at 1.5 ppm, resulting from t-butyl
protons completely disappeared. Further, solubility change was observed; while HO-ABP
was dissolved in CDCl3 before hydrolysis, it had poor solubility and precipitated in
chloroform after hydrolysis. These results suggest significant hydrolysis of t-butyl ester
groups of PtBMA blocks to form pendant acid moieties.
3.0 3.5 4.0 4.5 5.0 5.5
log Mn (g/mol)
HO-MI-Br
Mn = 9,500 g/mol
Mw/Mn = 1.22
HO-ABP
Mn = 20,800 g/mol
Mw/Mn = 1.24
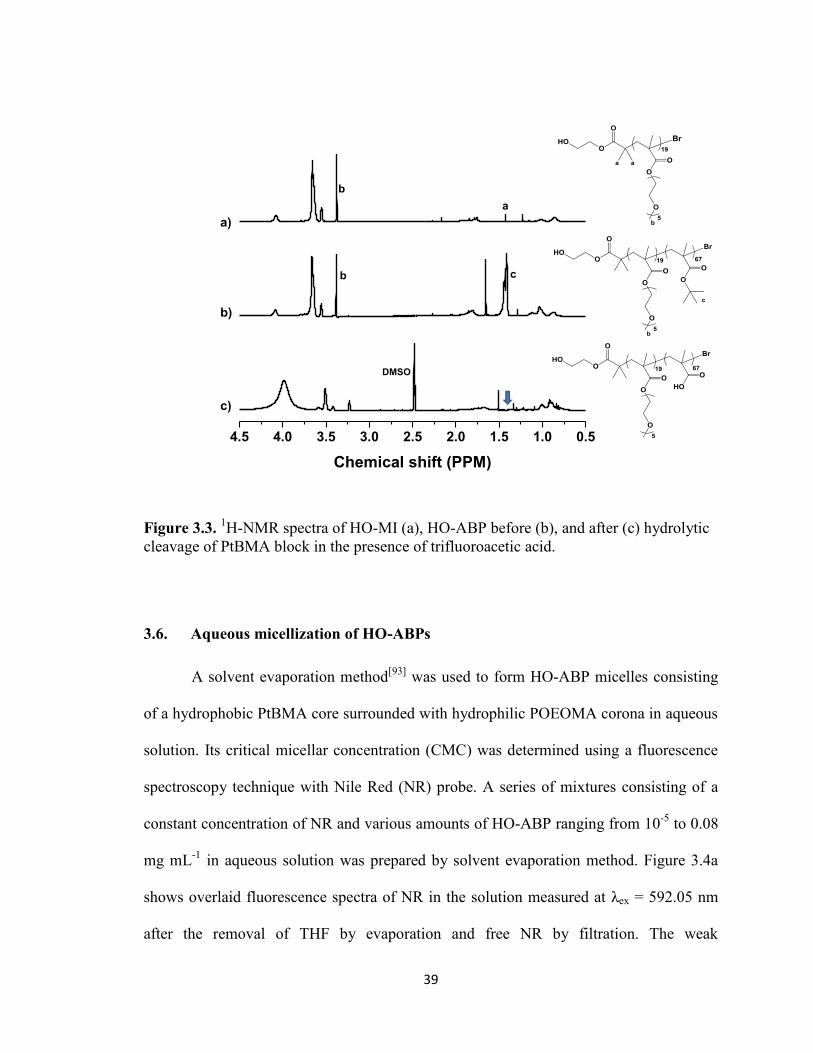
39
Figure 3.3. 1H-NMR spectra of HO-MI (a), HO-ABP before (b), and after (c) hydrolytic
cleavage of PtBMA block in the presence of trifluoroacetic acid.
3.6. Aqueous micellization of HO-ABPs
A solvent evaporation method[93]
was used to form HO-ABP micelles consisting
of a hydrophobic PtBMA core surrounded with hydrophilic POEOMA corona in aqueous
solution. Its critical micellar concentration (CMC) was determined using a fluorescence
spectroscopy technique with Nile Red (NR) probe. A series of mixtures consisting of a
constant concentration of NR and various amounts of HO-ABP ranging from 10-5
to 0.08
mg mL-1
in aqueous solution was prepared by solvent evaporation method. Figure 3.4a
shows overlaid fluorescence spectra of NR in the solution measured at λex = 592.05 nm
after the removal of THF by evaporation and free NR by filtration. The weak
4.5 4.0 3.5 3.0 2.5 2.0 1.5 1.0 0.5
Chemical shift (PPM)
a)
b
a
DMSO
b
c
b)
c)
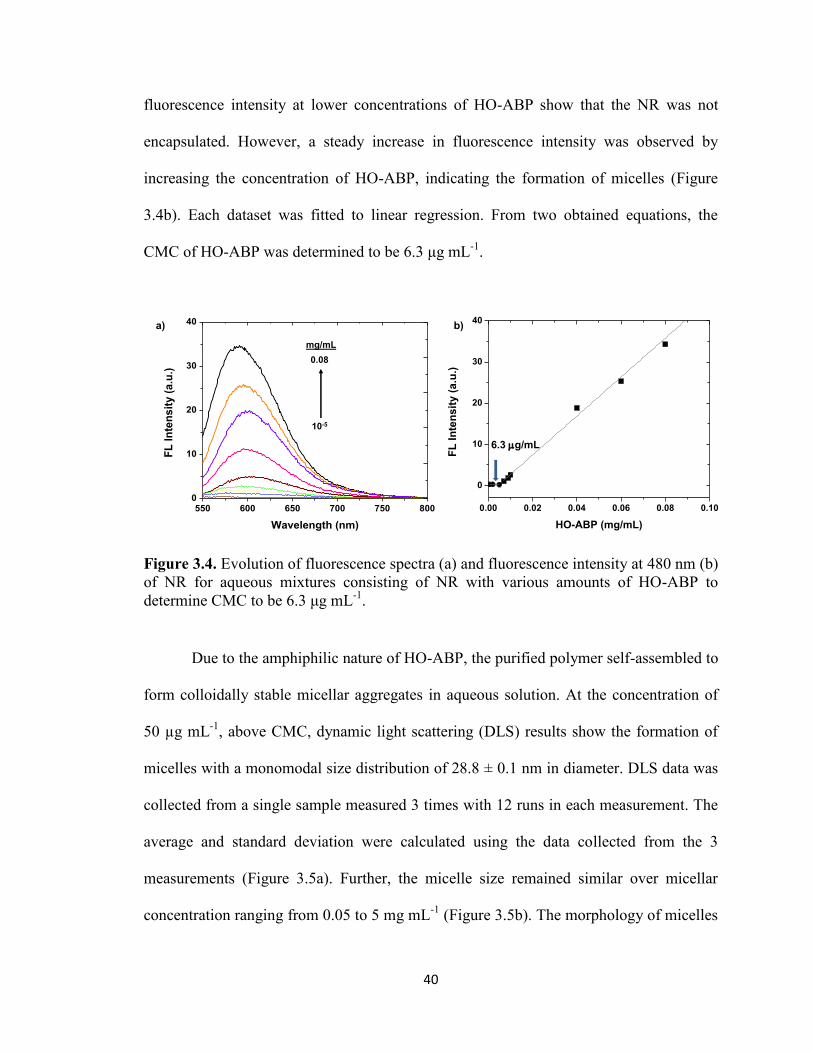
40
fluorescence intensity at lower concentrations of HO-ABP show that the NR was not
encapsulated. However, a steady increase in fluorescence intensity was observed by
increasing the concentration of HO-ABP, indicating the formation of micelles (Figure
3.4b). Each dataset was fitted to linear regression. From two obtained equations, the
CMC of HO-ABP was determined to be 6.3 μg mL-1
.
Figure 3.4. Evolution of fluorescence spectra (a) and fluorescence intensity at 480 nm (b)
of NR for aqueous mixtures consisting of NR with various amounts of HO-ABP to
determine CMC to be 6.3 μg mL-1
.
Due to the amphiphilic nature of HO-ABP, the purified polymer self-assembled to
form colloidally stable micellar aggregates in aqueous solution. At the concentration of
50 µg mL-1
, above CMC, dynamic light scattering (DLS) results show the formation of
micelles with a monomodal size distribution of 28.8 ± 0.1 nm in diameter. DLS data was
collected from a single sample measured 3 times with 12 runs in each measurement. The
average and standard deviation were calculated using the data collected from the 3
measurements (Figure 3.5a). Further, the micelle size remained similar over micellar
concentration ranging from 0.05 to 5 mg mL-1
(Figure 3.5b). The morphology of micelles
550 600 650 700 750 8000
10
20
30
40
FL
In
ten
sit
y (
a.u
.)
Wavelength (nm)
0.00 0.02 0.04 0.06 0.08 0.10
0
10
20
30
40
FL
In
ten
sit
y (
a.u
.)
HO-ABP (mg/mL)
a) b)
10-5
mg/mL
6.3 g/mL
0.08
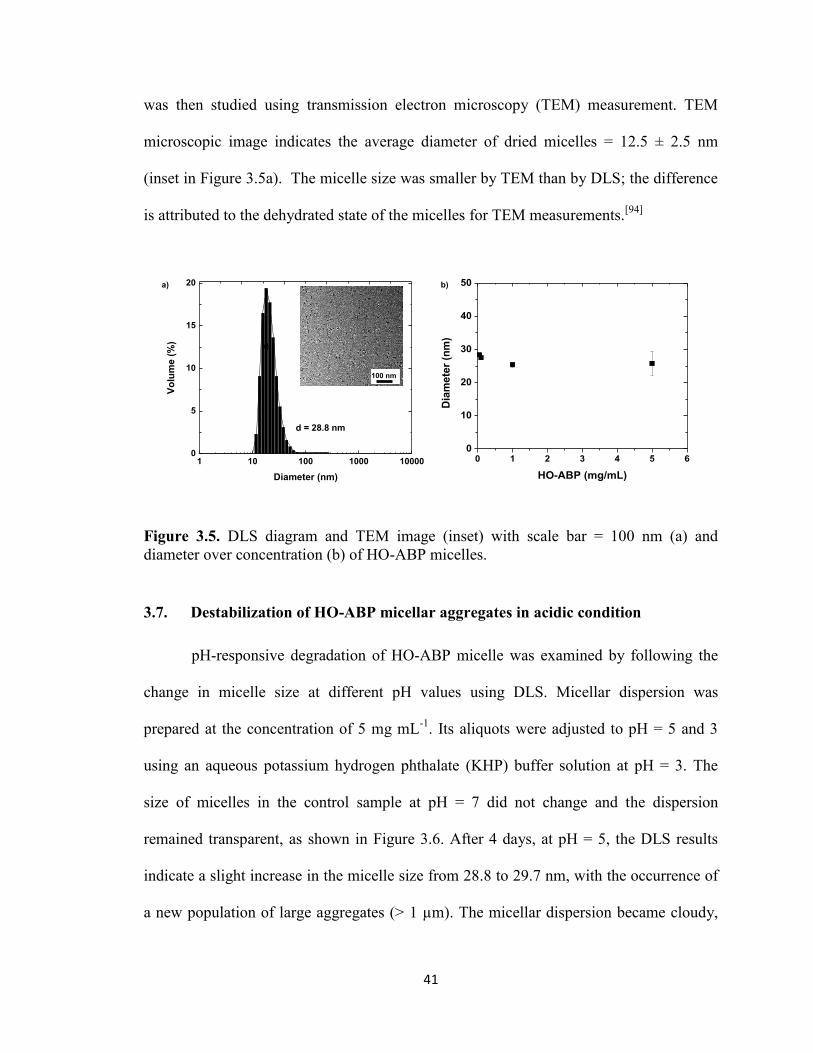
41
was then studied using transmission electron microscopy (TEM) measurement. TEM
microscopic image indicates the average diameter of dried micelles = 12.5 ± 2.5 nm
(inset in Figure 3.5a). The micelle size was smaller by TEM than by DLS; the difference
is attributed to the dehydrated state of the micelles for TEM measurements.[94]
Figure 3.5. DLS diagram and TEM image (inset) with scale bar = 100 nm (a) and
diameter over concentration (b) of HO-ABP micelles.
3.7. Destabilization of HO-ABP micellar aggregates in acidic condition
pH-responsive degradation of HO-ABP micelle was examined by following the
change in micelle size at different pH values using DLS. Micellar dispersion was
prepared at the concentration of 5 mg mL-1
. Its aliquots were adjusted to pH = 5 and 3
using an aqueous potassium hydrogen phthalate (KHP) buffer solution at pH = 3. The
size of micelles in the control sample at pH = 7 did not change and the dispersion
remained transparent, as shown in Figure 3.6. After 4 days, at pH = 5, the DLS results
indicate a slight increase in the micelle size from 28.8 to 29.7 nm, with the occurrence of
a new population of large aggregates (> 1 µm). The micellar dispersion became cloudy,
1 10 100 1000 100000
5
10
15
20
Vo
lum
e (
%)
Diameter (nm)
d = 28.8 nm
a)
100 nm
0 1 2 3 4 5 60
10
20
30
40
50
Dia
me
ter
(nm
)
HO-ABP (mg/mL)
a) b)
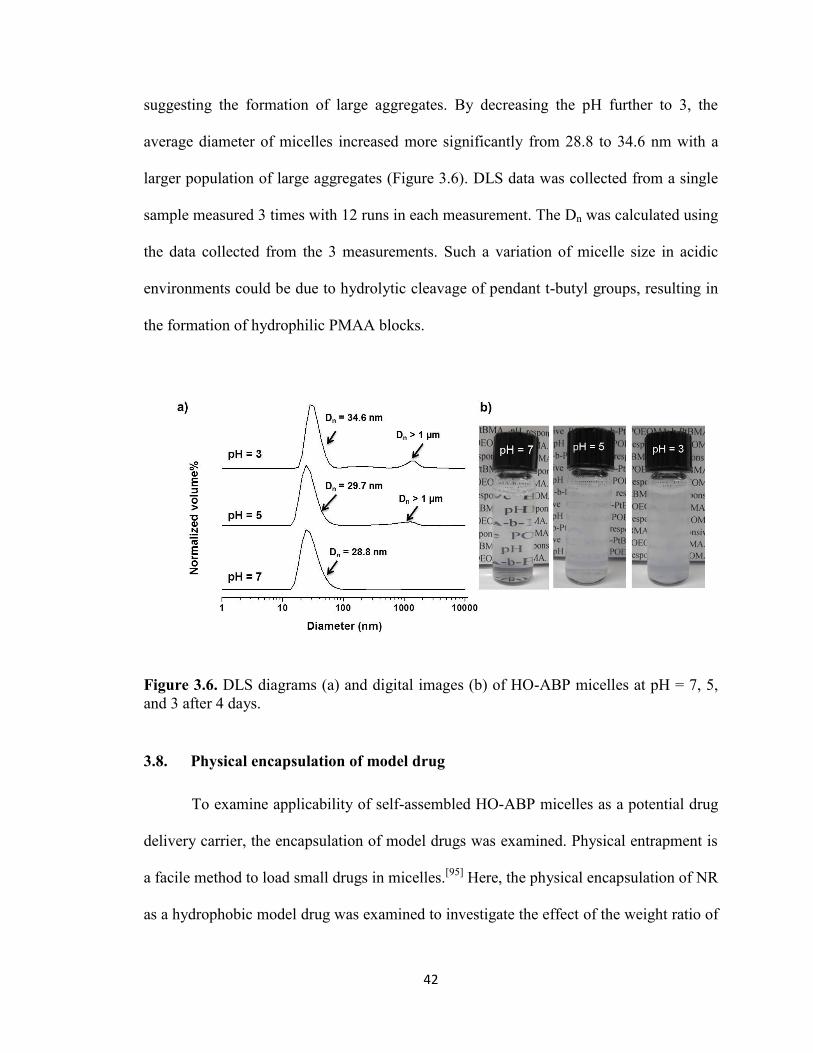
42
suggesting the formation of large aggregates. By decreasing the pH further to 3, the
average diameter of micelles increased more significantly from 28.8 to 34.6 nm with a
larger population of large aggregates (Figure 3.6). DLS data was collected from a single
sample measured 3 times with 12 runs in each measurement. The Dn was calculated using
the data collected from the 3 measurements. Such a variation of micelle size in acidic
environments could be due to hydrolytic cleavage of pendant t-butyl groups, resulting in
the formation of hydrophilic PMAA blocks.
Figure 3.6. DLS diagrams (a) and digital images (b) of HO-ABP micelles at pH = 7, 5,
and 3 after 4 days.
3.8. Physical encapsulation of model drug
To examine applicability of self-assembled HO-ABP micelles as a potential drug
delivery carrier, the encapsulation of model drugs was examined. Physical entrapment is
a facile method to load small drugs in micelles.[95]
Here, the physical encapsulation of NR
as a hydrophobic model drug was examined to investigate the effect of the weight ratio of
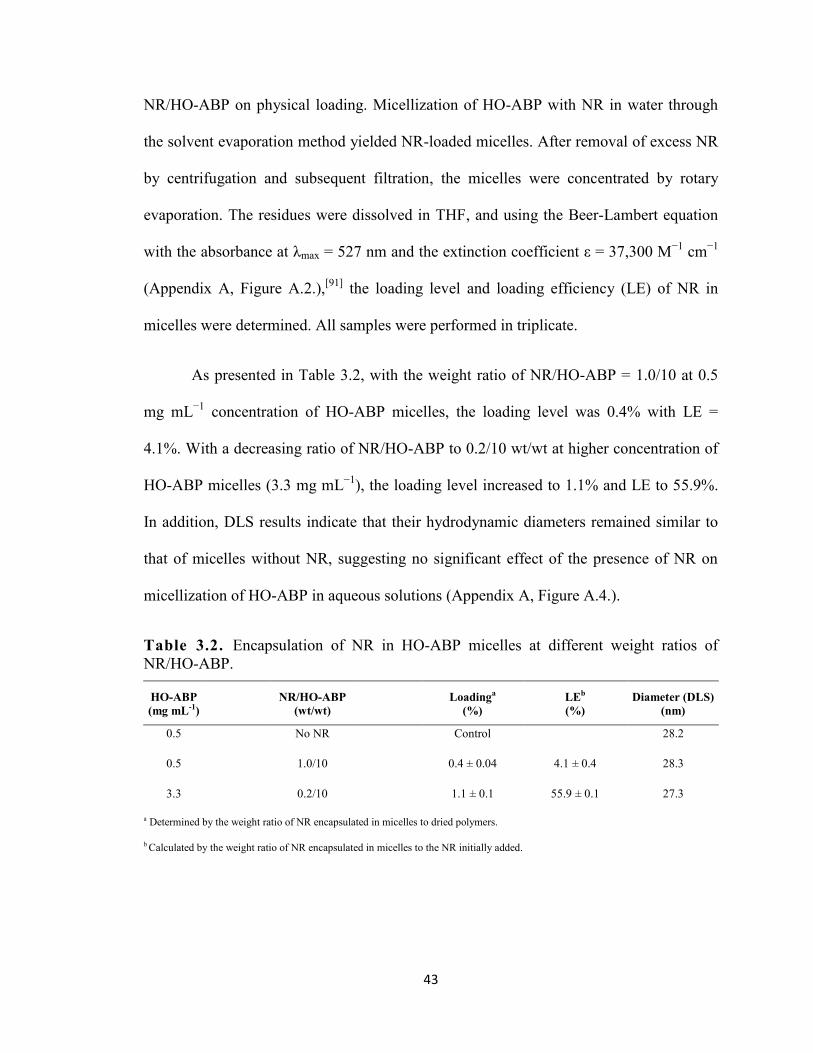
43
NR/HO-ABP on physical loading. Micellization of HO-ABP with NR in water through
the solvent evaporation method yielded NR-loaded micelles. After removal of excess NR
by centrifugation and subsequent filtration, the micelles were concentrated by rotary
evaporation. The residues were dissolved in THF, and using the Beer-Lambert equation
with the absorbance at λmax = 527 nm and the extinction coefficient ε = 37,300 M−1
cm−1
(Appendix A, Figure A.2.),[91]
the loading level and loading efficiency (LE) of NR in
micelles were determined. All samples were performed in triplicate.
As presented in Table 3.2, with the weight ratio of NR/HO-ABP = 1.0/10 at 0.5
mg mL−1
concentration of HO-ABP micelles, the loading level was 0.4% with LE =
4.1%. With a decreasing ratio of NR/HO-ABP to 0.2/10 wt/wt at higher concentration of
HO-ABP micelles (3.3 mg mL−1
), the loading level increased to 1.1% and LE to 55.9%.
In addition, DLS results indicate that their hydrodynamic diameters remained similar to
that of micelles without NR, suggesting no significant effect of the presence of NR on
micellization of HO-ABP in aqueous solutions (Appendix A, Figure A.4.).
Table 3.2. Encapsulation of NR in HO-ABP micelles at different weight ratios of
NR/HO-ABP.
HO-ABP
(mg mL-1) NR/HO-ABP
(wt/wt) Loadinga
(%)
LEb
(%)
Diameter (DLS)
(nm)
0.5
No NR
Control
28.2
0.5
1.0/10
0.4 ± 0.04 4.1 ± 0.4 28.3
3.3
0.2/10
1.1 ± 0.1 55.9 ± 0.1 27.3
a Determined by the weight ratio of NR encapsulated in micelles to dried polymers.
b Calculated by the weight ratio of NR encapsulated in micelles to the NR initially added.
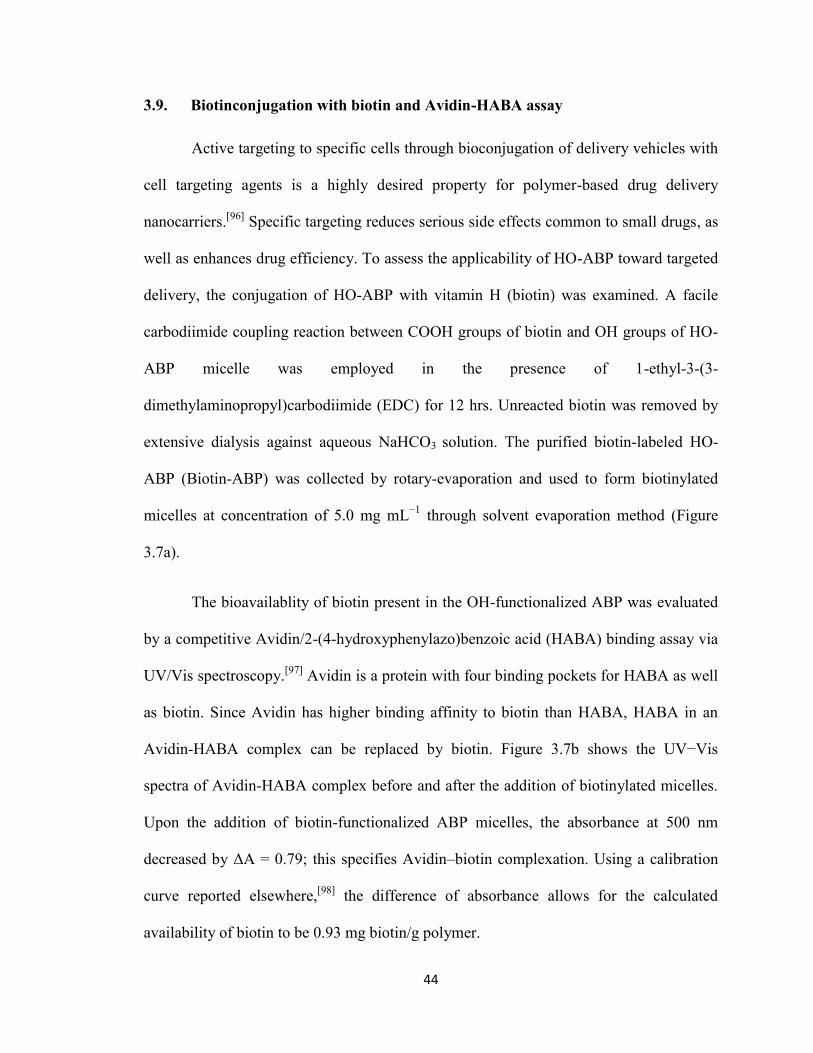
44
3.9. Biotinconjugation with biotin and Avidin-HABA assay
Active targeting to specific cells through bioconjugation of delivery vehicles with
cell targeting agents is a highly desired property for polymer-based drug delivery
nanocarriers.[96]
Specific targeting reduces serious side effects common to small drugs, as
well as enhances drug efficiency. To assess the applicability of HO-ABP toward targeted
delivery, the conjugation of HO-ABP with vitamin H (biotin) was examined. A facile
carbodiimide coupling reaction between COOH groups of biotin and OH groups of HO-
ABP micelle was employed in the presence of 1-ethyl-3-(3-
dimethylaminopropyl)carbodiimide (EDC) for 12 hrs. Unreacted biotin was removed by
extensive dialysis against aqueous NaHCO3 solution. The purified biotin-labeled HO-
ABP (Biotin-ABP) was collected by rotary-evaporation and used to form biotinylated
micelles at concentration of 5.0 mg mL−1
through solvent evaporation method (Figure
3.7a).
The bioavailablity of biotin present in the OH-functionalized ABP was evaluated
by a competitive Avidin/2-(4-hydroxyphenylazo)benzoic acid (HABA) binding assay via
UV/Vis spectroscopy.[97]
Avidin is a protein with four binding pockets for HABA as well
as biotin. Since Avidin has higher binding affinity to biotin than HABA, HABA in an
Avidin-HABA complex can be replaced by biotin. Figure 3.7b shows the UV−Vis
spectra of Avidin-HABA complex before and after the addition of biotinylated micelles.
Upon the addition of biotin-functionalized ABP micelles, the absorbance at 500 nm
decreased by ΔA = 0.79; this specifies Avidin–biotin complexation. Using a calibration
curve reported elsewhere,[98]
the difference of absorbance allows for the calculated
availability of biotin to be 0.93 mg biotin/g polymer.
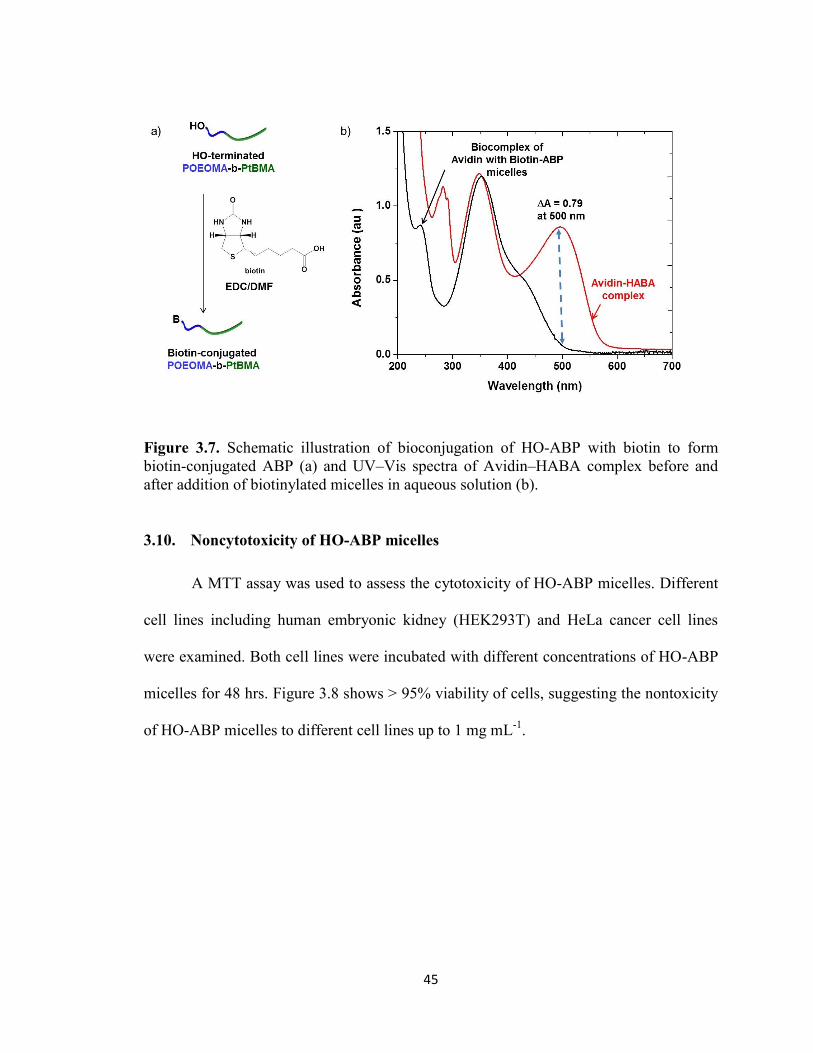
45
Figure 3.7. Schematic illustration of bioconjugation of HO-ABP with biotin to form
biotin-conjugated ABP (a) and UV–Vis spectra of Avidin–HABA complex before and
after addition of biotinylated micelles in aqueous solution (b).
3.10. Noncytotoxicity of HO-ABP micelles
A MTT assay was used to assess the cytotoxicity of HO-ABP micelles. Different
cell lines including human embryonic kidney (HEK293T) and HeLa cancer cell lines
were examined. Both cell lines were incubated with different concentrations of HO-ABP
micelles for 48 hrs. Figure 3.8 shows > 95% viability of cells, suggesting the nontoxicity
of HO-ABP micelles to different cell lines up to 1 mg mL-1
.
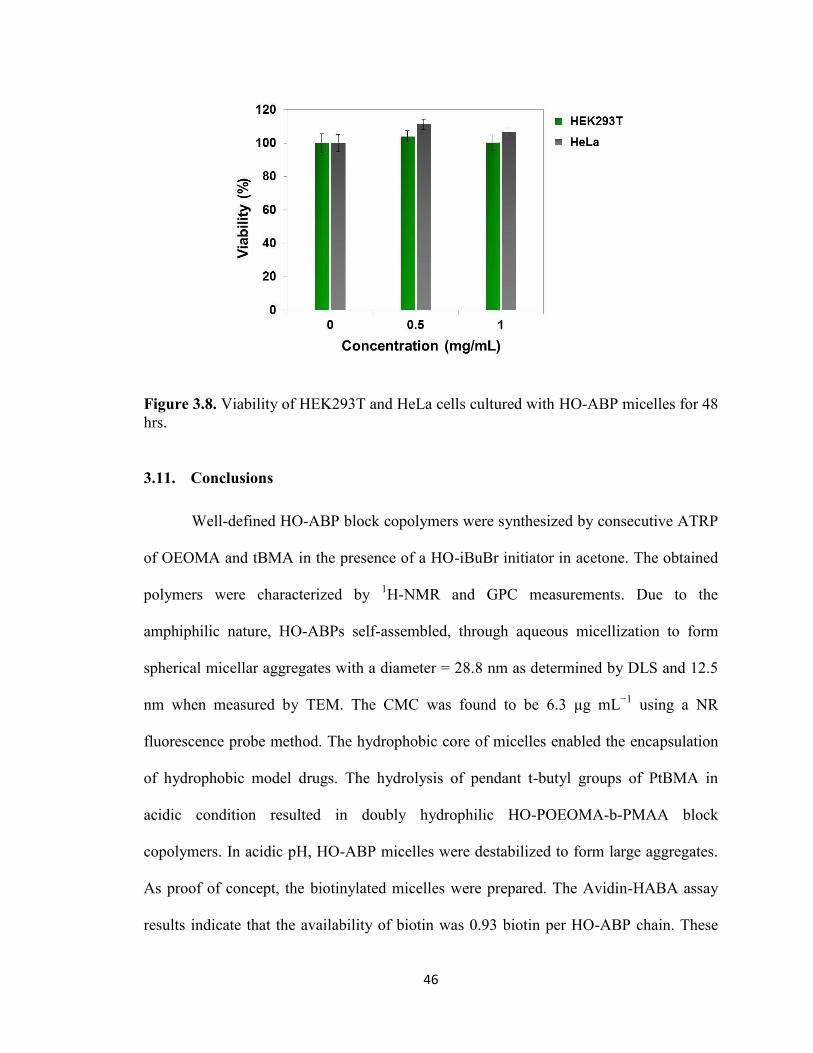
46
Figure 3.8. Viability of HEK293T and HeLa cells cultured with HO-ABP micelles for 48
hrs.
3.11. Conclusions
Well-defined HO-ABP block copolymers were synthesized by consecutive ATRP
of OEOMA and tBMA in the presence of a HO-iBuBr initiator in acetone. The obtained
polymers were characterized by 1H-NMR and GPC measurements. Due to the
amphiphilic nature, HO-ABPs self-assembled, through aqueous micellization to form
spherical micellar aggregates with a diameter = 28.8 nm as determined by DLS and 12.5
nm when measured by TEM. The CMC was found to be 6.3 μg mL−1
using a NR
fluorescence probe method. The hydrophobic core of micelles enabled the encapsulation
of hydrophobic model drugs. The hydrolysis of pendant t-butyl groups of PtBMA in
acidic condition resulted in doubly hydrophilic HO-POEOMA-b-PMAA block
copolymers. In acidic pH, HO-ABP micelles were destabilized to form large aggregates.
As proof of concept, the biotinylated micelles were prepared. The Avidin-HABA assay
results indicate that the availability of biotin was 0.93 biotin per HO-ABP chain. These
47
results, combined with noncytotoxicity, suggest that new HO-terminated ABP micelles
have potential as controlled drug delivery carriers in response to acidic conditions.
48
Chapter 4
Thiol-Responsive Mono-Cleavable Micelles
4.1. Introduction
A strategy toward the development of reduction-sensitive degradable micelles
involves the introduction of disulfide linkages into well-defined ABPs.[55]
Different
number of disulfide linkages are positioned at various locations; such as in main chains,
at side chains, or the cross-links.[17, 99]
For reductively degradable micelles having
disulfides in main chains, backbone multi-cleavable micelles[21, 62, 100]
and sheddable
micelles[101]
have been reported. Their characteristics are described in Section 1.5 in
Chapter 1. Mono-cleavable micelles are new and based on symmetric triblock copolymer
having single disulfides in the middle blocks. After our publication,[102]
several examples
of mono-cleavable micelles have been reported. They include multi-armed poly(ε-
caprolactone)-b-poly(ethylene oxide) copolymers,[103]
comb-like alternating copolymers
consisting of styrenic and N-(2-hydroxyethyl) maleimide units[40]
and polypeptides with
diethylene glycol-L-glutamate N-carboxyanhydride.[104]
This chapter describes the first example of mono-cleavable micelles based on
novel comb-type triblock copolymers consisting of hydrophilic POEOMA and
hydrophobic poly(oligo(propylene oxide) monononylphenyl ether acrylate (PAP) blocks.
As illustrated in Figure 4.1, single disulfide linkages are positioned in the center of the
triblock copolymers; thus named POEOMA-b-PAP-ss-PAP-b-POEOMA (ss-ABP2).
49
These block copolymers were synthesized by a consecutive ATRP of oligo(propylene
oxide) monononylphenyl ether acrylate (AP) in the presence of a difunctional Br-initiator
labeled with a disulfide linkage (SS-DBr) and then OEOMA. The resulting ss-ABP2 self-
assembled to form colloidally stable micellar aggregates in aqueous solutions at
concentration above the CMC. Their thiol-responsive degradation by cleavage of
disulfide linkages in their micelle cores led to a change in morphology to smaller
aggregate structures, as confirmed by dynamic light scattering (DLS) and atomic force
microscopy (AFM) measurements.
This chapter comprises material published in Macromolecular Rapid
Communications, 2011, 32, 1652-1657. Part of this text is adapted from the original
source material.
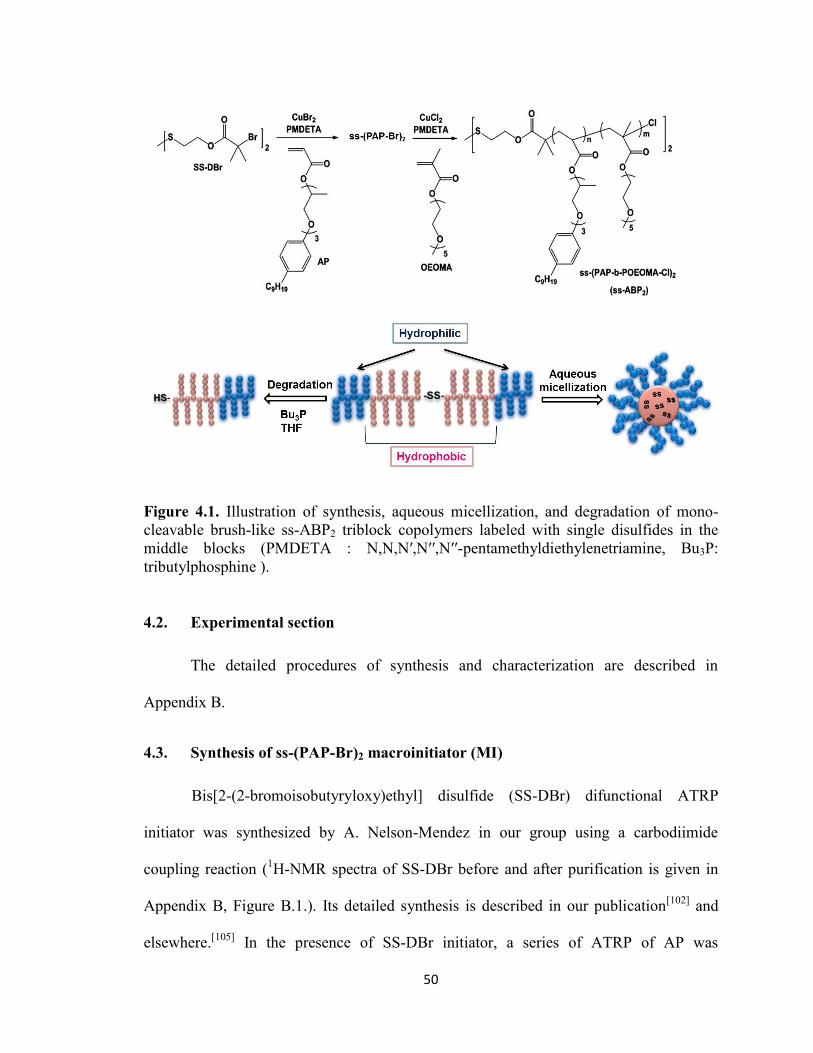
50
Figure 4.1. Illustration of synthesis, aqueous micellization, and degradation of mono-
cleavable brush-like ss-ABP2 triblock copolymers labeled with single disulfides in the
middle blocks (PMDETA : N,N,N′,N′′,N′′-pentamethyldiethylenetriamine, Bu3P:
tributylphosphine ).
4.2. Experimental section
The detailed procedures of synthesis and characterization are described in
Appendix B.
4.3. Synthesis of ss-(PAP-Br)2 macroinitiator (MI)
Bis[2-(2-bromoisobutyryloxy)ethyl] disulfide (SS-DBr) difunctional ATRP
initiator was synthesized by A. Nelson-Mendez in our group using a carbodiimide
coupling reaction (1H-NMR spectra of SS-DBr before and after purification is given in
Appendix B, Figure B.1.). Its detailed synthesis is described in our publication[102]
and
elsewhere.[105]
In the presence of SS-DBr initiator, a series of ATRP of AP was
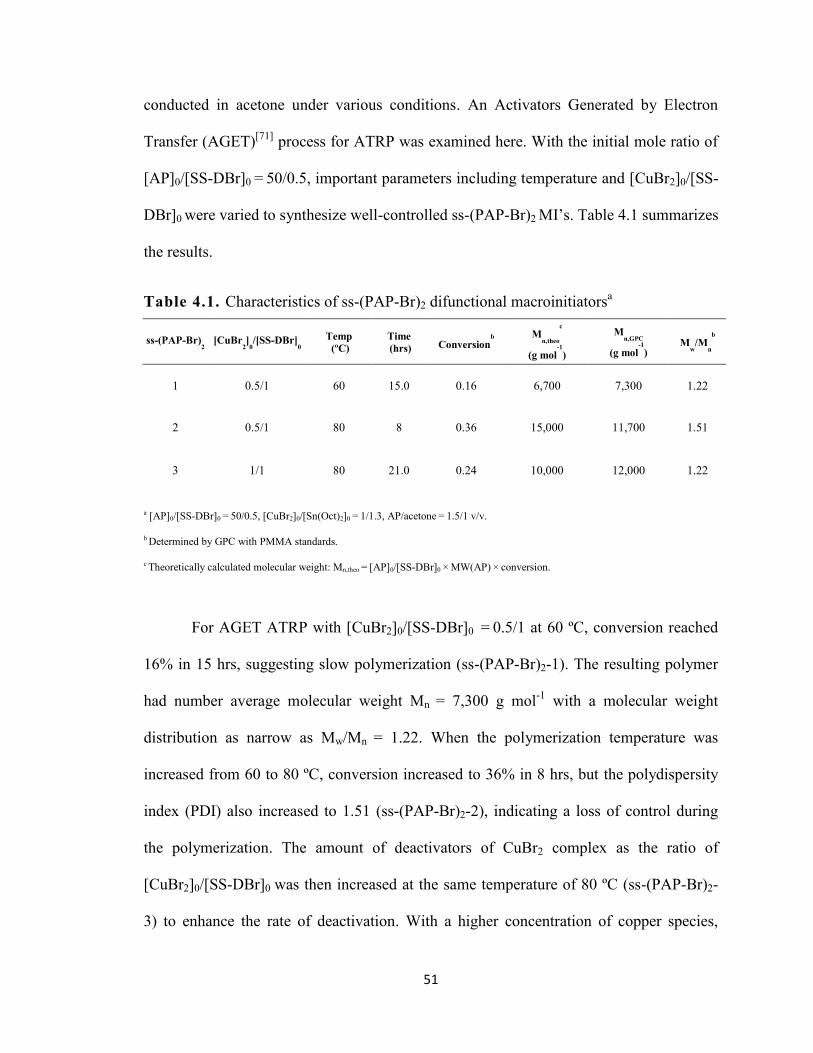
51
conducted in acetone under various conditions. An Activators Generated by Electron
Transfer (AGET)[71]
process for ATRP was examined here. With the initial mole ratio of
[AP]0/[SS-DBr]0 = 50/0.5, important parameters including temperature and [CuBr2]0/[SS-
DBr]0 were varied to synthesize well-controlled ss-(PAP-Br)2 MI’s. Table 4.1 summarizes
the results.
Table 4.1. Characteristics of ss-(PAP-Br)2 difunctional macroinitiatorsa
ss-(PAP-Br)2 [CuBr
2]
0/[SS-DBr]
0 Temp
(ºC) Time
(hrs) Conversionb
M
n,theo
c
(g mol-1
)
Mn,GPC
(g mol-1
) M
w/M
n
b
1 0.5/1 60 15.0 0.16 6,700 7,300 1.22
2 0.5/1 80 8 0.36 15,000 11,700 1.51
3 1/1 80 21.0 0.24 10,000 12,000 1.22
a [AP]0/[SS-DBr]0 = 50/0.5, [CuBr2]0/[Sn(Oct)2]0 = 1/1.3, AP/acetone = 1.5/1 v/v.
b Determined by GPC with PMMA standards.
c Theoretically calculated molecular weight: Mn,theo = [AP]0/[SS-DBr]0 × MW(AP) × conversion.
For AGET ATRP with [CuBr2]0/[SS-DBr]0 = 0.5/1 at 60 ºC, conversion reached
16% in 15 hrs, suggesting slow polymerization (ss-(PAP-Br)2-1). The resulting polymer
had number average molecular weight Mn = 7,300 g mol-1
with a molecular weight
distribution as narrow as Mw/Mn = 1.22. When the polymerization temperature was
increased from 60 to 80 ºC, conversion increased to 36% in 8 hrs, but the polydispersity
index (PDI) also increased to 1.51 (ss-(PAP-Br)2-2), indicating a loss of control during
the polymerization. The amount of deactivators of CuBr2 complex as the ratio of
[CuBr2]0/[SS-DBr]0 was then increased at the same temperature of 80 ºC (ss-(PAP-Br)2-
3) to enhance the rate of deactivation. With a higher concentration of copper species,
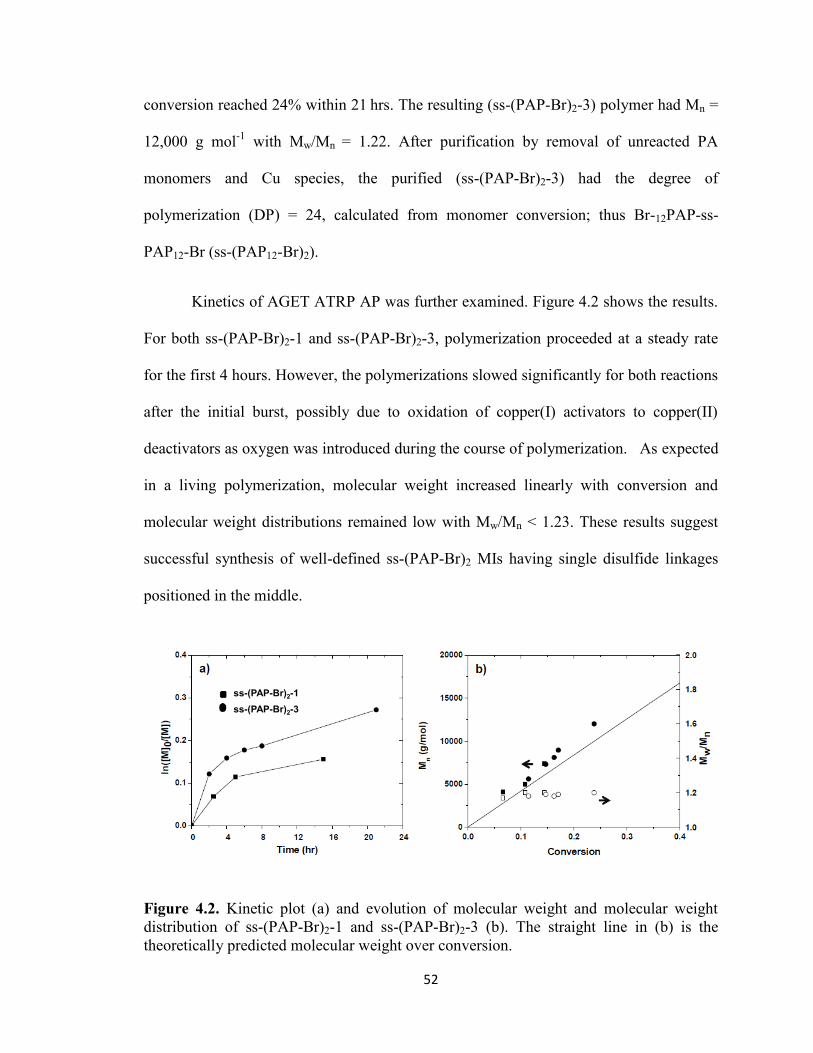
52
conversion reached 24% within 21 hrs. The resulting (ss-(PAP-Br)2-3) polymer had Mn =
12,000 g mol-1
with Mw/Mn = 1.22. After purification by removal of unreacted PA
monomers and Cu species, the purified (ss-(PAP-Br)2-3) had the degree of
polymerization (DP) = 24, calculated from monomer conversion; thus Br-12PAP-ss-
PAP12-Br (ss-(PAP12-Br)2).
Kinetics of AGET ATRP AP was further examined. Figure 4.2 shows the results.
For both ss-(PAP-Br)2-1 and ss-(PAP-Br)2-3, polymerization proceeded at a steady rate
for the first 4 hours. However, the polymerizations slowed significantly for both reactions
after the initial burst, possibly due to oxidation of copper(I) activators to copper(II)
deactivators as oxygen was introduced during the course of polymerization. As expected
in a living polymerization, molecular weight increased linearly with conversion and
molecular weight distributions remained low with Mw/Mn < 1.23. These results suggest
successful synthesis of well-defined ss-(PAP-Br)2 MIs having single disulfide linkages
positioned in the middle.
Figure 4.2. Kinetic plot (a) and evolution of molecular weight and molecular weight
distribution of ss-(PAP-Br)2-1 and ss-(PAP-Br)2-3 (b). The straight line in (b) is the
theoretically predicted molecular weight over conversion.
ss-(PAP-Br)2-1
ss-(PAP-Br)2-3
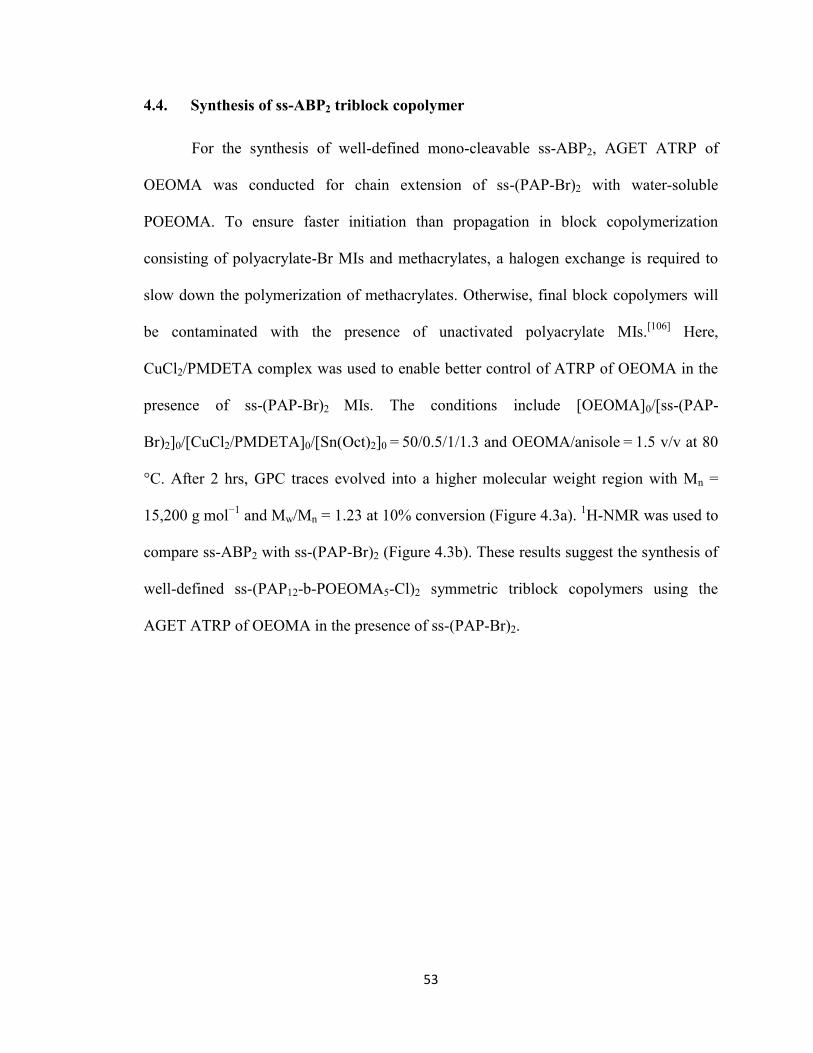
53
4.4. Synthesis of ss-ABP2 triblock copolymer
For the synthesis of well-defined mono-cleavable ss-ABP2, AGET ATRP of
OEOMA was conducted for chain extension of ss-(PAP-Br)2 with water-soluble
POEOMA. To ensure faster initiation than propagation in block copolymerization
consisting of polyacrylate-Br MIs and methacrylates, a halogen exchange is required to
slow down the polymerization of methacrylates. Otherwise, final block copolymers will
be contaminated with the presence of unactivated polyacrylate MIs.[106]
Here,
CuCl2/PMDETA complex was used to enable better control of ATRP of OEOMA in the
presence of ss-(PAP-Br)2 MIs. The conditions include [OEOMA]0/[ss-(PAP-
Br)2]0/[CuCl2/PMDETA]0/[Sn(Oct)2]0 = 50/0.5/1/1.3 and OEOMA/anisole = 1.5 v/v at 80
°C. After 2 hrs, GPC traces evolved into a higher molecular weight region with Mn =
15,200 g mol−1
and Mw/Mn = 1.23 at 10% conversion (Figure 4.3a). 1H-NMR was used to
compare ss-ABP2 with ss-(PAP-Br)2 (Figure 4.3b). These results suggest the synthesis of
well-defined ss-(PAP12-b-POEOMA5-Cl)2 symmetric triblock copolymers using the
AGET ATRP of OEOMA in the presence of ss-(PAP-Br)2.
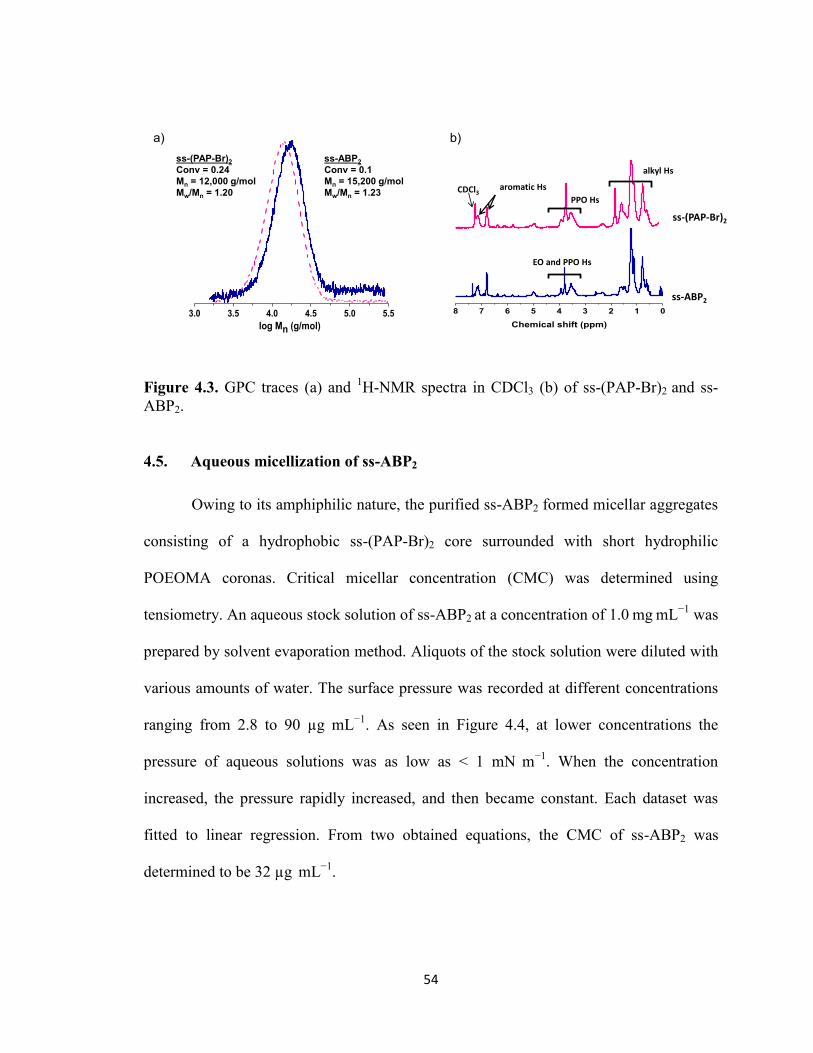
54
Figure 4.3. GPC traces (a) and 1H-NMR spectra in CDCl3 (b) of ss-(PAP-Br)2 and ss-
ABP2.
4.5. Aqueous micellization of ss-ABP2
Owing to its amphiphilic nature, the purified ss-ABP2 formed micellar aggregates
consisting of a hydrophobic ss-(PAP-Br)2 core surrounded with short hydrophilic
POEOMA coronas. Critical micellar concentration (CMC) was determined using
tensiometry. An aqueous stock solution of ss-ABP2 at a concentration of 1.0 mg mL−1
was
prepared by solvent evaporation method. Aliquots of the stock solution were diluted with
various amounts of water. The surface pressure was recorded at different concentrations
ranging from 2.8 to 90 µg mL−1
. As seen in Figure 4.4, at lower concentrations the
pressure of aqueous solutions was as low as < 1 mN m−1
. When the concentration
increased, the pressure rapidly increased, and then became constant. Each dataset was
fitted to linear regression. From two obtained equations, the CMC of ss-ABP2 was
determined to be 32 µg mL−1
.
3.0 3.5 4.0 4.5 5.0 5.5
log Mn (g/mol)
ss-(PAP-Br)2
Conv = 0.24
Mn = 12,000 g/mol
Mw/Mn = 1.20
ss-ABP2
Conv = 0.1
Mn = 15,200 g/mol
Mw/Mn = 1.23
8 7 6 5 4 3 2 1 0
Chemical shift (ppm)
ss-(PAP-Br)2
ss-ABP2
aromatic Hs
PPO Hs
alkyl Hs
EO and PPO Hs
CDCl3
a) b)

55
Figure 4.4. Surface pressure versus concentration of ss-ABP2 to determine CMC by
tensiometry.
4.6. Reductive cleavage of disulfide linkages in ss-ABP2
Reductive cleavage of single disulfide linkages in the middle blocks of ss-ABP2
triblock copolymers was examined. When all disulfide linkages of ss-ABP2 are cleaved
by reductive reactions under reducing conditions, the degraded products could be thiol-
terminated diblock copolymers (HS-PAP-b-POEOMA) with a half molecular weight of
ss-(PAP-b-POEOMA)2. For GPC measurements, ss-ABP2 was dissolved in THF and
mixed with tributylphosphine (Bu3P) at a mole equivalent ratio of Bu3P/disulfide = 1/1
for 24 hrs. As seen in Figure 4.5, molecular weight of ss-ABP2 decreased from Mn =
14,500 g mol−1
to Mn = 5,500 g mol−1
. This result indicates the significant cleavage of
disulfide linkages in ss-ABP2 under reducing conditions.
0.00 0.02 0.04 0.06 0.08 0.10
0
3
6
9
12
15
18
21
Pre
ss
ure
(m
N/m
)
ss-ABP2 (mg/mL)
32 µg/mL
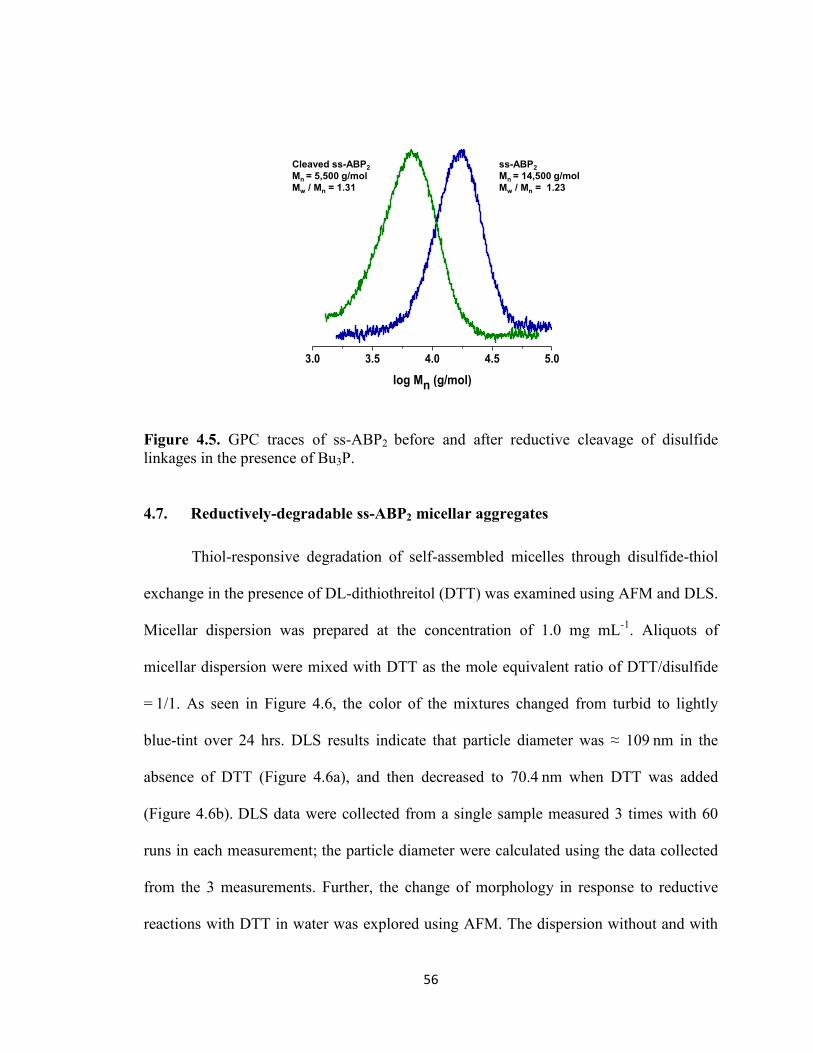
56
Figure 4.5. GPC traces of ss-ABP2 before and after reductive cleavage of disulfide
linkages in the presence of Bu3P.
4.7. Reductively-degradable ss-ABP2 micellar aggregates
Thiol-responsive degradation of self-assembled micelles through disulfide-thiol
exchange in the presence of DL-dithiothreitol (DTT) was examined using AFM and DLS.
Micellar dispersion was prepared at the concentration of 1.0 mg mL-1
. Aliquots of
micellar dispersion were mixed with DTT as the mole equivalent ratio of DTT/disulfide
= 1/1. As seen in Figure 4.6, the color of the mixtures changed from turbid to lightly
blue-tint over 24 hrs. DLS results indicate that particle diameter was ≈ 109 nm in the
absence of DTT (Figure 4.6a), and then decreased to 70.4 nm when DTT was added
(Figure 4.6b). DLS data were collected from a single sample measured 3 times with 60
runs in each measurement; the particle diameter were calculated using the data collected
from the 3 measurements. Further, the change of morphology in response to reductive
reactions with DTT in water was explored using AFM. The dispersion without and with
3.0 3.5 4.0 4.5 5.0
log Mn (g/mol)
Cleaved ss-ABP2
Mn = 5,500 g/mol
Mw / Mn = 1.31
ss-ABP2
Mn = 14,500 g/mol
Mw / Mn = 1.23
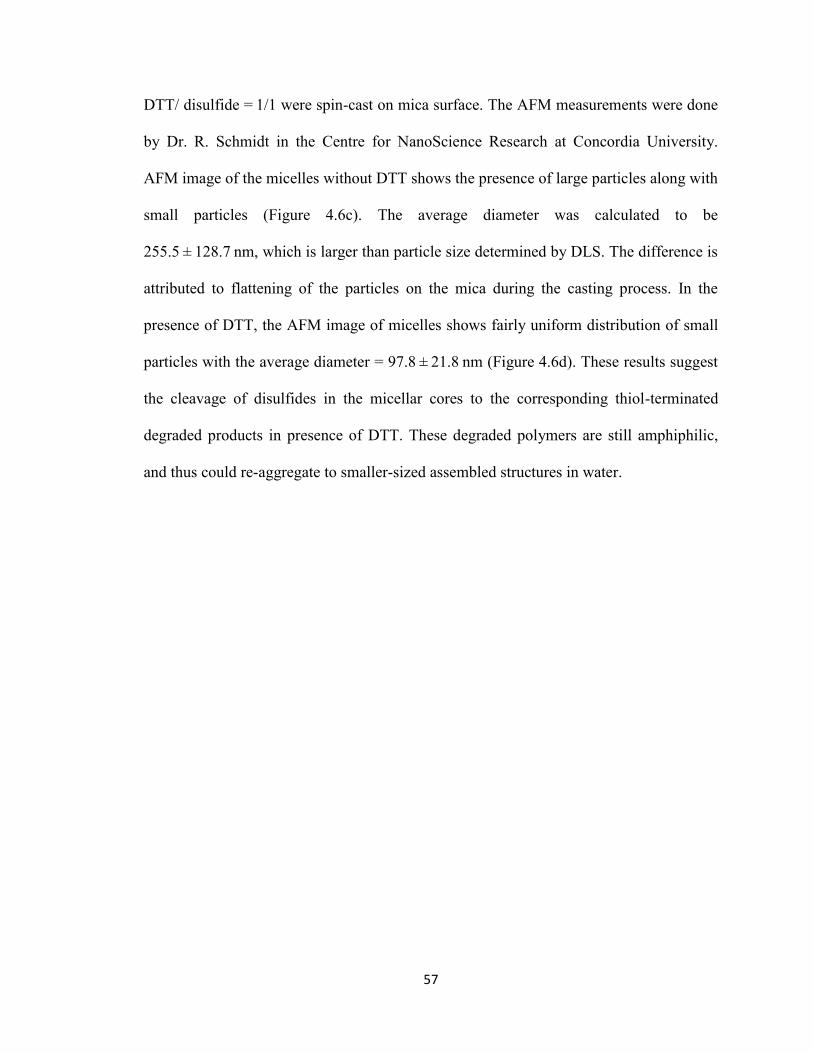
57
DTT/ disulfide = 1/1 were spin-cast on mica surface. The AFM measurements were done
by Dr. R. Schmidt in the Centre for NanoScience Research at Concordia University.
AFM image of the micelles without DTT shows the presence of large particles along with
small particles (Figure 4.6c). The average diameter was calculated to be
255.5 ± 128.7 nm, which is larger than particle size determined by DLS. The difference is
attributed to flattening of the particles on the mica during the casting process. In the
presence of DTT, the AFM image of micelles shows fairly uniform distribution of small
particles with the average diameter = 97.8 ± 21.8 nm (Figure 4.6d). These results suggest
the cleavage of disulfides in the micellar cores to the corresponding thiol-terminated
degraded products in presence of DTT. These degraded polymers are still amphiphilic,
and thus could re-aggregate to smaller-sized assembled structures in water.
58
Figure 4.6. For ss-ABP2 symmetric triblock copolymers, DLS diagrams based on %
volume and AFM images with the size = 10 µm × 10 µm before (a and b) and after (c and
d) addition of DTT defined as DTT/disulfide = 1/1 in water (insets; digital images of
micellar dispersions in water).
4.8. Conclusions
New thiol-responsive symmetric triblock copolymer having single disulfide
linkages in the middle blocks were synthesized using AGET ATRP. These mono-
cleavable copolymers consist of hydrophobic PAP and hydrophilic POEOMA.
Polymerizations were well-controlled, yielding both ss-(PAP-Br)2 and ss-ABP2 with
monomodal and narrow molecular weight distributions with PDI as low as Mw/Mn <
59
1.23. Due to the amphiphilic nature, ss-ABP2 self-assembled, through aqueous
micellization, to form micellar aggregates at concentrations above CMC. For reductive
cleavage of single disulfides in the mono-cleavable copolymers and micelles, GPC results
suggest that copolymers in the presence of Bu3P were cleaved to corresponding HS-
terminated PAP1/2-b-POEOMA with a half molecular weight. The AFM and DLS
analyses suggest the degradation of ss-ABP2 micelles to small amphiphilic thiols, leading
to the formation of smaller-sized assembled structures in water.

60
Chapter 5
Glutathione-Responsive Micelles Having
Pendant Disulfide Linkages
5.1. Introduction
Pendant multi-cleavable micelles are a promising class of drug delivery
nanocarriers. These micelles are based on well-defined ABPs having pendant disulfide
linkages as side chains. Of the strategies for the synthesis of thiol-responsive degradable
nanosized assemblies, as reviewed in chapter 1 (Figure 1.7), amphiphilic block
copolymer containing pendant disulfides in hydrophobic cores can be cleaved in response
to excess reducing agents, causing the destabilization of micellar aggregates through the
change in hydrophobic/hydrophilic balance.[107]
Alternatively, these micelles are
converted to core-crosslinked micelles with disulfide crosslinks through intermolecular
thiol-disulfide polyexchange reactions in the presence of catalytic amount of reducing
agents. This feature can enhance colloidal stability upon dilution below CMC, thus
preventing premature release of encapsulated drugs during circulation in the body.
Several examples of reduction-sensitive core-crosslinked nanogels or micelles
have been reported. Random copolymers prepared from dextran-lipoic acid derivatives
(Dex-LAs)[108]
and poly(ethyleneglycol) (PEG) and poly(ɛ-caprolactone) (PCL) were
used to prepare crosslinked nanogels that contained two lipoyl functional groups at their
interfaces.[109]
Redox-responsive micelles composed of various ABPs with pendant multi-
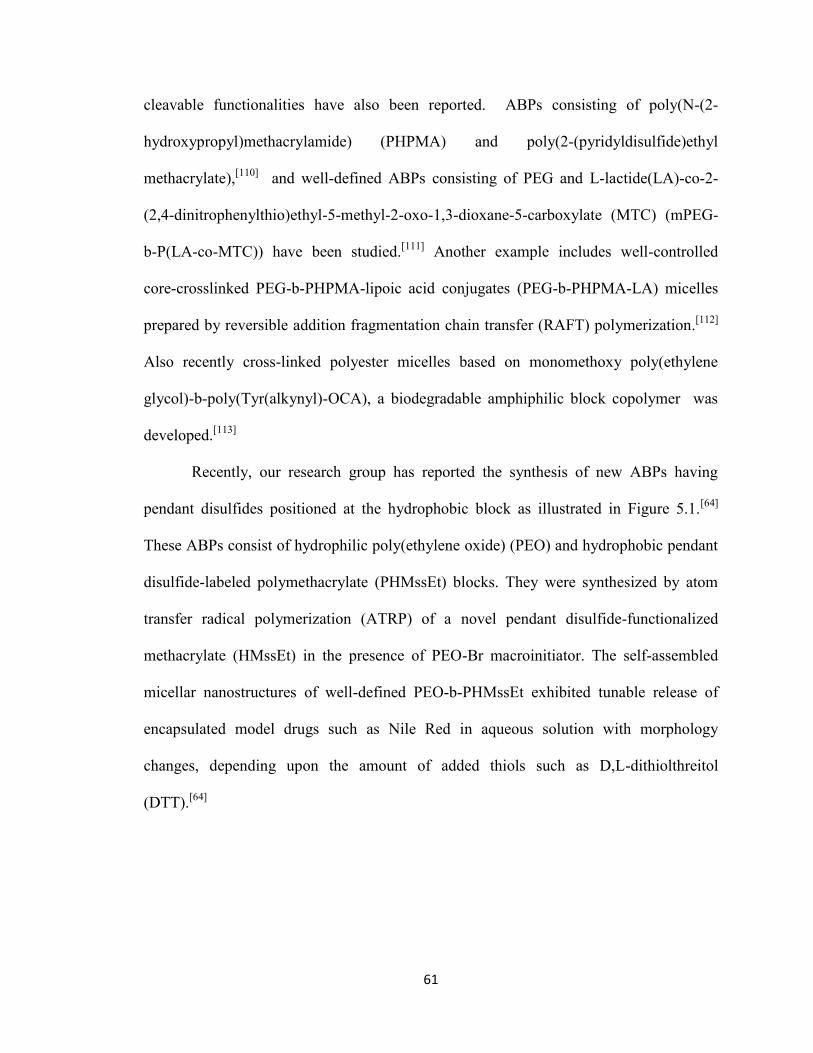
61
cleavable functionalities have also been reported. ABPs consisting of poly(N-(2-
hydroxypropyl)methacrylamide) (PHPMA) and poly(2-(pyridyldisulfide)ethyl
methacrylate),[110]
and well-defined ABPs consisting of PEG and L-lactide(LA)-co-2-
(2,4-dinitrophenylthio)ethyl-5-methyl-2-oxo-1,3-dioxane-5-carboxylate (MTC) (mPEG-
b-P(LA-co-MTC)) have been studied.[111]
Another example includes well-controlled
core-crosslinked PEG-b-PHPMA-lipoic acid conjugates (PEG-b-PHPMA-LA) micelles
prepared by reversible addition fragmentation chain transfer (RAFT) polymerization.[112]
Also recently cross-linked polyester micelles based on monomethoxy poly(ethylene
glycol)-b-poly(Tyr(alkynyl)-OCA), a biodegradable amphiphilic block copolymer was
developed.[113]
Recently, our research group has reported the synthesis of new ABPs having
pendant disulfides positioned at the hydrophobic block as illustrated in Figure 5.1.[64]
These ABPs consist of hydrophilic poly(ethylene oxide) (PEO) and hydrophobic pendant
disulfide-labeled polymethacrylate (PHMssEt) blocks. They were synthesized by atom
transfer radical polymerization (ATRP) of a novel pendant disulfide-functionalized
methacrylate (HMssEt) in the presence of PEO-Br macroinitiator. The self-assembled
micellar nanostructures of well-defined PEO-b-PHMssEt exhibited tunable release of
encapsulated model drugs such as Nile Red in aqueous solution with morphology
changes, depending upon the amount of added thiols such as D,L-dithiolthreitol
(DTT).[64]
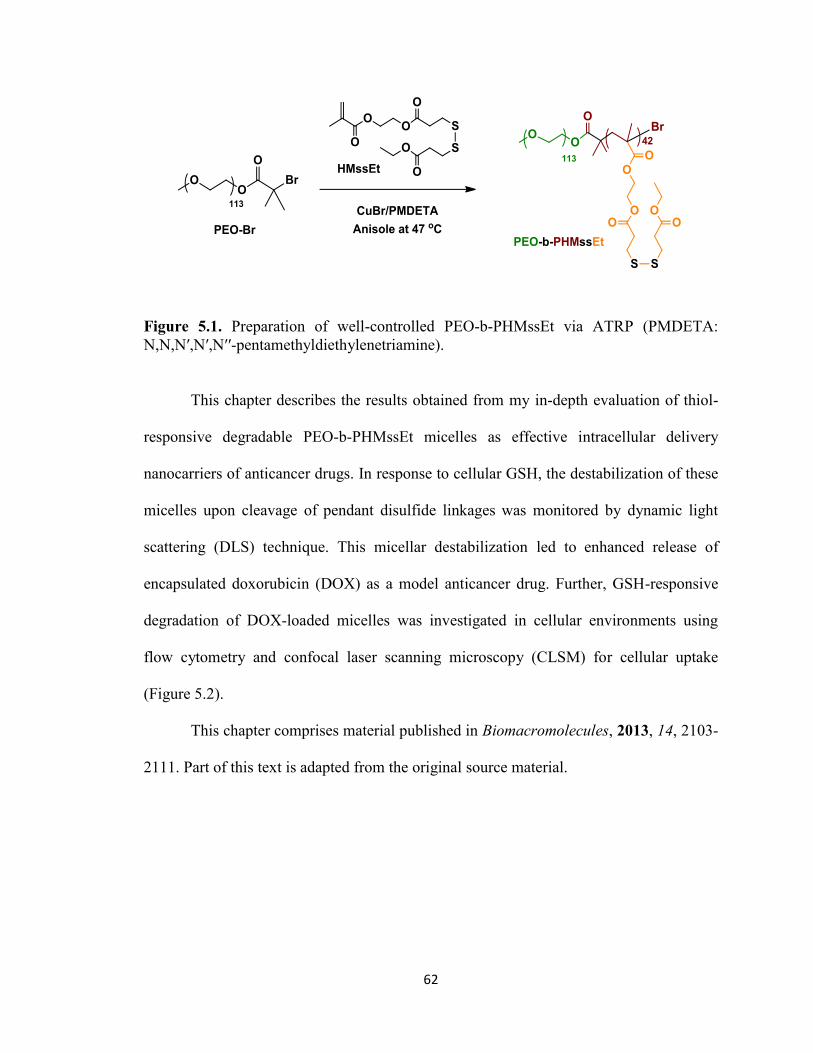
62
Figure 5.1. Preparation of well-controlled PEO-b-PHMssEt via ATRP (PMDETA:
N,N,N′,N′,N′′-pentamethyldiethylenetriamine).
This chapter describes the results obtained from my in-depth evaluation of thiol-
responsive degradable PEO-b-PHMssEt micelles as effective intracellular delivery
nanocarriers of anticancer drugs. In response to cellular GSH, the destabilization of these
micelles upon cleavage of pendant disulfide linkages was monitored by dynamic light
scattering (DLS) technique. This micellar destabilization led to enhanced release of
encapsulated doxorubicin (DOX) as a model anticancer drug. Further, GSH-responsive
degradation of DOX-loaded micelles was investigated in cellular environments using
flow cytometry and confocal laser scanning microscopy (CLSM) for cellular uptake
(Figure 5.2).
This chapter comprises material published in Biomacromolecules, 2013, 14, 2103-
2111. Part of this text is adapted from the original source material.
Endocytosis
Reduction-triggered
micelle destabilization
& drug release
Self- assembly
a)
b)
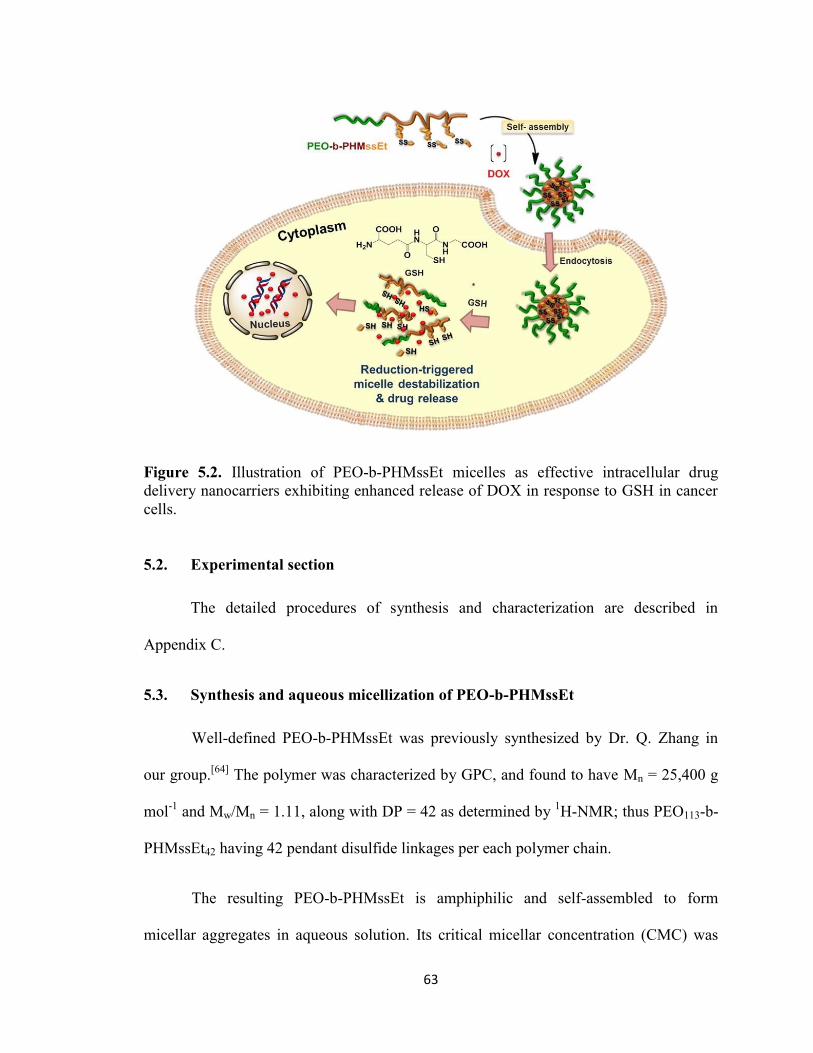
63
Figure 5.2. Illustration of PEO-b-PHMssEt micelles as effective intracellular drug
delivery nanocarriers exhibiting enhanced release of DOX in response to GSH in cancer
cells.
5.2. Experimental section
The detailed procedures of synthesis and characterization are described in
Appendix C.
5.3. Synthesis and aqueous micellization of PEO-b-PHMssEt
Well-defined PEO-b-PHMssEt was previously synthesized by Dr. Q. Zhang in
our group.[64]
The polymer was characterized by GPC, and found to have Mn = 25,400 g
mol-1
and Mw/Mn = 1.11, along with DP = 42 as determined by 1H-NMR; thus PEO113-b-
PHMssEt42 having 42 pendant disulfide linkages per each polymer chain.
The resulting PEO-b-PHMssEt is amphiphilic and self-assembled to form
micellar aggregates in aqueous solution. Its critical micellar concentration (CMC) was
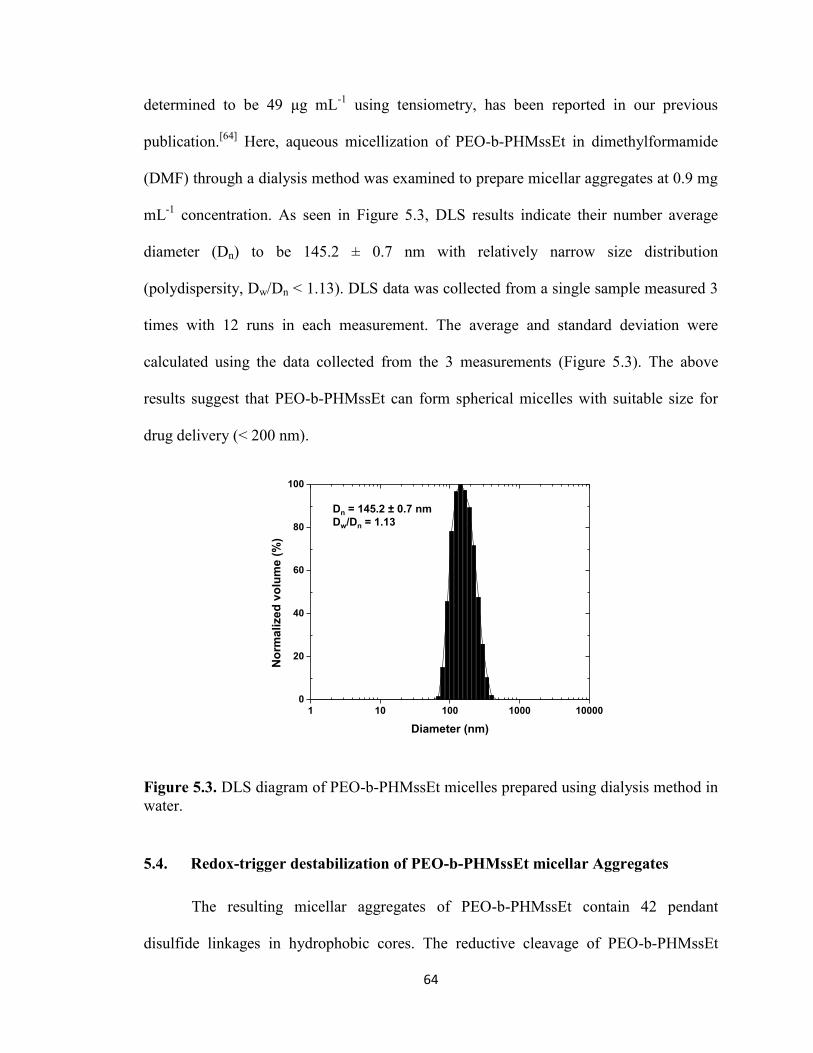
64
determined to be 49 μg mL-1
using tensiometry, has been reported in our previous
publication.[64]
Here, aqueous micellization of PEO-b-PHMssEt in dimethylformamide
(DMF) through a dialysis method was examined to prepare micellar aggregates at 0.9 mg
mL-1
concentration. As seen in Figure 5.3, DLS results indicate their number average
diameter (Dn) to be 145.2 ± 0.7 nm with relatively narrow size distribution
(polydispersity, Dw/Dn < 1.13). DLS data was collected from a single sample measured 3
times with 12 runs in each measurement. The average and standard deviation were
calculated using the data collected from the 3 measurements (Figure 5.3). The above
results suggest that PEO-b-PHMssEt can form spherical micelles with suitable size for
drug delivery (< 200 nm).
Figure 5.3. DLS diagram of PEO-b-PHMssEt micelles prepared using dialysis method in
water.
5.4. Redox-trigger destabilization of PEO-b-PHMssEt micellar Aggregates
The resulting micellar aggregates of PEO-b-PHMssEt contain 42 pendant
disulfide linkages in hydrophobic cores. The reductive cleavage of PEO-b-PHMssEt
1 10 100 1000 100000
20
40
60
80
100
No
rma
lize
d v
olu
me
(%
)
Diameter (nm)
Dn = 145.2 0.7 nm
Dw/Dn = 1.13
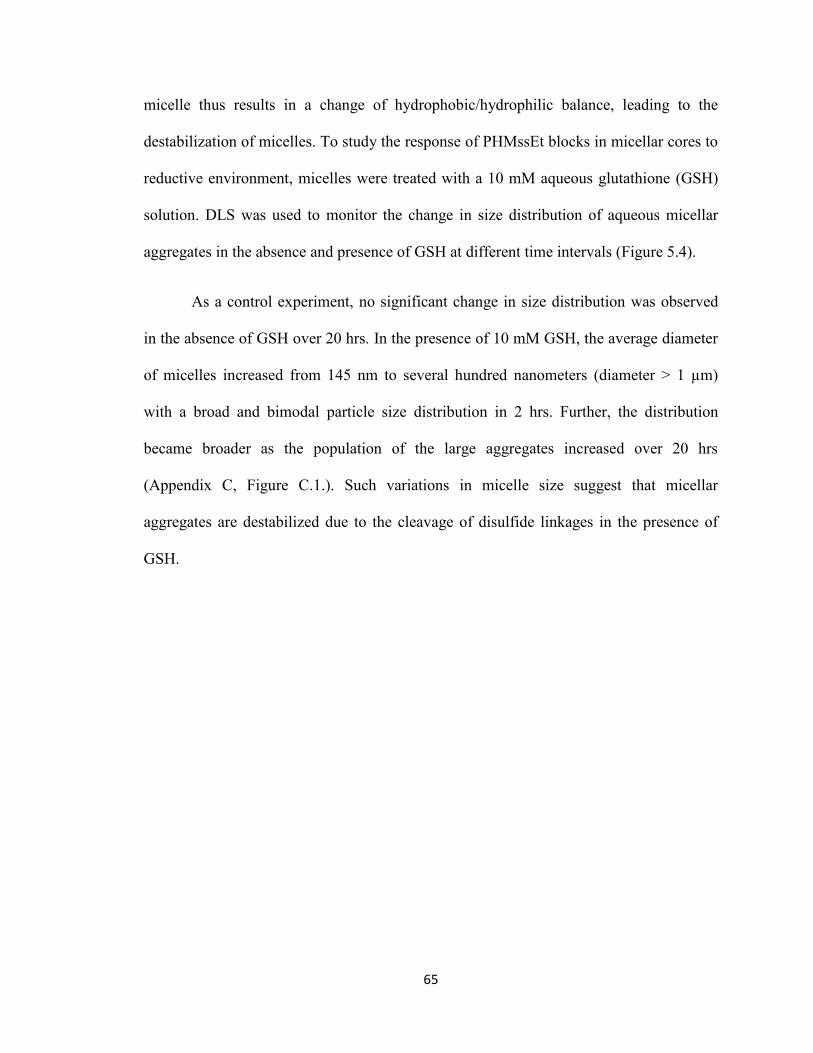
65
micelle thus results in a change of hydrophobic/hydrophilic balance, leading to the
destabilization of micelles. To study the response of PHMssEt blocks in micellar cores to
reductive environment, micelles were treated with a 10 mM aqueous glutathione (GSH)
solution. DLS was used to monitor the change in size distribution of aqueous micellar
aggregates in the absence and presence of GSH at different time intervals (Figure 5.4).
As a control experiment, no significant change in size distribution was observed
in the absence of GSH over 20 hrs. In the presence of 10 mM GSH, the average diameter
of micelles increased from 145 nm to several hundred nanometers (diameter > 1 µm)
with a broad and bimodal particle size distribution in 2 hrs. Further, the distribution
became broader as the population of the large aggregates increased over 20 hrs
(Appendix C, Figure C.1.). Such variations in micelle size suggest that micellar
aggregates are destabilized due to the cleavage of disulfide linkages in the presence of
GSH.
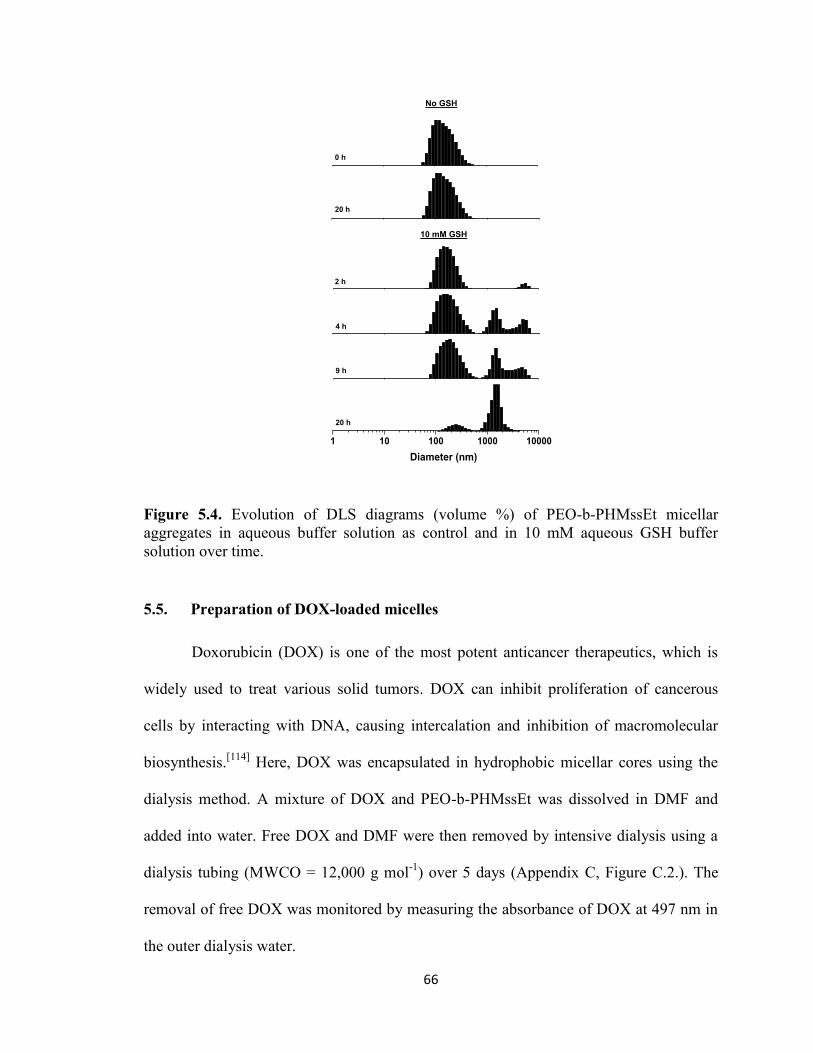
66
Figure 5.4. Evolution of DLS diagrams (volume %) of PEO-b-PHMssEt micellar
aggregates in aqueous buffer solution as control and in 10 mM aqueous GSH buffer
solution over time.
5.5. Preparation of DOX-loaded micelles
Doxorubicin (DOX) is one of the most potent anticancer therapeutics, which is
widely used to treat various solid tumors. DOX can inhibit proliferation of cancerous
cells by interacting with DNA, causing intercalation and inhibition of macromolecular
biosynthesis.[114]
Here, DOX was encapsulated in hydrophobic micellar cores using the
dialysis method. A mixture of DOX and PEO-b-PHMssEt was dissolved in DMF and
added into water. Free DOX and DMF were then removed by intensive dialysis using a
dialysis tubing (MWCO = 12,000 g mol-1
) over 5 days (Appendix C, Figure C.2.). The
removal of free DOX was monitored by measuring the absorbance of DOX at 497 nm in
the outer dialysis water.
1 10 100 1000 10000
Diameter (nm)
10 mM GSH
0 h
2 h
9 h
4 h
20 h
No GSH
20 h
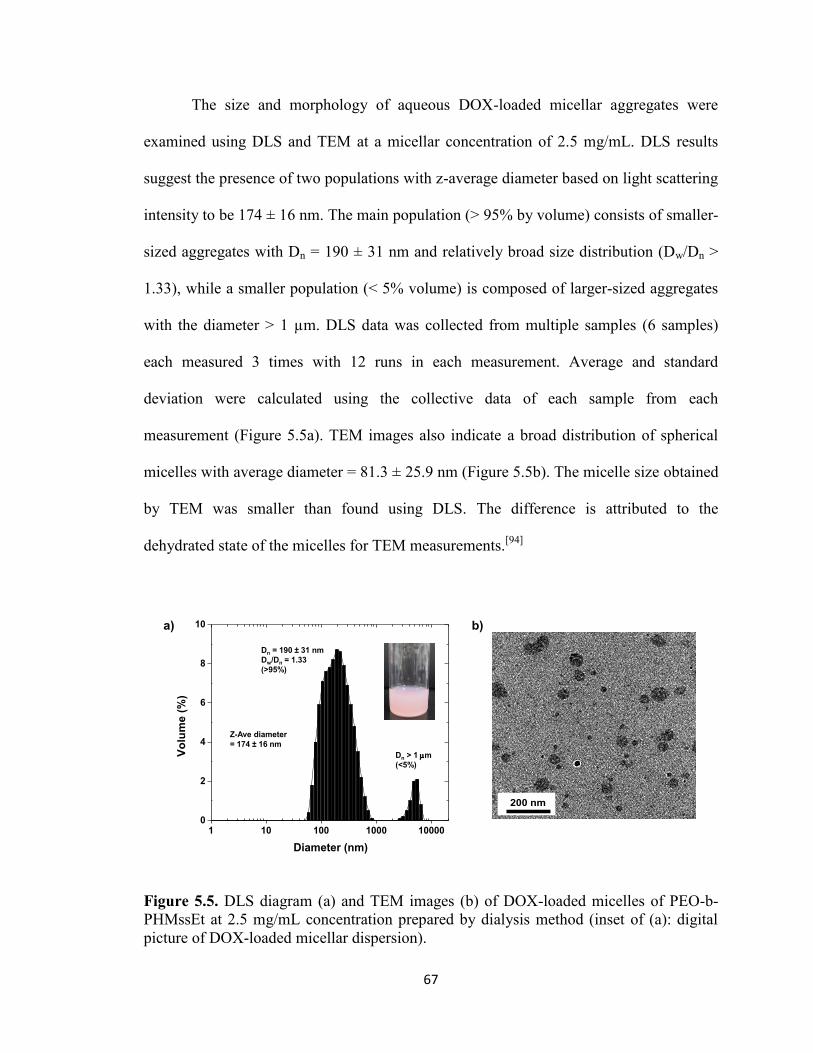
67
The size and morphology of aqueous DOX-loaded micellar aggregates were
examined using DLS and TEM at a micellar concentration of 2.5 mg/mL. DLS results
suggest the presence of two populations with z-average diameter based on light scattering
intensity to be 174 ± 16 nm. The main population (> 95% by volume) consists of smaller-
sized aggregates with Dn = 190 ± 31 nm and relatively broad size distribution (Dw/Dn >
1.33), while a smaller population (< 5% volume) is composed of larger-sized aggregates
with the diameter > 1 µm. DLS data was collected from multiple samples (6 samples)
each measured 3 times with 12 runs in each measurement. Average and standard
deviation were calculated using the collective data of each sample from each
measurement (Figure 5.5a). TEM images also indicate a broad distribution of spherical
micelles with average diameter = 81.3 ± 25.9 nm (Figure 5.5b). The micelle size obtained
by TEM was smaller than found using DLS. The difference is attributed to the
dehydrated state of the micelles for TEM measurements.[94]
Figure 5.5. DLS diagram (a) and TEM images (b) of DOX-loaded micelles of PEO-b-
PHMssEt at 2.5 mg/mL concentration prepared by dialysis method (inset of (a): digital
picture of DOX-loaded micellar dispersion).
1 10 100 1000 100000
2
4
6
8
10
Vo
lum
e (
%)
Diameter (nm)b)
a)
Z-Ave diameter
= 174 16 nm
Dn = 190 31 nm
Dw/Dn = 1.33
(>95%)
Dn > 1 m
(<5%)
200 nm 200 nm
1 10 100 1000 100000
2
4
6
8
10
Vo
lum
e (
%)
Diameter (nm)b)
a)
Z-Ave diameter
= 174 16 nm
Dn = 190 31 nm
Dw/Dn = 1.33
(>95%)
Dn > 1 m
(<5%)
200 nm 200 nm
a) b)
68
The loading level of DOX for DOX-loaded micelles was determined using
UV/Vis spectroscopy. The extinction coefficient of DOX in DMF was first determined to
be ε = 11,700 M−1
cm−1
at λmax = 480 nm (Appendix C, Figure C.3.). Next, aliquots of
DOX-loaded micellar dispersions were taken and water was removed by rotary
evaporation. The residues were then dissolved in DMF to form clear solutions of DOX
and PEO-b-PHMssEt. Figure 5.6 is an example of UV/Vis spectrum of DOX-loaded
micelles in DMF which showed a strong absorption of DOX at λmax = 480 nm. The
spectrum is similar to that of free DOX in DMF, suggesting no signification change in the
structure of DOX encapsulated in hydrophobic micellar cores. Using the Beer-Lambert
equation with the absorbance at λmax = 480 nm and the extinction coefficient, the loading
level of DOX was determined to be 0.44 ± 0.07% for MDOX-1 and 0.81 ± 0.07% for
MDOX-2 (Table 5.1). Similarly, the DOX loading level increased when the feed ratio of
the initial amount of DOX to copolymer was increased.
Figure 5.6. A typical UV/Vis spectrum of DOX-loaded micelles after the removal of
water, compared with that of free DOX (19.5 µmol mL-1
) in DMF.
300 400 500 600 700 800
0.00
0.05
0.10
0.15
0.20
0.25
0.30
Wavelength (nm)
Ab
so
rban
ce
DOX
DOX-loaded
polymers
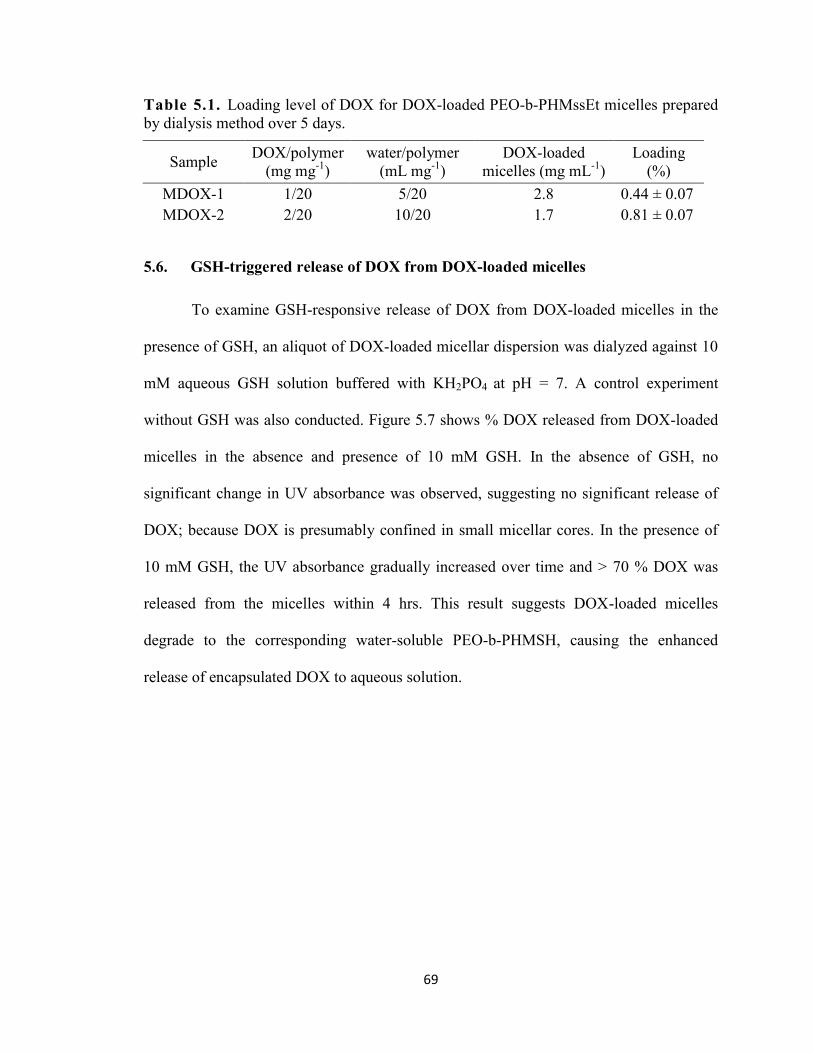
69
Table 5.1. Loading level of DOX for DOX-loaded PEO-b-PHMssEt micelles prepared
by dialysis method over 5 days.
Sample DOX/polymer
(mg mg-1
)
water/polymer
(mL mg-1
)
DOX-loaded
micelles (mg mL-1
)
Loading
(%)
MDOX-1 1/20 5/20 2.8 0.44 ± 0.07
MDOX-2 2/20 10/20 1.7 0.81 ± 0.07
5.6. GSH-triggered release of DOX from DOX-loaded micelles
To examine GSH-responsive release of DOX from DOX-loaded micelles in the
presence of GSH, an aliquot of DOX-loaded micellar dispersion was dialyzed against 10
mM aqueous GSH solution buffered with KH2PO4 at pH = 7. A control experiment
without GSH was also conducted. Figure 5.7 shows % DOX released from DOX-loaded
micelles in the absence and presence of 10 mM GSH. In the absence of GSH, no
significant change in UV absorbance was observed, suggesting no significant release of
DOX; because DOX is presumably confined in small micellar cores. In the presence of
10 mM GSH, the UV absorbance gradually increased over time and > 70 % DOX was
released from the micelles within 4 hrs. This result suggests DOX-loaded micelles
degrade to the corresponding water-soluble PEO-b-PHMSH, causing the enhanced
release of encapsulated DOX to aqueous solution.

70
Figure 5.7. Release of DOX from DOX-loaded micelles in 10 mM aqueous GSH
solution buffered with KH2PO4 at pH = 7.0, and aqueous KH2PO4 buffer solution at pH =
7.0 as a control.
5.7. GSH-responsive intracellular release of DOX upon degradation
To evaluate the efficiency of PEO-b-PHMssEt micelles as drug delivery
nanocarriers at a cellular level, intracellular release of DOX in response to cellular GSH
for HeLa cancer cells after internalization was investigated using flow cytometry and
confocal laser scanning microscopy (CLSM). Figure 5.8 shows flow cytometric
histograms of HeLa cells. Compared to cells only as a control, the histograms for HeLa
cells incubated with DOX-loaded micelles were shifted to the direction of high
fluorescence intensity, suggesting effective internalization of DOX-loaded micelles in
HeLa cells in 2 hrs.
0 1 2 3 4 5 6 7 8 9 10
0
20
40
60
80
100
Do
x r
ele
ase (
%)
Time (hrs)
10 mM GSH
No GSH
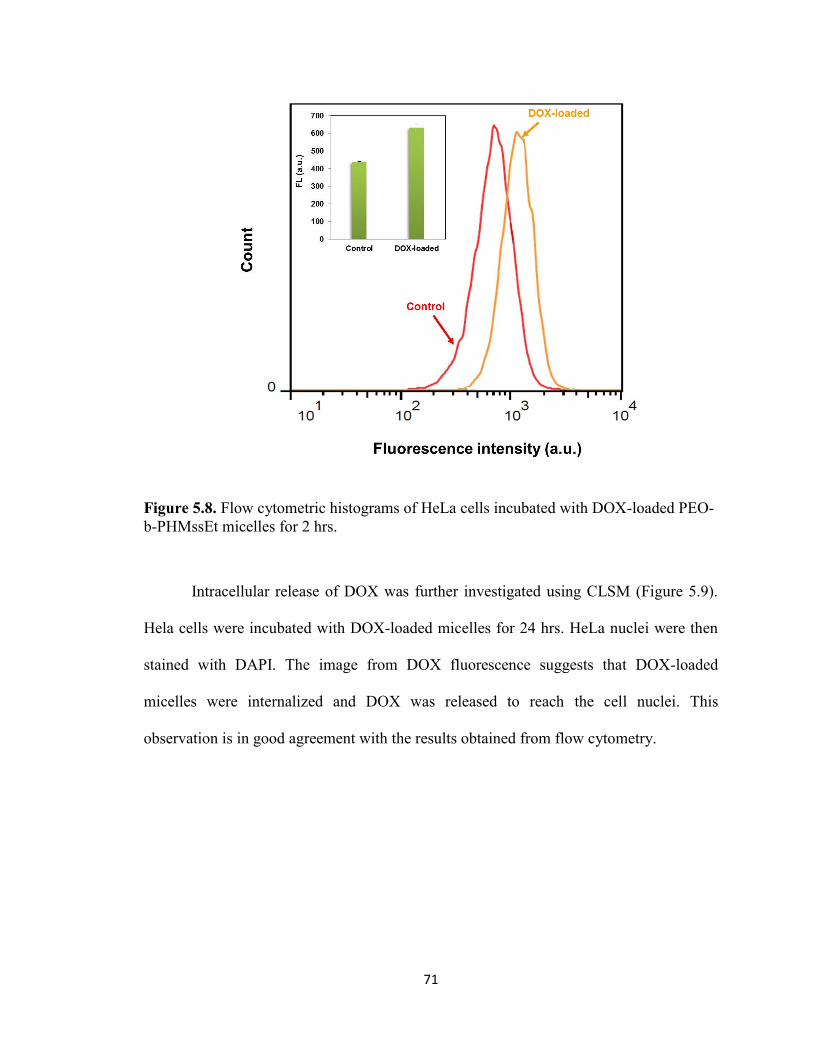
71
Figure 5.8. Flow cytometric histograms of HeLa cells incubated with DOX-loaded PEO-
b-PHMssEt micelles for 2 hrs.
Intracellular release of DOX was further investigated using CLSM (Figure 5.9).
Hela cells were incubated with DOX-loaded micelles for 24 hrs. HeLa nuclei were then
stained with DAPI. The image from DOX fluorescence suggests that DOX-loaded
micelles were internalized and DOX was released to reach the cell nuclei. This
observation is in good agreement with the results obtained from flow cytometry.
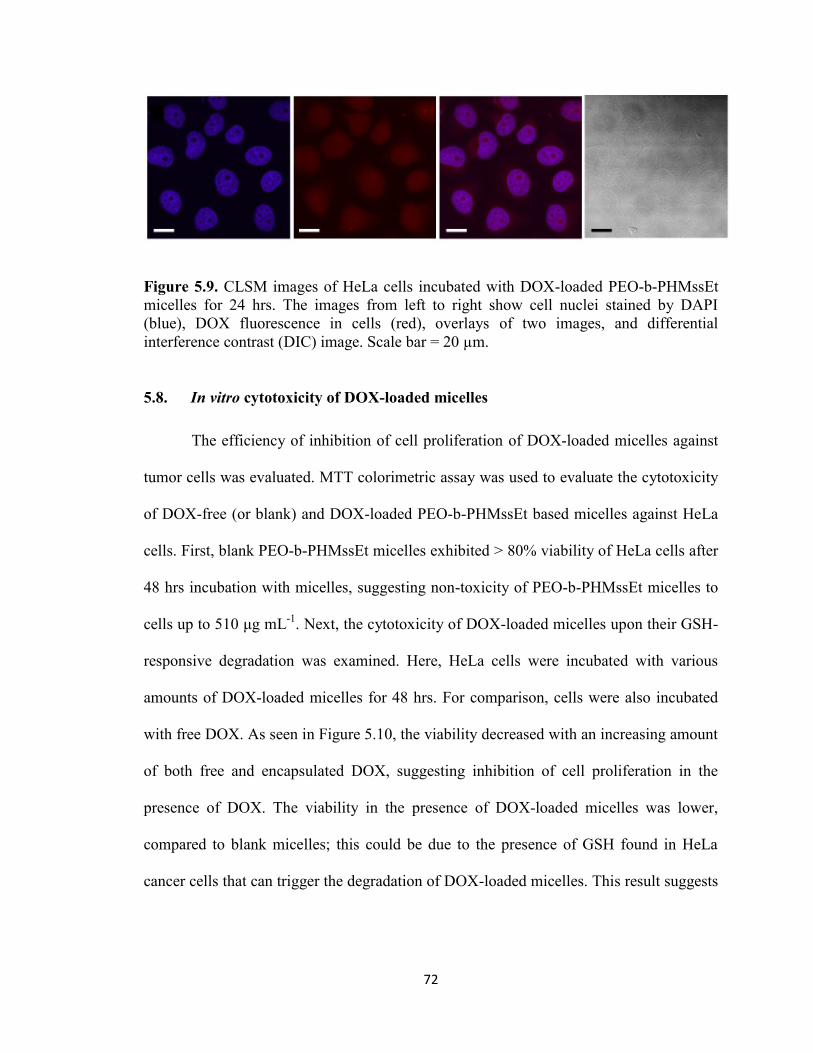
72
Figure 5.9. CLSM images of HeLa cells incubated with DOX-loaded PEO-b-PHMssEt
micelles for 24 hrs. The images from left to right show cell nuclei stained by DAPI
(blue), DOX fluorescence in cells (red), overlays of two images, and differential
interference contrast (DIC) image. Scale bar = 20 µm.
5.8. In vitro cytotoxicity of DOX-loaded micelles
The efficiency of inhibition of cell proliferation of DOX-loaded micelles against
tumor cells was evaluated. MTT colorimetric assay was used to evaluate the cytotoxicity
of DOX-free (or blank) and DOX-loaded PEO-b-PHMssEt based micelles against HeLa
cells. First, blank PEO-b-PHMssEt micelles exhibited > 80% viability of HeLa cells after
48 hrs incubation with micelles, suggesting non-toxicity of PEO-b-PHMssEt micelles to
cells up to 510 μg mL-1
. Next, the cytotoxicity of DOX-loaded micelles upon their GSH-
responsive degradation was examined. Here, HeLa cells were incubated with various
amounts of DOX-loaded micelles for 48 hrs. For comparison, cells were also incubated
with free DOX. As seen in Figure 5.10, the viability decreased with an increasing amount
of both free and encapsulated DOX, suggesting inhibition of cell proliferation in the
presence of DOX. The viability in the presence of DOX-loaded micelles was lower,
compared to blank micelles; this could be due to the presence of GSH found in HeLa
cancer cells that can trigger the degradation of DOX-loaded micelles. This result suggests
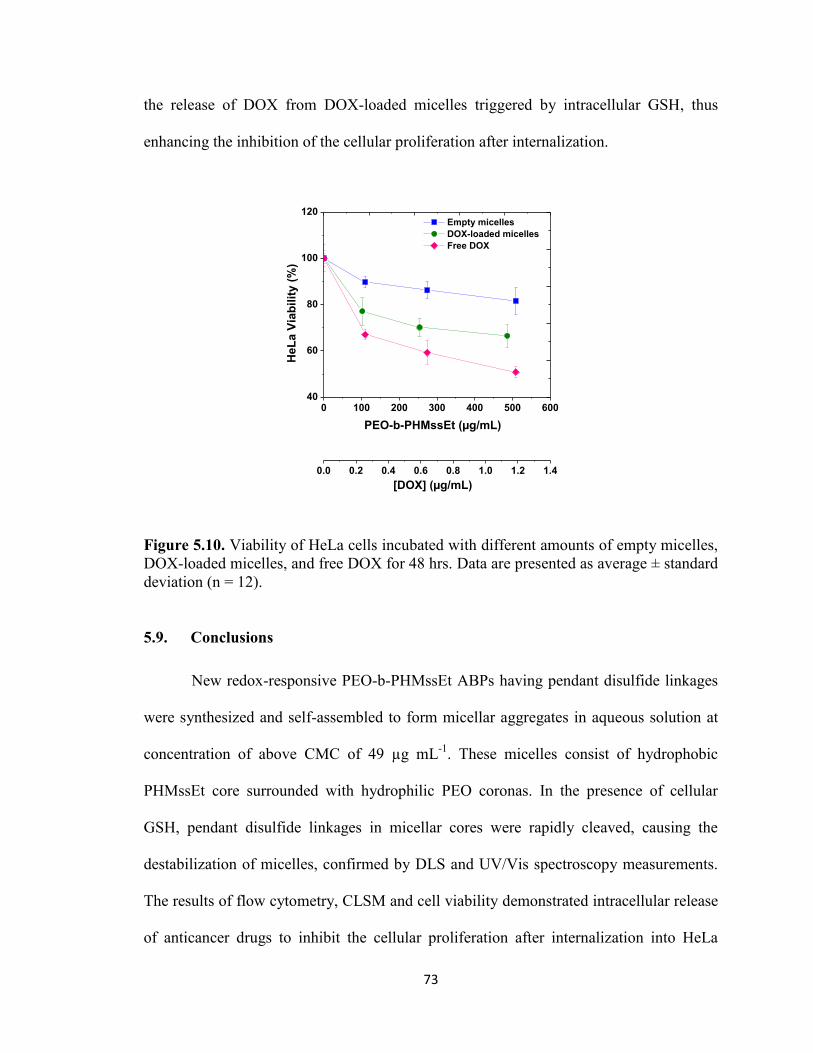
73
the release of DOX from DOX-loaded micelles triggered by intracellular GSH, thus
enhancing the inhibition of the cellular proliferation after internalization.
Figure 5.10. Viability of HeLa cells incubated with different amounts of empty micelles,
DOX-loaded micelles, and free DOX for 48 hrs. Data are presented as average ± standard
deviation (n = 12).
5.9. Conclusions
New redox-responsive PEO-b-PHMssEt ABPs having pendant disulfide linkages
were synthesized and self-assembled to form micellar aggregates in aqueous solution at
concentration of above CMC of 49 µg mL-1
. These micelles consist of hydrophobic
PHMssEt core surrounded with hydrophilic PEO coronas. In the presence of cellular
GSH, pendant disulfide linkages in micellar cores were rapidly cleaved, causing the
destabilization of micelles, confirmed by DLS and UV/Vis spectroscopy measurements.
The results of flow cytometry, CLSM and cell viability demonstrated intracellular release
of anticancer drugs to inhibit the cellular proliferation after internalization into HeLa
0 100 200 300 400 500 60040
60
80
100
120 Empty micelles
DOX-loaded micelles
Free DOX
PEO-b-PHMssEt (µg/mL)
He
La
Via
bil
ity
(%
)
0.0 0.2 0.4 0.6 0.8 1.0 1.2 1.4
[DOX] (µg/mL)

74
cells. These results suggest that GSH-responsive PEO-b-PHMssEt micelles hold great
promise as intracellular nanocarriers exhibiting the enhanced release of encapsulated
anticancer drugs through biodegradation in response to cellular GSH.
75
Chapter 6
Conclusion and Future Works
Stimuli-responsive degradable block copolymer micelles are able to provide
significant advantages for multifunctional drug delivery. These advantageous include
enhanced release of encapsulated biomolecules as well as changes in morphologies of
micellar nanocarriers. Advanced techniques such as control radical polymerization (CRP)
allow for the synthesis of ABPs with chemical flexibility which may be engineered to
incorporate stimuli-responsive degradable moieties. Examples of degradable linkages
include acid-labile and disulfides bonds. These degradable covalent linkages make
nanocarriers capable of undergoing changes in one or more physical properties in
response to external triggers; thereby, triggering the programmed release of encapsulated
biomolecules, particularly anticancer therapeutics. The objective of my master research
was to explore stimuli-responsive degradation by designing new types of amphiphilic
block copolymers. The obtained results contributed to a better understanding of the
structure-property relationship between morphological variance and stimuli-responsive
degradation. In this thesis, three different types of stimuli-responsive degradable micelles
were developed exhibiting pH or thiol-responsive degradation through atom transfer
radical polymerization (ATRP).
First, well-defined OH-terminated HO-POEOMA-b-PtBMA block copolymers
were synthesized by consecutive ATRP of oligo(ethylene oxide) monomethyl ether
methacrylate (OEOMA) and t-butyl methacrylate (tBMA) in the presence of a HO-
76
terminated alkyl halide initiator. 1H-NMR and GPC results suggest that polymerizations
preceded in a living fashion, yielding both HO-MI and HO-ABP with monomodal and
narrow molecular weight distributions as low as Mw/Mn < 1.25. Self-assembly of these
ABPs was first studied in aqueous solution using DLS and TEM. The encapsulation of
small molecules within the hydrophobic micellar core of these micelles was investigated
by loading the micelles with Nile Red (NR), and up to 1.1 wt% loading within micelles
was observed. Hydrolytic cleavage of t-butyl group of PtBMA resulted in doubly
hydrophilic HO-POEOMA-b-PMAA block copolymers. In acidic pH, HO-ABP micelles
were gradually destabilized to form large aggregates. To demonstrate bioconjugation, the
terminal OH groups were functionalized with biotin through a facile carbodiimide
coupling reaction. These preliminary studies were encouraging, however, more work is
required in order to increase HO-ABPs’ sensitivity to acidic environment. In addition, by
varying the nature of the pendant group, micelle destabilization kinetics can be tuned to
occur at a more rapid rate and at a pH more representative of a cancer tissue's
environment.
As detailed in chapter 4, a novel type of amphiphilic mono-cleavable triblock
copolymer having single disulfide linkages in the hydrophobic main chains was
synthesized and utilized to study redox-responsiveness of micelle in the presence of
reducing agents. The mono-cleavable copolymer consisted of hydrophobic
poly(oligo(propylene oxide) monononylphenyl ether acrylate (PAP) and hydrophilic
POEOMA, thus attaining amphiphilicity and having a bush-like structure. Consecutive
(activator generated by electron transfer) AGET ATRP of OEOMA in the presence of ss-
(PAP-Br)2 macroinitiators yielded well-defined ss-ABP2 triblock copolymers, as
77
confirmed by GPC and 1H-NMR. Formation of micellar aggregates in aqueous solution
was studied by tensiometry and DLS. Their thiol-responsive degradation by cleavage of
disulfide linkages in their micelle cores led to the change in morphologies to smaller
aggregate structures, which was confirmed by DLS and AFM measurements. As the
results presented in chapter 4 were merely preliminary, more work still needs to be done
on the current system in order to utilize its potential as controlled delivery vehicles.
Another class of thiol-responsive degradable micelles, which consisted of block
copolymers with disulfide linkages in side chains (pendant multi-cleavable micelles), was
presented in chapter 5. Well-controlled PEO-b-PHMssEt ABPs was previously
synthesized in our group. Self-assembly of PEO-b-PHMssEt to form micellar aggregates
in aqueous solution was confirmed by DLS. Further investigation by TEM revealed the
formation of spherical micelles. The encapsulation of anticancer drug within the
hydrophobic micellar core of micelles was investigated by loading the micelles with
doxorubicin, and up to 0.8% loading within the micelles was observed. The loading level
is a modest, yet encouraging level of encapsulation. The micelles were designed to
exhibit reduction-responsive degradation properties; consequently, pendant disulfide
linkages in micellar cores were cleaved in the presence of GSH, resulting in degradation
or destabilization of micellar nanocarriers. Such degradation led to the enhanced release
of encapsulated anticancer drugs in aqueous solutions, which was monitored by DLS and
UV absorbance measurements. In vitro release of doxorubicin to HeLa cellular
environments was also performed. The efficiency of therapeutic release, was analyzed
using MTT-based cell viability measurements. Intracellular release of anticancer drugs
after internalization into HeLa cancer cells was evidenced by flow cytometry and CLSM.

78
Although these results suggest that PEO-b-PHMssEt micelles hold great promise as
intracellular nanocarriers, more work needs to be done in order to develop the the
medicinal value of these GSH-responsive micelles. Therefore, PEO-b-PHMssEt structure
may be tailored and better-optimized to suit its desired application. Additionally, one
possibility would be to conjugate drugs through a cleavable site to the hydrophobic core.
This would enhance drug loading efficiency and prevent premature drug release.
Future work with these stimuli-responsive degradable micelles also should
involve the testing of their stability over time in biological conditions. The ability of the
proposed nanosized polymeric micelles to accumulate in tumor cells primilarily relied
upon the enhanced permeability and retention (EPR) effect for passive targeting of
tumors. By introducing active targeting moieties, particularly through the attachment of a
cancer cell selective targeting moiety to their surface, the activity of these nanoparticles
could be further enhanced. The epidermal growth factor receptor (EGFR) is one target
that is commonly used for active targeting. EGa1 is a small antibody with specific
binding to the EGFR receptor.[115]
Hence, it would be encouraging to see the
development of PEO-b-PHMssEt functionalized with EGa1 in order to improve their
therapeutic efficacy. Also, it would be extremely beneficial to develop multifunctional
amphiphilic block copolymers for many purposes such as drug delivery and diagnostics
with the ability to respond to several stimuli. Such a system could find far-reaching
applications in medicine by taking advantage of the unique properties of these polymers.
Regardless of the many advances, many challenges and opportunities remain for making
an impact in the field of smart polymers. While new stimuli-responsive degradable
polymeric micelles are continually being developed and the ability to prepare complex
79
macromolecules architectures is growing, many underused stimuli will take on greater
roles in the next generation of smart polymeric nanomaterials.
80
Appendix A
Experimental Section of Chapter 3
A.1. Materials
Ethylene glycol (EG), 2-bromoisobutyric acid (Br-iBuA), N,N´-dicyclohexyl
carbodiimide (DCC), N,N-dimethylaminopyridine (DMAP), N-(3-
dimethylaminopropyl)-N´-ethylcarbodiimide hydrochloride (EDC), N,N,N′,N′′,N′′-
pentamethyldiethylenetriamine (PMDETA, >98%), 2,2′-bipyridyl (bpy), copper(I)
bromide (CuBr, >99.99%), copper(I) chloride (CuCl, >99.99%), trifluoroacetic acid
(CF3COOH), avidin from egg white, biotin (>99%, lyophilized powder), 2-(4-
hydroxyphenylazo)-benzoic acid (HABA), and potassium hydrogen phthalate (KHP)
were used as received from Aldrich. For cell viability assay, Dulbecco’s modified eagle
medium (DMEM, 100 µL) and fetal bovine serum (FBS) were used as received from
Wisent and 3-(4,5-dimethylthiazol-2-yl)-2,5-diphenyltetrazolium bromide (MTT, a
yellow tetrazole) was used as received from Promega. OEOMA with MW = 300 g mol-1
and pendant ethylene oxide (EO) units ≈ 5 and tBMA from Aldrich were purified by
passing it through a column filled with basic alumina to remove inhibitors.
A.2. Synthesis and purification of 2-hydroxyethyl-2´-bromoisobutyrate (OH-
iBuBr)
The 2-Hydroxyethyl-2-bromoisobutyrate (OH-iBuBr) was synthesized as
described elsewhere.[92]
Briefly, Br-iBuA (11.4 g, 68.7 mmol) was mixed with EG (6.4
81
g, 103.1 mmol, 1.5 equivalents to hydroxyl groups) in the presence of DCC (15.1 g, 72.7
mmol) and a catalytic amount of DMAP (0.7 g) in THF (250 mL) at room temperature
overnight. After the removal of dicyclohexyl urea formed as a by-product, the product
was collected as the third of the total four bands off a silica gel column by column
chromatography using 1/4 to 2/3 v/v mixture of diethyl ether/hexane. Yield = 5.6 g
(54.7%). Rf = 0.3 on silica (1/4 diethyl ether/hexane). 1H-NMR (CDCl3, ppm): 1.92 (s,
6H, -C(CH3)2Br), 3.82 (t, 2H, -CH2OH), 4.28 (t, 2H,-OCH2CH2OH). 13
C-NMR (CDCl3,
ppm) 30.7, 55.8, 60.8, 67.4, 171.9.
A.3. Synthesis of HO-POEOMA-Br macroinitiator (HO-MI)
A series of ATRP of OEOMA was conducted in the presence of HO-iBuBr under
various conditions. Here is an example of the detailed procedure for HO-MI with
[OEOMA]0/[OH-iBuBr]0/[CuBr]0/[bpy]0 = 50/1/0.5/1; OH-iBuBr (0.42 g, 2.0 mmol),
OEOMA (30.0 g, 100.0 mmol), bpy (0.32 g, 2.0 mmol), acetone (25 mL), and anisole
(0.3 mL) were added to a 100 mL Schlenk flask. The mixture was degassed by three
freeze-thaw cycles to remove any dissolved oxygen. The flask was filled with nitrogen
and then CuBr (0.14 g, 1.0 mmol) was added to the frozen content. The flask was
immediately degassed by vacuum and then was sealed under nitrogen. The mixture was
allowed to melt and the schlenk flask was immersed in an oil bath preheated to 47 °C to
start the polymerization. Aliquots were withdrawn at different time intervals during the
polymerization to monitor conversion by 1H-NMR and molecular weight by GPC. The
polymerization was stopped by exposing the reaction mixture to air. In order to remove
residual copper species and unreacted monomers, the viscous polymer solutions of HO-
POEOMA-Br in acetone were precipitated (twice) into hexane (300 mL). To remove
82
copper species, the precipitate was then dissolved in THF and passed through a column
filled with basic aluminum oxide. The polymer was isolated by evaporation of solvent via
rotary evaporation and residual solvents were further dried in a vacuum oven at 50 C
overnight.
A.4. Synthesis of HO-POEOMA-b-PtBMA (HO-ABP) block copolymer
The detailed procedure for HO-ABP with [tBMA]0/[HO-POEOMA-
Br]0/[CuBr]0/[bpy]0 = 200/1/0.5/1 is described as follows; purified, dried HO-POEOMA-
Br (1.9 g, 0.49 mmol), tBMA (14 g, 98.4 mmol), bpy (76.9 mg, 0.49 mmol), and acetone
(14 mL) were added to a 50 mL Schlenk flask. The mixture was degassed by three
freeze-thaw cycles to remove any dissolved oxygen. The flask was filled with nitrogen
and then CuBr (35.3 mg, 0.25 mmol) was added to the frozen content. The flask was
closed, evacuated with vacuum and backfilled with nitrogen once. The mixture was
thawed and the flask was then immersed in an oil bath preheated to 47 °C to start the
polymerization. The polymerization was stopped at 5 hrs by exposing the reaction
mixture to air. The resulting HO-ABP was purified as described above.
A.5. Aqueous micellization by solvent evaporation
Dried HO-ABP (10 mg) was dissolved in THF (2 mL), and then distilled water
was added drop-wise into copolymer mixture. The resulting dispersion was stirred for
>12 hrs to remove THF, yielding colloidally stable micellar dispersions at 0.5 mg mL-1
concentrations.
83
A.6. Determination of CMC using a NR probe
Fluorescence measurements were performed with Nile Red (NR) to determine the
CMC. Different dilutions were prepared from a stock solution of NR in THF at 5.0 mg
mL-1
and a stock solution of HO-ABP in THF at 1.0 mg mL-1
to obtain a series of NR-
loaded micelles at various concentrations of HO-ABP ranging from 10-4
to 0.1 mg mL-1
.
Water (12 mL) was drop-wise added into mixtures consisting of the same amount of the
stock solution of NR (20 µL, 0.1 mg NR) and various amounts of the stock solution of
HO-ABP. The resulting dispersions were stirred for 12 hrs to remove THF, and then were
subjected to filtration using 0.45 µm Polyethersulfone (PES) filters to remove excess NR.
Their fluorescence spectra were recorded with λex = 480 nm and the fluorescence
intensity was recorded at maximum λem = 620 nm.
A.7. Hydrolytic cleavage of t-butyl groups of PtBMA blocks in acidic conditions
PtBMA blocks in HO-ABP were hydrolyzed in the presence of CF3COOH in
dichloromethane (CH2Cl2) at room temperature. Typically, HO-ABP (100 mg, 0.5 mol
COOH) dissolved in CH2Cl2 (1.6 mL) was mixed with CF3COOH (321.6 L, 4.3 mmol)
under stirring for 15 hrs. The degraded product was precipitated from hexane (10 mL).
The white solids were isolated and further dried in a vacuum oven at 50 C overnight.
A.8. pH-responsive destabilization of HO-ABP micelles at low pH
Using the same procedure described before, micellar dispersion was prepared at
5 mg mL-1
. Three aliquots were taken from micellar dispersion. Using KHP buffer
solution at pH = 3, pH of two aliquots were adjusted to 5 and 3.2. pH of another aliquots
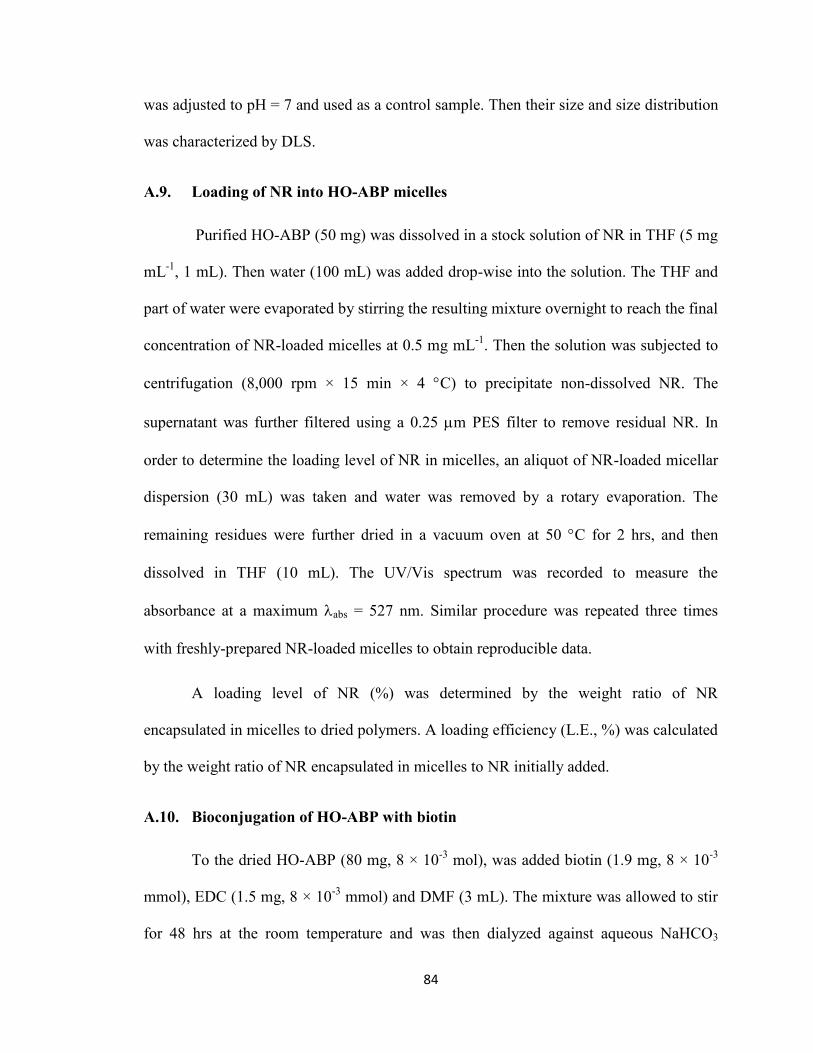
84
was adjusted to pH = 7 and used as a control sample. Then their size and size distribution
was characterized by DLS.
A.9. Loading of NR into HO-ABP micelles
Purified HO-ABP (50 mg) was dissolved in a stock solution of NR in THF (5 mg
mL-1
, 1 mL). Then water (100 mL) was added drop-wise into the solution. The THF and
part of water were evaporated by stirring the resulting mixture overnight to reach the final
concentration of NR-loaded micelles at 0.5 mg mL-1
. Then the solution was subjected to
centrifugation (8,000 rpm × 15 min × 4 C) to precipitate non-dissolved NR. The
supernatant was further filtered using a 0.25 m PES filter to remove residual NR. In
order to determine the loading level of NR in micelles, an aliquot of NR-loaded micellar
dispersion (30 mL) was taken and water was removed by a rotary evaporation. The
remaining residues were further dried in a vacuum oven at 50 C for 2 hrs, and then
dissolved in THF (10 mL). The UV/Vis spectrum was recorded to measure the
absorbance at a maximum abs = 527 nm. Similar procedure was repeated three times
with freshly-prepared NR-loaded micelles to obtain reproducible data.
A loading level of NR (%) was determined by the weight ratio of NR
encapsulated in micelles to dried polymers. A loading efficiency (L.E., %) was calculated
by the weight ratio of NR encapsulated in micelles to NR initially added.
A.10. Bioconjugation of HO-ABP with biotin
To the dried HO-ABP (80 mg, 8 × 10⁻³
mol), was added biotin (1.9 mg, 8 × 10⁻³
mmol), EDC (1.5 mg, 8 × 10⁻³
mmol) and DMF (3 mL). The mixture was allowed to stir
for 48 hrs at the room temperature and was then dialyzed against aqueous NaHCO3
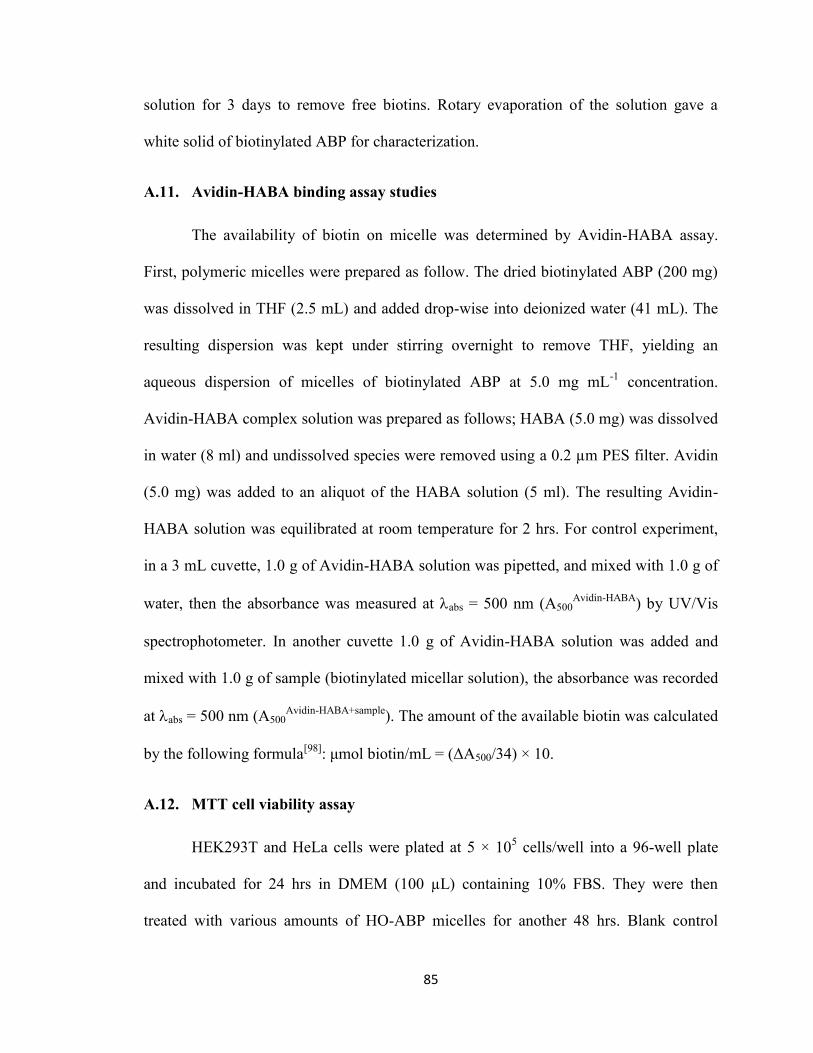
85
solution for 3 days to remove free biotins. Rotary evaporation of the solution gave a
white solid of biotinylated ABP for characterization.
A.11. Avidin-HABA binding assay studies
The availability of biotin on micelle was determined by Avidin-HABA assay.
First, polymeric micelles were prepared as follow. The dried biotinylated ABP (200 mg)
was dissolved in THF (2.5 mL) and added drop-wise into deionized water (41 mL). The
resulting dispersion was kept under stirring overnight to remove THF, yielding an
aqueous dispersion of micelles of biotinylated ABP at 5.0 mg mL-1
concentration.
Avidin-HABA complex solution was prepared as follows; HABA (5.0 mg) was dissolved
in water (8 ml) and undissolved species were removed using a 0.2 µm PES filter. Avidin
(5.0 mg) was added to an aliquot of the HABA solution (5 ml). The resulting Avidin-
HABA solution was equilibrated at room temperature for 2 hrs. For control experiment,
in a 3 mL cuvette, 1.0 g of Avidin-HABA solution was pipetted, and mixed with 1.0 g of
water, then the absorbance was measured at abs = 500 nm (A500Avidin-HABA
) by UV/Vis
spectrophotometer. In another cuvette 1.0 g of Avidin-HABA solution was added and
mixed with 1.0 g of sample (biotinylated micellar solution), the absorbance was recorded
at abs = 500 nm (A500Avidin-HABA+sample
). The amount of the available biotin was calculated
by the following formula[98]
: μmol biotin/mL = (ΔA500/34) × 10.
A.12. MTT cell viability assay
HEK293T and HeLa cells were plated at 5 × 10⁵ cells/well into a 96-well plate
and incubated for 24 hrs in DMEM (100 µL) containing 10% FBS. They were then
treated with various amounts of HO-ABP micelles for another 48 hrs. Blank control
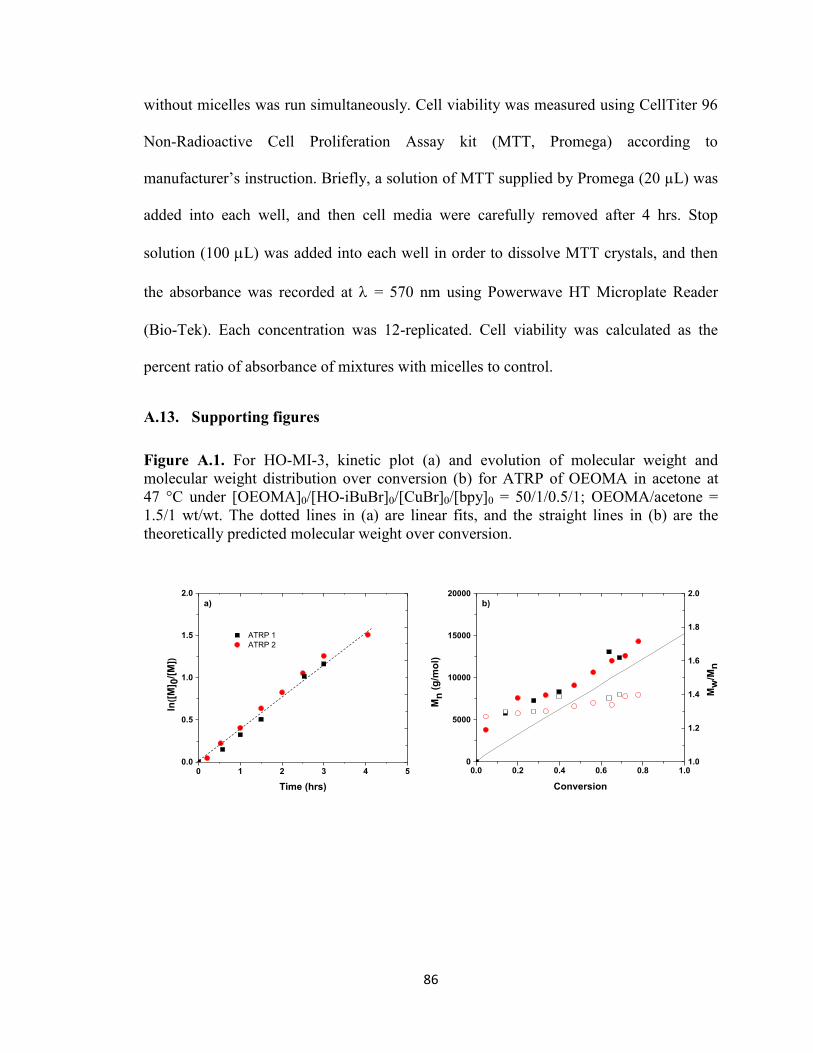
86
without micelles was run simultaneously. Cell viability was measured using CellTiter 96
Non-Radioactive Cell Proliferation Assay kit (MTT, Promega) according to
manufacturer’s instruction. Briefly, a solution of MTT supplied by Promega (20 µL) was
added into each well, and then cell media were carefully removed after 4 hrs. Stop
solution (100 L) was added into each well in order to dissolve MTT crystals, and then
the absorbance was recorded at = 570 nm using Powerwave HT Microplate Reader
(Bio-Tek). Each concentration was 12-replicated. Cell viability was calculated as the
percent ratio of absorbance of mixtures with micelles to control.
A.13. Supporting figures
Figure A.1. For HO-MI-3, kinetic plot (a) and evolution of molecular weight and
molecular weight distribution over conversion (b) for ATRP of OEOMA in acetone at
47 °C under [OEOMA]0/[HO-iBuBr]0/[CuBr]0/[bpy]0 = 50/1/0.5/1; OEOMA/acetone =
1.5/1 wt/wt. The dotted lines in (a) are linear fits, and the straight lines in (b) are the
theoretically predicted molecular weight over conversion.
0.0 0.2 0.4 0.6 0.8 1.00
5000
10000
15000
20000
Mn
(g
/mo
l)
Conversion
1.0
1.2
1.4
1.6
1.8
2.0
Mw
/Mn
0 1 2 3 4 50.0
0.5
1.0
1.5
2.0
ATRP 1
ATRP 2
ln([
M] 0
/[M
])
Time (hrs)
a) b)
87
Figure A.2. UV spectra of different concentrations of NR in THF to determine its
extinction coefficient at max = 527 nm.
Figure A.3. An example of UV spectra of HO-ABP and NR-loaded HO-ABP micelles
dissolved in THF.
200 300 400 500 600 700 800
0.0
0.2
0.4
0.6
0.8
Ab
so
rban
ce
Wavelength (nm)
0 4 8 12 16 200.0
0.2
0.4
0.6
0.8
Ab
so
rban
ce
NR [mol/L x 10-6]
= 37,300 M-1 cm-1
mg/mL
0.005
0.003
0.001
0.0008
0.0005
0.0001
0.00001
NR concentration (µmol/L)
200 300 400 500 600 700
0.0
0.3
0.6
0.9
1.2
1.5
Ab
so
rban
ce
Wavelength (nm)
NR-loaded
HO-ABP micellesHO-ABP
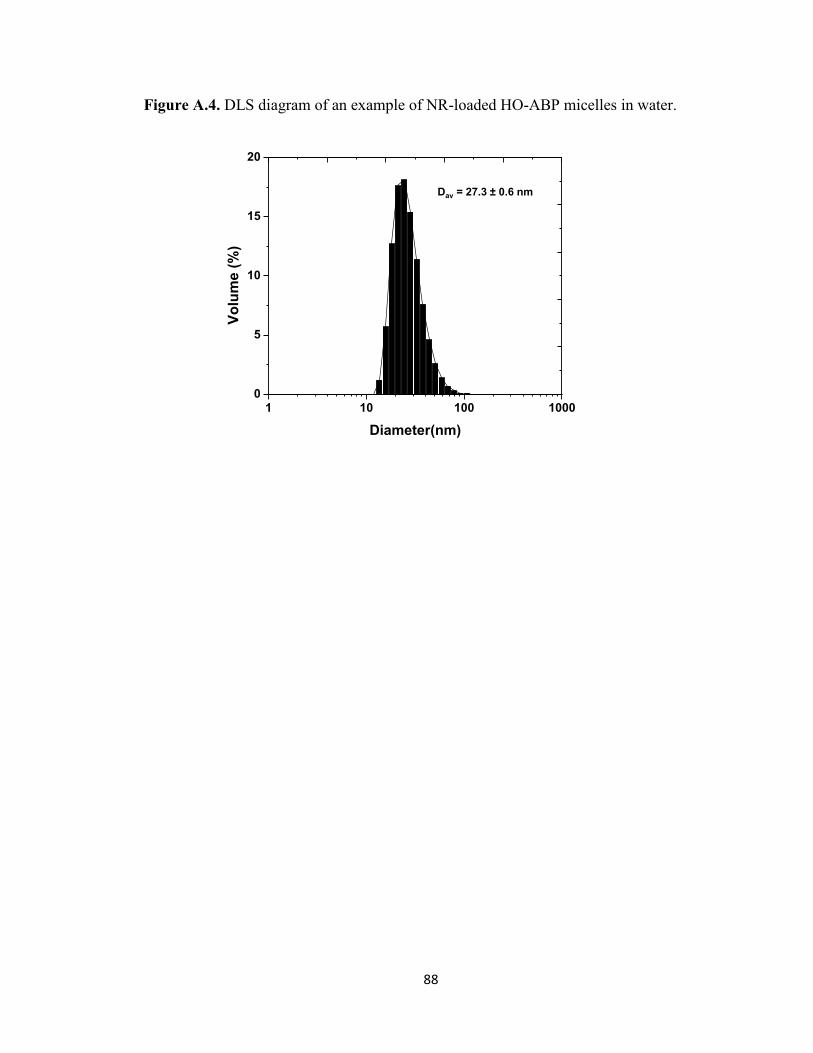
88
Figure A.4. DLS diagram of an example of NR-loaded HO-ABP micelles in water.
1 10 100 10000
5
10
15
20
Vo
lum
e (
%)
Diameter(nm)
Dav = 27.3 0.6 nm
89
Appendix B
Experimental Section of Chapter 4
B.1. Materials
2-Hydroxyethyl disulfide, 2-bromoisoburylic acid, N,N′-dicyclohexyl
carbodiimide (DCC), 4-dimethylaminopyridine (DMAP) as a catalyst, N,N,N′,N′′,N′′-
pentamethyldiethylenetriamine (PMDETA, >98%), copper (II) chloride (CuCl2,
>99.99%), tin (II) 2-ethylhexanonate (Sn(Oct)2, >95%), tributyl phosphine (Bu3P, 97%),
and anisole from Aldrich were used as received. copper(II) bromide (CuBr2, >99.99%)
and DL-dithioerythritol (DTT, 99%) was purchased from Acros Organics.
Oligo(propylene oxide) monononylphenyl ether acrylate (AP) with MW = 419 g mol-1
and pendent PO units DP ≈ 3 and oligo(ethylene oxide) monomethyl ether methacrylate
(OEOMA) with MW = 300 g mol-1
and pendent EO units DP ≈ 5 from Aldrich were
purified by passing them through a column filled with basic alumina to remove inhibitors.
Spectra/Por dialysis tubing (MWCO = 3,500 g mol-1
) was purchased from SpectrumLab.
B.2. Synthesis of bis[2-(2-bromoisobutyryloxy)ethyl] disulfide (SS-DBr)
2-bromoisoburylic acid (12.0 g, 71.9 mmol) dissolved in tetrahydrofuran (THF,
50 mL) was drop-wise added to a solution of 2-hydroxyethyl disulfide (5.0 g, 32.5
mmol), DCC (14.7 g, 71.2 mmol), a catalytic amount of DMAP, and THF (130 mL) at 0
°C over 20 min. The resulting solution was stirred at room temperature for overnight.
White solids (dicyclohexyl urea) formed during the reaction were removed by a vacuum
90
filtration. The solvent was then removed by a rotary evaporation. For further purification,
the product was dissolved in hexane and undissolved dicyclohexyl urea (DCU) was
removed by vacuum filtration. The pure product was isolated by removal of hexane and
further dried in vacuum oven at 50 °C overnight to form oily residue. 1H-NMR (CDCl3,
ppm) 4.5 (t, 4H, -CH2O(O)C-), 3.0 (t, 4H, -CH2-SS-),1.9 (s, 6H, Br-C(CH3)2).
B.3. Synthesis of ss-(PAP-Br)2 macroinitiators
A series of ATRP of AP was conducted in the presence of SS-DBr difunctional
initiator. The typical procedure for the preparation of ss-(PAP-Br)2 is as follows; SS-DBr
(40.0 mg, 0.14 mmol), AP (5.8 g, 13.8 mmol), PMDETA (57.8 mL, 0.28 mmol), CuBr2
(61.8 mg, 0.28 mmol), and acetone (4.9 mL) were added to a 25 mL Schlenk flask. The
resulting transparent solution was deoxygenated by purging with nitrogen for 30 min at
room temperature. The flask was immersed in an oil bath preheated to 80 °C. A nitrogen-
purged solution of Sn(Oct)2 (291.4 mg, 0.72 mmol) in anisole (0.5 mL) was added to start
the polymerization. Aliquots were removed at different time intervals during the
polymerization to measure conversion by 1H-NMR and molecular weight using GPC.
The polymerization was stopped by exposing the catalyst to air.
B.4. Synthesis of ss-ABP2 triblock copolymers
Dried, purified ss-(PAP-Br)2 (Mn,theo = 10,000 g mol-1
, 0.5 g, 0.05 mmol),
OEOMA (1.5 g, 5.0 mmol), PMDETA (20.9 mL, 0.10 mmol), CuCl2 (13.4 mg, 0.10
mmol), and anisole (1.3 mL) were added to a 25 mL Schlenk flask. The resulting
transparent solution was deoxygenated by purging with nitrogen for 30 min at room
temperature. The flask was immersed in an oil bath preheated to 80 °C. A nitrogen-
91
purged solution of Sn(Oct)2 (105 mg, 0.26 mmol) in anisole (0.3 mL) was added to start
the polymerization. Aliquots were removed at different time intervals during the
polymerization to measure conversion and molecular weight using GPC. The
polymerization was stopped by exposing the catalyst to air. For purification of ss-ABP2,
anisole was removed from reaction mixture by rotary evaporation. The residues were
dissolved in THF and dialyzed using a dialysis tubing with MWCO = 3,500 g mol-1
(SpectrumLab) over a mixture of MeOH/water (5/5 v/v) to remove unreacted OEOMA.
The GPC trace suggests that < 5% unreacted OEOMA remained in the purified ss-ABP2.
B.5. Aqueous micellization by solvent evaporation
An aliquot of the purified, dried ss-ABP2 (92 mg) was dissolved in THF (2.6 mL).
The clear polymer solution (0.30 mL) was drop-wise added into deionized water (10
mL). The resulting dispersion was kept under stirring overnight to remove THF, yielding
colloidally stable micellar dispersions at 1mg mL-1
concentration.
B.6. Determination of CMC of ss-ABP2 in water by tensiometry
An aliquot of the purified, dried ss-ABP2 (20 mg) was dissolved in THF (1.0 mL).
The clear polymer solution was drop-wise added into deionized water (20 mL). The
resulting dispersion was kept under stirring overnight to remove THF, allowing for
colloidally stable micellar dispersion. The final concentration of the dispersion was
calculated to be 1.4 mg mL-1
. Then, aliquots of the aqueous stock solution were diluted
with different amounts of deionized water to form a series of aqueous solutions of ss-
ABP2 at different concentrations from 10-3
to 1.4 mg mL-1
. A tensiometry was used to
measure the osmotic pressure (mN/m) of the solutions as follows; an aliquot of each
92
solution (600 μL) was carefully placed on each well and equilibrated before
measurements. The tensiometer was calibrated using air and water.
B.7. Degradation of ss-ABP2 triblock copolymers and micelles
An aliquot of purified, dried ss-ABP2 (50 mg) was dissolved in THF (5 mL). To
the mixture was added Bu3P (0.85 mL) defined as the ratio of Bu3P/disulfide = 1/1. The
mixture was magnetically stirred and aliquots of the mixture were injected into GPC to
determine molecular weight of degraded products.
For micellar dispersion, an aliquot of micellar dispersion at 2.3 mg mL-1
(100 mL)
was diluted with water (2.0 mL). The amount of disulfide linkages in micelles can be
calculated to be 18.1 nmol using Mn,theo = 12,700 g mol-1
of ss-ABP2. An aliquot of the
micellar dispersion (1.0 mL) was mixed with an aqueous stock solution of DTT (0.5 mg
mL-1
, 2.7 mL) defined as the ratio of DTT/disulfide = 1/1 under magnetic stirring.
Aliquots were taken for atomic force microscopy.
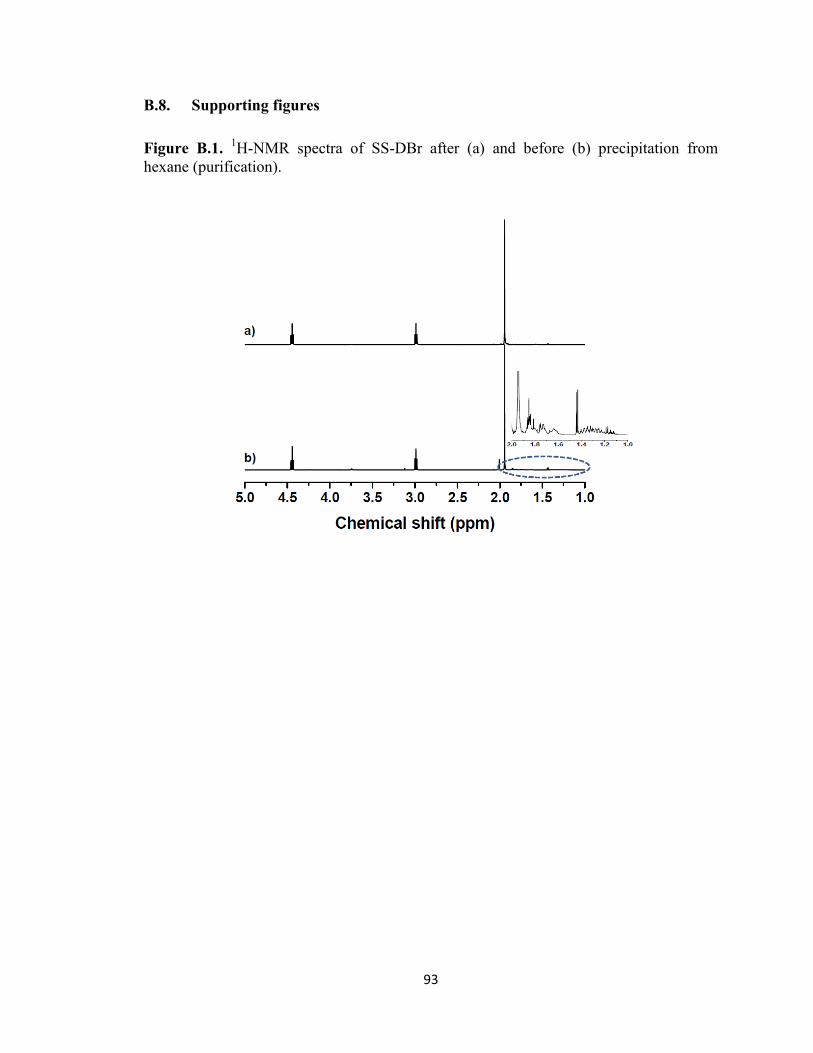
93
B.8. Supporting figures
Figure B.1. 1H-NMR spectra of SS-DBr after (a) and before (b) precipitation from
hexane (purification).
94
Appendix C
Experimental Section of Chapter 5
C.1. Materials
PEO-b-PHMssEt block copolymer was synthesized by Dr. Q. Zhang.[64]
Doxorubicin hydrochloride (DOX.HCl, > 98%), L-glutathione (GSH) reduced form,
triethylamine (Et3N, > 99.5 %) and dimethylformamide (DMF) were purchased from
Aldrich and used as received. Spectra/Por dialysis tubing (MWCO = 12,000 g mol-1
) was
purchased from SpectrumLab. For cell viability assay, Dulbecco’s modified eagle
medium (DMEM) and fetal bovine serum (FBS) were used as received from Wisent and
3-(4,5-dimethylthiazol-2-yl)-2,5-diphenyltetrazolium bromide (MTT, a yellow
tetrazolium) was used as received from Promega. 4',6-diamidino-2-phenylindole (DAPI)
and mounting medium were used as received from Aldrich.
C.2. Aqueous micellization by dialysis method
Water (9 mL) was added drop-wise to a clear solution of PEO-b-PHMssEt (10
mg) dissolved in DMF (2 mL). The resulting mixture was stirred for 2 hrs, and then
dialyzed in a dialysis tubing (MWCO = 12,000 g mol-1
) against water for 3 days to
remove DMF. The outer water (500 mL) was changed twice a day, yielding colloidally-
stable micellar aggregates in aqueous solution at 1 mg mL-1
concentration.
95
C.3. Preparation of DOX-loaded micelles
Similar procedure for aqueous micellization through the dialysis method was
used. For the preparation of the sample of MDOX-1, water (5 mL) was added dropwise
to the solution consisting of the purified, dried PEO-b-PHMssEt (20 mg), DOX (1 mg),
and Et3N (3 mol equivalent to DOX) in DMF (2 mL). The resulting dispersion was
dialyzed over water (500 mL) for 5 days, yielding DOX-loaded micellar dispersion at 2.6
mg mL-1
concentration. For the MDOX-2 at 1.7 mg mL-1
, a similar procedure was used
except for the use of increasing amounts of PEO-b-PHMssEt (20 mg), DOX (2 mg),
DMF (3 mL), and water (10 mL).
C.4. Determination of loading level of DOX using UV/Vis spectroscopy
A calibration curve of absorbance (A) at max = 480 nm over various
concentrations of DOX in DMF was first constructed as follows. A stock solution of
DOX in DMF (1 mg mL-1
, 1.7 mmol L-1
) was first prepared by dissolving DOX (1 mg,
1.7 μmol) in DMF (1 mL). Aliquots of the stock solution were then diluted with DMF to
form a series of solutions of DOX ranging from 5.6 to19.5 μmol L-1
. Their UV/Vis
spectra (ex = 480 nm) were recorded. To determine the loading level of DOX in DOX-
loaded micelles, aliquots of DOX-loaded micellar dispersion (1 mL) were taken. After
the removal of water using a rotary evaporation, the residues of DOX and copolymers
were dissolved in DMF (2 mL) to form clear solution. Their UV/Vis spectra were
recorded and the loading level of DOX was calculated by the weight ratio of loaded DOX
to dried polymers. The extinction coefficient of DOX in DMF was determined to be ε =
11,700 M−1
cm−1
at λmax = 480 nm.
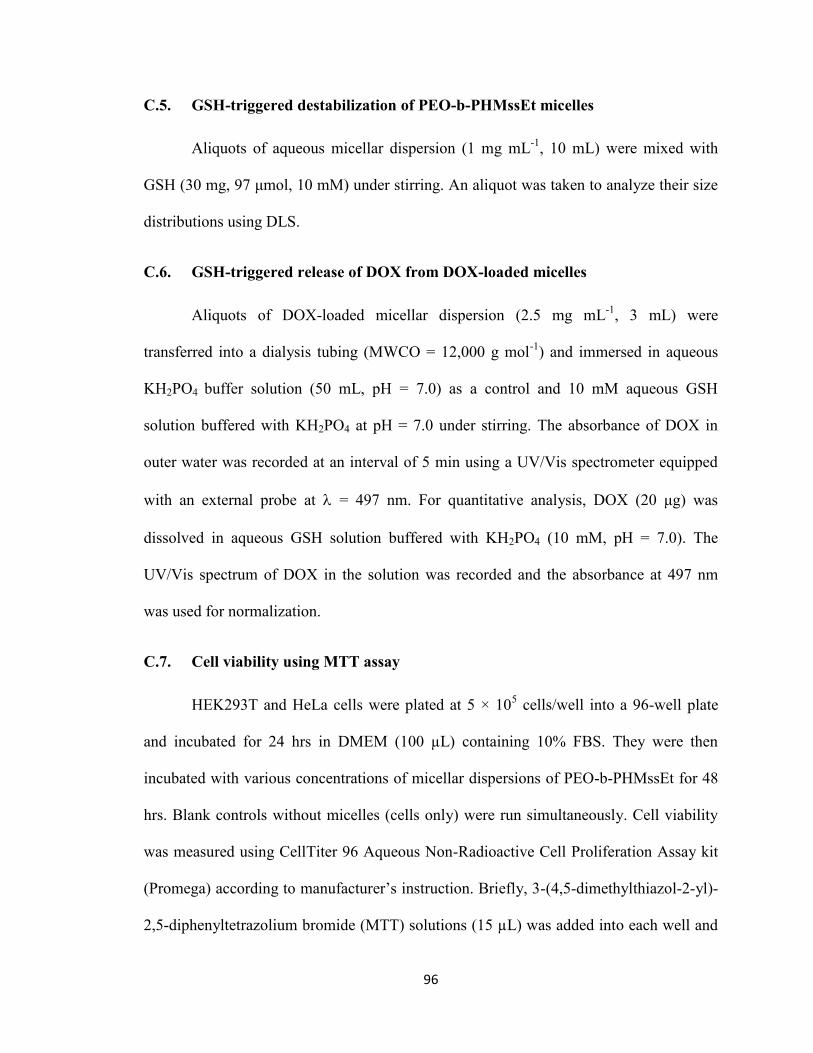
96
C.5. GSH-triggered destabilization of PEO-b-PHMssEt micelles
Aliquots of aqueous micellar dispersion (1 mg mL-1
, 10 mL) were mixed with
GSH (30 mg, 97 μmol, 10 mM) under stirring. An aliquot was taken to analyze their size
distributions using DLS.
C.6. GSH-triggered release of DOX from DOX-loaded micelles
Aliquots of DOX-loaded micellar dispersion (2.5 mg mL-1
, 3 mL) were
transferred into a dialysis tubing (MWCO = 12,000 g mol-1
) and immersed in aqueous
KH2PO4 buffer solution (50 mL, pH = 7.0) as a control and 10 mM aqueous GSH
solution buffered with KH2PO4 at pH = 7.0 under stirring. The absorbance of DOX in
outer water was recorded at an interval of 5 min using a UV/Vis spectrometer equipped
with an external probe at = 497 nm. For quantitative analysis, DOX (20 μg) was
dissolved in aqueous GSH solution buffered with KH2PO4 (10 mM, pH = 7.0). The
UV/Vis spectrum of DOX in the solution was recorded and the absorbance at 497 nm
was used for normalization.
C.7. Cell viability using MTT assay
HEK293T and HeLa cells were plated at 5 × 10⁵ cells/well into a 96-well plate
and incubated for 24 hrs in DMEM (100 µL) containing 10% FBS. They were then
incubated with various concentrations of micellar dispersions of PEO-b-PHMssEt for 48
hrs. Blank controls without micelles (cells only) were run simultaneously. Cell viability
was measured using CellTiter 96 Aqueous Non-Radioactive Cell Proliferation Assay kit
(Promega) according to manufacturer’s instruction. Briefly, 3-(4,5-dimethylthiazol-2-yl)-
2,5-diphenyltetrazolium bromide (MTT) solutions (15 µL) was added into each well and
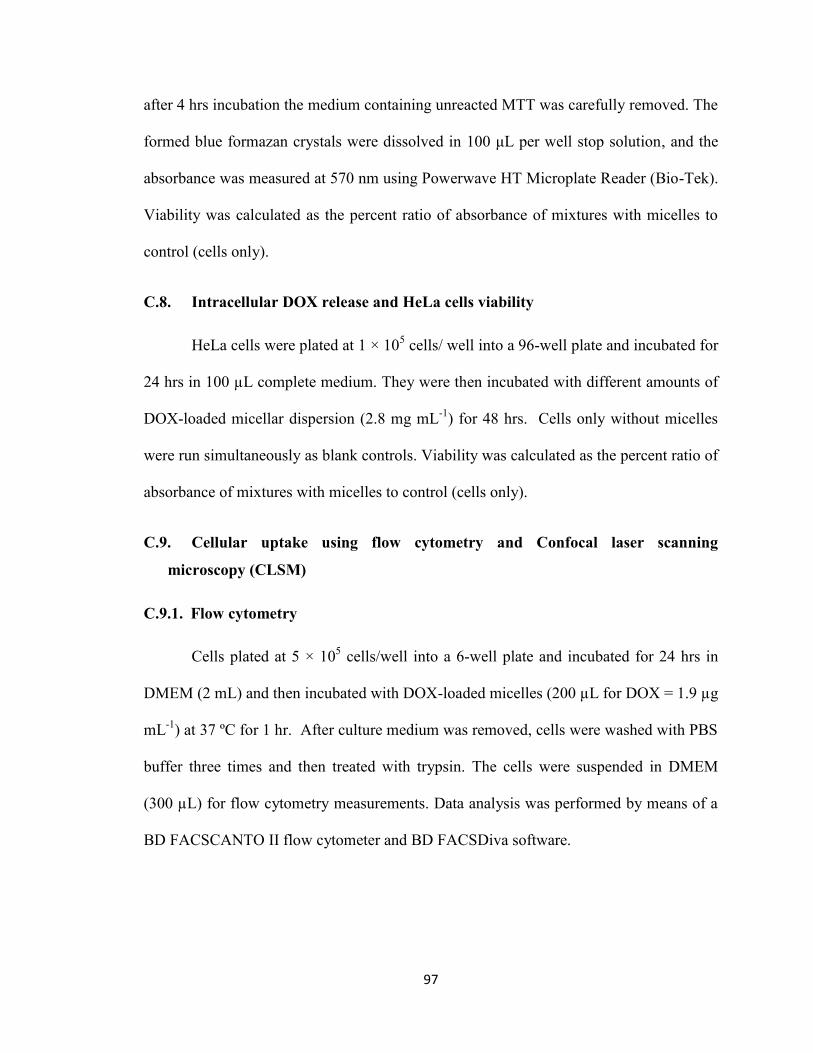
97
after 4 hrs incubation the medium containing unreacted MTT was carefully removed. The
formed blue formazan crystals were dissolved in 100 μL per well stop solution, and the
absorbance was measured at 570 nm using Powerwave HT Microplate Reader (Bio-Tek).
Viability was calculated as the percent ratio of absorbance of mixtures with micelles to
control (cells only).
C.8. Intracellular DOX release and HeLa cells viability
HeLa cells were plated at 1 × 10⁵ cells/ well into a 96-well plate and incubated for
24 hrs in 100 µL complete medium. They were then incubated with different amounts of
DOX-loaded micellar dispersion (2.8 mg mL-1
) for 48 hrs. Cells only without micelles
were run simultaneously as blank controls. Viability was calculated as the percent ratio of
absorbance of mixtures with micelles to control (cells only).
C.9. Cellular uptake using flow cytometry and Confocal laser scanning
microscopy (CLSM)
C.9.1. Flow cytometry
Cells plated at 5 × 10⁵ cells/well into a 6-well plate and incubated for 24 hrs in
DMEM (2 mL) and then incubated with DOX-loaded micelles (200 µL for DOX = 1.9 µg
mL-1
) at 37 ºC for 1 hr. After culture medium was removed, cells were washed with PBS
buffer three times and then treated with trypsin. The cells were suspended in DMEM
(300 µL) for flow cytometry measurements. Data analysis was performed by means of a
BD FACSCANTO II flow cytometer and BD FACSDiva software.
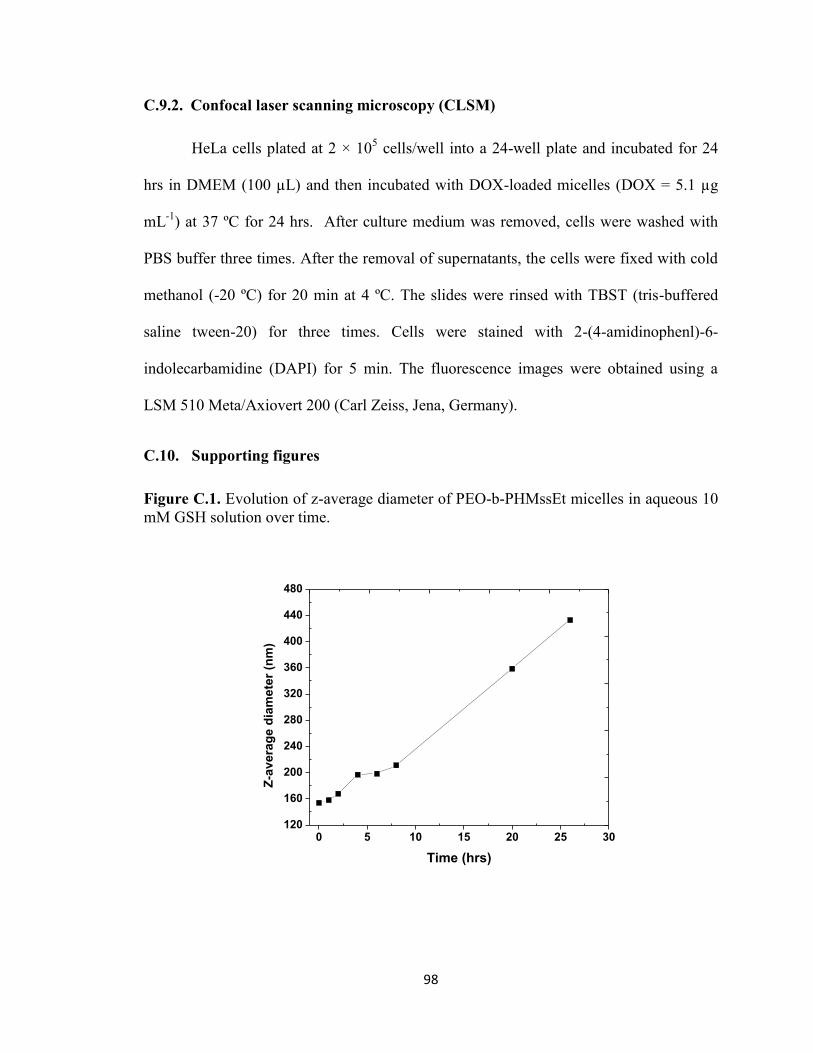
98
C.9.2. Confocal laser scanning microscopy (CLSM)
HeLa cells plated at 2 × 10⁵ cells/well into a 24-well plate and incubated for 24
hrs in DMEM (100 µL) and then incubated with DOX-loaded micelles (DOX = 5.1 µg
mL-1
) at 37 ºC for 24 hrs. After culture medium was removed, cells were washed with
PBS buffer three times. After the removal of supernatants, the cells were fixed with cold
methanol (-20 ºC) for 20 min at 4 ºC. The slides were rinsed with TBST (tris-buffered
saline tween-20) for three times. Cells were stained with 2-(4-amidinophenl)-6-
indolecarbamidine (DAPI) for 5 min. The fluorescence images were obtained using a
LSM 510 Meta/Axiovert 200 (Carl Zeiss, Jena, Germany).
C.10. Supporting figures
Figure C.1. Evolution of z-average diameter of PEO-b-PHMssEt micelles in aqueous 10
mM GSH solution over time.
0 5 10 15 20 25 30120
160
200
240
280
320
360
400
440
480
Z-a
vera
ge d
iam
ete
r (n
m)
Time (hrs)
99
Figure C.2. UV absorbance at λ= 497 nm of free DOX in outer water during extensive
dialysis.
Figure C.3. Overlaid UV spectra (a) and absorbance at λmax = 480 nm (b) of DOX at
various concentrations (µmol L-1
) in DMF to construct a calibration curve.
1 2 3 4 5 6
0.00
0.02
0.04
0.06
0.08
0.10
Ab
so
rba
nc
e a
t 4
97
(n
m)
Time (day)
Outer water
changed
0 5 10 15 20 250.00
0.05
0.10
0.15
0.20
0.25
0.30
DOX concentration (umol/L)
Ab
so
rban
ce
= 11,900 M-1 cm-1
R2 > 0.999
300 400 500 600 700 800
0.00
0.05
0.10
0.15
0.20
0.25
0.30 19.5
16.7
14.0
11.2
8.55
5.66
(umol/L)
Ab
so
rban
ce
Wavelength (nm)
a)b)
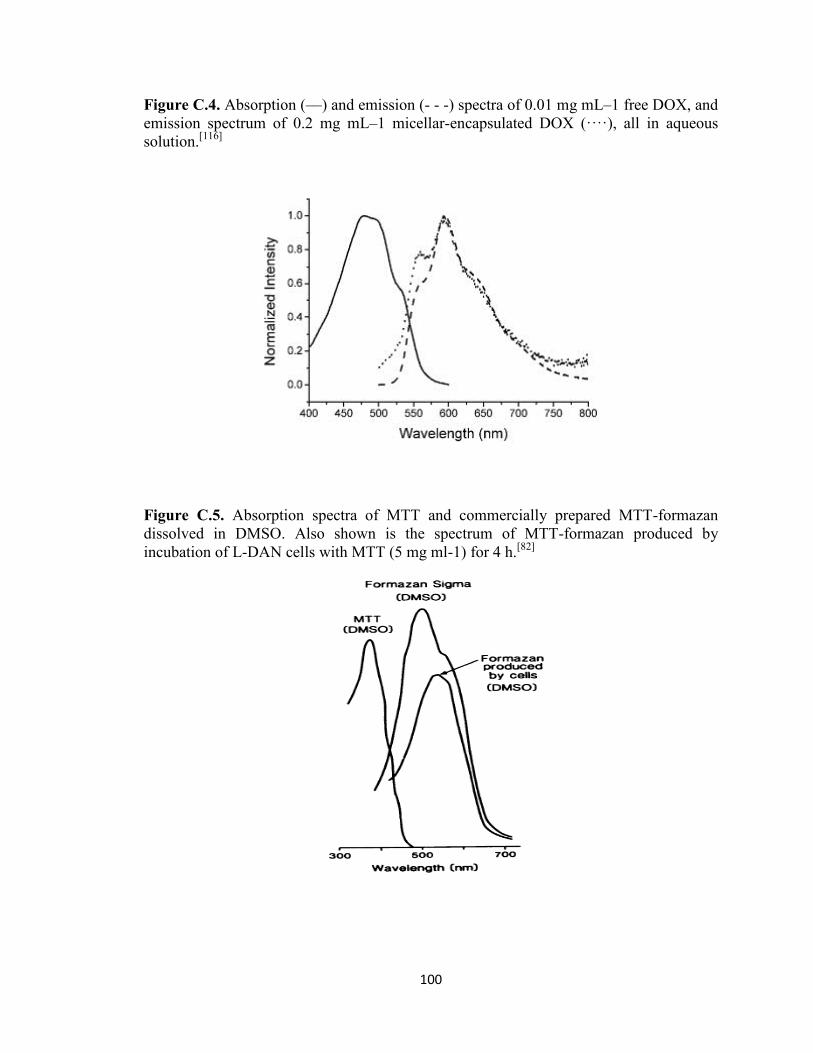
100
Figure C.4. Absorption (––) and emission (- - -) spectra of 0.01 mg mL–1 free DOX, and
emission spectrum of 0.2 mg mL–1 micellar-encapsulated DOX (····), all in aqueous
solution.[116]
Figure C.5. Absorption spectra of MTT and commercially prepared MTT-formazan
dissolved in DMSO. Also shown is the spectrum of MTT-formazan produced by
incubation of L-DAN cells with MTT (5 mg ml-1) for 4 h.[82]
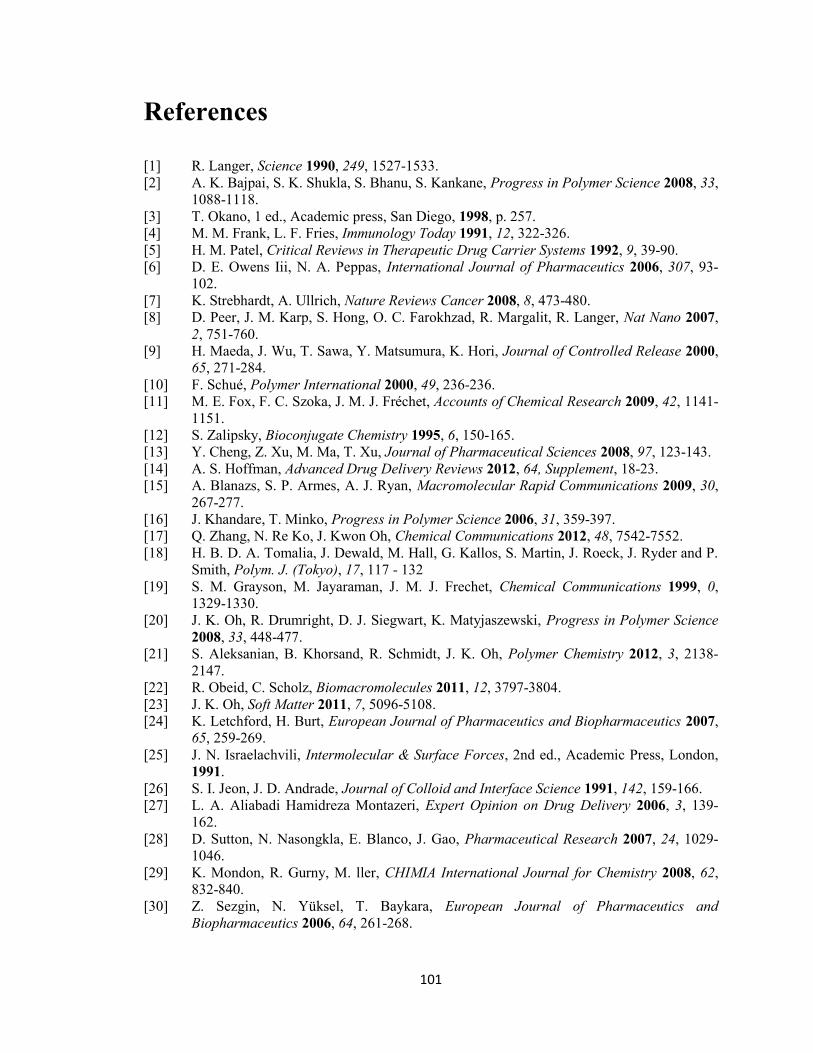
101
References
[1] R. Langer, Science 1990, 249, 1527-1533.
[2] A. K. Bajpai, S. K. Shukla, S. Bhanu, S. Kankane, Progress in Polymer Science 2008, 33,
1088-1118.
[3] T. Okano, 1 ed., Academic press, San Diego, 1998, p. 257.
[4] M. M. Frank, L. F. Fries, Immunology Today 1991, 12, 322-326.
[5] H. M. Patel, Critical Reviews in Therapeutic Drug Carrier Systems 1992, 9, 39-90.
[6] D. E. Owens Iii, N. A. Peppas, International Journal of Pharmaceutics 2006, 307, 93-
102.
[7] K. Strebhardt, A. Ullrich, Nature Reviews Cancer 2008, 8, 473-480.
[8] D. Peer, J. M. Karp, S. Hong, O. C. Farokhzad, R. Margalit, R. Langer, Nat Nano 2007,
2, 751-760.
[9] H. Maeda, J. Wu, T. Sawa, Y. Matsumura, K. Hori, Journal of Controlled Release 2000,
65, 271-284.
[10] F. Schué, Polymer International 2000, 49, 236-236.
[11] M. E. Fox, F. C. Szoka, . M. . Fr chet, Accounts of Chemical Research 2009, 42, 1141-
1151.
[12] S. Zalipsky, Bioconjugate Chemistry 1995, 6, 150-165.
[13] Y. Cheng, Z. Xu, M. Ma, T. Xu, Journal of Pharmaceutical Sciences 2008, 97, 123-143.
[14] A. S. Hoffman, Advanced Drug Delivery Reviews 2012, 64, Supplement, 18-23.
[15] A. Blanazs, S. P. Armes, A. J. Ryan, Macromolecular Rapid Communications 2009, 30,
267-277.
[16] J. Khandare, T. Minko, Progress in Polymer Science 2006, 31, 359-397.
[17] Q. Zhang, N. Re Ko, J. Kwon Oh, Chemical Communications 2012, 48, 7542-7552.
[18] H. B. D. A. Tomalia, J. Dewald, M. Hall, G. Kallos, S. Martin, J. Roeck, J. Ryder and P.
Smith, Polym. J. (Tokyo), 17, 117 - 132
[19] S. M. Grayson, M. Jayaraman, J. M. J. Frechet, Chemical Communications 1999, 0,
1329-1330.
[20] J. K. Oh, R. Drumright, D. J. Siegwart, K. Matyjaszewski, Progress in Polymer Science
2008, 33, 448-477.
[21] S. Aleksanian, B. Khorsand, R. Schmidt, J. K. Oh, Polymer Chemistry 2012, 3, 2138-
2147.
[22] R. Obeid, C. Scholz, Biomacromolecules 2011, 12, 3797-3804.
[23] J. K. Oh, Soft Matter 2011, 7, 5096-5108.
[24] K. Letchford, H. Burt, European Journal of Pharmaceutics and Biopharmaceutics 2007,
65, 259-269.
[25] J. N. Israelachvili, Intermolecular & Surface Forces, 2nd ed., Academic Press, London,
1991.
[26] S. I. Jeon, J. D. Andrade, Journal of Colloid and Interface Science 1991, 142, 159-166.
[27] L. A. Aliabadi Hamidreza Montazeri, Expert Opinion on Drug Delivery 2006, 3, 139-
162.
[28] D. Sutton, N. Nasongkla, E. Blanco, J. Gao, Pharmaceutical Research 2007, 24, 1029-
1046.
[29] K. Mondon, R. Gurny, M. ller, CHIMIA International Journal for Chemistry 2008, 62,
832-840.
[30] Z. Sezgin, N. Yüksel, T. Baykara, European Journal of Pharmaceutics and
Biopharmaceutics 2006, 64, 261-268.
102
[31] M. L. Adams, A. Lavasanifar, G. S. Kwon, Journal of Pharmaceutical Sciences 2003, 92,
1343-1355.
[32] K. J. Holmberg, B.; Kronberg, B.; Lindman, B. , Surfactants and Polymers in Aqueous
Solution Second Edition ed., John Wiley & Sons, Ltd, , , 2003.
.
[33] G. S. O. Kwon, T., Advanced Drug Delivery Reviews 1996, 21, 107.
[34] C. Allen, D. Maysinger, A. Eisenberg, Colloids and Surfaces B: Biointerfaces 1999, 16,
3-27.
[35] R. Nagarajan, K. Ganesh, The Journal of Chemical Physics 1989, 90, 5843-5856.
[36] E. Fleige, M. A. Quadir, R. Haag, Advanced Drug Delivery Reviews 2012, 64, 866-884.
[37] Z. Qian, A. Samuel, C. Alexander, O. Jung Kwon, in Progress in Controlled Radical
Polymerization: Materials and Applications, Vol. 1101, American Chemical Society,
2012, pp. 287-302.
[38] A. W. Jackson, D. A. Fulton, Macromolecules 2012, 45, 2699-2708.
[39] H. Fan, J. Huang, Y. Li, J. Yu, J. Chen, Polymer 2010, 51, 5107-5114.
[40] S. Li, C. Ye, G. Zhao, M. Zhang, Y. Zhao, Journal of Polymer Science Part A: Polymer
Chemistry 2012, 50, 3135-3148.
[41] W. Gao, J. M. Chan, O. C. Farokhzad, Molecular Pharmaceutics 2010, 7, 1913-1920.
[42] F. Meng, Z. Zhong, J. Feijen, Biomacromolecules 2009, 10, 197-209.
[43] S. Sengupta, D. Eavarone, I. Capila, G. Zhao, N. Watson, T. Kiziltepe, R. Sasisekharan,
Nature 2005, 436, 568-572.
[44] S. Aryal, C.-M. J. Hu, L. Zhang, ACS Nano 2009, 4, 251-258.
[45] H. Mok, J. W. Park, T. G. Park, Bioconjugate Chemistry 2008, 19, 797-801.
[46] A. P. Griset, J. Walpole, R. Liu, A. Gaffey, Y. L. Colson, M. W. Grinstaff, Journal of the
American Chemical Society 2009, 131, 2469-2471.
[47] B. Wang, C. Xu, J. Xie, Z. Yang, S. Sun, Journal of the American Chemical Society
2008, 130, 14436-14437.
[48] Z. Xu, W. Gu, L. Chen, Y. Gao, Z. Zhang, Y. Li, Biomacromolecules 2008, 9, 3119-
3126.
[49] E. R. Gillies, J. M. J. Frechet, Chemical Communications 2003, 0, 1640-1641.
[50] K. Ulbrich, V. r. Šubr, Advanced Drug Delivery Reviews 2004, 56, 1023-1050.
[51] W. Chen, F. Meng, F. Li, S.-J. Ji, Z. Zhong, Biomacromolecules 2009, 10, 1727-1735.
[52] E. R. Gillies, T. B. Jonsson, J. M. J. Fréchet, Journal of the American Chemical Society
2004, 126, 11936-11943.
[53] H. S. Yoo, E. A. Lee, T. G. Park, Journal of Controlled Release 2002, 82, 17-27.
[54] Y. Bae, S. Fukushima, A. Harada, K. Kataoka, Angewandte Chemie International Edition
2003, 42, 4640-4643.
[55] F. Meng, W. E. Hennink, Z. Zhong, Biomaterials 2009, 30, 2180-2198.
[56] F. Q. Schafer, G. R. Buettner, Free Radical Biology and Medicine 2001, 30, 1191-1212.
[57] G. Saito, J. A. Swanson, K.-D. Lee, Advanced Drug Delivery Reviews 2003, 55, 199-215.
[58] A. Russo, W. DeGraff, N. Friedman, J. B. Mitchell, Cancer Research 1986, 46, 2845-
2848.
[59] H. Sun, B. Guo, R. Cheng, F. Meng, H. Liu, Z. Zhong, Biomaterials 2009, 30, 6358-
6366.
[60] H. G. Sun, B.; Li, X.; Cheng, R.; Meng, F.; Liu, H.; Zhong, Z., Biomacromolecules 2010,
11, 848-854.
[61] L.-Y. Tang, Y.-C. Wang, Y. Li, J.-Z. Du, J. Wang, Bioconjugate Chemistry 2009, 20,
1095-1099.
[62] J. Liu, Y. Pang, W. Huang, Z. Zhu, X. Zhu, Y. Zhou, D. Yan, Biomacromolecules 2011,
12, 2407-2415.

103
[63] A. Nelson-Mendez, S. Aleksanian, M. Oh, H.-S. Lim, J. K. Oh, Soft Matter 2011, 7,
7441-7452.
[64] Q. Zhang, S. Aleksanian, S. M. Noh, J. K. Oh, Polymer Chemistry 2013, 4, 351-359.
[65] M. Szwarc, M. Levy, R. Milkovich, Journal of the American Chemical Society 1956, 78,
2656-2657.
[66] M. Szwarc, Nature 1956, 178, 1168-1169.
[67] C. J. Hawker, A. W. Bosman, E. Harth, Chemical Reviews 2001, 101, 3661-3688.
[68] J.-S. Wang, K. Matyjaszewski, Journal of the American Chemical Society 1995, 117,
5614-5615.
[69] A. B. Lowe, C. L. McCormick, Progress in Polymer Science 2007, 32, 283-351.
[70] M. Kato, M. Kamigaito, M. Sawamoto, T. Higashimura, Macromolecules 1995, 28,
1721-1723.
[71] W. Jakubowski, K. Matyjaszewski, Macromolecules 2005, 38, 4139-4146.
[72] I. F. Uchegbu, in Polymers in Drug Delivery, CRC Press, 2006.
[73] N. Rapoport, Progress in Polymer Science 2007, 32, 962-990.
[74] P. Goon, C. Manohar, V. V. Kumar, Journal of Colloid and Interface Science 1987, 119,
177-180.
[75] I. Astafieva, X. F. Zhong, A. Eisenberg, Macromolecules 1993, 26, 7339-7352.
[76] J. Jiang, X. Tong, D. Morris, Y. Zhao, Macromolecules 2006, 39, 4633-4640.
[77] M. Stoddart, in Mammalian Cell Viability, Vol. 740 (Ed.: M. J. Stoddart), Humana Press,
2011, pp. 1-6.
[78] S. A. Altman, L. Randers, G. Rao, Biotechnology Progress 1993, 9, 671-674.
[79] R. Supino, in In Vitro Toxicity Testing Protocols, Vol. 43 (Eds.: S. O’Hare, C. Atterwill),
Humana Press, 1995, pp. 137-149.
[80] T. Mosmann, Journal of Immunological Methods 1983, 65, 55-63.
[81] J. Carmichael, W. G. DeGraff, A. F. Gazdar, J. D. Minna, J. B. Mitchell, Cancer
Research 1987, 47, 936-942.
[82] J. A. Plumb, R. Milroy, S. B. Kaye, Cancer Research 1989, 49, 4435-4440.
[83] N. G. Papadopoulos, G. V. Z. Dedoussis, G. Spanakos, A. D. Gritzapis, C. N. Baxevanis,
M. Papamichail, Journal of Immunological Methods 1994, 177, 101-111.
[84] P. Decherchi, P. Cochard, P. Gauthier, Journal of Neuroscience Methods 1997, 71, 205-
213.
[85] K. Engin, D. B. Leeper, J. R. Cater, A. J. Thistlethwaite, L. Tupchong, J. D. McFarlane,
International Journal of Hyperthermia 1995, 11, 211-216.
[86] T. J. Martin, K. Procházka, P. Munk, S. E. Webber, Macromolecules 1996, 29, 6071-
6073.
[87] S.-i. Yusa, Y. Shimada, Y. Mitsukami, T. Yamamoto, Y. Morishima, Macromolecules
2003, 36, 4208-4215.
[88] X. Huang, F. Du, J. Cheng, Y. Dong, D. Liang, S. Ji, S.-S. Lin, Z. Li, Macromolecules
2009, 42, 783-790.
[89] X. Huang, F. Du, R. Ju, Z. Li, Macromolecular Rapid Communications 2007, 28, 597-
603.
[90] L. Brannon-Peppas, Journal of Controlled Release 2000, 66, 321.
[91] B. Khorsand, J. K. Oh, Journal of Polymer Science Part A: Polymer Chemistry 2013, 51,
1620-1629.
[92] T. Sarbu, K.-Y. Lin, J. Spanswick, R. R. Gil, D. J. Siegwart, K. Matyjaszewski,
Macromolecules 2004, 37, 9694-9700.
[93] A. Lavasanifar, J. Samuel, G. S. Kwon, Journal of Controlled Release 2001, 77, 155-160.
[94] V. T. Huynh, P. de Souza, M. H. Stenzel, Macromolecules 2011, 44, 7888-7900.
[95] A. Rösler, G. W. M. Vandermeulen, H.-A. Klok, Advanced Drug Delivery Reviews 2001,
53, 95-108.
104
[96] R. Sinha, G. J. Kim, S. Nie, D. M. Shin, Molecular Cancer Therapeutics 2006, 5, 1909-
1917.
[97] J. K. Oh, D. J. Siegwart, H.-i. Lee, G. Sherwood, L. Peteanu, J. O. Hollinger, K. Kataoka,
K. Matyjaszewski, Journal of the American Chemical Society 2007, 129, 5939-5945.
[98] K. Qi, Q. Ma, E. E. Remsen, C. G. Clark, K. L. Wooley, Journal of the American
Chemical Society 2004, 126, 6599-6607.
[99] aD. Han, X. Tong, Y. Zhao, Langmuir 2012, 28, 2327-2331; bY. Kim, M. H.
Pourgholami, D. L. Morris, M. H. Stenzel, Journal of Materials Chemistry 2011, 21,
12777-12783.
[100] D. Han, X. Tong, Y. Zhao, Macromolecules 2011, 44, 437-439.
[101] aB. Khorsand Sourkohi, A. Cunningham, Q. Zhang, J. K. Oh, Biomacromolecules 2011,
12, 3819-3825; bT.-B. Ren, Y. Feng, Z.-H. Zhang, L. Li, Y.-Y. Li, Soft Matter 2011, 7,
2329-2331; cT.-B. Ren, W.-J. Xia, H.-Q. Dong, Y.-Y. Li, Polymer 2011, 52, 3580-3586.
[102] B. Khorsand Sourkohi, R. Schmidt, J. K. Oh, Macromolecular Rapid Communications
2011, 32, 1652-1657.
[103] L. Sun, W. Liu, C.-M. Dong, Chemical Communications 2011, 47, 11282-11284.
[104] D.-L. Liu, X. Chang, C.-M. Dong, Chemical Communications 2013, 49, 1229-1231.
[105] N. V. Tsarevsky, K. Matyjaszewski, Macromolecules 2005, 38, 3087-3092.
[106] D. A. Shipp, J.-L. Wang, K. Matyjaszewski, Macromolecules 1998, 31, 8005-8008.
[107] L. Yuan, J. Liu, J. Wen, H. Zhao, Langmuir 2012, 28, 11232-11240.
[108] Y.-L. Li, L. Zhu, Z. Liu, R. Cheng, F. Meng, J.-H. Cui, S.-J. Ji, Z. Zhong, Angewandte
Chemie International Edition 2009, 48, 9914-9918.
[109] Y. Xu, F. Meng, R. Cheng, Z. Zhong, Macromolecular Bioscience 2009, 9, 1254-1261.
[110] Z. Jia, L. Wong, T. P. Davis, V. Bulmus, Biomacromolecules 2008, 9, 3106-3113.
[111] L. Yan, W. Wu, W. Zhao, R. Qi, D. Cui, Z. Xie, Y. Huang, T. Tong, X. Jing, Polymer
Chemistry 2012, 3, 2403-2412.
[112] R. Wei, L. Cheng, M. Zheng, R. Cheng, F. Meng, C. Deng, Z. Zhong,
Biomacromolecules 2012, 13, 2429-2438.
[113] Z. Zhang, L. Yin, C. Tu, Z. Song, Y. Zhang, Y. Xu, R. Tong, Q. Zhou, J. Ren, J. Cheng,
ACS Macro Letters 2012, 2, 40-44.
[114] R. L. Momparler, M. Karon, S. E. Siegel, F. Avila, Cancer Research 1976, 36, 2891-
2895.
[115] S. Oliveira, R. M. Schiffelers, J. van der Veeken, R. van der Meel, R. Vongpromek, P. M.
P. van Bergen en Henegouwen, G. Storm, R. C. Roovers, Journal of Controlled Release
2010, 145, 165-175.
[116] X. Dai, Z. Yue, M. E. Eccleston, J. Swartling, N. K. H. Slater, C. F. Kaminski,
Nanomedicine: Nanotechnology, Biology and Medicine 2008, 4, 49-56.
105
List of publications
N. Chan, B. Khorsand, S. Aleksanian, J. K. Oh* "Dual location stimuli-responsive
degradation strategy of block copolymer nanocarriers for accelerated release",
Chemical Communications, 2013, 49, 7534-7536.
B. Khorsand, G. Lapointe, C. Brett, J. K. Oh* "Intracellular drug delivery
nanocarriers of glutathione-responsive degradable block copolymers having pendant
disulfide linkages", Biomacromolecules, 2013, 14, 2103-2111.
B. Khorsand, J. K. Oh* "pH-responsive destabilization and facile bioconjugation of
new hydroxyl-terminated block copolymer micelles", Journal of Polymer Science
Part A: Polymer Chemistry, 2013, 51, 1620-1629. (Selected as spotlight article of
the issue)
S. Aleksanian, B. Khorsand, R. Schmidt, J. K. Oh* "Rapidly thiol-responsive
degradable block copolymer nanocarriers with facile bioconjugation", Polymer
Chemistry, 2012, 3, 2138-2147.
B. Khorsand, A. Cunningham, Q. Zhang, J. K. Oh* "Biodegradable block copolymer
micelles with thiol-responsive sheddable coronas", Biomacromolecules, 2011, 12,
3819–3825. (One of the top 5 most-read articles in Biomacromolecules in 2011)
B. Khorsand, R. Schmidt, J. K. Oh* "New thiol-responsive mono-cleavable block
copolymer micelles labeled with single disulfides", Macromolecular Rapid
Communications, 2011, 32, 1652–1657.