diffusion theory for adsorption and desorption of...
TRANSCRIPT

THE JOURNAL OF CHEMICAL PHYSICS VOLUME 58, NUMBER 3 1 FEBRUARY 1973
Diffusion theory for adsorption and desorption of gas atoms at surfaces*
Patrick J. Pagnit and James C. Keck Massachusetts Institute of Technology, Cambridge, Massachusetts
(Received 30 June 1972)
The time evolution of a non equilibrium ensemble of gas atoms adsorbed on a solid surface is described. Adsorption and desorption rate constants and adatom (adsorbed atom) energy distributions are obtained in the steady state approximation from the appropriate master equation or an equivalent diffusion equation. Energy transition probabilities are obtained from a classical gas-surface collision model using an interaction potential composed of an oscillating harmonic repUlsion and a stationary attraction. Calculations have been performed over the following range of similarity parameters: inertia ratio 10-2<)l= mg / m, <2, frequency ratio 1 < v = w, / W g < 10, and well depth 2 < a = D / kT < 100. For "resonance" values of the frequency ratio, gas-surface collisions are sufficiently adiabatic that adatom energy distributions are significantly nonequilibrium, and steady state rate constants are depressed below the equilibrium rate constants. Applications include prediction of adsorption and desorption rate constants, sticking and accommodation coefficients, sublimation and condensation rates, and boundary conditions for the Knudsen layer.
1. INTRODUCTION
This investigation concerns the evolution of a system of gas atoms adsorbed on a solid surface when that system is thrown out of equilibrium. A fundamental physical understanding of the nonequilibrium phenomena at such a surface is needed to delineate important similarity parameters and provide guidelines for definitive experiments in surface studies. Consider, as an initial problem statement, an ensemble of gas atoms in equilibrium with a solid surface at temperature T enclosed in a sealed container. The enclosure is instantaneously evacuated at 1= O. The problem is to determine the time history of the surface concentration and the adatom (adsorbed atom) energy distribution. Experiments show that over a wide range of conditions the desorption process proceeds according to a firstorder rate equation:
dA (I) /dl= kaF(/) -kdA (I), (1)
where A is the surface concentration (cm-2), F is the gas concentration (cm-3), and ka and kd are the adsorption and desorption rate constants. A satisfactory quantitative understanding of temperature and atomic species dependence of the rate constants ka and kd is sought. This analysis is the first attempt the authors are aware of to describe the functional dependence of ka and kd using non equilibrium kinetics. An equilibrium approach,! which assumes a Boltzmann distribution for the ada tom energy distribution and that all atoms which strike the surface adsorb, gives the classical desorption rate constant
kdc= (wg/27r) exp( -D/kT) , (2)
Trilling22 and Kogan.23 Of particular interest in connection with the present investigation is the work of Armand2-9 who has made careful studies of the effect of lattice interactions on the desorption process and Logan and Keck18 who have developed a relatively simple "soft cube" model for scattering of gas atoms by surfaces. Also of interest is the analogous gas-phase problem of molecular dissociation and recombination,24-31 and a review of this literature has been published by Bunker.32 The theory developed in this paper is based on this analogy and parallels the work of Keck Carrier27 and Keck.23
Applications of the theory include prediction and correlation of adsorption and desorption lifetimes, accommodation and sticking coefficients, sublimation and condensation rates, and scattering patterns. In addition, potential parameters for gas-surface interactions may be deduced from a comparison of the theoretical results with experimental data33- 39 obtained using modulated beam and flash desorption techniques.
A general discussion of the theoretical model and the governing master equation used to obtain rate constants is given in the following section. The mechanism of the gas-surface collisions and the dimensionless parameters characterizing the problem are discussed in Sec. III. The transition kernel appearing in the master equation and the steady state adsorption and desorption rate constants are derived in Sec. IV. Finally, a brief summary and conclusions are given in the last section.
II. MATHEMATICAL MODEL
A. Qualitative Discussion where Wg is a characteristic frequency, D is the potential energy well depth, and T is the surface temperature. Consider first a single gas atom approaching the The statistical description given here approaches this solid surface from the free state with a nondimensional equilibrium expression as a limiting case. energy E= E/kT as shown in Fig. 1, where r is the atom
Many previous investigations of the interactions of displacement from the surface. Far from the surface, gas atoms at surfaces have been reported,2-21 and ex- the free atom feels an attractive van der Waals force cellent reviews of this work may be found in articles by represented as a potential with a positive gradient in-
1162
Downloaded 07 Dec 2011 to 129.10.124.131. Redistribution subject to AIP license or copyright; see http://jcp.aip.org/about/rights_and_permissions
ADSORPTION AND DESORPTION OF GAS ATOMS 1163
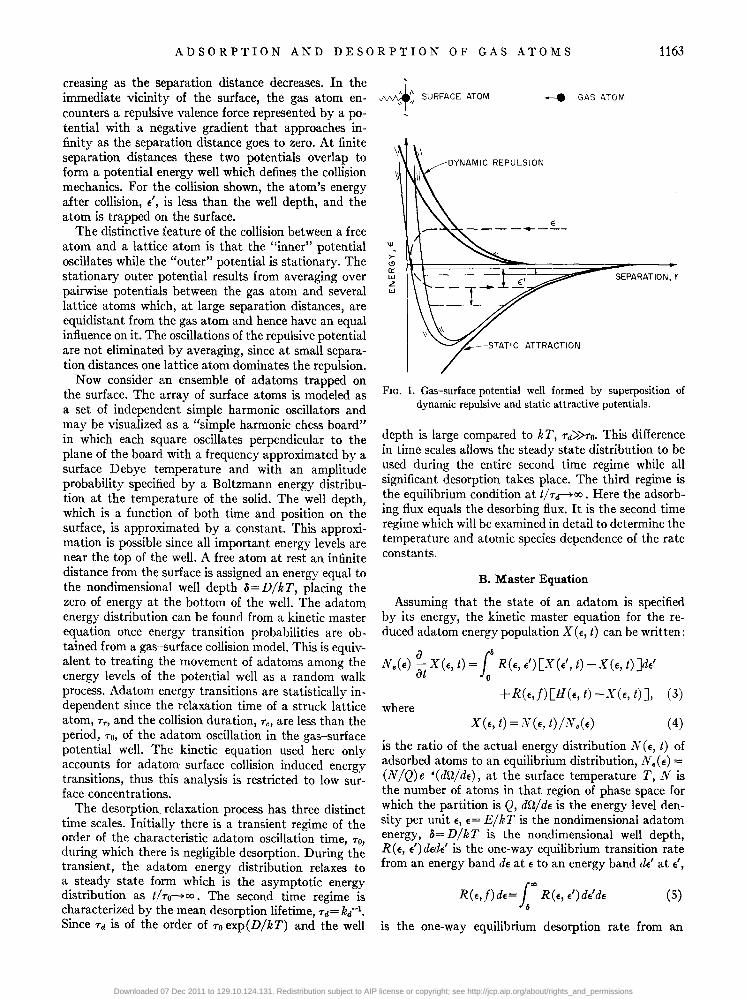
creasing as the separation distance decreases. In the immediate vicinity of the surface, the gas atom encounters a repulsive valence force represented by a potential with a negative gradient that approaches infinity as the separation distance goes to zero. At finite separation distances these two potentials overlap to form a potential energy well which defines the collision mechanics. For the collision shown, the atom's energy after collision, e', is less than the well depth, and the atom is trapped on the surface.
The distinctive feature of the collision between a free atom and a lattice atom is that the "inner" potential oscillates while the "outer" potential is stationary. The stationary outer potential results from averaging over pairwise potentials between the gas atom and several lattice atoms which, at large separation distances, are equidistant from the gas atom and hence have an equal influence on it. The oscillations of the repulsive potential are not eliminated by averaging, since at small separation distances one lattice atom dominates the repulsion.
Now consider an ensemble of adatoms trapped on the surface. The array of surface atoms is modeled as a set of independent simple harmonic oscillators and may be visualized as a "simple harmonic chess board" in which each square oscillates perpendicular to the plane of the board with a frequency approximated by a surface Debye temperature and with an amplitude probability specified by a Boltzmann energy distribution at the temperature of the solid. The well depth, which is a function of both time and position on the surface, is approximated by a constant. This approximation is possible since all important energy levels are near the top of the well. A free atom at rest an infinite distance from the surface is assigned an energy equal to the nondimensional well depth fJ= D/kT, placing the zero of energy at the bottom of the well. The ada tom energy distribution can be found from a kinetic master equation once energy transition probabilities are obtained from a gas--surface collision model. This is equivalent to treating the movement of adatoms among the energy levels of the potential well as a random walk process. Adatom energy transitions are statistically independent since the relaxation time of a struck lattice atom, T r, and the collision duration, T e, are less than the period, TO, of the ada tom oscillation in the gas-surface potential well. The kinetic equation used here only accounts for ada tom-surface collision induced energy transitions, thus this analysis is restricted to low surface concentrations.
The desorption. relaxation process has three distinct time scales. Initially there is a transient regime of the order of the characteristic ada tom oscillation time TO during which there is negligible desorption. During' th~ transient, the ada tom energy distribution relaxes to a steady state form which is the asymptotic energy distribution as t/TO~OO. The second time regime is characterized by the mean desorption lifetime Td= krl. Since Td is of the order of TO exp(D/kT) and the well
-~:: SURFACE ATOM ____ GAS ATOM
DYNAMIC REPULSION
E ----.... ---
. ><!l a:: w Z w
~====~~~~::-----I h. I SEPARATION, r
FIG. 1. Gas-surface potential well formed by superposition of dynamic repulsive and static attractive potentials.
depth is large compared to kT, Td»TO. This difference in time scales allows the steady state distribution to be used during the entire second time regime while all significant desorption takes place. The third regime is the equilibrium condition at t/T~OO. Here the adsorbing flux equals the desorbing flux. It is the second time regime which will be examined in detail to determine the temperature and atomic species dependence of the rate constants.
B. Master Equation
Assuming that the state of an adatom is specified by its energy, the kinetic master equation for the reduced ada tom energy population X (E, t) can be written:
N.(E) ~ X(E, t) = /8 R(E, e') [X(e', t) -X(E, t)]dE' at 0
+R(E,f)[H(E, t)-X(e, t)], (3) where
X(e, t) =~V(E, t)/N.(E) (4)
is the ratio of the actual energy distribution N (E, t) of adsorbed atoms to an equilibrium distribution, N.(E) = (N /Q)e--(dfJ/dE), at the surface temperature T, N is the number of atoms in that region of phase space for which the partition is Q, dfJ/ dE is the energy level density per unit E, E= E/kT is the nondimensional adatom energy, 8= D/kT is the nondimensional well depth, R(E, E')dEde' is the one-way equilibrium transition rate from an energy band dE at E to an energy band dE' at E',
R(E,f)de= 1a~ R(E, E')dE'de (5)
is the one-way equilibrium desorption rate from an
Downloaded 07 Dec 2011 to 129.10.124.131. Redistribution subject to AIP license or copyright; see http://jcp.aip.org/about/rights_and_permissions

1164 P. J. PAGNI AND J. C. KECK
energy band de at e to the free state, and H(e, t) is the ratio of the actual one-way adsorption rate to the equilibrium one-way adsorption rate, R(f, e). Note that by detailed balancing, we have
R(e,e')=R(e',e) and R(j,e)=R(e,f). (6)
X(e, t) is a useful measure of non equilibrium since it is unity at equilibrium. X(e, t»1 indicates over population of the energy level e, and X (e, t) < 1 indicates depletion of the level e. The master equation simply states that the adatoms leave the energy level e either by making transitions to the level e' at a rate R(e, e') X (e, t) or by desorbing to the free state at a rate R (e,j) X(e, t) and enter the energy level e either by making transitions from the level e' at a rate R(e', e) X(e', t) or by adsorbing from the free state at a rate R(f, e) H(e, t).
The form of Eq. (3) results from the following assumptions:
(1) The adatom concentration is sufficiently small that collisions between adatoms may be neglected. If an equivalent Knudsen number Kn, is defined as the ratio of the adatom-surface collision rate to the adatomadatH)m collision rate, this assumption is valid when Kn»1. The adatom-surface collision rate is the inverse period of oscillation in the well ,....,1013 secl. The adatom-adatom collision rate is ucA where A is the surface concentration, u the collision diameter ,....,10-8
cm, and the mean speed c= (7rkT/2mg )l12,....,105 cm sec.-l The effective Knudsen number is then Kn= To-l(ucA) = lOl6A-l and assumption 1 is valid if A«1016 cm-2•
(2) A classical approach is valid. Keck and Carrier27
have shown that quantum models fail when the average energy transfer per collision is greater than the energy level spacing at the rate-limiting step in the well. For the transition rate derived here, the "bottleneck" is at the top of the well where the energy level density is high, and the quantum number is large. For very shallow well depths, 5'"'-'1, this approximation is not valid.
(3) The nonequilibrium transition probability is equal to the equilibrium transition probability. This assumption is always valid since the collision mechanics are determined by the temperature of the solid and the atomic parameters of the gas and solid and are independent of the energy distribution of the adsorbed ensemble.
c. Steady State Solutions
To solve Eq. (3) we now introduce the steady state approximation by setting the time derivative on the right-hand side equal to zero. This gives
{ R(e, e')[X(e', t)-X(e, t)Jde' o
+R(e,j) [H(e, t)-X(e, t)J=O. (7)
The form of Eq. (7) indicates that energy and time variables will separate if it is assumed that a steady state reduced population, X (e), exists such that
X (e)f(t) = X(e, t) - H (e, t), (8)
where f(t) gives the time dependence of the adsorbed population. If the energy distribution in the free gas is steady, H(e, t) may also be separated as H(e) F(t) IF., where F(t) is the time-dependent free gas concentration, and H (e) is the ratio of the adsorption rate at an energy level e from the actual incident distribution to the rate from an equilibrium distribution. In terms of the equilibrium transition rate R (e', e) and a timeindependent incident atom energy distribution Xg(e') =
F.Ng(e', t)IF(t)Ne(e').
H(e) = {'" R(e', ehg(l)de'l R(j, e). (9)
H(e) is unity when the incident energy distribution is Boltzmann about the temperature of the solid so that Xg(e') = 1.
An integral equation for X (e) is obtained by substituting Eq. (8) into Eq. (7) and assuming aHlae« (t)dx/de. This gives
[ R(e, e') [X (e') -x(e) Jde'+ R(e,fh(e) = O. (10) o
The condition aHlae<<j(t)dxlde is generally satisfied since near the top of the well the gradient of x(e) is large due to depletion of the upper energy levels by desorbing adatoms, and H(e) does not have a large gradient at any energy. The steady state population, x(e), is obtained from a iteration solution to Eq. (10) or by conversion of Eq. (10) to an equivalent diffusion equation.27
The surface concentration is given by
A (t) = { X(e, t)Ne(e) de, o
(11)
where X(e, t) is obtained in the steady state approximation by assuming X(e, t) is separable, and setting x(O) = 1 in Eq. (8). This gives
X(e, t) = X(O, t)x(e) +[H(e) -H(Oh(e) JF(t) IF •.
(12)
Since N.(e) is a rapidly decreasing function of e, substituting Eq. (12) into Eq. (11) with H(e) slowly varying and x(e)~1 near e=O gives
A(t)~X(O, t) { N.(e)de=X(O, t)A.. (13) o
The rate constants are obtained as functions of transition rates, R( f, e), and the steady state reduced population, x(e), from the energy integral of the master equation. Integrating the original master equation (3) over energy using Eqs. (9) and (13) yields the phe-
Downloaded 07 Dec 2011 to 129.10.124.131. Redistribution subject to AIP license or copyright; see http://jcp.aip.org/about/rights_and_permissions

ADSORPTION AND DESORPTION OF GAS ATOMS 1165
nomenological equation
dA (t) I dt= kaF (t) - kdA (t),
where the rate constants have the form
ka=j3 R(j, E)x(E) dE
o F. and
kd=j3 R(j, E)x(e) dE
o A.
(14)
(1S)
(16)
if H(E) is unity. These are the steady state rate constants. The equilibrium rate constants are given by setting X(E) = 1 in Eqs. (15) and (16). It is seen from these equations that the ratio of the forward to backward rates in both the steady state and equilibrium case is equal to the equilibrium constant:
Ke= Fel Ae=kdelkae=kdlka (17)
where Ke is the equilibrium constant, kde is the equilibrium desorption rate constant, and kae is the equilibrium adsorption rate constant. When H(E) is not unity, i.e., an incident gas stream exists which does not have a Boltzmann distribution about the temperature of the solid, the ratio of the forward to backward rate constants is equal to the ratio of the equilibrium constant to H(O),
(18)
The factor H(O) takes into account the dependence of the adsorption rate constant on the energy distribution of the incident atoms. In this case, the energy integral of the original master equation with Eqs. (12), (13), and (14) gives the adsorption rate constant as
18 H(O) ka= R(J, E)x(E)dE'--.
o Fe (19)
Since the desorption rate constant is unaffected by the incident atom energy distribution, it remains unchanged and is given by Eq. (16).
III. COLLISION MECHANICS
A. Equations of Motion
The mechanics of a single collision between a gas atom and a surface atom must be described in detail to obtain the energy transition probability, R(Ef, E). The colIision model used is similar to the soft cube model of Logan and Keck,18 with an oscillating half harmonic repulsion replacing the oscillating exponential repulsion since lower incident energies are of interest. It is assumed that:
(1) Tangential momentum is conserved, i.e., the solid surface is flat. This is not true since the crystal structure produces a rough surface on the atomic scale. However, the roughness seen by an incident atom is energy dependent,t6 and at incident energies < Ii the
-e mg
o r = y - z
FIG. 2. Collision model. Attractive potential is an arbitrary shape of height a at fixed position several lattice spacings from the surface. Repulsive quadratic potential follows the surface oscillator motion.
adatom, remaining relatively far outside the crystal structure, would see an approximately flat surface. Experimental data on out-of-plane scattering and the success of the softl8 and hardl7 cube models in predicting scattering patterns40 support this assumption.
(2) The surface atoms are independent simple harmonic oscillators with a single characteristic frequency obtained by approximating the lattice frequency spectrum with a delta function at the Debye frequency. Decoupling the surface array into independent oscillators has been shown to have small effect on the energy exchange process.18 .19 It is also assumed that only a single surface atom is involved in any given collision. It has been shown that most of the load for most of the collisions is taken by a single surface atom.IS When the adatom velocity parallel to the surface is so large that the distance traveled during a collision is greater than the lattice space, this one-on-one approximation fails.
(3) The gas-surface potential consists of a stationary arbitrarily shaped attraction and an oscillating quadratic repulsion. The motivation for this assumption is discussed in the introduction. The interaction is described classically and would not strictly apply to incident atoms whose DeBroglie wavelength is of the order of the lattice spacing or to solid temperatures below the surface Debye temperature.
The model interaction potential is illustrated in Fig. 2. The inner half (r<O) is an harmonic repulsion while the outer half (r>O) is a static barrier of height, Ii. yet) and Z (t) are the gas and surface atom displacements from their respective equilibrium positions which are separated by the equilibrium extension of the gassurface "spring." ks and kg are the lattice and gassurface spring constants, ms and mg are the surface and gas atom masses, and ;; is the desorption energy divided by kT. The time origin marks the initiation of a collision. For t<O, the gas atom is force free, and the surface oscillator is in simple harmonic motion. Thus,
and Z(t) = (V /ws) sin(w8 t+q,)
yet) = -ut+ (V /ws ) sinq" (20)
Downloaded 07 Dec 2011 to 129.10.124.131. Redistribution subject to AIP license or copyright; see http://jcp.aip.org/about/rights_and_permissions

1166 P. J. PAGNI AND J. C. KECK
where u is the incident gas atom velocity in the well, Ws is the angular frequency of the surface atom, and V and q, are the velocity amplitude and phase of the surface atom. The initial conditions are established as the gas atom impacts at the end of the gas-surface spring. At 1=0,
YeO) =Z(O) = (V/w.) sinq"
YeO) = -u; teO) = V cosq,. (21)
The equations of motion during collision (1)0) are
mg yet) = -kg[Y(t) -Z(t)],
m.Z(t) = -k.Z(t) +kg[Y(t) -Z(t)]. (22)
The collision ends when the gas-surface spring returns to its equilibrium extension with the gas atom moving away from the surface. For t= Te,
(23)
with Y (Te) positive and greater than t (Te). The collision duration, T e, is the smallest nonzero root of Eq. (23). The nondimensional energy transfer Me) is defined as the increase in the gas atom kinetic energy during the collision, divided by kT:
From comparison with experiment, the parametric ranges of interest are: 10-2 < J.t < 2, 1<1'<10, and 2 < 0< 102. In the adiabatic limit, V-HJO, the energy transfer goes to zero since the collision duration is large, and the incident particle turns around slowly losing no energy. In the impulsive or hard cube limit ~, and the collision duration goes to zero. Here the adiabacity factor which is proportional to exp( -w.Te)~1, and the energy transfer is a maximum.
C. Normal Mode Solutions
General solutions to the equations of motion during collision, Eq. (25), may be written as a linear superposition of normal modes:
yet) = L: ajqj(t) and z(t) = L: (Jjq;(t) , (28)
where j= 1, 2 indexes the two normal modes, qj, of the system. The following algebraic equations defining the normal mode frequencies are obtained by substitution of possible solutions, y=a exp(iwt) and Z= (J exp(iwt) , into Eq. (25):
(l-v2w2)a-{J= 0,
J.ta- (v2+J.t-v2w2){J=0. (29)
d(e) =e'-e= (mg/2kT) [Y(Te)L Y(O) 2]. (24) The resulting normal mode frequencies, WI and W2, nondimensional with respect to w., are
B. Similarity Parameters
Defining w.-1 as a characteristic time and uw.-l as a characteristic length, the nondimensional equations of motion corresponding to Equations (22) are
v2jj+ (y-z) =0,
v2(z+z) -,u (y-z) =0, (25)
where J.l.= mg/m. is the inertia parameter, v=ws/Wg is the frequency parameter, z=Z/uw.-1 is the nondimensional surface atom displacement, y= Y /uw.-l is the nondimensional gas atom displacement, and time is nondimensionalized with respect to ws-I. The nondimensional initial conditions are
yeO) =z(O) = V.,
yeO) = -1, and z(O) = Ve, (26) where
Ve= V cosq,/u and Vs= V sinq,/u (27)
are respectively the nondimensional velocity and displacement of the surface atom at impact. One set of initial conditions applies to all incident energies since the initial gas atom velocity no longer appears explicitly in Eqs. (25) and (26). Although the surface oscillator frequency is assumed to be given by the bulk Debye temperature, w.= keD/ii, any surface oscillator frequency may be used to obtain Wg from the dimensionless ratio v=w./wg. The original nine variables V, q" W s, W g , m., mg , D, T, and u are thus reduced to three parameters v, J.t, 0, and two initial conditions Ve and V •.
W1.2= {(v2+J.t+l)±[(v2+J.t+l)2-4v2]1/2j1/2/4v. (30)
The amplitude coefficients in Eq. (28) are related by {Jj= (1-w2v2)ai. Applying the initial conditions given by Eqs. (26) to Eqs. (25) yields the gas atom trajectory
and the surface atom trajectory
(l-WI2v2) tV. (1-WI2v2) (1+ Ve-Wz2v2) z(t) = - coswlt- (1) 3 .. 2
1-t -t WI v-
. (1-w22v2)V. X Slllw1t+ 1-t
(1-W22v2) (1 + Ve- WI2v2) . X cosw2t+ (1) 2 2 SlllW2t, -r WI W21'
(32)
where t=W22/W12. The nondimensional collision duration Te is the smallest nonzero root of y(Te) =Z(Te). Using Eqs. (31) and (32), the implicit expression for Te is
cos (WITe+cf>r) = - (I a21/1 al I)t cos (W2Te+¢Z) , (33)
where a and q, are the amplitudes and phases of the normal modes. In terms of the initial conditions and
Downloaded 07 Dec 2011 to 129.10.124.131. Redistribution subject to AIP license or copyright; see http://jcp.aip.org/about/rights_and_permissions

ADSORPTION AND DESORPTION OF GAS ATOMS 1167
similarity parameters, these are
\ 0!1\2 = [V.2~j4(1-W2J +[ (1 + Vc- v2W22) 2 j 4(1- r) 2wb,4J,
\ 0!2\2 = [V.2j4(1-r)2J
+[(1+ Vc-vwI2)2j4(1-r)2wI4wb4J (34) and
<Pl= tan-I[ - (1+ Vc-VW22)jV.W22wlv2J,
</J2= tan-I[ - (1+ Ve-VW12)jV.W12w2V]. (35)
Once the collision duration is known, the energy transfer in a collision is obtained directly from
..:l= E[Y( Tc)L 1J, where E=mgu2j2kT.
D. Collision Duration and Energy Transfer
(36)
Contours of constant collision duration and energy transfer in initial condition space are given in Figs. 3(a) and 3(b). The time contours in Fig. 3(a) are given for relatively impulsive parameters, Il= v= 1, while the energy contours in Figure 3(b) are for v= 3.16 and Il= 0.5. There is a "plateau" in the V., V. plane, separated from the remainder of the space by a discontinuity along the heavy dashed lines in Figs. 3(a) and 3(b) given implicitly by y( Te) = z( Te) and y( Te) = i( Te). This discontinuity follows from the definition of Te as the smallest nonzero root of a periodic function. The effect of higher v is to increase the size of the plateau and the range of initial conditions for which adiabatic collisions with longer duration occur. The approximately radial, straight-line behavior of contours of constant collision time in Fig. 3 (a) follows from the definitions of V. and Ve. Radial lines in VB' Ve space are roughly lines of constant phase angle, <p. Figure 3a illustrates that the duration of the collision is largely dependent on the phase angle of the surface atoms at impact. Since the initial conditions establish the nature of the collision, regions in Ve, V. space may be assigned a particular type of collision. For Ve< -1, region III in Figs. 3(a) and 3 (b), no collisions are possible since the surface atom is moving away from the gas atom at t=O. On the plateau and for most of the space off the plateau, region I in Figs. 3 (a) and 3 (b), the gas atom strikes the surface, returns to the well, and rebounds off the attractive step before another collision begins. The dashed circle in Fig. 3b indicates the region of interest in collision initial condition space for calculation of steady state adatom energy distributions as determined by the equilibrium transition rate described in the next section. It shows that only collisions in region I affect the steady state reduced populations and rate constants.
In region II on Figures 3 (a) and 3 (b), the gas atom strikes the surface, begins and ends a collision, but strikes the surface again before returning to the well
I<t I-2 W ::<
0) ~ 0 -<t -.J 0.. (J)
Ci _I ::<
~ w -2 u Li: rr: iii -3 -
(f) 3 > ..... u <t 2 0..
~ I-<t I-Z W ::< w
b)~ 0 -.J 0.. (J)
0 -I
::< 0 I-<t w -2 u <t li-rr: ::::J (J) -3
-I o 2 3
REGION II
2
o
"c: 2.0 -I
REGION I
-2
-3
-I
SURFACE ATOM VELOCITY AT IMPACT, Vc
-I 0 2 3
3
REGION II 2
0
-I
6ft::: : O. -3
-I 0 3 SURFACE ATOM VELOCITY AT IMPACT, Vc
FIG. 3. Contours in initial condition space: (a) Contours of constant collision times for V=J.I= 1; (b) Contours of constant energy transfer for v=3.16 and /L=O.S. Region I has single collisions, and Region II has second collisions. In Region III no collisions occur. Heavy dash indicates plateau bounded by a discontinuity in T and ~.
and rebounding off the attractive step. To assess whether these "double" collisions occur, the final conditions of the normal mode solution are used to define the initial conditions of new trajectories for the time t> Te. The gas atom is in free flight, and the surface atom motion is approximated by simple harmonic oscillation subject to initial conditions given by z( Te) and i( Te). Let T= t-Te. Then the gas atom and surface
Downloaded 07 Dec 2011 to 129.10.124.131. Redistribution subject to AIP license or copyright; see http://jcp.aip.org/about/rights_and_permissions

1168 P. J. PAGNI AND J. C. KECK
1.2
::J..!.o 0:: W I-w .8 ~ « 0:: « 0..
« .6 I-0:: W z
.4
REGIONll
FIG. 4. Second collisions are not signi. ficant at the incident gas atom energies indicated when the system frequency and inertia parameters lie in region I on this figure.
REGION I
.2
.0 0 2
FREQUENCY PARAMETER, 1/
atom equations of motion are
yeT) =Y(Tc)+Y(Tc)T,
Z(T) =Z(Te ) COST+i(Te ) sinT. (37)
If Z(T)"=Y(T) for any T>O, a double collision occurs. Region II in Fig. 4 defines the values of J.L and v for which double collisions occur. It is clear that double collisions are not important for most values of the similarity parameters except at very low energies. This energy dependence derives from the (J.L/f) 1/2 radius of the region of interest in Vs, Vc space defined by the 1/ e point of the equilibrium transition rate R (l, f). Double collisions may be important for cases where J.L= 1, v~1, and ~ is small, e.g., the sublimation and condensation of rare gases on rare gases.41
Figure 5 shows sample gas and surface atom trajectories illustrating the various types of collisions. N ondimensional displacements are given on the left with corresponding velocities on the right. The abscissa is nondimensional with respect to ws-l. Figure Sea) with v= 3.16 and J.L= 0.5 represents a relatively adiabatic collision at Ve= 1 and V8= 0 in region I (single collision) on Fig. 3(b). Figure S(b) with V=J.L= 1, Ve=O, and V.= 0.2 is on the boundary between region I (single collision) and region II (double collision) on Fig. 3(a). In this limiting case the initial conditions for Fig. 5 (b) are on the collision duration discontinuity in Vc, VB space. Figure S(c), with v=J.L=l, Ve=O, and Vs=0.86, shows a relatively impulsive double collision in region II on Fig. 3(a).
3 4
IV. GENERAL SOLUTIONS
A. Equilibrium Transition Rate
The fundamental role of the one-way equilibrium transition rate, R(l, f)dfdf' is evident from the functional form of the master equation, Eq. (3), and the adsorption and desorption rate constants given by Eqs. (15) and (16) where R(f, f) is defined in terms of R(l, f) by Eq. (5). The one-way differential transition rate may be expressed as a flux in phase space from the state f to the state l3B:
dR=p(v·n)ds, (38)
where ds is a differential element of a surface in phase space separating the states f and l on which (v·n) >0, V is the generalized velocity of a point in phase space, n is the unit outward normal to ds, and p(q, p) is the density of points representing the state of a system of n particles in a 6n dimensional phase space, the ~~es of which are the conjugate momentum p and pOSItion q coordinates of the particles.
For the case of a gas-atom, surface-atom collision, the only nonignorable coordinates are the momentum of the gas atom, Po, the momentum of the surface atom p., and the position of the surface atom Z. The one~way equilibrium transition rate may therefore be w.n~t~n in terms of the initial gas atom energy, f, and the Imtial velocity and position of the surface atom, Ve and V., using Eq. (38):
R(f, Ve, Vs)dfdVedV,=p(Po, p., Z)(Y -Z)dPgdP8dZ.
(39)
Downloaded 07 Dec 2011 to 129.10.124.131. Redistribution subject to AIP license or copyright; see http://jcp.aip.org/about/rights_and_permissions

ADSORPTION AND DESORPTION OF GAS ATOMS 1169
I- 3. z w ~ _'--.3 6 ".--,9
) W ," I a ~ 0 i{:---*---¥--~-d----¥----t->o,..
b)
c)
-.J Cl. (f)
0_3.
I-Z W ~ w <.) <10 -.J Cl. (f)
0
-I.
I-Z w ~ w ~O -.J Cl. (f)
0 -I.
-- ..... ,1 , , , , 2 3 4
.I' /
/
" , " .... " ,
.I' .... , .I' ..,
>I-
I.
g 0 -.J W >
>-'= <.)
0 -.J w >
>-I-U 0 -.J W >
0 "
-I.
o , ....
....
, , ,
2
,-, / ,
r
I
\ \ \ 15
I I
I 118
TIME
6
FIG. S. Gas y(l) --, and surface z(l) - - - atom trajectories. (a) Adiabatic collision (v=3.16, J.I=O.S, V.=O, and V.= 1.0) with'T.= 3.06 and 8/.= -0.007; (b) Limiting case between single and second collisions (v=J.I= 1, V.=0.2, Vc=O) with 'T.=2.80 and 8/.=-1 at the end of the first collision: (c) Second collision (v=J.I= 1, V,=0.86, Vc=O) here 'Tc= 1.71 and 8/.= -0.69 at the end of the first collision. Length and time are nondimensional with respect to UW,-l and ",,-1, respectively.
The surface in phase space across which the flux is monitored is given by Y - Z = 0 with the condition Y-Z<o.
With the definitions: dpg= dEg/ u, dp. = m.di, and Y = -u, Eq. (39) becomes
R(E, Vc, V.)dEdVcdV.
= p(Eg, i, Z)m.[1+(i/u)JdEgdidZ. (40)
Since it is assumed that the gas atom and surface atom are independent prior to collision, the phase space density in the initial state peE, i, Z) can be separated as a product of the gas particle density Po ( Eo) and the surface particle density p. (E.) :
p(Eu, Z, Z) =pg(Eg)p.( E.)
No exp( - Eg/kT) exp( - E8/kT)
Qg Q. ( 41)
where No is the number of gas atoms, Qo is the gas partition function, Q.=27rkT/w. is the solid atom partition
function, and it is assumed that, for the equilibrium transition rate calculation, the phase space points have a Boltzmann distribution. Substituting Eq. (41) into Eq. (40) with Eg= kTf, E.=~m.u2(Vc2+ V.2) , di=udVc, and dZ = uw.-1dV. yields
R(f, Vc, V.)dEdVcdV.= (Ng/Qo)e-·(m.u2/27r)
X exp[ - (f/,u) (Vc2+ V.2) J(1+ Vc)dEdVcdV.. (42)
The one-way equilibrium transition rate, nondimensionalized with respect to NgkT/Qg, is then
CR(f, Vc, V.)dfdVcdV.= (E/7rfJ.) (1+ Vc)
X exp[- (4,1.1) (V/+ V.2+fJ.) JdEdVcdV., (43)
where the nondimensional initial gas atom kinetic energy E, surface atom velocity Vc, and surface atom displacement V. are defined in the previous sections.
From the definition of the partition function,
NgkT/Qg=N/kT/Q/=NkT/Q, (44)
Downloaded 07 Dec 2011 to 129.10.124.131. Redistribution subject to AIP license or copyright; see http://jcp.aip.org/about/rights_and_permissions

1170 P. J. PAGNI AND J. C. KECK
18
16
14 -
W " >-- 12 (9
n: ~ 10 w -.J
8 <t Z LL
6
o 2 I I
, ,
" 6 8 10 12 14 16 18
INITIAL ENERGY, E
FIG. 6. Contours of constant one-way equilibrium transition rate in E, .' space for v=3.16 and 1'=0.5. Sample well depth shown at 0= 13.
where the subscript g indicates all gas atoms, the subscript f indicates only free atoms, and no subscript refers to ada toms. Thus the transition rate given by Eq. (43) may be nondimensionalized in a variety of ways. In adsorption processes, Eq. (43) is nondimensional with respect to
NfkT/Qf= tF.(8kT /7rmg )1/2e-6 = t(F,t) e-6, (45)
where c is the mean speed of the free atoms, and Qf= (27rmgkT) 1/2 for gas atoms moving normal to the surface. The transition rate in desorption processes is nondimensionalized with respect to
Nk T/Q = AeWg/27r (46)
where A. is the equilibrium adatom concentration. Equation (43) shows that the one-way equilibrium
transition rate has a strong maximum in initial condition (Vc, V.) space. In the limit e ...... HlO , <R (e, Ve, V.) resembles a delta function at
V.=O,
( 47)
This behavior is useful in making the variable transformation from <R(e, Ve, V.) to <R(e', e). The energy transfer, and therefore the final energy for a given initial energy, is given as an implicit but exact function of e, Vo, and V. by Eq. (36). This function is plotted in Fig. 3(b) for the particular but typical case, 1'=3.16 and J,L=0.5. It is seen that the surface, (.6./f) (Ve, V.), is approximately a plane in the neighborhood of the maximum of <R(e, Ve , VB)' The equation of that plane is obtained by expanding (.6./e) (Ve , V.) in a twodimensional Taylor series about the Vo, VB values given
by Eq. (47), and truncating the expansion at the linear terms.
(.6./e) (Ve, V.) =a ...... l+bV.+cVe (48) where
a=ii(Te),
b = 2f1 (Te) flv. (Te), and
c= 2f1( Te) flv.( Te)
with subscripts indicating differentiation, and Te(O, 0) is obtained from Eq. (33). A rotation transformation to two new coordinates, V.r and Vcr, whose axes are parallel and normal to the intersection of the e' plane with the plane of the Ve, V. axes, picks up the direction of the normal coordinate Vcr. This transformation is
Vsr = Ve[1 + (c2/b2) J-I/2...... V.[l + (b2jc2)]-1/2,
Vcr= Ve[1 + (b2/C2) J-I/2+ V.[l + (c2/b2) J-I/2. (49)
The Jacobian is unity. The Vcr, Vsr axes can be located on Fig. 3(b) by a ,-....,60 0 counterclockwise rotation from the Ve , V. axes. Inverting Eqs. (49), substituting into Eq. (43), and integrating over V.r gives
<R (Vcr, e)dVerde= (e/7rp,) 1/2(1 + Vcr [1 + (b2/ C2) J-I/21
X exp[ ...... (f/p,) Vcr2......eJdVerde. (50)
The one-way equilibrium transition rate is then obtained from Eq. (50) using
<R(e, e') de'dE=<R[Vcr(E') , EJ I dVer/dE' I dE'dE
and Ver(E', E) = (e' ...... aE)E-1(b2+c2)-1/2, with the desired result
(51)
This approximate rate does not satisfy the symmetry required by detailed balancing. A symmetric form can be constructed by taking the arithmetic mean of R(e, E') and R (E', E). Numerical comparisons show negligible distinction between the symmetric and unsymmetric rates.
Introducing the approximations:
a,-....,1, e"""'e= (E+e')/2 ,
and .6./2E«1 yields a simple symmetric kernel:
<R(e,.6.) = [p,7re(b2+c2) J-I/2 exp[ ...... .6.2/p,e(b2+c2) ...... eJ,
(52)
where e= (E'+e)/2 is the mean energy, and .6.=e' ...... e is the energy transfer. This approximate one-way equilibrium transition rate is used in the calculations reported here. Figure 6 shows contours of constant nondimensional one-way equilibrium transition rate <R(e, e') in the range 100 to 1038 in f, e' space. The gradient of <R(e, e') along the .6. axis is much greater than
Downloaded 07 Dec 2011 to 129.10.124.131. Redistribution subject to AIP license or copyright; see http://jcp.aip.org/about/rights_and_permissions

ADSORPTION AND DESORPTION OF GAS ATOMS 1171
along the E axis. This difference allows an expansion of the population X(e, t) about A=O to obtain an equivalent diffusion equation for X(e, t) from the master equation. The exponential decay in il follows from the Boltzmann factor. A typical well depth, ~= 13, is indicated by the dashed line in Fig. 6. There are four transition regions separated by E' = ~ and e=~: for E and E'>~, the gas atom is never trapped; when e and E' <~, transitions occur between states in the well; for e<~ and E'>~ desorption takes place; and in the region E' < ~ and e> ~ gas phase atoms are adsorbed.
Once the equilibrium transition rate is known, the one-way equilibrium desorption rate, (R( j, e), is obtained as the integral of (R(e', E) over ~<E'<oo given by Eq. (5). This is equivalent to integrating Eq. (52) over 0.5(~+e)<il<oo using A=2(il-e) with e as a parameter. The result is
(R(j, e) = t exp( -4qpe+8cfe) {erfc[pl- (2qejl) J
where
and
+ exp(8qpe) erfc[pl+ (2qejl) Jl (53)
q= [iJ.(b2+C2) J-1/2,
p= (4q2+1)1/2,
I=H~+e)1/2.
The Gaussian behavior of the kernel for Eq. (5), given by Eq. (52), is clear in Fig. 7 where the nondimensional transition rate is plotted versus energy transfer for iJ.=0.5 and p=3.16. The two curves, equivalent to slicing Fig. 6 along il= 10 and il= 30, indicate that the mean energy transfer increases as the incident energy increases. This is reasonable since harder collisions should be more impulsive. The broadening of the kernel half-width appears in Eq. (52) as a Gaussian scale factor of E-1.
1.2
-I 0
NORMALIZED TRANSITION KERNEL RIE,t.)It.oIE)
E=30.
ENERGY TRANSFER, t::. 2
FIG. 7. Normalized transition kernel versus energy transfer for 1'=3.16 and /,=0.5 with .= 10 and 30. Similar results are obtained for all/, and 1'.
10~O::----:----::----:----::----:1:-_-L---.L_L---L_~>.J o 2 4 6 8 10 12 14 16 18 20 22
ENERGY,E
FIG. 8. Energy transfer moments versus incident energy for 1'=3.16 and /,=0.5. Criterion t.,= 1/2 (at.,/a.) is satisfied for .>2.
B. Steady State Adatom Energy Distribution
Two methods were used to obtain approximate solutions to the master equation for the steady state adatom energy distribution.
1. Equivalent Diffusion Equation
Equation 3 may be converted to an equivalent diffusion equation27 which identifies the desorption process with a diffusion process in phase space.24 This is a particular form of the more general transformation to a Fokker-Planck equation.25 In the steady state approximation the equivalent diffusion equation is
o - a[A2(e)J[ox(e)/oeJI=0 (54) oe
where
An(e)= L: (e'-e)n(R(e,e')dE'
is the nth moment of the energy transfer with respect to the equilibrium transition rate. Equation (54) is a valid approximation to the master equation when the form of (R(e, e') is such that A1~toA2/oe.
Figure 8, where p= 3.16 and iJ.= 0.5, indicates this criteria is satisfied for e> 2 for the kernel given by Eq. (52). This result is typical for all values of the inertia and frequency parameters. Fig. 8 also displays the exponential energy dependence of An(e) due to the Boltzmann factor in (R(e, e'). The normalization condition, x(O) = 1, replaces the boundary condition at the bottom of the well since the solution of Eq. (54) is not well defined with first derivative boundary conditions. The boundary condition at e=~ is (A2(~)/2)o(~)/oe= - 2r (~)x (~), where ~ is the well depth and r (~) is the "one-way equilibrium desorption flux",
r(~) = t lao (R(e, e')de'de. (55) o . 8
Once the equilibrium transition rate is known, r (~)
Downloaded 07 Dec 2011 to 129.10.124.131. Redistribution subject to AIP license or copyright; see http://jcp.aip.org/about/rights_and_permissions

1172 P. ]. PAGNI AND ]. C. KECK
1.0
- .8 ~
o
~ .6
~ 3 .4
.2 --
v 0 3.18 1'0 .72
--------v 03.14 1'0.46 __ ---------
-,----o 0~c=5c----,l:1 0---c1=-5 -2::':0-:----:2:":::5--::3"::0- -3-5 -4~0-...:'45=--~50
ENERGY,E
FIG. 9. Plot of mean square energy transfer per collision versus incident energy for v=3.18, p.=0.72 and v=3.14, p.=0.46. Iteration is useful for Il./ Ilo> ~1 and the diffusion equation is useful for Il./ Ilo < ~ 1.
can be integrated directly. Using the approximate kernel given by Eq. (52) and changing variables to ~ and ~, r (<<5) is obtained by integrating over 2 (<<5-~) < ~<ao for -ao<~<<<5 and over 2(~-«5)<~<ao for «5<~< ao, with the result
r (<<5) = exp( - «5+ «5/16q2) erf( «51/2/4q). (56)
This approximate equilibrium desorption flux is valid when a~1, 2«5/!L»1 and 8q2»1.
The steady state reduced population in the diffusion approximation is, integrating Eq. (54) subject to the above boundary conditions,
;x(E) = 1-{ ~2(E)-ldE / (f ~2(E)-ldE+tr(<<5)-I). (57)
Numerical integration, using Eq. (56) for r(<<5) , and ~2(~) as given in the Appendix, gives the results described here.
The diffusion approximation is useful since its range of validity includes significant non equilibrium effects, and the moments of the transition rate CR(E, Vc, V8 ),
as shown in the Appendix, are sufficient to obtain a solution. A criterion for validity of the diffusion solution is given by the mean square energy transfer per collision ~2(E)/~O(E), shown in Fig. 9 for v=3.18, !L=0.72, and v=3.14, !L=0.46. When ~d~o<1, the diffusion solution is accurate. When ~2/ ~o> 1, the terms O(~n) dropped in the diffusion approximation become important.
Figure 1O(a) shows equivalent diffusion equation solutions given by Eq. (57) for the steady state reduced population for v= 3.16, !L= 0.5, and «5= 10 and 30. The ratio of the actual to the equilibrium energy distribution is plotted versus energy below the top of the well. Those energy levels for which X(E) equals one have a Boltzmann distribution. The levels for which X(E) is less than one are depleted. The magnitude of the depletion is determined by the rate at which atoms
"diffuse" up the well to replace the adatoms that desorb. When the energy transfer in a collision is small, diffusive movement of adatoms among the energy states in the well is slower than the desorption process, and the upper levels deplete. However, when the energy transfer is large, the desorbed atoms are rapidly replaced by ada toms from lower levels, and the true population approaches an equilibrium population.
2. Iteration Solution
When the energy transfer per collision is large, ~2/ ~> 1, iteration schemes converge rapidly, and the first iteration is a valid approximation to X(E). The steady state ada tom energy distribution is then obtained from an iteration solution to Eq. (10) in the form
Xi(E) = t CR(E, ~')xH(E')dl / f'" CR(E, E')dl, (58) o 0
where Xi(E) is the jth iteration approximation to the steady state reduced population. Assuming the trial function XO(~) = 1.0 for E<<<5, and substituting Eq. (52) into Eq. (58) with a change in integration variable from E' to (~)1/2, gives
Xl(E) = t CR(x, E)dx / f'" CR(x, E)dx, (59) o 0
-12 ~ >< 1§10
~ -' 2.8 0 <l.
8.6 0) u
::> 0 w
4 a:: w ~ >- .2 U1
)-0
'" .0 ~ 10 9 U1
':<-----!:---8::---7--6 --5--4---3 -2---· 0
ENERGY BELOW WELL DEPTH, 8- E
w
r:'·r-========---------=-"-'-:::.:----"'-\·1l
)? .8 o w ,
b) ~ .6 --- DIFFUSION w a:: w 4 ---- ITERATION
~
~ : L------- ----~-U1 10 9 8 7 6 5 4 3
ENERGY BELOW WELL DEPTH, 15 - E 2 o
FIG. 10. Steady state reduced adatom energy population. (a) diffusion approximation for p=3.16 and p.=0.5 with 0= 10 and 30; (b) comparison of iteration and diffusion approximations for p=3.18 and p.=0.72 at 0=55.6. X indicates second iteration, X2(0).
Downloaded 07 Dec 2011 to 129.10.124.131. Redistribution subject to AIP license or copyright; see http://jcp.aip.org/about/rights_and_permissions

ADSORPTION AND DESORPTION OF GAS ATOMS 1173
where <R(x, e) = (2/r1/2) exp- (p2xL g2x-2+pg) with x= (E)1/2 and g= 2qe. Integration42 ,43 yields a first inteation approximation for the steady state reduced population:
X1(e) = I-tl erfc[pl- (2qe/l) + erfc[pl+ (2qe/l) ]
X exp(8pqe)}. (60)
A second iteration approximation for the steady state population at the top of the well, x2(5), may be found by numerical integration of Eq. (58) with j=2 and e=5, using Eq. (59) for XH(e'). The analytic single iteration approximation, Eq. (60), is used in calculations reported here. Although no direct comparison is possible Fig. 10(b) shows the equivalent diffusion equation and iteration solution approximate steady state reduced populations for 1'=3.18, p.=0.72 at 5=55.6. X indicates a second iteration x2(5). The mean energy transfer per collision ~2(5)/~o(5) is 1.5. The actual population is close to equilibrium, and similar ratios of the steady state to equilibrium rate constants are obtained from both methods: diffusion equation kd/kde= 0.86, and iteration solution kd/kde= 0.88.
C. Steady State Rate Constants
The energy integral of the master equation yields the adsorption and desorption rate constants in the steady state approximation. Two methods have been described for obtaining the steady state reduced population and the equilibrium desorption flux, required by Eqs. (15) and (16) for these rates. The iteration solution numerically integrates Eqs. (15) and (16) using Eq. (60) for the steady reduced population X(E) and Eq. (53) for the equilibrium desorption rate <R(f, E). The diffusion method formally integrates Eqs. (15) and (16) using Eq. (57) for the steady state reduced population X (E), and Eq. (56) for the desorption flux r (5) required as a boundary condition. Since the iteration method is valid over a restricted range of similarity parameters where the ada tom ensemble is close to equilibrium, the diffusion method is used for the results described here.
The steady state desorption rate constant, obtained in the diffusion approximation from Eq. (15) noting that NkT/Q= A"wg/2r for the collision model described in Sec. III, is
kd= [:: ({ ~2-1dE+ir(5)-1) r1, (61)
where ~2 is given by Eq. (A9) and r (5) is given by Eq. (57). The equilibrium desorption rate constant is obtained from Eq. (15) using x(e) = 1:
kde= (wg/2r) r (15). (62)
The classical desorption rate constant kde is given by Eq. (2). The classical derivation1 assumes that (1) the gas phase and the adsorbed phase are at equilibrium; and (2) the sticking coefficient is unity so that
;Z <l ;(j")
z o u w ~ 0::
1.0 ~-"""=--'----'C--~----'----,----,--,-----, 8
6
2
6
-fL=1.O 4 --fL=0.2
2
I 0·2.'---_'------::---_LL-~:__----"---.l---.l---'~---' 2 3 4
FREQUENCY PARAMETER,v
FIG. 11. Ratio of the steady state to the equilibrium rate constant versus frequency parameter, v for a= 10 with contours of ).1=0.2 and 1 shown. The steady state rate constant is orders of magnitude below the equilibrium rate constant at "resonance" values of v.
the rate of arrival equals the rate of adsorption. These assumptions are not physically realistic during the adsorption-desorption relaxation processes. The equilibrium desorption rate constant, Eq. (62), is valid when the first assumption is correct, and the "steady state" desorption rate constant Eq. (61) does not require either assumption. For reference, the equilibrium constant for the adsorption-clesorption process is
Ke= (mg/2rkT)1/2wge-B, (63)
and the classical adsorption rate constant is the arrival rate,
(64)
When Eq. (17) is valid, the equilibrium adsorption rate constant is
kae= (kT/2rmg)1/2r(5) exp(c5), (65)
and the corresponding steady state adsorption rate constant is
ka = (kT/2rmg)1/2 [2 ~& ~2(E)-1dE+tr(5)-1r1 exp(5).
(66)
Equation (17) shows that the ratio of steady state to equilibrium rate constants is independent of the direction of the process. From Eq. (17) with Eqs. (61) and (62) or Eqs. (66) and (65),
ka/kae=kd/kde= (t+2r(c5) ~& ~2(e)-1dEr1. (67)
Downloaded 07 Dec 2011 to 129.10.124.131. Redistribution subject to AIP license or copyright; see http://jcp.aip.org/about/rights_and_permissions

1174 P. J. PAGNI AND J. C. KECK
1.4
I. 2~\ l n" I n"2 n"3 n=4
L !
2 -
.0 o 2
-
3 4 5 6 7 8 9 10 FREQUENCY PARAMETER, II
FIG. 12. Resonance values v,(,..) of the frequency parameter in,.., v space. The adiabatic limit is reached, and the mean energy transfer goes to zero on the contours indexed by n.
In the adiabatic limit A2~, and ka/kae=kd/kde~. In the impulsive limit A2 is a maximum. Since v-'>OO gives the adiabatic limit and 0-'>00 gives the impulsive limit, nonequilibrium effects generally increase as v increases and decreases as 0 increases. Figure 11 presents the ratio of the steady state to equilibrium rate constants given by Eq. (67) for ",=0.2 and 1 with 0= 10. Under this condition of fixed 0, the classical desorption and adsorption rate constants for a given gas species would be constants.
An interesting effect is shown by the contours of constant J.l. in Fig. 11 which pinpoint the values of the similarity parameters corresponding to highly nonequilibrium adatom energy distributions. "Resonance" occurs when the larger normal mode frequency given by Eq. (30) is an odd multiple of the smaller:
Wl= (2n+l)w2, n= 1, 2, 3···. (68)
For normal mode frequencies which are not independent, the period of both the gas and the surface atom motion is a multiple of the longer of the two normal mode periods, 27r/W2. The end of a collision occurs at t= Tc= 7r/W2, and since y and z have a common period, the velocities if (Tc) and i (Tc) return to their initial magnitudes. Thus at resonance the energy transfer is
(69)
and the adiabatic limit is reached. At frequency parameters near resonance, the steady state rate constant is orders of magnitude smaller than the equilibrium rate constant. Resonance is therefore a special case where non equilibrium effects are extremely important. Including anharmonic damping would round off the minima in Fig. 11, but would not change the qualitative picture.
Using Eq. (30) for the normal mode frequencies in Eq. (68) obtains the resonance values of v as a function of J.l. plotted in Fig. 12;
v,(J.l.) = (2NI 1+[1-4-'(1 +J.l.) J/2}- (1 +J.l.) )1/2, (70)
where
4-'= 1- [(2n+ 1)2-1J2/[(2n+ 1)2+ IJ2, n= 1,2,3·· ..
v,(J.l.) goes to 2n+ 1 in both the limit n-'>oo, and the limit J.l.~. With these results and the steady state adatom energy distribution previously derived, the magnitude and regions of import of nonequilibrium effects have been defined.
Figure 13 shows the variation of the adsorption rate constants given by Eqs. (65) and (66) for v=3.18, J.l.= 0.72, and v= 2.66, J.l.= 0.38 over a range of dimensionless well depths 0 from 10-80. The adsorption rate constant provides a more accurate measure of nonequilibrium effects since the exponential temperature dependence of the desorption rate constant is not present. The steady state and equilibrium rate constants shown are nondimensionalized with respect to the arrival rate, and the nondimensional well depth /) is equivalent to an inverse temperature. The displacement of the kae lines below kac = 1 gives a measure of the effect of a nonunity sticking coefficient. The corresponding displacement of the ka lines below the ka• lines indicates the effect of a nonequilibrium surface population.
The results given here are for adsorption from an incident gas with a Boltzmann energy distribution about the surface temperature. When the incident gas stream has any other energy distribution, the adsorption rate constant is obtained from Eq. (19). The result is Eq. (66) multiplied by H(O) where H(O) is given by Eq. (9) as
H(O) = fO <R(E, O)xg(E)dE / fa'" <R(E, O)dE. (71)
For the case of a gas with a Boltzmann energy distribu-
C'
E
'" .6 N '-f--'"
'- .5 o
-'"
f-
~ .4 fCf> z 8 .3 w ~ 0::
Z o f-
&: . I o Cf> o
kae -
koc = 1.0
...... ------------
II = 2.66 fL = .38 ------
~ O~--~--~~---L--~ ____ ~ __ ~~~ 10 70 80
FIG. 13. Nondimensional steady state and equilibrium adsorption rate constants versus well depth for v=3.18, ,..=0.72 and v=2.66, ,..=0.38.
Downloaded 07 Dec 2011 to 129.10.124.131. Redistribution subject to AIP license or copyright; see http://jcp.aip.org/about/rights_and_permissions

ADSORPTION AND DESORPTION OF GAS ATOMS 1175
tion at a temperature T g ,
Xg(E) =1]1/2 exp[ -1](E-O)+E-OJ
where 1]= T ITg. Substituting this expression and the value of CR(E, 0) obtained from Eq. (51) into Eq. (71) and integrating gives
(a2q2+ 1)1/2
H(O) =1]1/2[expo(1]-1) J --a2q2+1]
erfc[0(a2q2+1]) JI/2 X (72)
erfc[0(a2q2+ 1) JI/2 .
For the case of a monoenergetic incident beam of energy EO+ 0, xi E) = (4 VO/C)OD (E- 0- Eo) exp (E- 0), where OD is the Dirac delta function, and Eq. (71) gives
H(O) = 4Vo ( a2q2+ 1 )1/2 exp[ -a2q2Eo- (a2q2+ 1)oJ C 71'(Eo+O) erfc[(a2q2+1)oJI/2'
(73)
where Vo= (2kTEo/mg)1/2 is the velocity of the atoms in the beam and c= (8kTI7I'mg)1/2 is the mean thermal speed for a gas of atoms in equilibrium with the surface. Figure 14 shows H(0)1]-1/2 given by Eq. (72) versus the frequency parameter, P, for 1]=0, 1, and 10 with M= 0.2 and 1. The well depth, 0, was fixed at 0= 10: There was no measurable variation of H(O) with well depth over 10<0<80. H(O) 1]-1 /2 = 1 for all Pr(M) and for 1]= 1.
Figure 15 shows the 1] dependence of H(O) 1]-1/2 given by Eq. (72) for p=3.18, M=O.72, and p=2.66, M=0.38. The effect of the former set of parameters being "off resonance" while the latter is "on resonance" is clear from the near unity H(0)1]-1/2 for the resonance system.
As a sample calculation of the steady state rate constants, consider the case of a xenon gas impinging on a clean tungsten surface. Comparison of the soft cube model with scattering pattern datal8 indicates a frequency parameter P= 2.02 and a well depth D= 45000 K
~ 1.6
.§ 1.4 :I: w ~ 1.2 a: z
- iJ. = 1.0 -- iJ. = .2
o "1= I ~ l.0r----'-------.:::~..,;.~~==:.===:;;,,'"'='-o::_""""':3 a: o (f)
~ .8
Cl w
:: .6 ~ :::;; a: ~ 4;--1 ---~.L----_,:.3--------!4,--------l5,---i
FREQUENCY PARAMETER • z)
FIG. 14. H(0)-q-l/2 versus the frequency parameter I' for the inertia parameter, ~=0.2 and 1 with the temperature parameter, "1=0,1, and 10. At resonance and at '1=1, H(O)=l.
N 1.2
'.- ~==========~7=~~~--_ 01.01'" I
~ .8 a: z o ;:: .6 Q.
a: o
~.4 Cl w ~ .2 ~ :::;;
v = 2.66 P. = .38
v = 3.18 P. = .72
~ 0 z .O~I-L--L~~.IL-J-~~~I-~-L-LLLIO-L--L~IOO
SURFACE IGAS TEMPERATURE RATIO, 1) = T/Tg
FIG. 15. H (0)-q-1I2 versus the ratio of the surface temperature to the gas temperature, 71= TIT. for 1'=3.18, ~=0.72, and 1'= 2.66, ~=0.38.
for this system. The inertia ratio is Jl.= 0.72. If the surface temperature were 900 oK, 0 would be 5. If Tg =
900oK, 1]=1, and H(O)=l: Therefore, from Eq. (66), ka = 1.98X loa cm secl • If T g = 225°K, 1]=4.0 and from Eq. (72) H(O) = 1.12: Therefore, from Eq. (19) ka = 2.22 X loa cm sec l • The desorption rate constant is the same for all Tg; here kd=5.85X10⁹ secl . Note that the energy distribution of the incident stream primarily affects the sticking coefficient while the steady state distribution given by Eq. (57) remains a good approximation to the ada tom energy distribution for all 1].
V. CONCLUDING REMARKS
In summary, the time evolution of a nonequilibrium ensemble of gas atoms adsorbed on a solid surface has been described. The temperature and atomic species dependence of the phenomenological rate constants in the experimentally observed first-order rate equation has been obtained from the energy integral of the governing master equation. The pertinent similarity parameters and energy transition probabilities for gas atoms colliding with solid surfaces have been derived from a classical interaction model using a gas-surface potential composed of an oscillating harmonic repulsion and a stationary attraction. The master equation for the reduced ada tom energy population has been solved in the steady state approximation by interaction when the mean energy transfer per collision is greater than kT and by conversion to an equivalent diffusion equation with the second moment of the energy transfer assigned the role of diffusion coefficient in the case of mean energy transfer less than kT.
The magnitude of the departure from equilibrium due to the depletion of the energy levels near the top of the surface potential well is defined by the steady state reduced adatom energy population. It was found that for "resonance" values of the ratio of surface-gas oscillator frequencies, gas-surface collisions were suf-
Downloaded 07 Dec 2011 to 129.10.124.131. Redistribution subject to AIP license or copyright; see http://jcp.aip.org/about/rights_and_permissions

1176 P. J. PAGNI AND J. C. KECK
ficiently adiabatic that the adatom energy distributions were appreciably nonequilibrium, and the steady state rate constants were depressed orders of magnitude below the equilibrium rate constants. Experimental verification of this prediction would be extremely useful.
The ratio of the steady state desorption to adsorption rate constants is the equilibrium constant, unless an incident gas exists with an energy distribution which is not Boltzmann about the surface temperature. If such a gas exists the adsorption rate constant is modified by the ratio of the adsorption rate at the bottom of the gas-surface potential well from the actual incident energy distribution to the adsorption rate at that energy level from an equilibrium incident energy distribution. The desorption rate constant is unmodified: Therefore, the ratio of rate constants is the product of the equilibrium constant and the ratio of adsorption rates at the bottom of the well.
Comparisons with experimental data, as described in a later paper, indicate the results of this analysis are reasonable; however, insufficient experimental results are available at the present time to say that the theory has been confirmed. This treatment obtains the detailed time history of the energy distribution of the adsorbed ensemble. The adsorption-desorption rate problem considered here is but one of a large set of problems whose solution may be described by similar analysis. Gas-surface potential parameters obtained from this approach permit prediction of many phenomena: Therefore, rigorous experimental verification is feasible.
Possible extensions of the model are (1) to account for surface roughness by introducing a distribution of surface orientations or well depths; (2) to include energy transitions induced by adatom-adatom collisions in the master equation, thus eliminating the low surface concentration restriction; and (3) to add another degree of freedom to the master equation to account for internal energy exitation, thus extending the analysis to admolecules.
ACKNOWLEDGMENTS
The authors are grateful for helpful discussions with Professors Ronald Probstein, Leon Trilling, and Robert Stickney. This research was supported by the Advanced Research Projects Agency of the Department of Defense and was monitored by the Office of Naval Research under Contract No. N00014-67-A-0204-0040 and ARPA Order No. 322.
APPENDIX: ENERGY TRANSFER MOMENTS
The moments defined in Sec. IV are evaluated here for the collision model described in Sec. III. Using the equilibrium transition rate given by Eq. (43) for the required kernel and recognizing that integration over
€' is equivalent to integration over Ve and V. yields
X exp- ~ (Ve2+ V82+J.L)dVcdVs , (AI)
J.L
where the lower limit of Vc has been extended to - 00
with a negligible additional contribution to the integral. Since the energy transfer .:l is implicitly dependent on Vc and V. through the collision duration To, it is necessary to approximate .:l by a two-dimensional Taylor expansion about the maximum in the kernel taken here to second order. This expansion is
.:l(VcVs ) =.l+.lv,(Vc- Vc)+.lv.(V,- Vs)
+t[.lv,voCVc- Vc)2+2.lv,v.CVe- Ve) (Vs - V.)
+.lv.v.(Vs - Vs )2], (A2)
where the tilde superscript indicates evaluation at the kernel maximum (V. = 0, Vc=0.S[(1+21l/€)1/L l]} and subscripts indicate differentiation. Third-order terms are odd and contribute negligibly to the integral. The coefficients in Eq. (A2) are
.lv, = 2€yyv"
.lv. = 2€yyv.,
where
with
.lv, v, = 2€(Yv,2+yyv,V,) ,
.lv,v. = 2€(yv.yv, +YYv,v.),
.lv.v.= 2€(yv.2+yyv,),
A = (S-WI sinwITc-w2 sinw2Tc) / (1- f),
j2= (COSW2Tc- COSWITc)/(WI2_W22),,2,
(A3)
ja= [(1_,,2WI2) COSW2Tc- (1-,,2w22) COSWITc]/(WI2-wl),,2,
and where
Yv,v, = [(WI sinwITc-w2 sinw2Tc)/(wI2-w22) "2]TcV,,
Yv, v. = [(WI sinwITc-w2 sinw2Te) / (WI2_W22) ,,2]TcV.,
(AS)
Yv.v.= [W22(COSWITc- COSW2Tc)/(l-S-) ]TcV., (A6)
with
TeV, = (WI sinwITc-w2 sinw2Te) / (W12_W22) (y-i) ,,2,
TeV.=W22(COSWITc- COSW2Tc)/(I-f) (y-i), (A7)
where Te( V., Ve) is evaluated via Eq. (33). These expressions were obtained by differentiating Eq. (31). Substituting Eqs. (A2) through (A7) into (AI) and
Downloaded 07 Dec 2011 to 129.10.124.131. Redistribution subject to AIP license or copyright; see http://jcp.aip.org/about/rights_and_permissions

ADSORPTION AND DESORPTION OF GAS ATOMS 1177
integrating obtains the following moments:
~o(E) = exp( -e), (AS)
~1(e) = [exp( -e) ](.i+[(JL/2E) - Vc].iv,
+ (JL/4E) {[(2e/JL) VeL 2Ve+ l].iv,V, +.iv.v.l),
(A9)
~2(e) = [exp( -e) ] (.i2+[(JL/2e) - Ve].i.iv,
+ (JL/2E) {[(2ejJL) VeL2Vc+ 1] (.iv,2+.i.iv,vJ
+ .iV•2+ .i.iv.v.l ). (AW)
The zeroth moment is simply the collision rate. The first moment, as indicated in Fig. S satisfies the criteria2'7 ~1(e) =0.Sa~2(e)/ae required for validity of the diffusion approximation. A measure of the mean energy transfer per collision is given by the ratio of the second to zeroth moments. The dominance of second-order terms in the energy transfer Taylor expansion is exhibited in the linear dependence of ~2/ ~ on e as shown in Fig. 9. Using Eq. (AW) to evaluate ~2 in Eq. (30) gives the desired steady state solution to the approximate diffusion equation for the ada tom energy distribution.
*This research was supported by the Advanced Research Projects Agency of the Department of Defense and monitored by the Office of Naval Research under Contract No. NOOOI4-67-A-0204-0040 and ARPA Order No. 322.
tpresent address: University of California, Berkeley, California. 11. Frenkel, Z. Phys. 26, 117 (1924). 2G. Armand, Surf. Sci. 6, 345 (1967). 3G. Armand, Surf. Sci. 9, 145 (1968). 4G. Armand, e.R. Acad. Sci. B 265, 1217 (1967). 5G. Armand, e.R. Acad. Sci. B 266, 193 (1968). 6G. Armand, e.R. Acad. Sci. B 266, 1042 (1968). 7G. Armand, 1. Mec. 7, 5 (1968). BG . Armand, Vide 139, 18 (1969). 9G. Armand, Advan. App\. Mech., Supp\.5 2, 1055 (1969). \OF. O. Goodman, 1. Phys. Chern. Solids 24, 1451 (1963). IIF. O. Goodman, 1. Phys. Chern. Solids 26, 85 (1965). 12F. O. Goodman, Surf. Sci. 3, 386 (1965). 13F. O. Goodman, 1. Chern. Phys. 50, 3855 (1969). 14V. B. Leonas, Zh. Prik\' Mekh. Tekh. Fiz. 3, 71 (1965). 151. E. Lennard-lones, Proc. R. Soc. A 163, 127 (1937). 161. E. Lennard-lones, Trans. Faraday Soc. 28, 333 (1932). 17R. M. Logan and R E. Stickney, 1. Chern. Phys.44, 195
(1966). IBR. M. Logan and 1. e. Keck, 1. Chern. Phys. 49, 860 (1968). 19R. A. Oman et al., Advan. App\. Mech., Suppi.3 2, 396
(1964). 20L. Trilling, 1. Mec. 3, 215 (1964). 211. D. McClure and Y. Wu, Advan. App\. Mech., Supp\.6
2, 1191 (1969). 22L. Trilling, Fundamentals of Gas -Surface Interactions, edited
by H. Saltsburg et a\. (Academic Press, New York, 1967).
In addition to these moments an approximate oneway equilibrium desorption flux is given by the first moment of the absolute value of the energy transfer
r(e) = ! I ~ 11 (E) = ! 1"" I ~ I R(e, e')de'. (All) 2 2 _0)
Using a rotation transformation similar to that used to obtain CR(e, e') from CR(e, VeVs), Eq. (All) may be separated into a summation of integrals in which ~ has a constant sign, thus bringing the absolute value outside the individual integrals. Asymptotically expanding the resulting parabolic cylinder functions obtains
I ~ 11 (e) =0.Se(~2v.+~2vy/2 exp[ -e- (lleC2/20JL)]
X {(BJ.l/e) sinh[(SejJL)1/2C]
+2(1-BC) (JL/tre)1/2
X exp- (eC2/30JL) cosh[(3ejJL)1/2C]1,
(A12) where
B= (1+.i2V./.i2vJ-1/2,
C= (.i-Vc.iv,)/(.i2V.+.i2V,) 112.
23M. N. Kogan, Rarefied Gas Dynamics (Plenum, New York, 1969).
24H. A. Kramers, Physica (Utr.) 7, 284 (1940). 25N. G. von Kampen, Can. 1. Phys. 39, 551 (1961). 261. e. Keck, 1. Chern. Phys. 29,470 (1958). 271. e. Keck and G. F. Carrier, 1. Chern. Phys. 43, 2284 (1965). 2B1. e. Keck, Adv. Chern. Phys. 13, 85 (1966). 291. e. Keck, 1. Chern. Phys. 46,4211 (1967). 3°1. e. Keck and A. Ka1elkar, 1. Chern. Phys. 49, 3211 (1968). 31e. A. Brau, 1. e. Keck, and G. F. Carrier, Phys. Fluids
9, 1885 (1966). 32D. L. Bunker, Theory of Elementary Gas Reaction Rates
(Pergamon, New York, 1966), pp. 76-107. 33G. Erhlich, Adv. Cata\. Re1at. Subj. 4, 259 (1963). 34A. Y. Cho and e. D. Hendricks, 1. App\. Phys. 40, 3339
(1969). 35H. Shelton and A. Y. Cho, 1. App\. Phys. 37, 3544 (1966). 361. R. Arthur, lr., "Report on 27th Annual Conference
Physical Electronic," M. I. T., pp. 188-192, 1967. 371. B. Hudson and 1. S. Sandejas, 1. Vac. Sci. Techno\. 4, 230
(1967). 3BF. L. Hughes, Phys. Rev. 113, 1036 (1959). 391. B. Taylor and I. Langmuir, Phys. Rev. 44, 423 (1933). 4°1. P. Moran, M. I. T. Fluids Dynamic Research Lab. Report
T68-1,1968. 41L. L. Levenson, e.R. Acad. Sci. B 1217 (1967). 42M. Abramowitz and I. Stegan, Nat\. Bur. Std. (U. S.), App\.
Math. Ser. 55, 304 (1964). 431. Gradshteyn and I. Ryzhik, Table of Integrals, Series, and
Products, edited and translated by A. 1effrey, (Academic, New York, 1965) p. 341.
Downloaded 07 Dec 2011 to 129.10.124.131. Redistribution subject to AIP license or copyright; see http://jcp.aip.org/about/rights_and_permissions