disclaimer for faa research publication · disclaimer for faa research publication although the faa...
TRANSCRIPT

Disclaimer for FAA Research Publication
Although the FAA has sponsored this project, it neither endorses nor rejects the
findings of the research. The presentation of this information is in the interest of
invoking technical community comment on the results and conclusions of the research.
STATISTICAL ANALYSIS PROGRAM FOR GENERATING
MATERIAL ALLOWABLES
Suresh Keshavanarayana
Department of Aerospace Engineering
Wichita State University
1845 Fairmount
Wichita KS 67260-0044
ABSTRACT
A computer program to conduct statistical analyses and generate tolerance values per the CMH-
17 guidelines has been assembled. The computer program is written using Visual Basic language
and has an Excel spreadsheet based user interface. The program combines the features of the
pooling and single point methods to generate the material allowables/tolerance factors. The
program also allows the user to discriminate the data for presence of outliers, between-batch
variability, appropriateness of statistical distributions, equality of variances, etc., using standard
statistical tests and graphical tools. The details of the computer program and the status of the
ongoing work are outlined in this paper.
1. INTRODUCTION
The variability associated with the composite material properties is well known. The sources of
variability include run-to-run variability in fabrication, batch-to-batch variability of raw
materials, testing variability, and variability intrinsic to the material. The generation of
statistically based material allowables (basis values/tolerance factors), which account for some of
the variability, is a key milestone in the insertion of materials into the design process for airframe
structures and their certification. After the test data for material properties are obtained using
standard test procedures, the test data has to be analyzed using statistical methods to generate the
allowable values.
Currently, three statistical methods are available for generation of allowable values and these
methods are discussed in detail in the CMH-17 handbook[1]. The three methods are the Single
Point (SP) method[1], the Regression Analysis (RECIPE)[1] and the Pooling (AGATE) method
[2,3]. The SP and Pooling methods have been utilized through Microsoft Excel based Visual
basic Computer programs- STAT17 and ASAP respectively. The regression analysis method is
implemented using a Fortran code.
The current version of the ASAP program used for the Pooling method can accommodate test
data at five different environmental conditions, with a data limit of 200 per test environment. The
program assumes that the data at each environment follow a normal distribution and uses
statistical and graphical methods to judge the normality of the test data, prior to generating the
allowable/basis values. In addition to the statistical analysis, the program highlights problems
with the data (outliers), generates plots and conducts statistical tests to aide engineering
judgment if/when necessary and recommends alternate analysis methods if required. The excel
based STAT-17 program used for generating allowables based on SP method handles test data at
a single environmental condition individually. The program features discriminatory tests for
statistical distributions such as Normal, Weibull and LogNormal, and uses non-parametric
methods for estimating allowables in the event the distributions do not fit the data satisfactorily.
In the ongoing work, an Excel-Visual basic computer program which combines the features of
the Pooling and the SP methods per the flowchart approved by the Statistics Working Group
(SWG) of the CMH-17, is being assembled. The details of the computer program, its capabilities
and features and the status of the ongoing work are summarized in this paper.
2. GENERATION OF ALLOWABLES USING CMH-17 METHOD
The CMH-17 method utilizes both the SP and Pooling methods to generate the allowables from
test data obtained at different environmental test conditions. The test data generated with
multiple batches of data tested across different environmental test conditions (e.g., Room
temperature dry, elevated temperature wet, etc.) are screened for contiguity of test conditions (ref
CMH17) and other engineering considerations prior to the statistical analysis. The statistical
analysis begins with the test data being screened for acceptable and consistent failure modes
across material batched and environmental test conditions. The data sets are then analyzed for
the minimum requirement for number of batches and batch sizes to determine if the SP or
Pooling method has to be used per the flowchart in Figure 1. The test data sets are then screened
for outliers at the batch level and at the test condition level using the MNR statistic test [1,3].
The outliers are then dispositioned and new data points added to satisfy the minimum size
requirements for the batch/sample.
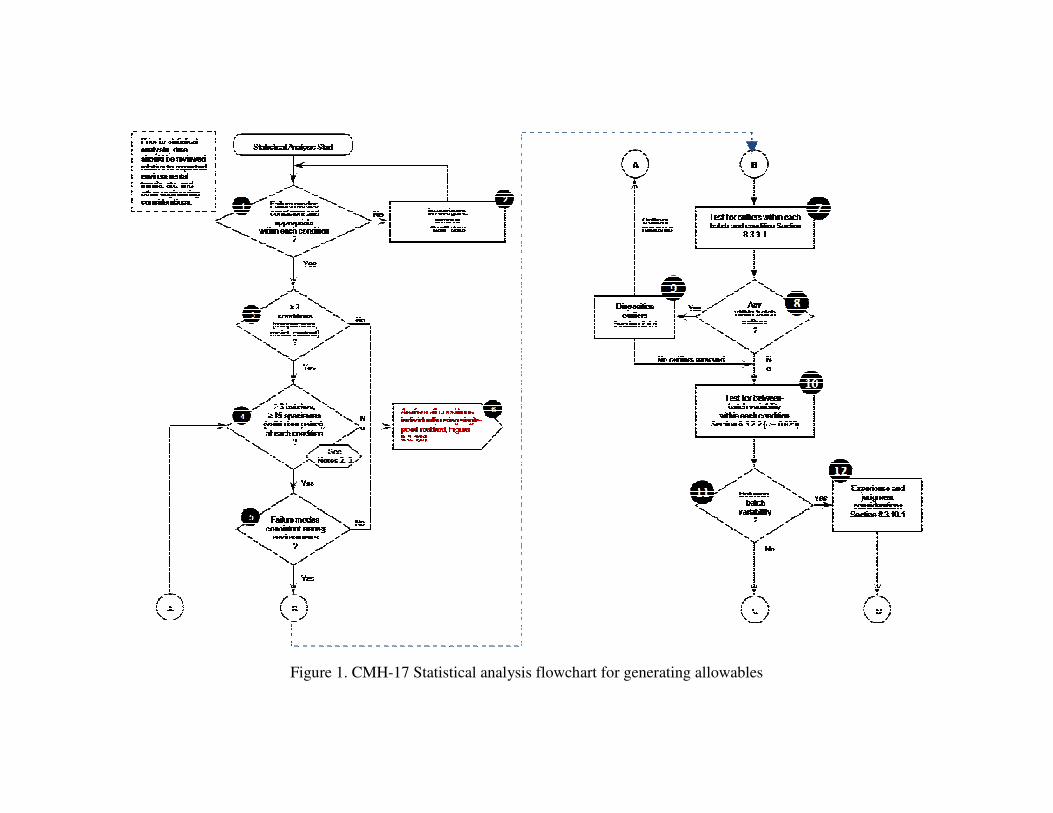
Figure 1. CMH-17 Statistical analysis flowchart for generating allowables
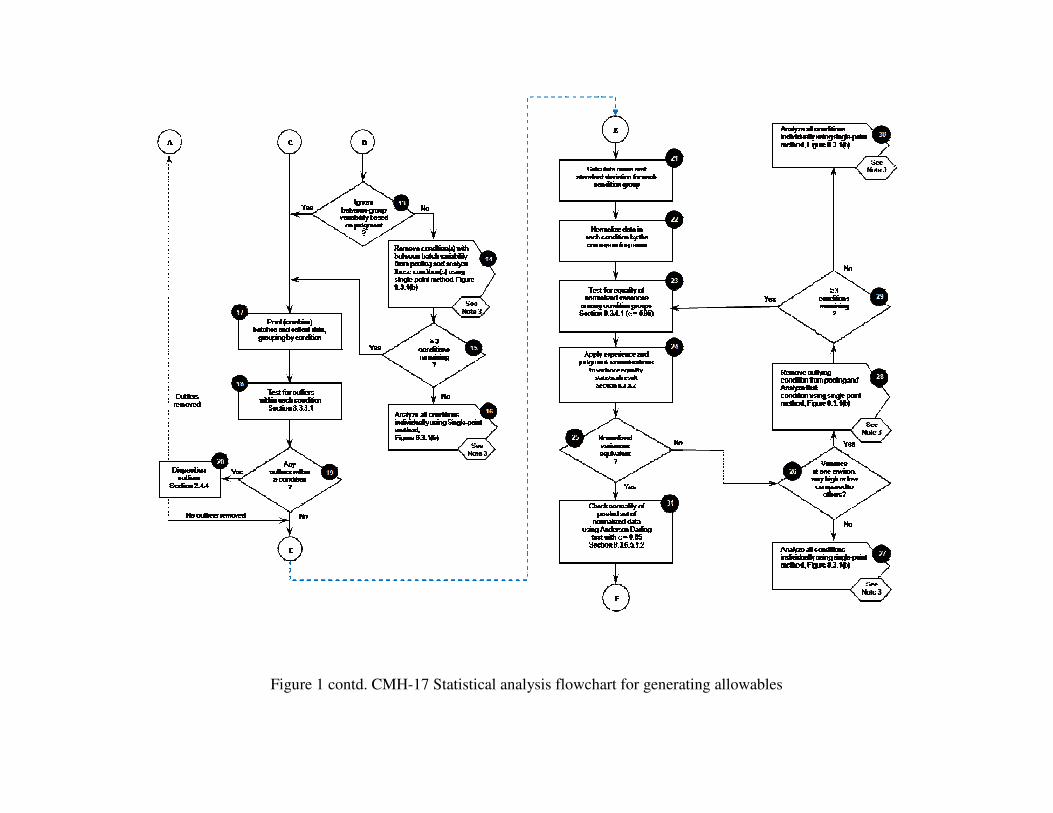
Figure 1 contd. CMH-17 Statistical analysis flowchart for generating allowables
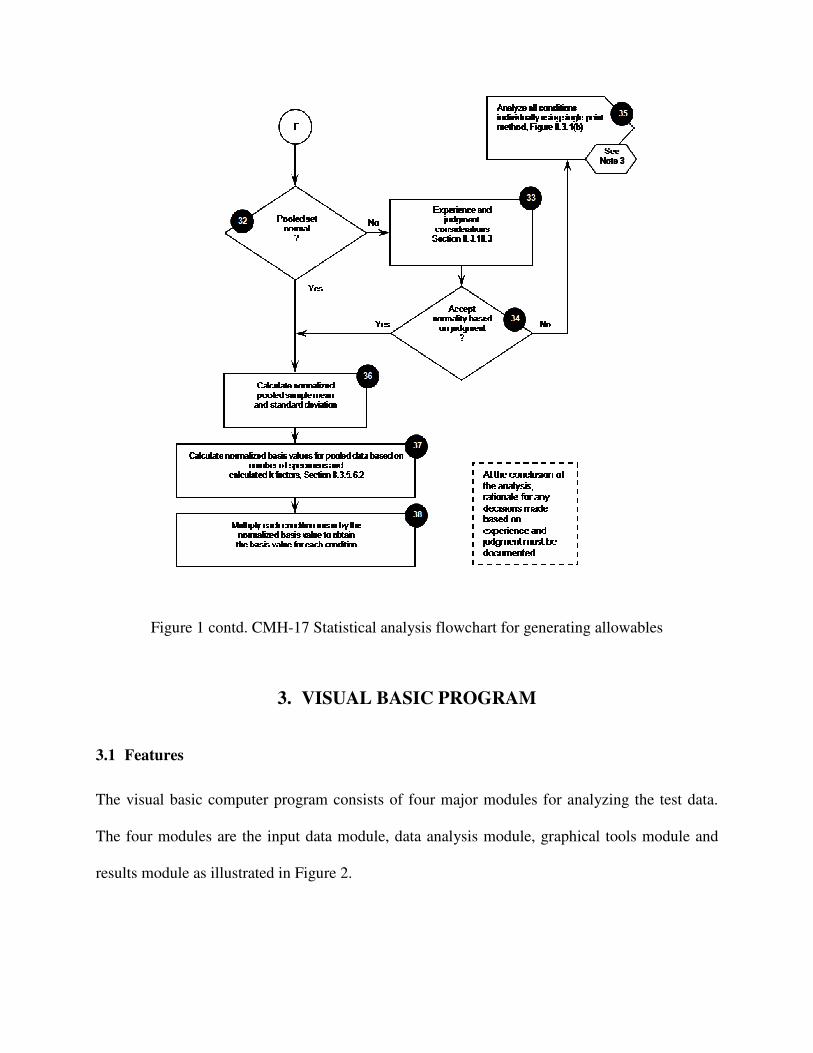
Figure 1 contd. CMH-17 Statistical analysis flowchart for generating allowables
3. VISUAL BASIC PROGRAM
3.1 Features
The visual basic computer program consists of four major modules for analyzing the test data.
The four modules are the input data module, data analysis module, graphical tools module and
results module as illustrated in Figure 2.
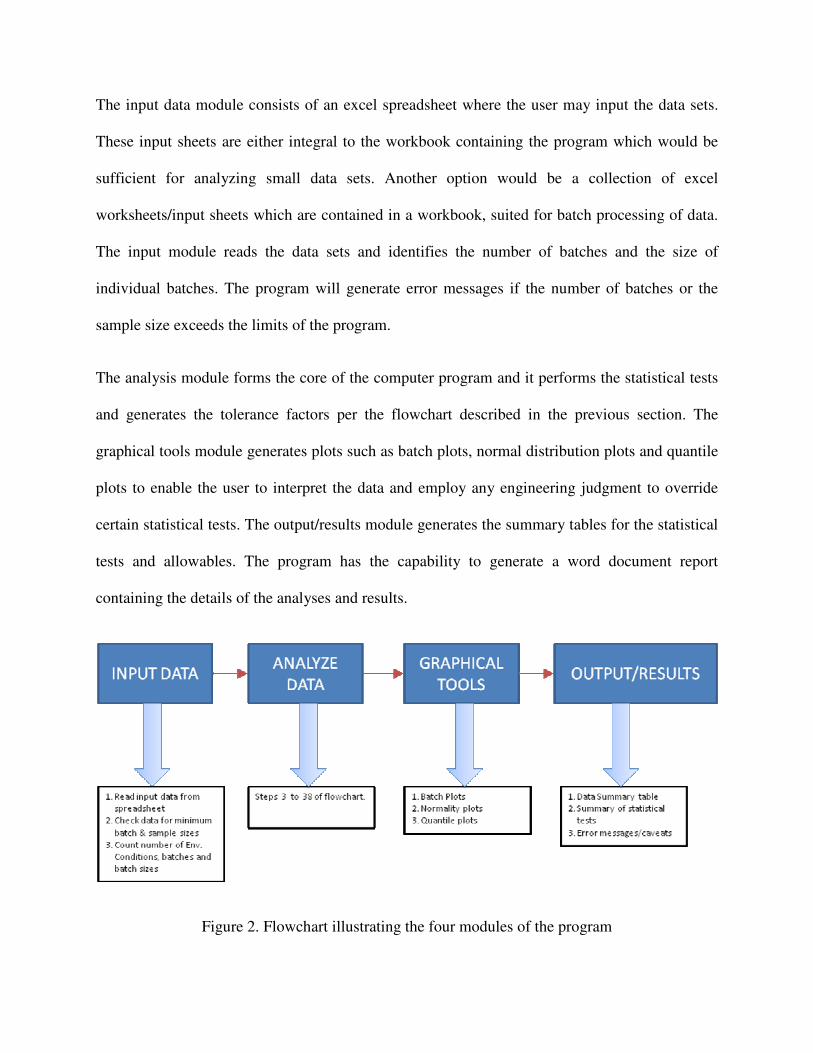
The input data module consists of an excel spreadsheet where the user may input the data sets.
These input sheets are either integral to the workbook containing the program which would be
sufficient for analyzing small data sets. Another option would be a collection of excel
worksheets/input sheets which are contained in a workbook, suited for batch processing of data.
The input module reads the data sets and identifies the number of batches and the size of
individual batches. The program will generate error messages if the number of batches or the
sample size exceeds the limits of the program.
The analysis module forms the core of the computer program and it performs the statistical tests
and generates the tolerance factors per the flowchart described in the previous section. The
graphical tools module generates plots such as batch plots, normal distribution plots and quantile
plots to enable the user to interpret the data and employ any engineering judgment to override
certain statistical tests. The output/results module generates the summary tables for the statistical
tests and allowables. The program has the capability to generate a word document report
containing the details of the analyses and results.
Figure 2. Flowchart illustrating the four modules of the program

3.2 Input of Data
The input data for statistical analysis is through an “input data” sheet which is part of the excel
program. The input sheet contains pre-allocated cells for data and batch identifiers as shown in
Figure 3. In addition, a specimen number can be inserted to identify a specimen within a batch.
The current input sheet can accommodate up to 1000 test data points at 10 environmental test
conditions. The user may enter the individual data sets using a keyboard or read the data from an
excel spreadsheet. The test condition identifiers (i.e., RTD, CTD, ETW, ETD) are available for
selection from a drop down list corresponding to each column of data. The user is required to
enter the temperatures (alphanumeric identifier) corresponding to the selected condition.
The statistical analysis of the test data is started by using the macro buttons on the input sheet.
The “Generate Basis Values” macro button initiates the entire statistical analysis process
outlined in the flowchart discussed previously. The input data is read by the VB program into
arrays at the beginning of program execution. The program checks for the batch and sample sizes
and generates error messages if necessary. The program subsequently tests the batches and
pooled data at each test condition for outliers which are identified on the input data sheet. The
user may then choose to retain the outlier or remove it from the analysis using the check box
corresponding to the data point under question. Sometimes, it would be more efficient to check
the data for outliers and between batch variability prior to generation of allowables. Additional
macro buttons are available to conduct these tests on the data sets selected using the drop down
menu as shown in Figure 3.

CTW 1
COMPANY Some Company CTD
MATERIAL Tx00/##xx Unitape/Epoxy RTD CTD -65 c CTD-65c
PROPERTY Tension - 0 deg RTW
TEST METHOD ASTM D3039 ETD
ANALYSIS DATE Date ETW
ANALYZED BY Name
3 x 75 4 75
1 B P U/D B P U/D B P U/D B P U/D
1 1
1 2
3
4
5
6
7
8
9
10
11
12
13
14
15
16
17
18
19
20
21
22
23
24
25
26
27
5 4
CONDITION TEMPERATURE TEMPERATURE CONDITION TEMPERATURECONDITION
Spec.
No.
Outlier
No.
TRUE
Batch
I.D
Data Data
TRUE
Batch
I.D
OutlierSpec.
No.
Spec.
No.
TEMPERATURE
Deg. F
CONDITION
DataOutlier
TRUE
Batch
I.D
Spec.
No.
DataOutlier
TRUE
Batch
I.D
CLEAR HEADER INFORMATION
PRINT REPORT
PRINT RESULTS SUMMARY
PRINT STATISTICS SUMMARY
CLEAR INPUT DATA
CLEAR SUMMARY SHEETS
READ DATA FROM .XLS FILE
PRINT REPORT TO WORD FILE
CHECK BETWEEN-BATCH
VARIABILITY AT TEST CONDITION
CHECKFOR OUTLIERS IN DATA AT
TEST CONDITION
CHECK FOR NORMALITY OF DATA
AT TEST CONDITION
Use data for pooling Use data for pooling Use data for pooling Use data for pooling
RTD 75
RTD
RTD
RTD RTW ETD RTW
Figure 3. Data input sheet layout
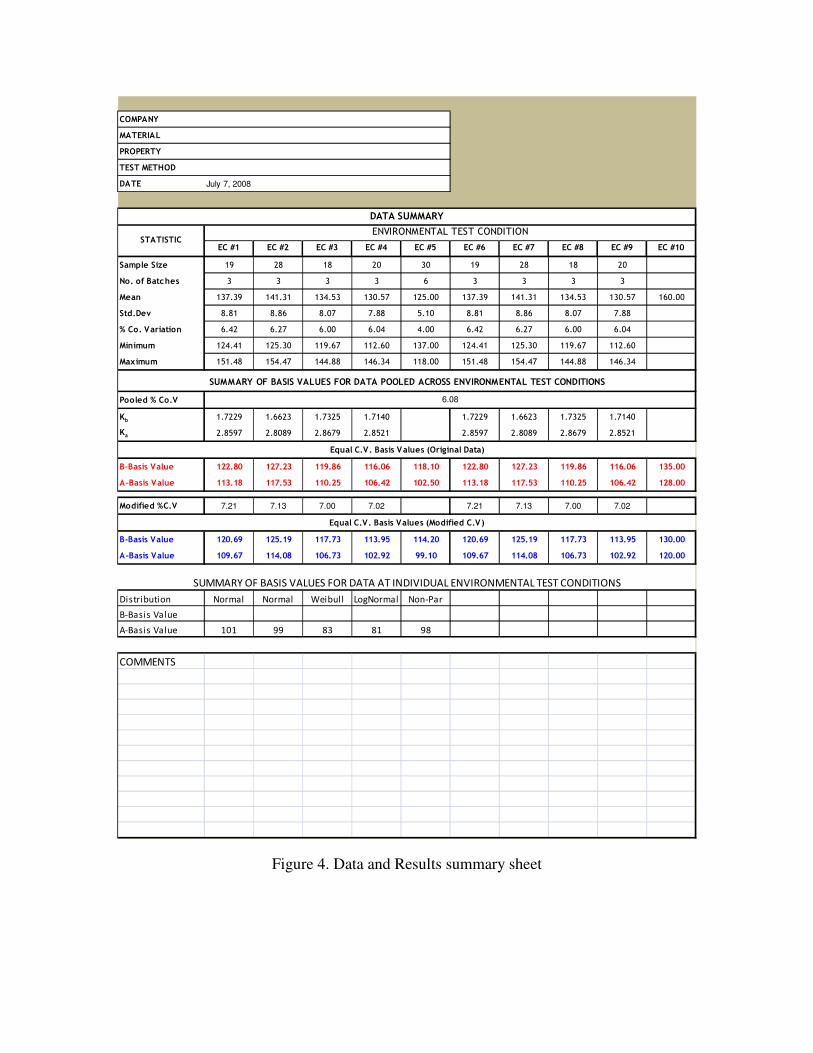
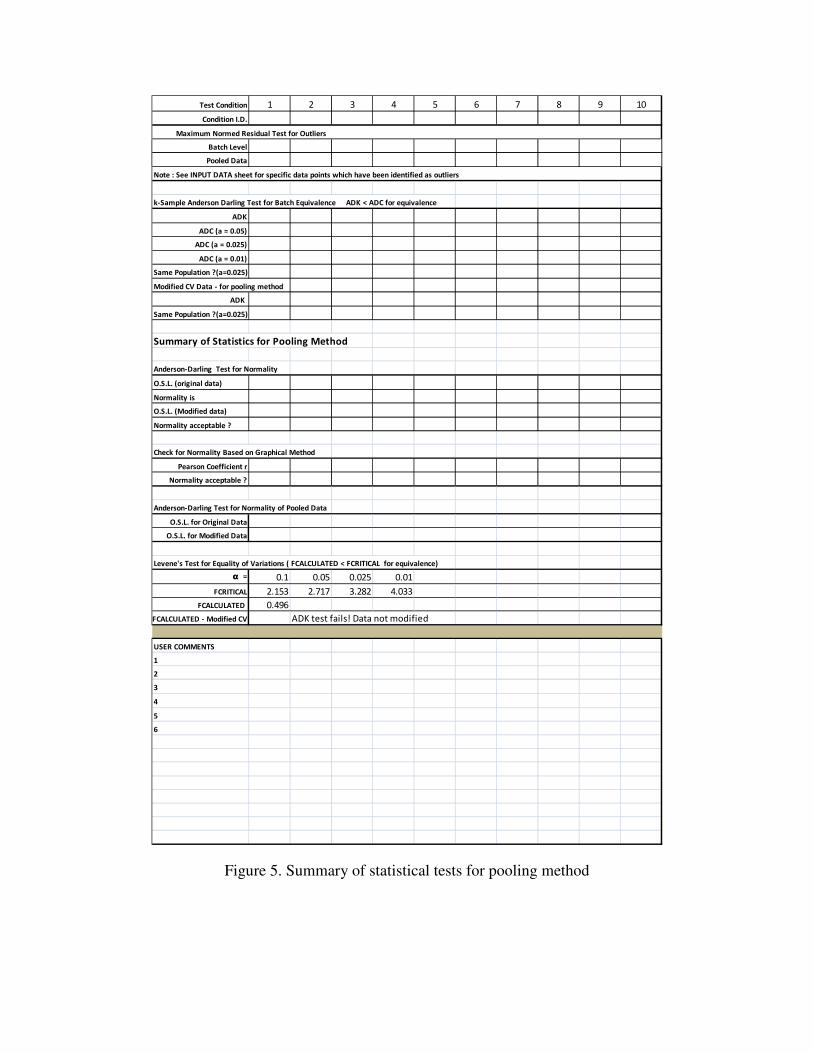
3.3 Results and Statistics Summary
The layout of the data and results summary sheet is shown in Figure 4. This sheet contains
statistical summary of the test data, i.e., number of data points, number of batches, mean value,
standard deviation, etc., at each test condition. The basis values corresponding to the pooling
and single point methods are both presented on the sheet. However, comments generated by the
program in accordance with the CMH-17 procedure will aide in the selection of the basis values.
These comments will point to the specific problems associated with the data sets, e.g., between-
batch variance, Normality of pooled data, etc., the details of which may be found in the statistics
summary sheets shown in Figures 5 and 6. If the user has an overriding engineering judgment,
the user may input the argument in the “user comments” area of the sheet shown in Figure 5.
COMPANY
MATERIAL
PROPERTY
TEST METHOD
DATE
EC #1 EC #2 EC #3 EC #4 EC #5 EC #6 EC #7 EC #8 EC #9 EC #10
Sample Size 19 28 18 20 30 19 28 18 20
No. of Batches 3 3 3 3 6 3 3 3 3
Mean 137.39 141.31 134.53 130.57 125.00 137.39 141.31 134.53 130.57 160.00
Std.Dev 8.81 8.86 8.07 7.88 5.10 8.81 8.86 8.07 7.88
% Co. Variation 6.42 6.27 6.00 6.04 4.00 6.42 6.27 6.00 6.04
Minimum 124.41 125.30 119.67 112.60 137.00 124.41 125.30 119.67 112.60
Maximum 151.48 154.47 144.88 146.34 118.00 151.48 154.47 144.88 146.34
Pooled % Co.V
Kb 1.7229 1.6623 1.7325 1.7140 1.7229 1.6623 1.7325 1.7140
Ka 2.8597 2.8089 2.8679 2.8521 2.8597 2.8089 2.8679 2.8521
B-Basis Value 122.80 127.23 119.86 116.06 118.10 122.80 127.23 119.86 116.06 135.00
A-Basis Value 113.18 117.53 110.25 106.42 102.50 113.18 117.53 110.25 106.42 128.00
Modified %C.V 7.21 7.13 7.00 7.02 7.21 7.13 7.00 7.02
B-Basis Value 120.69 125.19 117.73 113.95 114.20 120.69 125.19 117.73 113.95 130.00
A-Basis Value 109.67 114.08 106.73 102.92 99.10 109.67 114.08 106.73 102.92 120.00
Distribution Normal Normal Weibull LogNormal Non-Par
B-Basis Value
A-Basis Value 101 99 83 81 98
COMMENTS
ENVIRONMENTAL TEST CONDITION
DATA SUMMARY
SUMMARY OF BASIS VALUES FOR DATA AT INDIVIDUAL ENVIRONMENTAL TEST CONDITIONS
Equal C.V. Basis Values (Modified C.V)
July 7, 2008
STATISTIC
SUMMARY OF BASIS VALUES FOR DATA POOLED ACROSS ENVIRONMENTAL TEST CONDITIONS
6.08
Equal C.V. Basis Values (Original Data)
Figure 4. Data and Results summary sheet
Test Condition 1 2 3 4 5 6 7 8 9 10
Condition I.D.
Batch Level
Pooled Data
k-Sample Anderson Darling Test for Batch Equivalence ADK < ADC for equivalence
ADK
ADC (a = 0.05)
ADC (a = 0.025)
ADC (a = 0.01)
Same Population ?(a=0.025)
Modified CV Data - for pooling method
ADK
Same Population ?(a=0.025)
Summary of Statistics for Pooling Method
Anderson-Darling Test for Normality
O.S.L. (original data)
Normality is
O.S.L. (Modified data)
Normality acceptable ?
Check for Normality Based on Graphical Method
Pearson Coefficient r
Normality acceptable ?
Anderson-Darling Test for Normality of Pooled Data
O.S.L. for Original Data
O.S.L. for Modified Data
Levene's Test for Equality of Variations ( FCALCULATED < FCRITICAL for equivalence)
αααα = 0.1 0.05 0.025 0.01
FCRITICAL 2.153 2.717 3.282 4.033
FCALCULATED 0.496
FCALCULATED - Modified CV ADK test fails! Data not modified
USER COMMENTS
1
2
3
4
5
6
Maximum Normed Residual Test for Outliers
Note : See INPUT DATA sheet for specific data points which have been identified as outliers
Figure 5. Summary of statistical tests for pooling method

Distribution Statistic #1 #2 #3 #4 #5 #6 #7 #8 #9 #10
Normal
Log Normal
Weibul l
Mean
Stdev
%C.V.
Log Mea n
Log Stdev
Scale parameter
Shape Pa rameter
NON-PARAMETRIC STATISTICS
B-Bas is Method
A-Basis Method
B-Bas is Ra nk
A-Bas is Ra nk
B-Ba s is Hans-Koop k Factor
A-Ba s is Hans-Koop k Factor
EQUALITY OF VARIANCES TEST
Fcalculated
Fcritical
Variances Equal ?
ANALYSIS OF VARIANCE (ANOVA) STATISTICS
Sa mpl e Between-batch Mea n Sq. (MSB)
Error Mea n Square (MSE)
Estima te of Pop. Std. Devi ati on (S)
B-Bas i s Tolerance Li mit Factor (TB)
A-Bas i s Tolerance Li mit Factor (TA)
B-Ba s is Value
A-Ba s is Value
SUMMARY OF BASIS VALUES
WEIBULL
NORMAL
LOGNORMAL
NON-PARAMETRIC
ANALYSIS OF VARIANCE
WEIBULL
NORMAL
LOGNORMAL
NON-PARAMETRIC
ANALYSIS OF VARIANCE
A-Basis
B-Basis
Observed Signi fi ca nce
Level (OSL)
Summary of Statistics for Single-Point Method
Norma l
Log Normal
Weibul l
Figure 6. Summary of statistical tests for Single Point method.
3.4 Program Status
To date, the excel user interface for the program has been completed. The formats of the input,
results and statistics summary sheets were presented to the Statistics Working Group at the 54th
CMH-17 meeting (March 2009, Salt Lake City, Utah). Currently, the visual basic program is
being assembled and is expected to be completed around October 2009. The program will be
tested with existing data sets beginning November 2009. The program documentation is being
prepared concurrently and will be available to the users along with the program.
4. SUMMARY
An Excel based Visual Basic computer program to conduct statistical analyses and generate
tolerance values per the CMH-17 guidelines is being assembled. The program combines the
single point and pooling methods to generate allowables per the CMH-17 guidelines. The Excel
based user interface for data input and results summary have been completed. The coding of the
visual basic program is currently under progress.
5. REFERENCES
1. The Composites Materials Handbook, CMH-17
2. Shyprykevich, P, "The Role of Statistical Data Reduction in the Development of Design
Allowables for Composites," Test Methods for Design Allowables for Fibrous
Composites: 2nd Volume, ASTM STP 1003, C.C. Chamis ed., American Society for
Testing and Materials, Philadelphia, PA, 1989, pp. 111-135.
3. John S. Tomblin, Yeow C. Ng and K. Suresh Raju, "Material Qualification and
Equivalency for Polymer Matrix Composite Material Systems," DOT/FAA/AR-00/47,
April 2001.