documentation errors in instrumentation and electrical systems · complex instrumentation and...
TRANSCRIPT
School of Built Environment
Documentation Errors in
Instrumentation and Electrical
Systems
Toward System Information Modelling
Authors: Prof. Peter ED Love and Dr. Jingyang Zhou
Date: 30th July 2012
Document Number: SoBE 100/2012
Disclaimer
The Reader may make use of this report or any information provided by School of Built Environment (hereafter referred to as SoBE) but they do so at their own risk. SoBE will not be responsible for the results of any actions taken by the Reader or third parties on the basis of the information in this Report or other information provided by SoBE nor for any errors or omissions that may be contained in this Report. SoBE expressly disclaims any liability or responsibility to any person in respect of anything done or omitted to be done by any person in reliance on this Report or any information provided. For further information:
School of Built Environment Curtin University, GPO Box U1987 Perth, Western Australia Australia Tel: 61 (08) 9266 7350 Fax: 61 (08) 9266 Email: [email protected] Copyright © SoBE, Curtin University, 2012 All rights reserved. No part of this publication may be reproduced, stored in a retrieval system or transmitted in any form or by any means electronic, mechanical, photocopying, recording or otherwise without prior written permission of the copyright holder.
“It is only an error in judgment to make a mistake, but it shows
infirmity of character to adhere to it when discovered”
Christian Nevell Bovee
iii
Acknowledgments
The authors would like to thank I&E Systems for their support that has enabled the
research to be undertaken.
We would like to acknowledge the contributions of Professor Peter Davis, Dr. Michael
Sing, and Dr. Robert Lopez from Curtin University who have provided us with
constructive and invaluable feedback throughout the duration of this study. We would
also like to thank Professor David Edwards (Birmingham City University, UK), Professor
Jim Smith (Bond University, Australia), Professor Nuria Forcada (Universitat Politècnica
de Catalunya, Spain) and A/Professor Palaneeswaran Ekambaram (Swinburne
University of Technology, Australia) for peer reviewing the research reported and
providing constructive and invaluable comments.
Finally, we would like to thank I&E systems and Curtin University for jointly funding this
project. We believe the path of discovery has been and continues to be an enjoyable
and rewarding learning experience for both organizations.
The authors hope the research undertaken can make a difference to better
understanding why productivity in the design and documentation process is being
impacted. Moreover, the findings reported should stimulate thinking about the need to
re-appraise and re-evaluate the current design and documentation process of
instrumentation and electrical and systems in complex construction and engineering
projects.
iv
Table of Contents Page
Acknowledgments iii
List of Tables v
List of Figures vi
Glossary of Terms vii
Executive Summary 1
1 Introduction 2
2 Design and Engineering Documentation 3
2.1 Project Size and Complexity 5
2.2 Contributors to Poor Documentation Quality 6
3 Research Approach 7
3.1 Case Selection 8
3.2 Data Collection 8
3.2.1 Interviews 8
3.2.2 Documentary Sources 9
4 Case Study Background 10
5 Research Findings
5.1 Error Classification 11
5.2 Quantification of Unproductive Time 14
5.3 Information Redundancy 16
6 Toward Productivity Improvement 19
6.1 Quantifying the Benefits of DAD 22
7 Research Limitations 25
8 Conclusion 25
8.1 Future Research 26
v
Tables Page
Table 1. Summary of data collection methods used 9
Table 2. Classification of error types 14
Table 3. Quantification of non-productive time on-site 15
Table 4. CAD versus DAD to document Stacker Conveyor 22
vi
Figures Page
Figure 1. Documentation process and RFI 5
Figure 2. Stacker Conveyor 10
Figure 3. Examples of errors 13
Figure 4. Redundancy associated with cables and components 17
Figure 5. Man-hours cost for information redundancy 18
Figure 6. Cost curve to prepare traditional documentation 19
Figure 7. Drawing omission identified in DAD 20
Figure 8. Missing labels identified in DAD 21
Figure 9. Reduction in man-hours 23
Figure 10. Reduction in documentation cost 24
Figure 11. Cost comparison between traditional CAD drawing and DAD 24
vii
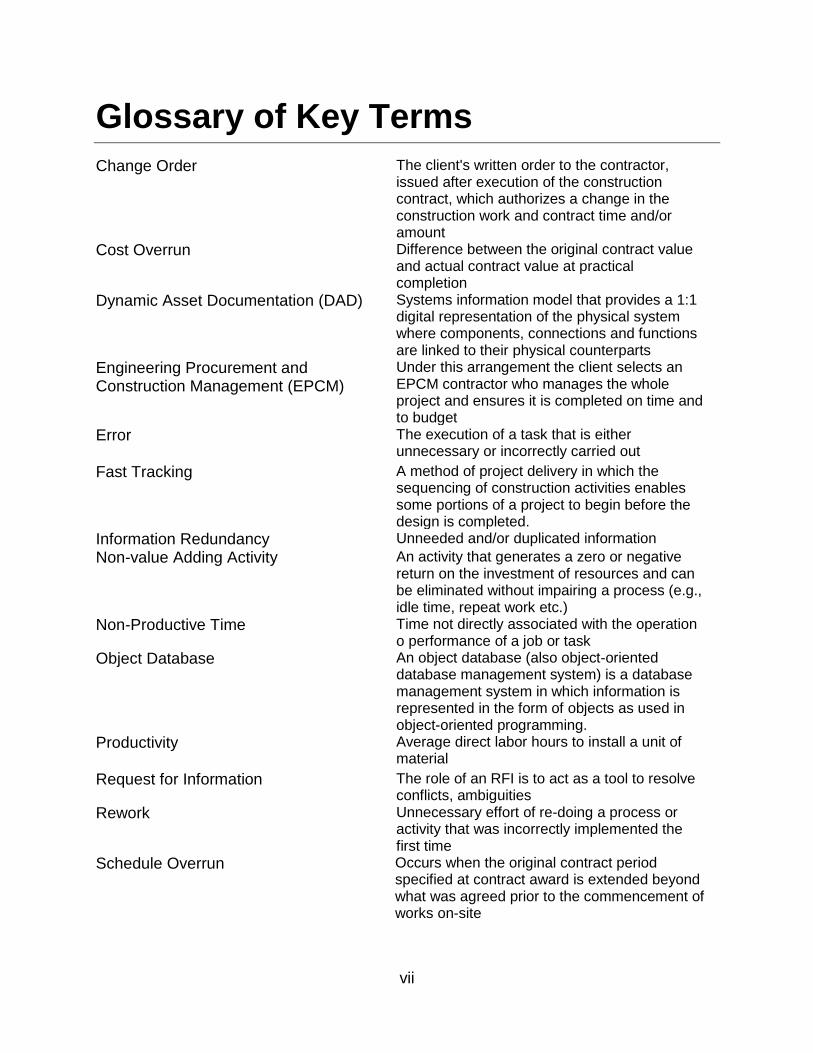
Glossary of Key Terms
Change Order The client's written order to the contractor, issued after execution of the construction contract, which authorizes a change in the construction work and contract time and/or amount
Cost Overrun
Difference between the original contract value and actual contract value at practical completion
Dynamic Asset Documentation (DAD) Systems information model that provides a 1:1 digital representation of the physical system where components, connections and functions are linked to their physical counterparts
Engineering Procurement and Construction Management (EPCM)
Under this arrangement the client selects an EPCM contractor who manages the whole project and ensures it is completed on time and to budget
Error
The execution of a task that is either unnecessary or incorrectly carried out
Fast Tracking A method of project delivery in which the sequencing of construction activities enables some portions of a project to begin before the design is completed.
Information Redundancy Unneeded and/or duplicated information
Non-value Adding Activity An activity that generates a zero or negative return on the investment of resources and can be eliminated without impairing a process (e.g., idle time, repeat work etc.)
Non-Productive Time Time not directly associated with the operation o performance of a job or task
Object Database An object database (also object-oriented database management system) is a database management system in which information is represented in the form of objects as used in object-oriented programming.
Productivity
Average direct labor hours to install a unit of material
Request for Information The role of an RFI is to act as a tool to resolve conflicts, ambiguities
Rework Unnecessary effort of re-doing a process or activity that was incorrectly implemented the first time
Schedule Overrun Occurs when the original contract period specified at contract award is extended beyond what was agreed prior to the commencement of works on-site
1
Executive Summary
Documentation errors have been identified as a significant problem within the
construction and engineering industry. Errors contained with contract documents can
contribute to loss of profit, reduced productivity, cost and time overruns as well as
contractual disputes. Research has identified that as much as 60% of variations in
construction and engineering projects are a result of errors and omissions contained
within poor quality documentation. Considering this alarming statistic and the impact
that poor quality documentation can have on productivity, the research presented in this
report examines the nature of errors contained within electrical documentation produced
for an Iron Ore Stacker Conveyor. Analyses of 106 drawings and the cable schedule
used to document the design of a Stacker Conveyor revealed:
seven different types of error: labeling mistakes, inconsistent labeling, omissions
from drawings, omissions from the cable schedule, missing labels, wrong design
and incorrect connections;
omissions from drawings (51.3%) and cable schedule (42.98%) accounted for a
significant proportion of all the errors identified;
that the reconciliation process associated with addressing an omission error
ranged from three to five hours;
an additional 851.5 man-hours would have been required to address all the
errors identified, which translates to an additional cost of $127,725 (when man-
hours are charged at a rate of $150 per hour for electrical engineers); and
the block, schematic and termination and layout drawings contained considerable
information redundancy. For example, 357 items appeared twice on drawings
documents with as many as 42 items appearing five times. The creation of the
information redundancy contained within the 107 documents equates to 598
additional man-hours and a cost of $77,740 (when man-hours are charged at a
rate of $130 per hour Computer Aided Design (CAD) draftsmen).
It is proffered that the use of CAD to produce the electrical drawings of the Stacker
Conveyor were ineffective, inefficient and costly to produce. In addressing the need to
eliminate documentation errors and improve productivity, the cable schedule is used to
create a Systems Information Management by developing a 1:1 object orientated model
for the Stacker Conveyor using the Dynamic Asset Documentation software. As a result,
of using this approach, it is estimated that a 94% cost saving and with a substantial
improvement in productivity could have been attained in this particular case.
2
1 Introduction
Poor design and documentation has been repeatedly identified as a major factor that is
contributing to the poor performance (e.g. cost and schedule overruns) and productivity
of the construction industry [1,2,3]. The documentation that is produced by consultants
often contains errors and omissions [3,4,5]. Complete design documentation is generally
not available when a project goes to tender stage, and as a result very few projects are
actually completed within the tendered price [6]. Accordingly Barrett and Barrett have
stated, “projects that run over time and budget are often underpinned by faulty
documentation that looks professional, but in fact does no properly describe the built
solution” [7].
Client’s fixed budgets and their requirement for earlier completion often results in
unnecessary pressure being placed upon design and engineering organizations to meet
their immediate demands and needs [7]. The use of competitive tendering by clients to
acquire the services of design and engineering organizations may result in a de-
emphasis being placed on the use of design audits, checks, verifications and reviews [8].
Consequently, the design documentation may contain incorrect dimensions, inadequate
references to drawings, standards and building/engineering codes and conflicting
specification [9]. Therefore, contractors and subcontractors are often required to raise
numerous ‘requests for information’ (RFI) for the purpose of clarifying, confirming or
requiring additional information. Empirical studies have indicated that between 50% and
60% of change orders that occur in projects are attributable to poor quality design
documentation [10,11]. Moreover, the costs of rectifying errors that arise from the design
and documentation process can potentially increase overall project costs 5% [12].
The graphical and written representations developed by engineers, for example, are
typically represented in two dimensions (2D) and constructed using computer-aided-
design (CAD). When a change is required to a 2D drawing, then the drawing and each
corresponding view has to be manually updated. This can be a very time-consuming
and costly process. Furthermore, as drawings are manually coordinated between views
in 2D, there is a propensity for documentation errors to arise particularly in the design of
complex instrumentation and electrical (I&E) systems, which comprise of hundreds of
component drawings that are not to scale and have to be represented schematically. In
such cases, information is often repeated on several drawings to connect each
schematic together. Consequently, the time to prepare the schematics can be a lengthy
and tedious process, especially as the design gradually emerges and individual
documents are completed. Inconsistencies can manifest between the documents and
3
therefore they must be re-edited and crosschecked before they can be issued for
construction.
Against this contextual backdrop, the research presented in this report aims to develop
an understanding of the nature of documentation errors and quantify their cost and
impact on productivity. In addressing the issues of documentation error and information
redundancy, Dynamic Asset Documentation (DAD), which builds a 1:1 relationship
between the real world objects and the developed model, is compared to the atypical
1:n relations of the conventional CAD enabled documentation process.
2 Design and Engineering Documentation
The design and construction of projects is complex and challenging process, and its
success is heavily reliant upon good communication between members of the design
and construction teams. Good design is effective when it serves its intended purpose
and is constructible within desired budget, time and safely objectives [13]. Furthermore, it
has been suggested that documentation quality should be measured using the following
criteria [14]:
timeliness – be supplied when required so as not to cause delay to works;
accuracy – free of errors, conflicts and inconsistencies;
completeness – providing all information required (i.e. ensuring there are no
omissions);
coordination – through coordination between design disciplines; and
conformance – meeting the requirements of performance standards and statutory
regulations.
Furthermore Tilley et al. defined quality documentation as the ability to provide the
contractor with all the information needed to enable construction to be carried out as
required, efficiently and without hindrance [14]. Research has revealed that the number
of RFIs being raised in Australian construction and engineering projects is a significant
problem. Moreover, the number of RFIs is a potential indicator of poor quality
documentation being produced [14-20].
The communication of current design documentation, for example, typically consists of
a set of 2D generated drawings showing the physical structure, along with specifications
showing the production and installation process. This is also akin to the domain of I&E
systems where design documentation consists of schematics, and cable schedule and
specifications. As a result there is a proclivity for contractors to be supplied with
incomplete, conflicting and erroneous documents and questions will be raised as and
when needed to address these issues [14,15]. When a situation of this nature arises, the
4
standard form of communication between the contractor and designers is to raise an
RFI. According to Tadt et al. the purpose of an RFI is to identify and resolve issues on-
site that require resolution to avoid potential contract disputes and claims [21]. Moreover,
CMM further suggests that RFIs are used to provide a systematic collection of the
analysis and resolution of questions that arise before and during construction [20]. RFIs
are typically used when [19]:
necessary information appears to be missing from the design
drawings/schematics or specifications, or where information contained within
them appears incomplete;
the contractor seeks clarification of the design drawings/schematics or
specifications;
discrepancies within the design drawings/schematics such as conflicting
information between plans and details or between drawings and specifications;
the contractor requests permission to use alternative materials or products.
Depending on the nature of the request, this could be interpreted as request for
substitution and could be subject to other provisions of the contract documents;
the contractor seeks an approved method to resolve conflict issues; and
to confirm verbal understandings between an architect/engineer and the
contractor related to any of the foregoing.
RFIs that require a ‘yes’ or ‘no’ answer should be avoided [20]. Furthermore, RFIs should
not be used to address minor questions, but instead focus on addressing significant
issues that may impact cost and schedule [20]. A response to an RFI needs to be
provided on a timely basis so as to not impact a project’s schedule [5,14,15,17,20]. RFIs can
be time-sensitive to resolve, yet the responding party needs to make a significant effort
to produce an accurate response on a timely basis [20]. A number of issues, however,
can impact the time it takes to respond to an RFI. For example, staff who were originally
involved in the design and have intricate tacit knowledge of the project may have left the
organization, been allocated to another project or be on leave/holiday. As a result, an
alternative or new engineer will be required to attend to the RFI that has been raised.
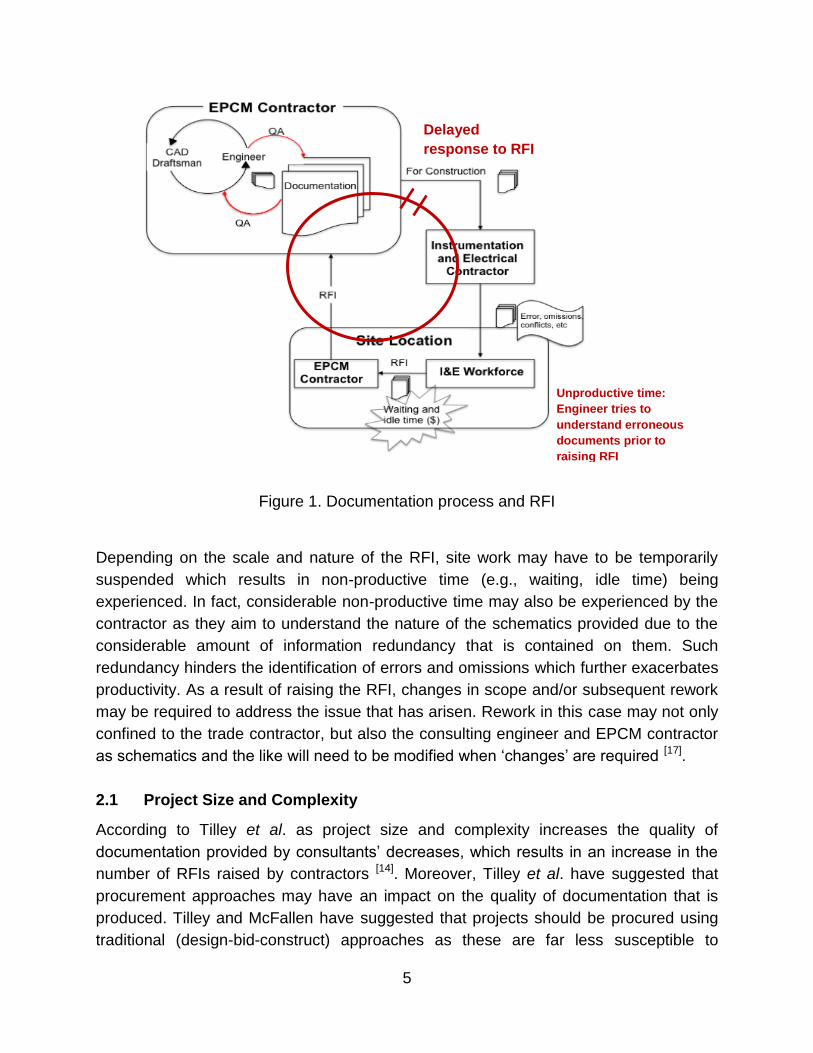
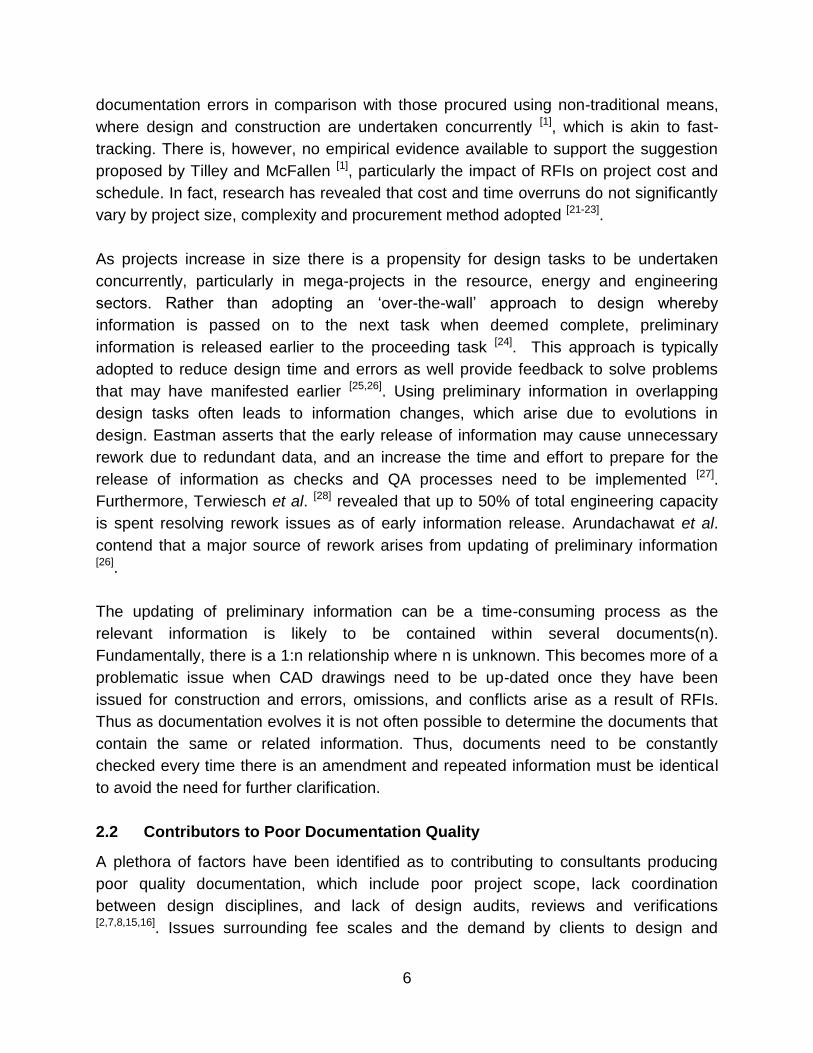
In Figure 1, for example, the documentation and RFI process is represented for a
hypothetical EPCM contract that involves a I&E contractor. Documentation is prepared
by engineering consultants who are contracted to the EPCM contractor. The process of
engineering design is iterative and requires engineers and CAD draftsman to work
collaboratively to realize a design solution. Once all the necessary quality assurance
(QA) approvals have been undertaken, documents will be provided to the selected I&E
contractor for construction. Once on-site, and construction commences, anomalies
(e.g., errors, omissions, conflicting information) in the schematics and cable schedule
are identified and RFIs are raised and sent to the EPCM contractor.
5
Figure 1. Documentation process and RFI
Depending on the scale and nature of the RFI, site work may have to be temporarily
suspended which results in non-productive time (e.g., waiting, idle time) being
experienced. In fact, considerable non-productive time may also be experienced by the
contractor as they aim to understand the nature of the schematics provided due to the
considerable amount of information redundancy that is contained on them. Such
redundancy hinders the identification of errors and omissions which further exacerbates
productivity. As a result of raising the RFI, changes in scope and/or subsequent rework
may be required to address the issue that has arisen. Rework in this case may not only
confined to the trade contractor, but also the consulting engineer and EPCM contractor
as schematics and the like will need to be modified when ‘changes’ are required [17].
2.1 Project Size and Complexity
According to Tilley et al. as project size and complexity increases the quality of
documentation provided by consultants’ decreases, which results in an increase in the
number of RFIs raised by contractors [14]. Moreover, Tilley et al. have suggested that
procurement approaches may have an impact on the quality of documentation that is
produced. Tilley and McFallen have suggested that projects should be procured using
traditional (design-bid-construct) approaches as these are far less susceptible to
Delayed
response to RFI
Unproductive time:
Engineer tries to
understand erroneous
documents prior to
raising RFI
6
documentation errors in comparison with those procured using non-traditional means,
where design and construction are undertaken concurrently [1], which is akin to fast-
tracking. There is, however, no empirical evidence available to support the suggestion
proposed by Tilley and McFallen [1], particularly the impact of RFIs on project cost and
schedule. In fact, research has revealed that cost and time overruns do not significantly
vary by project size, complexity and procurement method adopted [21-23].
As projects increase in size there is a propensity for design tasks to be undertaken
concurrently, particularly in mega-projects in the resource, energy and engineering
sectors. Rather than adopting an ‘over-the-wall’ approach to design whereby
information is passed on to the next task when deemed complete, preliminary
information is released earlier to the proceeding task [24]. This approach is typically
adopted to reduce design time and errors as well provide feedback to solve problems
that may have manifested earlier [25,26]. Using preliminary information in overlapping
design tasks often leads to information changes, which arise due to evolutions in
design. Eastman asserts that the early release of information may cause unnecessary
rework due to redundant data, and an increase the time and effort to prepare for the
release of information as checks and QA processes need to be implemented [27].
Furthermore, Terwiesch et al. [28] revealed that up to 50% of total engineering capacity
is spent resolving rework issues as of early information release. Arundachawat et al.
contend that a major source of rework arises from updating of preliminary information [26].
The updating of preliminary information can be a time-consuming process as the
relevant information is likely to be contained within several documents(n).
Fundamentally, there is a 1:n relationship where n is unknown. This becomes more of a
problematic issue when CAD drawings need to be up-dated once they have been
issued for construction and errors, omissions, and conflicts arise as a result of RFIs.
Thus as documentation evolves it is not often possible to determine the documents that
contain the same or related information. Thus, documents need to be constantly
checked every time there is an amendment and repeated information must be identical
to avoid the need for further clarification.
2.2 Contributors to Poor Documentation Quality
A plethora of factors have been identified as to contributing to consultants producing
poor quality documentation, which include poor project scope, lack coordination
between design disciplines, and lack of design audits, reviews and verifications [2,7,8,15,16]. Issues surrounding fee scales and the demand by clients to design and
7
document in shorter periods of time have been identified as primary contributors to poor
documentation quality [1-3]. According to DeFraites overall project quality is determined
by the level of professional fees provided and that the quality of these services is
determined by how the services are selected and how fees are negotiated [30]. It has
been suggested that when designers are selected on the basis of competition there is a
tendency to for them to remove or modify particular services to maximize their fee [8].
Consequently, the documentation that they produce is often incomplete and may
contain errors and omissions. Noteworthy, the legal standard of care for professional
services does not require or expect perfection when creating design documentation
prepared by design consultants [31]. From studies undertaken by the Construction
Industry Institute and National Research Council a design error and omission rate in the
range of 2% to 3% of construction cost is deemed to be an acceptable threshold level [14,15].
3 Research Approach
There has been limited research that has sought to quantify errors contained within
design documentation, particularly in the context of I&E engineering. However, research
propagated to date has enabled an underlying theoretical foundation to be established [2,3,5,8,17], though it requires further exploration before prescriptive laws can be
formulated. Many organizations have been reluctant to allow researchers to examine
firsthand the quality of documentation that has been provided to them due reasons of
commercial confidentiality and fear of potential litigation.
Documentation errors are a chronic malaise and have become a ‘norm’ within the
construction and engineering industry [3]. Active engagement from industry professionals
who have intricate knowledge of the problem are needed to tackle this problem. With
this in mind, participatory action research (PAR) approach was adopted [34-37]. In brief,
PAR is [38]:
participatory;
cooperative, engaging organizational members and researchers in a joint venture
in which both equally contribute; and
a way to balance research and action
In this context, the research aimed to address both the practical concerns of the
organization, and the research goals (i.e. the quantification and productivity impact of
errors in design documentation), by working collaboratively for a selected case study
8
project. The characteristics of action research are: an action and change orientation, a
problem focus, an organic process involving systematic and iterative stages and
collaboration with participants from within the organization [34-37]. As practitioner
involvement was required they were treated as both subjects and co-researchers. By
adopting this approach, theory related to design error and practice acted in congruence.
3.1 Case Selection
Working in close collaboration with the participating organization, it was decided that a
case study would be required to quantify documentation errors and their impact on
productivity. The organization had access to a significant amount of completed projects
but issues of commercial confidentiality needed to be taken into account. Moreover,
within any given I&E package the number of drawings that are produced varies
depending on its complexity and size. Thus, a small project with a complete set of
drawings was initially required to gain an understanding of the ‘problem’ extent and to
work through new issues that may have potentially arisen. The participating
organization had been asked to convert all CAD generated electrical ‘As Built’ drawings
for a Port facility into a System Information Model (SIM) known as DAD for the future life
of the plant. The electrical package for a Stacker Conveyor (CV911) was selected as a
complete set of drawings (106) and a cable schedule were readily available.
3.2 Data Collection
Triangulation formed the basis for the data collection, which took place at the offices of
the participating I&E organization. Triangulation involves the use of multiple research
methods and/or measures of a phenomenon, in order to overcome problems of bias and
validity [40,41]. The data collection methods used in this research was unstructured
interviews and documentary sources (Table 1). In addition to the active day-to-day
involvement of the participating organization with a researcher in their offices,
unstructured interviews with key personnel were also undertaken by a separate
researcher who was not positioned within the office environment. This was undertaken
to provide additional context to the problem and provide validity to the research process.
3.2.1 Interviews
Unstructured interviews were used as a primary and secondary source of data. As a
primary source, they were used to determine the issues influencing the production and
use of documentation. As a secondary source, information gathered from documentary
sources was confirmed. The use of unstructured interviews enabled the interviewer to
act as a research tool and learn about matters that could not be directly observed [42].
Interviews were undertaken with the Managing Director and Business Development
9
Manager and varied in length from 30 minutes to two hours. Interviews were open to
stimulate conversation and breakdown any barriers that may have existed between the
interviewer and interviewee. The interviewee was allowed to talk freely without
interruption or intervention, so as to acquire a clear picture of their perspective. Note
taking was generally used as the medium to record the interviews.
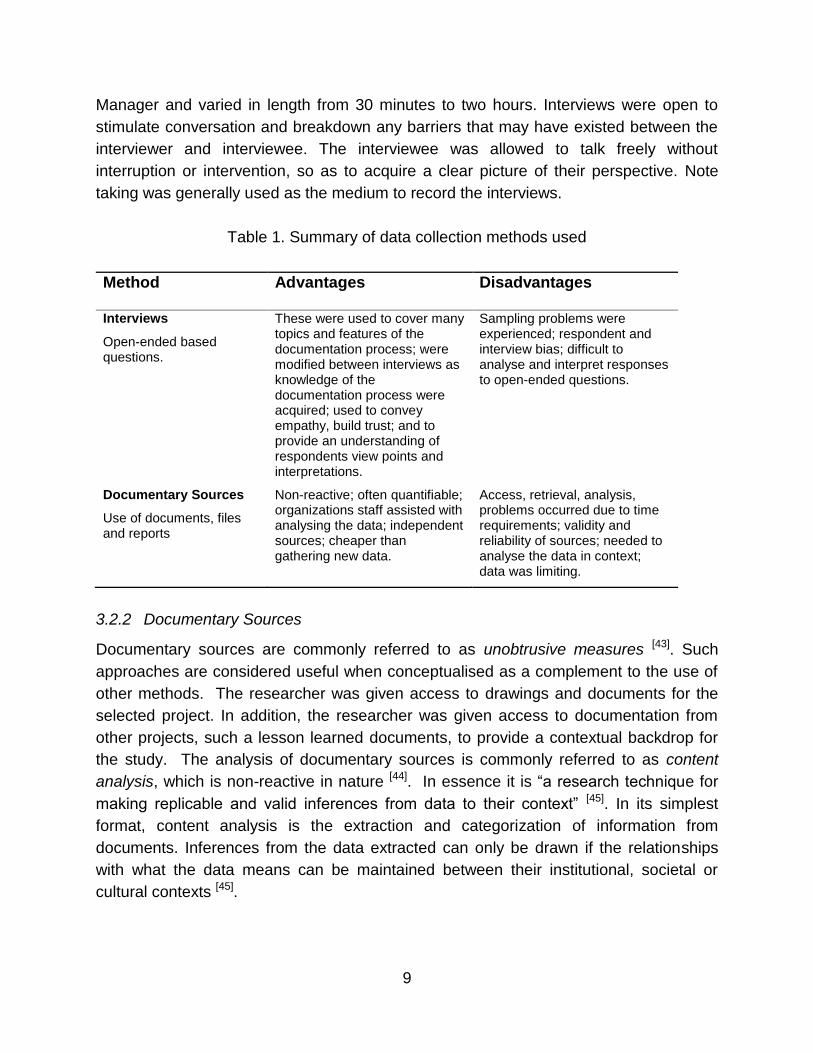
Table 1. Summary of data collection methods used
Method Advantages Disadvantages
Interviews
Open-ended based questions.
These were used to cover many topics and features of the documentation process; were modified between interviews as knowledge of the documentation process were acquired; used to convey empathy, build trust; and to provide an understanding of respondents view points and interpretations.
Sampling problems were experienced; respondent and interview bias; difficult to analyse and interpret responses to open-ended questions.
Documentary Sources
Use of documents, files and reports
Non-reactive; often quantifiable; organizations staff assisted with analysing the data; independent sources; cheaper than gathering new data.
Access, retrieval, analysis, problems occurred due to time requirements; validity and reliability of sources; needed to analyse the data in context; data was limiting.
3.2.2 Documentary Sources
Documentary sources are commonly referred to as unobtrusive measures [43]. Such
approaches are considered useful when conceptualised as a complement to the use of
other methods. The researcher was given access to drawings and documents for the
selected project. In addition, the researcher was given access to documentation from
other projects, such a lesson learned documents, to provide a contextual backdrop for
the study. The analysis of documentary sources is commonly referred to as content
analysis, which is non-reactive in nature [44]. In essence it is “a research technique for
making replicable and valid inferences from data to their context” [45]. In its simplest
format, content analysis is the extraction and categorization of information from
documents. Inferences from the data extracted can only be drawn if the relationships
with what the data means can be maintained between their institutional, societal or
cultural contexts [45].
10
Content analysis was used as the primary research method and in conjunction with
interviews, was used to quantify and determine the productivity impact of documentation
errors. Data was extracted directly from the ‘As Built’ documentation that was provided
for the Stacker Conveyor. A classification system for coding documentation errors that
arose was developed. This process of coding is akin to previous studies that have
examined the nature of design errors and omissions [46-48].
4 Case Study Background
The Stacker Conveyor selected for this research was part of a $2.8 billion Iron Ore
Mining project that was undertaken in the Pilbara in the northwest of Western Australia
(WA) which was constructed in 2008. The project consisted of two stages:
1. Construction of Port facilities and rail infrastructure to connect to mining
operations.
2. Mining operations and railway connections.
In the mine’s first year of operation and estimated 27 million tons of iron were mined,
railed, shipped to customers in China. This increased to 40 million tons in 2011, and it
anticipated that this will increase to 155 by 2013/2014. The increase in production has
resulted in several expansion projects being undertaken, such as the Port which
includes the development of additional outloading and inloading circuits, berths, ship
loaders, reclaimers, stacker, train unloaders, conveyor and material handling systems,
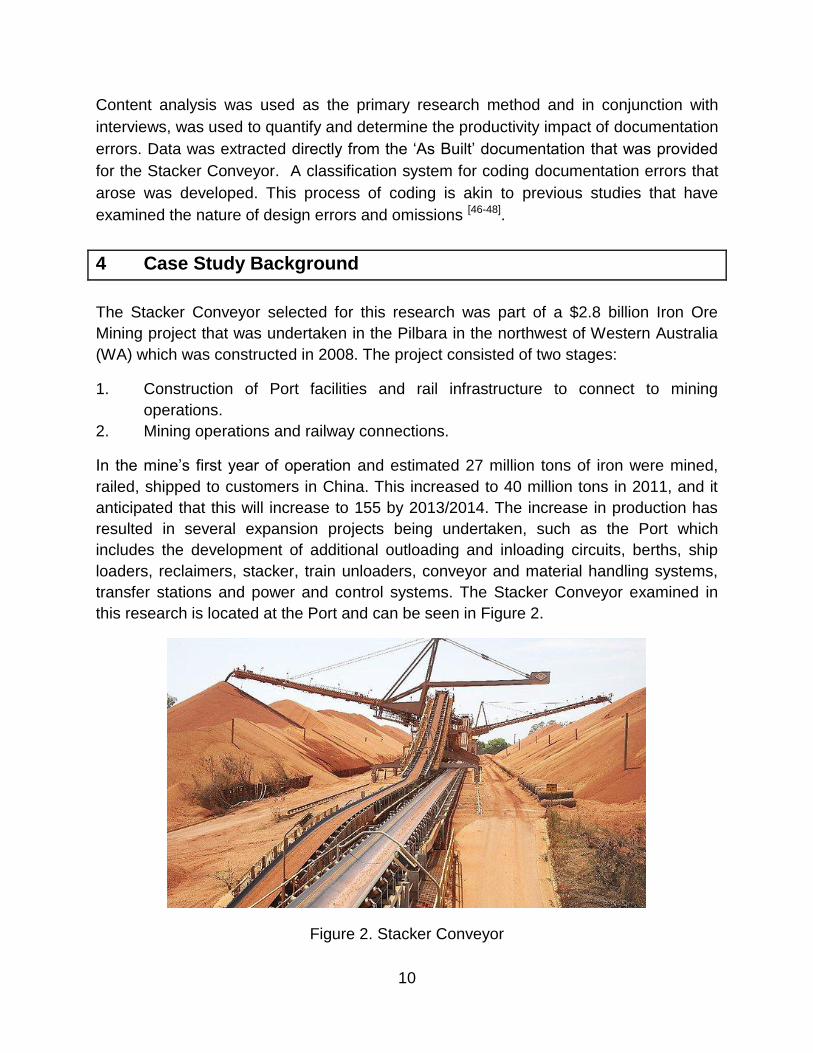
transfer stations and power and control systems. The Stacker Conveyor examined in
this research is located at the Port and can be seen in Figure 2.
Figure 2. Stacker Conveyor
11
The Port expansion cost $486 million, with $59.3 million being dedicated to the EPCM,
of which approximately 35% ($20.76 million) was expended on the electrical related
design, and documentation.
5 Research Findings
The 106 drawings and cable schedule for the iron ore conveyor used in this study were
denoted as being ‘As Built’. The 106 drawings can be classified into 4 diagram types:
(1) Block, (2) Schematic (3) Termination and (4) Layout. The 107 documents describe
the function of the iron ore conveyer and its affiliated equipment and facilities which
include 469 components and 589 cables. The 107 documents account for 5% of all the
electrical documents issued for the port’s facilities.
Analysis of these documents revealed that numerous errors and inconsistencies were
prevalent even though they should reflect all the changes made in to the specifications
and working drawings during the construction process as well as the exact location of all
elements of work. If these documents were issued ‘For Construction’, then engineers
on-site would spend considerable amounts of time trying to understand them and then
would need to raise an RFI to confirm or clarify the issues that are identified. Moreover,
engineers on-site cannot work without authorized drawings. They must submit their
RFIs to the EPCM contractor on-site and wait for a response and the re-issue of new
drawings. There may also be occasions when issues contained on the drawings cannot
be understood by the engineer. In this particular case, the engineer may have to travel
several kilometres from the workface to the site office to resolve the situation, which
would result in considerable unproductive time being experienced.
Considering the errors contained in the ‘As Built’ drawings, it suggested that a
significant amount of RFIs and non-productive time must have occurred during the
actual installation process. Moreover, engineers on-site cannot work without authorized
drawings. They must submit their RFIs to the EPCM contractor on-site and wait for a
response and the re-issue of new drawings. It is not feasible to determine the non-
productive time that occurred, but an estimate of productivity loss can be determined to
attend to the ‘As Built’ drawings
12
5.1 Error Classification
The classification of error types provides a platform for their quantification. The analysis
of data derived from interviews and documentation for the selected case study enabled
seven classifications of error to be identified and subsequently quantified (Table 2):
1. Incorrect labeling: The names of the cables or components are labeled
incorrectly. For example, a cable name was labeled as MP46511-C-104 when it
should be MP46511-C-105
2. Inconsistent labeling: The names of the same cables or components are not
identical among different drawings. For example, in drawing 04900-EL-DR-
2001_6, a pull wire switch was labeled as PW23, while in drawing 04900-EL-DR-
2570_4, it was labeled PWS23.
3. Drawings omission: Cables and components were missing from some drawings.
For example, a 400V distribution board DB461L1 and its corresponding
connection cable DB461L1-P-01 were found to be missing from the drawing.
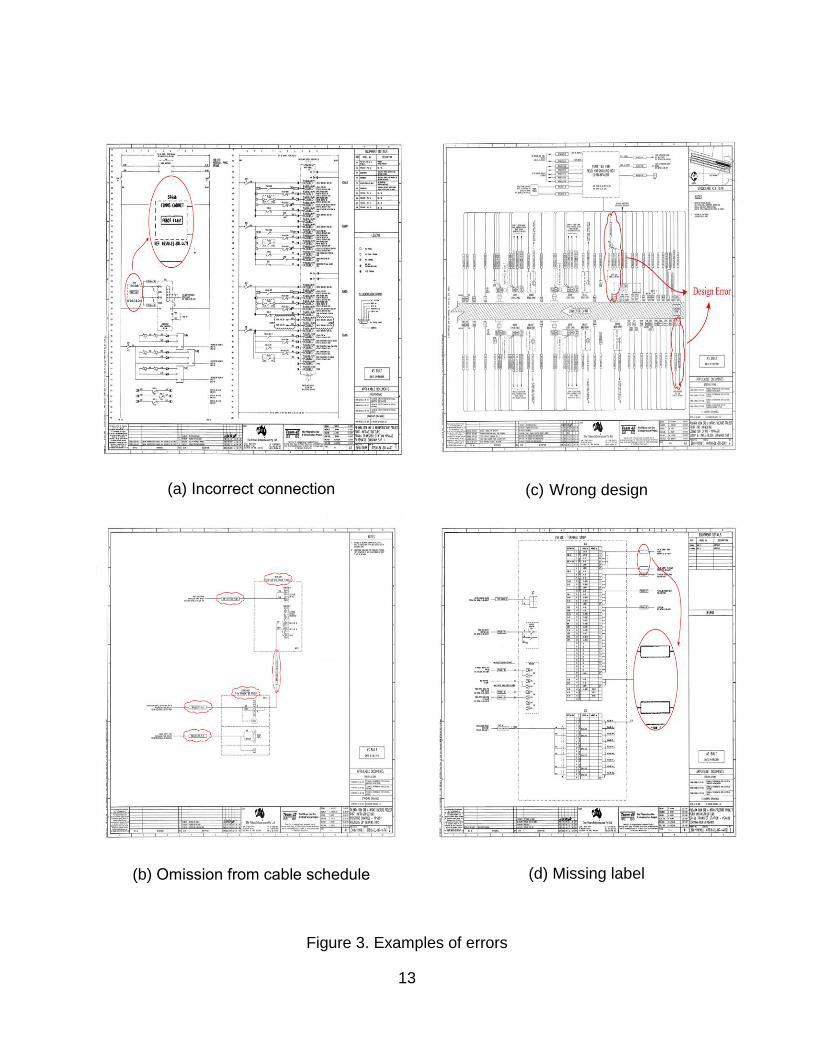
4. Incorrect connections: Cables or components were connected to wrong
connections (Figure 3a).
5. Cable schedule omissions: Incomplete information contained within the cable
schedule (Figure 3b).
6. Wrong design: cables and components are not meant to be designed on a
particular drawing (Figure 3c).
7. Missing labels: Cables or components are drawn on drawings but are not
labeled (Figure 3d).
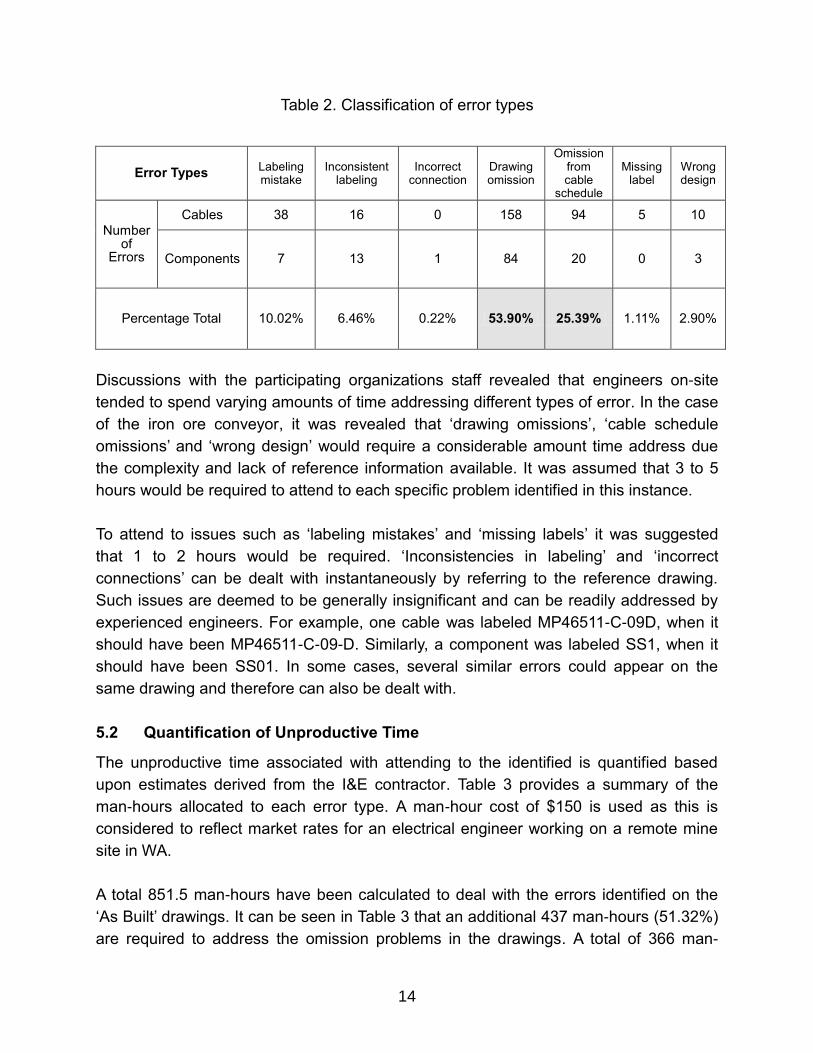
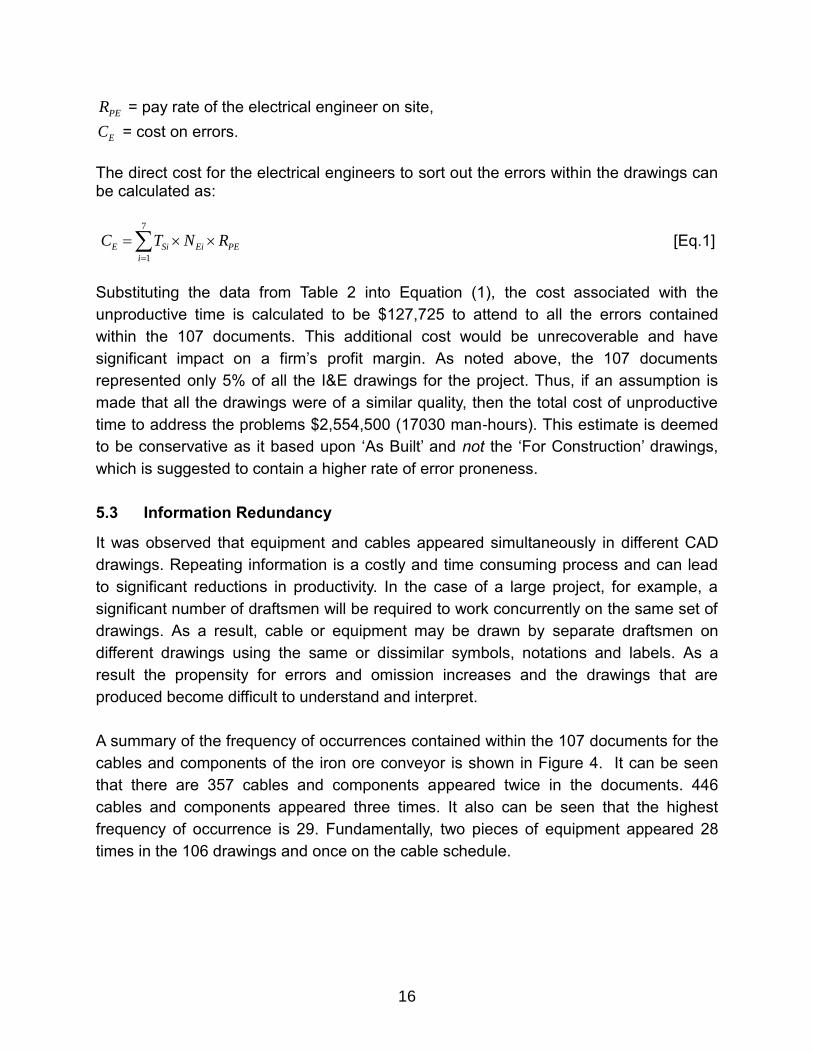
Drawing omissions were the most prevalent form of error identified (53.90%).From the
106 drawings used to install the electrical system for the conveyor belt, 158 cables and
84 components were found to have been omitted. The cable schedule is typically used
as the mechanism to extract materials and cable length and it was revealed that 94
cables and 20 components had been omitted (25.39%). If the contractor had simply
relied upon the supplied cable schedule from the consultants, then their tender price
would have been significantly ‘incorrect’. Moreover, the omitted components and cables
were deemed to have had long ‘lead-in’ times to procure. So, if the I&E services
contractor did not identify these omissions, then the likelihood of a project delay would
have be high.
13
(a) Incorrect connection
(b) Omission from cable schedule
(c) Wrong design
(d) Missing label
Figure 3. Examples of errors
14
Table 2. Classification of error types
Error Types Labeling mistake
Inconsistent labeling
Incorrect connection
Drawing omission
Omission from cable
schedule
Missing label
Wrong design
Number of
Errors
Cables 38 16 0 158 94 5 10
Components 7 13 1 84 20 0 3
Percentage Total 10.02% 6.46% 0.22% 53.90% 25.39% 1.11% 2.90%
Discussions with the participating organizations staff revealed that engineers on-site
tended to spend varying amounts of time addressing different types of error. In the case
of the iron ore conveyor, it was revealed that ‘drawing omissions’, ‘cable schedule
omissions’ and ‘wrong design’ would require a considerable amount time address due
the complexity and lack of reference information available. It was assumed that 3 to 5
hours would be required to attend to each specific problem identified in this instance.
To attend to issues such as ‘labeling mistakes’ and ‘missing labels’ it was suggested
that 1 to 2 hours would be required. ‘Inconsistencies in labeling’ and ‘incorrect
connections’ can be dealt with instantaneously by referring to the reference drawing.
Such issues are deemed to be generally insignificant and can be readily addressed by
experienced engineers. For example, one cable was labeled MP46511-C-09D, when it
should have been MP46511-C-09-D. Similarly, a component was labeled SS1, when it
should have been SS01. In some cases, several similar errors could appear on the
same drawing and therefore can also be dealt with.
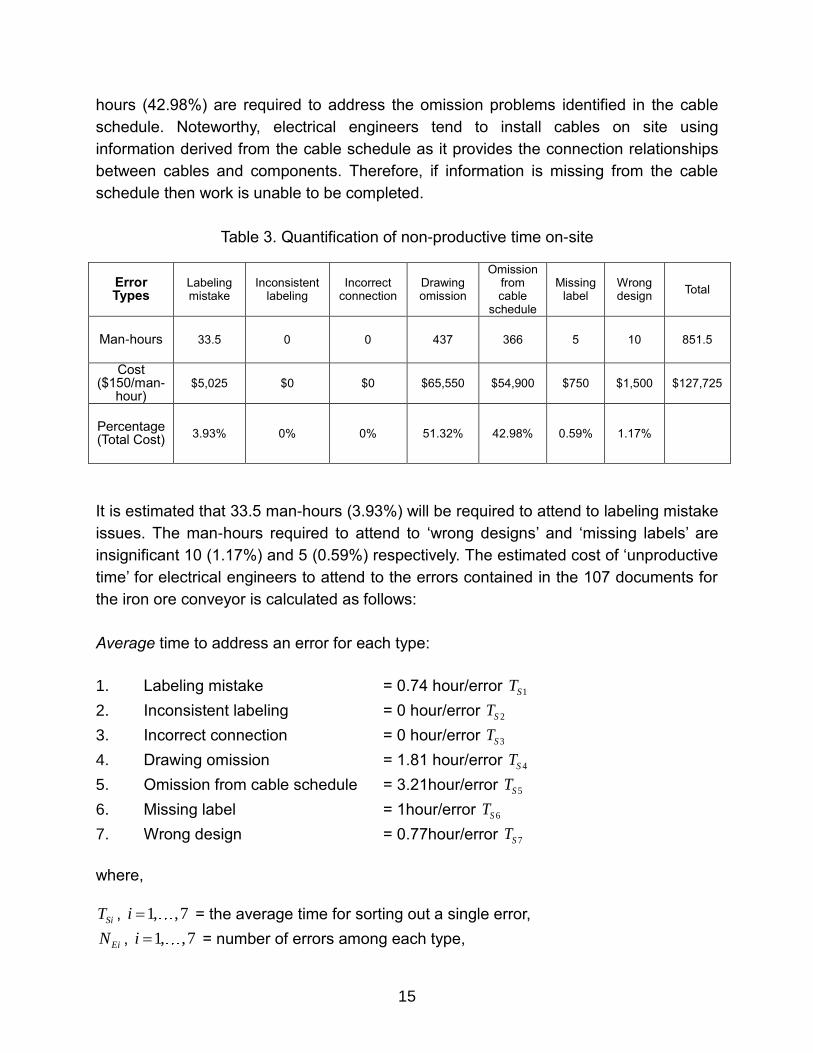
5.2 Quantification of Unproductive Time
The unproductive time associated with attending to the identified is quantified based
upon estimates derived from the I&E contractor. Table 3 provides a summary of the
man-hours allocated to each error type. A man-hour cost of $150 is used as this is
considered to reflect market rates for an electrical engineer working on a remote mine
site in WA.
A total 851.5 man-hours have been calculated to deal with the errors identified on the
‘As Built’ drawings. It can be seen in Table 3 that an additional 437 man-hours (51.32%)
are required to address the omission problems in the drawings. A total of 366 man-
15
hours (42.98%) are required to address the omission problems identified in the cable
schedule. Noteworthy, electrical engineers tend to install cables on site using
information derived from the cable schedule as it provides the connection relationships
between cables and components. Therefore, if information is missing from the cable
schedule then work is unable to be completed.
Table 3. Quantification of non-productive time on-site
Error Types
Labeling mistake
Inconsistent labeling
Incorrect connection
Drawing omission
Omission from cable
schedule
Missing label
Wrong design
Total
Man-hours 33.5 0 0 437 366 5 10 851.5
Cost ($150/man-
hour) $5,025 $0 $0 $65,550 $54,900 $750 $1,500 $127,725
Percentage (Total Cost)
3.93% 0% 0% 51.32% 42.98% 0.59% 1.17%
It is estimated that 33.5 man-hours (3.93%) will be required to attend to labeling mistake
issues. The man-hours required to attend to ‘wrong designs’ and ‘missing labels’ are
insignificant 10 (1.17%) and 5 (0.59%) respectively. The estimated cost of ‘unproductive
time’ for electrical engineers to attend to the errors contained in the 107 documents for
the iron ore conveyor is calculated as follows:
Average time to address an error for each type:
1. Labeling mistake = 0.74 hour/error 1ST
2. Inconsistent labeling = 0 hour/error 2ST
3. Incorrect connection = 0 hour/error 3ST
4. Drawing omission = 1.81 hour/error 4ST
5. Omission from cable schedule = 3.21hour/error 5ST
6. Missing label = 1hour/error 6ST
7. Wrong design = 0.77hour/error 7ST
where,
SiT , 1, ,7i = the average time for sorting out a single error,
EiN , 1, ,7i = number of errors among each type,
16
PER = pay rate of the electrical engineer on site,
EC = cost on errors.
The direct cost for the electrical engineers to sort out the errors within the drawings can be calculated as:
7
1
E Si Ei PE
i
C T N R
[Eq.1]
Substituting the data from Table 2 into Equation (1), the cost associated with the
unproductive time is calculated to be $127,725 to attend to all the errors contained
within the 107 documents. This additional cost would be unrecoverable and have
significant impact on a firm’s profit margin. As noted above, the 107 documents
represented only 5% of all the I&E drawings for the project. Thus, if an assumption is
made that all the drawings were of a similar quality, then the total cost of unproductive
time to address the problems $2,554,500 (17030 man-hours). This estimate is deemed
to be conservative as it based upon ‘As Built’ and not the ‘For Construction’ drawings,
which is suggested to contain a higher rate of error proneness.
5.3 Information Redundancy
It was observed that equipment and cables appeared simultaneously in different CAD
drawings. Repeating information is a costly and time consuming process and can lead
to significant reductions in productivity. In the case of a large project, for example, a
significant number of draftsmen will be required to work concurrently on the same set of
drawings. As a result, cable or equipment may be drawn by separate draftsmen on
different drawings using the same or dissimilar symbols, notations and labels. As a
result the propensity for errors and omission increases and the drawings that are
produced become difficult to understand and interpret.
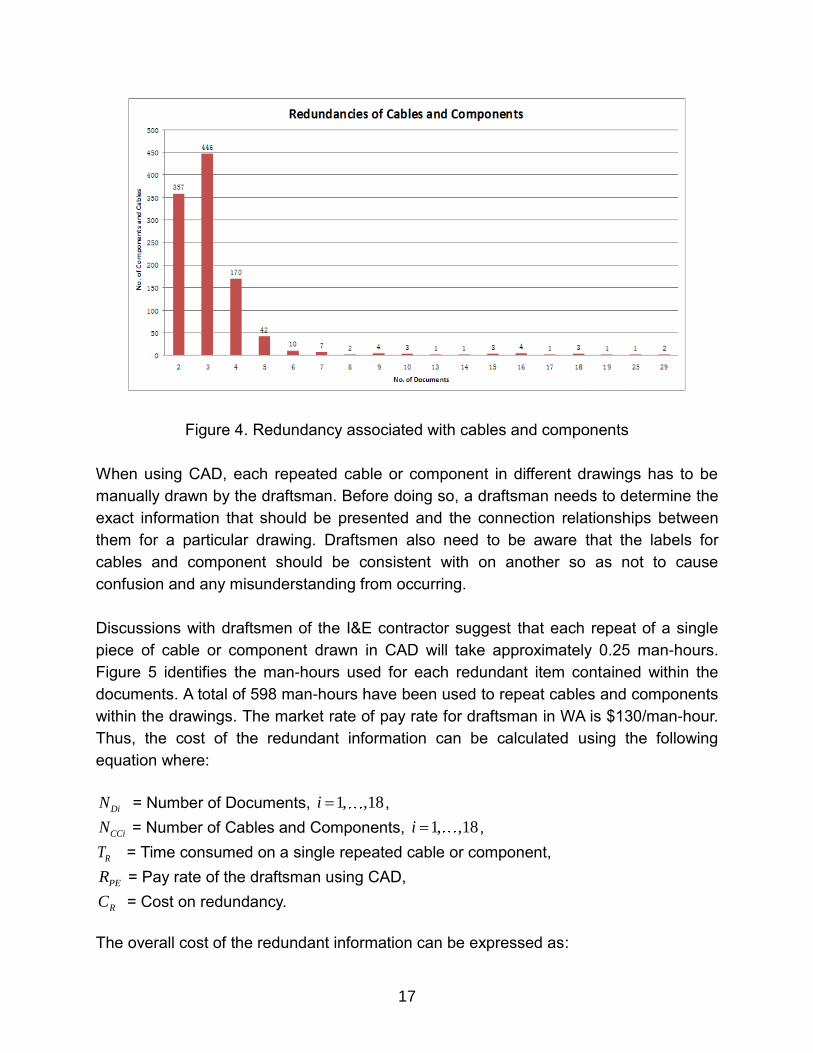
A summary of the frequency of occurrences contained within the 107 documents for the
cables and components of the iron ore conveyor is shown in Figure 4. It can be seen
that there are 357 cables and components appeared twice in the documents. 446
cables and components appeared three times. It also can be seen that the highest
frequency of occurrence is 29. Fundamentally, two pieces of equipment appeared 28
times in the 106 drawings and once on the cable schedule.
17
Figure 4. Redundancy associated with cables and components
When using CAD, each repeated cable or component in different drawings has to be
manually drawn by the draftsman. Before doing so, a draftsman needs to determine the
exact information that should be presented and the connection relationships between
them for a particular drawing. Draftsmen also need to be aware that the labels for
cables and component should be consistent with on another so as not to cause
confusion and any misunderstanding from occurring.
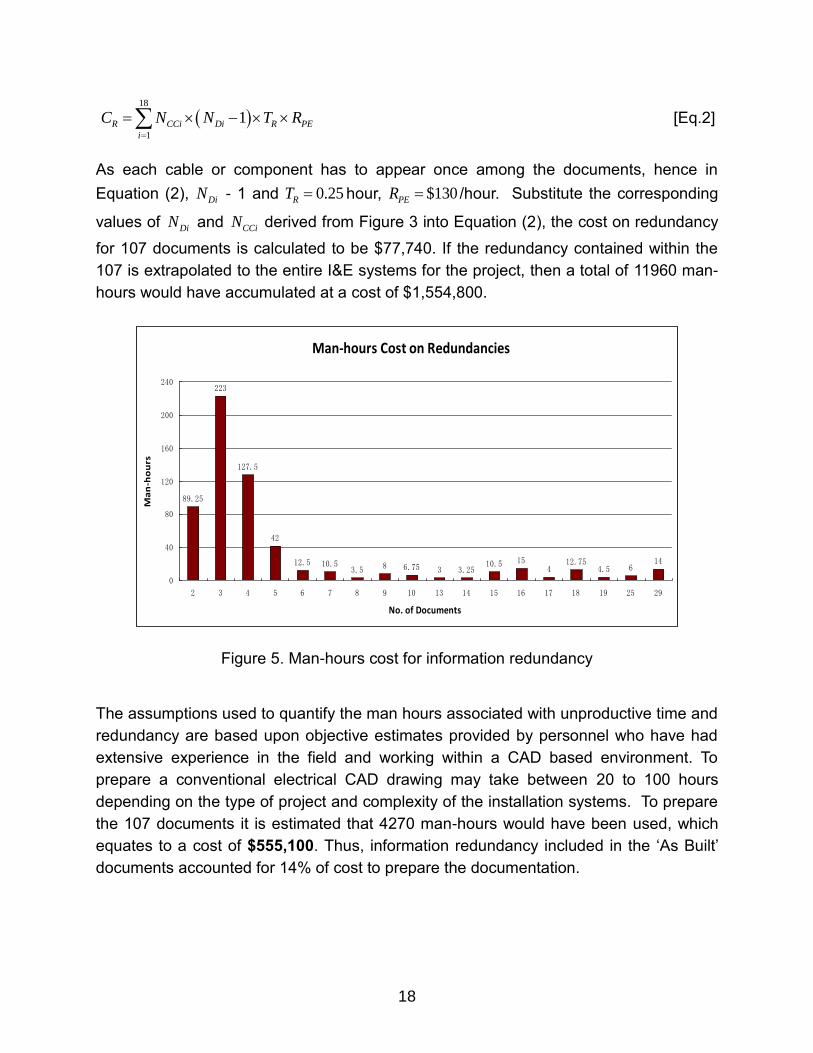
Discussions with draftsmen of the I&E contractor suggest that each repeat of a single
piece of cable or component drawn in CAD will take approximately 0.25 man-hours.
Figure 5 identifies the man-hours used for each redundant item contained within the
documents. A total of 598 man-hours have been used to repeat cables and components
within the drawings. The market rate of pay rate for draftsman in WA is $130/man-hour.
Thus, the cost of the redundant information can be calculated using the following
equation where:
DiN = Number of Documents, 1, ,18i ,
CCiN = Number of Cables and Components, 1, ,18i ,
RT = Time consumed on a single repeated cable or component,
PER = Pay rate of the draftsman using CAD,
RC = Cost on redundancy.
The overall cost of the redundant information can be expressed as:
18
18
1
1R CCi Di R PE
i
C N N T R
[Eq.2]
As each cable or component has to appear once among the documents, hence in
Equation (2), DiN - 1 and 0.25RT hour, $130PER /hour. Substitute the corresponding
values of DiN and CCiN derived from Figure 3 into Equation (2), the cost on redundancy
for 107 documents is calculated to be $77,740. If the redundancy contained within the
107 is extrapolated to the entire I&E systems for the project, then a total of 11960 man-
hours would have accumulated at a cost of $1,554,800.
Figure 5. Man-hours cost for information redundancy
The assumptions used to quantify the man hours associated with unproductive time and
redundancy are based upon objective estimates provided by personnel who have had
extensive experience in the field and working within a CAD based environment. To
prepare a conventional electrical CAD drawing may take between 20 to 100 hours
depending on the type of project and complexity of the installation systems. To prepare
the 107 documents it is estimated that 4270 man-hours would have been used, which
equates to a cost of $555,100. Thus, information redundancy included in the ‘As Built’
documents accounted for 14% of cost to prepare the documentation.
Man-hours Cost on Redundancies
89.25
223
127.5
42
12.5 10.53.5 8 6.75 3 3.25
10.5 154
12.754.5 6
14
0
40
80
120
160
200
240
2 3 4 5 6 7 8 9 10 13 14 15 16 17 18 19 25 29
No. of Documents
Ma
n-h
ou
rs
19
6 Toward Productivity Improvement
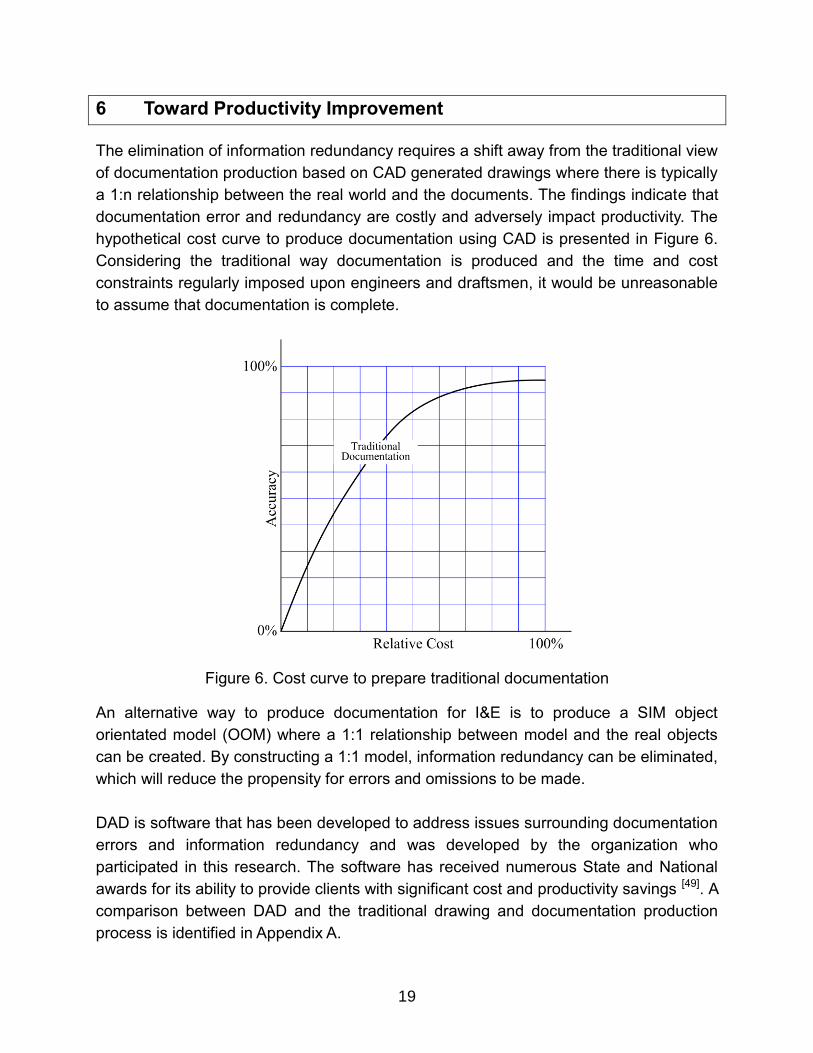
The elimination of information redundancy requires a shift away from the traditional view
of documentation production based on CAD generated drawings where there is typically
a 1:n relationship between the real world and the documents. The findings indicate that
documentation error and redundancy are costly and adversely impact productivity. The
hypothetical cost curve to produce documentation using CAD is presented in Figure 6.
Considering the traditional way documentation is produced and the time and cost
constraints regularly imposed upon engineers and draftsmen, it would be unreasonable
to assume that documentation is complete.
Figure 6. Cost curve to prepare traditional documentation
An alternative way to produce documentation for I&E is to produce a SIM object
orientated model (OOM) where a 1:1 relationship between model and the real objects
can be created. By constructing a 1:1 model, information redundancy can be eliminated,
which will reduce the propensity for errors and omissions to be made.
DAD is software that has been developed to address issues surrounding documentation
errors and information redundancy and was developed by the organization who
participated in this research. The software has received numerous State and National
awards for its ability to provide clients with significant cost and productivity savings [49]. A
comparison between DAD and the traditional drawing and documentation production
process is identified in Appendix A.
20
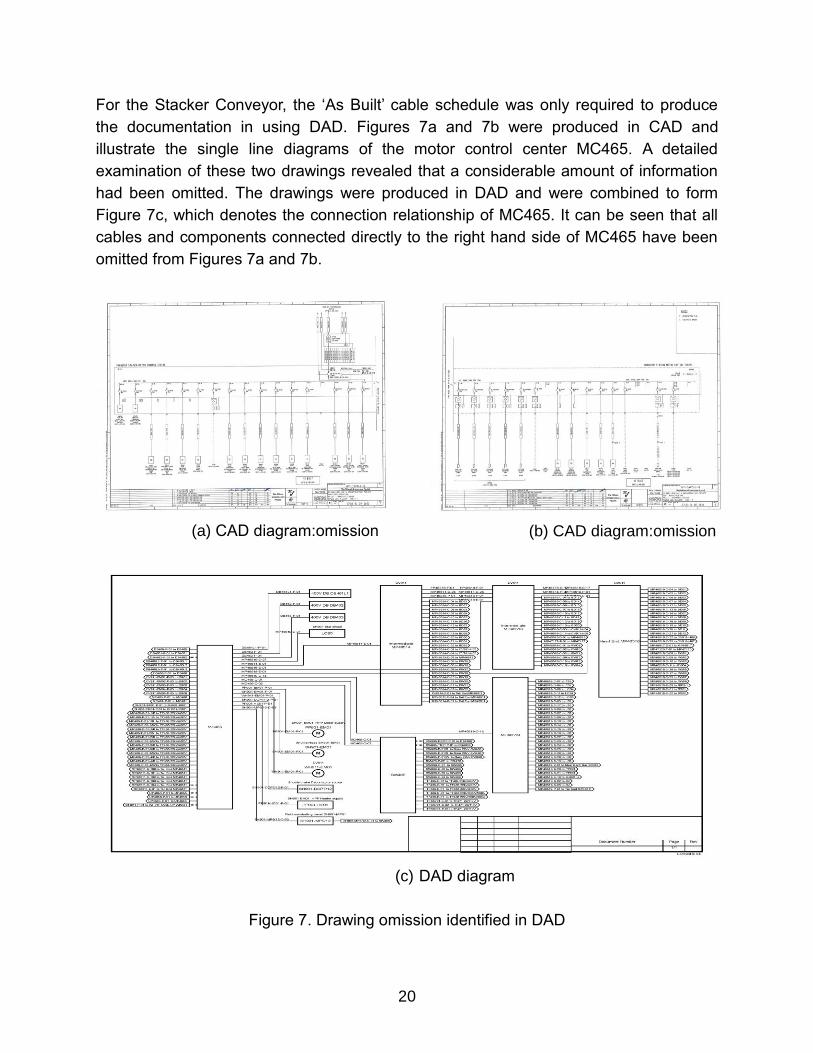
For the Stacker Conveyor, the ‘As Built’ cable schedule was only required to produce
the documentation in using DAD. Figures 7a and 7b were produced in CAD and
illustrate the single line diagrams of the motor control center MC465. A detailed
examination of these two drawings revealed that a considerable amount of information
had been omitted. The drawings were produced in DAD and were combined to form
Figure 7c, which denotes the connection relationship of MC465. It can be seen that all
cables and components connected directly to the right hand side of MC465 have been
omitted from Figures 7a and 7b.
(a) CAD diagram:omission
(b) CAD diagram:omission
(c) DAD diagram
Figure 7. Drawing omission identified in DAD
21
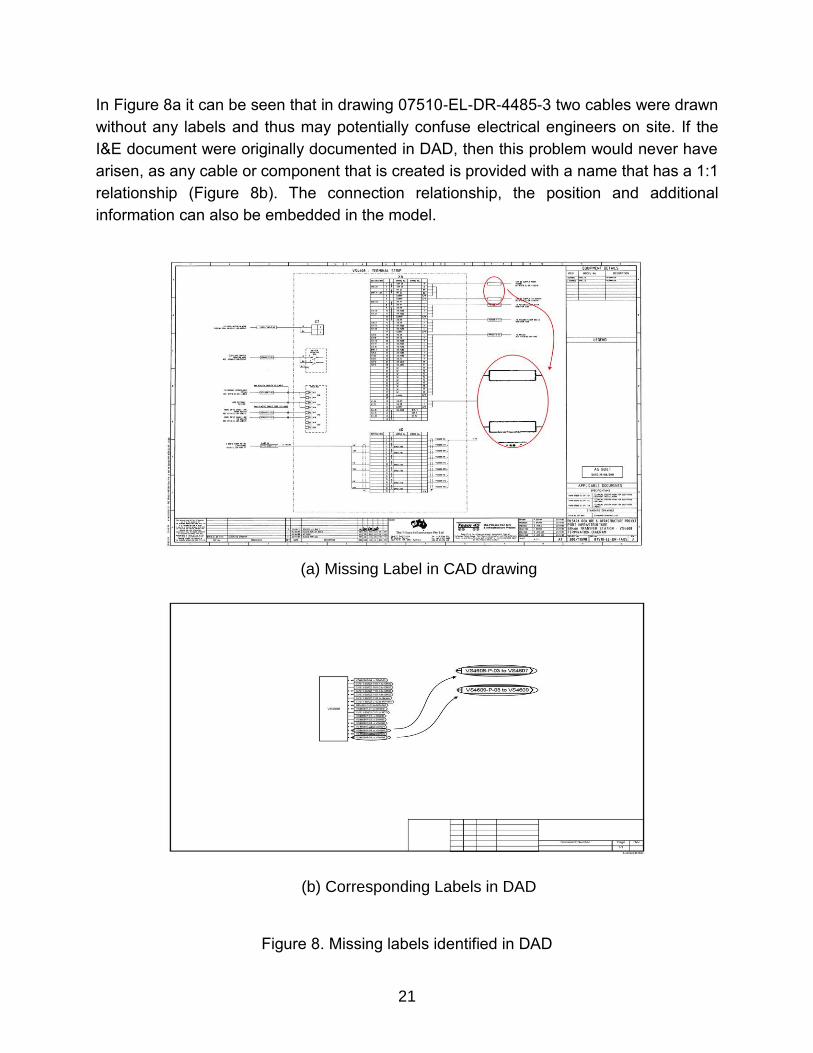
In Figure 8a it can be seen that in drawing 07510-EL-DR-4485-3 two cables were drawn
without any labels and thus may potentially confuse electrical engineers on site. If the
I&E document were originally documented in DAD, then this problem would never have
arisen, as any cable or component that is created is provided with a name that has a 1:1
relationship (Figure 8b). The connection relationship, the position and additional
information can also be embedded in the model.
(a) Missing Label in CAD drawing
(b) Corresponding Labels in DAD
Figure 8. Missing labels identified in DAD
22
Essentially, there are two methods to build models in DAD:
1. Extract information direct from cable schedule, assuming it is correct
2. Manually, assuming the correct relationship between cables and components is
established.
Once the object database is established within DAD, it can produce a variety of diagram
types (e.g., Block, Schematic, Termination, and Layout). All the drawings share
information from the constructed database and therefore design repetition for the same
component or cable is eliminated. If some aspects of the systems design are required
to be revised, then revisions can be undertaken by simply amending the database.
Consequently, there is no need to individually revise drawings, which is often the case
when using the conventional CAD based approach. Hence, man-hours are saved and
documentation errors are reduced.
6.1 Quantifying the Benefits of DAD
DAD was used to re-produce the ‘As Built’ drawings for the Stacker Conveyor using the
cable schedule. The cable schedule was used as it is the only traditional document
format that is able to provide a wide synopsis of the design as all cables and the
devices that they join together are listed. The cable schedule also provides a summary
of the complex information spread across all the other documents in a design package
and usually produced in an .XLS file that can be imported to DAD.
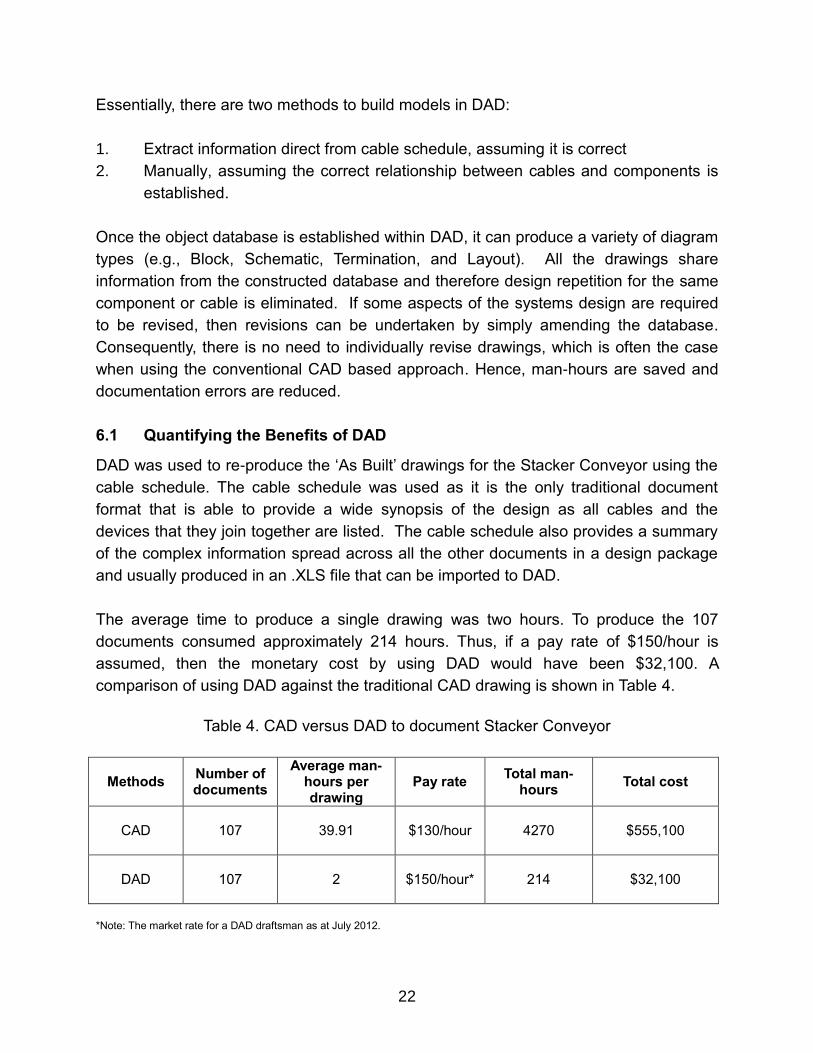
The average time to produce a single drawing was two hours. To produce the 107
documents consumed approximately 214 hours. Thus, if a pay rate of $150/hour is
assumed, then the monetary cost by using DAD would have been $32,100. A
comparison of using DAD against the traditional CAD drawing is shown in Table 4.
Table 4. CAD versus DAD to document Stacker Conveyor
Methods Number of documents
Average man-hours per drawing
Pay rate Total man-
hours Total cost
CAD
107
39.91 $130/hour 4270 $555,100
DAD
107
2 $150/hour* 214 $32,100
*Note: The market rate for a DAD draftsman as at July 2012.
23
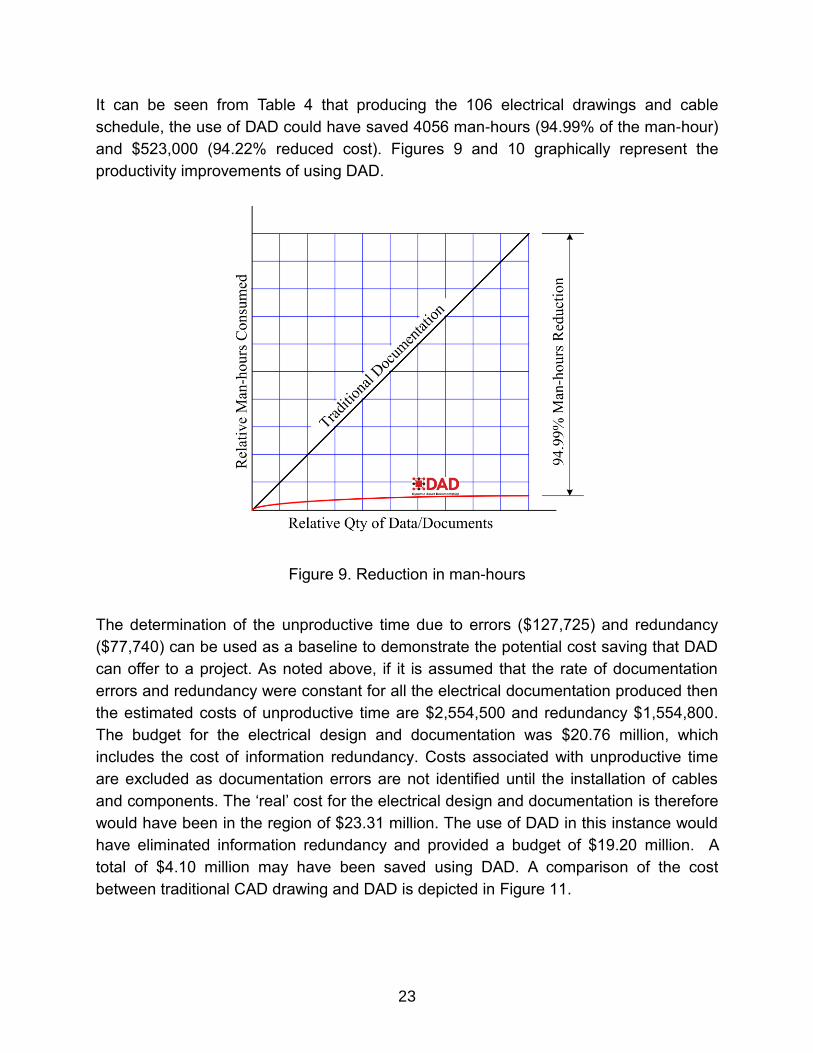
It can be seen from Table 4 that producing the 106 electrical drawings and cable
schedule, the use of DAD could have saved 4056 man-hours (94.99% of the man-hour)
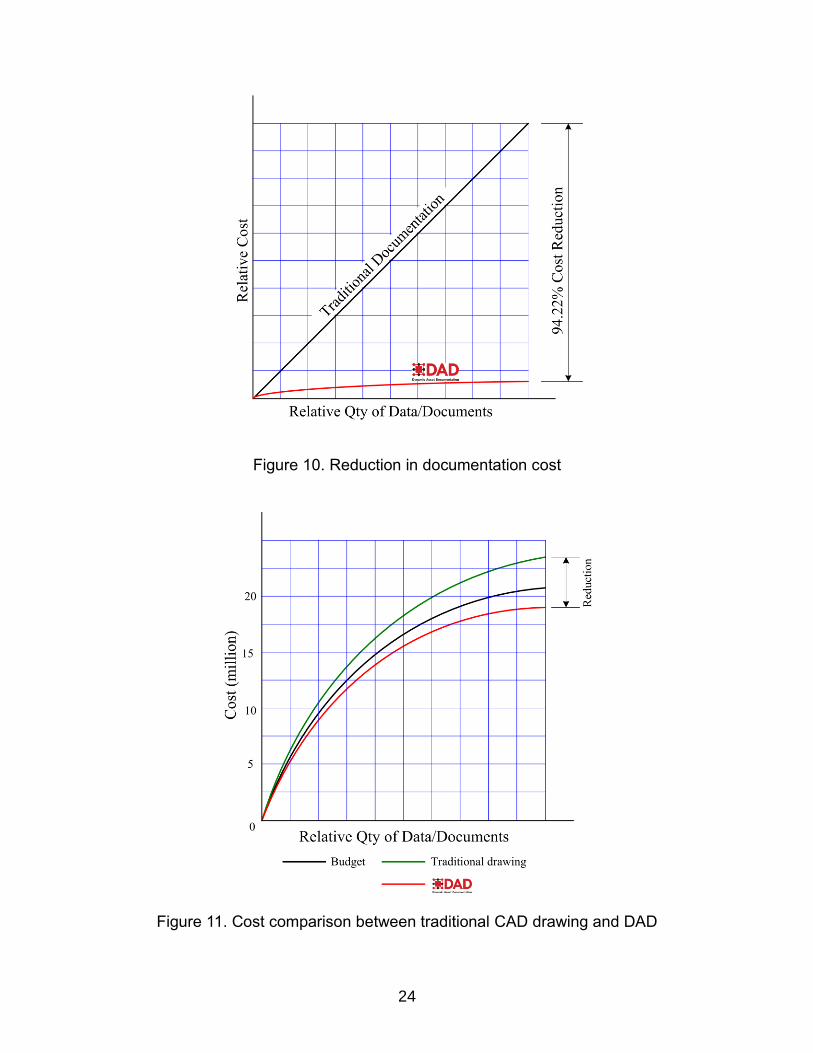
and $523,000 (94.22% reduced cost). Figures 9 and 10 graphically represent the
productivity improvements of using DAD.
Figure 9. Reduction in man-hours
The determination of the unproductive time due to errors ($127,725) and redundancy
($77,740) can be used as a baseline to demonstrate the potential cost saving that DAD
can offer to a project. As noted above, if it is assumed that the rate of documentation
errors and redundancy were constant for all the electrical documentation produced then
the estimated costs of unproductive time are $2,554,500 and redundancy $1,554,800.
The budget for the electrical design and documentation was $20.76 million, which
includes the cost of information redundancy. Costs associated with unproductive time
are excluded as documentation errors are not identified until the installation of cables
and components. The ‘real’ cost for the electrical design and documentation is therefore
would have been in the region of $23.31 million. The use of DAD in this instance would
have eliminated information redundancy and provided a budget of $19.20 million. A
total of $4.10 million may have been saved using DAD. A comparison of the cost
between traditional CAD drawing and DAD is depicted in Figure 11.
24
Figure 10. Reduction in documentation cost
Figure 11. Cost comparison between traditional CAD drawing and DAD
25
7 Research Limitations
The research adopted a PAR approach to quantify documentation errors in a set of
electrical documents for a Stacker Conveyor. The active involvement of staff from the
participating organization in the research process provided invaluable insights into the
mechanisms used to produce electrical documentation. The study was exploratory and
not definitive. The quantification process was time-consuming and only one case has
been examined which limits the generalizability of the reported findings. In addition, ‘As
Built’ drawings were used as the reference point, which did not truly reflect the extent of
the problem at hand. As a result this may affect the internal and external validity of the
study.
8 Conclusion
This has research has demonstrated that electrical documentation is produced
inefficiently and contains significant errors, omissions and inconsistencies. There is a
pressing need to re-evaluate the way in which I&E documentation is being produced if
significant productivity and cost savings are to be achieved. The need is evident from
the following results which have emerged from this initial study.
Analysis of 106 ‘As Built’ electrical drawings and a cable schedule for a Stacker
Conveyor revealed a variety of documentation errors manifested themselves as labeling
mistakes, inconsistent labeling, drawing omissions, omissions from the cable schedule,
missing labels, wrong design and incorrect connections. Omissions from drawings and
the cable schedule accounted for 93% of all errors identified. It was revealed through in-
depth discussions with staff from the participating organization that the reconciliation
process of an omission ranged from 3 to 5 hours before an RFI seeking clarification
could be sent to the consult engineer. This non-productive time leads to losses
productivity and increased costs. A total of 803 extra man-hours would have been
needed to address the omissions at a cost of $120,450. In the case of all documentation
errors at total of 851.5 extra man-hours would be required at a cost of $127,725.
During the analysis it was observed that there was considerable information redundancy
contained within the 107 electrical documents. For example, 357 items appeared twice
on drawings documents with as many as 42 items appearing five times. The creation of
the information redundancy contained within the 107 documents equates to an
additional 598 man-hours and a cost of $77,740.
26
The Stacker Conveyor’s “As Built’ cable schedule was converted into DAD to examine
how it would eliminate documentation errors and information redundancy. The average
time to produce a single drawing was two hours compared to the estimated 39 hours
using CAD. It is suggested that producing the 106 electrical drawings and cable schedule,
the use of DAD could have saved 4056 man-hours and $523,000. Therefore, a 94%
cost saving and improvement in productivity could have been attained in this particular
case.
8.1 Future Research
Integral to PAR is the need to bring about change so that on-going improvements can
be made. Before such improvements can be realized at project and industry level
further research is required to inform and educate practitioners about innate problems
that are being experienced with current documentation practices. Many engineering
organizations are reluctant to admit to problems with their existing documentation
systems and processes. Such a laissez-faire attitude has contributed to a culture of
complacency and what is in fact a chronic malaise embedded within the systems, and
processes of projects has become a ‘norm’.
A novel line of inquiry has been undertaken, which has provided the basis for further
studies into this important and fertile area. More case studies are required to examine
the extent of documentation error and information redundancy that prevails, particularly
for those drawings that are issued ‘For Construction’. An examination of the changes
between ‘For Construction’ and ‘As Built’ drawings as well as nature and volume of RFIs
generated by drawings produced in CAD in comparison to those in DAD would provide
additional insights into the productivity benefits that it can be realized in documentation
process.
27
References
[1] Tilley, P.A. and McFallan, S.L (2000). Design and documentation quality survey –
designers and contractors perspectives. BCE Doc 00/115, CSIRO Division of
Building, Construction and Engineering, Highett, Melbourne, Victoria, Australia
[2] Andi, S., and Minato, T. (2003). Design document quality in the Japanese
construction industry: factors influencing and impacts on the construction
process. International journal of Project Management, 21, pp.537-546.
[3] Love, P.E.D., Edwards, D.J., and Irani, Z. (2008). Forensic project management:
An exploratory examination of the causal behavior of design-induced error. IEEE
Transactions in Engineering Management, 55(2), pp.234-248
[4] Love, P.E.D., and Edwards, D.J. (2004). Determinants of rework in building
construction projects. Engineering, Construction and Architectural Management,
11(4), pp.259-274.
[5] Tilley, P.A. (2005). Lean design management – a new paradigm for managing
the design and documentation process to improve quality. Proceedings of the
13th International Group for Lean Construction (IGLC-13), July, Sydney, Australia
[6] Rowlinson, S. (1999). A definition of procurement systems. In. Rowlinson, S.,
and P. McDermott. Procurement Systems: A Guide to Best Practice in
Construction. E & F Spon, London, pp.27-53.
[7] Barrett, P. and Barrett, L. (2004). Revaluing Construction: Final Synthesis Report
on Workshops, University of Salford, UK cited in Tilley, P.A. (2005). Lean design
management – a new paradigm for managing the design and documentation
process to improve quality. Proceedings of the 13th International Group for Lean
Construction (IGLC-13), July, Sydney, Australia
[8] Love, P.E.D., Cheung, S.O., Irani, Z and Davis, P.R. (2011). Causal discovery
and inference of project disputes. IEEE Transactions on Engineering
Management 58(3), pp.400 – 411.
[9] Cusack, D. (1992). Implementation of ISO 9000 in Construction. In ISO 9000
Forum Symposium, Gold Coast, November, Australia
[10] Hibberd, P. (1980). Variations in Construction. Unpublished MSc Thesis,
University of Manchester Institute of Science and Technology, Manchester, UK
[11] Kirby, J.G., Douglas, A., and Hikks, D.K. (1988). Improvements in design review
management. ASCE Journal of Construction Engineering and Management,
114(1), pp.69-82.
[12] Gardiner, J. (1994). Management of design documentation, where do we go from
here? In Wakefield, R.R. and D.G. Carmichael (Ed.), Construction and
Management, Recent Advances, Balkema, Rotterdam, pp.113-118.
28
[13] McGeorge, J.F. (1988). Design productivity: a quality problem. ASCE Journal of
Management in Engineering, 4(4), pp.350-362.
[14] Tilley, P.A., Mohamed, S., and Wyatt, A. (1997). Indicators of design and
documentation efficiency. S.N. Tucker (Ed) Proceedings of the 5TH Annual OF
International Group for Lean Construction, 16th -17th July, Gold Coast, Australia
[15] Tilley, P.A., and Barton, R. (1997). Design and documentation deficiency –
causes and effects. Proceedings of the First International Conference on
Construction Process Re-engineering, Gold Coast, Australia, pp.703-712.
[16] Syam, A. (1995). Editorial. Journal of the Australian Institute of Steel
Construction, 29(3), p.1
[17] APCC (2003). Improving Project Documentation: A Guide to Improve Current
Practice, Australian Procurement and Construction Council Australian
Construction Form, October, Deakin West, ACT, Australia
[18] Love, P.E.D., Edwards, D.J. and Smith, J. (2006). Contract documentation and
the incidence of rework. Architectural Engineering and Design Management, 1,
pp.247-259.
[19] Love, P.E.D., Davis, P.R., Jasper, T., Lopez, R., Tresise, P., and Ellis, J.M.
(2009). Causal Ascription of Disputes in Construction Projects. Disputes
Avoidance and Resolution Program, CRC Construction Innovation, Report No.
2007-006-EP-02, Icon.Net Pty Ltd, Brisbane, QLD, Australia
[20] Matthews, W. (2005). RFI recommendations. Modern Steel Construction, 46(10)
(Available at www.modernsteel.com, accessed 22nd July, 2012)
[21] Tadt, E., Hanna, A., and Whited (2012). Best Practices from WisDOT Mega and
ARRA Projects – Request for Information: Benchmarks and Metrics. WisDOT
Policy Research Program Project, ID: 0092-1-20, Final Report, March 2012,
submitted to the Wisconsin Department of Transportation by the Construction
and Materials Support Center, University of Wisconsin, Wisconsin, USA
[22] Love, P.E.D. Edwards, D.J., Watson, H. and Davis, P.R. (2010). Rework in civil
engineering projects: Determination of cost predictors. ASCE Journal of
Construction, Engineering and Management 136(3), pp. 275-282.
[23] Lopez, R., and Love, P.E.D., (2012). Deign error costs in construction. ASCE
Journal of Construction, Engineering and Management 138(5), pp.585-594.
[24] Love, P.E.D. and Sing, C-P. (2012). Determining the probability distribution of
rework costs in construction and engineering Projects. Structure and
Infrastructure Engineering (In press)
[25] Evbuomwan, N. F. O. and Anumba, C. J., (1996). Towards a concurrent
engineering model for design-and-build projects. The Structural Engineer, 74(5),
73-78.
29
[26] Love, P.E.D., and Gunasekaran, A. (1997). Concurrent engineering in the
construction industry. Concurrent Engineering: Research Applications, 5(2),
pp.155-162.
[27] Arundachawat, P., Roy, R., Al-Ashaab, A., and Shebab, E. (2009). Design
rework prediction in concurrent design environment: current trends and future
research directions. Proceedings of the 19th CIRP Design Conference,
Competitive Design, 30th -31st March, Cranfield University, Cranfield, UK p.237-
244.
[28] Eastman, R.M. (1980). Engineering information release prior to final design
freeze. IEEE Transactions on Engineering Management, 27(2), pp.37-42
[29] Terwiesch, C.H., Loch, C.H., and Meyer, A.D. (2002). Exchanging preliminary
information in concurrent engineering: alternative coordination strategies, Journal
of Organisation Science, 13(4), pp.402-421.
[30] Krishnan, V., Eppinger, S.D., Whitney, D.E. (1997). A model-based framework to
overlap product development activities. Management Science, 43(4), pp.437-
451.
[31] DeFraites, A.A. Jnr. (1989). Fee versus quality. ASCE Journal of Professional
Issues in Engineering, 115(2), pp. 125-128.
[32] Lewis, L.G Jnr. (1999). Construction contingency; Standard of care vs. cost of
design errors and omissions. Engineering Times, February, p.23
[33] Construction Industry Institute, (1987). Costs of Quality in Design and
Construction, Source Document 29, RS-10-2, University of Texas, Austin, US
(Available at: https://www.construction-institute.org, Accessed 24th April 2012)
[34] National Research Council (1994). Responsibilities of Architects and Engineers
and Their Clients in Federal Facilities Development. Commission on Engineering
and Technical Systems, National Academies Press (Available at:
http://www.nap.edu, Accessed 24th April 2012)
[35] Baskerville, R. (1997). Distinguishing action research from participative case
studies. Journal of Systems and Information Technology, 1(1), pp25-45.
[36] Smith,L., Bratini, L., Chambers, A., Jensen, R.A., and Romero, L. (2010).
Between idealism and reality: Meeting the challenges of participatory action
research. Action Research, 8(4), pp.407-425.
[37] Peters, M., and Robinson, V. (1984). The origins and status of action research.
Journal of Applied Behavioural Science, 20(2), pp.113-124.
[38] Susman, G., and Evered, R. (1978). An assessment of the scientific merits of
action research. Administrative Science Quarterly, 23(4), pp.582-603.
[39] Israel, B., Schurman, S., Hugentobler, M.K (1992). Relationships between
organization members and communities. Journal of Applied Behavioral Science,
28, pp.74-101.
30
[40] Denzin, N.K. (1988). The Research Act: A Theoretical Introduction to
Sociological Methods. Third Edition, Prentice-Hall, Englewood Cliffs
[41] Black, T.R. (1993) Evaluating Social Science Research: An Introduction. Sage
Publications, London.
[42] Taylor, S.J., and Bogdan, R. (1984). Introduction to Qualitative Research
Methods. 2nd Wiley-Interscience Publications, USA.
[43] Robson, C. (1993). Real World Research: A Resource for Social Scientists and
Practitioner-Researchers. Blackwell Publishers, Oxford.
[44] Holsti, O. (1969). Content Analysis for the Social Sciences and Humanities.
Addison-Wesley, Reading, MA.
[45] Krippendorf, K. (1980). Content Analysis: An Introduction to its Methodology.
Sage, Newbury Park, London.
[46] Davis, K., Ledbetter, W.D., and Burati, J.L. (1989). Measuring design and
construction quality costs. ASCE Journal of Construction Engineering and
Management, 115(3), pp.385-400.
[47] Abdul-Rahman, H (1997). Some observations on the issues of quality cost in
construction. International Journal of Quality and Reliability Management, 14(5),
pp.464-481.
[48] Nylén, K-O. (1996). Cost of Failure in a Major Civil Engineering Project.
Licentiate Thesis, Division of Construction Management and Economics,
Department of Real Estate and Construction Management, Royal Institute of
Technology, Stockholm, Sweden.
[49] Dynamic Asset Documentation (http://www.dad.net.au/v10.0/)
31
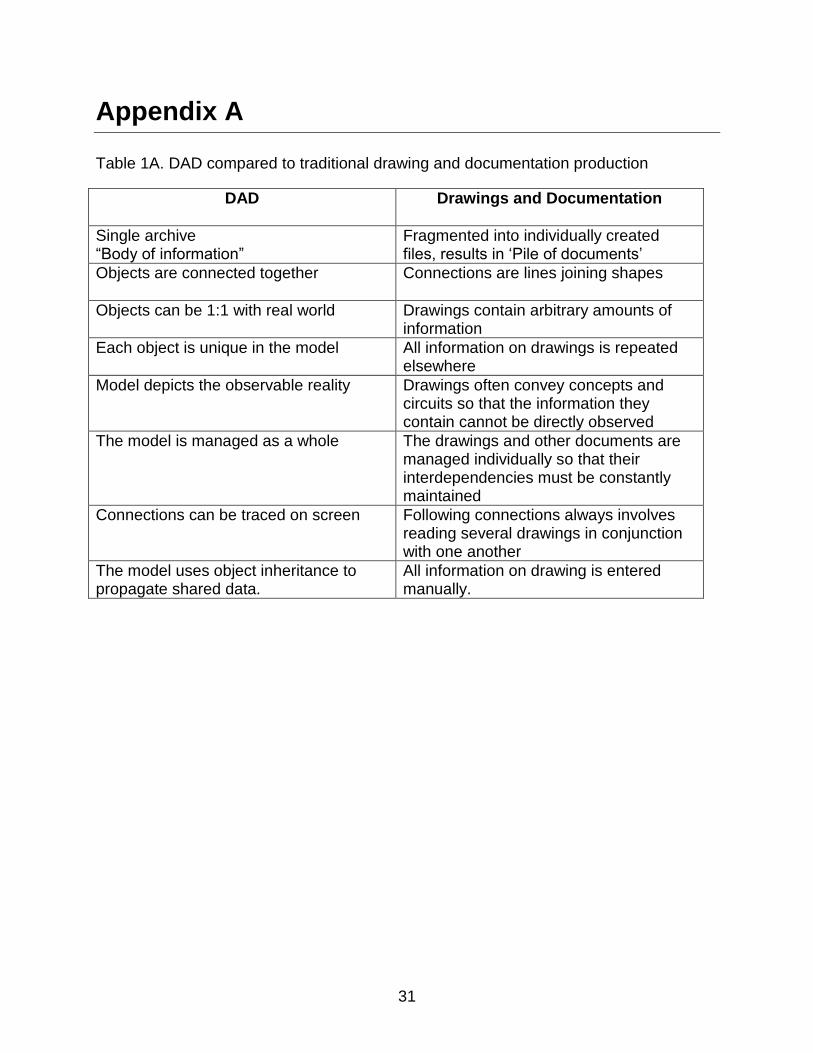
Appendix A
Table 1A. DAD compared to traditional drawing and documentation production
DAD
Drawings and Documentation
Single archive “Body of information”
Fragmented into individually created files, results in ‘Pile of documents’
Objects are connected together
Connections are lines joining shapes
Objects can be 1:1 with real world Drawings contain arbitrary amounts of information
Each object is unique in the model All information on drawings is repeated elsewhere
Model depicts the observable reality Drawings often convey concepts and circuits so that the information they contain cannot be directly observed
The model is managed as a whole The drawings and other documents are managed individually so that their interdependencies must be constantly maintained
Connections can be traced on screen Following connections always involves reading several drawings in conjunction with one another
The model uses object inheritance to propagate shared data.
All information on drawing is entered manually.