evaluation of potential pm2.5 reductions … 3-1. comparison of annual point source emissions by...
TRANSCRIPT
PECHAN
5528-B Hempstead Way Springfield, VA 22151
703-813-6700 telephone 703-813-6729 facsimile
3622 Lyckan Parkway Suite 2002 Durham, NC 27707
919-493-3144 telephone 919-493-3182 facsimile
P.O. Box 1345 El Dorado, CA 95623
530-672-0441 telephone 530-672-0504 facsimile
PM
PMEVALUATION OF POTENTIAL
2.5 REDUCTIONS BY IMPROVING PERFORMANCE OF CONTROL DEVICES:
2.5 EMISSION ESTIMATES
FINAL REPORT
Prepared for:
U.S. Environmental Protection Agency Research Triangle Park, NC 27711
Prepared by:
E.H. Pechan & Associates, Inc. 3622 Lyckan Parkway, Suite 2002 Durham, NC 27707
and
RTI International 3040 Cornwallis Road Research Triangle Park, NC 27709-2194
EPA Contract No. 68-D-00-265 Work Assignment 4-52 Pechan Report No. 05.08.003/9012-452
September 27, 2005

[This page intentionally left blank.]
PECHAN September 27, 2005
CONTENTS Page
TABLES ........................................................................................................................................ iv FIGURES ....................................................................................................................................... iv ACRONYMS AND ABBREVIATIONS ........................................................................................v PM2.5 EMISSION ESTIMATES .....................................................................................................1
1. INTRODUCTION ........................................................................................................1 2. BACKGROUND ON PM2.5 EMISSION MEASUREMENTS....................................1 3. 2002 DRAFT NEI PM2.5 EMISSION ESTIMATES....................................................4 4. DEVELOPMENT OF REFINED POINT SOURCE PM2.5 EMISSION
ESTIMATES ................................................................................................................6 4.1 Estimating PM25-PRI Emissions based on Reported Filterable and
Condensable Emissions..................................................................................... 6 4.2 Adding PM25-PRI Emissions based on Reported PM-FIL Emissions.............. 8 4.3 Verifying Control Status Designations .............................................................. 8 4.4 Other Adjustments to the 2002 Draft NEI Data................................................. 9
4.4.1 Coal Storage/Transfer Operations ............................................................ 9 4.4.2 Paved and Unpaved Roads ..................................................................... 10 4.4.3 Selected Uncontrolled Emission Sources ............................................... 10 4.4.4 Sources Controlled with Wet Scrubbers................................................. 10 4.4.5 Glass Melting at Techneglas .................................................................. 10
4.5 Uncertainty in PM2.5 Point Source Emission Estimates................................... 11 4.5.1 Impact of Assumed Ratio of PM25-FIL to PM25-PRI (“Low
Estimate”) ............................................................................................... 12 4.5.2 Impact of Misreporting PM25-FIL as PM25-PRI (“High Estimate”).... 12
4.6 Summary of Refined PM2.5 Point Source Emission Estimates ........................ 13 5. DEVELOPMENT OF NONPOINT AND MOBILE SOURCE PM2.5 EMISSION
ESTIMATES ..............................................................................................................14 5.1 Nonpoint Source Emission Estimates from NEI.............................................. 14 5.2 Application of Transportable Fractions to Nonpoint Fugitive Dust Categories
.......................................................................................................................... 15 5.3 Mobile Source Emission Estimates from NEI ................................................. 16
6. SIGNIFICANCE OF CONTROLLED POINT SOURCE PM2.5 EMISSIONS .........17 7. ESTIMATE OF UPPER AND LOWER BOUND OF DEGREE OF
IMPROVEMENT .......................................................................................................21 7.1 Breakdown of Controlled PM25-PRI Emissions According to Industry Sectors
.......................................................................................................................... 21 7.2 Existing Controls.............................................................................................. 22 7.3 Additional Reductions Associated with Improved Methods and Modifications
(Lower Bound) ................................................................................................. 23 7.4 Additional Reductions Associated with Innovative Controls (Upper Bound) 26 7.5 Calculated Emission Reductions for Each NAA ............................................. 30
8. REFERENCES ...........................................................................................................30
Pechan Report No. 05.08.003/9012-452 iii
PECHAN September 27, 2005
TABLES
Table 3-1. Comparison of Annual Point Source Emissions by PM2.5 Nonattainment Area and State ........................................................................................................................................5
Table 4-1. Test Data Concerning the Significance of PM-CON in PM-PRI..................................7 Table 4-2. “Best-Estimate” PM25-PRI Point Source Emissions for the 16 NAAs ......................13 Table 4-3. Uncertainty in PM25-PRI Point Source Emissions for the 16 NAAs .........................14 Table 5-1. Nonpoint Source Categories to Which Fugitive Dust Transport Factors were Applied
to PM10-FIL Emissions .......................................................................................................15 Table 5-2. Comparison of Draft 2002 Nonpoint NEI PM25-FIL Emissions Before and After
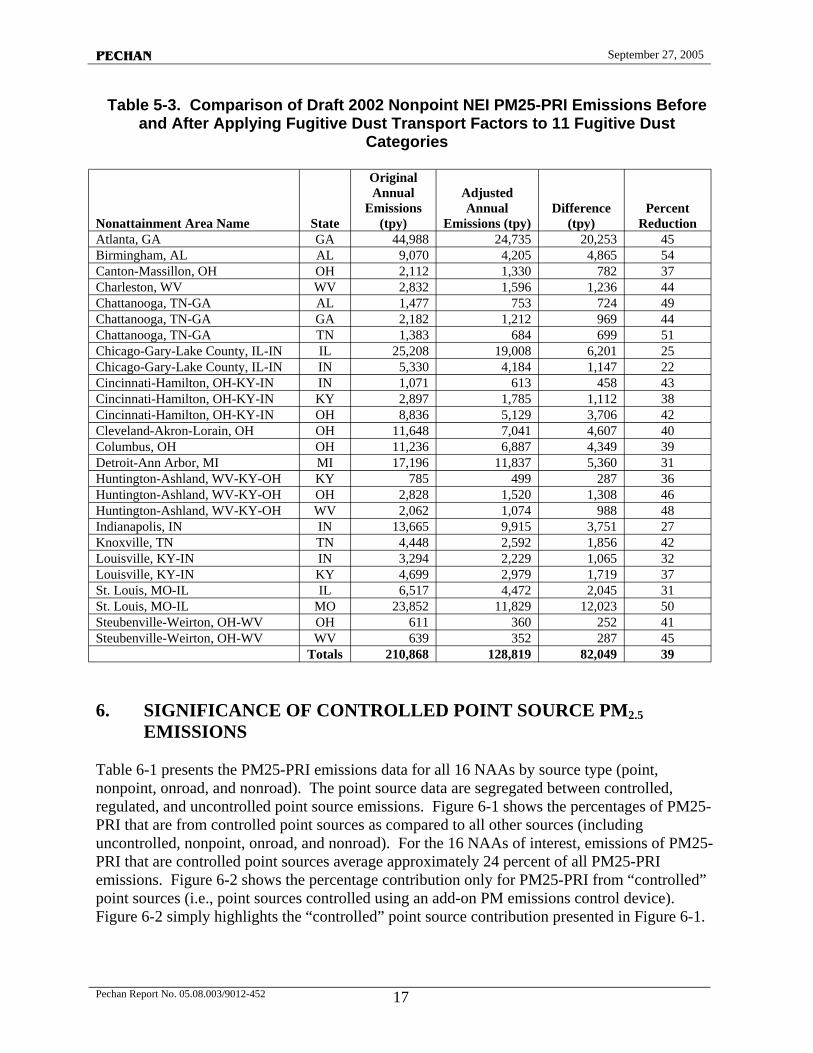
Applying Fugitive Dust Transport Factors to 11 Fugitive Dust Categories ........................16 Table 5-3. Comparison of Draft 2002 Nonpoint NEI PM25-PRI Emissions Before and After
Applying Fugitive Dust Transport Factors to 11 Fugitive Dust Categories ........................17 Table 6-1. Comparison of PM25-PRI Emissions by Source Type ...............................................18 Table 7-1. Source Classification Code (SCC) Breakdown for PM25-PRI Emissions .................22 Table 7-2. Control Code Breakdown for PM25-PRI Emissions...................................................23 Table 7-3. Estimated Emission Reductions Achieved by Improved Methods and Control Device
Modifications .......................................................................................................................29 Table 7-4. Estimated Emission Reductions Achieved by Innovative Controls ............................29 Table 7-5. Calculated Emissions After Implementation of Control Device Improvements.........30
FIGURES
Figure 6-1 Breakdown of PM25-PRI Emissions According to Source Type by NAA ............... 18 Figure 6-2. Point Source “Controlled” Emissions as a Percentage of Total PM25-PRI Emissions
from All Sources by NAA................................................................................................... 19 Figure 6-3. Contribution of PM25-PRI Point Source Emissions by Control Status and NAA .. 20 Figure 6.4 Emissions of PM25-PRI versus Number of Emission Points .................................... 20
Pechan Report No. 05.08.003/9012-452 iv
PECHAN September 27, 2005
ACRONYMS AND ABBREVIATIONS
acfm actual cubic feet per minute BOF basic oxygen furnace CAIR Clean Air Interstate Rule COHPAC Compact Hybrid Particulate Collector DSI dry sorbent injection EGU electrical generating unit EPA United States Environmental Protection Agency FF fabric filter FGD flue gas desulfurization ft2 square feet ESP electrostatic precipitator MACT maximum achievable control technology MW megawatt µm micrometer NAA nonattainment area NAAQS National Ambient Air Quality Standard NEI National Emissions Inventory PM particulate matter PPS polyphensulfide PTFE polytetrafluoroethene ROPE Rapid Onset Pulsed Energization SCA specific collection area SIP state implementation plan SO3 sulfur trioxide tpy tons per year TSP total suspended particulates W watts WS wet scrubber
Pechan Report No. 05.08.003/9012-452 v

[This page intentionally left blank.]
PECHAN September 27, 2005
PM2.5 EMISSION ESTIMATES
1. INTRODUCTION
The United States Environmental Protection Agency (EPA) is evaluating emissions reduction strategies for implementing the 1997 PM2.5 National Ambient Air Quality Standard (NAAQS) (PM2.5, also written as PM2.5, is particulate matter (PM) that is less than 2.5 micrometers (µm) in diameter). Effective April 5, 2005, EPA completed the “designation” process in which EPA formally announced the areas of the country that are not attaining the PM2.5 standards. States are required to develop and submit implementation plans (SIPs) to bring these areas into attainment. The SIPs will be due to EPA in April 2008 and must provide for attainment by April 2010 (based upon data for the 2007-2009 time period) unless EPA approves an extension of the time period to a date which may not be later than 2014.
EPA is investigating ways to reduce direct (primary) PM2.5 emissions in areas that likely will not attain the PM2.5 standards even after the Clean Air Interstate Rule (CAIR) is fully implemented. One possible way of reducing PM2.5 emissions would be to modify existing control devices to improve their performance in reducing the “fine” (less than 2.5 µm) fraction of particulate matter.
The purpose of this task is to estimate PM2.5 emissions from controlled stationary sources in 16 urban areas that are projected to exceed the PM2.5 ambient standards in 2010. In addition, the results of an extensive literature search and other sources were used to estimate the degree to which improving or replacing emission controls could reduce PM2.5 emissions. Specifically, the objectives were to develop:
• An estimate of PM2.5 emissions from stationary sources that are currently controlled for particulate matter (for each of the 16 urban areas and as an aggregate);
• An estimate of the fraction of PM2.5 emissions for each urban area that is controlled for particulate matter based on total PM2.5 emissions from all sources (including mobile) and also based on the total PM2.5 emissions from stationary sources; and
• An estimate of the upper and lower bound of the degree to which improving or replacing these controls would reduce PM2.5 emissions (including condensable fraction) for each urban area based on data reported in the literature for these sources.
2. BACKGROUND ON PM2.5 EMISSION MEASUREMENTS
The primary source of emission estimates is the 2002 draft National Emissions Inventory (NEI) that EPA released for review by the state and local agencies during February 2005. In order to understand the emission estimates reported in the NEI, some background on the PM emission measurement methods is important for understanding the technical approach used to develop the final emission estimates and emission reductions.
EPA Method 5 (including its variations in Methods 5A through 5I) is the most commonly used test method for measuring PM emission from stationary sources. Method 5 actually measures Pechan Report No. 05.08.003/9012-452 1
PECHAN September 27, 2005
total suspended particulates (TSP) as there is no prefilter or cyclone to remove particulates with a mean aerodynamic diameter of greater than 10 µm. Nonetheless, Method 5 results are often reported as PM10. For some sources, this may be a reasonable estimate, but it is likely to overestimate the actual PM10 emission for some sources as this method of “reporting” assumes that all TSP are less than 10 µm in diameter.
EPA Method 5 utilizes a heated sampling line where the probe and filter portion of the sampling train are kept at 120 ºC (250 ºF). After the filter, the sampled exhaust gas flows through a series of impingers that are kept in an ice bath. The primary purpose of these impingers in the Method 5 sampling train is to measure the water content of the sampled exhaust gas. These impingers also cool the sampled exhaust gas, which can cause certain chemicals that are gaseous at 120 ºC (250 ºF) to condense at lower temperatures within the impingers [the final exhaust gas from the Method 5 sampling train is to be less than 20 ºC (68 ºF)]. Conventionally, Method 5 sampling measures PM that is contained in the sampling probe and filter, which is often referred to as the “front-half” or “filterable” PM catch. PM that condenses in the impinger section of the probe are often referred to as the “back half” PM catch or the “condensable” PM.
This discussion reflects the fact that particulate matter is not an absolute quantity. It is a function of temperature and pressure. According to EPA Method 17:
“Of the two variables (i.e., temperature and pressure), temperature has the greater effect upon the amount of PM in an effluent gas stream; in most stationary source categories, the effect of pressure appears to be negligible.”
Method 17 is similar to Method 5 in that it measures TSP. Method 17, however, uses an in-stack (front-half) sampling system that operates effectively at the stack gas temperature. Thus, when Method 17 data are reported, it is critical that the temperature of the stack gas be reported. Method 17, like Method 5, focuses on filterable PM, but includes the same ice bath impinger train in which condensable PM can be collected. Also note that, for hot flue gases (above 120 ºC), which are typical for combustion devices and furnaces, Method 5 will generally yield higher filterable PM emissions (and lower condensable PM emissions) than Method 17 because some of the PM may condense between the temperature of the stack gas and the 120 ºC temperature of the Method 5 front-half sampling train.
To specifically measure PM10 emissions, Methods 201 or 201A are used. Method 201 and 201A are similar to Method 17 in that they operate at the actual stack gas temperature; however, Methods 201 and 201A employ a sizing device, typically a cyclone, at the sample inlet to remove PM greater than 10 µm in diameter from the sampled gas stream. As with the other methods discussed so far, Methods 201 and 201A concentrate on measuring the filterable PM, but theses methods specifically indicate that the condensable fraction should be measured and included in the PM10 emission total. At the time of this report, EPA only has provisional test methods for directly measuring PM2.5; these methods are similar to Methods 201 and 201A, but with sizing devices with different cut points.
Method 202 is the EPA test method for measuring the condensable PM emissions. Although the method is primarily specified for use with the in-stack methods (Method 17, 201, and 201A), variations of Method 202 are also used to measure the condensable PM emissions in a Method 5
Pechan Report No. 05.08.003/9012-452 2
PECHAN September 27, 2005
impinger train. The condensable PM fraction is generally considered to be fine PM (less than the 2.5 µm in diameter).
The primary point of this background discussion is to highlight the fact that there are few direct PM2.5 emission measurements from stationary sources. As such, some respondents do not even report PM2.5 emissions. Most of the PM2.5 emissions that are reported are generated from some measurement of PM (usually a TSP-type Method 5 data) and some fraction of emitted PM that is less than 2.5 or 10 µm in diameter. The fraction of PM that is less than 2.5 or 10 µm generally comes from emission factors reported in AP-42 for various sources and control device configurations. These size-specific AP-42 PM emission factors are generally developed from limited size distribution data generated from tests using Anderson cascade impactors (EPA, 1995). Based on the method of particle separation used in the cascade impactors, the particle size fractions are most appropriately applied to the filterable TSP emissions (i.e., PM emissions based on Method 5 front-half catch measurements) to yield a filterable PM2.5 fraction.
The NEI requests reporting of the PM2.5 emissions in three categories:
• PM25-PRI: primary (or total) PM2.5 emissions, which should be the sum of condensable and filterable PM2.5;
• PM25-FIL: filterable (or front-half) portion of the PM2.5 emissions; and • PM-CON: condensable (or back-half) portion of the PM2.5 emissions.
The NEI background material has some break-down of PM2.5 between filterable and condensable for a limited number of sources/control combinations. If the state or local agency requires only Method 5 (front-half) testing, that agency often has no means of estimating PM-CON. In these cases, the agency may report the PM2.5 emissions as either PM25-PRI and/or PM25-FIL and leave the PM-CON entry blank.
Information is not available in the NEI to accurately assess how facilities estimated PM emissions they reported to the state or local agency who then submits the inventory data to EPA to include in the NEI. For large stationary point sources, the facilities either estimate the emissions (based on test results or calculated using throughput and control data and emission factors) or the state requests that facilities report their throughput and control data and the state calculates the emissions using the reported data and emission factors. Because regulatory programs historically have not required facilities to test for and report PM-CON emissions, PMCON data reported to the NEI are generally sparse. In addition, some facilities have not been required to report PM25-FIL emissions, and, thus, PM25-FIL and PM25-PRI emissions are not consistently reported to the state agencies who submit their data to EPA for inclusion in the NEI. Although consistent reporting of PM25-PRI, PM25-FIL, and PM-CON will improve in the future as a result of the PM2.5 NAAQS, regional haze rule, and improvements in test methods, it is a serious limitation in the draft 2002 NEI.
It should be noted that EPA will be releasing the final 2002 NEI in the fall of 2005. This version will incorporate comments that state and local agencies provided to EPA on the draft 2002 NEI. In addition, EPA will be applying procedures to fill in missing PM25-FIL and PM-CON emissions and will sum the emissions for these two pollutants to obtain PM25-PRI emissions.
Pechan Report No. 05.08.003/9012-452 3
PECHAN September 27, 2005
It is beyond the scope of this report to delineate the PM2.5 emissions between filterable and condensable in a detailed manner; this work will be done for the final NEI. However, it is important to acknowledge the lack of direct measurement data and the inherent difficulties in estimating the PM2.5 emissions.
3. 2002 DRAFT NEI PM2.5 EMISSION ESTIMATES
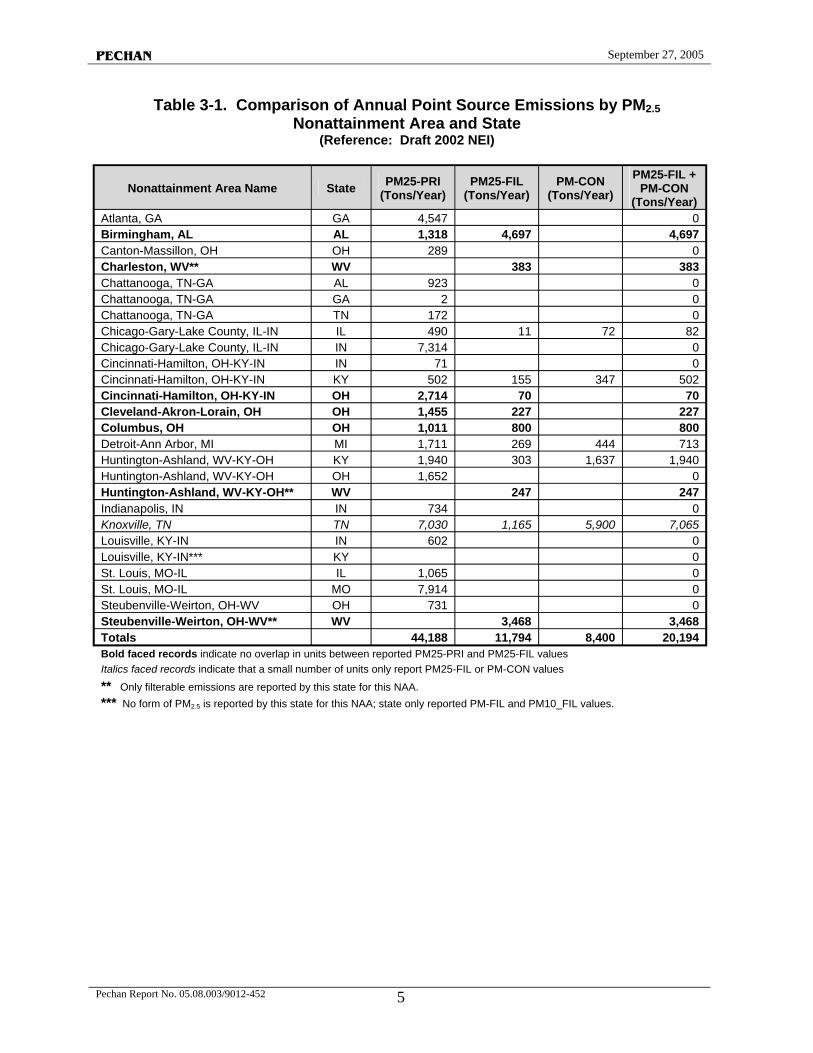
As mentioned in Section 2, the primary source of PM2.5 emission estimates is the 2002 draft NEI. Table 3-1 provides a summary of the reported point source PM2.5 emissions as reported in the draft 2002 NEI. The 2002 draft NEI is currently undergoing review by both EPA and state and local agencies, and some reporting errors are to be expected in this draft database. Additionally, given the inherent difficulties in developing the PM2.5 emissions estimates as discussed in Section 2, it is understandable that some data gaps and reporting anomalies exist. As seen by this compilation of the draft 2002 NEI data, PM25-PRI is rarely equal to the sum of the PM25FIL and PM-CON.
We reviewed each individual NEI record within a nonattainment area (NAA) to determine if the PM25-FIL and PM-CON data reported in the NEI overlapped with reported PM25-PRI data. For a few NAA/State combinations, all of the reported PM25-FIL and PM-CON data reported overlapped with reported PM25-PRI data. For several NAA/State combinations (those shown in bold), emissions for each source were reported only as PM25-PRI or PM25-FIL, with no overlapping data. Nearly all of the data reported in the Knoxville, TN NAA area included all three values of PM2.5, but a few sources reported only values for PM25-FIL or PM-CON and are not included in the PM25-PRI emission value. For one NAA/State combination, no PM2.5 data were reported at all.
Pechan Report No. 05.08.003/9012-452 4
PECHAN September 27, 2005
Table 3-1. Comparison of Annual Point Source Emissions by PM2.5 Nonattainment Area and State
(Reference: Draft 2002 NEI)
Nonattainment Area Name State PM25-PRI (Tons/Year)
PM25-FIL (Tons/Year)
PM-CON (Tons/Year)
PM25-FIL + PM-CON
(Tons/Year) Atlanta, GA GA 4,547 0 Birmingham, AL AL 1,318 4,697 4,697 Canton-Massillon, OH OH 289 0 Charleston, WV** WV 383 383 Chattanooga, TN-GA AL 923 0 Chattanooga, TN-GA GA 2 0 Chattanooga, TN-GA TN 172 0 Chicago-Gary-Lake County, IL-IN IL 490 11 72 82 Chicago-Gary-Lake County, IL-IN IN 7,314 0 Cincinnati-Hamilton, OH-KY-IN IN 71 0 Cincinnati-Hamilton, OH-KY-IN KY 502 155 347 502 Cincinnati-Hamilton, OH-KY-IN OH 2,714 70 70 Cleveland-Akron-Lorain, OH OH 1,455 227 227 Columbus, OH OH 1,011 800 800 Detroit-Ann Arbor, MI MI 1,711 269 444 713 Huntington-Ashland, WV-KY-OH KY 1,940 303 1,637 1,940 Huntington-Ashland, WV-KY-OH OH 1,652 0 Huntington-Ashland, WV-KY-OH** WV 247 247 Indianapolis, IN IN 734 0 Knoxville, TN TN 7,030 1,165 5,900 7,065 Louisville, KY-IN IN 602 0 Louisville, KY-IN*** KY 0 St. Louis, MO-IL IL 1,065 0 St. Louis, MO-IL MO 7,914 0 Steubenville-Weirton, OH-WV OH 731 0 Steubenville-Weirton, OH-WV** WV 3,468 3,468 Totals 44,188 11,794 8,400 20,194 Bold faced records indicate no overlap in units between reported PM25-PRI and PM25-FIL values Italics faced records indicate that a small number of units only report PM25-FIL or PM-CON values
** Only filterable emissions are reported by this state for this NAA. *** No form of PM2.5 is reported by this state for this NAA; state only reported PM-FIL and PM10_FIL values.
Pechan Report No. 05.08.003/9012-452 5
PECHAN September 27, 2005
4. DEVELOPMENT OF REFINED POINT SOURCE PM2.5 EMISSION ESTIMATES
A primary objective of this analysis is to assess the total PM2.5 (i.e., the PM25-PRI) emissions from stationary sources; some refinements were needed in the directly reported PM25-PRI to develop a complete PM2.5 inventory. Additional refinements were also needed when control device configurations were not reported in the draft 2002 NEI. This section details the refinements made to the draft 2002 NEI data in order to develop a best-estimate of the PM25PRI emissions.
4.1 Estimating PM25-PRI Emissions based on Reported Filterable and Condensable Emissions
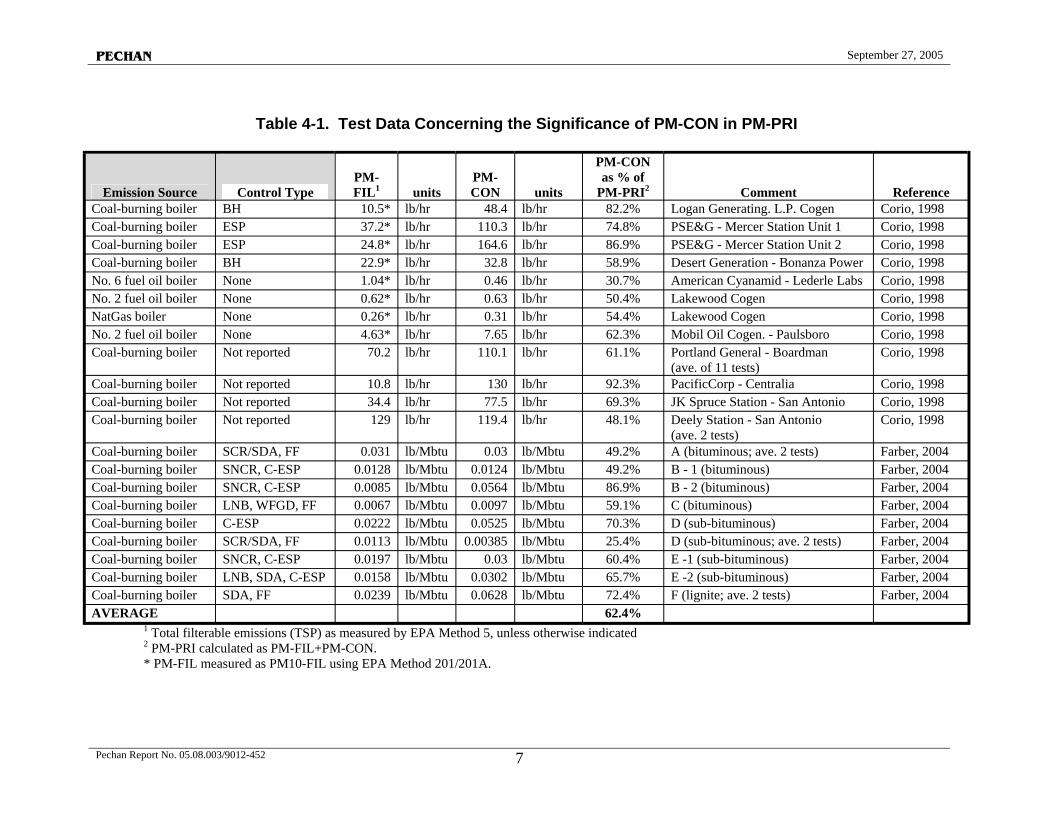
The first step in developing a complete inventory of PM2.5 data is to convert any PM2.5 data that were only reported as either PM25-FIL or PM-CON to PM25-PRI. For this analysis, we assume a 20/80 split between PM25-FIL and PM-CON. This value is based primarily on measurements reported by Farber et al. (2004) and Corio (1998) as presented in Table 4-1. The arithmetic average percent condensable to total PM emissions was 60 percent, although there is significant variability in this ratio due to differences in boiler type, control device, and other operating variables; the range was 20 to 90 percent.
This 40/60 split is between filterable TSP (or PM10) and condensable. As discussed in the background section, the filterable TSP must be adjusted to estimate the fine portion of the filterable PM (i.e., PM25-FIL). This split is based on data for coal-fired boilers that account for a significant portion of the PM2.5 emissions in the draft point source NEI. Based on AP-42 particle size distribution factors for coal-fired boilers controlled using an electrostatic precipitator (ESP) (the most commonly used PM control device in the electric utility industry), PM25-FIL accounts for approximately 40 percent of the TSP (range between 30 and 60 percent, depending on the boiler type). It is assumed that all of the condensable PM is PM2.5 (i.e., PMCON). After reducing the filterable emissions by 40 percent, the ratio of PM25-FIL to PM-CON is 16/60 or approximately 20/80. Thus, PM-CON constitutes approximately 80 percent of the PM25-PRI for coal-fired boilers controlled with ESPs.
Pechan Report No. 05.08.003/9012-452 6
PECHAN September 27, 2005
Table 4-1. Test Data Concerning the Significance of PM-CON in PM-PRI
Emission Source Control Type PMFIL1 units
PM-CON units
PM-CON as % of
PM-PRI2 Comment Reference Coal-burning boiler BH 10.5* lb/hr 48.4 lb/hr 82.2% Logan Generating. L.P. Cogen Corio, 1998 Coal-burning boiler ESP 37.2* lb/hr 110.3 lb/hr 74.8% PSE&G - Mercer Station Unit 1 Corio, 1998 Coal-burning boiler ESP 24.8* lb/hr 164.6 lb/hr 86.9% PSE&G - Mercer Station Unit 2 Corio, 1998 Coal-burning boiler BH 22.9* lb/hr 32.8 lb/hr 58.9% Desert Generation - Bonanza Power Corio, 1998 No. 6 fuel oil boiler None 1.04* lb/hr 0.46 lb/hr 30.7% American Cyanamid - Lederle Labs Corio, 1998 No. 2 fuel oil boiler None 0.62* lb/hr 0.63 lb/hr 50.4% Lakewood Cogen Corio, 1998 NatGas boiler None 0.26* lb/hr 0.31 lb/hr 54.4% Lakewood Cogen Corio, 1998 No. 2 fuel oil boiler None 4.63* lb/hr 7.65 lb/hr 62.3% Mobil Oil Cogen. - Paulsboro Corio, 1998 Coal-burning boiler Not reported 70.2 lb/hr 110.1 lb/hr 61.1% Portland General - Boardman
(ave. of 11 tests) Corio, 1998
Coal-burning boiler Not reported 10.8 lb/hr 130 lb/hr 92.3% PacificCorp - Centralia Corio, 1998 Coal-burning boiler Not reported 34.4 lb/hr 77.5 lb/hr 69.3% JK Spruce Station - San Antonio Corio, 1998 Coal-burning boiler Not reported 129 lb/hr 119.4 lb/hr 48.1% Deely Station - San Antonio
(ave. 2 tests) Corio, 1998
Coal-burning boiler SCR/SDA, FF 0.031 lb/Mbtu 0.03 lb/Mbtu 49.2% A (bituminous; ave. 2 tests) Farber, 2004 Coal-burning boiler SNCR, C-ESP 0.0128 lb/Mbtu 0.0124 lb/Mbtu 49.2% B - 1 (bituminous) Farber, 2004 Coal-burning boiler SNCR, C-ESP 0.0085 lb/Mbtu 0.0564 lb/Mbtu 86.9% B - 2 (bituminous) Farber, 2004 Coal-burning boiler LNB, WFGD, FF 0.0067 lb/Mbtu 0.0097 lb/Mbtu 59.1% C (bituminous) Farber, 2004 Coal-burning boiler C-ESP 0.0222 lb/Mbtu 0.0525 lb/Mbtu 70.3% D (sub-bituminous) Farber, 2004 Coal-burning boiler SCR/SDA, FF 0.0113 lb/Mbtu 0.00385 lb/Mbtu 25.4% D (sub-bituminous; ave. 2 tests) Farber, 2004 Coal-burning boiler SNCR, C-ESP 0.0197 lb/Mbtu 0.03 lb/Mbtu 60.4% E -1 (sub-bituminous) Farber, 2004 Coal-burning boiler LNB, SDA, C-ESP 0.0158 lb/Mbtu 0.0302 lb/Mbtu 65.7% E -2 (sub-bituminous) Farber, 2004 Coal-burning boiler SDA, FF 0.0239 lb/Mbtu 0.0628 lb/Mbtu 72.4% F (lignite; ave. 2 tests) Farber, 2004 AVERAGE 62.4%
1 Total filterable emissions (TSP) as measured by EPA Method 5, unless otherwise indicated 2 PM-PRI calculated as PM-FIL+PM-CON. * PM-FIL measured as PM10-FIL using EPA Method 201/201A.
Pechan Report No. 05.08.003/9012-452 7
PECHAN September 27, 2005
This proportion is expected to be fairly representative of other large combustion sources and furnaces, such as controlled basic oxygen furnaces (BOFs) at integrated iron and steel making plants or uncontrolled oil-fired or gas-fired boilers. As seen in the NAA/state combinations that reported both PM25-FIL and PM-CON, this 20/80 split agrees well with the estimated split in PM25-PRI between filterable and condensable fractions based on a review of the NEI data for sources for which facilities reported both PM25-FIL and PM-CON emissions. Therefore, a fixed 20/80 ratio was initially assumed for all sources who only reported PM25-FIL or PM-CON. When only PM25-FIL data were reported, the PM25-FIL emissions were multiplied by a factor of 5 to estimate PM25-PRI emissions, and when only PM-CON data were reported, these data were multiplied by a factor of 1.25 to estimate PM25-PRI emissions.
This 20/80 PM2.5 split is not expected to apply for fugitive dust emissions occurring at near-ambient temperatures. As described in Section 4.4, after the initial application of the 20/80 ratio, large fugitive dust sources were reviewed and alternative 50/50 split was applied to these types of sources. We acknowledge that the make-up of PM25-PRI between PM25-FIL and PM-CON will vary by SCC and by control device within each SCC. For the purposes of this evaluation, selected default split values were developed that are expected to be reasonably appropriate, on average, for the major point sources. A detailed PM augmentation is currently being conducted for the 2002 NEI data to fill-in missing PM data using SCC- and control device-specific PM augmentation values. It may be informative to re-assess the PM fine emissions for the 16 NAAs after completion of the 2002 NEI PM augmentation.
4.2 Adding PM25-PRI Emissions based on Reported PM-FIL Emissions
The state of Kentucky only reported PM-FIL (and for some of its sources of PM10-FIL). To fill in the missing data for the Louisville, KY NAA, PM25-FIL emissions were estimated based on the reported PM-FIL data using the size fractions reported in AP-42 for the largest emission sources in the area (electric utilities and cement manufacturer). Table 2 presents the PM2.5 fractions used to convert the PM-FIL emissions to PM25-FIL emissions. As in Section 4.1, the resulting PM25-FIL emission estimates were multiplied by a factor of 5 (a 20/80 split) to estimate PM25-PRI emissions.
Due to time and budget constraints, we did not perform the same procedure we performed for the Louisville NAA for any of the other NAAs. For example, there are large steel plants and electric utility plants in the Detroit-Ann Arbor NAA for which no PM2.5 data are reported. Additionally, the only emission sources reported for the Kentucky portions for the Huntington-Ashland and Cincinnati-Hamilton NAAs are electric utility data that are entered by EPA. Although the electric utilities are often the primary contributors to PM2.5 emissions, some emission sources are still missing from the data set. These issues are most easily addressed after the NEI data are finalize and all of the PM2.5 data are fully populated.
4.3 Verifying Control Status Designations
The draft 2002 NEI characterizes the emission sources as controlled, uncontrolled, or unknown. Through data collection efforts conducted in the development of maximum achievable control technology (MACT) standards for coal-fired electrical generating units (EGUs), blast furnaces and steel making facilities, foundries, cement kilns, and refineries, RTI has significant information on the emission sources and the control devices used for specific plants in these Pechan Report No. 05.08.003/9012-452 8
PECHAN September 27, 2005
industries. Based on a preliminary analysis of the reported NEI data, these sources contribute roughly 75 percent of the controlled PM2.5 emissions. As such, these MACT databases were valuable resources used to re-designate the control status for these key sources.
First, all sources with emissions of greater than 2 tpy and that were designated with a control status of “unknown” were reviewed and assigned to either “controlled” or “uncontrolled” based on data obtained from MACT projects. A few of the coal-fired boilers were not in the MACT database; these units were all assumed to be controlled with an ESP. In this process, we adjusted the control status for 59 individual emission points from “unknown” to “controlled,” and for 37 emission points from “unknown” to “uncontrolled.” All emission points labeled as “unknown” with PM25-PRI emissions less than 2 tpy were re-assigned as “uncontrolled;” the total combined emissions for these sources was less than 100 tpy.
Additionally, the largest “uncontrolled” sources were reviewed to ensure these large emission sources were properly designated. Using the MACT databases and the assumption that all coal-fired boilers are equipped with ESPs for PM control, 12 individual emission points were corrected from “uncontrolled” to “controlled”: eight were exhaust stacks for pulverized-coal-fired boilers; three were cupolas at iron foundries; and one was an electric arc furnace at a steel foundry.
In reviewing the largest “uncontrolled” emission sources, certain large emission sources were identified, such as coke oven doors, that are subject to work practice or equipment standards to reduce their emissions. Although they do not have an external air pollution control device, it is misleading to characterize these emissions as completely uncontrolled since the current emissions from these sources has been significantly reduced through source-specific opacity limits or work practice standards. Therefore, we subcategorized the point sources with no add-on control devices into “regulated” sources (i.e., sources subject to federal opacity/work practice standards) and “uncontrolled” sources (i.e., sources with no emission control systems). We subsequently refer to the NEI “controlled” point sources as “sources with add-on PM emission control devices.”
4.4 Other Adjustments to the 2002 Draft NEI Data
As part of the review of the validity of the 20/80 split in PM25-FIL to PM-CON and control device status assignments, all single point emission sources that are projected to have PM25-PRI emissions of more than 400 tpy were reviewed individually. In this review, several significant sources of emissions were identified whose emissions appeared to be overstated. This section describes these sources and the adjustments made in emission estimates for these sources.
4.4.1 Coal Storage/Transfer Operations
The largest point source in the city of St. Louis is American Commercial Terminals, reporting 3,714 tpy of PM25-PRI emissions. Although coal loading is expected to produce PM emissions, it appears that the emission factor used in this case represents the initial short-term emission puff and that most of these emissions would immediately re-settle within the terminal area. That is, this source is analogous to agricultural tilling, where the tilling operation kicks up large quantities of dust, but only a small portion of that dust is “transportable” (i.e., remains airborne for a sufficient period of time to be carried off-site). The database was sorted by source Pechan Report No. 05.08.003/9012-452 9
PECHAN September 27, 2005
classification code (SCC), and other significant sources of PM emissions from coal storage and transfer operations were identified. For these sources, it is assumed that the PM25-PRI equals PM25-FIL (i.e., no condensable PM), if applicable, and that the transportable fraction was 36 percent of the reported emissions for these point sources. This 36 percent transport factor value was based on a review of county-specific PM transport factor for St Louis (city).
4.4.2 Paved and Unpaved Roads
The NEI contains significant PM2.5 emissions from paved and unpaved roads within the point source inventory. As with coal storage and loading, these emissions are not expected to have a condensable fraction (PM25-PRI = PM25-FIL, when conversion from PM-FIL was necessary), and a significant fraction of the emissions are expected to re-settle on-site. The database was sorted by SCC, and emissions from paved and unpaved roads were adjusted so that PM25-PRI equals PM25-FIL (when conversion from PM25-FIL was needed), and then a transportable fraction of 20 percent was applied for the “uncontrolled” sources; no transport factor was applied to the emission estimates designated as “controlled” (typically via dust suppression by water spray). This 20 percent transport factor value was selected based on a review of county-specific PM transport factors for the counties with the highest uncontrolled paved and unpaved road emissions (at point sources).
4.4.3 Selected Uncontrolled Emission Sources
A number of “uncontrolled” PM sources were observed when reviewing the validity of the 20/80 split used in converting the reported PM25-FIL data to PM25-PRI values. In particular, the Birmingham, AL NAA contained a significant number of foundry operations such as induction furnace melting, cast grinding, and sand handling processes as well as cement plants with crushing and sizing operations. Similarly, coke oven pushing emissions that escape capture are expected to be primarily carbon fines with limited condensable PM, so that the 20/80 split was deemed inappropriate. For these “uncontrolled” emission sources, a 50/50 split was assumed between PM25-FIL and PM-CON, so that the PM25-PRI emissions were estimated as two times the reported PM25-FIL emissions.
4.4.4 Sources Controlled with Wet Scrubbers
Several large PM sources requiring correction of the PM25-FIL to PM25-PRI are controlled using wet or venturi scrubbers. Wet scrubbers often achieve higher levels of condensable PM control than dry control technology as the scrubbers help to condense the condensable PM during particulate removal. We reviewed the PM augmentation table for the draft NEI (a table of factors developed to help fill-in missing PM emissions) to compare the PM25-PRI to PM-CON factors for the same SCC controlled with a high-efficiency wet scrubber versus a high-efficiency ESP. Based on this comparison, a 50/50 split was assumed between PM25-FIL and PM-CON for sources controlled with wet scrubbers (NEI air pollution control device codes 001, 002, 003, and 053).
4.4.5 Glass Melting at Techneglas
One other emission source requiring conversion from PM25-FIL to PM25-PRI that was identified in the data review was the glass melting operations at Techneglas, Inc. in Columbus, Pechan Report No. 05.08.003/9012-452 10
PECHAN September 27, 2005
OH. After applying the 20/80 ratio of filterable to condensable fine PM, the PM25-PRI emissions for this furnace was estimated to be 4,000 tpy after control via a high-efficiency ESP. This would make this source the largest single controlled emission source in the 16 NAAs evaluated. Although no direct data are available from which to assess the validity of the 20/80 split assumption, the application of the 20/80 split appears to yield an unreasonably high emission estimate in this instance. Furthermore, the emissions reported for this plant appear to be higher than expected. Emissions for seven other glass melting furnaces are reported in the 16 NAAs evaluated; emissions for these other glass melting furnaces range between 20 and 60 tpy and are uncontrolled for PM. Although it is possible that the glass melting rates in these other furnaces are much lower than at Techneglas, it seems unlikely that even a much larger glass melting furnace, being equipped with an ESP, would have such significantly higher PM emissions than uncontrolled glass melting furnaces. Therefore, for this emission point, a 50/50 split is assumed between PM25-FIL and PM-CON simply to limit the impacts of what appears to be an exaggerated emissions value. Application of the 50/50 split results in a PM25-PRI emission estimate for this facility of 1,600 tpy.
4.5 Uncertainty in PM2.5 Point Source Emission Estimates
It is evident that significant uncertainty exists in the analysis of PM2.5 emissions from the point sources. Some of the uncertainty is due to the draft status of the 2002 NEI, wherein the complete suite of PM, PM10, and PM2.5 emissions data have not been filled-in based on reported data. We expect that this uncertainty to produce a low bias to the point source emissions (i.e., the PM2.5 point source emissions are currently under-estimated due to emissions being reported as PM or PM10 without estimating the PM2.5 fraction).
There is also uncertainty associated with the emission factors (when used) and the size-specific emission factors from AP-42. This is particularly true for some of the fugitive emission sources simply due to the difficulties in developing good emission factors for these sources. These sources are invariably classified as uncontrolled sources, and it appeared that the emissions from these sources were generally overstated. We adjusted the emission for some of these ambient, fugitive dust sources by applying a representative transportable fraction to the reported emissions. The representative factors were developed from county-specific PM transport fractions developed by EPA. The actual transportable fraction will vary based on wind speed, location of building structures, vegetation, and other factors. For other sources, such as coke oven pushing, no adjustment was made in the reported fugitive emissions. One integrated iron and steel facility reported controlled emissions from their coke oven pushing operations, but also reported 612 tons/year of fugitive PM25-FIL emissions from coke oven pushing, presumably to account for pushing emissions that escape capture. It is appropriate to account for these uncaptured, and subsequently uncontrolled emissions, but it is important to realize that these emission estimates are inherently highly uncertain.
Significant uncertainty is also introduced by the reporting method and the assumed speciation of the PM2.5 emissions between PM25-PRI, PM25-FIL and PM-CON. In our analysis, we assumed all data reported as PM25-PRI was indeed the total PM2.5 emissions (filterable plus condensable PM2.5). However, past experience in reviewing the sources of data suggest that most of the directly reported PM25-PRI emissions are based on Method 5 source test data and application of AP-42 size fraction factors and actually reflect only PM25-FIL data. Misreporting of PM25-FIL
Pechan Report No. 05.08.003/9012-452 11
PECHAN September 27, 2005
emissions as PM25-PRI emissions will underestimate the total PM2.5 emissions from point sources.
Uncertainty is also introduced when only PM-FIL emissions are reported due to the uncertainty in the relative mass of filterable and condensable PM emissions from various sources. As seen in Table 4-1, the relative mass of filterable and condensable PM emissions for similar sources is highly variable. Additionally, concerns have been expressed that Method 202 yields condensable masses that are biased high due to sulfur dioxide absorption in the impinger liquid, adding to the uncertainty.
In an attempt to characterize the uncertainty caused by the reporting method and assumed speciation of PM2.5, alternative assessment assumptions were evaluated. These alternative assessment assumptions are described in the following subsections.
4.5.1 Impact of Assumed Ratio of PM25-FIL to PM25-PRI (“Low Estimate”)
For this alternative analysis, the default split between PM25-FIL and PM-CON was assumed to be 50/50 instead of 20/80. No change in the assessment was made for sources that were assumed to have no PM-CON and to which a transportable fraction was applied. As nearly all of the condensable PM2.5 emissions were reported in conjunction with sources that reported all three variants of PM2.5, adjusting the default split primarily impacts sources that reported only PM25FIL (or PM-FIL) data. The 50/50 split effectively means that these PM25-FIL data were multiplied by a factor of 2 when converting them to PM25-PRI emissions (rather than a factor of 5 used in the “best-estimate” approach). As such, this revised 50/50 split in the PM25-FIL/PM-CON ratio resulted in reducing the projected emissions for the 16 NAAs, and is referred to as the low-end emission estimate.
4.5.2 Impact of Misreporting PM25-FIL as PM25-PRI (“High Estimate”)
In this alternative analysis, we assumed that all PM25-PRI data for sources that did not also report PM25-FIL or PM-CON data were incorrectly reported and actually represented PM25-FIL emissions data. The default PM2.5 split used in the “best-estimate” approach (20/80 for all sources except those controlled by wet scrubbers, which used a 50/50) was then used to correct the reported PM2.5 data to represent PM25-PRI emissions. No change in the assessment was made for sources that were assumed to have no condensable PM and to which a transportable fraction was applied. No change in the assessment was made for sources that reported PM25FIL or PM-CON data. The impact of this assessment is to increase the PM2.5 emissions for sources that reported only PM25-PRI emissions by a factor of 5 (or 2 if controlled by a wet scrubber). As such, this approach resulted in increased emissions for the 16 NAAs, and is referred to as the high-end emission estimate. Note that the high-end estimate does not consider missing PM2.5 data that result when PM or PM10 data are reported with no reporting of the PM2.5 fraction of those data. As such, the high-end estimate is by no means considered an upper-bound. The high-end estimate is primarily provided to assess the potential impact of improperly reporting filterable PM emissions data as PM25-PRI.
Pechan Report No. 05.08.003/9012-452 12
PECHAN September 27, 2005
4.6 Summary of Refined PM2.5 Point Source Emission Estimates
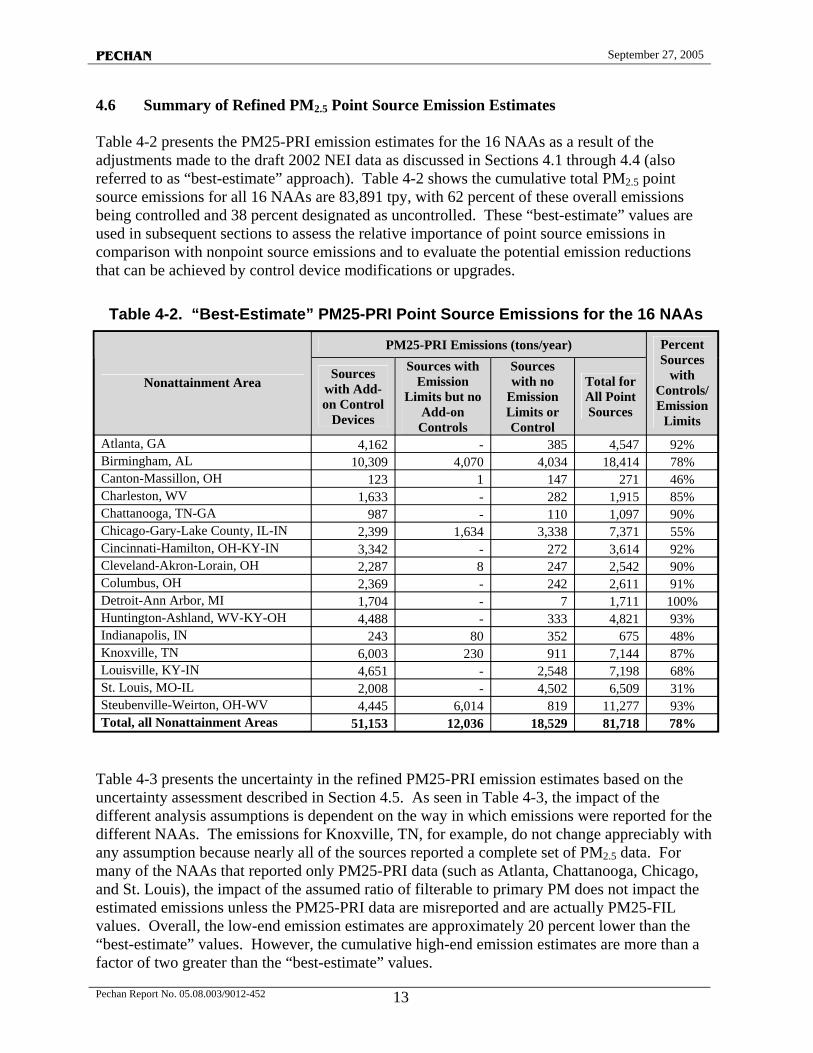
Table 4-2 presents the PM25-PRI emission estimates for the 16 NAAs as a result of the adjustments made to the draft 2002 NEI data as discussed in Sections 4.1 through 4.4 (also referred to as “best-estimate” approach). Table 4-2 shows the cumulative total PM2.5 point source emissions for all 16 NAAs are 83,891 tpy, with 62 percent of these overall emissions being controlled and 38 percent designated as uncontrolled. These “best-estimate” values are used in subsequent sections to assess the relative importance of point source emissions in comparison with nonpoint source emissions and to evaluate the potential emission reductions that can be achieved by control device modifications or upgrades.
Table 4-2. “Best-Estimate” PM25-PRI Point Source Emissions for the 16 NAAs
PM25-PRI Emissions (tons/year) Percent
Nonattainment Area
Sources with
Controls/ Emission
Limits
Sources with Add-on Control
Devices
Sources with Emission
Limits but no Add-on
Controls
Sources with no
Emission Limits or Control
Total for All Point Sources
Atlanta, GA 4,162 - 385 4,547 92% Birmingham, AL 10,309 4,070 4,034 18,414 78% Canton-Massillon, OH 123 1 147 271 46% Charleston, WV 1,633 - 282 1,915 85% Chattanooga, TN-GA 987 - 110 1,097 90% Chicago-Gary-Lake County, IL-IN 2,399 1,634 3,338 7,371 55% Cincinnati-Hamilton, OH-KY-IN 3,342 - 272 3,614 92% Cleveland-Akron-Lorain, OH 2,287 8 247 2,542 90% Columbus, OH 2,369 - 242 2,611 91% Detroit-Ann Arbor, MI 1,704 - 7 1,711 100% Huntington-Ashland, WV-KY-OH 4,488 - 333 4,821 93% Indianapolis, IN 243 80 352 675 48% Knoxville, TN 6,003 230 911 7,144 87% Louisville, KY-IN 4,651 - 2,548 7,198 68% St. Louis, MO-IL 2,008 4,502 6,509 31% Steubenville-Weirton, OH-WV 4,445 6,014 819 11,277 93% Total, all Nonattainment Areas 51,153 12,036 18,529 81,718 78%
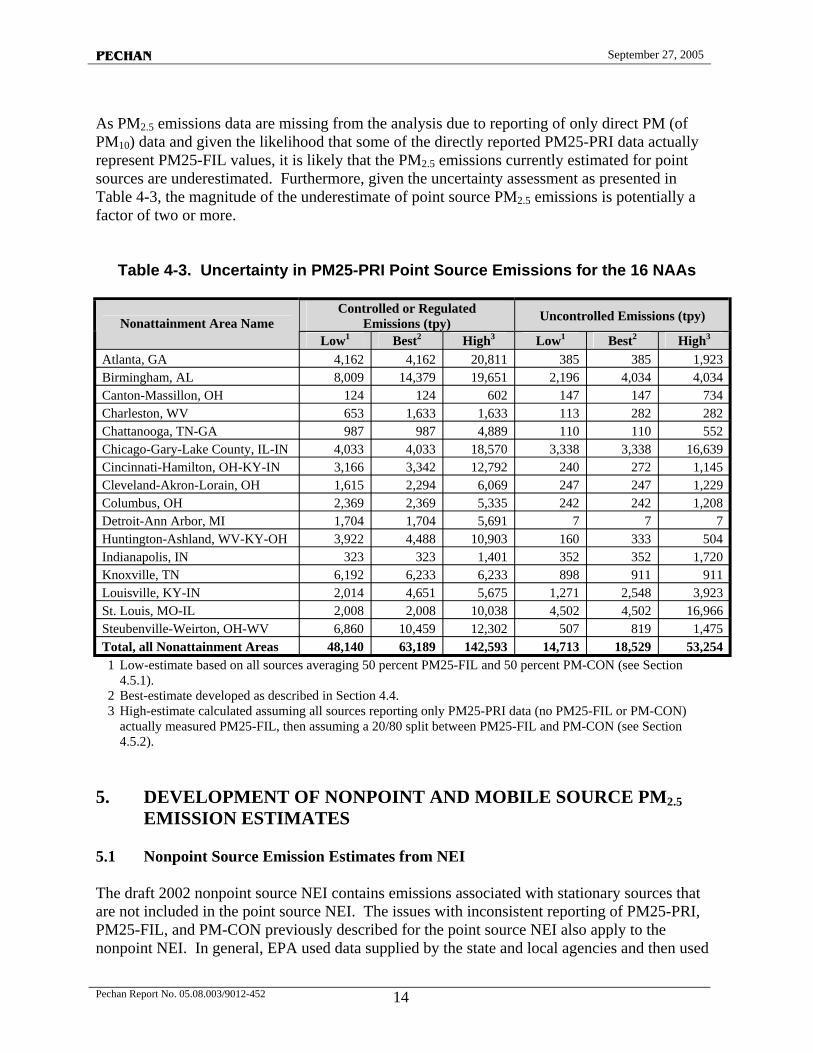
Table 4-3 presents the uncertainty in the refined PM25-PRI emission estimates based on the uncertainty assessment described in Section 4.5. As seen in Table 4-3, the impact of the different analysis assumptions is dependent on the way in which emissions were reported for the different NAAs. The emissions for Knoxville, TN, for example, do not change appreciably with any assumption because nearly all of the sources reported a complete set of PM2.5 data. For many of the NAAs that reported only PM25-PRI data (such as Atlanta, Chattanooga, Chicago, and St. Louis), the impact of the assumed ratio of filterable to primary PM does not impact the estimated emissions unless the PM25-PRI data are misreported and are actually PM25-FIL values. Overall, the low-end emission estimates are approximately 20 percent lower than the “best-estimate” values. However, the cumulative high-end emission estimates are more than a factor of two greater than the “best-estimate” values.
Pechan Report No. 05.08.003/9012-452 13
PECHAN September 27, 2005
As PM2.5 emissions data are missing from the analysis due to reporting of only direct PM (of PM10) data and given the likelihood that some of the directly reported PM25-PRI data actually represent PM25-FIL values, it is likely that the PM2.5 emissions currently estimated for point sources are underestimated. Furthermore, given the uncertainty assessment as presented in Table 4-3, the magnitude of the underestimate of point source PM2.5 emissions is potentially a factor of two or more.
Table 4-3. Uncertainty in PM25-PRI Point Source Emissions for the 16 NAAs
Nonattainment Area Name Controlled or Regulated
Emissions (tpy) Uncontrolled Emissions (tpy)
Low1 Best2 High3 Low1 Best2 High3
Atlanta, GA 4,162 4,162 20,811 385 385 1,923 Birmingham, AL 8,009 14,379 19,651 2,196 4,034 4,034 Canton-Massillon, OH 124 124 602 147 147 734 Charleston, WV 653 1,633 1,633 113 282 282 Chattanooga, TN-GA 987 987 4,889 110 110 552 Chicago-Gary-Lake County, IL-IN 4,033 4,033 18,570 3,338 3,338 16,639 Cincinnati-Hamilton, OH-KY-IN 3,166 3,342 12,792 240 272 1,145 Cleveland-Akron-Lorain, OH 1,615 2,294 6,069 247 247 1,229 Columbus, OH 2,369 2,369 5,335 242 242 1,208 Detroit-Ann Arbor, MI 1,704 1,704 5,691 7 7 7 Huntington-Ashland, WV-KY-OH 3,922 4,488 10,903 160 333 504 Indianapolis, IN 323 323 1,401 352 352 1,720 Knoxville, TN 6,192 6,233 6,233 898 911 911 Louisville, KY-IN 2,014 4,651 5,675 1,271 2,548 3,923 St. Louis, MO-IL 2,008 2,008 10,038 4,502 4,502 16,966 Steubenville-Weirton, OH-WV 6,860 10,459 12,302 507 819 1,475 Total, all Nonattainment Areas 48,140 63,189 142,593 14,713 18,529 53,254 1 Low-estimate based on all sources averaging 50 percent PM25-FIL and 50 percent PM-CON (see Section
4.5.1). 2 Best-estimate developed as described in Section 4.4. 3 High-estimate calculated assuming all sources reporting only PM25-PRI data (no PM25-FIL or PM-CON)
actually measured PM25-FIL, then assuming a 20/80 split between PM25-FIL and PM-CON (see Section 4.5.2).
5. DEVELOPMENT OF NONPOINT AND MOBILE SOURCE PM2.5 EMISSION ESTIMATES
5.1 Nonpoint Source Emission Estimates from NEI
The draft 2002 nonpoint source NEI contains emissions associated with stationary sources that are not included in the point source NEI. The issues with inconsistent reporting of PM25-PRI, PM25-FIL, and PM-CON previously described for the point source NEI also apply to the nonpoint NEI. In general, EPA used data supplied by the state and local agencies and then used
Pechan Report No. 05.08.003/9012-452 14
PECHAN September 27, 2005
its own inventory estimates to fill in data for categories not included in a state or local agency inventory.
State and local agencies typically did not report all three PM pollutants (i.e., PM25-PRI, PM25FIL, and PM-CON) for the fossil fuel combustion nonpoint source categories. Most states reported only PM25-FIL emissions and others incorrectly reported PM25-FIL emissions under the PM25-PRI pollutant code. For the draft NEI, EPA reviewed the PM data reported by state and local agencies and corrected incorrect reporting of primary emissions, estimated PM-CON emissions when missing, and recalculated PM25-PRI emissions as the sum of the corrected PM25-FIL and PM-CON emissions. For the draft NEI, EPA made further progress on correcting and gap filling PM emissions in the nonpoint than in the point source NEI. However, for the final nonpoint NEI that will incorporate state and local comments, EPA will perform a complete review and augmentation of the PM emissions in both the point and nonpoint 2002 NEI.
5.2 Application of Transportable Fractions to Nonpoint Fugitive Dust Categories
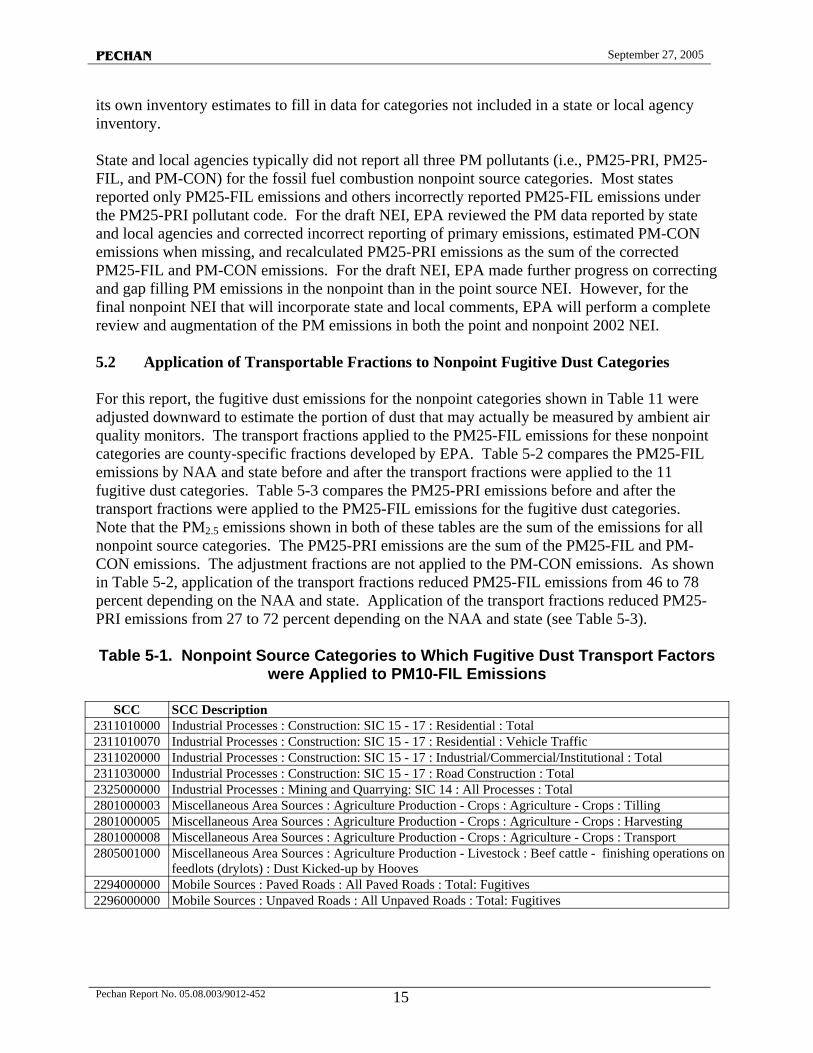
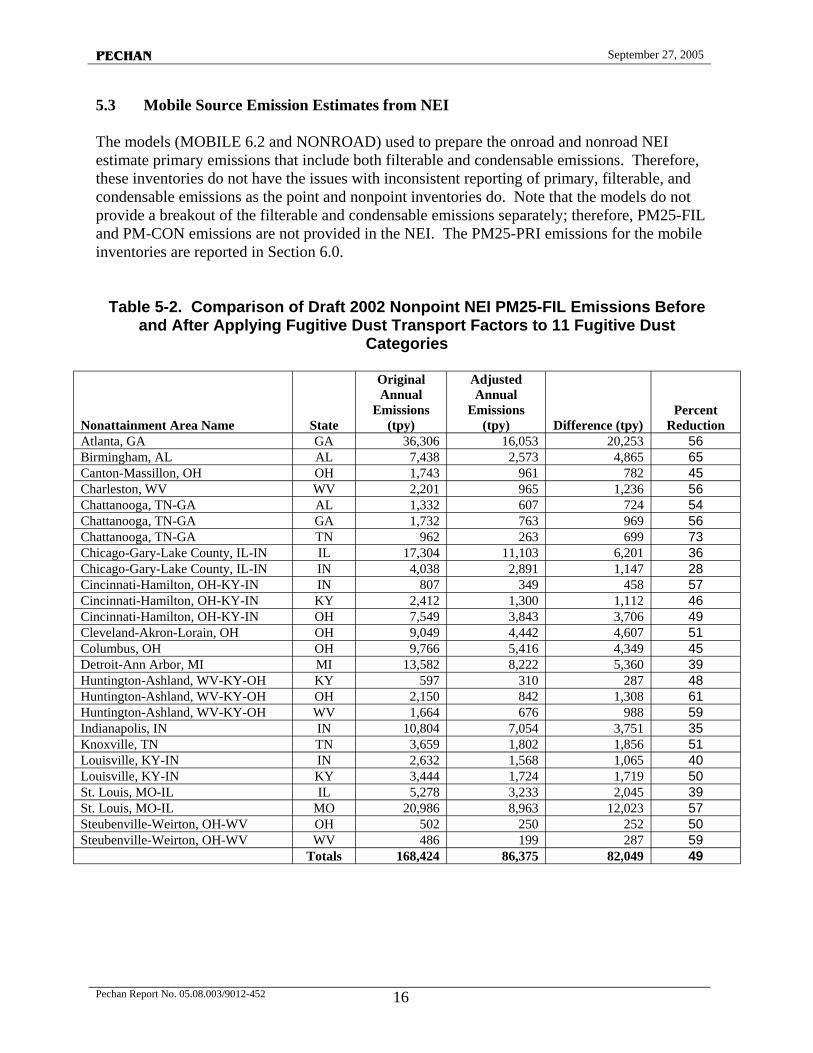
For this report, the fugitive dust emissions for the nonpoint categories shown in Table 11 were adjusted downward to estimate the portion of dust that may actually be measured by ambient air quality monitors. The transport fractions applied to the PM25-FIL emissions for these nonpoint categories are county-specific fractions developed by EPA. Table 5-2 compares the PM25-FIL emissions by NAA and state before and after the transport fractions were applied to the 11 fugitive dust categories. Table 5-3 compares the PM25-PRI emissions before and after the transport fractions were applied to the PM25-FIL emissions for the fugitive dust categories. Note that the PM2.5 emissions shown in both of these tables are the sum of the emissions for all nonpoint source categories. The PM25-PRI emissions are the sum of the PM25-FIL and PMCON emissions. The adjustment fractions are not applied to the PM-CON emissions. As shown in Table 5-2, application of the transport fractions reduced PM25-FIL emissions from 46 to 78 percent depending on the NAA and state. Application of the transport fractions reduced PM25PRI emissions from 27 to 72 percent depending on the NAA and state (see Table 5-3).
Table 5-1. Nonpoint Source Categories to Which Fugitive Dust Transport Factors were Applied to PM10-FIL Emissions
SCC SCC Description 2311010000 Industrial Processes : Construction: SIC 15 - 17 : Residential : Total 2311010070 Industrial Processes : Construction: SIC 15 - 17 : Residential : Vehicle Traffic 2311020000 Industrial Processes : Construction: SIC 15 - 17 : Industrial/Commercial/Institutional : Total 2311030000 Industrial Processes : Construction: SIC 15 - 17 : Road Construction : Total 2325000000 Industrial Processes : Mining and Quarrying: SIC 14 : All Processes : Total 2801000003 Miscellaneous Area Sources : Agriculture Production - Crops : Agriculture - Crops : Tilling 2801000005 Miscellaneous Area Sources : Agriculture Production - Crops : Agriculture - Crops : Harvesting 2801000008 Miscellaneous Area Sources : Agriculture Production - Crops : Agriculture - Crops : Transport 2805001000 Miscellaneous Area Sources : Agriculture Production - Livestock : Beef cattle - finishing operations on
feedlots (drylots) : Dust Kicked-up by Hooves 2294000000 Mobile Sources : Paved Roads : All Paved Roads : Total: Fugitives 2296000000 Mobile Sources : Unpaved Roads : All Unpaved Roads : Total: Fugitives
Pechan Report No. 05.08.003/9012-452 15
PECHAN September 27, 2005
5.3 Mobile Source Emission Estimates from NEI
The models (MOBILE 6.2 and NONROAD) used to prepare the onroad and nonroad NEI estimate primary emissions that include both filterable and condensable emissions. Therefore, these inventories do not have the issues with inconsistent reporting of primary, filterable, and condensable emissions as the point and nonpoint inventories do. Note that the models do not provide a breakout of the filterable and condensable emissions separately; therefore, PM25-FIL and PM-CON emissions are not provided in the NEI. The PM25-PRI emissions for the mobile inventories are reported in Section 6.0.
Table 5-2. Comparison of Draft 2002 Nonpoint NEI PM25-FIL Emissions Before and After Applying Fugitive Dust Transport Factors to 11 Fugitive Dust
Categories
Nonattainment Area Name State
Original Annual
Emissions (tpy)
Adjusted Annual
Emissions (tpy) Difference (tpy)
Percent Reduction
Atlanta, GA GA 36,306 16,053 20,253 56 Birmingham, AL AL 7,438 2,573 4,865 65 Canton-Massillon, OH OH 1,743 961 782 45 Charleston, WV WV 2,201 965 1,236 56 Chattanooga, TN-GA AL 1,332 607 724 54 Chattanooga, TN-GA GA 1,732 763 969 56 Chattanooga, TN-GA TN 962 263 699 73 Chicago-Gary-Lake County, IL-IN IL 17,304 11,103 6,201 36 Chicago-Gary-Lake County, IL-IN IN 4,038 2,891 1,147 28 Cincinnati-Hamilton, OH-KY-IN IN 807 349 458 57 Cincinnati-Hamilton, OH-KY-IN KY 2,412 1,300 1,112 46 Cincinnati-Hamilton, OH-KY-IN OH 7,549 3,843 3,706 49 Cleveland-Akron-Lorain, OH OH 9,049 4,442 4,607 51 Columbus, OH OH 9,766 5,416 4,349 45 Detroit-Ann Arbor, MI MI 13,582 8,222 5,360 39 Huntington-Ashland, WV-KY-OH KY 597 310 287 48 Huntington-Ashland, WV-KY-OH OH 2,150 842 1,308 61 Huntington-Ashland, WV-KY-OH WV 1,664 676 988 59 Indianapolis, IN IN 10,804 7,054 3,751 35 Knoxville, TN TN 3,659 1,802 1,856 51 Louisville, KY-IN IN 2,632 1,568 1,065 40 Louisville, KY-IN KY 3,444 1,724 1,719 50 St. Louis, MO-IL IL 5,278 3,233 2,045 39 St. Louis, MO-IL MO 20,986 8,963 12,023 57 Steubenville-Weirton, OH-WV OH 502 250 252 50 Steubenville-Weirton, OH-WV WV 486 199 287 59
Totals 168,424 86,375 82,049 49
Pechan Report No. 05.08.003/9012-452 16
PECHAN September 27, 2005
Table 5-3. Comparison of Draft 2002 Nonpoint NEI PM25-PRI Emissions Before and After Applying Fugitive Dust Transport Factors to 11 Fugitive Dust
Categories
Nonattainment Area Name State
Original Annual
Emissions (tpy)
Adjusted Annual
Emissions (tpy) Difference
(tpy) Percent
Reduction Atlanta, GA GA 44,988 24,735 20,253 45 Birmingham, AL AL 9,070 4,205 4,865 54 Canton-Massillon, OH OH 2,112 1,330 782 37 Charleston, WV WV 2,832 1,596 1,236 44 Chattanooga, TN-GA AL 1,477 753 724 49 Chattanooga, TN-GA GA 2,182 1,212 969 44 Chattanooga, TN-GA TN 1,383 684 699 51 Chicago-Gary-Lake County, IL-IN IL 25,208 19,008 6,201 25 Chicago-Gary-Lake County, IL-IN IN 5,330 4,184 1,147 22 Cincinnati-Hamilton, OH-KY-IN IN 1,071 613 458 43 Cincinnati-Hamilton, OH-KY-IN KY 2,897 1,785 1,112 38 Cincinnati-Hamilton, OH-KY-IN OH 8,836 5,129 3,706 42 Cleveland-Akron-Lorain, OH OH 11,648 7,041 4,607 40 Columbus, OH OH 11,236 6,887 4,349 39 Detroit-Ann Arbor, MI MI 17,196 11,837 5,360 31 Huntington-Ashland, WV-KY-OH KY 785 499 287 36 Huntington-Ashland, WV-KY-OH OH 2,828 1,520 1,308 46 Huntington-Ashland, WV-KY-OH WV 2,062 1,074 988 48 Indianapolis, IN IN 13,665 9,915 3,751 27 Knoxville, TN TN 4,448 2,592 1,856 42 Louisville, KY-IN IN 3,294 2,229 1,065 32 Louisville, KY-IN KY 4,699 2,979 1,719 37 St. Louis, MO-IL IL 6,517 4,472 2,045 31 St. Louis, MO-IL MO 23,852 11,829 12,023 50 Steubenville-Weirton, OH-WV OH 611 360 252 41 Steubenville-Weirton, OH-WV WV 639 352 287 45
Totals 210,868 128,819 82,049 39
6. SIGNIFICANCE OF CONTROLLED POINT SOURCE PM2.5 EMISSIONS
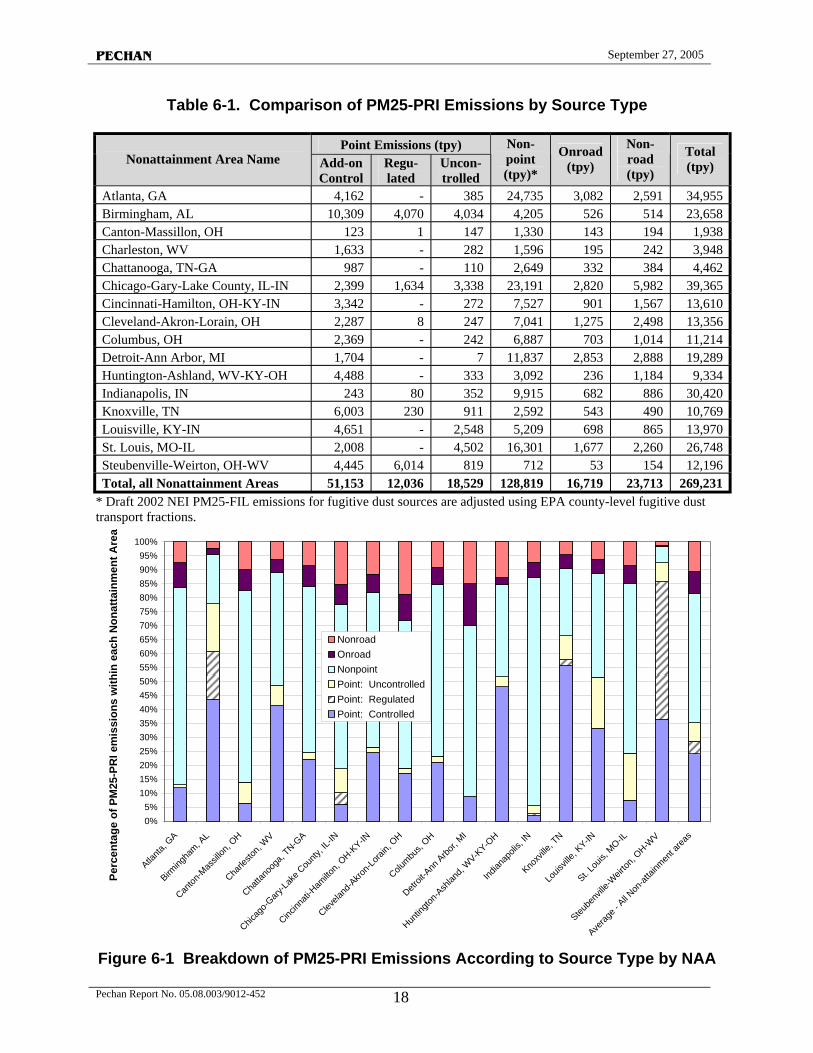
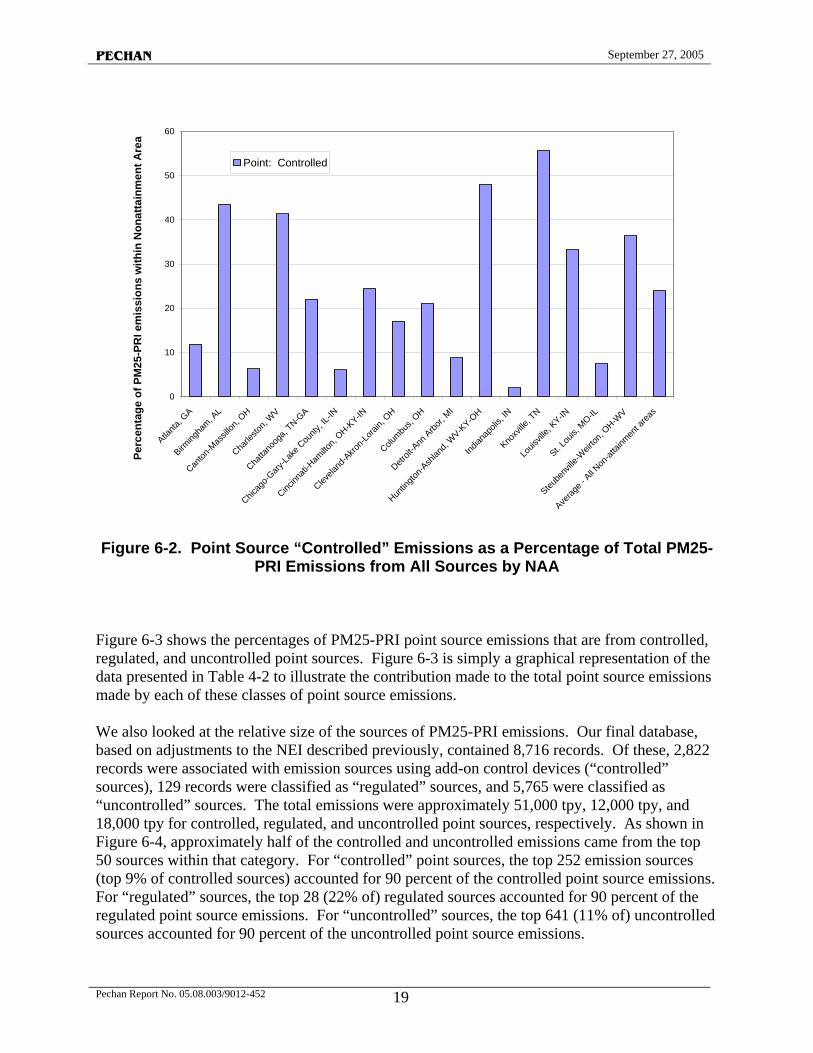
Table 6-1 presents the PM25-PRI emissions data for all 16 NAAs by source type (point, nonpoint, onroad, and nonroad). The point source data are segregated between controlled, regulated, and uncontrolled point source emissions. Figure 6-1 shows the percentages of PM25PRI that are from controlled point sources as compared to all other sources (including uncontrolled, nonpoint, onroad, and nonroad). For the 16 NAAs of interest, emissions of PM25PRI that are controlled point sources average approximately 24 percent of all PM25-PRI emissions. Figure 6-2 shows the percentage contribution only for PM25-PRI from “controlled” point sources (i.e., point sources controlled using an add-on PM emissions control device). Figure 6-2 simply highlights the “controlled” point source contribution presented in Figure 6-1.
Pechan Report No. 05.08.003/9012-452 17
PECHAN September 27, 2005
Table 6-1. Comparison of PM25-PRI Emissions by Source Type
Point Emissions (tpy)Nonattainment Area Name Add-on
Control Regulated
Uncontrolled
Non-point (tpy)*
Onroad (tpy)
Non-road (tpy)
Total (tpy)
Atlanta, GA 4,162 - 385 24,735 3,082 2,591 34,955 Birmingham, AL 10,309 4,070 4,034 4,205 526 514 23,658 Canton-Massillon, OH 123 1 147 1,330 143 194 1,938 Charleston, WV 1,633 - 282 1,596 195 242 3,948 Chattanooga, TN-GA 987 - 110 2,649 332 384 4,462 Chicago-Gary-Lake County, IL-IN 2,399 1,634 3,338 23,191 2,820 5,982 39,365 Cincinnati-Hamilton, OH-KY-IN 3,342 - 272 7,527 901 1,567 13,610 Cleveland-Akron-Lorain, OH 2,287 8 247 7,041 1,275 2,498 13,356 Columbus, OH 2,369 - 242 6,887 703 1,014 11,214 Detroit-Ann Arbor, MI 1,704 - 7 11,837 2,853 2,888 19,289 Huntington-Ashland, WV-KY-OH 4,488 - 333 3,092 236 1,184 9,334 Indianapolis, IN 243 80 352 9,915 682 886 30,420 Knoxville, TN 6,003 230 911 2,592 543 490 10,769 Louisville, KY-IN 4,651 - 2,548 5,209 698 865 13,970 St. Louis, MO-IL 2,008 - 4,502 16,301 1,677 2,260 26,748 Steubenville-Weirton, OH-WV 4,445 6,014 819 712 53 154 12,196 Total, all Nonattainment Areas 51,153 12,036 18,529 128,819 16,719 23,713 269,231
* Draft 2002 NEI PM25-FIL emissions for fugitive dust sources are adjusted using EPA county-level fugitive dust transport fractions.
0% 5%
10% 15% 20% 25% 30% 35% 40% 45% 50% 55% 60% 65% 70% 75% 80% 85% 90% 95%
100%
Perc
enta
ge o
f PM
25-P
RI e
mis
sion
s w
ithin
eac
h N
onat
tain
men
t Are
a
Non r oad O n road Non poin t Poi n t : Uncon t r o ll ed P o i n t: R e gu l a te d Poi n t : Contr ol l e d
Atlanta
, GA
Birming
ham, A
L
Canton
-Mas
sillon
, OH
Charle
ston,
WV
Chatta
noog
a,
Chicag
o-Gary
-Lake
County
, IL-IN
TN-GA
Cincinn
ati-H
amilto
n, OH-K
Y-IN
Clevela
nd-A
kron-L
orain,
OH
Columbu
s, OH
Detroit
-Ann
Arbor, M
I
Huntin
gton-A
shlan
d, W
V-KY-O
H
Indian
apoli
s, IN
Knoxv
ille, T
N
Louis
ville,
KY-IN
Steube
nville
-Weir
ton, O
H-WV
St. Lou
is, M
O-IL
Averag
e -All N
on-at
tainm
ent a
reas
Figure 6-1 Breakdown of PM25-PRI Emissions According to Source Type by NAA
Pechan Report No. 05.08.003/9012-452 18
PECHAN September 27, 2005
0
10
20
30
40
50
60 Pe
rcen
tage
of P
M25
-PR
I em
issi
ons
with
in N
onat
tain
men
t Are
a
P o in t: Con t rolled
Atlanta
, GA
Birming
ham, A
L
Canton
-Mas
sillon
, OH
Chatta
noog
a, TN-G
A
Charle
ston,
WV
Chicag
o-Gary
-Lake
Cou
nty, IL
-IN
Clevela
nd-A
kron-L
orain,
OH
OH-KY-IN
Columbu
s, OH
Detroit
-Ann
Arbor, M
I
Huntin
gton-A
shlan
d, WV-K
Y-OH
Indian
apoli
s, IN
Knoxv
ille, T
N
Louis
ville,
KY-IN
St. Lou
is,MO-IL
Steube
nville
-Weir
ton, O
H-WV
Averag
e - All N
on-at
tainm
ent a
reas
Cincinn
ati-H
amilto
n,
Figure 6-2. Point Source “Controlled” Emissions as a Percentage of Total PM25PRI Emissions from All Sources by NAA
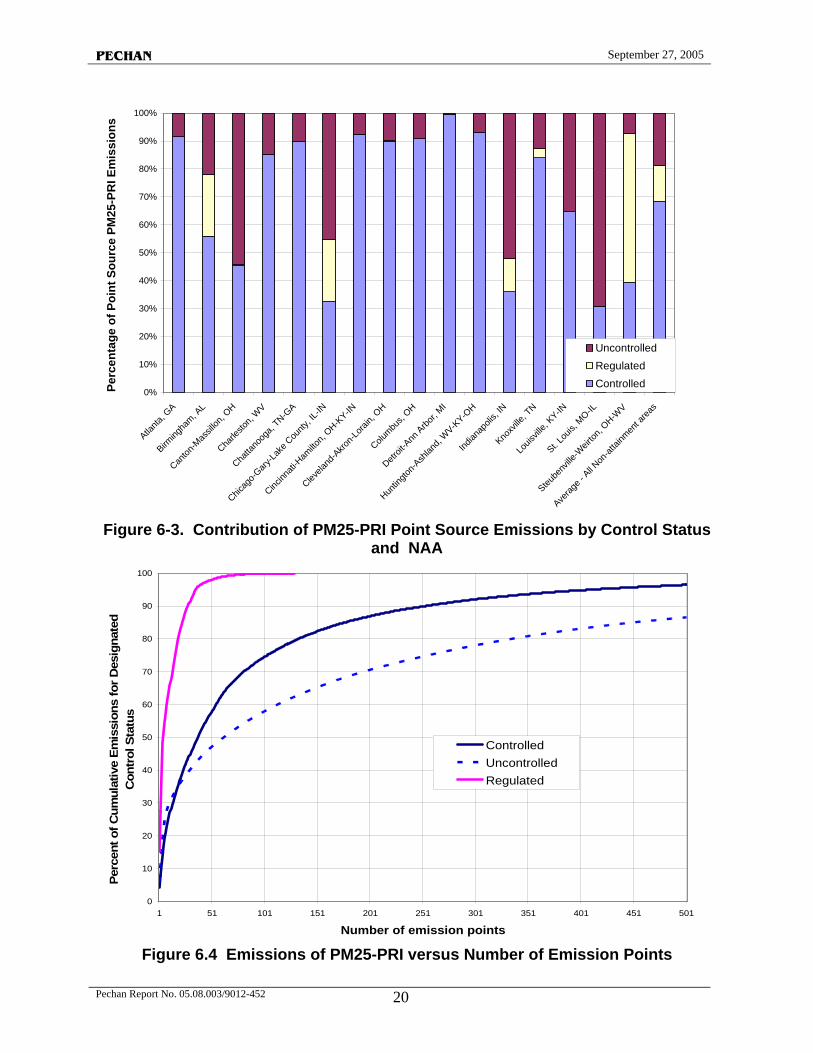
Figure 6-3 shows the percentages of PM25-PRI point source emissions that are from controlled, regulated, and uncontrolled point sources. Figure 6-3 is simply a graphical representation of the data presented in Table 4-2 to illustrate the contribution made to the total point source emissions made by each of these classes of point source emissions.
We also looked at the relative size of the sources of PM25-PRI emissions. Our final database, based on adjustments to the NEI described previously, contained 8,716 records. Of these, 2,822 records were associated with emission sources using add-on control devices (“controlled” sources), 129 records were classified as “regulated” sources, and 5,765 were classified as “uncontrolled” sources. The total emissions were approximately 51,000 tpy, 12,000 tpy, and 18,000 tpy for controlled, regulated, and uncontrolled point sources, respectively. As shown in Figure 6-4, approximately half of the controlled and uncontrolled emissions came from the top 50 sources within that category. For “controlled” point sources, the top 252 emission sources (top 9% of controlled sources) accounted for 90 percent of the controlled point source emissions. For “regulated” sources, the top 28 (22% of) regulated sources accounted for 90 percent of the regulated point source emissions. For “uncontrolled” sources, the top 641 (11% of) uncontrolled sources accounted for 90 percent of the uncontrolled point source emissions.
Pechan Report No. 05.08.003/9012-452 19
PECHAN September 27, 2005
0%
10%
20%
30%
40%
50%
60%
70%
80%
90%
100%Pe
rcen
tage
of P
oint
Sou
rce
PM25
-PR
I Em
issi
ons
U n c ont r o l l e d Re gu la t e d C ont r o l l e d
Atlanta
, GA
Birming
ham, A
L
Canton
-Mas
sillon
, OH
Charle
ston,
WV
Chatta
noog
a,
Chicag
o-Gary
-Lake
County
, IL-IN
TN-GA
Cincinn
ati-H
amilto
n, OH-K
Y-IN
Clevela
nd-A
kron-L
orain,
OH
Detroit
-Ann
Arbor, M
I
Columbu
s,OH
Huntin
gton-A
shlan
d, W
V-KY-O
H
Indian
apoli
s,IN
Knoxv
ille, T
N
Louis
ville,
KY-IN
St. Lou
is, M
O-IL
Steube
nville
-Weir
ton, O
H-WV
Averag
e -All N
on-at
tainm
ent a
reas
Figure 6-3. Contribution of PM25-PRI Point Source Emissions by Control Status and NAA
0
10
20
30
40
50
60
70
80
90
100
Perc
ent o
f Cum
ulat
ive
Emis
sion
s fo
r Des
igna
ted
Con
trol
Sta
tus
Controlled Unc ontrolle d Regulat ed
1 5 1 101 151 201 251 301 351 401 451
Number of emission points
Figure 6.4 Emissions of PM25-PRI versus Number of Emission Points
Pechan Report No. 05.08.003/9012-452 20
501
PECHAN September 27, 2005
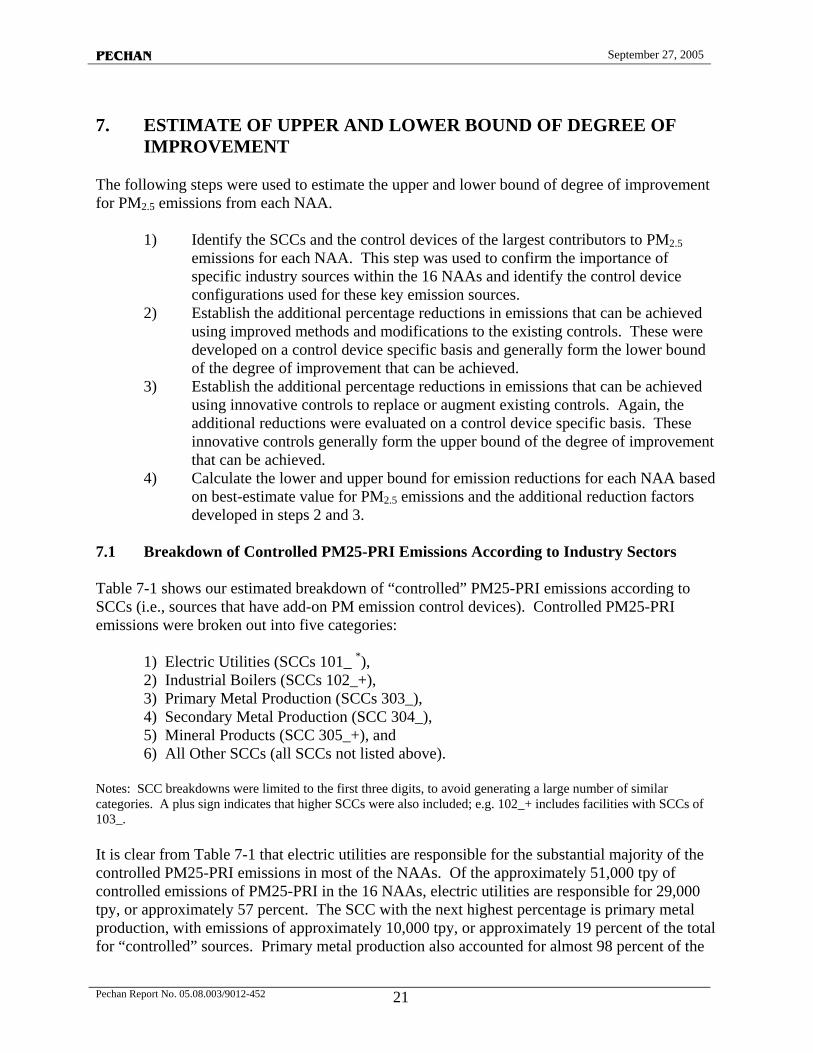
7. ESTIMATE OF UPPER AND LOWER BOUND OF DEGREE OF IMPROVEMENT
The following steps were used to estimate the upper and lower bound of degree of improvement for PM2.5 emissions from each NAA.
1) Identify the SCCs and the control devices of the largest contributors to PM2.5 emissions for each NAA. This step was used to confirm the importance of specific industry sources within the 16 NAAs and identify the control device configurations used for these key emission sources.
2) Establish the additional percentage reductions in emissions that can be achieved using improved methods and modifications to the existing controls. These were developed on a control device specific basis and generally form the lower bound of the degree of improvement that can be achieved.
3) Establish the additional percentage reductions in emissions that can be achieved using innovative controls to replace or augment existing controls. Again, the additional reductions were evaluated on a control device specific basis. These innovative controls generally form the upper bound of the degree of improvement that can be achieved.
4) Calculate the lower and upper bound for emission reductions for each NAA based on best-estimate value for PM2.5 emissions and the additional reduction factors developed in steps 2 and 3.
7.1 Breakdown of Controlled PM25-PRI Emissions According to Industry Sectors
Table 7-1 shows our estimated breakdown of “controlled” PM25-PRI emissions according to SCCs (i.e., sources that have add-on PM emission control devices). Controlled PM25-PRI emissions were broken out into five categories:
1) Electric Utilities (SCCs 101_ *), 2) Industrial Boilers (SCCs 102_+), 3) Primary Metal Production (SCCs 303_), 4) Secondary Metal Production (SCC 304_), 5) Mineral Products (SCC 305_+), and 6) All Other SCCs (all SCCs not listed above).
Notes: SCC breakdowns were limited to the first three digits, to avoid generating a large number of similar categories. A plus sign indicates that higher SCCs were also included; e.g. 102_+ includes facilities with SCCs of 103_.
It is clear from Table 7-1 that electric utilities are responsible for the substantial majority of the controlled PM25-PRI emissions in most of the NAAs. Of the approximately 51,000 tpy of controlled emissions of PM25-PRI in the 16 NAAs, electric utilities are responsible for 29,000 tpy, or approximately 57 percent. The SCC with the next highest percentage is primary metal production, with emissions of approximately 10,000 tpy, or approximately 19 percent of the total for “controlled” sources. Primary metal production also accounted for almost 98 percent of the
Pechan Report No. 05.08.003/9012-452 21
PECHAN September 27, 2005
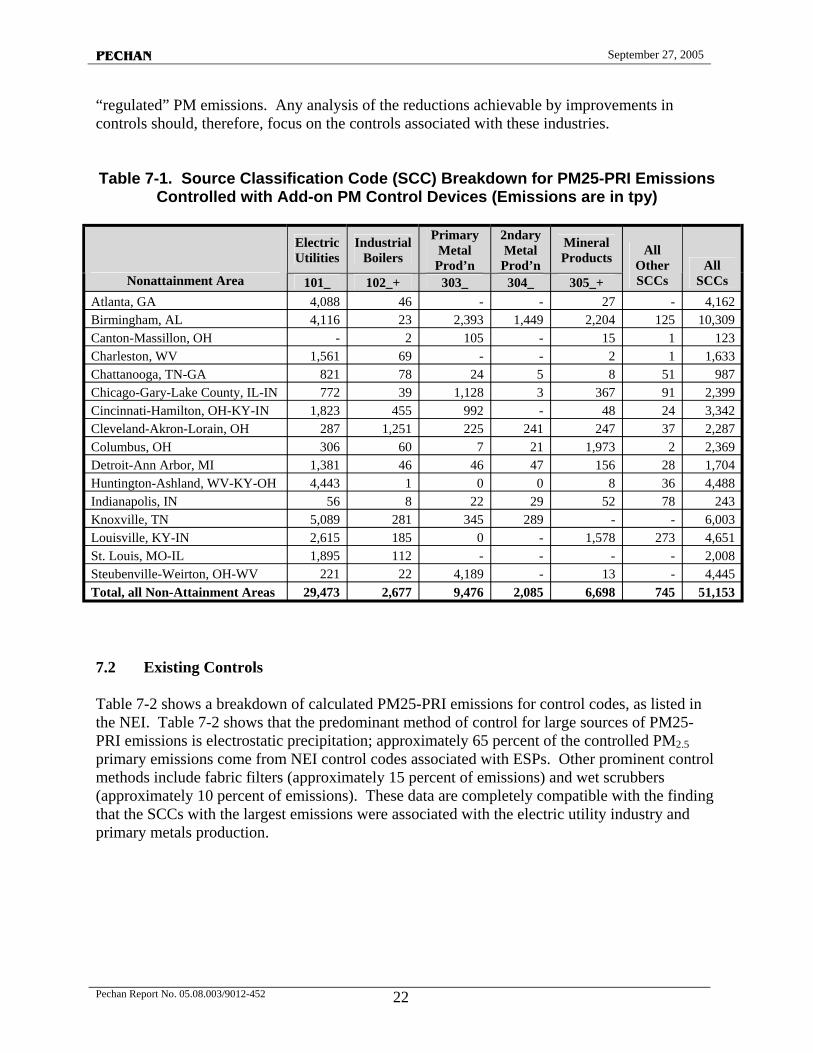
“regulated” PM emissions. Any analysis of the reductions achievable by improvements in controls should, therefore, focus on the controls associated with these industries.
Table 7-1. Source Classification Code (SCC) Breakdown for PM25-PRI Emissions Controlled with Add-on PM Control Devices (Emissions are in tpy)
Nonattainment Area
Electric Utilities
Industrial Boilers
Primary Metal
Prod’n
2ndary Metal
Prod’n
Mineral Products All
Other SCCs
All SCCs101_ 102_+ 303_ 304_ 305_+
Atlanta, GA 4,088 46 - - 27 - 4,162 Birmingham, AL 4,116 23 2,393 1,449 2,204 125 10,309 Canton-Massillon, OH - 2 105 - 15 1 123 Charleston, WV 1,561 69 - - 2 1 1,633 Chattanooga, TN-GA 821 78 24 5 8 51 987 Chicago-Gary-Lake County, IL-IN 772 39 1,128 3 367 91 2,399 Cincinnati-Hamilton, OH-KY-IN 1,823 455 992 - 48 24 3,342 Cleveland-Akron-Lorain, OH 287 1,251 225 241 247 37 2,287 Columbus, OH 306 60 7 21 1,973 2 2,369 Detroit-Ann Arbor, MI 1,381 46 46 47 156 28 1,704 Huntington-Ashland, WV-KY-OH 4,443 1 0 0 8 36 4,488 Indianapolis, IN 56 8 22 29 52 78 243 Knoxville, TN 5,089 281 345 289 - - 6,003 Louisville, KY-IN 2,615 185 0 - 1,578 273 4,651 St. Louis, MO-IL 1,895 112 - - - - 2,008 Steubenville-Weirton, OH-WV 221 22 4,189 - 13 - 4,445 Total, all Non-Attainment Areas 29,473 2,677 9,476 2,085 6,698 745 51,153
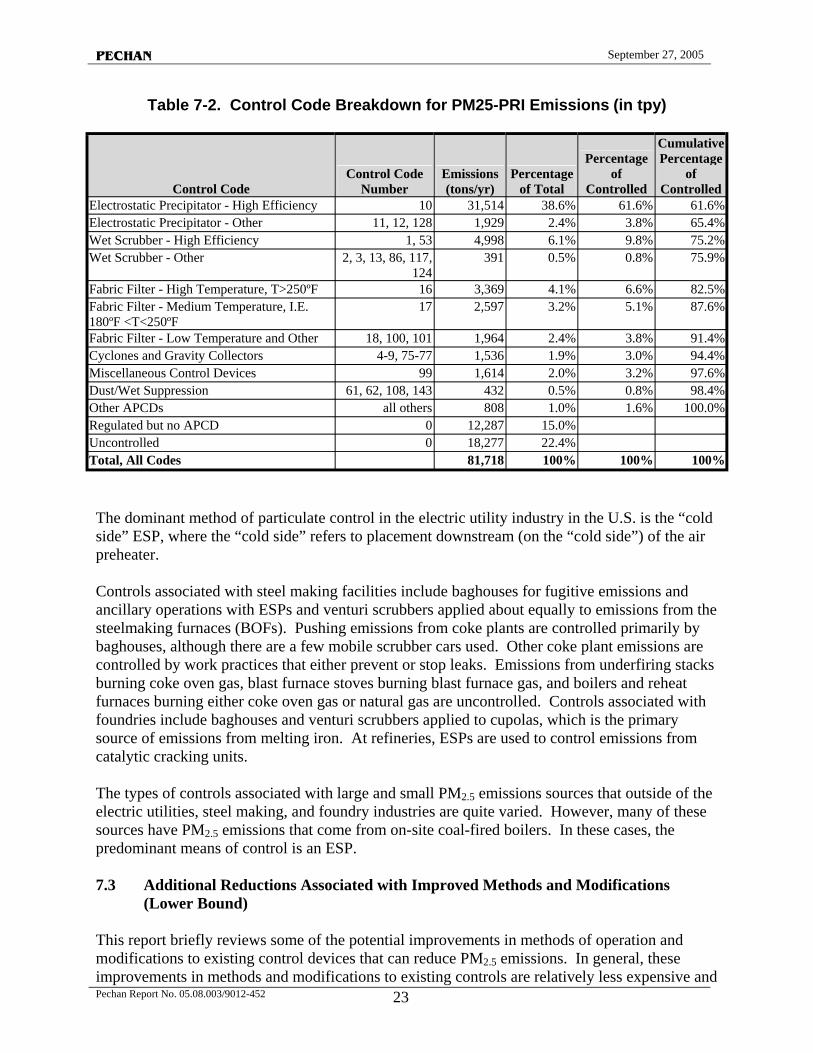
7.2 Existing Controls
Table 7-2 shows a breakdown of calculated PM25-PRI emissions for control codes, as listed in the NEI. Table 7-2 shows that the predominant method of control for large sources of PM25PRI emissions is electrostatic precipitation; approximately 65 percent of the controlled PM2.5 primary emissions come from NEI control codes associated with ESPs. Other prominent control methods include fabric filters (approximately 15 percent of emissions) and wet scrubbers (approximately 10 percent of emissions). These data are completely compatible with the finding that the SCCs with the largest emissions were associated with the electric utility industry and primary metals production.
Pechan Report No. 05.08.003/9012-452 22
PECHAN September 27, 2005
Table 7-2. Control Code Breakdown for PM25-PRI Emissions (in tpy)
Control Code Control Code
Number Emissions (tons/yr)
Percentage of Total
Percentage of
Controlled
Cumulative Percentage
of Controlled
Electrostatic Precipitator - High Efficiency 10 31,514 38.6% 61.6% 61.6% Electrostatic Precipitator - Other 11, 12, 128 1,929 2.4% 3.8% 65.4% Wet Scrubber - High Efficiency 1, 53 4,998 6.1% 9.8% 75.2% Wet Scrubber - Other 2, 3, 13, 86, 117,
124 391 0.5% 0.8% 75.9%
Fabric Filter - High Temperature, T>250ºF 16 3,369 4.1% 6.6% 82.5% Fabric Filter - Medium Temperature, I.E. 180ºF <T<250ºF
17 2,597 3.2% 5.1% 87.6%
Fabric Filter - Low Temperature and Other 18, 100, 101 1,964 2.4% 3.8% 91.4% Cyclones and Gravity Collectors 4-9, 75-77 1,536 1.9% 3.0% 94.4% Miscellaneous Control Devices 99 1,614 2.0% 3.2% 97.6% Dust/Wet Suppression 61, 62, 108, 143 432 0.5% 0.8% 98.4% Other APCDs all others 808 1.0% 1.6% 100.0% Regulated but no APCD 0 12,287 15.0% Uncontrolled 0 18,277 22.4% Total, All Codes 81,718 100% 100% 100%
The dominant method of particulate control in the electric utility industry in the U.S. is the “cold side” ESP, where the “cold side” refers to placement downstream (on the “cold side”) of the air preheater.
Controls associated with steel making facilities include baghouses for fugitive emissions and ancillary operations with ESPs and venturi scrubbers applied about equally to emissions from the steelmaking furnaces (BOFs). Pushing emissions from coke plants are controlled primarily by baghouses, although there are a few mobile scrubber cars used. Other coke plant emissions are controlled by work practices that either prevent or stop leaks. Emissions from underfiring stacks burning coke oven gas, blast furnace stoves burning blast furnace gas, and boilers and reheat furnaces burning either coke oven gas or natural gas are uncontrolled. Controls associated with foundries include baghouses and venturi scrubbers applied to cupolas, which is the primary source of emissions from melting iron. At refineries, ESPs are used to control emissions from catalytic cracking units.
The types of controls associated with large and small PM2.5 emissions sources that outside of the electric utilities, steel making, and foundry industries are quite varied. However, many of these sources have PM2.5 emissions that come from on-site coal-fired boilers. In these cases, the predominant means of control is an ESP.
7.3 Additional Reductions Associated with Improved Methods and Modifications (Lower Bound)
This report briefly reviews some of the potential improvements in methods of operation and modifications to existing control devices that can reduce PM2.5 emissions. In general, these improvements in methods and modifications to existing controls are relatively less expensive and Pechan Report No. 05.08.003/9012-452 23
PECHAN September 27, 2005
produce relatively smaller emission reductions than addition of innovative controls. Detailed discussion of the improved methods and modifications will be included in the Task 3 report, but several of the improvements are discussed below. Their applicability to various control devices is given in parenthesis, i.e., FF (fabric filter), ESP (electrostatic precipitator), WS (wet scrubber).
Improved Monitoring (FF, ESP, WS). One traditional method for evaluating particulate emissions is an opacity monitor. However, opacity monitors are frequently not capable of evaluating performance within specific modules of a control device, and also are limited in value for low opacity emissions. Consequently, improved continuous particulate monitoring techniques have been developed, using techniques including the triboelectric effect (in which particle friction produces an electrical signal), and backscattering of light (as opposed to extinction of light, which is the effect measured by opacity monitors). These improved monitoring techniques can diagnose problems within specific sections of control devices (e.g. fabric filter bag leak detectors) and can detect problems sooner than they can be detected with traditional opacity monitors.
Addition of Conditioning Agents (ESP, WS, BH). Pulverized-coal-fired power plants that switch to low-sulfur coal often experience problems with high-resistivity fly ash. Operators may add “conditioning agents” to alter the properties of the ash, including attempting to lower resistivity and increase particulate “stickiness.” Conditioning agents that are added include sulfur trioxide (SO3), ammonia, trona (hydrated sodium carbonate/bicarbonate), and various proprietary agents. Although SO3 conditioning can improve total particulate collection for ESPs, it can also lead to increased emission of very fine particulate, resulting in a “blue plume” (Bayless et al., 2000). Therefore, other conditioning agents are currently under evaluation. Ritzenthaler and Maziuk (2004) report the results of an evaluation of trona injection at Unit 2 of the General James M. Gavin Plant in Cheshire, OH. Injection of Trona (dry sorbent injection, or DSI) between the air heater outlet and the inlet of the ESP resulted in removal of SO3. Removal rates ranged from a low of 63 percent at approximately 1 ton per hour to a high of 86 percent at a rate of approximately 5 tons per hour DSI. Similarly, additives can be injected in wet scrubbing solution to help condense and remove aerosol component in the exhaust gas. Injection of powdered activated carbon has been investigated as a means to improve mercury removal efficiency; powdered activated carbon should also adsorb (and thereby improve the control device performance for) condensable organic matter.
ESP Upgrades (ESP). The general label of ESP upgrades includes replacement of weighted-wire electrodes with rigid discharge electrodes, and addition of advanced electronic controls, including pulsed energization. The corona discharge electrodes in ESPs have traditionally been weighted wires hung between the collecting plates. The problem with weighted wires is that the wire can snap, causing the discharge wire to short into the grounded collecting plate. Many ESP users and rebuilders have avoided this problem by going to rigid (non-wire) discharge electrodes. These electrodes avoid the shorting problem that can occur with weighted-wire electrodes. Another potential upgrade for ESPs is the conversion of antiquated electrical controls to modern electronic controls, including the possibility of pulsed energization. Traditionally, the amount of particulate charging that can be achieved by an ESP is limited, due to the problems of sparking and back-corona that occur, particularly with high-resistivity fly ash. Modern computerized controls can reduce these problems; one technique is to substitute the steady voltage of traditional ESPs with voltage pulses (pulsed energization). Pulsed energization allows for higher voltages (improved particle charging) while minimizing the problems of back-corona and Pechan Report No. 05.08.003/9012-452 24
PECHAN September 27, 2005
sparking. One proprietary version of pulsed energization is Rapid Onset Pulsed Energization (ROPE). A pilot plant employing this technology was installed at the Miller Plant, and reported to result in a threefold reduction in particulate penetration (Southern Company, 2004).
ESP upgrades may also include increasing the size of the precipitator (i.e., adding an additional collection cell, either in series or in parallel). Increasing the size of the precipitator increases treatment time: the longer a particle spends in the precipitator, the greater its chance of being collected, other things being equal. Precipitator size also is related to the specific collection area (SCA), the ratio of the surface area of the collection electrodes to the gas flow. Higher collection areas tend to lead to better removal efficiencies. Modern ESPs in the U.S. have collection areas in the range of 200-800 square feet (ft²)/1000 per actual cubic feet per minute (acfm). In order to achieve collection efficiencies of 99.5%, specific collection areas of 350-400 ft²/1000 acfm are typically used. Some older precipitators on utility boilers are small, with specific collection areas below 200 ft²/1000 acfm and correspondingly short treatment times. Expansion of these precipitators, or their replacement with larger precipitators, can lead to greatly enhanced performance (Institute of Clean Air Companies, 2004). However, space limitations at many plants limit the ability to significantly increase precipitator size.
Improved Filter Fabrics (FF). In the last decade, there has been increasing use of membrane-coated fabrics (e.g., Teflon, or polytetrafluoroethene [PTFE]) in fabric filters. The membranes on these fabrics have very small holes through which air flows. This type of filtration changes the method of filtration from filtration caused by the deposited dust layer to filtration caused by the membrane itself. Due to the very small holes (as small as 0.4 µm in diameter), penetration of PM2.5 can be significantly reduced as long as the membrane remains intact. Lillieblad et al. (2003) examined PM2.5 and mercury emissions from a high air-to-cloth ratio fabric filter located after a pulverized coal-fired boiler (located in Finland). The bags were polyphensulfide (PPS) with intrinsic Teflon (PTFE) coating. At the time of testing, the bags had been in service for more than 31,000 hours. An inspection of the filters was performed prior to the measurements to check that the bags were in good condition. Results of the testing indicated an overall particulate collection efficiency of 99.88 percent, a PM2.5 collection efficiency of 99.6 percent, and a PM10 collection efficiency of 63.5 percent.
Increased Scrubber Pressure Drop (WS). There are several old venturi scrubbers (30 to 50 years old) applied to BOFs at integrated iron and steel plants and to cupolas at iron foundries. During the development of the MACT standards for these source categories, we identified plants with scrubbers operating at pressure drops of 25 to 30 inches of water or achieving PM control levels on the order of 0.05 grains per dry standard cubic feet and higher. For example, the venturi scrubbers at Ispat-Inland (Lake County, IN) and AK Steel (Middletown, OH) were evaluated, and the MACT analysis indicated they would have to be upgraded or replaced to meet the MACT standard when it becomes effective in 2006. The higher pressure drop scrubbers are expected to reduce PM emissions by about 50 percent. The MACT standard for cupolas at iron foundries will likely force facilities with wet scrubbers to install a baghouses when it becomes effective in 2007.
Reduce Temperature of the Exhaust Gas Inlet to the Control Device (ESP, FF, WS). In general, particulate control systems are ineffective at removing gaseous-phase components of the gas stream. Most of the significant PM2.5 point source emissions occur from combustion processes or other sources operated at high temperatures. As discussed in Section 2, exhaust gas Pechan Report No. 05.08.003/9012-452 25
PECHAN September 27, 2005
temperature is the primary factor influencing the state of condensable PM from stationary sources. Reducing the temperature of the exhaust gas prior to the PM control device increases the amount of “condensable” PM that is in particulate form within the control device. That is, at lower temperatures, the ratio of PM25-FIL to PM-CON increases, and the overall PM2.5 removal efficiency of the control system increases because the control systems can now effectively reduce the “condensed” PM. The temperature of the exhaust gases can be reduced through the use of heat recovery or other gas cooling technologies.
Table 7-3 summarizes estimates of the additional reductions in PM2.5 emissions that can be achieved by improved methods and modifications to existing controls. These removal efficiencies are based on the control efficiencies reported in the literature (as discussed above) and engineering judgment as to the average performance improvements that can be achieved when implementing these improvements to the variety of “controlled” emission sources within the 16 NAAs.
7.4 Additional Reductions Associated with Innovative Controls (Upper Bound)
Replacement or addition of innovative controls to existing controls produces relatively larger reductions in PM2.5 emissions than simple improvements in methods of operation or minor modifications. However, replacement of existing controls or addition of innovative controls is also relatively more expensive than improved methods of operation or modifications to existing controls.
Advanced Hybrid Collector (ESP). The Advanced Hybrid™ filter combines electrostatic precipitation with fabric filtration. The internal geometry contains alternating rows of ESP components (discharge electrodes and perforated collector plates) and filter bags. Particulate-laden flue gas enters the ESP sections, and significant amounts are precipitated on the perforated collection plates. The perforated plates also allow flue gas to be drawn through the plates to be collected on the filter bags. The filter bags have a Gore-Tex® membrane coating, and are pulse-cleaned (Gebert et al., 2004). A full-scale Advanced Hybrid™ Collector was recently installed at the Big Stone Plant near Milbank, South Dakota. The goal of the project is a particulate capture efficiency of over 99.99%. This can be compared to the original ESP, which had a particulate capture efficiency of 99.5% (University of North Dakota Energy and Environmental Research Center, 2004).
Compact Hybrid Particulate Collector (COHPAC) (ESP). COHPAC is a pulse jet filter module operated at a very high filtration velocity (air-to-cloth ratio), installed downstream of an ESP. The function of a COHPAC is as a “polishing filter,” collecting the particulate (especially fine particulate) that escapes an ESP. A full-scale COHPAC system has been installed at the Gaston power plant near Birmingham, AL (Southern Company, 2004).
Indigo Particle Agglomerator (ESP). The Indigo Agglomerator was developed in Australia to reduce visible emissions from coal-fired boilers. The Indigo Agglomerator contains two sections, a bipolar charger followed by a mixing section. The bipolar charger has alternate passages with positive or negative charging. That is, the even passages may be positive and the odd passages negative, or vice versa. This can be contrasted with a conventional coal-fired boiler precipitator, which has only negative charging electrodes. Following the charging sections, a mixing process takes place, where the negatively charged particles from a negative Pechan Report No. 05.08.003/9012-452 26
PECHAN September 27, 2005
passage are mixed with the positively charged particles from a positive passage. The close proximity of particles with opposite charges causes them to electrostatically attach to each other. These agglomerates enter the precipitator where they are easily collected due to their larger size.
Crynack et al. (2004) reported on the reductions in fine particulate (PM2.5) emissions achieved when an Indigo Agglomerator was installed at the Watson plant; a 250 megawatt (MW) coal-fired power plant in Mississippi. The agglomerator was installed on one of two identical, parallel precipitators, such that the results could be compared between a precipitator with the agglomerator and one without. Both precipitators had three mechanical zones and six electrical zones. Agglomerator performance was tested with two coals, a western coal from Colorado, and an Eastern coal from Illinois. Both coals showed significant fine particulate emission reductions with the agglomerator. Crynack et al. reported a “300 percent reduction” (presumably indicating a factor of 3 reduction or, in other words, a two-thirds reduction) in the emission of fine particles less than 5 µm in diameter, a two-thirds reduction in opacity, and a one-third reduction in total particulate mass emission. Crynack et al. also reported that, without the agglomerator, particle penetration peaked at 15 percent for 1 µm particles; this was reduced to 3 percent with the agglomerator. Finally, for particles with a size less than 2.5 µm, emissions were reduced by 75 percent with both coals.
Wet ESP (ESP, WS, FF). As discussed previously, one significant barrier to improved ESP performance is that increasing energy levels can lead to excessive sparking and back-corona. This is particularly problematic with high-resistivity fly ash, as occurs with low-sulfur coals. Another problem with ESPs is that operating at lower temperatures, which can improve collection of condensable PM, can result in condensation on the ESP collection plates, causing corrosion. One method of avoiding these problems is a wet ESP, which bathes the collection plates in liquid. Farber et al. (2004) report that, for electrical utility power plants, a wet ESP is typically installed between a wet flue gas desulfurization (FGD) absorber and the stack for removing remaining fly ash as well as condensed sulfuric acid. These wet ESPs may be mounted at grade for horizontal flow or on top of the absorber for vertical flow. Utility applications include the AES Deepwater cogeneration plant in Houston since 1986, Xcel Energy’s Sherbourne County Station, and an installation on top of an FGD absorber at New Brunswick Power’s Coleson Cove plant in 2002. Also, Wisconsin Energy selected wet ESPs for their 1,000 MW Elm Road project. Farber et al. (2004) state that an advantage of wet ESPs is increased power level (2 watts per actual cubic feet per minute (W/acfm), versus 0.1 to 0.5 W/acfm for a dry ESP). They note that wet ESPs can “very effectively capture sulfuric acid aerosols (90%+).” Wet ESPs may also be used as a polishing unit for an existing dry ESP.
Wet Membrane ESP (ESP). The wet membrane ESP attempts to avoid problems of water channeling and resulting dry spots than can occur with wet ESPs, and the higher-cost metals that must be employed to avoid corrosion in a traditional wet ESP. The membranes are made from materials that transport flushing liquid by capillary action effectively removing collected material without spraying (Southern Environmental Corporation, 2004).
Horizontal Baghouse (FF). During the development of the iron and steel foundry MACT, two different facilities operated a cupola controlled with a baghouse with horizontally supported bags (referred to as a horizontal baghouse). The bag material in this type of baghouse does not need to be as thick and strong as a vertical baghouse simply to support the weight of the bag and collected dust. The thinner bags, low operating temperature, and low air-to-cloth ratios of these Pechan Report No. 05.08.003/9012-452 27
PECHAN September 27, 2005
horizontal baghouses allowed for easier pulse-cleaning. Each of these horizontal baghouses exhibited lower outlet PM concentrations by more than a factor of 2 compared to the best performing vertical baghouse system.
Table 7-4 summarizes estimates of the additional reductions in PM2.5 emissions that can be achieved by addition of innovative controls to existing controls, or by replacement of existing controls with innovative controls. These removal efficiencies are based on the control efficiencies reported in the literature (as discussed above) and engineering judgment as to the performance improvements that can be achieved when replacing the existing control device with a more efficient conventional control device (e.g., a low temperature baghouse) or a innovative control system averaged across the variety of “controlled” emission sources within the 16 NAAs.
Pechan Report No. 05.08.003/9012-452 28
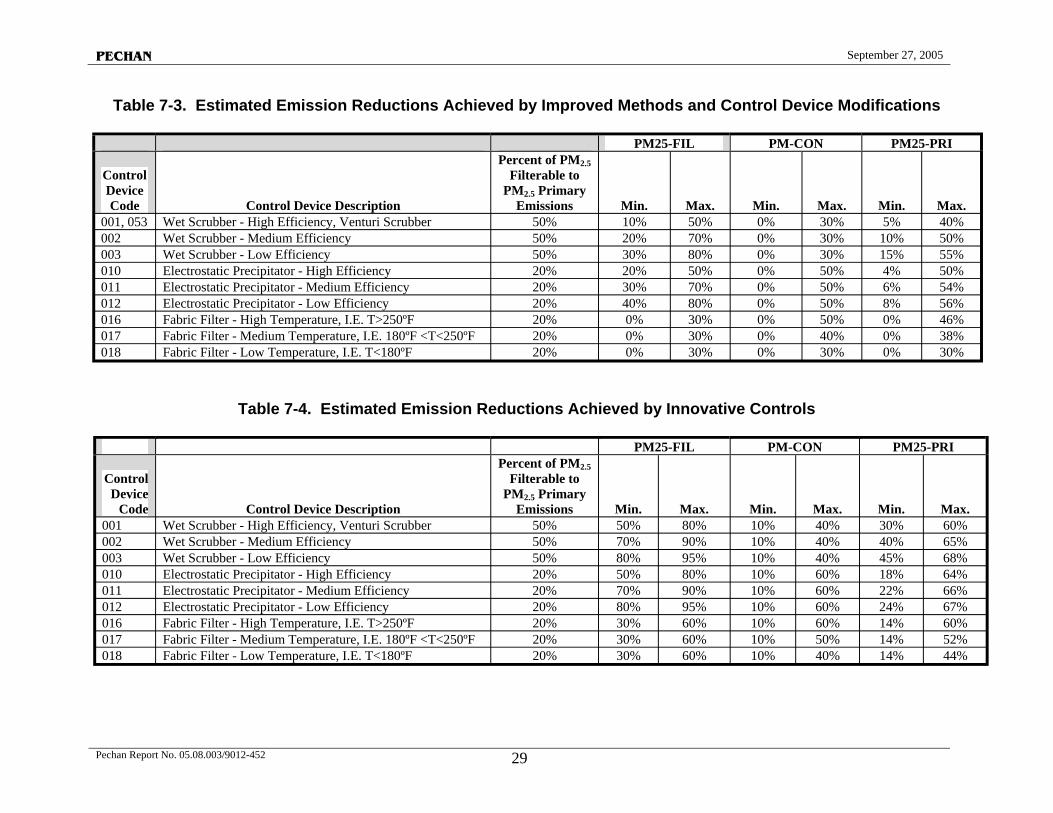
PECHAN September 27, 2005
Table 7-3. Estimated Emission Reductions Achieved by Improved Methods and Control Device Modifications
PM25-FIL PM-CON PM25-PRI
Control Device Code Control Device Description
Percent of PM2.5 Filterable to
PM2.5 Primary Emissions Min. Max. Min. Max. Min. Max.
001, 053 Wet Scrubber - High Efficiency, Venturi Scrubber 50% 10% 50% 0% 30% 5% 40% 002 Wet Scrubber - Medium Efficiency 50% 20% 70% 0% 30% 10% 50% 003 Wet Scrubber - Low Efficiency 50% 30% 80% 0% 30% 15% 55% 010 Electrostatic Precipitator - High Efficiency 20% 20% 50% 0% 50% 4% 50% 011 Electrostatic Precipitator - Medium Efficiency 20% 30% 70% 0% 50% 6% 54% 012 Electrostatic Precipitator - Low Efficiency 20% 40% 80% 0% 50% 8% 56% 016 Fabric Filter - High Temperature, I.E. T>250ºF 20% 0% 30% 0% 50% 0% 46% 017 Fabric Filter - Medium Temperature, I.E. 180ºF <T<250ºF 20% 0% 30% 0% 40% 0% 38% 018 Fabric Filter - Low Temperature, I.E. T<180ºF 20% 0% 30% 0% 30% 0% 30%
Table 7-4. Estimated Emission Reductions Achieved by Innovative Controls
PM25-FIL PM-CON PM25-PRI
Control Device
Code Control Device Description
Percent of PM2.5 Filterable to
PM2.5 Primary Emissions Min. Max. Min. Max. Min. Max.
001 Wet Scrubber - High Efficiency, Venturi Scrubber 50% 50% 80% 10% 40% 30% 60% 002 Wet Scrubber - Medium Efficiency 50% 70% 90% 10% 40% 40% 65% 003 Wet Scrubber - Low Efficiency 50% 80% 95% 10% 40% 45% 68% 010 Electrostatic Precipitator - High Efficiency 20% 50% 80% 10% 60% 18% 64% 011 Electrostatic Precipitator - Medium Efficiency 20% 70% 90% 10% 60% 22% 66% 012 Electrostatic Precipitator - Low Efficiency 20% 80% 95% 10% 60% 24% 67% 016 Fabric Filter - High Temperature, I.E. T>250ºF 20% 30% 60% 10% 60% 14% 60% 017 Fabric Filter - Medium Temperature, I.E. 180ºF <T<250ºF 20% 30% 60% 10% 50% 14% 52% 018 Fabric Filter - Low Temperature, I.E. T<180ºF 20% 30% 60% 10% 40% 14% 44%
Pechan Report No. 05.08.003/9012-452 29
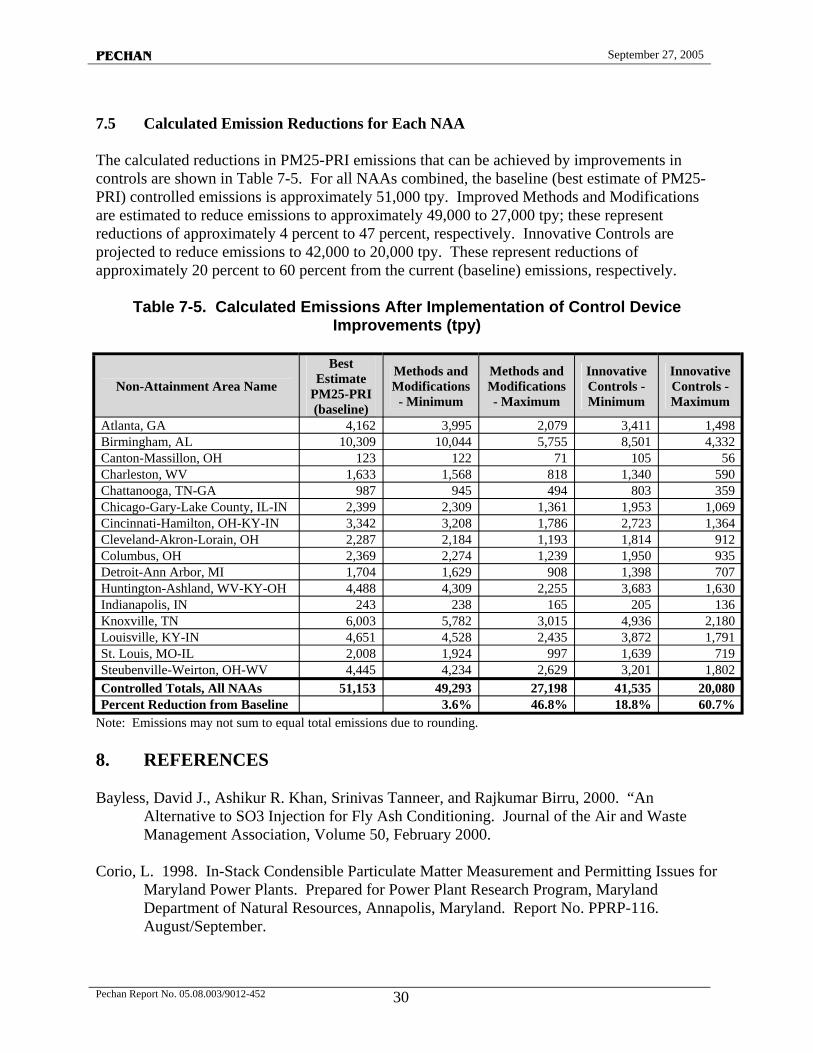
PECHAN September 27, 2005
7.5 Calculated Emission Reductions for Each NAA
The calculated reductions in PM25-PRI emissions that can be achieved by improvements in controls are shown in Table 7-5. For all NAAs combined, the baseline (best estimate of PM25PRI) controlled emissions is approximately 51,000 tpy. Improved Methods and Modifications are estimated to reduce emissions to approximately 49,000 to 27,000 tpy; these represent reductions of approximately 4 percent to 47 percent, respectively. Innovative Controls are projected to reduce emissions to 42,000 to 20,000 tpy. These represent reductions of approximately 20 percent to 60 percent from the current (baseline) emissions, respectively.
Table 7-5. Calculated Emissions After Implementation of Control Device Improvements (tpy)
Non-Attainment Area Name
Best Estimate
PM25-PRI (baseline)
Methods and Modifications
- Minimum
Methods and Modifications - Maximum
Innovative Controls Minimum
Innovative Controls Maximum
Atlanta, GA 4,162 3,995 2,079 3,411 1,498 Birmingham, AL 10,309 10,044 5,755 8,501 4,332 Canton-Massillon, OH 123 122 71 105 56 Charleston, WV 1,633 1,568 818 1,340 590 Chattanooga, TN-GA 987 945 494 803 359 Chicago-Gary-Lake County, IL-IN 2,399 2,309 1,361 1,953 1,069 Cincinnati-Hamilton, OH-KY-IN 3,342 3,208 1,786 2,723 1,364 Cleveland-Akron-Lorain, OH 2,287 2,184 1,193 1,814 912 Columbus, OH 2,369 2,274 1,239 1,950 935 Detroit-Ann Arbor, MI 1,704 1,629 908 1,398 707 Huntington-Ashland, WV-KY-OH 4,488 4,309 2,255 3,683 1,630 Indianapolis, IN 243 238 165 205 136 Knoxville, TN 6,003 5,782 3,015 4,936 2,180 Louisville, KY-IN 4,651 4,528 2,435 3,872 1,791 St. Louis, MO-IL 2,008 1,924 997 1,639 719 Steubenville-Weirton, OH-WV 4,445 4,234 2,629 3,201 1,802 Controlled Totals, All NAAs 51,153 49,293 27,198 41,535 20,080 Percent Reduction from Baseline 3.6% 46.8% 18.8% 60.7%
Note: Emissions may not sum to equal total emissions due to rounding.
8. REFERENCES
Bayless, David J., Ashikur R. Khan, Srinivas Tanneer, and Rajkumar Birru, 2000. “An Alternative to SO3 Injection for Fly Ash Conditioning. Journal of the Air and Waste Management Association, Volume 50, February 2000.
Corio, L. 1998. In-Stack Condensible Particulate Matter Measurement and Permitting Issues for Maryland Power Plants. Prepared for Power Plant Research Program, Maryland Department of Natural Resources, Annapolis, Maryland. Report No. PPRP-116. August/September.
Pechan Report No. 05.08.003/9012-452 30
PECHAN September 27, 2005
Crynack, Robert, Rodney Truce, Wallis Harrison, 2004. “Reducing Fine Particulate Emissions from U.S. Coals Using the Indigo Agglomerator.” Paper Number 04-A-42-AWMA, presented at the 2004 Air &Waste Management Association (AWMA) Combined Power Plant Control Mega Symposium.
Farber, Paul S., Daniel L. Marmer, William DePriest, 2004. “Condensible Particulate Matter: Sources and Control in Coal-Fired Power Plants.” Paper Number 17, presented at the 2004 Air &Waste Management Association (AWMA) Combined Power Plant Control Mega Symposium.
Gebert, Richard, Craig Rinschler, Dwight Davis, Ulrich Leibacher, Peter Studer, Walter Eckert, William Swanson, Jeffrey Endrizzi, Thomas Hrdlicka, Stanley J. Miller, Michael L. Jones, Ye Zhuang, and Michael Collings, 2004. “Commercialization of the Advanced Hybrid™ Filter Technology.” Available at: http://www.netl.doe.gov/publications/proceedings/02/air_q3/Gerbert.pdf. Accessed August 26, 2005.
Institute of Clean Air Companies, 2004. “Control Technology Information.” Available at: http://www.icac.com/controls.html#esp. Accessed September 25, 2005.
Lillieblad, L. and P. Wieslander, 2003. “PM2.5 and Mercury Emissions From a High Ratio Fabric Filter After a Pulverized Coal Fired Boiler.” Paper #200 at 2003 Air & Waste Management Association Combined Power Plant Control Mega Symposium. Available at: http://www.icac.com/controlhg/MEGA03_200.pdf. Accessed August 26, 2005.
Ritzenthaler, Douglas P. and John Maziuk, 2004. “Successful Mitigation of SO3 Emissions While Simultaneously Enhancing ESP Operation at the General James M. Gavin Plant in Cheshire, Ohio by Employing Dry Sorbent Injection of Trona Upstream of the ESP.” Presented at the A&WMA/EPA/DOE/EPRI Combined Power Plant Air Pollutant Control in Washington DC, August 30 – September 2, 2004.
Southern Company, 2004. “Emission Control Systems.” Available at: http://www.southerncompany.com/gapower/about/pdf/Air%20Quality.pdf. Accessed August 26, 2005.
Southern Environmental Corporation, 2004. “Membrane WESP: A Lower Cost Way to Reduce PM2.5, SO3 & Hg+2 Emissions.” Available at: http://www.southernenvironmental.com/_pdf/12_Dec_MEMRANE_WESP_REPORT_4t hRev.pdf. Accessed August 26, 2005.
University of North Dakota Energy and Environmental Research Center, 2004. “Advanced Hybrid Filter.” Available at: http://www.undeerc.org/commercialization/projects/hybrid.asp. Accessed August 26, 2005.
EPA, 1995. U.S. Environmental Protection Agency, Compilation of Emission Factors, AP 42, Volume I, Fifth Edition -- January 1995.
Pechan Report No. 05.08.003/9012-452 31