future challenges for big pharma
DESCRIPTION
Future Challenges for Big Pharma - - Dr. Aurup 1-11-12TRANSCRIPT

Future Challenges for
Big Pharma
Peter Aurup, MDVP & Head - Global
Clinical Trial Operations
January 11, 2012
2
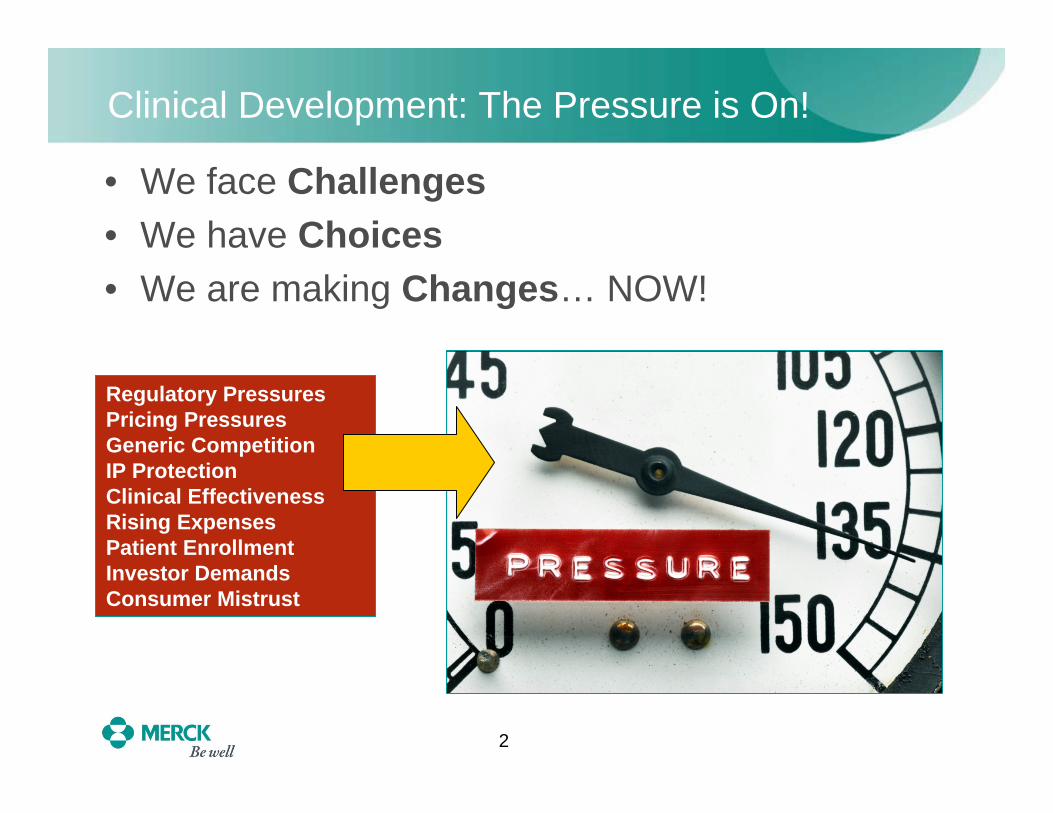
Clinical Development: The Pressure is On!
• We face Challenges• We have Choices• We are making Changes… NOW!
Regulatory PressuresPricing Pressures Generic CompetitionIP ProtectionClinical EffectivenessRising ExpensesPatient EnrollmentInvestor DemandsConsumer Mistrust

CHALLENGES
4
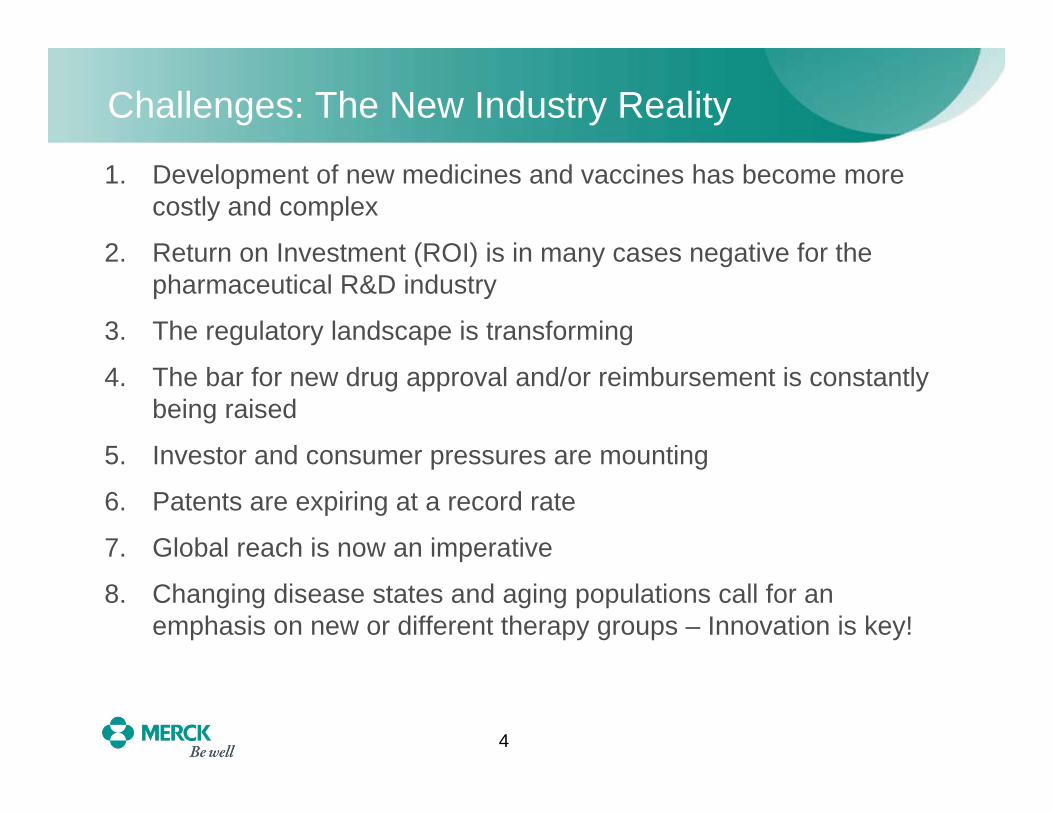
Challenges: The New Industry Reality
1. Development of new medicines and vaccines has become more costly and complex
2. Return on Investment (ROI) is in many cases negative for the pharmaceutical R&D industry
3. The regulatory landscape is transforming
4. The bar for new drug approval and/or reimbursement is constantlybeing raised
5. Investor and consumer pressures are mounting
6. Patents are expiring at a record rate
7. Global reach is now an imperative
8. Changing disease states and aging populations call for an emphasis on new or different therapy groups – Innovation is key!
5
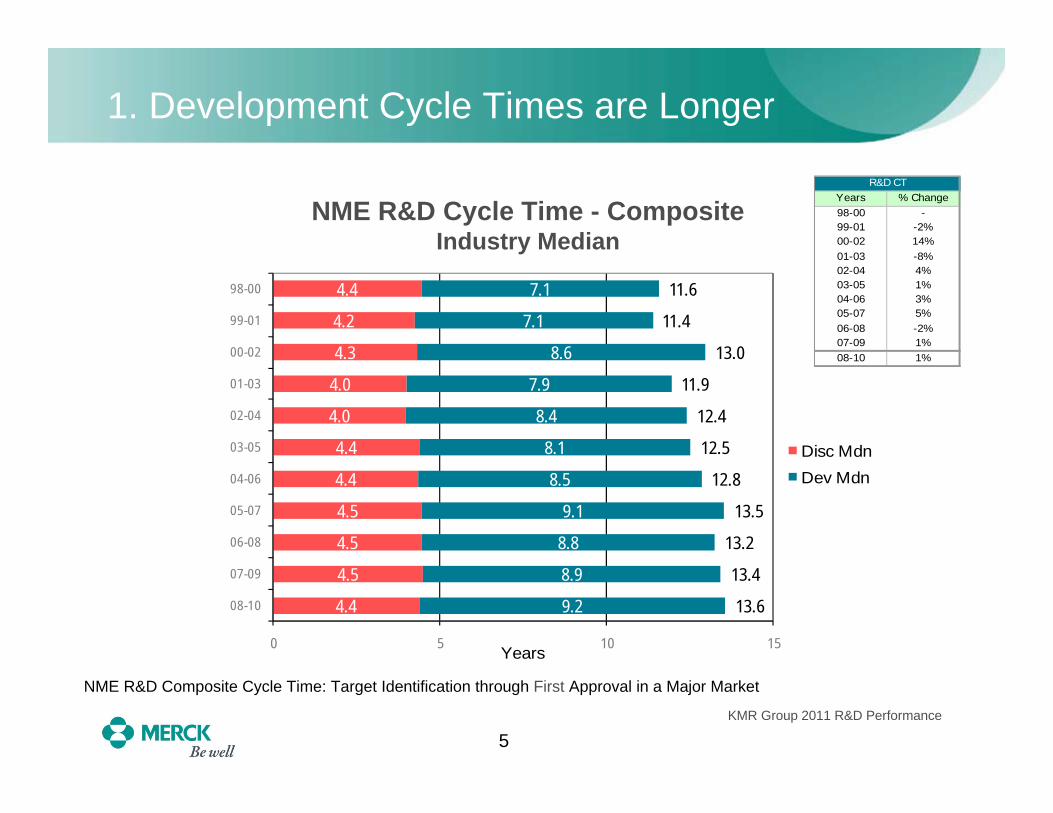
1. Development Cycle Times are Longer
NME R&D Cycle Time - CompositeIndustry Median
NME R&D Composite Cycle Time: Target Identification through First Approval in a Major Market
4.4
4.5
4.5
4.5
4.4
4.4
4.0
4.0
4.3
4.2
4.4
9.2
8.9
8.8
9.1
8.5
8.1
8.4
7.9
8.6
7.1
7.1
13.6
13.4
13.2
13.5
12.8
12.5
12.4
11.9
13.0
11.4
11.6
0 5 10 15
08-10
07-09
06-08
05-07
04-06
03-05
02-04
01-03
00-02
99-01
98-00
Years
Disc MdnDev Mdn
Years % Change98-00 -99-01 -2%00-02 14%01-03 -8%02-04 4%03-05 1%04-06 3%05-07 5%06-08 -2%07-09 1%08-10 1%
R&D CT
KMR Group 2011 R&D Performance
6
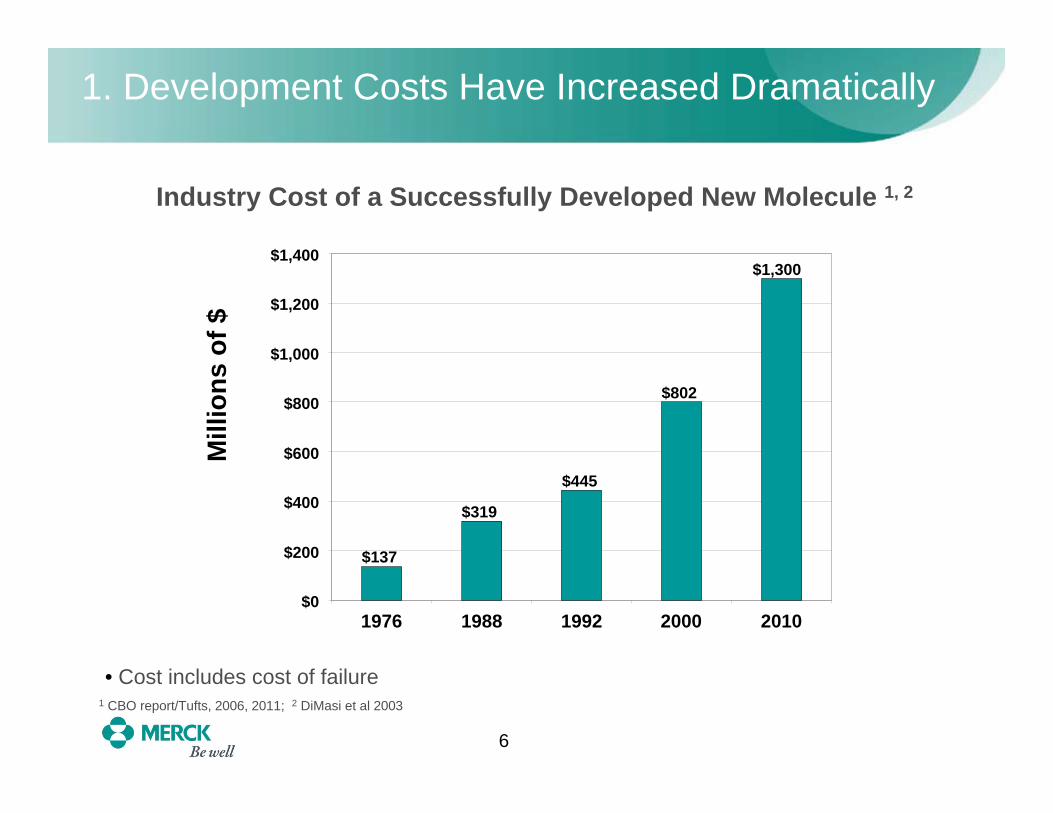
1. Development Costs Have Increased Dramatically
Industry Cost of a Successfully Developed New Molecule 1, 2
• Cost includes cost of failure
$137
$319
$445
$802
$1,300
$0
$200
$400
$600
$800
$1,000
$1,200
$1,400
1976 1988 1992 2000 2010
Mill
ions
of $
1 CBO report/Tufts, 2006, 2011; 2 DiMasi et al 2003
7
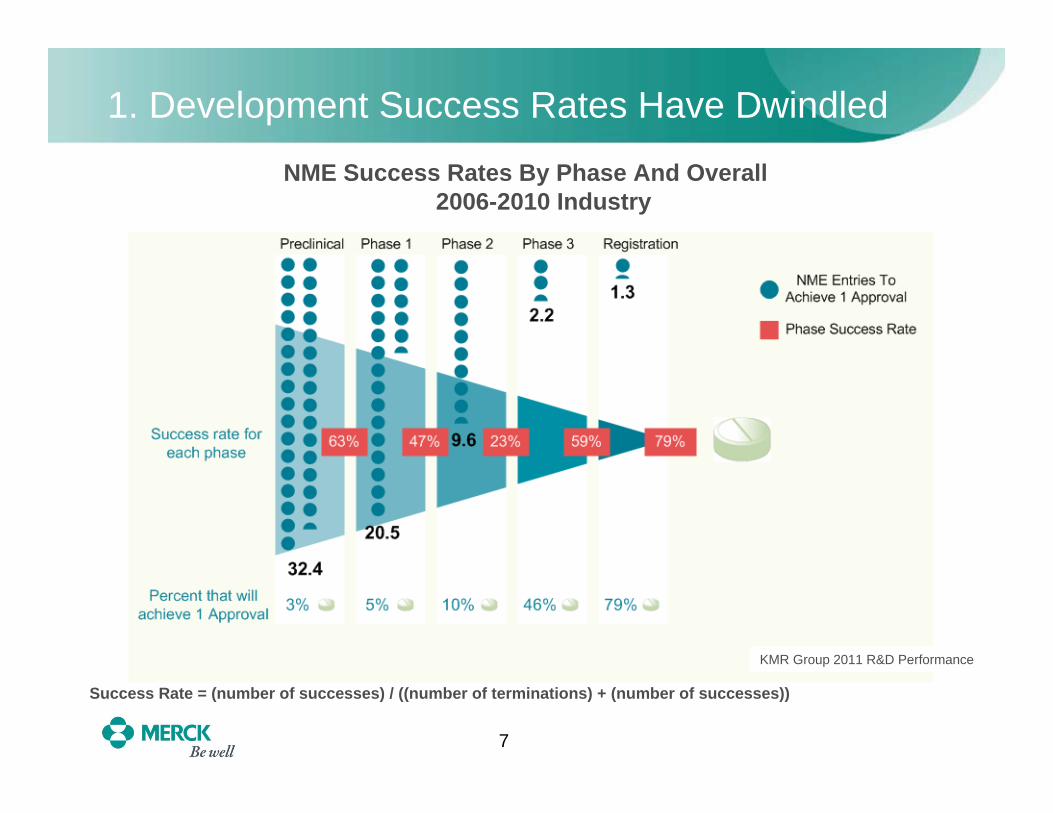
1. Development Success Rates Have Dwindled
NME Success Rates By Phase And Overall2006-2010 Industry
Success Rate = (number of successes) / ((number of terminations) + (number of successes))
KMR Group 2011 R&D Performance

8
2. ROI for R&D in the Pharmaceutical Industry has Turned Negative
Source: Credit Suisse / C. Arnold et al.; published in In Vivo: The Business & Medicine Report, April 2009
R&D Investment as a Percentage of Sales Has Increased, While ROI has Decreased
56
78 8
11 11
13 1314
15 1516 16
9
0
2
4
6
8
10
12
14
16
18
1980 1982 1984 1986 1988 1990 1992 1994 1996 1998 2000 2002 2004 2006 2008
R&
D/S
ales
0.00.20.40.60.81.01.21.41.61.82.02.22.42.62.83.0
Sales/C
apitalized R&
D
Note: The capitalized R&D analysis is Sales for a given year/R&D spend for 11 years (adjusted for inflation).
Sales/Capitalized R&D InvestmentR&D/Sales
9
3. Regulatory Landscape is More Difficult to Navigate
• The regulatory landscape is changing• Outcomes data often requested prior to drug approval
• Greater emphasis on product safety requires extensive data
• Increased post-marketing regulatory requirements
• More requirements to conduct clinical trials in a country as a prelude to registering and marketing a product• Need good interaction with local regulatory agencies for clinical
trial authorization
10
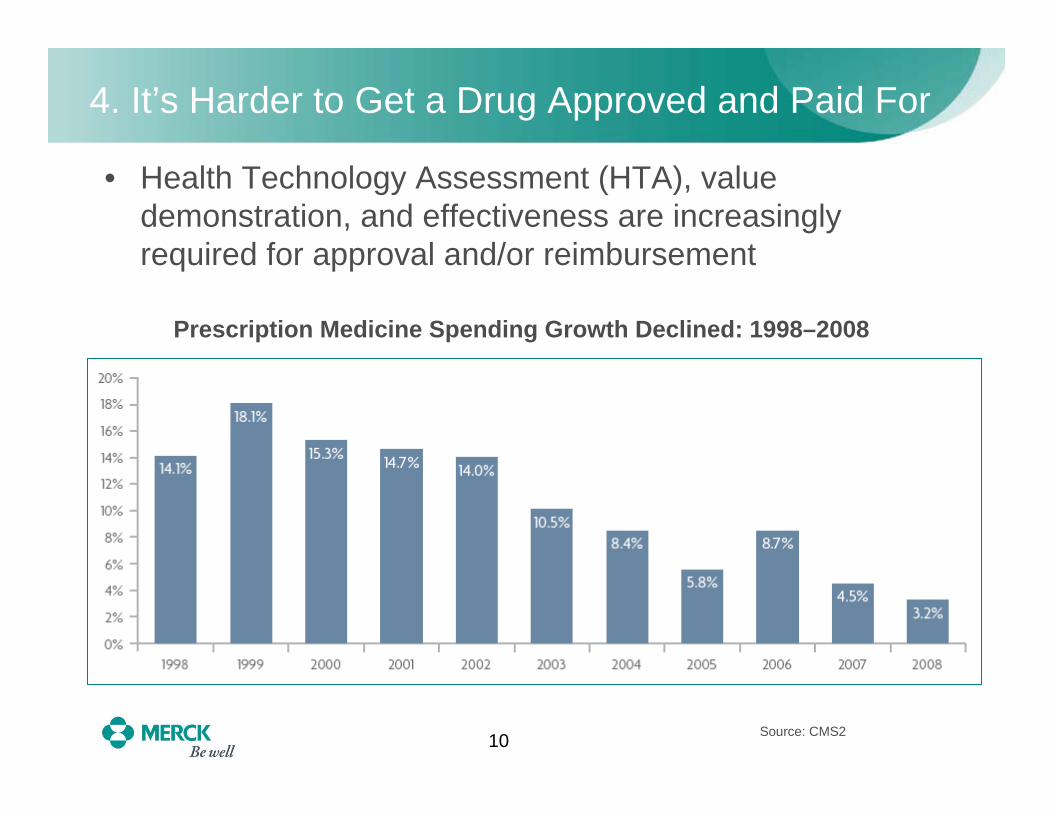
4. It’s Harder to Get a Drug Approved and Paid For
• Health Technology Assessment (HTA), value demonstration, and effectiveness are increasingly required for approval and/or reimbursement
Prescription Medicine Spending Growth Declined: 1998–2008
Source: CMS2
11
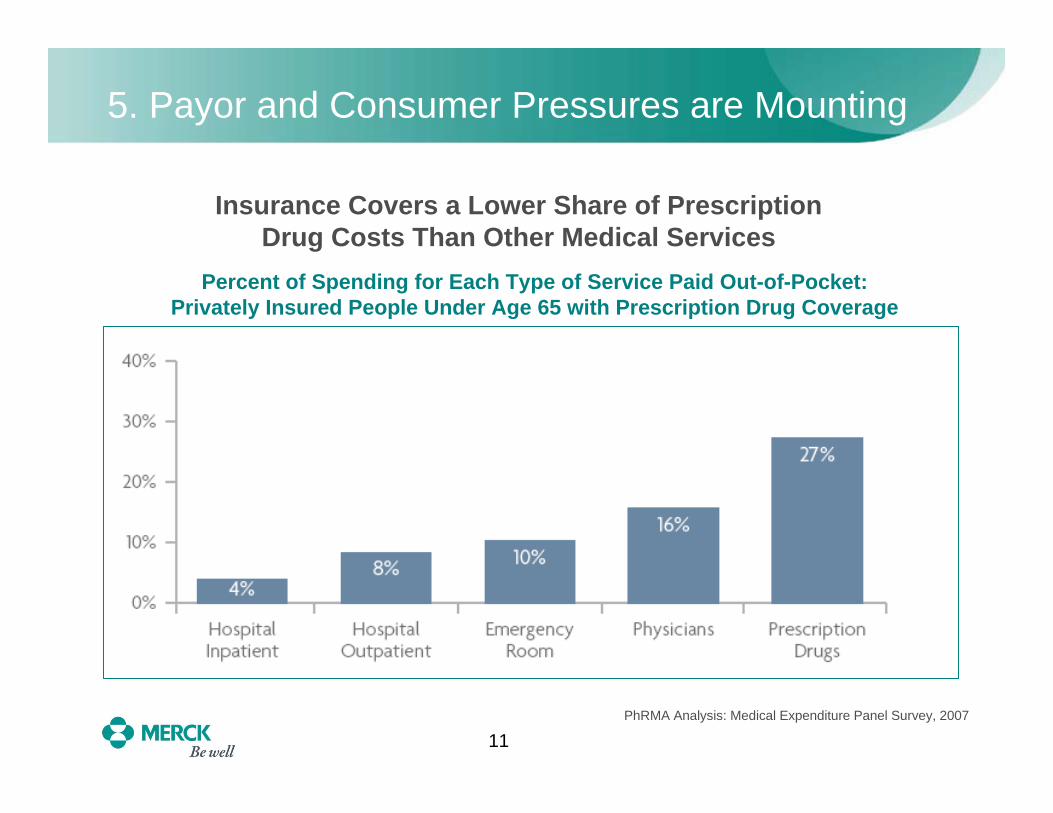
5. Payor and Consumer Pressures are Mounting
Percent of Spending for Each Type of Service Paid Out-of-Pocket: Privately Insured People Under Age 65 with Prescription Drug Coverage
Insurance Covers a Lower Share of PrescriptionDrug Costs Than Other Medical Services
PhRMA Analysis: Medical Expenditure Panel Survey, 2007
12
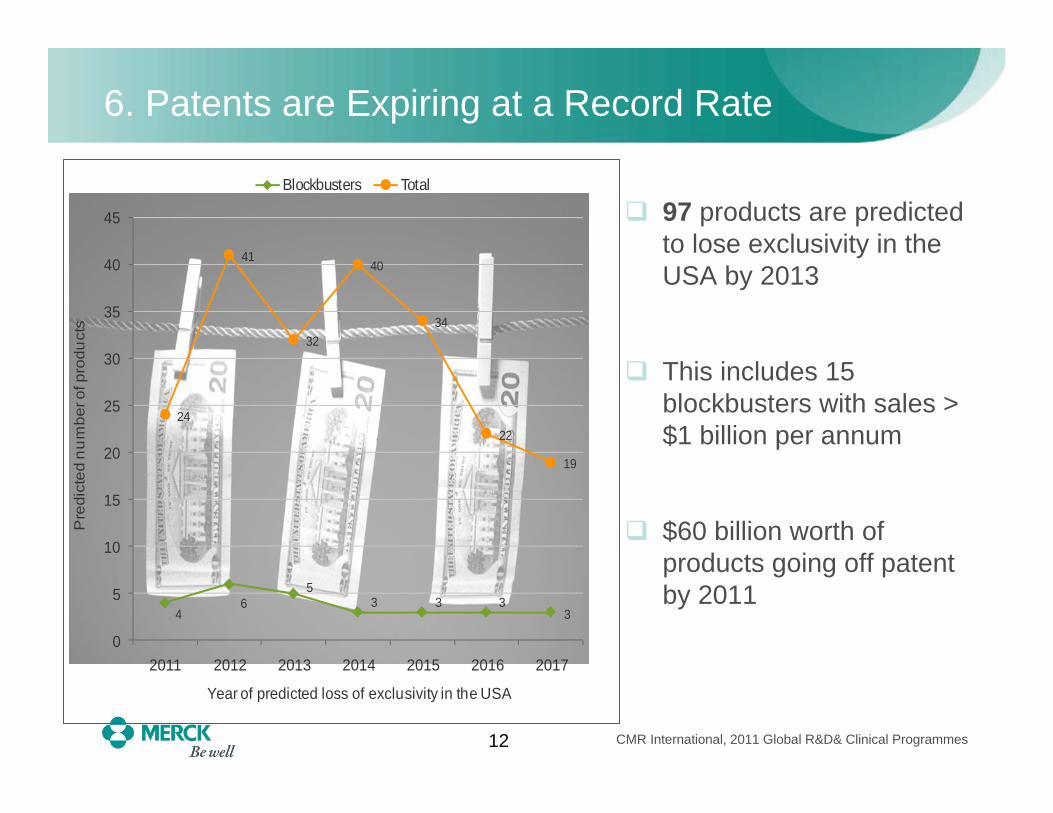
6. Patents are Expiring at a Record Rate
46
53 3 3
3
24
41
32
40
34
22
19
0
5
10
15
20
25
30
35
40
45
2011 2012 2013 2014 2015 2016 2017
Pre
dict
ed n
um
ber o
f pro
duct
s
Year of predicted loss of exclusivity in the USA
Blockbusters Total
97 products are predicted to lose exclusivity in the USA by 2013
This includes 15 blockbusters with sales > $1 billion per annum
$60 billion worth of products going off patent by 2011
CMR International, 2011 Global R&D& Clinical Programmes
13
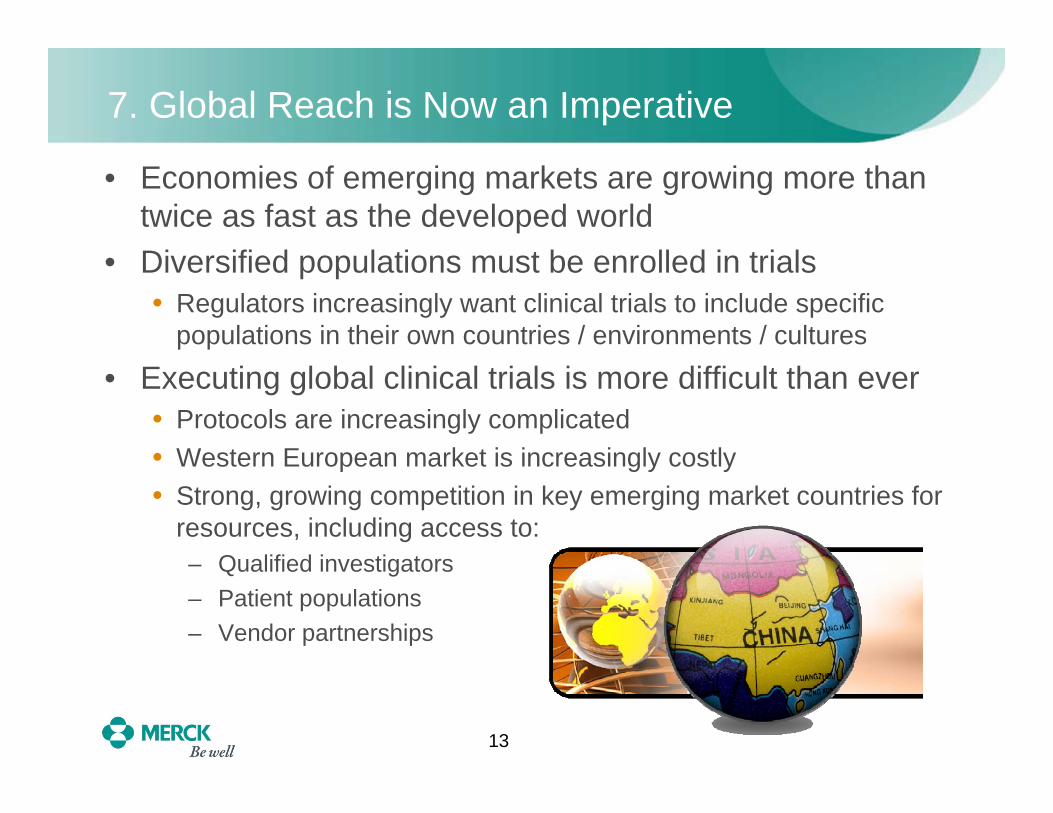
7. Global Reach is Now an Imperative
• Economies of emerging markets are growing more than twice as fast as the developed world
• Diversified populations must be enrolled in trials• Regulators increasingly want clinical trials to include specific
populations in their own countries / environments / cultures
• Executing global clinical trials is more difficult than ever• Protocols are increasingly complicated• Western European market is increasingly costly• Strong, growing competition in key emerging market countries for
resources, including access to:– Qualified investigators– Patient populations – Vendor partnerships
14
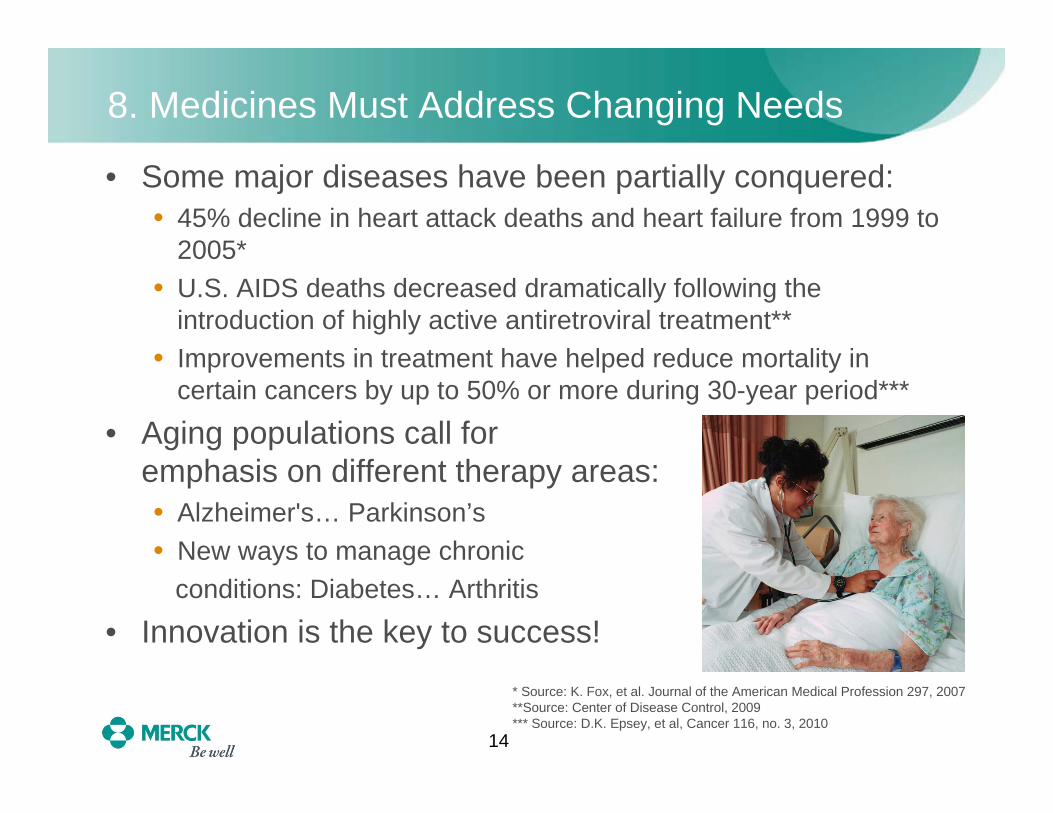
8. Medicines Must Address Changing Needs
• Some major diseases have been partially conquered:• 45% decline in heart attack deaths and heart failure from 1999 to
2005* • U.S. AIDS deaths decreased dramatically following the
introduction of highly active antiretroviral treatment**• Improvements in treatment have helped reduce mortality in
certain cancers by up to 50% or more during 30-year period***
• Aging populations call for emphasis on different therapy areas:• Alzheimer's… Parkinson’s• New ways to manage chronic
conditions: Diabetes… Arthritis
• Innovation is the key to success!
* Source: K. Fox, et al. Journal of the American Medical Profession 297, 2007**Source: Center of Disease Control, 2009*** Source: D.K. Epsey, et al, Cancer 116, no. 3, 2010

CHOICES

16
Choices: Pharma’s Present—and Future—Path
How are we choosing to:• Respond to economic and investor pressures?• Ensure that we get new products to market?• Gain efficiencies and expedite
clinical trial execution?• Foster Innovation?
CONSOLIDATIONSPORTFOLIO PRIORITIZATION
PARTNERSHIPSOUTSOURCING
EXECUTIONAL EXCELLENCEGLOBALIZATION
INNOVATION …. AND MORE!

17
Responding to Economic and Investor Pressures
• Mergers within the last few years consolidated some major pharmaceutical “powerhouses”• Pfizer /Wyeth; Roche /Genentech; Merck /Schering-Plough
• Integrating companies results in positives and negatives:
CONSOLIDATIONS
That sucking sound? Layoffs draining brains from pharmaAugust 22, 2011
October 25, 2011, 12:38 PM GMT
Job Cuts Hurt, But Will Save Novartis Future Pain
July 8, 2010 1:13 PM
Merck Closing 8 Plants,8 Research Sites
18
New Strategies Rationalizing R&D Spending
• Some companies are slashing R&D spending in response to investor demands
• Others are prioritizing investments based on morecalculated risks / returns• Harder look at early
development programs• Increased willingness to
“kill” programs earlier andmore often
• Changing incentives / rewardsto match changing strategy
PRIORITIZING PORTFOLIOS
19
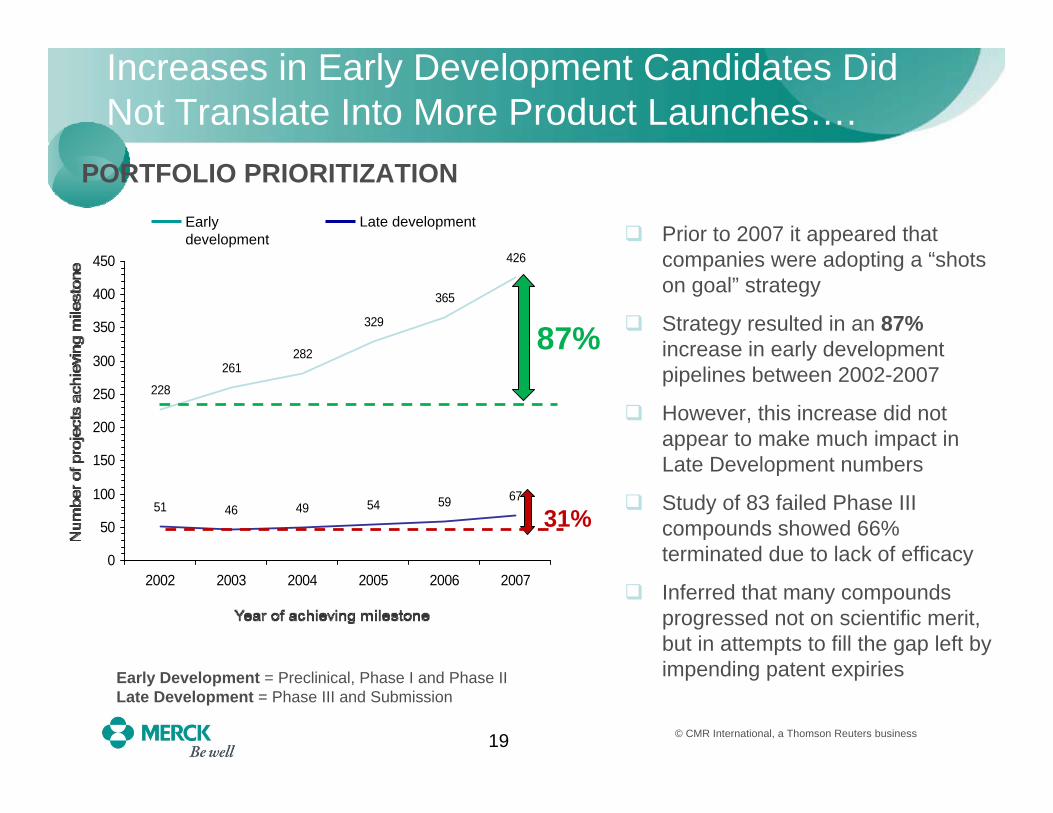
Increases in Early Development Candidates Did Not Translate Into More Product Launches….
228
261282
329
365
426
51 46 49 54 59 67
0
50
100
150
200
250
300
350
400
450
2002 2003 2004 2005 2006 2007
Early development
Late developmentPrior to 2007 it appeared that companies were adopting a “shots on goal” strategy
Strategy resulted in an 87%increase in early development pipelines between 2002-2007
However, this increase did not appear to make much impact in Late Development numbers
Study of 83 failed Phase III compounds showed 66% terminated due to lack of efficacy
Inferred that many compounds progressed not on scientific merit, but in attempts to fill the gap left by impending patent expiries
87%
31%
Early Development = Preclinical, Phase I and Phase IILate Development = Phase III and Submission
© CMR International, a Thomson Reuters business
PORTFOLIO PRIORITIZATION
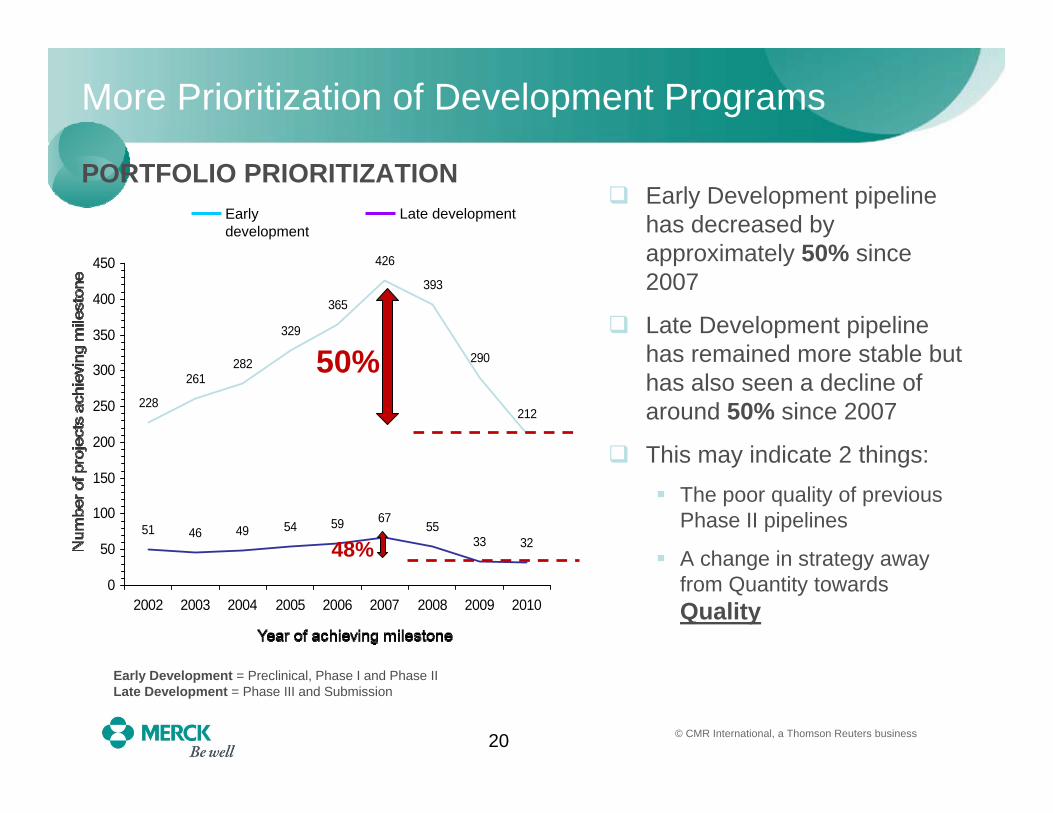
20
228
261282
329
365
426
393
290
212
51 46 49 54 59 6755
33 32
0
50
100
150
200
250
300
350
400
450
2002 2003 2004 2005 2006 2007 2008 2009 2010
More Prioritization of Development Programs
Early development
Late developmentEarly Development pipeline has decreased by approximately 50% since 2007
Late Development pipeline has remained more stable but has also seen a decline of around 50% since 2007
This may indicate 2 things:The poor quality of previous Phase II pipelines
A change in strategy away from Quantity towards Quality
50%
48%
Early Development = Preclinical, Phase I and Phase IILate Development = Phase III and Submission
© CMR International, a Thomson Reuters business
PORTFOLIO PRIORITIZATION
21
Increased Use of Adaptive Trials
• Companies increasingly choosing to determine a drug's benefit/risk ratio at specific study points in pivotal trials
• Rise in adaptive designs for clinical trials• In adaptive trials, decisions for mid-study changes can be made
at predetermined opportunity points • Decisions based on information available to date
– No waiting for total trial data• Greater use of sophisticated portfolio management
techniques
• Stop the development process sooner, not later if a drug won't prove safe, effective or be approved for sale
PORTFOLIO PRIORITIZATION
22
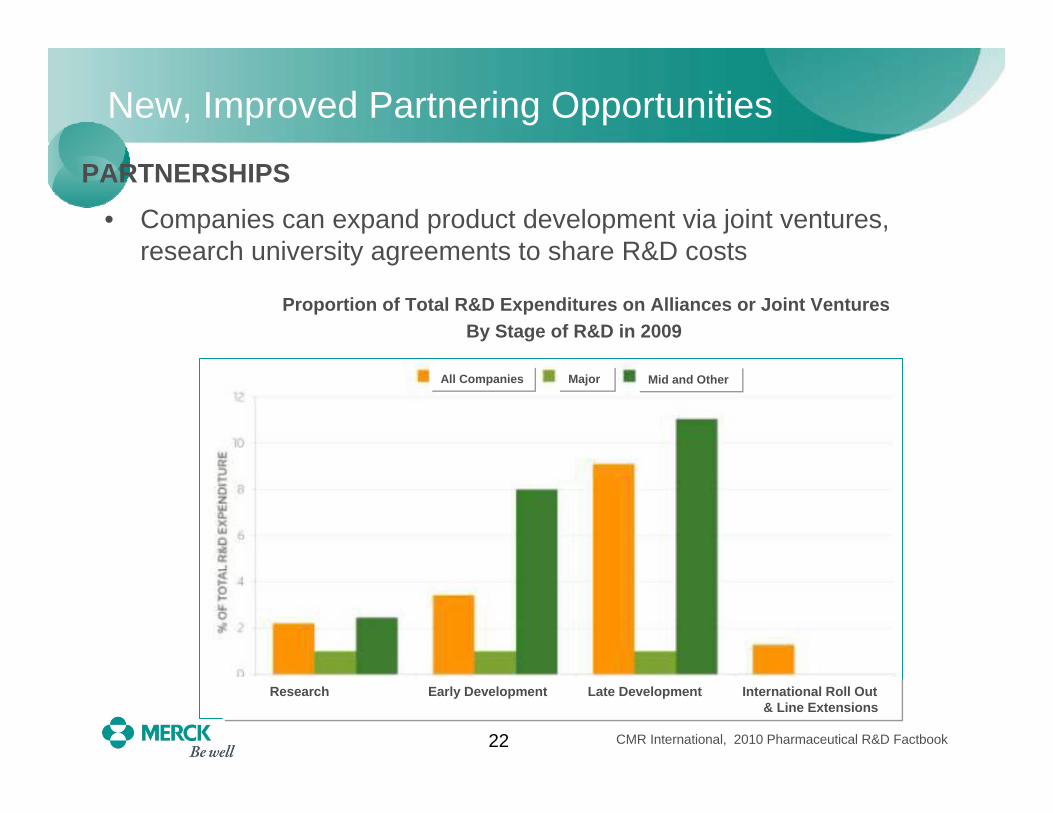
New, Improved Partnering Opportunities
• Companies can expand product development via joint ventures, research university agreements to share R&D costs
Proportion of Total R&D Expenditures on Alliances or Joint VenturesBy Stage of R&D in 2009
CMR International, 2010 Pharmaceutical R&D Factbook
PARTNERSHIPS
Research Early Development Late Development International Roll Out s & Line Extensions
All Companies Major Mid and Other
23
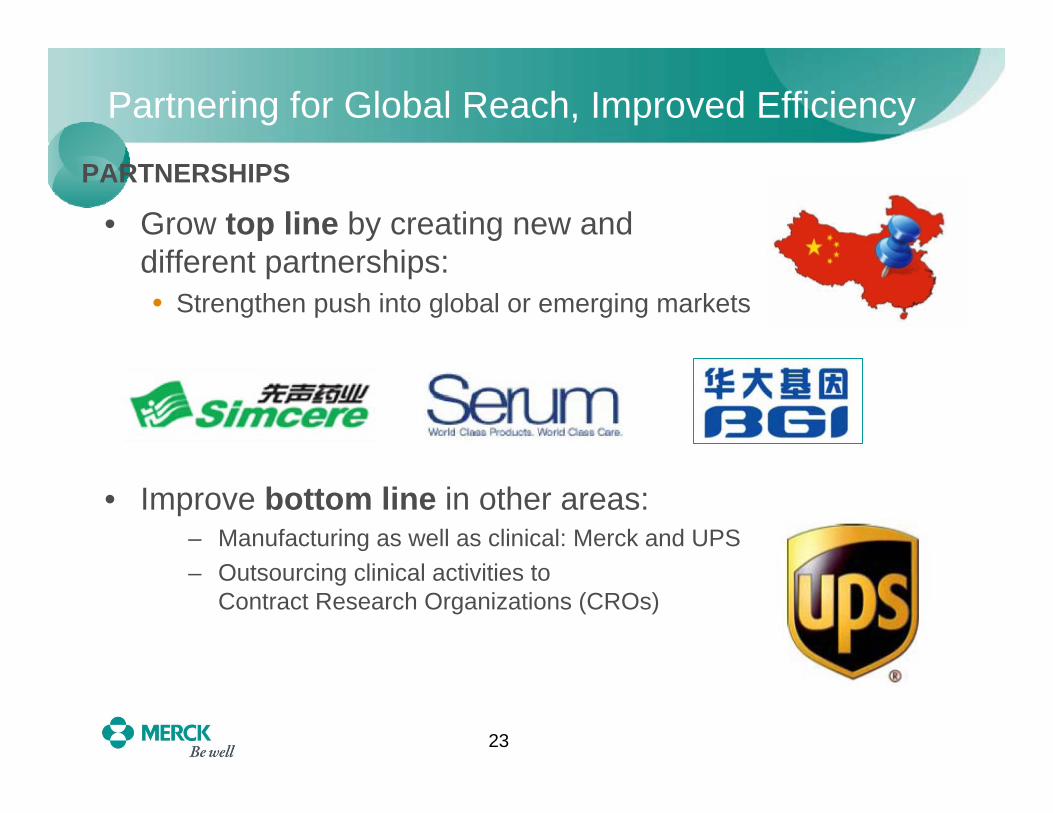
Partnering for Global Reach, Improved Efficiency
• Grow top line by creating new and different partnerships: • Strengthen push into global or emerging markets
• Improve bottom line in other areas:– Manufacturing as well as clinical: Merck and UPS– Outsourcing clinical activities to
Contract Research Organizations (CROs)
PARTNERSHIPS
24
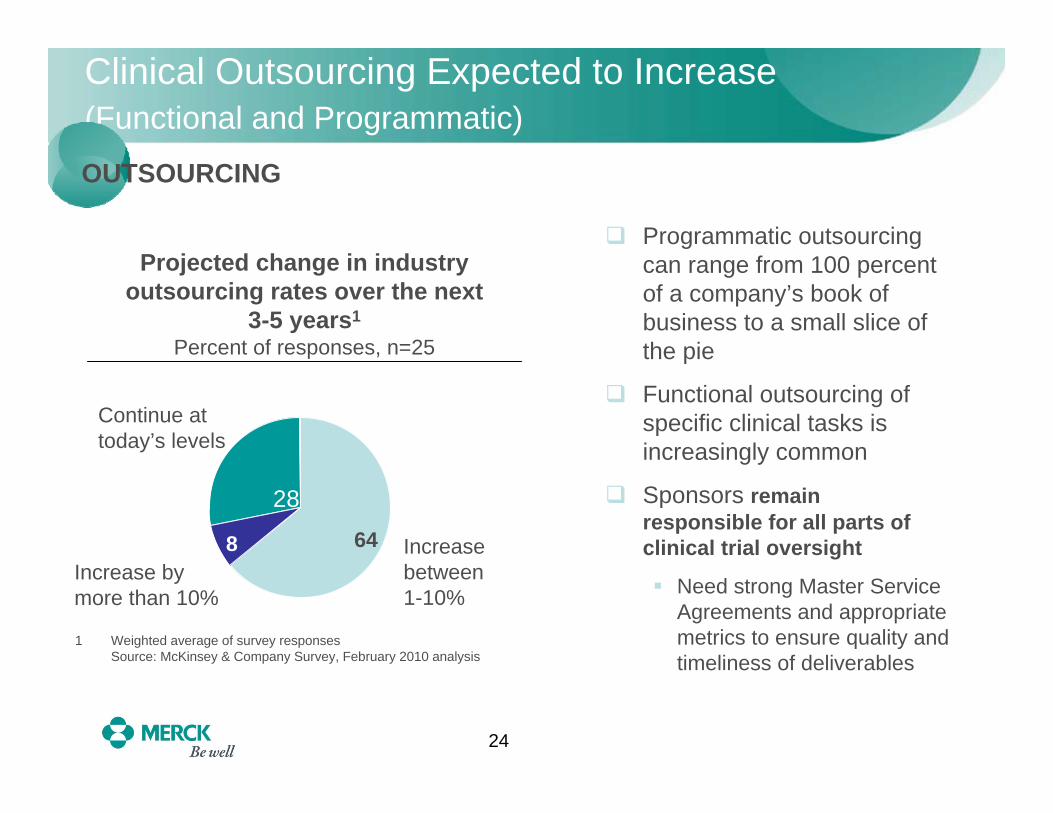
Clinical Outsourcing Expected to Increase(Functional and Programmatic)
Increase bymore than 10%
Increase between 1-10%
Continue at today’s levels
28
1 Weighted average of survey responsesSource: McKinsey & Company Survey, February 2010 analysis
Projected change in industry outsourcing rates over the next
3-5 years1
Percent of responses, n=25
8 64
28
Programmatic outsourcing can range from 100 percent of a company’s book of business to a small slice of the pie
Functional outsourcing of specific clinical tasks is increasingly common
Sponsors remain responsible for all parts of clinical trial oversight
Need strong Master Service Agreements and appropriate metrics to ensure quality and timeliness of deliverables
OUTSOURCING
25
Strategic Rationale for More Clinical Outsourcing
• Quality and capabilities of major Contract Resource Organizations (CROs) have increased worldwide • Provide more access to global capabilities and infrastructure for
conducting clinical trials
• Improves a pharma company’s flexibility in adjusting to a volatile book of business and associated labor demands• Reduces fixed operating costs• Meets demands for specific job roles while potentially moving
some work to lower-cost geographies with skilled workforces • Reduces risk for “stranded resources” when studies end• Allows companies to focus on core capabilities internally
• Provides performance /cost transparency
OUTSOURCING
26
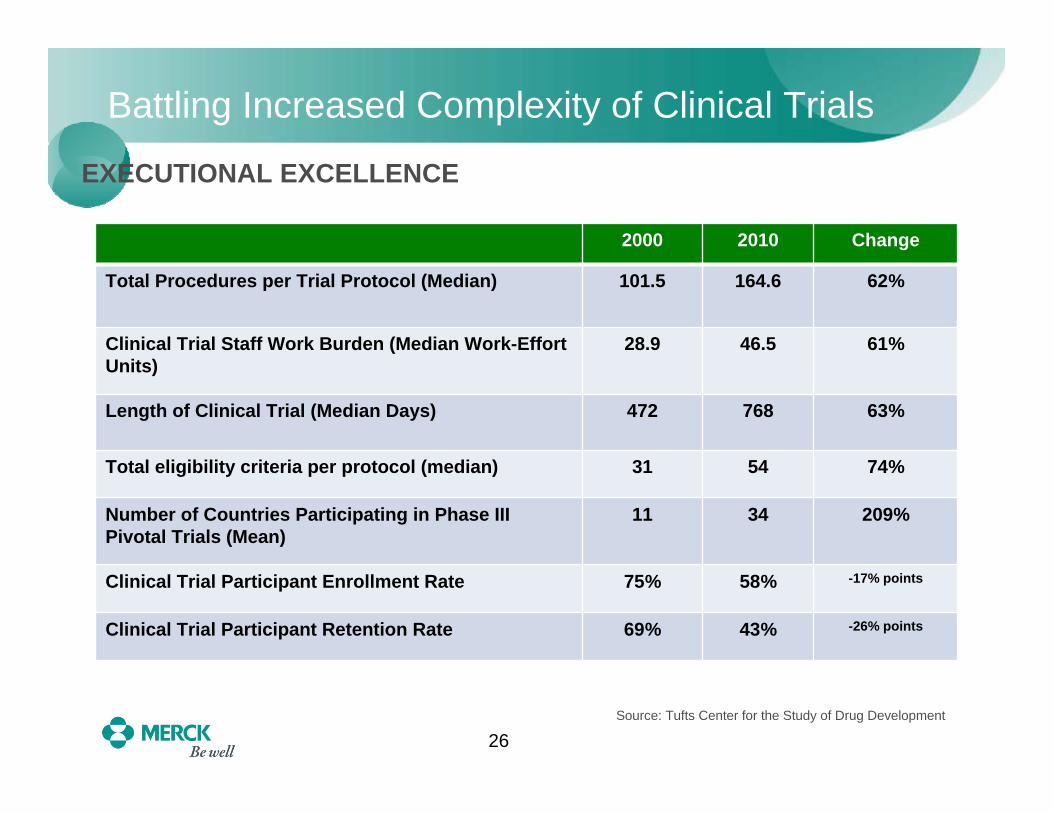
Battling Increased Complexity of Clinical Trials
Changes in Clinical Trials: Resources, Length and Participation
Source: Tufts Center for the Study of Drug Development
EXECUTIONAL EXCELLENCE
2000 2010 Change
Total Procedures per Trial Protocol (Median) 101.5 164.6 62%
Clinical Trial Staff Work Burden (Median Work-Effort Units)
28.9 46.5 61%
Length of Clinical Trial (Median Days) 472 768 63%
Total eligibility criteria per protocol (median) 31 54 74%
Number of Countries Participating in Phase III Pivotal Trials (Mean)
11 34 209%
Clinical Trial Participant Enrollment Rate 75% 58% -17% points
Clinical Trial Participant Retention Rate 69% 43% -26% points
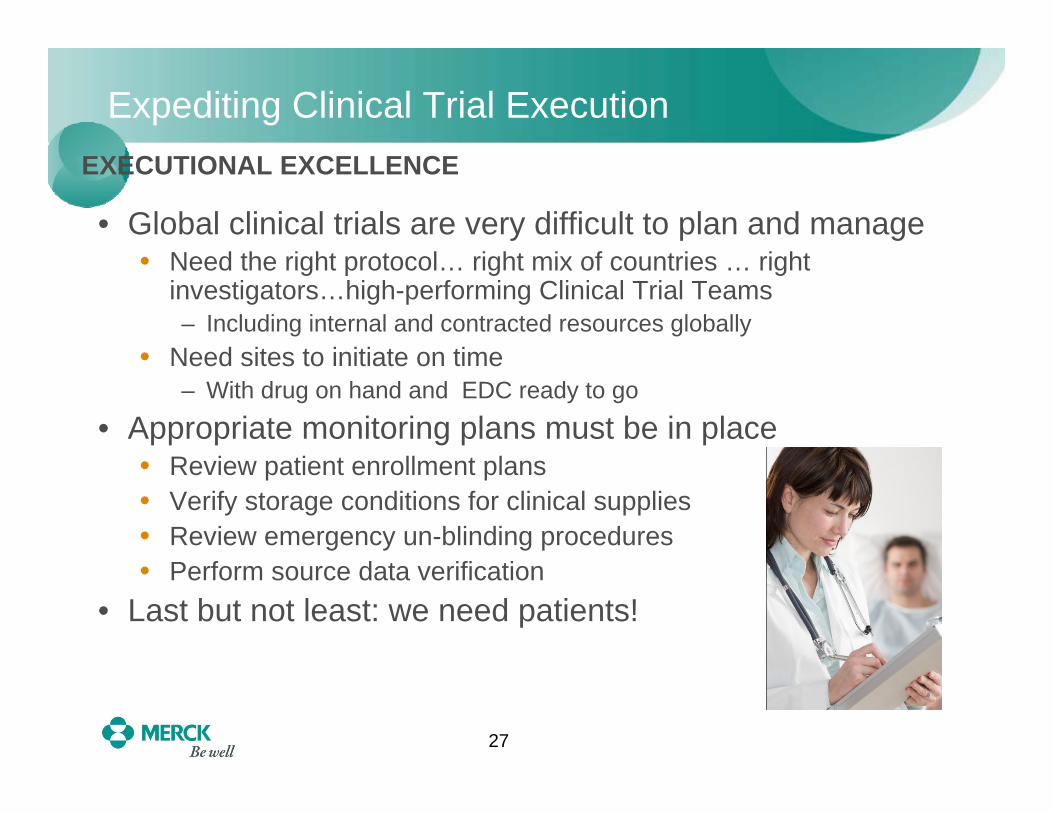
27
• Global clinical trials are very difficult to plan and manage• Need the right protocol… right mix of countries … right
investigators…high-performing Clinical Trial Teams– Including internal and contracted resources globally
• Need sites to initiate on time– With drug on hand and EDC ready to go
• Appropriate monitoring plans must be in place• Review patient enrollment plans• Verify storage conditions for clinical supplies• Review emergency un-blinding procedures• Perform source data verification
• Last but not least: we need patients!
Expediting Clinical Trial ExecutionEXECUTIONAL EXCELLENCE
28
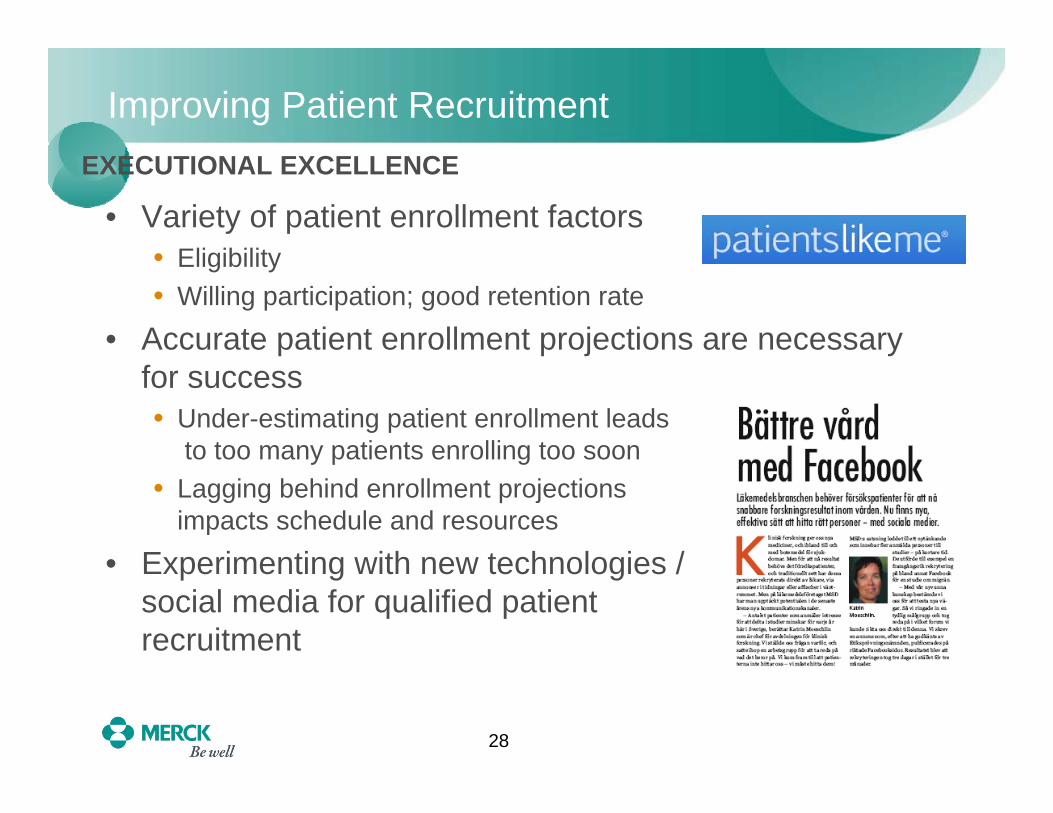
Improving Patient Recruitment
• Variety of patient enrollment factors• Eligibility• Willing participation; good retention rate
• Accurate patient enrollment projections are necessary for success• Under-estimating patient enrollment leads
to too many patients enrolling too soon• Lagging behind enrollment projections
impacts schedule and resources
• Experimenting with new technologies / social media for qualified patient recruitment
EXECUTIONAL EXCELLENCE
29
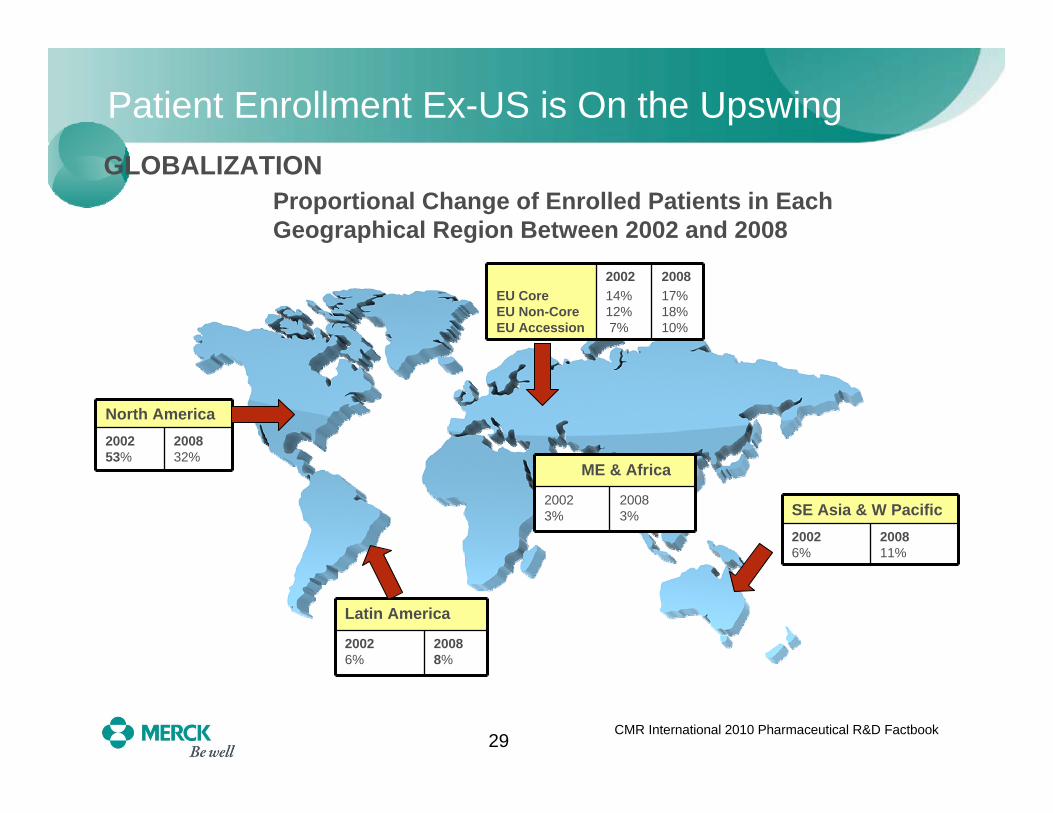
Patient Enrollment Ex-US is On the Upswing
Latin America
20026%
20088%
ME & Africa
20023%
20083%
North America200253%
200832%
GLOBALIZATIONProportional Change of Enrolled Patients in Each Geographical Region Between 2002 and 2008
CMR International 2010 Pharmaceutical R&D Factbook
SE Asia & W Pacific20026%
200811%
EU CoreEU Non-CoreEU Accession
200214%12%7%
200817%18%10%
30
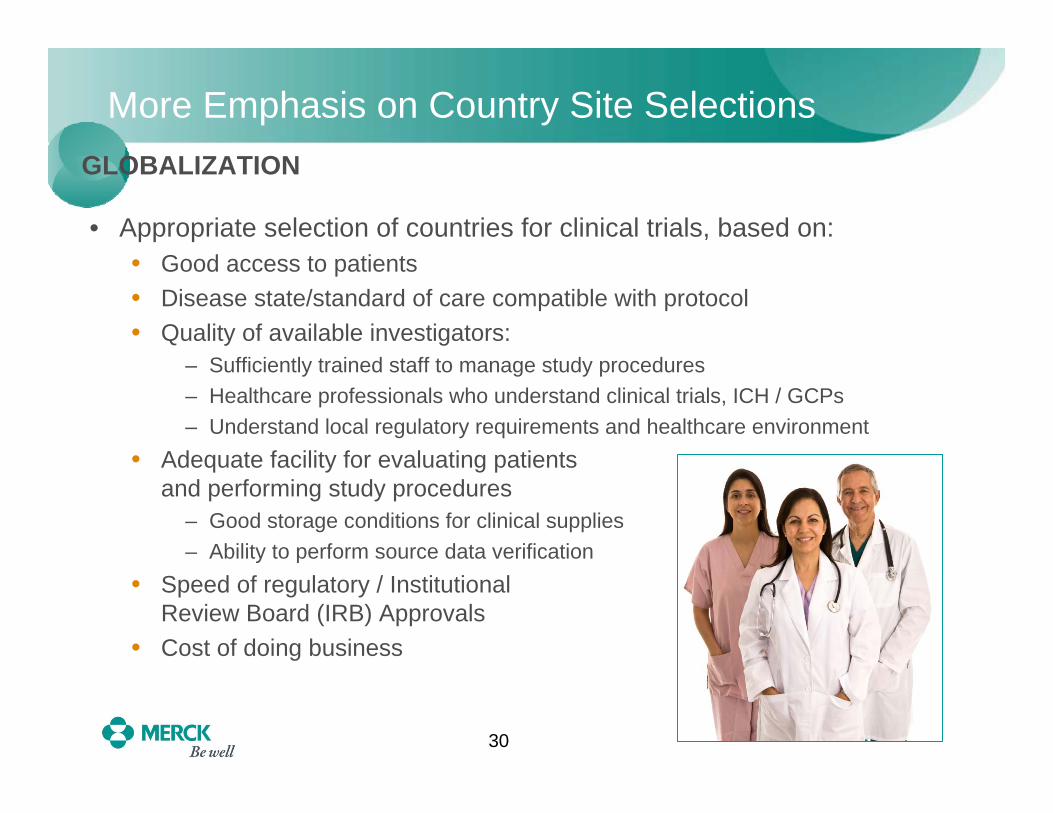
More Emphasis on Country Site Selections
• Appropriate selection of countries for clinical trials, based on: • Good access to patients• Disease state/standard of care compatible with protocol • Quality of available investigators:
– Sufficiently trained staff to manage study procedures– Healthcare professionals who understand clinical trials, ICH / GCPs– Understand local regulatory requirements and healthcare environment
• Adequate facility for evaluating patients and performing study procedures
– Good storage conditions for clinical supplies– Ability to perform source data verification
• Speed of regulatory / Institutional Review Board (IRB) Approvals
• Cost of doing business
GLOBALIZATION
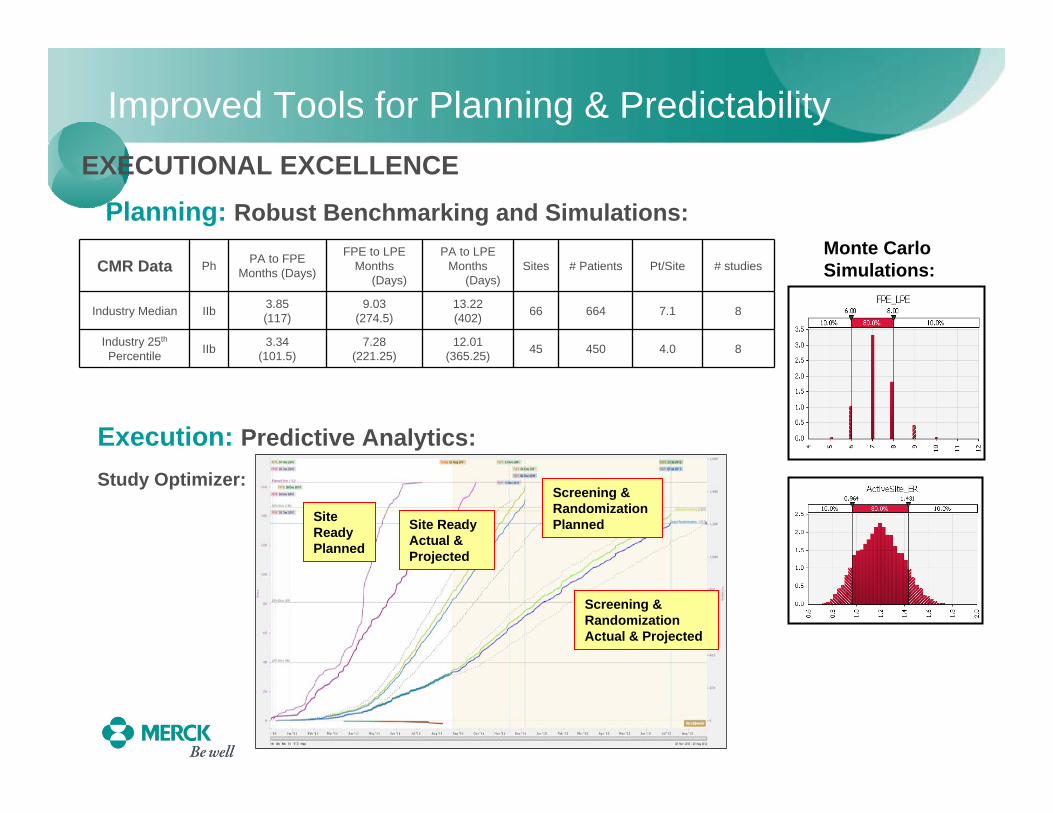
Improved Tools for Planning & Predictability
Planning: Robust Benchmarking and Simulations:
CMR Data Ph PA to FPEMonths (Days)
FPE to LPEMonths
(Days)
PA to LPEMonths
(Days)Sites # Patients Pt/Site # studies
Industry Median IIb 3.85(117)
9.03(274.5)
13.22(402) 66 664 7.1 8
Industry 25th
Percentile IIb 3.34(101.5)
7.28(221.25)
12.01(365.25) 45 450 4.0 8
EXECUTIONAL EXCELLENCE
Execution: Predictive Analytics:
Monte CarloSimulations:
Study Optimizer:
Site Ready Planned
Site Ready Actual & Projected
Screening & Randomization Planned
Screening & Randomization Actual & Projected
32
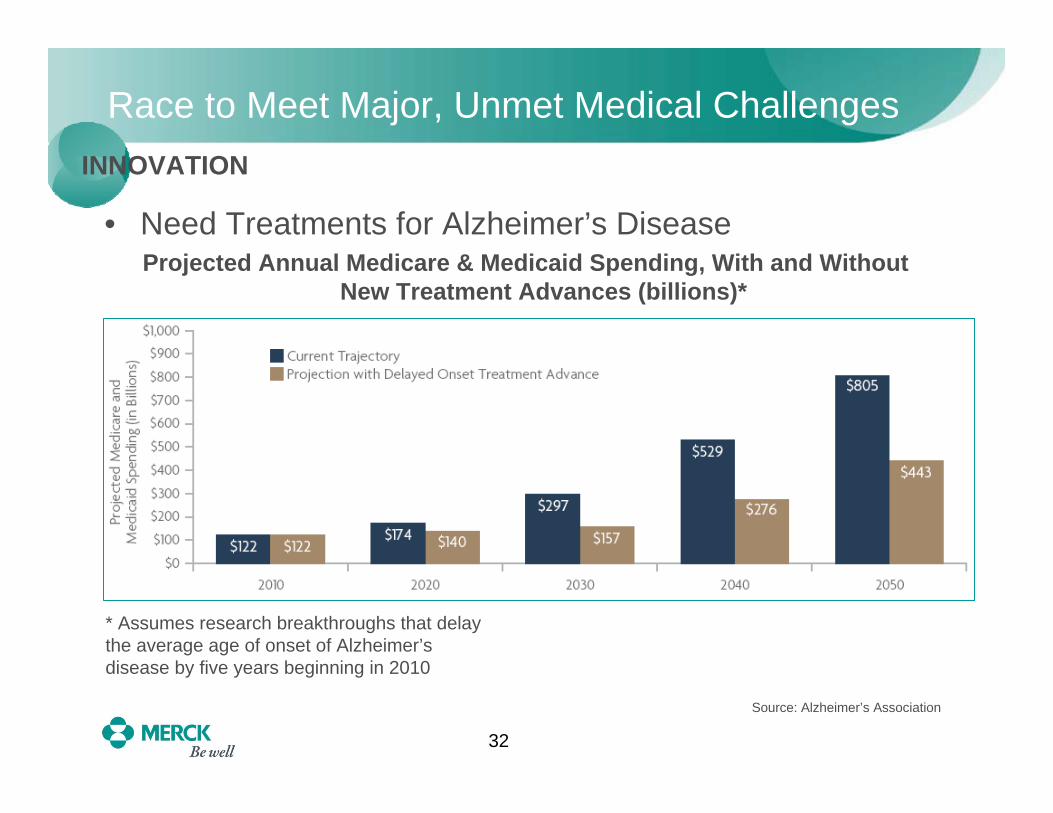
Race to Meet Major, Unmet Medical Challenges
• Need Treatments for Alzheimer’s DiseaseProjected Annual Medicare & Medicaid Spending, With and Without
New Treatment Advances (billions)*
* Assumes research breakthroughs that delay the average age of onset of Alzheimer’s disease by five years beginning in 2010
Source: Alzheimer’s Association
INNOVATION

33
Need New Treatments for Degenerative Disorders
• Parkinson’s Disease Costs Society $27 billion Per Year in Medical Bills and Lost WagesProjected Worldwide Increase in Prevalence of Parkinson’s Disease
INNOVATION
E.R. Dorsey, et al: Neurology 68, no. 5 (2007)
34
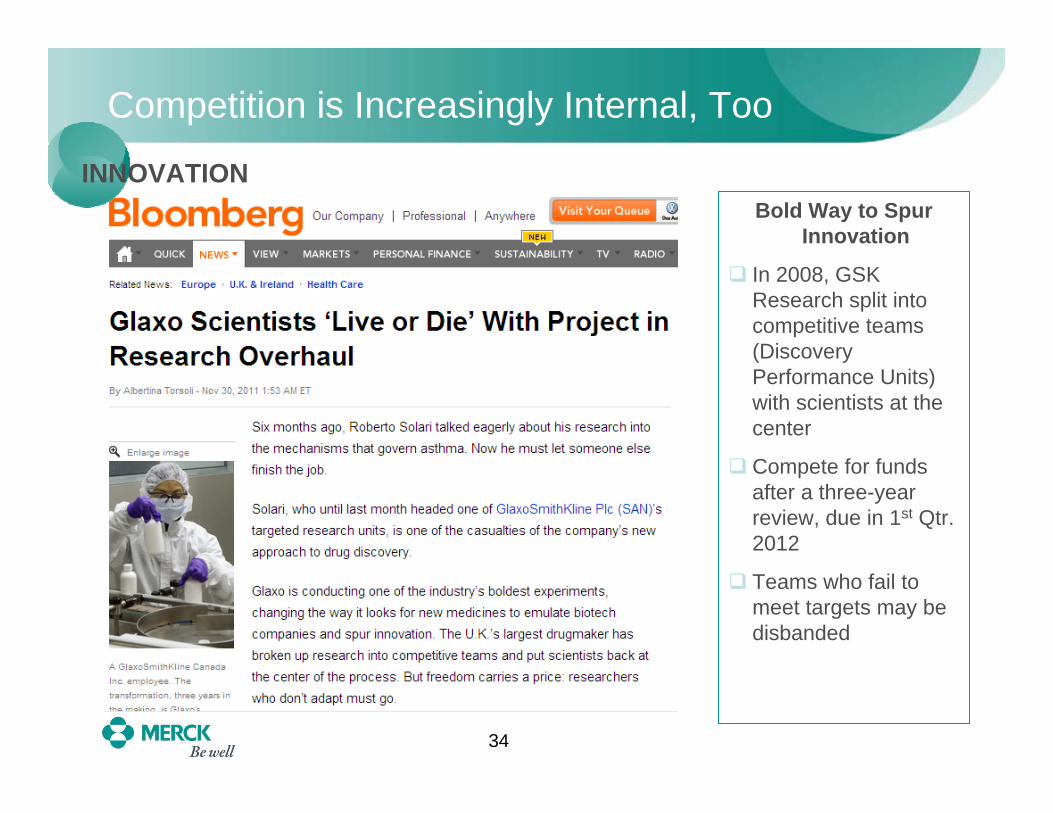
Competition is Increasingly Internal, Too
INNOVATIONBold Way to Spur
Innovation
In 2008, GSK Research split into competitive teams (Discovery Performance Units) with scientists at the center
Compete for funds after a three-year review, due in 1st Qtr. 2012
Teams who fail to meet targets may be disbanded

CHANGES
36
We Must Adapt Behavior, Culture to New Reality
• Work differently to be successful • Changing internal culture and behaviors is not easy• “Big Pharma” had long been a stronghold in the economy
– Viewed as secure, high-quality employers and corporate citizens• Now we are an industry under siege – from payers and
consumers
• Commit to increasing external licensing and research• R&D investment is too costly to always be done alone
• Make globalization work• People need our medicines everywhere• Partnering can help us reach patients
and markets without substantial internal investments
37
What Has to Change in Development for Big Pharma?
• Organizational inertia• Overcome tendency to just keep doing things the way we always have• Build structures that are flexible and adaptable to constant changes in
demography and geography of the development portfolio• Aversion to constant process evolution
• Alleviate concerns that changing something will impact safety orcompliance
• “Not invented here” syndrome• Be willing to partner on innovative therapies and new ways of operating• Cultivate and enhance capabilities in vendor oversight and management
– Without doing their work for them!
• Change attitude that vendors are “just” service providers• Build strong relationships with vendors across all levels of organization• Work collaboratively, as one team• Make vendor oversight and management a core capability

38
Exploring the Ways to “Get it Right”