gender disparities in health care in medicare … disparities in health care in medicare advantage...
TRANSCRIPT
GENDERDISPARITIESIN HEALTH CARE in Medicare Advantage
CMS Office of Minority Health in collaboration with the RAND Corporation
April 2017
Background and Purpose
This report presents summary information on the quality of health care received by Medicare beneficiaries. Quality-‐of-‐care data are presented at the national level for both patient experience and clinical care measures and are shown separately for women and men. Data are reported separately for women and men because there is evidence that quality of care may be different for these groups. This information may be of interest to Medicare beneficiaries, Medicare Advantage and prescription drug plans, and others interested in better understanding beneficiaries’ quality of care and how it differs by gender.
In all, this report provides data regarding 8 patient experience measures and 24 clinical care measures. The patient experience data were collected from a national survey of Medicare beneficiaries, known as the Medicare Consumer Assessment of Healthcare Providers and Systems (CAHPS) survey. This survey is administered each year; the data in this report are from the 2015 Medicare CAHPS survey. Patient experience measures include how easy it is to get needed care, how well doctors communicate with beneficiaries, and how easy it is for beneficiaries to get information from their drug plan about prescription drug coverage and cost.
The clinical care data were gathered through medical records and insurance claims for hospitalizations, medical office visits, and procedures. These data, which are collected each year from Medicare health plans (Medicare Advantage plans) nationwide, are part of the Healthcare Effectiveness Data and Information Set (HEDIS). Examples of clinical care measures include whether beneficiaries received appropriate screening for colon cancer, whether beneficiaries with diabetes received a test that determines whether their blood sugar is under control, and whether appropriate treatment was provided to beneficiaries with chronic obstructive pulmonary disease. The HEDIS data reported here were collected in 2015.
Data for each of the patient experience and clinical care measures are presented in the form of bar charts. Separate bar charts are shown for each measure. For each patient experience measure, the chart shows the average score for men and women on a 0–100 scale. The average score represents the percentage of the best-‐possible score that was achieved for a given group for that measure. For example, consider a measure for which the best possible score is 4 and the worst possible score is 1. If a given group’s score on that measure is 3.5, then that group’s score on a 0–100 scale is ([3.5−1]/[4−1])*100 = 83.3. For each clinical care measure, a bar chart shows the percentage of beneficiaries in each group whose care met the standard called for by the specific measure (e.g., a test or treatment).
A summary of the information contained in the bar charts for individual measures is presented on the following page. In particular, a pair of stacked bar charts shows the number of patient experience measures (out of 8) and the number of clinical care measures (out of 24) for which women experienced care that was worse than, similar to, or better than the care experienced by men.
For detailed information on data sources and analytic methods, see the appendix.
1

2
Disparities in Care: All Patient Experience and Clinical Care Measures
Number of patient experience measures (of 8) and clinical care measures (of 24) for which women received care that was worse than, similar to, or better than the care received by men in 2015
Data source: The bar on the left (patient experience measures) summarizes data from all Medicare Advantage beneficiaries nationwide who participated in the 2015 Medicare CAHPS survey. The bar on the right (clinical care measures) summarizes clinical quality (HEDIS) data collected in 2015 from Medicare health plans nationwide.
The relative difference between men and women is used to assess disparities.
• Better = Women received better care than men. Differences are statistically significant (p <0.05), are equal to or larger than 3 points† on a 0–100 scale, and favor women.
• Similar = Women and men received care of similar quality. Differences are less than 3 pointson a 0–100 scale (differences greater than 3 points were always statistically significant).Differences may be statistically significant.
• Worse = Women received worse care than men. Differences are statistically significant, areequal to or larger than 3 points on a 0–100 scale, and favor men.
Summary: Women received worse care for 3 of the clinical care measures, similar care for 16 of the clinical care measures, and better care for 5 of the clinical care measures compared with men. Patient experiences of men and women were similar across all 8 patient experience measures.
† A difference that is considered to be of moderate magnitude. Paddison CA, Elliott MN, Haviland AM, Farley DO, Lyratzopoulos G, Hambarsoomian K, Dembosky JW, Roland MO. Experiences of care among Medicare beneficiaries with ESRD: Medicare Consumer Assessment of Healthcare Providers and Systems (CAHPS) survey results. Am J Kidney Dis. 2013;61, pp. 440–449.
Women get worse care than men
Women and men get similar care
Women get better care than men 8 of 8
5 of 24
16 of 24
3 of 24
Patient experience measures Clinical care measures
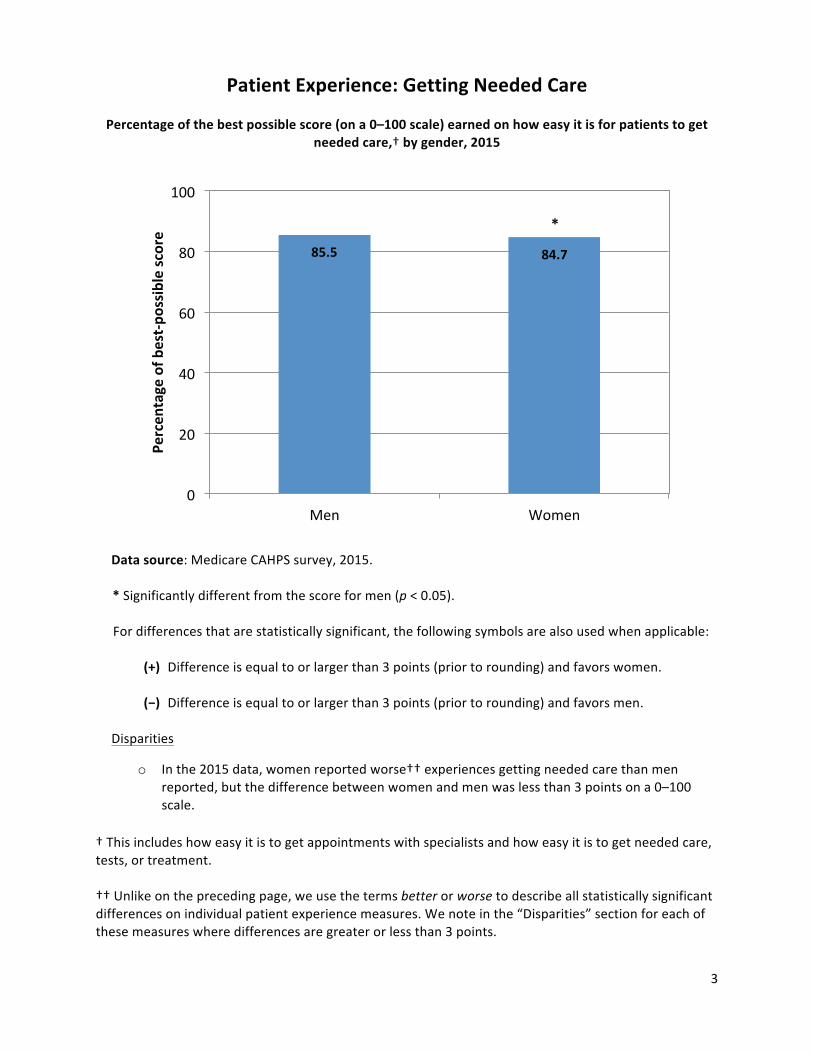
Patient Experience: Getting Needed Care
Percentage of the best possible score (on a 0–100 scale) earned on how easy it is for patients to get needed care,† by gender, 2015
100
80
60
40
20
0
Data source: Medicare CAHPS survey, 2015.
* Significantly different from the score for men (p < 0.05).
For differences that are statistically significant, the following symbols are also used when applicable:
(+) Difference is equal to or larger than 3 points (prior to rounding) and favors women.
(−) Difference is equal to or larger than 3 points (prior to rounding) and favors men.
Disparities
o In the 2015 data, women reported worse†† experiences getting needed care than men reported, but the difference between women and men was less than 3 points on a 0–100 scale.
† This includes how easy it is to get appointments with specialists and how easy it is to get needed care, tests, or treatment.
†† Unlike on the preceding page, we use the terms better or worse to describe allstatistically significant differences on individual patient experience measures. We note in the “Disparities” section for each of these measures where differences are greater or less than 3 points.
Perc
enta
geo
fbes
t-po
ssib
lesc
ore
85.5 84.7
*
Men Women
3
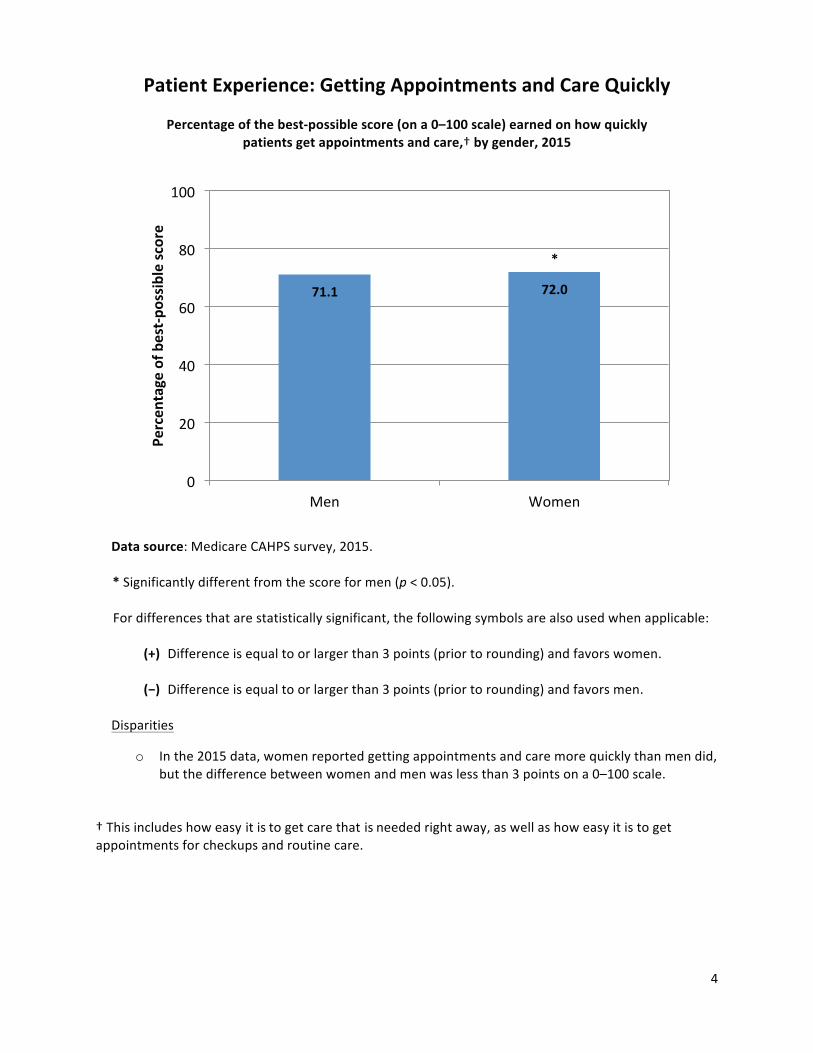
Patient Experience: Getting Appointments and Care Quickly
Percentage of the best-possible score (on a 0–100 scale) earned on how quickly patients get appointments and care,† by gender, 2015
100
80
60
40
20
0
Data source: Medicare CAHPS survey, 2015.
* Significantly different from the score for men (p < 0.05).
For differences that are statistically significant, the following symbols are also used when applicable:
(+) Difference is equal to or larger than 3 points (prior to rounding) and favors women.
(−) Difference is equal to or larger than 3 points (prior to rounding) and favors men.
Disparities
o In the 2015 data, women reported getting appointments and care more quickly than men did, but the difference between women and men was less than 3 points on a 0–100 scale.
† This includes how easy it is to get care that is needed right away, as well as how easy it is to get appointments for checkups and routine care.
Perc
enta
geo
fbes
t-po
ssib
lesc
ore
71.1 72.0
*
Men Women
4
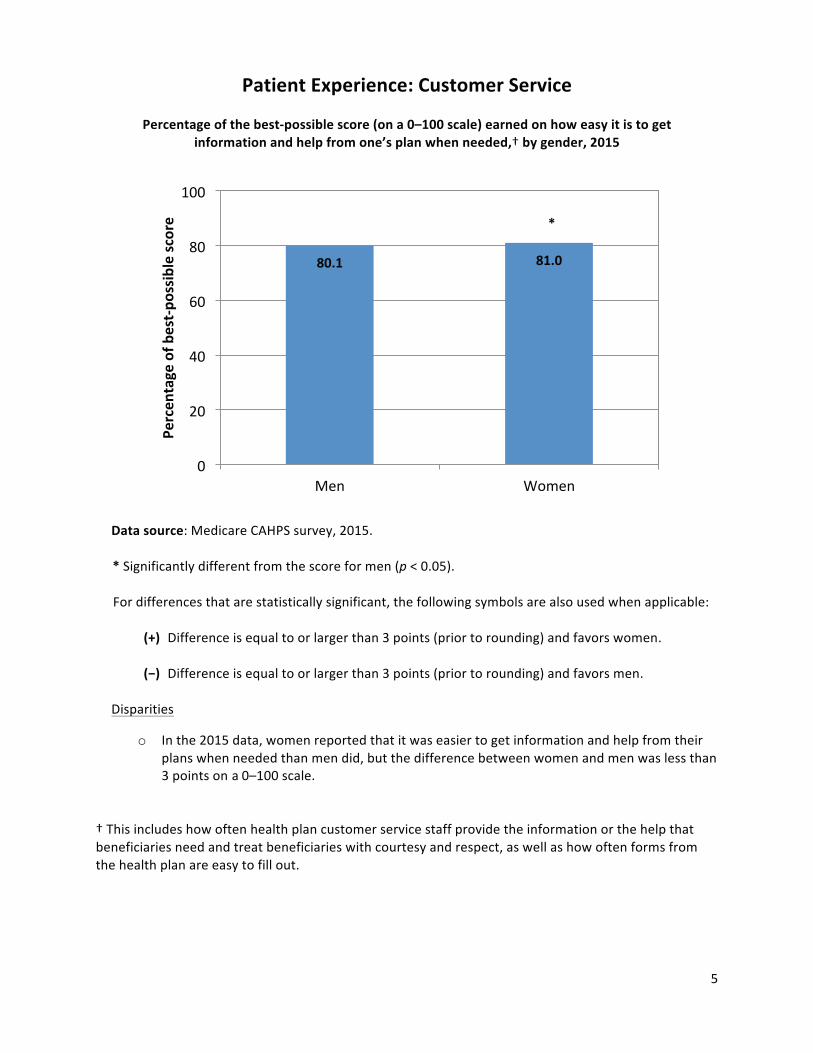
Patient Experience: Customer Service
Percentage of the best-possible score (on a 0–100 scale) earned on how easy it is to get information and help from one’s plan when needed,† by gender, 2015
100
80
60
40
20
0
Data source: Medicare CAHPS survey, 2015.
* Significantly different from the score for men (p < 0.05).
For differences that are statistically significant, the following symbols are also used when applicable:
(+) Difference is equal to or larger than 3 points (prior to rounding) and favors women.
(−) Difference is equal to or larger than 3 points (prior to rounding) and favors men.
Disparities
o In the 2015 data, women reported that it was easier to get information and help from their plans when needed than men did, but the difference between women and men was less than 3 points on a 0–100 scale.
† This includes how often health plan customer service staff provide the information or the help that beneficiaries need and treat beneficiaries with courtesy and respect, as well as how often forms from the health plan are easy to fillout.
Perc
enta
geo
fbes
t-po
ssib
lesc
ore
80.1 81.0
*
Men Women
5
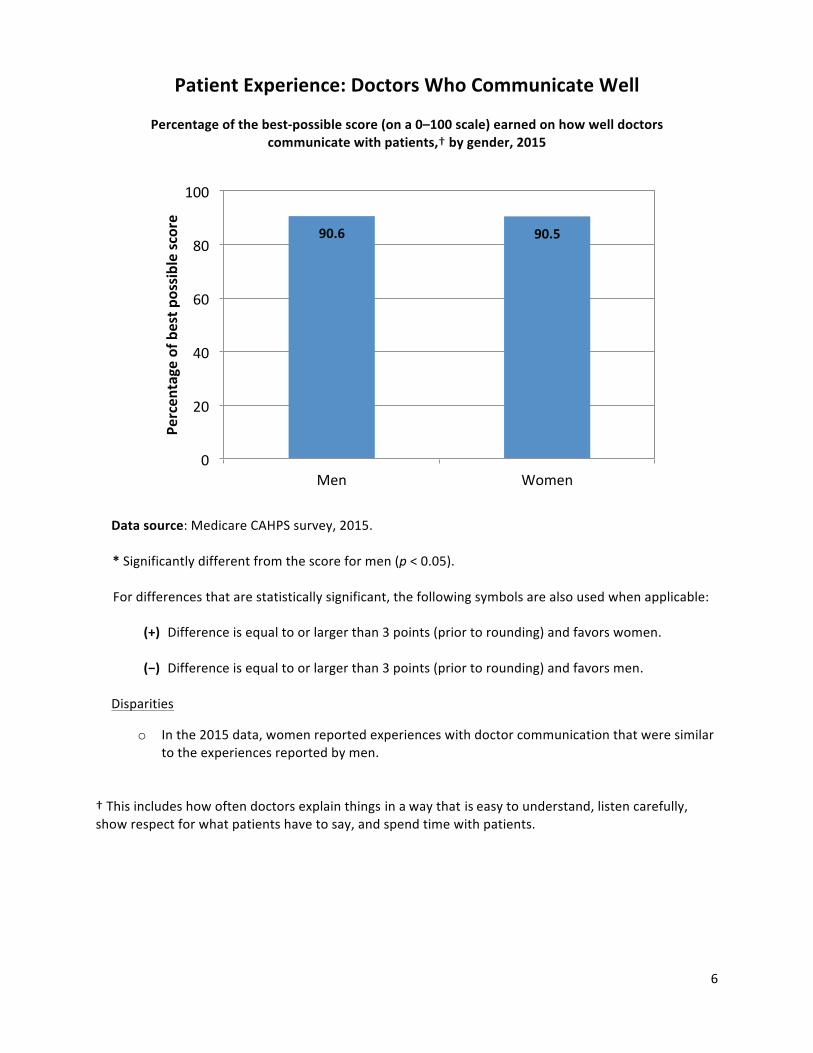
Patient Experience: Doctors Who Communicate Well
Percentage of the best-possible score (on a 0–100 scale) earned on how well doctors communicate with patients,† by gender, 2015
100
80
60
40
20
0
Data source: Medicare CAHPS survey, 2015.
* Significantly different from the score for men (p < 0.05).
For differences that are statistically significant, the following symbols are also used when applicable:
(+) Difference is equal to or larger than 3 points (prior to rounding) and favors women.
(−) Difference is equal to or larger than 3 points (prior to rounding) and favors men.
Disparities
o In the 2015 data, women reported experiences with doctor communication that were similarto the experiences reported by men.
† This includes how often doctors explain things in a way that is easy to understand,listen carefully,show respect for what patients have to say, and spend time with patients.
Perc
enta
geo
fbes
t pos
sibl
esc
ore
90.6 90.5
Men Women
6
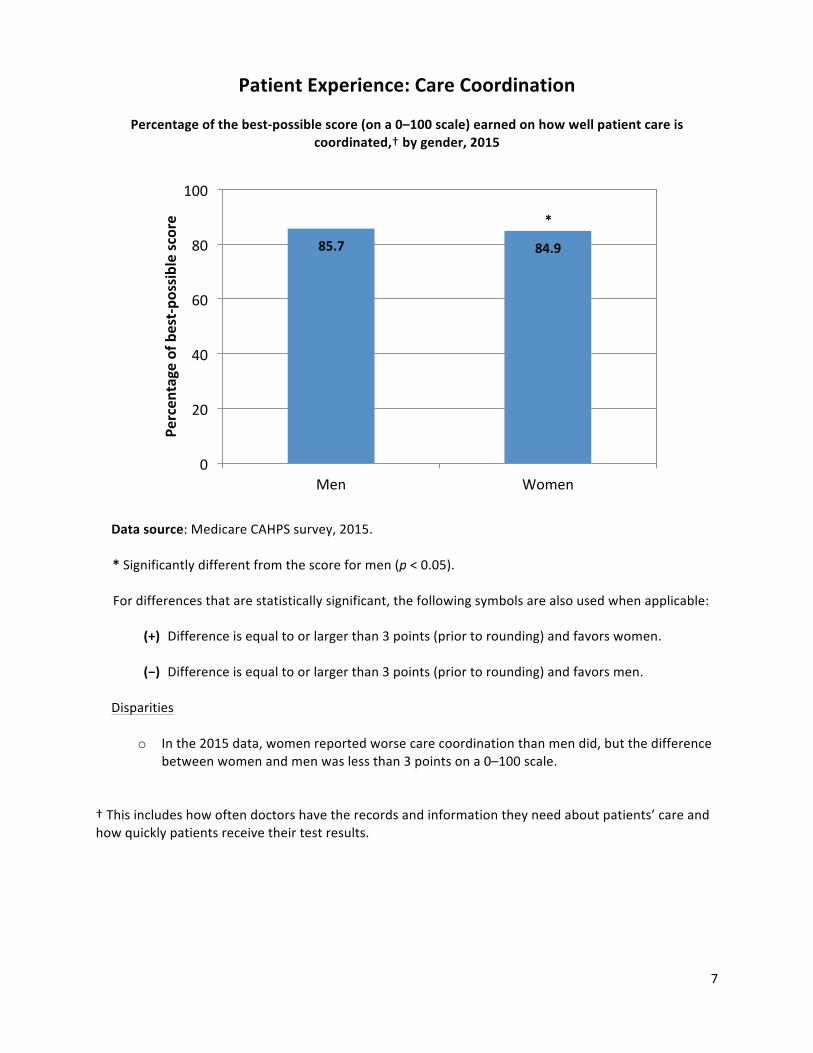
Patient Experience: Care Coordination
Percentage of the best-possible score (on a 0–100 scale) earned on how well patient care is coordinated,† by gender, 2015
100
80
60
40
20
0
Data source: Medicare CAHPS survey, 2015.
* Significantly different from the score for men (p < 0.05).
For differences that are statistically significant, the following symbols are also used when applicable:
(+) Difference is equal to or larger than 3 points (prior to rounding) and favors women.
(−) Difference is equal to or larger than 3 points (prior to rounding) and favors men.
Disparities
o In the 2015 data, women reported worse care coordination than men did, but the difference between women and men was less than 3 points on a 0–100 scale.
† This includes how often doctors have the records and information they need about patients’ care and how quickly patients receive their test results.
Perc
enta
geo
fbes
t-po
ssib
lesc
ore
85.7 84.9
*
Men Women
7
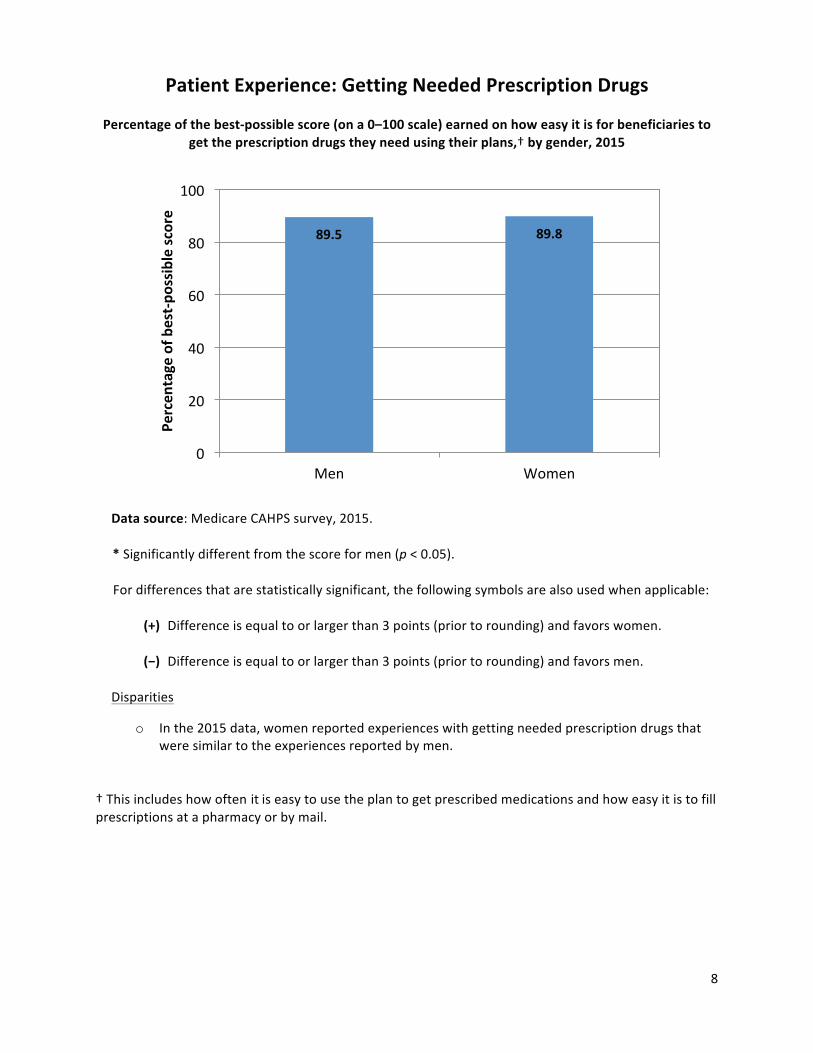
Patient Experience: Getting Needed Prescription Drugs
Percentage of the best-possible score (on a 0–100 scale) earned on how easy it is for beneficiaries to get the prescription drugs they need using their plans,† by gender, 2015
100
80
60
40
20
0
Data source: Medicare CAHPS survey, 2015.
* Significantly different from the score for men (p < 0.05).
For differences that are statistically significant, the following symbols are also used when applicable:
(+) Difference is equal to or larger than 3 points (prior to rounding) and favors women.
(−) Difference is equal to or larger than 3 points (prior to rounding) and favors men.
Disparities
o In the 2015 data, women reported experiences with getting needed prescription drugs that were similar to the experiences reported by men.
† This includes how often it is easy to use the plan to get prescribed medications and how easy it is to fill prescriptions at a pharmacy or by mail.
Perc
enta
geo
fbes
t-po
ssib
lesc
ore
89.5 89.8
Men Women
8
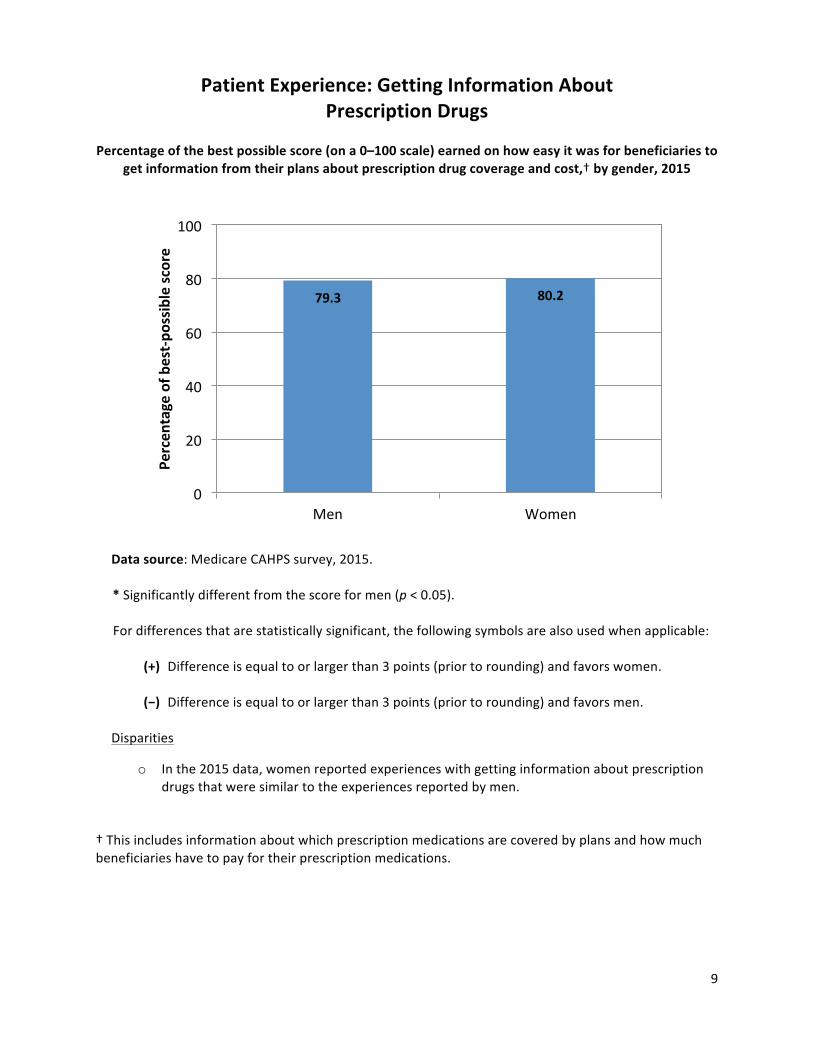
Patient Experience: Getting Information About Prescription Drugs
Percentage of the best possible score (on a 0–100 scale) earned on how easy it was for beneficiaries to get information from their plans about prescription drug coverage and cost,† by gender, 2015
Perc
enta
geo
fbes
t-po
ssib
lesc
ore
100
80
60
40
20
0 Men Women
Data source: Medicare CAHPS survey, 2015.
79.3 80.2
* Significantly different from the score for men (p < 0.05).
For differences that are statistically significant, the following symbols are also used when applicable:
(+) Difference is equal to or larger than 3 points (prior to rounding) and favors women.
(−) Difference is equal to or larger than 3 points (prior to rounding) and favors men.
Disparities
o In the 2015 data, women reported experiences with getting information about prescription drugs that were similar to the experiences reported by men.
† This includes information about which prescription medications are covered by plans and how much beneficiaries have to pay for their prescription medications.
9

73.5 72.1
0
20
40
60
80
100 Pe
rcen
tage
ofb
est-
poss
ible
scor
e
Patient Experience: Annual Flu Vaccine
Percentage of Medicare enrollees who got a vaccine (flu shot), by gender, 2015
Men Women
Data source: Medicare CAHPS survey, 2015.
* Significantly different from the score for men (p < 0.05).
For differences that are statistically significant, the following symbols are also used when applicable:
(+) Difference is equal to or larger than 3 points (prior to rounding) and favors women.
(−) Difference is equal to or larger than 3 points (prior to rounding) and favors men.
Disparities
o In the 2015 data, women were as likely as men to have received the flu vaccine.
10
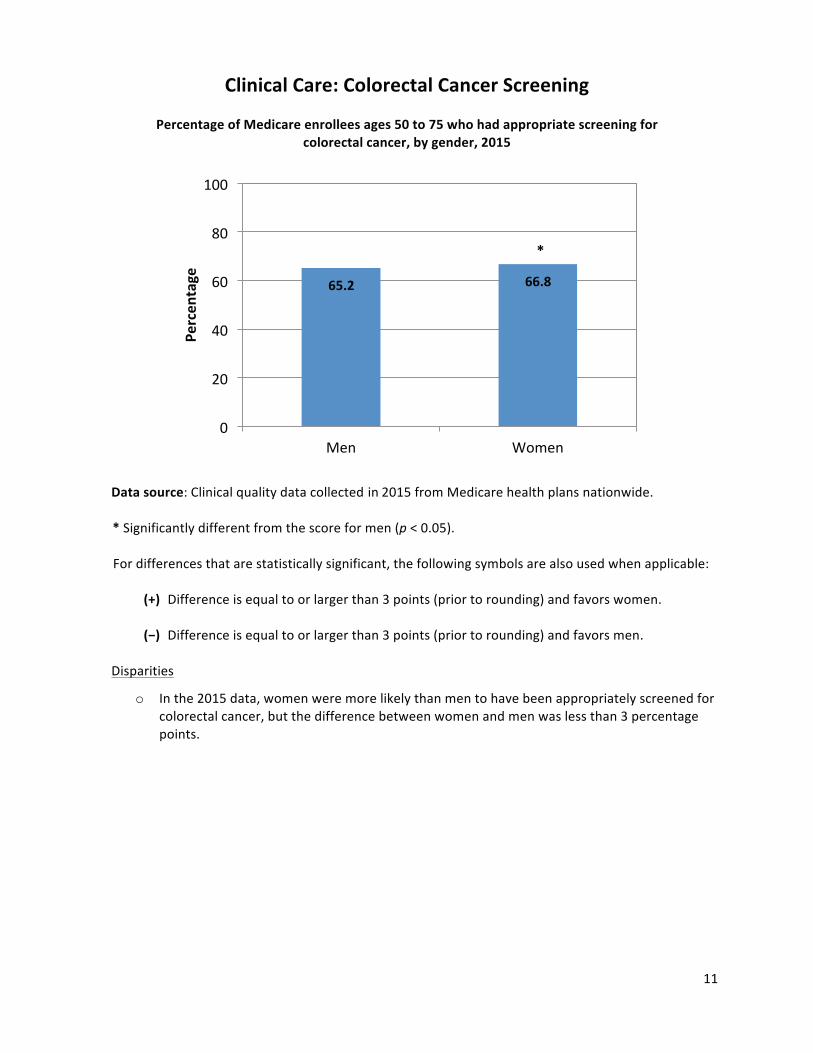
Clinical Care: Colorectal Cancer Screening
Percentage of Medicare enrollees ages 50 to 75 who had appropriate screening for colorectal cancer, by gender, 2015
100
80
60
40
20
0
Data source:Clinical quality data collected in 2015 from Medicare health plans nationwide.
* Significantly different from the score for men (p < 0.05).
For differences that are statistically significant, the following symbols are also used when applicable:
(+) Difference is equal to or larger than 3 points (prior to rounding) and favors women.
(−) Difference is equal to or larger than 3 points (prior to rounding) and favors men.
Disparities
o In the 2015 data, women were more likely than men to have been appropriately screened for colorectal cancer,but the difference between women and men was less than 3 percentage points.
Perc
enta
ge
65.2 66.8
*
Men Women
11

Clinical Care: Diabetes Care—Blood Sugar Testing
Percentage of Medicare enrollees ages 18 to 75 with diabetes (type 1 and type 2) who had 1 or more
94.2 95.1
0
20
40
60
80
100 Pe
rcen
tage
HbA1c tests in the past year,by gender, 2015
*
Men Women
Data source:Clinical quality data collected in 2015 from Medicare health plans nationwide.
* Significantly different from the score for men (p < 0.05).
For differences that are statistically significant, the following symbols are also used when applicable:
(+) Difference is equal to or larger than 3 points (prior to rounding) and favors women.
(−) Difference is equal to or larger than 3 points (prior to rounding) and favors men.
Disparities
o In the 2015 data, women with diabetes were more likely than men with diabetes to have had their blood sugar tested at least once in the past year. The difference between women and men was less than 3 percentage points.
12

Clinical Care: Diabetes Care—Eye Exam
Percentage of Medicare enrollees ages 18 to 75 with diabetes (type 1 and type 2) who had an eye exam (retinal) in the past year,by gender, 2015
100
80
60
40
20
0
Data source:Clinical quality data collected in 2015 from Medicare health plans nationwide.
* Significantly different from the score for men (p < 0.05).
For differences that are statistically significant, the following symbols are also used when applicable:
(+) Difference is equal to or larger than 3 points (prior to rounding) and favors women.
(−) Difference is equal to or larger than 3 points (prior to rounding) and favors men.
Disparities
o In the 2015 data, women with diabetes were more likely than men with diabetes to have hadan eye exam in the past year. The difference between women and men was greater than 3 percentage points.
Perc
enta
ge 71.4 74.6
*(+)
Men Women
13
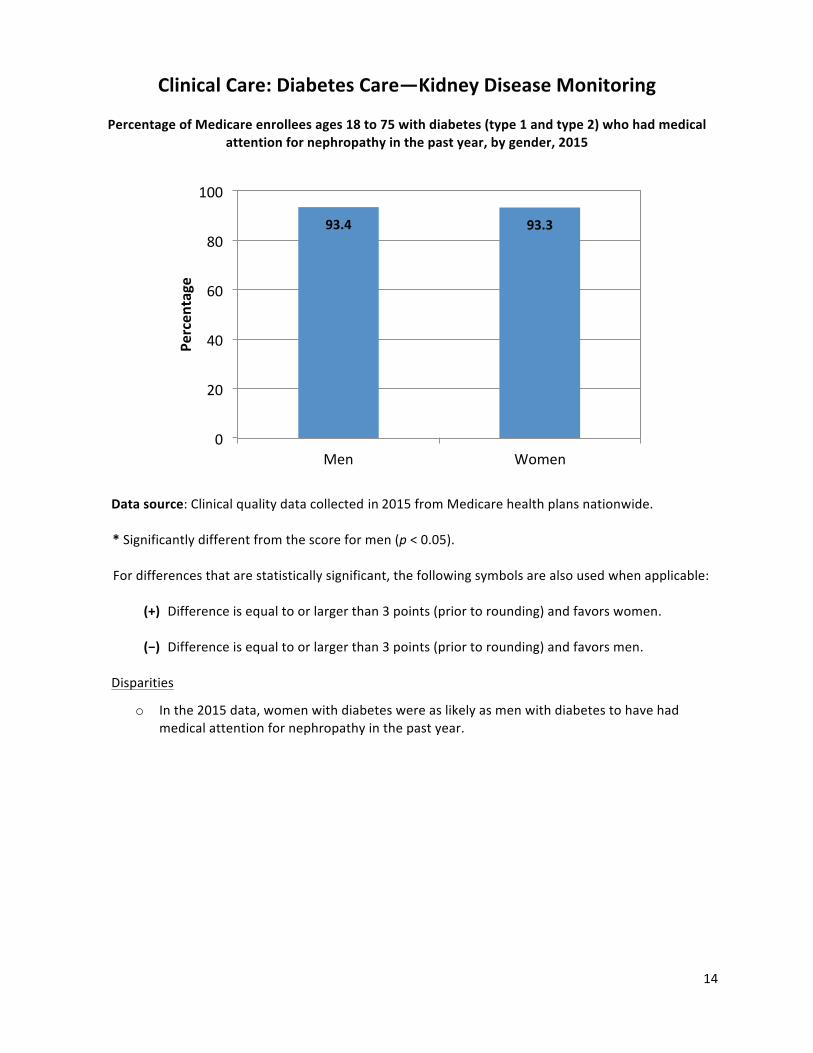
Clinical Care: Diabetes Care—Kidney Disease Monitoring
Percentage of Medicare enrollees ages 18 to 75 with diabetes (type 1 and type 2) who had medical
93.4 93.3
0
20
40
60
80
100 Pe
rcen
tage
attention for nephropathy in the past year,by gender, 2015
Men Women
Data source:Clinical quality data collected in 2015 from Medicare health plans nationwide.
* Significantly different from the score for men (p < 0.05).
For differences that are statistically significant, the following symbols are also used when applicable:
(+) Difference is equal to or larger than 3 points (prior to rounding) and favors women.
(−) Difference is equal to or larger than 3 points (prior to rounding) and favors men.
Disparities
o In the 2015 data, women with diabetes were as likely as men with diabetes to have had medical attention for nephropathy in the past year.
14
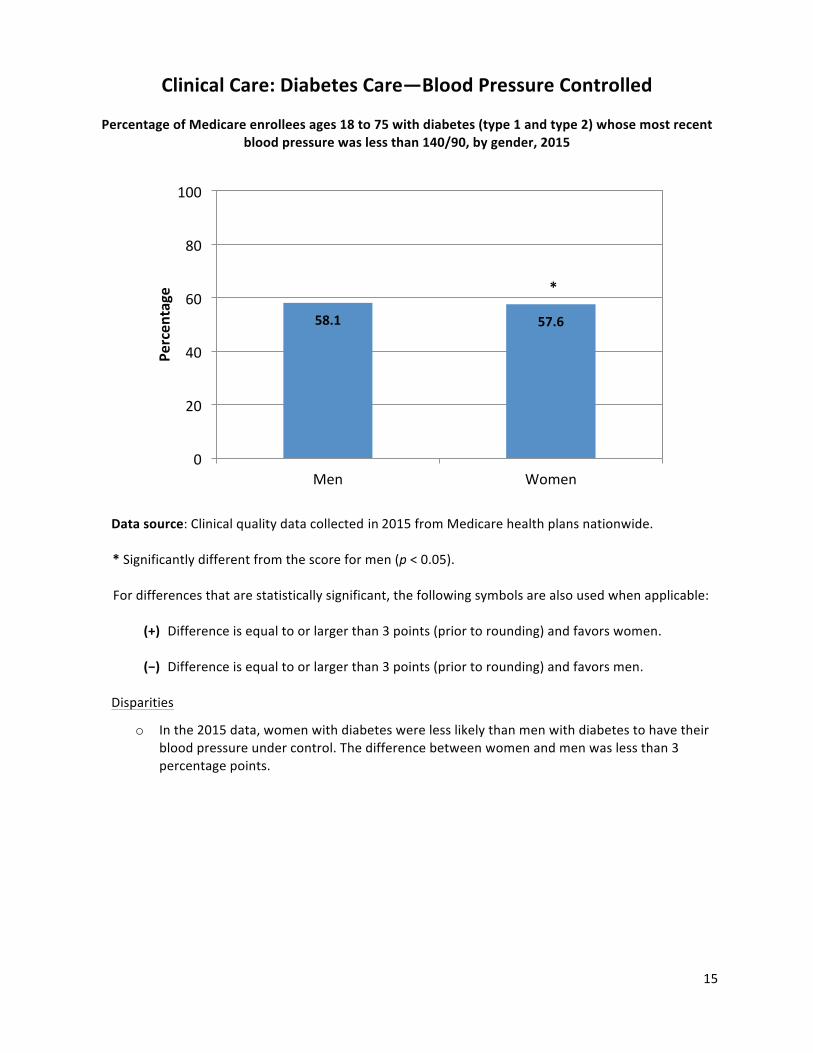
Clinical Care: Diabetes Care—Blood Pressure Controlled
Percentage of Medicare enrollees ages 18 to 75 with diabetes (type 1 and type 2) whose most recent blood pressure was less than 140/90,by gender, 2015
100
80
60
40
20
0
58.1 57.6
*
Men Women
Perc
enta
ge
Data source:Clinical quality data collected in 2015 from Medicare health plans nationwide.
* Significantly different from the score for men (p < 0.05).
For differences that are statistically significant,the following symbols are also used when applicable:
(+) Difference is equal to or larger than 3 points (prior to rounding) and favors women.
(−) Difference is equal to or larger than 3 points (prior to rounding) and favors men.
Disparities
o In the 2015 data, women with diabetes were less likely than men with diabetes to have their blood pressure under control. The difference between women and men was less than 3 percentage points.
15
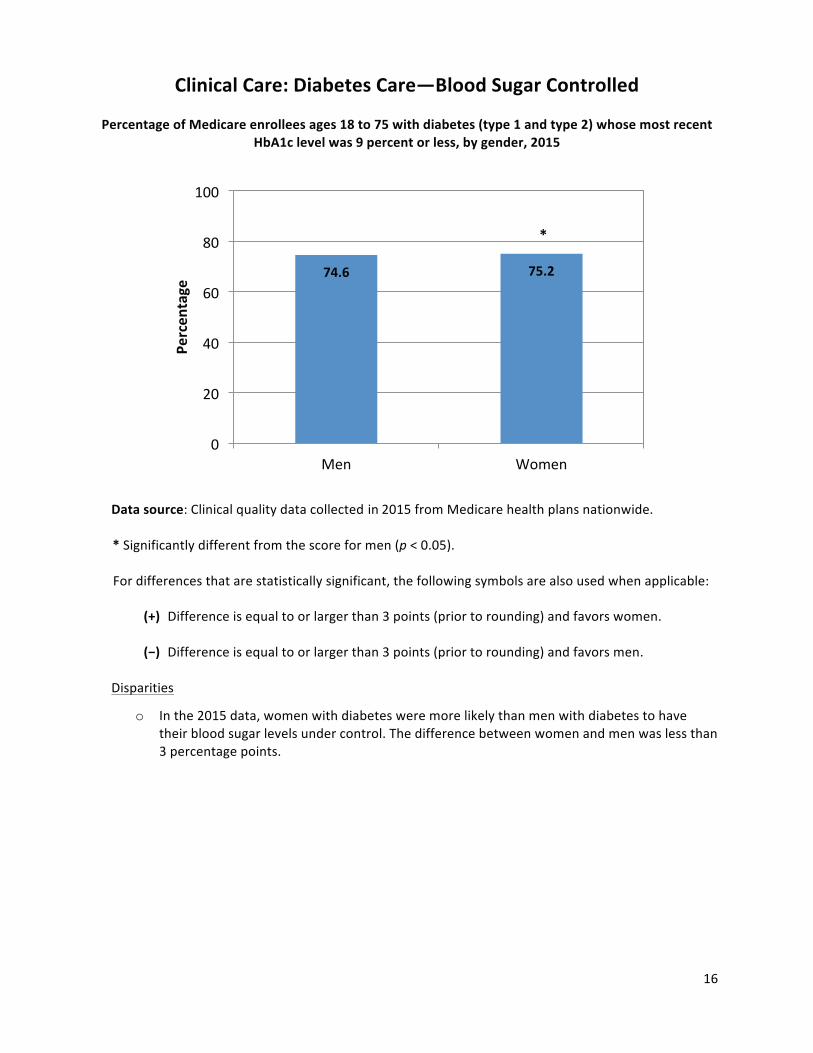
Clinical Care: Diabetes Care—Blood Sugar Controlled
Percentage of Medicare enrollees ages 18 to 75 with diabetes (type 1 and type 2) whose most recent HbA1c level was 9 percent or less,by gender, 2015
100
80
60
40
20
0
Data source:Clinical quality data collected in 2015 from Medicare health plans nationwide.
* Significantly different from the score for men (p < 0.05).
For differences that are statistically significant, the following symbols are also used when applicable:
(+) Difference is equal to or larger than 3 points (prior to rounding) and favors women.
(−) Difference is equal to or larger than 3 points (prior to rounding) and favors men.
Disparities
o In the 2015 data, women with diabetes were more likely than men with diabetes to have their blood sugar levels under control. The difference between women and men was less than 3 percentage points.
Perc
enta
ge 74.6 75.2
*
Men Women
16
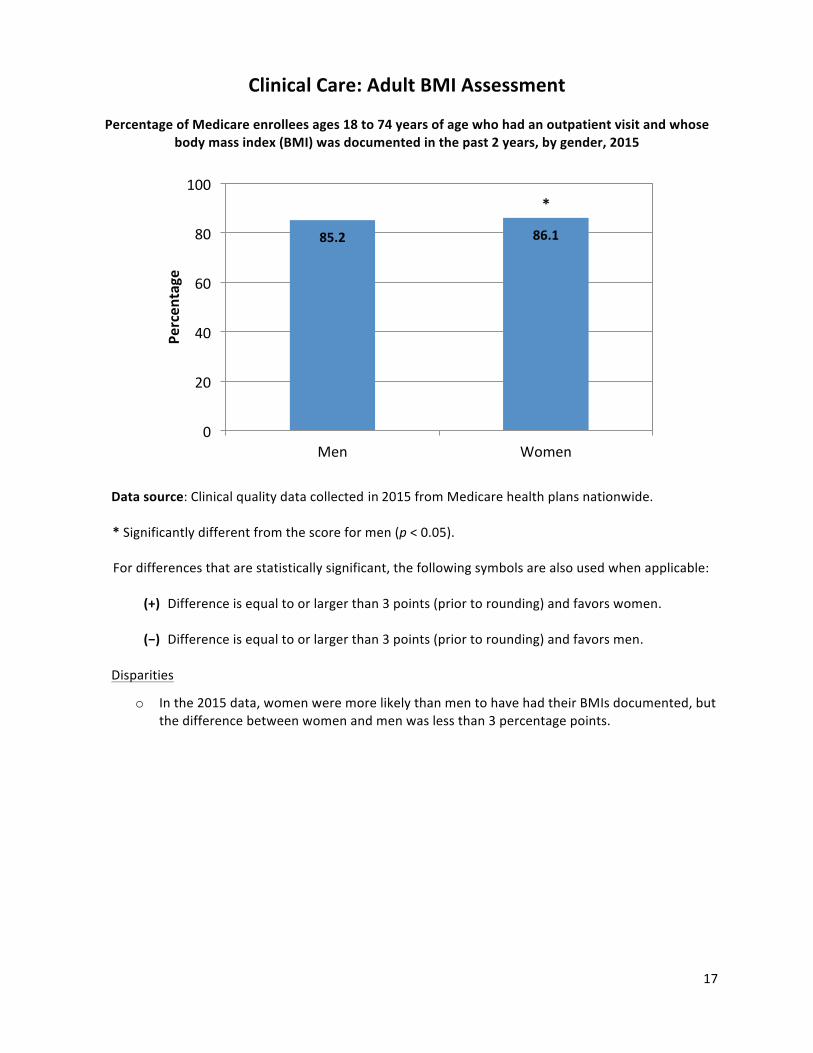
Clinical Care: Adult BMI Assessment
Percentage of Medicare enrollees ages 18 to 74 years of age who had an outpatient visit and whose
85.2 86.1
0
20
40
60
80
100 Pe
rcen
tage
*
body mass index (BMI) was documented in the past 2 years,by gender, 2015
Men Women
Data source:Clinical quality data collected in 2015 from Medicare health plans nationwide.
* Significantly different from the score for men (p < 0.05).
For differences that are statistically significant, the following symbols are also used when applicable:
(+) Difference is equal to or larger than 3 points (prior to rounding) and favors women.
(−) Difference is equal to or larger than 3 points (prior to rounding) and favors men.
Disparities
o In the 2015 data, women were more likely than men to have had their BMIs documented, but the difference between women and men was less than 3 percentage points.
17
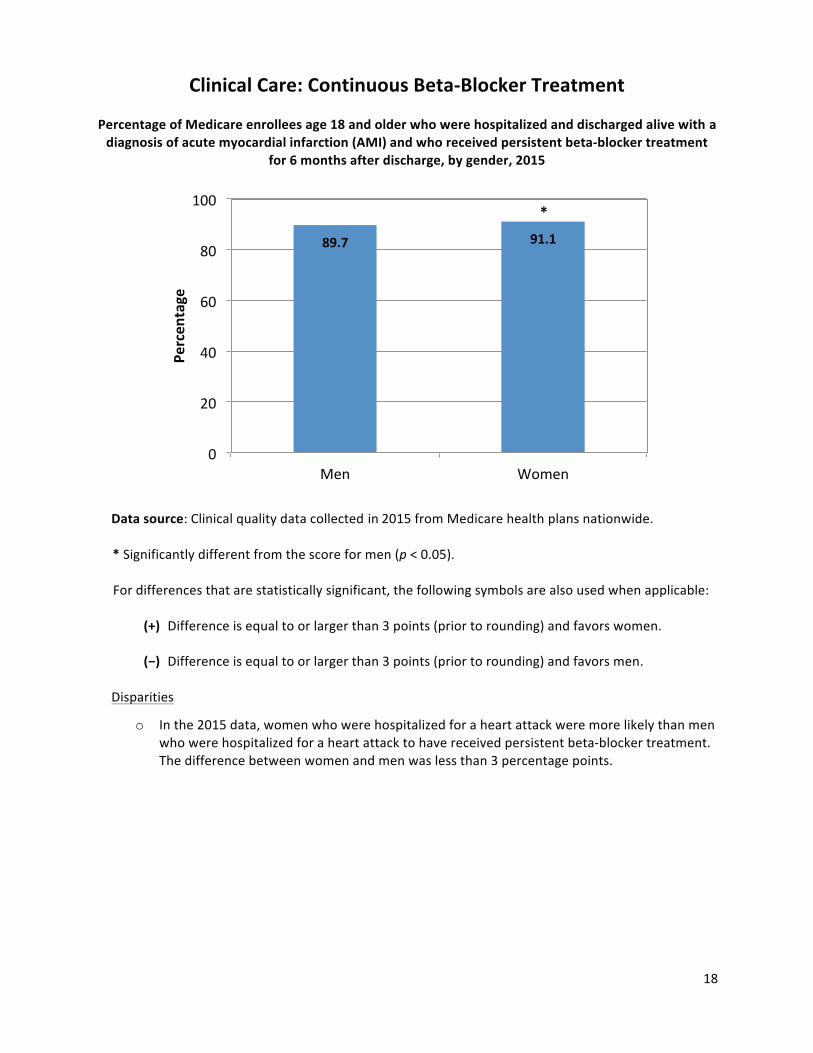
Clinical Care: Continuous Beta-Blocker Treatment
Percentage of Medicare enrollees age 18 and older who were hospitalized and discharged alive with a diagnosis of acute myocardial infarction (AMI) and who received persistent beta-blocker treatment
for 6 months after discharge,by gender,2015
100
80
60
40
20
0
89.7 91.1
*
Men Women
Perc
enta
ge
Data source:Clinical quality data collected in 2015 from Medicare health plans nationwide.
* Significantly different from the score for men (p < 0.05).
For differences that are statistically significant, the following symbols are also used when applicable:
(+) Difference is equal to or larger than 3 points (prior to rounding) and favors women.
(−) Difference is equal to or larger than 3 points (prior to rounding) and favors men.
Disparities
o In the 2015 data, women who were hospitalized for a heart attack were more likely than men who were hospitalized for a heart attack to have received persistent beta-blocker treatment. The difference between women and men was less than 3 percentage points.
18
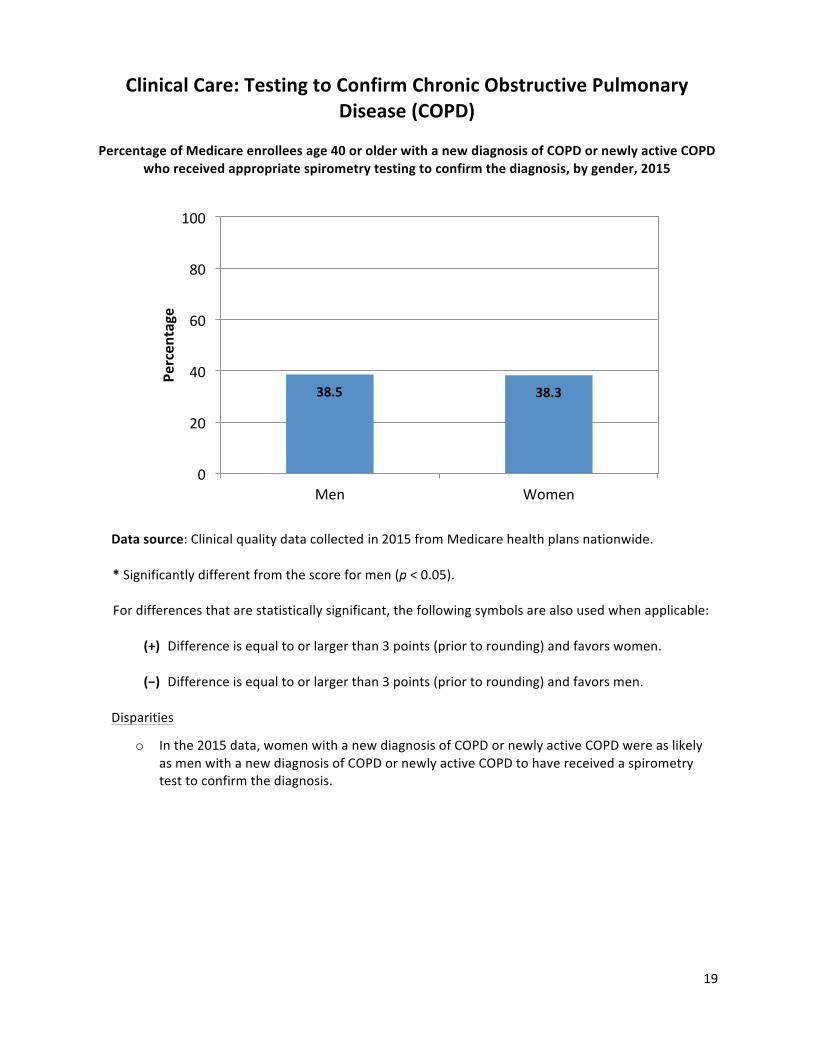
Clinical Care: Testing to Confirm Chronic Obstructive Pulmonary Disease (COPD)
Percentage of Medicare enrollees age 40 or older with a new diagnosis of COPD or newly active COPD who received appropriate spirometry testing to confirm the diagnosis,by gender,2015
100
80
60
40
20
0
Data source:Clinical quality data collected in 2015 from Medicare health plans nationwide.
* Significantly different from the score for men (p < 0.05).
For differences that are statistically significant, the following symbols are also used when applicable:
(+) Difference is equal to or larger than 3 points (prior to rounding) and favors women.
(−) Difference is equal to or larger than 3 points (prior to rounding) and favors men.
Disparities
o In the 2015 data, women with a new diagnosis of COPD or newly active COPD were as likely as men with a new diagnosis of COPD or newly active COPD to have received a spirometry test to confirm the diagnosis.
Perc
enta
ge
38.5 38.3
Men Women
19
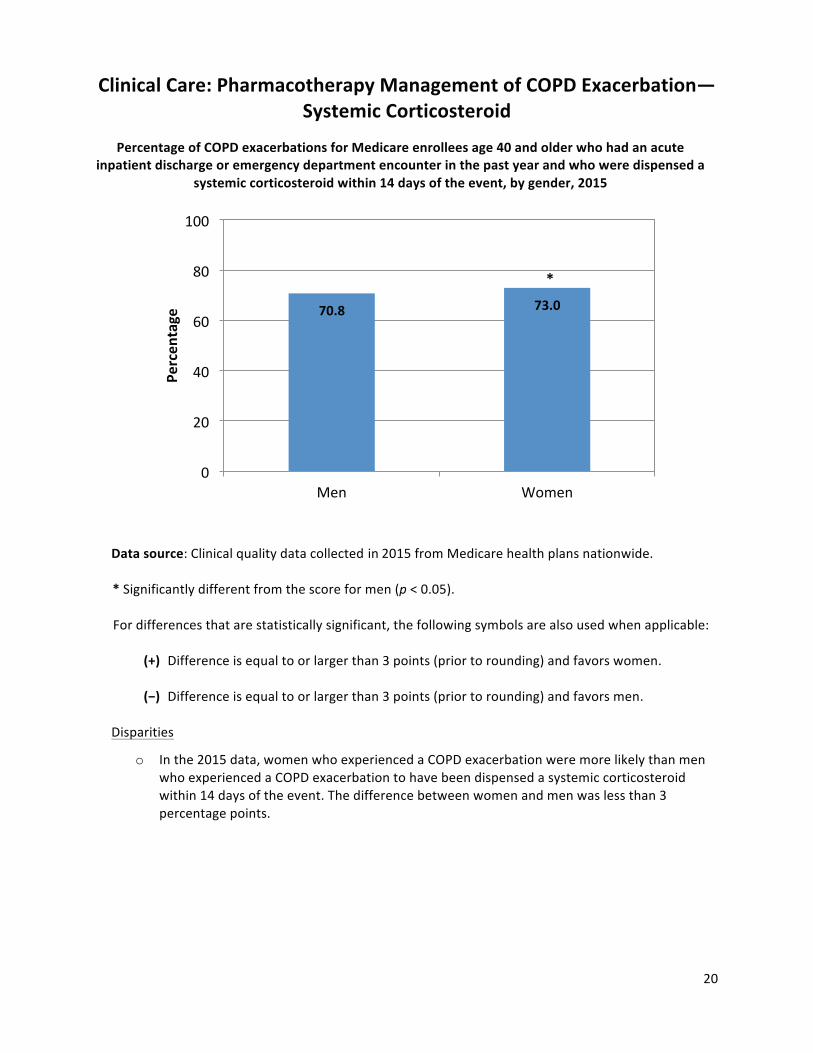
Clinical Care: Pharmacotherapy Management of COPD Exacerbation— Systemic Corticosteroid
Percentage of COPD exacerbations for Medicare enrollees age 40 and older who had an acute inpatient discharge or emergency department encounter in the past year and who were dispensed a
systemic corticosteroid within 14 days of the event,by gender,2015
100
80
60
40
20
0
Data source:Clinical quality data collected in 2015 from Medicare health plans nationwide.
* Significantly different from the score for men (p < 0.05).
For differences that are statistically significant, the following symbols are also used when applicable:
(+) Difference is equal to or larger than 3 points (prior to rounding) and favors women.
(−) Difference is equal to or larger than 3 points (prior to rounding) and favors men.
Disparities
o In the 2015 data, women who experienced a COPD exacerbation were more likely than men who experienced a COPD exacerbation to have been dispensed a systemic corticosteroid within 14 days of the event. The difference between women and men was less than 3 percentage points.
Perc
enta
ge 70.8 73.0
*
Men Women
20
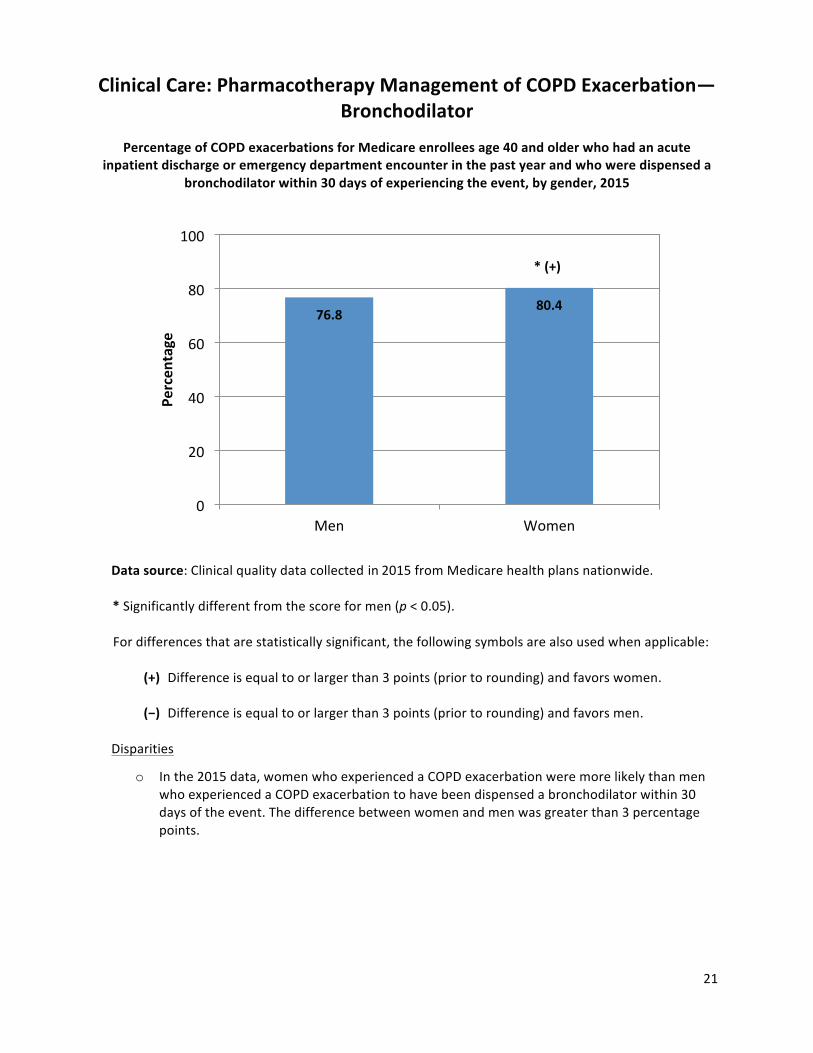
Clinical Care: Pharmacotherapy Management of COPD Exacerbation— Bronchodilator
Percentage of COPD exacerbations for Medicare enrollees age 40 and older who had an acute inpatient discharge or emergency department encounter in the past year and who were dispensed a
bronchodilator within 30 days of experiencing the event,by gender,2015
100
80
60
40
20
0
Data source:Clinical quality data collected in 2015 from Medicare health plans nationwide.
* Significantly different from the score for men (p < 0.05).
For differences that are statistically significant,the following symbols are also used when applicable:
(+) Difference is equal to or larger than 3 points (prior to rounding) and favors women.
(−) Difference is equal to or larger than 3 points (prior to rounding) and favors men.
Disparities
o In the 2015 data, women who experienced a COPD exacerbation were more likely than men who experienced a COPD exacerbation to have been dispensed a bronchodilator within 30 days of the event. The difference between women and men was greater than 3 percentage points.
Perc
enta
ge
76.8 80.4
*(+)
Men Women
21
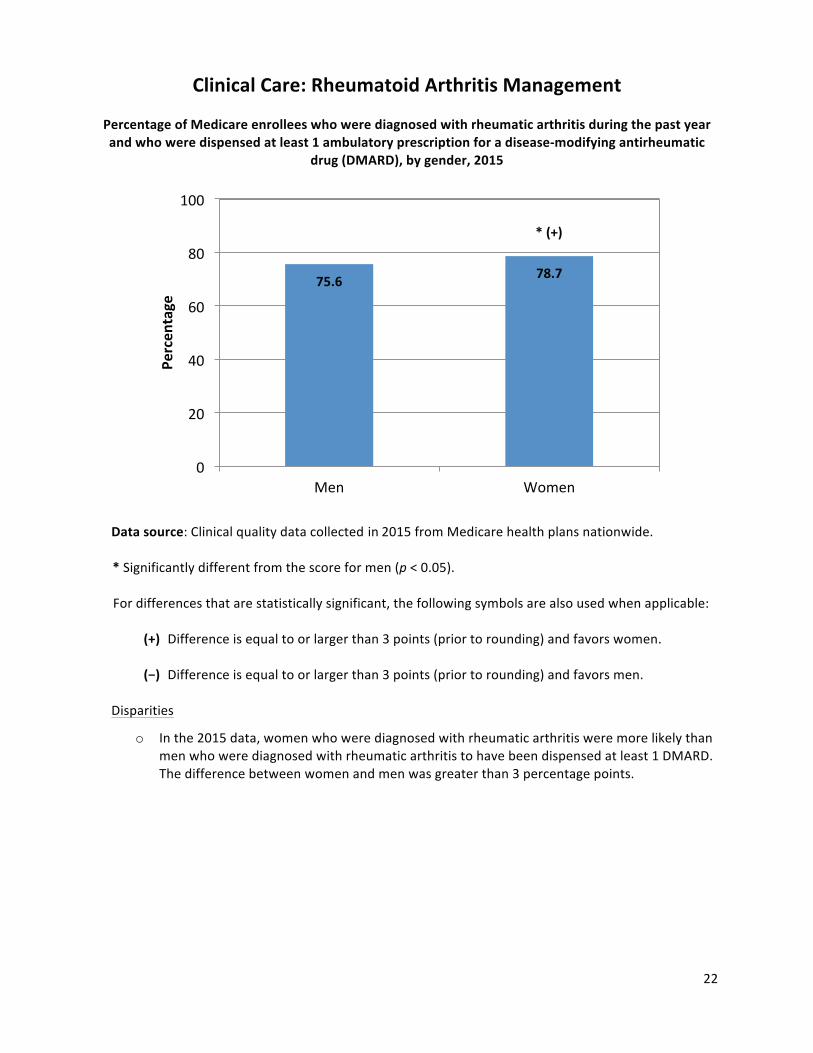
Clinical Care: Rheumatoid Arthritis Management
Percentage of Medicare enrollees who were diagnosed with rheumatic arthritis during the past year and who were dispensed at least 1 ambulatory prescription for a disease-modifying antirheumatic
drug (DMARD),by gender,2015
100
80
60
40
20
0
Data source:Clinical quality data collected in 2015 from Medicare health plans nationwide.
* Significantly different from the score for men (p < 0.05).
For differences that are statistically significant, the following symbols are also used when applicable:
(+) Difference is equal to or larger than 3 points (prior to rounding) and favors women.
(−) Difference is equal to or larger than 3 points (prior to rounding) and favors men.
Disparities
o In the 2015 data, women who were diagnosed with rheumatic arthritis were more likely than men who were diagnosed with rheumatic arthritis to have been dispensed at least 1 DMARD. The difference between women and men was greater than 3 percentage points.
Perc
enta
ge 75.6 78.7
*(+)
Men Women
22
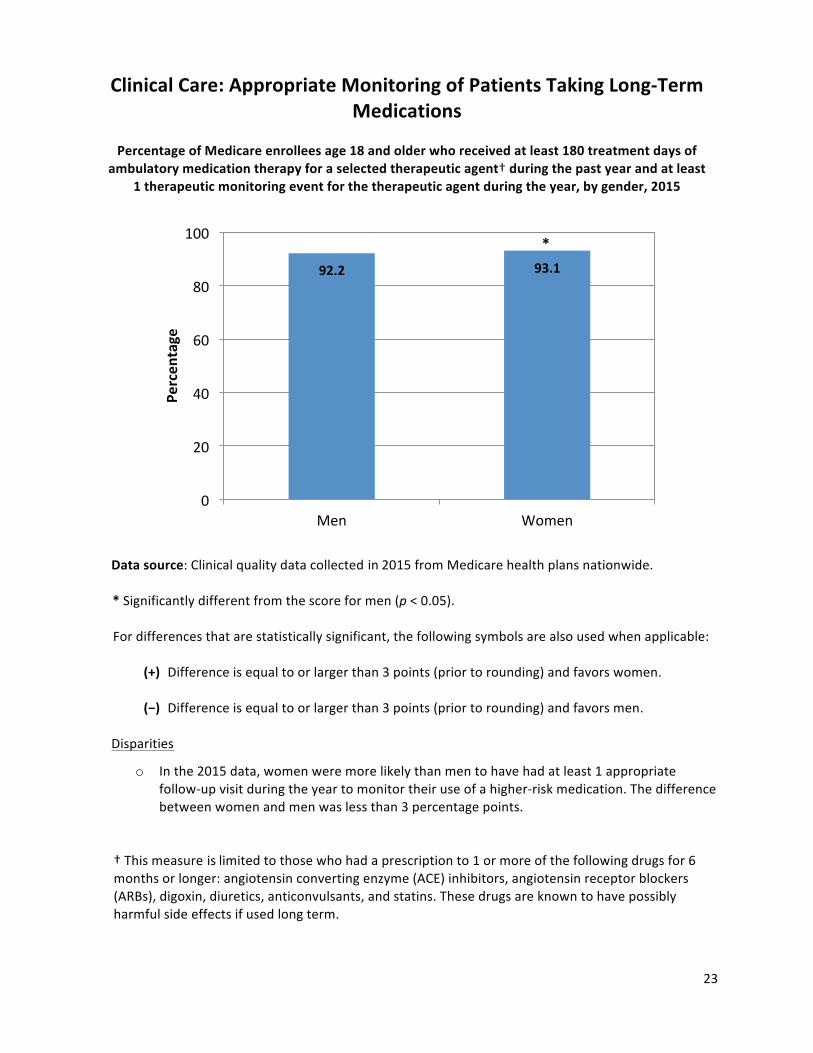
Clinical Care: Appropriate Monitoring of Patients Taking Long-Term Medications
Percentage of Medicare enrollees age 18 and older who received at least 180 treatment days of ambulatory medication therapy for a selected therapeutic agent† during the past year and at least
1 therapeutic monitoring event for the therapeutic agent during the year,by gender,2015
100
80
60
40
20
0
Data source:Clinical quality data collected in 2015 from Medicare health plans nationwide.
* Significantly different from the score for men (p < 0.05).
For differences that are statistically significant, the following symbols are also used when applicable:
(+) Difference is equal to or larger than 3 points (prior to rounding) and favors women.
(−) Difference is equal to or larger than 3 points (prior to rounding) and favors men.
Disparities
o In the 2015 data, women were more likely than men to have had at least 1 appropriate follow-up visit during the year to monitor their use of a higher-risk medication. The difference between women and men was less than 3 percentage points.
† This measure is limited to those who had a prescription to 1 or more of the following drugs for 6 months or longer: angiotensin converting enzyme (ACE) inhibitors, angiotensin receptor blockers (ARBs), digoxin, diuretics, anticonvulsants, and statins. These drugs are known to have possibly harmful side effects if used long term.
Perc
enta
ge
92.2 93.1
*
Men Women
23
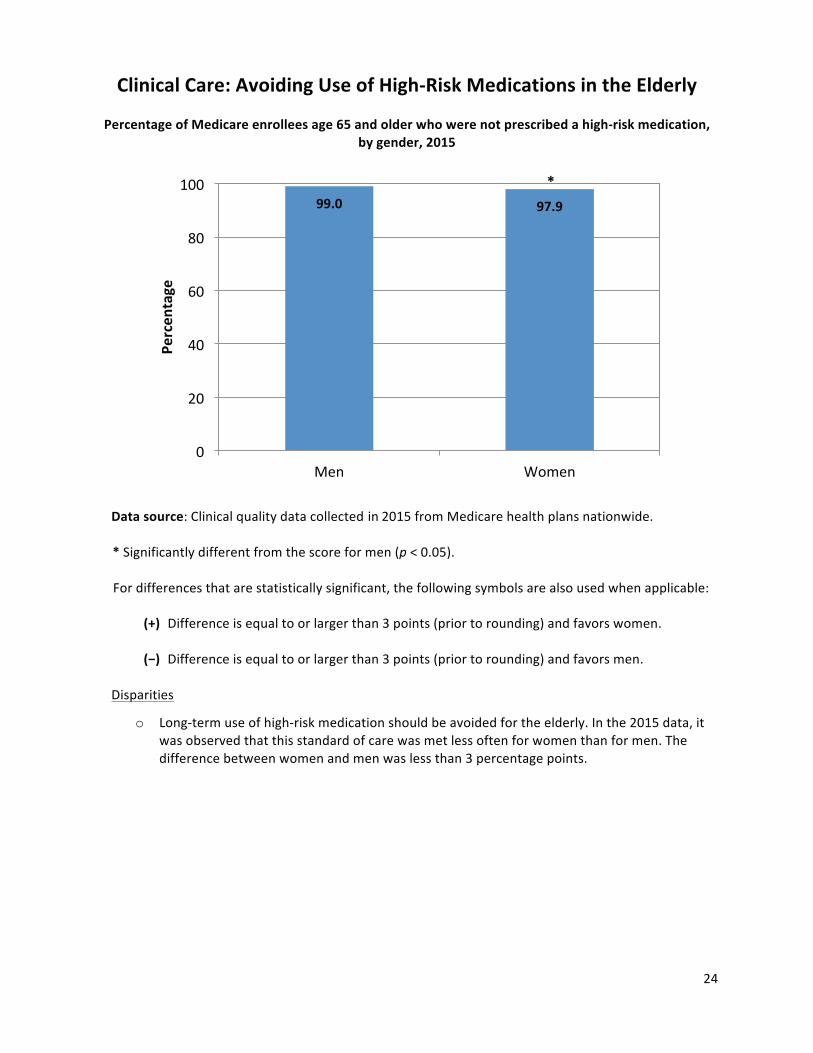
Clinical Care: Avoiding Use of High-Risk Medications in the Elderly
Percentage of Medicare enrollees age 65 and older who were not prescribed a high-risk medication,
99.0 97.9
0
20
40
60
80
100 Pe
rcen
tage
by gender,2015
*
Men Women
Data source:Clinical quality data collected in 2015 from Medicare health plans nationwide.
* Significantly different from the score for men (p < 0.05).
For differences that are statistically significant, the following symbols are also used when applicable:
(+) Difference is equal to or larger than 3 points (prior to rounding) and favors women.
(−) Difference is equal to or larger than 3 points (prior to rounding) and favors men.
Disparities
o Long-term use of high-risk medication should be avoided for the elderly. In the 2015 data, it was observed that this standard of care was met less often for women than for men. The difference between women and men was less than 3 percentage points.
24
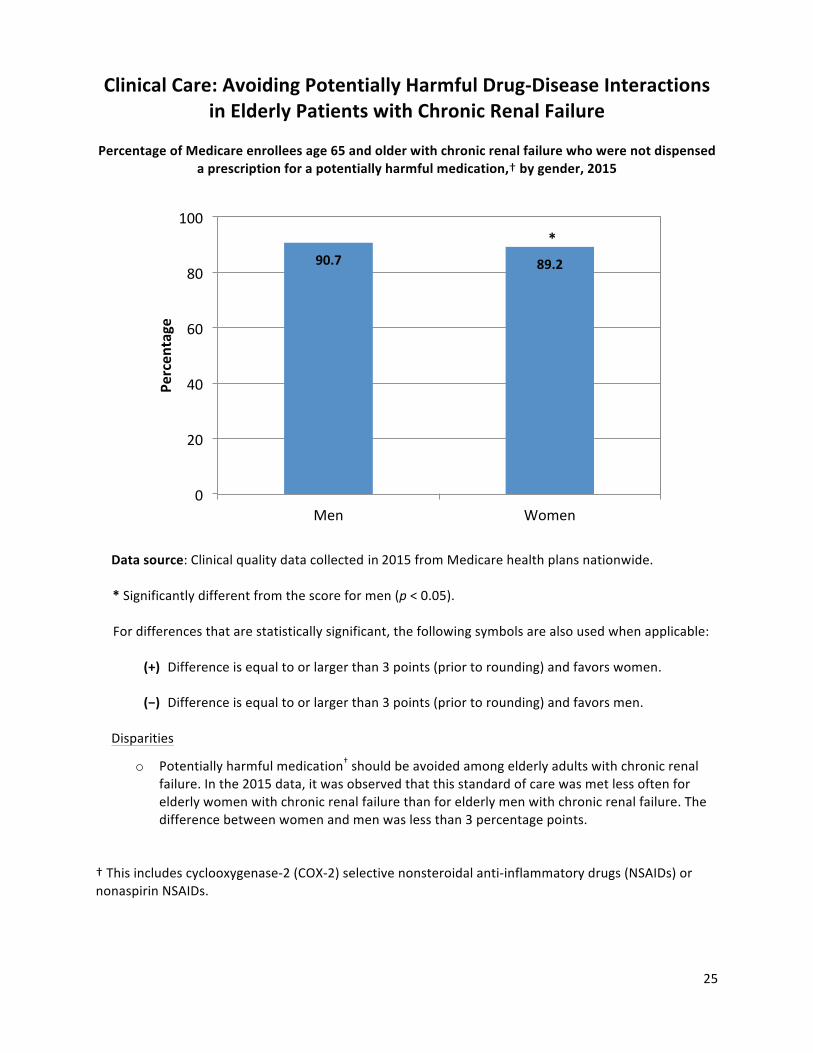
Clinical Care: Avoiding Potentially Harmful Drug-Disease Interactions in Elderly Patients with Chronic Renal Failure
Percentage of Medicare enrollees age 65 and older with chronic renal failure who were not dispensed a prescription for a potentially harmful medication,† by gender,2015
100
80
60
40
20
0
Data source:Clinical quality data collected in 2015 from Medicare health plans nationwide.
* Significantly different from the score for men (p < 0.05).
For differences that are statistically significant, the following symbols are also used when applicable:
(+) Difference is equal to or larger than 3 points (prior to rounding) and favors women.
(−) Difference is equal to or larger than 3 points (prior to rounding) and favors men.
Disparities
o Potentially harmfulmedication† should be avoided among elderly adults with chronic renal failure. In the 2015 data, it was observed that this standard of care was met less often for elderly women with chronic renal failure than for elderly men with chronic renal failure. The difference between women and men was less than 3 percentage points.
† This includes cyclooxygenase-2 (COX-2) selective nonsteroidalanti-inflammatory drugs (NSAIDs) or nonaspirin NSAIDs.
Perc
enta
ge
90.7 89.2
*
Men Women
25

Clinical Care: Avoiding Potentially Harmful Drug-Disease Interactions in Elderly Patients with Dementia
Percentage of Medicare enrollees age 65 and older with dementia who were not dispensed a prescription for a potentially harmful medication,† by gender, 2015
100
80
60
40
20
0
Data source:Clinical quality data collected in 2015 from Medicare health plans nationwide.
* Significantly different from the score for men (p < 0.05).
For differences that are statistically significant, the following symbols are also used when applicable:
(+) Difference is equal to or larger than 3 points (prior to rounding) and favors women.
(−) Difference is equal to or larger than 3 points (prior to rounding) and favors men.
Disparities
o Potentially harmfulmedication† should be avoided among elderly adults with dementia. In the 2015 data, it was observed that this standard of care was met less often for elderly women with dementia than for elderly men with dementia. The difference between women and men was greater than 3 percentage points.
† This includes antiemetics,antipsychotics,benzodiazepines,tricyclic antidepressants,H2 receptor antagonists, nonbenzodiazepine hypnotics, and anticholinergic agents.
Perc
enta
ge
56.1 47.8
*(−)
Men Women
26
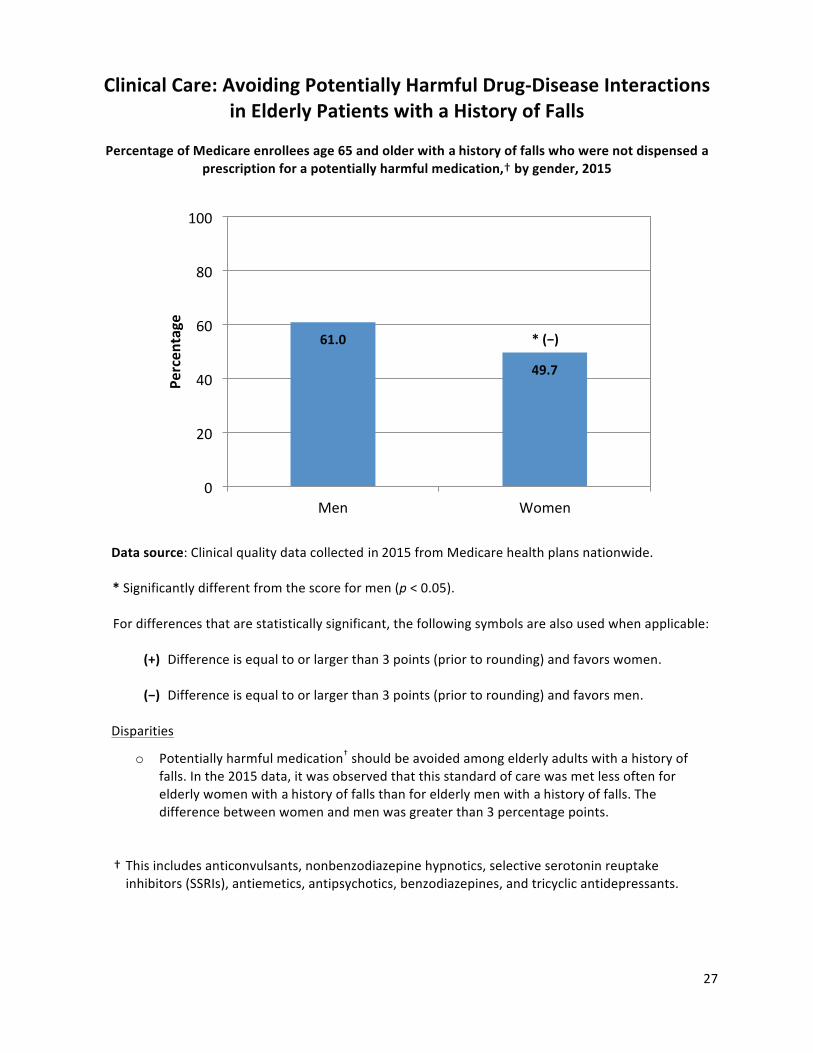
Clinical Care: Avoiding Potentially Harmful Drug-Disease Interactions in Elderly Patients with a History of Falls
Percentage of Medicare enrollees age 65 and older with a history of falls who were not dispensed a prescription for a potentially harmful medication,† by gender,2015
100
80
60
40
20
0
Data source:Clinical quality data collected in 2015 from Medicare health plans nationwide.
* Significantly different from the score for men (p < 0.05).
For differences that are statistically significant, the following symbols are also used when applicable:
(+) Difference is equal to or larger than 3 points (prior to rounding) and favors women.
(−) Difference is equal to or larger than 3 points (prior to rounding) and favors men.
Disparities
o Potentially harmfulmedication† should be avoided among elderly adults with a history of falls. In the 2015 data, it was observed that this standard of care was met less often for elderly women with a history of falls than for elderly men with a history of falls. The difference between women and men was greater than 3 percentage points.
† This includes anticonvulsants, nonbenzodiazepine hypnotics, selective serotonin reuptake inhibitors (SSRIs), antiemetics, antipsychotics, benzodiazepines, and tricyclic antidepressants.
Perc
enta
ge
61.0
49.7
*(−)
Men Women
27
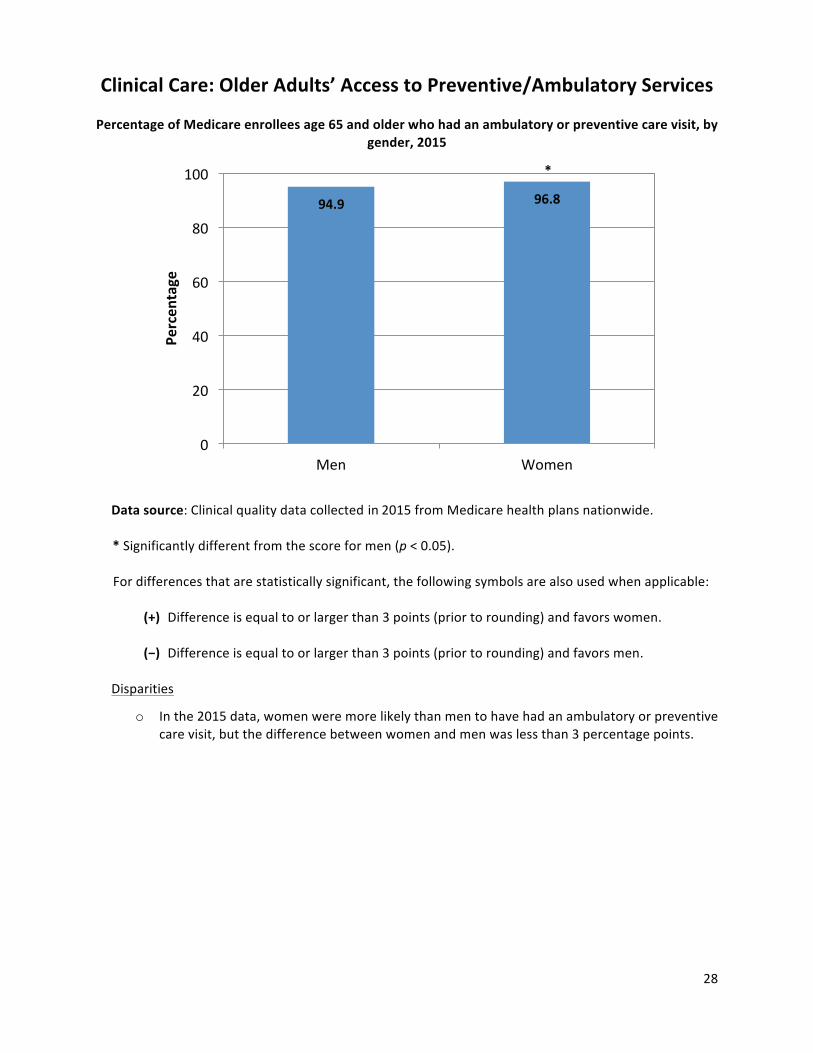
Clinical Care: Older Adults’ Access to Preventive/Ambulatory Services
Percentage of Medicare enrollees age 65 and older who had an ambulatory or preventive care visit, by
94.9 96.8
0
20
40
60
80
100 Pe
rcen
tage
gender,2015
*
Men Women
Data source:Clinical quality data collected in 2015 from Medicare health plans nationwide.
* Significantly different from the score for men (p < 0.05).
For differences that are statistically significant, the following symbols are also used when applicable:
(+) Difference is equal to or larger than 3 points (prior to rounding) and favors women.
(−) Difference is equal to or larger than 3 points (prior to rounding) and favors men.
Disparities
o In the 2015 data, women were more likely than men to have had an ambulatory or preventive care visit, but the difference between women and men was less than 3 percentage points.
28
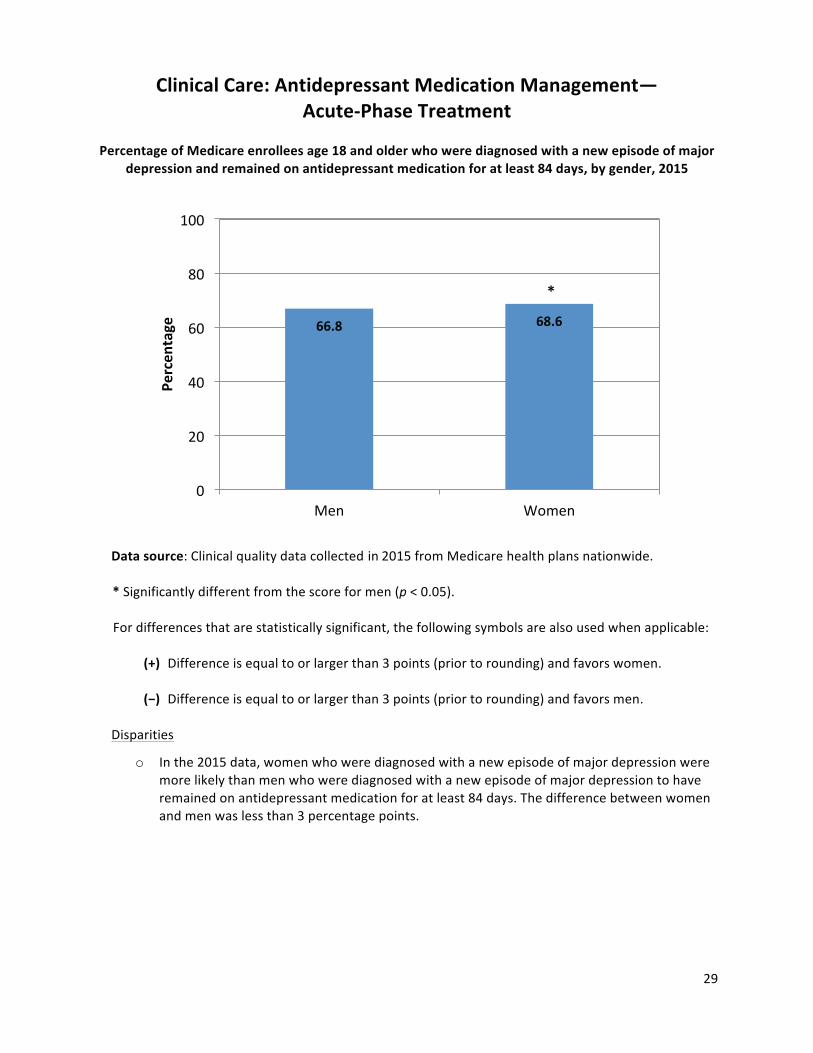
Clinical Care: Antidepressant Medication Management— Acute-Phase Treatment
Percentage of Medicare enrollees age 18 and older who were diagnosed with a new episode of major depression and remained on antidepressant medication for at least 84 days, by gender,2015
100
80
60
40
20
0
Data source:Clinical quality data collected in 2015 from Medicare health plans nationwide.
* Significantly different from the score for men (p < 0.05).
For differences that are statistically significant,the following symbols are also used when applicable:
(+) Difference is equal to or larger than 3 points (prior to rounding) and favors women.
(−) Difference is equal to or larger than 3 points (prior to rounding) and favors men.
Disparities
o In the 2015 data, women who were diagnosed with a new episode of major depression were more likely than men who were diagnosed with a new episode of major depression to have remained on antidepressant medication for at least 84 days. The difference between women and men was less than 3 percentage points.
Perc
enta
ge
66.8 68.6
*
Men Women
29
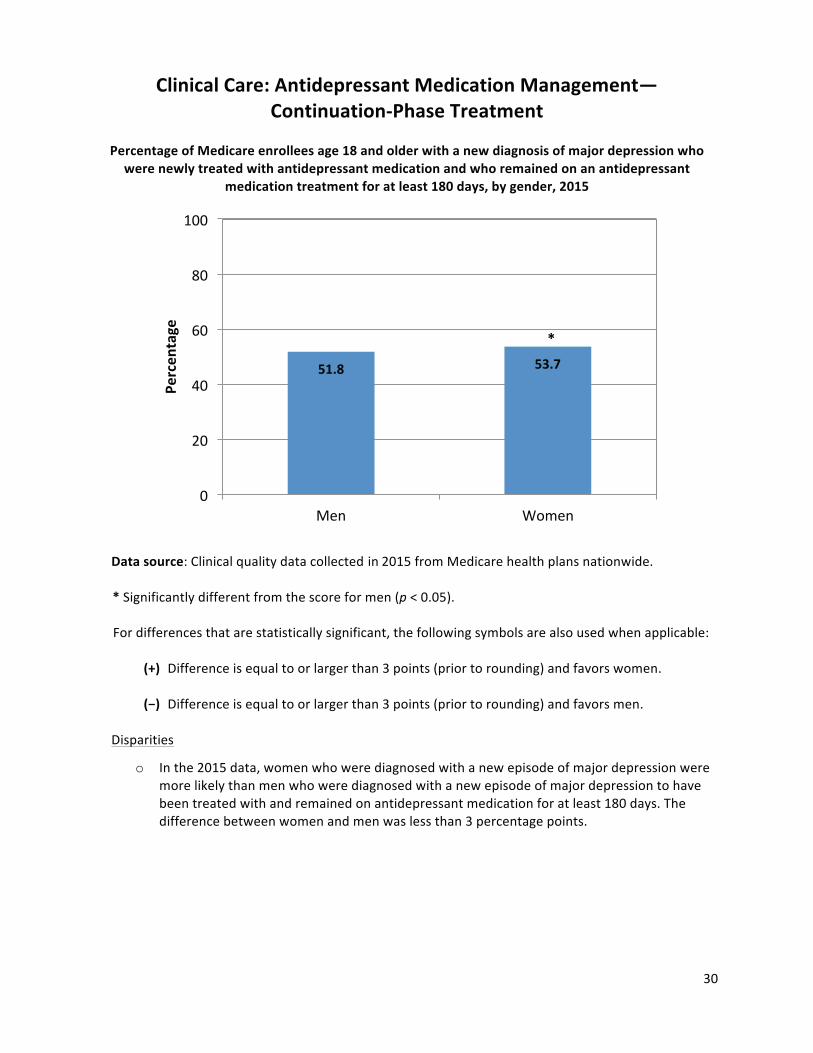
Clinical Care: Antidepressant Medication Management— Continuation-Phase Treatment
Percentage of Medicare enrollees age 18 and older with a new diagnosis of major depression whwere newly treated with antidepressant medication and who remained on an antidepressant
medication treatment for at least 180 days, by gender,2015
100
80
60
40
20
0
Data source:Clinical quality data collected in 2015 from Medicare health plans nationwide.
* Significantly different from the score for men (p < 0.05).
For differences that are statistically significant, the following symbols are also used when applicabl
(+) Difference is equal to or larger than 3 points (prior to rounding) and favors women.
(−) Difference is equal to or larger than 3 points (prior to rounding) and favors men.
Disparities
o In the 2015 data, women who were diagnosed with a new episode of major depression wermore likely than men who were diagnosed with a new episode of major depression to havebeen treated with and remained on antidepressant medication for at least 180 days. The difference between women and men was less than 3 percentage points.
Perc
enta
ge
51.8 53.7
*
Men Women
o
e:
e
30
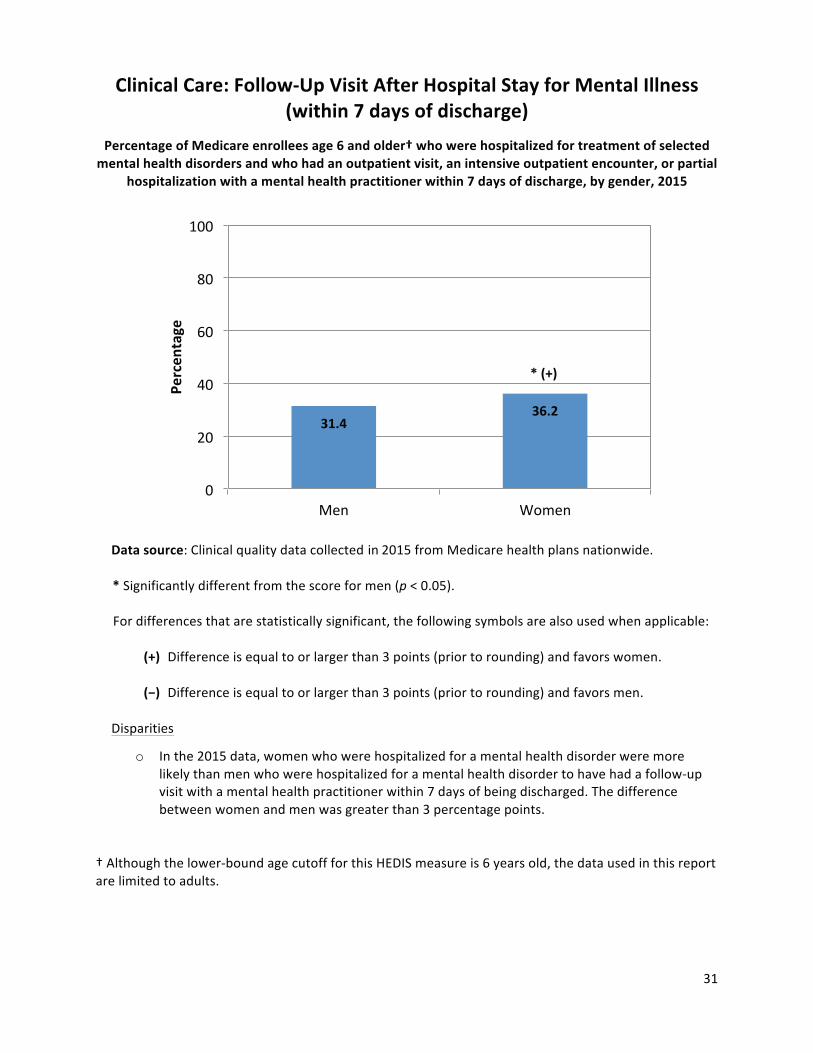
Clinical Care: Follow-Up Visit After Hospital Stay for Mental Illness (within 7 days of discharge)
Percentage of Medicare enrollees age 6 and older† who were hospitalized for treatment of selected mental health disorders and who had an outpatient visit, an intensive outpatient encounter, or partial
hospitalization with a mental health practitioner within 7 days of discharge, by gender,2015
100
80
60
40
20
0
Data source:Clinical quality data collected in 2015 from Medicare health plans nationwide.
* Significantly different from the score for men (p < 0.05).
For differences that are statistically significant,the following symbols are also used when applicable:
(+) Difference is equal to or larger than 3 points (prior to rounding) and favors women.
(−) Difference is equal to or larger than 3 points (prior to rounding) and favors men.
Disparities
o In the 2015 data, women who were hospitalized for a mental health disorder were more likely than men who were hospitalized for a mental health disorder to have had a follow-up visit with a mental health practitioner within 7 days of being discharged. The difference between women and men was greater than 3 percentage points.
† Although the lower-bound age cutoff for this HEDIS measure is 6 years old, the data used in this report are limited to adults.
Perc
enta
ge
31.4 36.2
*(+)
Men Women
31
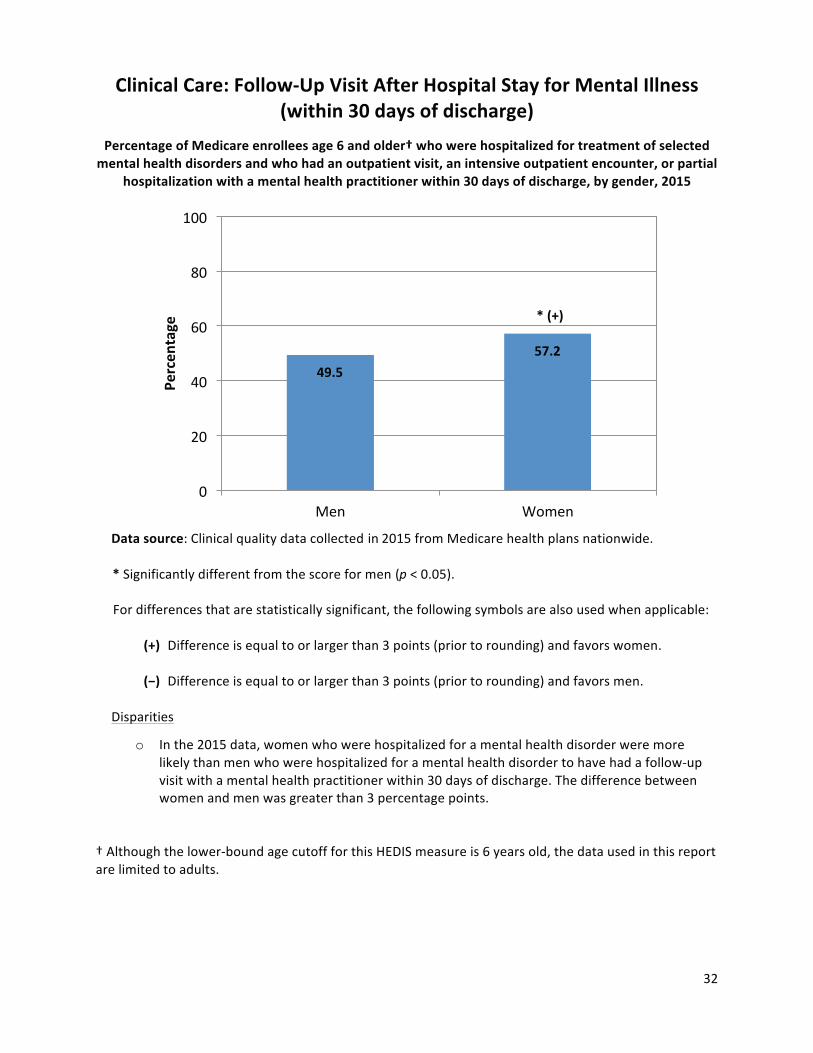
Clinical Care: Follow-Up Visit After Hospital Stay for Mental Illness (within 30 days of discharge)
Percentage of Medicare enrollees age 6 and older† who were hospitalized for treatment of selected mental health disorders and who had an outpatient visit, an intensive outpatient encounter, or partial
hospitalization with a mental health practitioner within 30 days of discharge, by gender,2015
100
80
60
40
20
0
Data source:Clinical quality data collected in 2015 from Medicare health plans nationwide.
* Significantly different from the score for men (p < 0.05).
For differences that are statistically significant, the following symbols are also used when applicable:
(+) Difference is equal to or larger than 3 points (prior to rounding) and favors women.
(−) Difference is equal to or larger than 3 points (prior to rounding) and favors men.
Disparities
o In the 2015 data, women who were hospitalized for a mental health disorder were more likely than men who were hospitalized for a mental health disorder to have had a follow-up visit with a mental health practitioner within 30 days of discharge. The difference between women and men was greater than 3 percentage points.
† Although the lower-bound age cutoff for this HEDIS measure is 6 years old, the data used in this report are limited to adults.
Perc
enta
ge
49.5 57.2
*(+)
Men Women
32
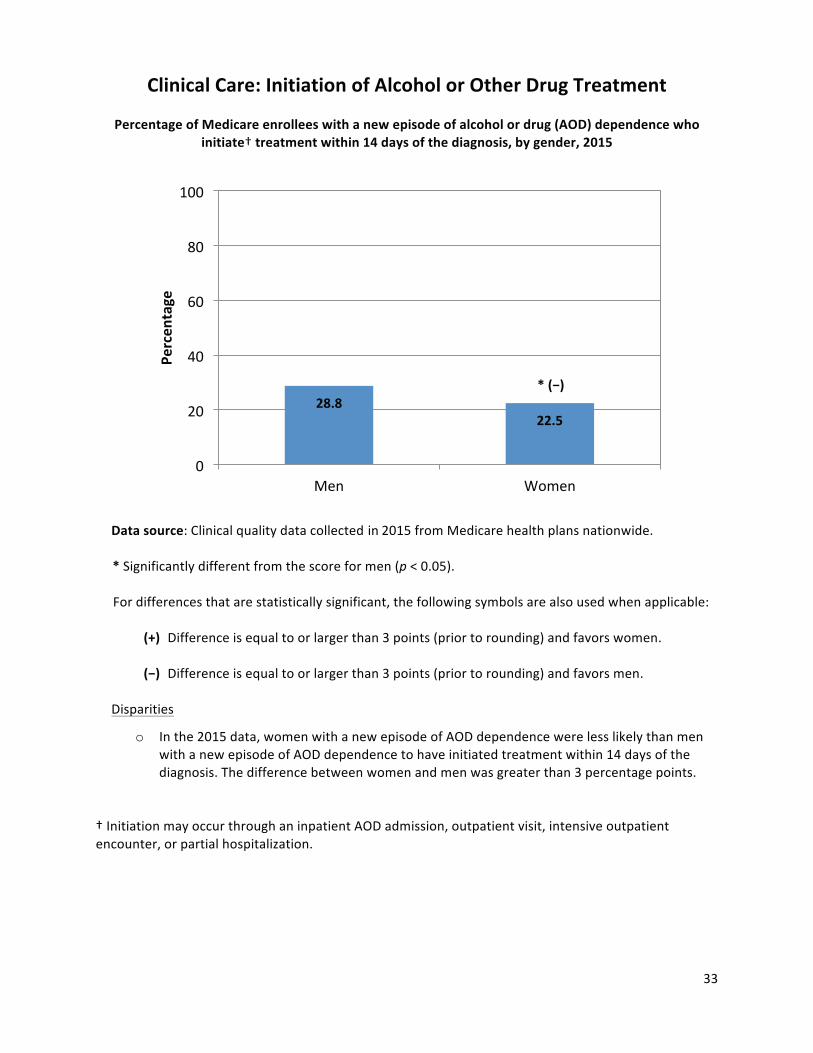
Clinical Care: Initiation of Alcohol or Other Drug Treatment
Percentage of Medicare enrollees with a new episode of alcohol or drug (AOD) dependence who initiate† treatment within 14 days of the diagnosis, by gender,2015
100
80
60
40
20
0
Data source:Clinical quality data collected in 2015 from Medicare health plans nationwide.
* Significantly different from the score for men (p < 0.05).
For differences that are statistically significant, the following symbols are also used when applicable:
(+) Difference is equal to or larger than 3 points (prior to rounding) and favors women.
(−) Difference is equal to or larger than 3 points (prior to rounding) and favors men.
Disparities
o In the 2015 data, women with a new episode of AOD dependence were less likely than men with a new episode of AOD dependence to have initiated treatment within 14 days of the diagnosis. The difference between women and men was greater than 3 percentage points.
† Initiation may occur through an inpatient AOD admission, outpatient visit, intensive outpatient encounter, or partial hospitalization.
Perc
enta
ge
28.8 22.5
*(−)
Men Women
33
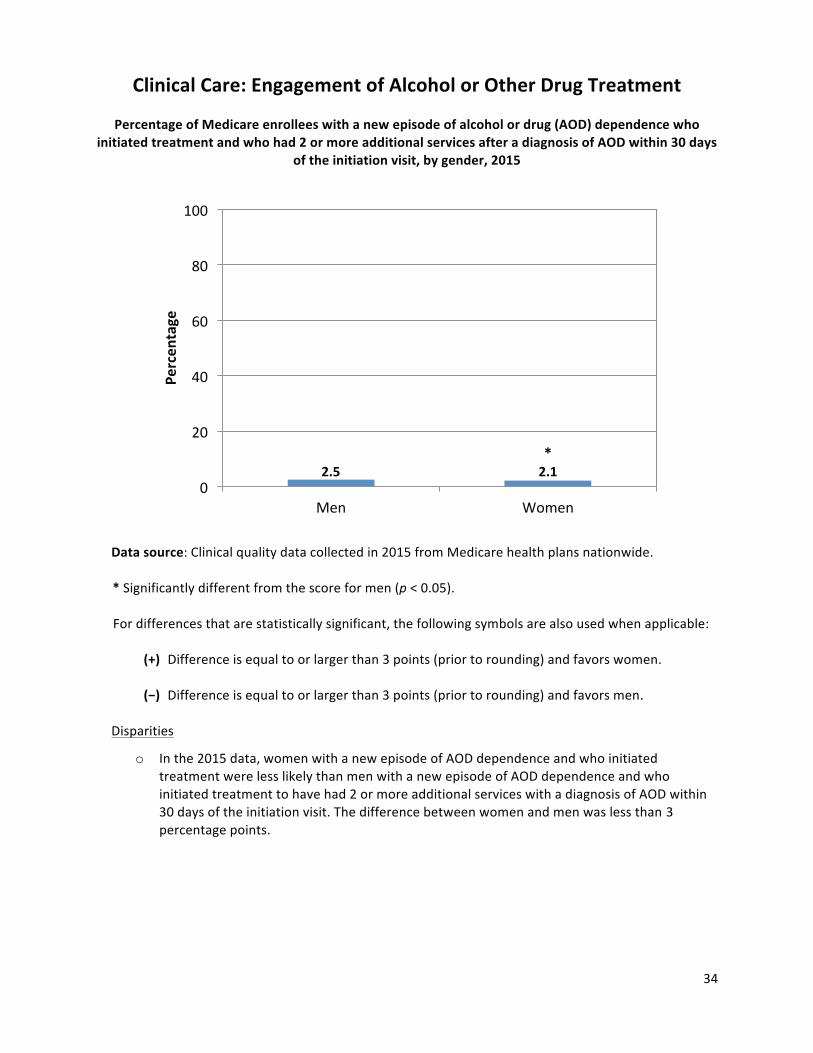
Clinical Care: Engagement of Alcohol or Other Drug Treatment
Percentage of Medicare enrollees with a new episode of alcohol or drug (AOD) dependence who initiated treatment and who had 2 or more additional services after a diagnosis of AOD within 30 days
of the initiation visit, by gender,2015 Pe
rcen
tage
100
80
60
40
20
0Men Women
Data source:Clinical quality data collected in 2015 from Medicare health plans nationwide.
* Significantly different from the score for men (p < 0.05).
For differences that are statistically significant, the following symbols are also used when applicable:
(+) Difference is equal to or larger than 3 points (prior to rounding) and favors women.
(−) Difference is equal to or larger than 3 points (prior to rounding) and favors men.
Disparities
2.5 2.1*
o In the 2015 data, women with a new episode of AOD dependence and who initiatedtreatment were less likely than men with a new episode of AOD dependence and whoinitiated treatment to have had 2 or more additional services with a diagnosis of AOD within30 days of the initiation visit. The difference between women and men was less than 3percentage points.
34
35
Suggested Citation:CMS Office of Minority Health and RAND Corporation. Gender Disparities in Health Care in Medicare Advantage. Baltimore, MD. 2017.
Copyright Information:This communication was produced, published, and disseminated at U.S. taxpayer expense. All materialappearing in this report is in the public domain and may be reproduced or copied without permission;citation as to source, however, is appreciated.