international comparisons of litigation costs · 5 international comparisons of litigation costs...
TRANSCRIPT
International Comparisons of Litigation CostsCanada, Europe, Japan,
and the United States
JUNE 2013 UPDATE

© U.S. Chamber Institute for Legal Reform, June 2013. All rights reserved.
This publication, or part thereof, may not be reproduced in any form without the written permission of the U.S. Chamber Institute for Legal Reform. Forward requests for permission to reprint to: Reprint Permission Office, U.S. Chamber Institute for Legal Reform, 1615 H Street, N.W., Washington, D.C. 20062-2000 (202.463.5724).
Prepared for the U.S. Chamber Institute for Legal Reform by
David L. McKnight and Paul J. Hinton, NERA Economic Consulting1
Table of ContentsIntroduction 1
Analysis 3
Businesses’ general liability insurance costs provide a basis for comparing liability costs among countries 3
Higher liability costs estimated in this study reflect more frequent claiming and/or higher claim costs 4
Features of countries’ legal systems explain most of the variation in liability costs 5
Conclusion 6
Appendix i
Econometric analysis of companies’ general liability insurance costs i
Analysis of the correlation between measures of the legal environment and liability costs iv
End Notes vi
Addendum viii
How Japanese Liability Costs Compare to those in the US, Canada and Europe viii
. . . . . . . . . . . . . . . . . . . . . . . . . . . . . . . . . . . . . . . . . . . . . . . . . . . . . . . . . . . . . . . . . . . . . . . . . . . . . . . . . . . . . . . . . . . . . . . . . . . . . . . . . . . . . . . . . . . . . . . . . . . . . . . . . . . . . . . . . . . . . . . . . . . . . . . . . . . . . . . . . . . . . . . . . . . . . . . . . . . . . . . . . . . . . .
. . . . . . . . . . . . . . . . . . . . . . . . . . . . . . . . . . . . . . . . . . . . . . . . . . . . . . . . . . . . . . . . . . . . . . . . . . . . . . . . . . . . . . . . . . . . . . . . . . . . . . . . . . . . . . . . . . . . . . . . . . . . . . . . . . . . . . . . . . . . . . . . . . . . . . . . . . . . . . . . . . . . . . . . . . . . . . . . . . . . . . . . . . . . . . . . . . . . . . . . .
. . . . . . . . . . . . . . . . . . . . . . . . . . . . . . . . . . . . . . . . . . . . . . . . . . . . . . . . . . . . . . . . . . . . . . . . . . . . . . . . . . . . . . . . . . . . . . . . . . . . . . . . . . . . . . . . . . . . . . . . . . . . . . . . . . . . . . . . . . . . . . . . . . . . . . . . . . . . . . . . . . . . . . . . . . . . . . . . . . . . . . . . . . . . . . . . . .
. . . . . . . . . . . . . . . . . . . . . . . . . . . . . . . . . . . . . . . . . . . . . .
. . . . . . . . . . . . . . . . . . . . . . . . . . . . . . . . . . . . . . . . . . . . . . . . . . . . . . . . . . . . . . . . . . . . . . . . . . . . . . . . . . . . . . . . . . . . . . . . . . . . . . . . . . . . . . . . . . . . . . . . . . . . . . . . . . . .
. . . . . . . . . . . . . . . . . . . . . . . . . . . . . . . . . . . . . . . . . . . . . . . . . . . . . . . . . . . . . . . . . . . . . . . . . . . . . . . . . . . . . . . . . . . . . . . . . . . . . . . . . . . . . . . . . . . . . . . . . . . . . . . . . . . . . . . . . . . . . . . . . . . . . . . . . . . . . . . . . . . . . . . . . . . . . . . . . . . . . . . . . . . . . . . . . . .
. . . . . . . . . . . . . . . . . . . . . . . . . . . . . . . . . . . . . . . . . . . . . . . . . . . . . . . . . . . . . . . . . . . . . . . . . . . . . . . . . . . . . . . . . . . . . . . . . . . . . . . . . . . . . . . . . . . . . . . . . . . . . . . . . . . . . . . . . . . . . . . . .
. . . . . . . . . . . . . . . . . . . . . . . . . . . . . . . . . . . . . . . . . . . . . . . . . . . . . . . . . . . . . . . . . . . . . . . . . . . . . . . . . . . . . . . . . . . . . . . . . . . . . . . . . . . . . . . . . . . . . . . . . . . . . . . . . . . . . . . . . . . . . . . . . . . . . . . . . . . . . . . . . . . . . . . . . . . . . . . . . . . . . . . . . . . . . . .
. . . . . . . . . . . . . . . . . . . . . . . . . . . . . . . . . . . . . . . . . . . . . . . . . . . . . . . . . . . . . . . . . . . . . . . . . . . . . . . . . . . . . . . . . . . . . . . . . . . . . . . . . . . . . . . . . . . . . . . . . . . . . . . . . . . . . . . . . . . . . . . . . . . . . . . . . . . . . . . . . . . . . . . . . . . . . . . . . . . . . . . . . . . . . . . . . . . . . .
. . . . . . . . . . . . . . . . . . . . . . . . . . . . . . . . . . . . . . . . . . . . . . . . . . . . . . . . . . . . . . . . . . . . . . . . . . . . . . . . . . . . . . . . . . . . . . . . . . . . . . . . .
. . . . . . . . . . . . . . . . . . . . . . . . . . . . . . . . . . . . . . . . . . . . . . . . . . . . . . . . . . . . . . . . . . . . . . . . . . . . . . . . . . . . . . . . . . . . . . . . . . . . . . . . . . . . . . . . . . . . . . . . .
. . . . . . . . . . . . . . . . . . . . . . . . . . . . . . . . . . . . . . . . . . . . . . . . . . . . . . . . . . . . . . . . . . . . . . . . . . . . . . . . . . . . . . . . . . . . . . . . . . . . . . . . . . . . . . . . . . . . . . . . . . . . . . . . .
1 International Comparisons of Litigation Costs
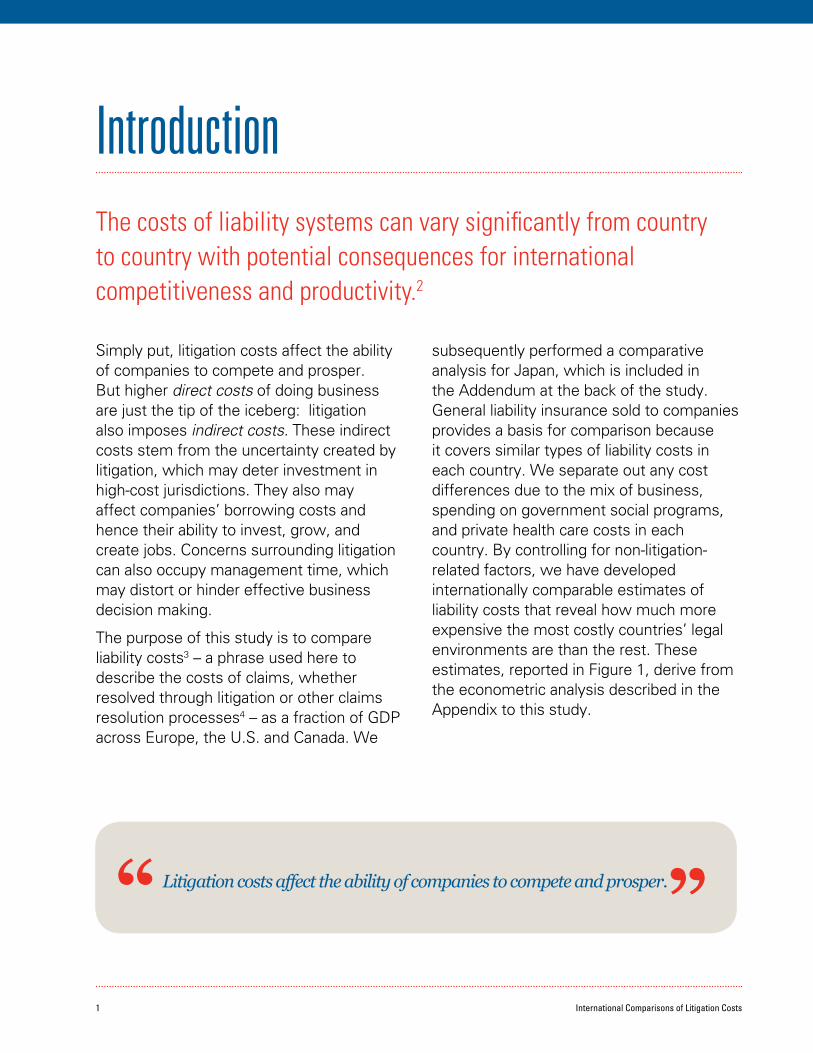
IntroductionThe costs of liability systems can vary significantly from country to country with potential consequences for international competitiveness and productivity.2
Simply put, litigation costs affect the ability of companies to compete and prosper. But higher direct costs of doing business are just the tip of the iceberg: litigation also imposes indirect costs. These indirect costs stem from the uncertainty created by litigation, which may deter investment in high-cost jurisdictions. They also may affect companies’ borrowing costs and hence their ability to invest, grow, and create jobs. Concerns surrounding litigation can also occupy management time, which may distort or hinder effective business decision making.
The purpose of this study is to compare liability costs3 – a phrase used here to describe the costs of claims, whether resolved through litigation or other claims resolution processes4 – as a fraction of GDP across Europe, the U.S. and Canada. We
subsequently performed a comparative analysis for Japan, which is included in the Addendum at the back of the study. General liability insurance sold to companies provides a basis for comparison because it covers similar types of liability costs in each country. We separate out any cost differences due to the mix of business, spending on government social programs, and private health care costs in each country. By controlling for non-litigation-related factors, we have developed internationally comparable estimates of liability costs that reveal how much more expensive the most costly countries’ legal environments are than the rest. These estimates, reported in Figure 1, derive from the econometric analysis described in the Appendix to this study.
“ Litigation costs affect the ability of companies to compete and prosper.”
2U.S. Chamber Institute for Legal Reform
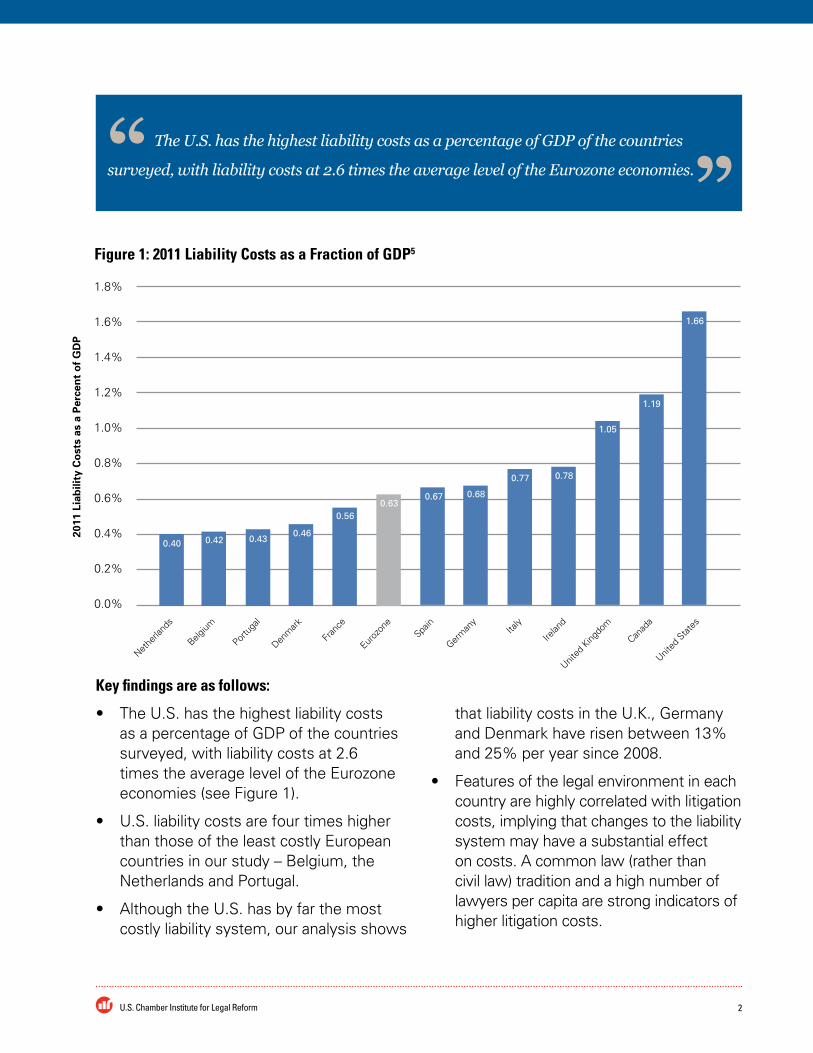
Key findings are as follows:
• The U.S. has the highest liability costs as a percentage of GDP of the countries surveyed, with liability costs at 2.6 times the average level of the Eurozone economies (see Figure 1).
• U.S. liability costs are four times higher than those of the least costly European countries in our study – Belgium, the Netherlands and Portugal.
• Although the U.S. has by far the most costly liability system, our analysis shows
that liability costs in the U.K., Germany and Denmark have risen between 13% and 25% per year since 2008.
• Features of the legal environment in each country are highly correlated with litigation costs, implying that changes to the liability system may have a substantial effect on costs. A common law (rather than civil law) tradition and a high number of lawyers per capita are strong indicators of higher litigation costs.
“ The U.S. has the highest liability costs as a percentage of GDP of the countries
surveyed, with liability costs at 2.6 times the average level of the Eurozone economies.”
Nethe
rland
s
Belgium
Portu
gal
Denm
ark
Fran
ce
Euroz
one
Spain
Germ
any
Italy
Irelan
d
United
King
dom
Canad
a
United
Stat
es
Figure 1: 2011 Liability Costs as a Fraction of GDP5
0.40 0.42 0.430.46
0.560.63
0.67 0.68
0.77 0.78
1.05
1.19
1.66
1.8%
1.6%
1.4%
1.2%
1.0%
0.8%
0.6%
0.4%
0.2%
0.0%
2011
Lia
bili
ty C
ost
s as
a P
erce
nt
of
GD
P
3 International Comparisons of Litigation Costs
AnalysisBusinesses’ general liability insurance costs provide a basis for comparing liability costs among countriesLiability insurance data have been used in prior international studies of liability costs and the effects of tort reform.6 This study builds on prior research that relied upon aggregate insurance premium and loss data by using individual companies’ purchases of general liability insurance policies to estimate liability costs. These data allow us to measure average country-level differences by comparing costs of companies with similar risk exposure and size in each country.
Insurance costs are a meaningful basis of analysis because a large fraction of liability costs are covered by insurance, and
coverage is sufficiently similar in Europe, the U.S. and Canada. Specifically, in this study, we use general liability insurance costs to represent overall differences in liability costs, whether those costs are covered by general liability insurance, are covered by a separate specialty line of insurance (e.g., director and officers insurance or automobile insurance), or are not covered at all. The broad scope of coverage of general liability insurance and the similarity of the coverage provided from country to country make it a useful benchmark for liability costs generally.
We use data on all general liability insurance policies placed by Marsh, Inc., a major broker of commercial insurance, in Europe, the U.S., and Canada from 2008 through 2011. These data include the actual costs to companies of liability insurance policies they bought in particular countries in each year.7 We include European countries in which Marsh brokered more than 100 policies in each year.8 These countries constitute more than 83% of Eurozone GDP.
The cost of general liability insurance depends upon the amount of coverage purchased and the risk exposure of the particular insured across all of its countries of operation. We infer which countries the general liability insurance covers by observing the countries in which each company also buys property insurance. Property insurance typically covers risks located in a single country where the policy is purchased; thus, the cost of property insurance purchased provides a proxy for general liability exposure.9 Company size
4U.S. Chamber Institute for Legal Reform
and industry may also affect liability risks. We develop an econometric analysis that accounts for these factors and reveals the difference in the cost of purchasing a comparable general liability insurance policy for a company with similar exposure in each country. We estimate a common insurance business cycle effect on insurance costs in addition to country-specific time trends.
Higher liability costs estimated in this study reflect more frequent claiming and/or higher claim costsIn this analysis, we consider the following legal, regulatory, economic and policy differences that could potentially reduce liability costs if a country were to:
• compensate fewer legitimate claimants or compensate them less;
• limit the scope of legal liability (i.e., more third-party assumption of risk);
• impose civil liability and penalties that are more effective in deterring liability events;
• impose more regulation that reduces the frequency of liability events;
• offer more generous social programs and coverage of health care expenses, thus lowering uncompensated costs; or
• discourage weak or unfounded claims, control unusually high compensation (and noncompensatory awards) and/or have lower legal costs.
The countries used as the basis for liability cost comparisons in this study are generally similar in the scope of civil redress they provide for harm caused by third parties.
For example, an individual injured in a traffic accident can expect similar vehicle damage and injury costs to be paid by an insurer or government program, or recovered from a responsible third party in each of the countries studied, whether through a claims process or dispute resolution. Differences in liability costs between countries that provide comparable civil redress are not, by definition, due to shortfalls in the legitimate benefits of liability protection.10
More effective deterrence could result in lower liability costs and would be expected to reflect a lower incidence of liability events. Analysis of deterrence effects is outside the scope of this study, though we note that punitive damages awards are employed for deterrent effect in the U.S., but not generally in Europe, where liability costs are lower. We are not aware of strong evidence of more effective deterrence in Europe that would explain lower liability costs.
Countries that have more comprehensive and effective regulations may reduce the occurrence of harmful liability events that result in claims for compensation, such as traffic accidents, financial fraud,11 or injuries caused by defective products, thereby liability costs are lower. But, based on survey evidence, the U.S. does not have a consistently lower regulatory burden than other Organisation for Economic Cooperation and Development (OECD) countries.12 There is little evidence to support the hypothesis that liability costs in the U.S. are higher because of less effective regulation.
Government social programs, such as those providing disability benefits or covering healthcare expenses, cover some of the costs that could otherwise be compensated through the liability system. Government
5 International Comparisons of Litigation Costs
spending on such programs is lower in the U.S. than in many other countries, and estimates of liability costs should reflect these differences. We adjust our estimates of liability costs in each country for this effect. We use the results from a study by Kerr, Ma and Schmit13 to determine how much higher liability costs would be in European countries if their social programs were similar in size and scope to those in the U.S. All of the comparison countries have higher adjusted liability costs, except for Canada, which has an equivalent level of social spending to that of the U.S. If European countries matched U.S. social spending, European liability costs on average would have been 33 percent higher in 2011. Therefore, government spending on social programs cannot explain the 160 percent higher cost of liability insurance in the U.S. Differences in healthcare costs outside of government programs are accounted for by including a measure of private health insurance in the econometric analysis (described further in the Appendix).
Differences between countries’ legal systems may result in more frequent, weaker or unfounded claims, unusually high compensation or higher legal costs. Having selected countries with similar scopes of civil redress, similar regulatory protections and deterrence, and adjusted liability cost estimates for differences in government benefits, the cost differences we measure are most likely explained by more frequent claims or higher claim costs, or both.
Features of countries’ legal systems explain most of the variation in liability costsWe test the proposition that features of each country’s legal system may affect the frequency and costliness of claims by measuring how much liability costs vary across countries with different legal systems. We develop two objective measures of the legal system: the number of lawyers per capita14 and whether countries have a civil or common law tradition.15 Regression analysis (reported in the Appendix) reveals that these measures of the legal environment explain most of the variation in liability costs across the countries in our study, and each of these measures of the legal environment is statistically significant. Moreover, these estimates may understate the influence of features of the legal environment because it is unlikely that this study fully measures all the relevant features of the legal systems in each comparison country.16
This analysis establishes that there is a measurable relationship between choices that countries make about the features of their legal environment and the liability costs borne by participants in the economy.17
6U.S. Chamber Institute for Legal Reform
ConclusionThis study develops internationally comparable measures of liability costs for major European countries, the U.S. and Canada that account for differences between their levels of spending on government benefits and health care costs. The differences in costs are largely explained by features of the legal environment in each country that may affect the frequency and cost of claims. The countries included in the study provide similar levels of legal protection, regulation and deterrence against wrongdoing. Consequently, we conclude that countries with relatively higher costs have more frequent or more costly claims or both. The U.S. has the highest estimated liability costs in proportion to GDP, and the U.K. is the most costly European country. Absent any offsetting benefit from differences in legal protections, higher liability costs in these countries reduce their international competitiveness.
“ There is a measurable
relationship between
choices that countries
make about the features of
their legal environment
and the liability costs
borne by participants
in the economy.”
i International Comparisons of Litigation Costs
AppendixOur empirical analysis of international liability costs involves the following steps:
1. Use data on each company’s domestic property insurance in each country to identify the geographic footprint of its general liability insurance coverage outside the country in which each policy was written.
2. Account for any effect of company characteristics on insurance costs by including size and industry variables in an econometric model.
3. Adjust the estimates of relative liability insurance costs by country for differences in government spending on social programs using previously published estimates.18
4. Use a second econometric model to determine the extent to which measures of the legal environment explain adjusted relative costs in each country.
Econometric analysis of companies’ general liability insurance costsWe have data on more than 35,000 sepa-rate insurance transactions that individual companies made from 2008 to 2011 in the comparison countries. Information about each insurance transaction is used to explain the variation in costs of policies purchased in different countries over time. The factors used to explain the variation in costs are the amount of property insurance placed in the same country by the purchaser, the global revenues of the purchaser, the global num-ber of employees of the purchaser, the in-dustry of the purchaser, the policy year, and the country in which the policy was placed. We also control for country-level trends in the cost of general liability insurance to ex-amine whether there have been any changes in the cost of liability insurance over time.
iiU.S. Chamber Institute for Legal Reform
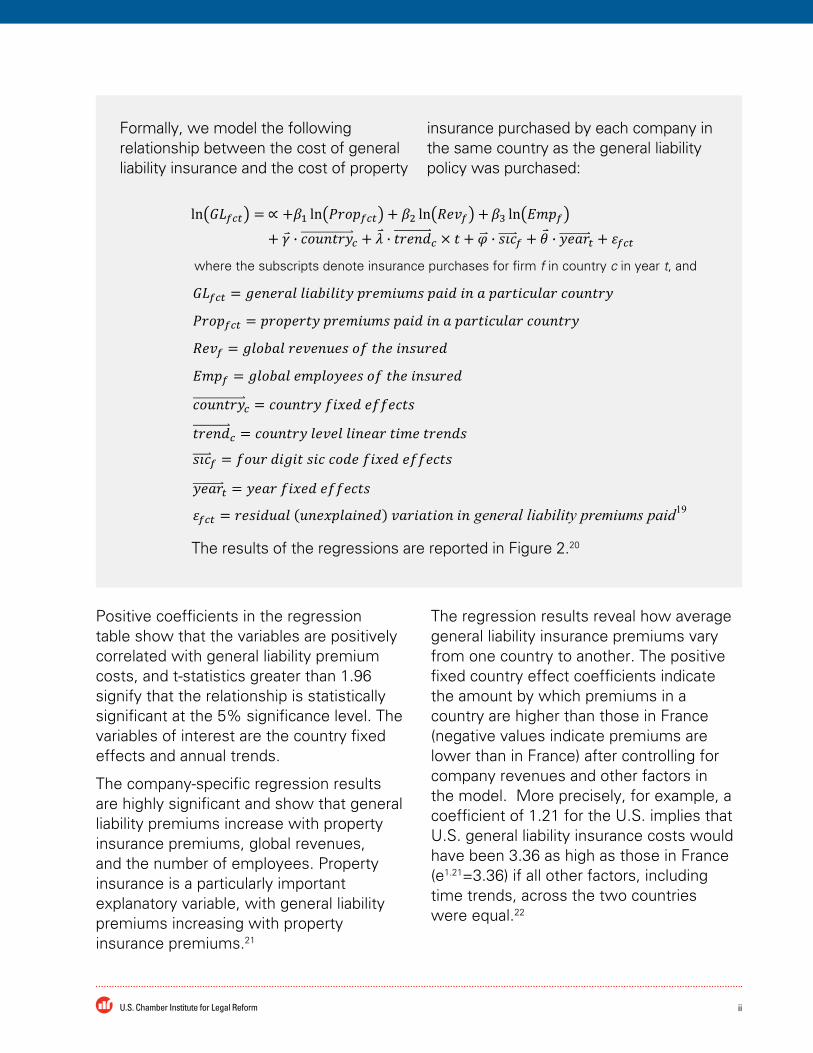
Formally, we model the following relationship between the cost of general liability insurance and the cost of property
insurance purchased by each company in the same country as the general liability policy was purchased:
where the subscripts denote insurance purchases for firm f in country c in year t, and
The results of the regressions are reported in Figure 2.20
Positive coefficients in the regression table show that the variables are positively correlated with general liability premium costs, and t-statistics greater than 1.96 signify that the relationship is statistically significant at the 5% significance level. The variables of interest are the country fixed effects and annual trends.
The company-specific regression results are highly significant and show that general liability premiums increase with property insurance premiums, global revenues, and the number of employees. Property insurance is a particularly important explanatory variable, with general liability premiums increasing with property insurance premiums.21
The regression results reveal how average general liability insurance premiums vary from one country to another. The positive fixed country effect coefficients indicate the amount by which premiums in a country are higher than those in France (negative values indicate premiums are lower than in France) after controlling for company revenues and other factors in the model. More precisely, for example, a coefficient of 1.21 for the U.S. implies that U.S. general liability insurance costs would have been 3.36 as high as those in France (e1.21=3.36) if all other factors, including time trends, across the two countries were equal.22
iii International Comparisons of Litigation Costs
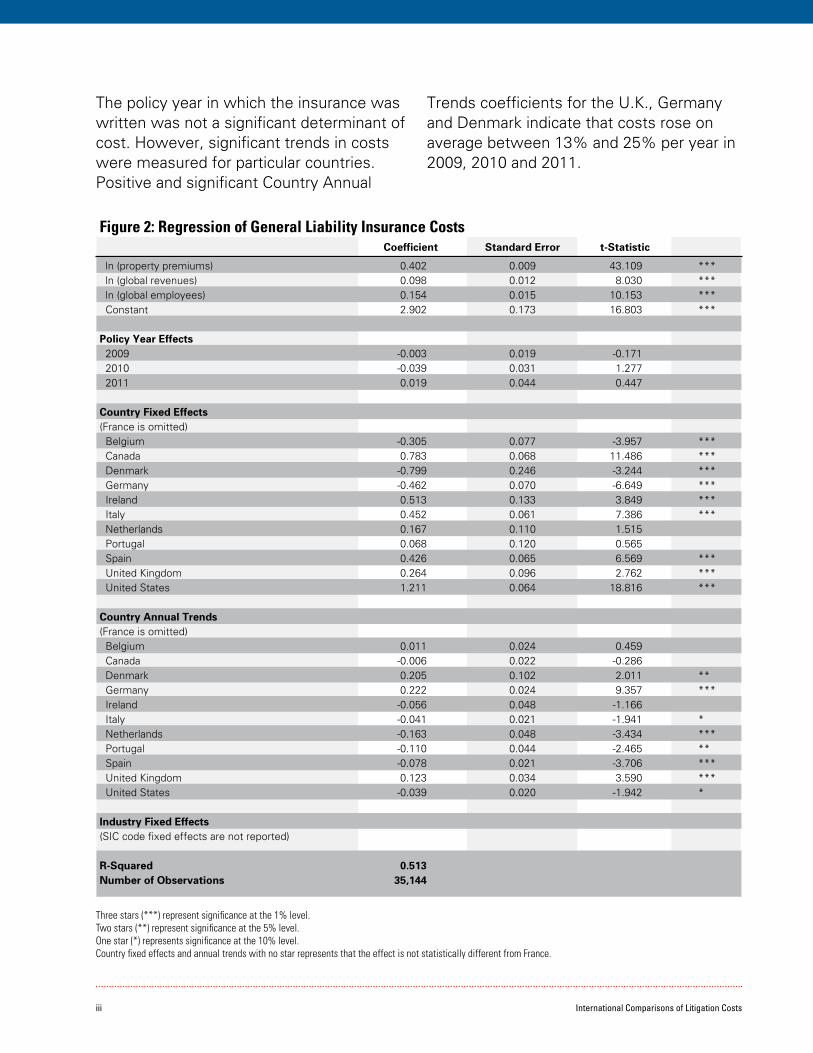
Three stars (***) represent significance at the 1% level. Two stars (**) represent significance at the 5% level. One star (*) represents significance at the 10% level. Country fixed effects and annual trends with no star represents that the effect is not statistically different from France.
The policy year in which the insurance was written was not a significant determinant of cost. However, significant trends in costs were measured for particular countries. Positive and significant Country Annual
Trends coefficients for the U.K., Germany and Denmark indicate that costs rose on average between 13% and 25% per year in 2009, 2010 and 2011.
Figure 2: Regression of General Liability Insurance Costs Coefficient Standard Error t-Statistic
ln (property premiums) 0.402 0.009 43.109 *** ln (global revenues) 0.098 0.012 8.030 *** ln (global employees) 0.154 0.015 10.153 *** Constant 2.902 0.173 16.803 ***
Policy Year Effects 2009 -0.003 0.019 -0.171 2010 -0.039 0.031 1.277 2011 0.019 0.044 0.447
Country Fixed Effects(France is omitted) Belgium -0.305 0.077 -3.957 *** Canada 0.783 0.068 11.486 *** Denmark -0.799 0.246 -3.244 *** Germany -0.462 0.070 -6.649 *** Ireland 0.513 0.133 3.849 *** Italy 0.452 0.061 7.386 *** Netherlands 0.167 0.110 1.515 Portugal 0.068 0.120 0.565 Spain 0.426 0.065 6.569 *** United Kingdom 0.264 0.096 2.762 *** United States 1.211 0.064 18.816 ***
Country Annual Trends(France is omitted) Belgium 0.011 0.024 0.459 Canada -0.006 0.022 -0.286 Denmark 0.205 0.102 2.011 ** Germany 0.222 0.024 9.357 *** Ireland -0.056 0.048 -1.166 Italy -0.041 0.021 -1.941 * Netherlands -0.163 0.048 -3.434 *** Portugal -0.110 0.044 -2.465 ** Spain -0.078 0.021 -3.706 *** United Kingdom 0.123 0.034 3.590 *** United States -0.039 0.020 -1.942 *
Industry Fixed Effects(SIC code fixed effects are not reported)
R-Squared 0.513Number of Observations 35,144
ivU.S. Chamber Institute for Legal Reform
Analysis of the correlation between measures of the legal environment and liability costsIn their study of liability insurance premiums, Kerr, Ma and Schmit23 estimate the effect of government health care and social program spending on liability costs across 24 countries over a 12-year period. They
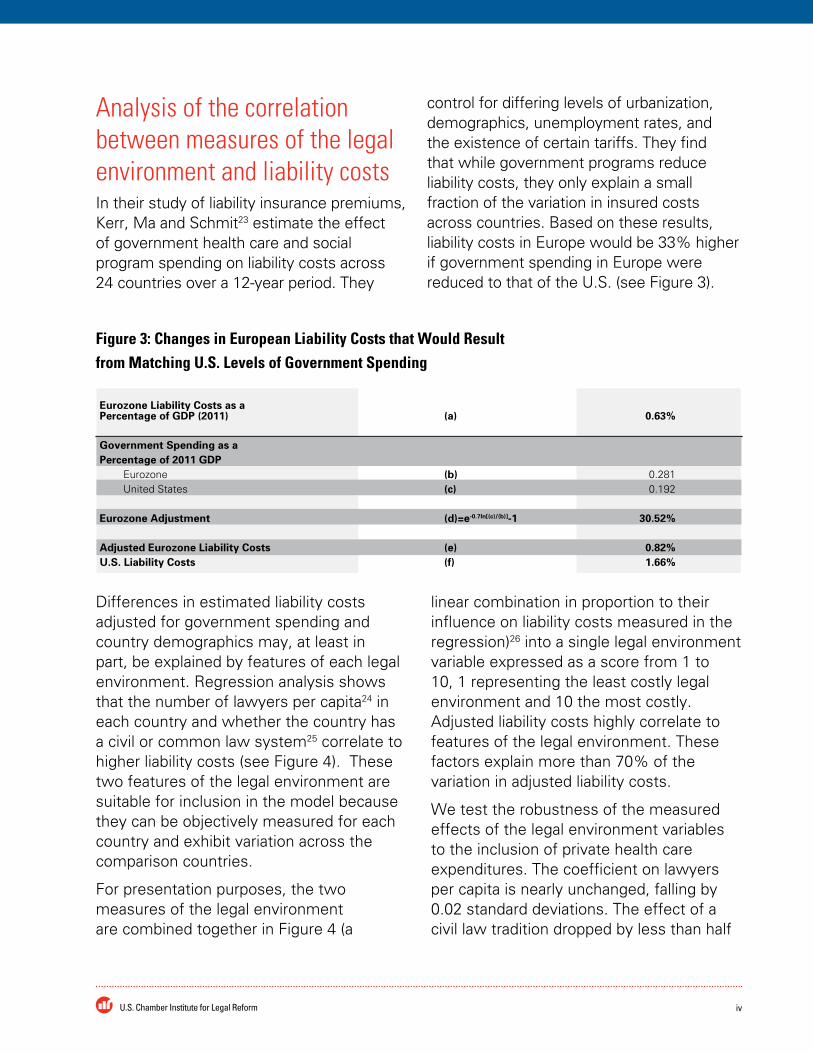
control for differing levels of urbanization, demographics, unemployment rates, and the existence of certain tariffs. They find that while government programs reduce liability costs, they only explain a small fraction of the variation in insured costs across countries. Based on these results, liability costs in Europe would be 33% higher if government spending in Europe were reduced to that of the U.S. (see Figure 3).
Figure 3: Changes in European Liability Costs that Would Result from Matching U.S. Levels of Government Spending
Eurozone Liability Costs as a Percentage of GDP (2011) (a) 0.63%
Government Spending as aPercentage of 2011 GDP Eurozone (b) 0.281 United States (c) 0.192
Eurozone Adjustment (d)=e-0.7ln[(c)/(b)]-1 30.52%
Adjusted Eurozone Liability Costs (e) 0.82%U.S. Liability Costs (f) 1.66%
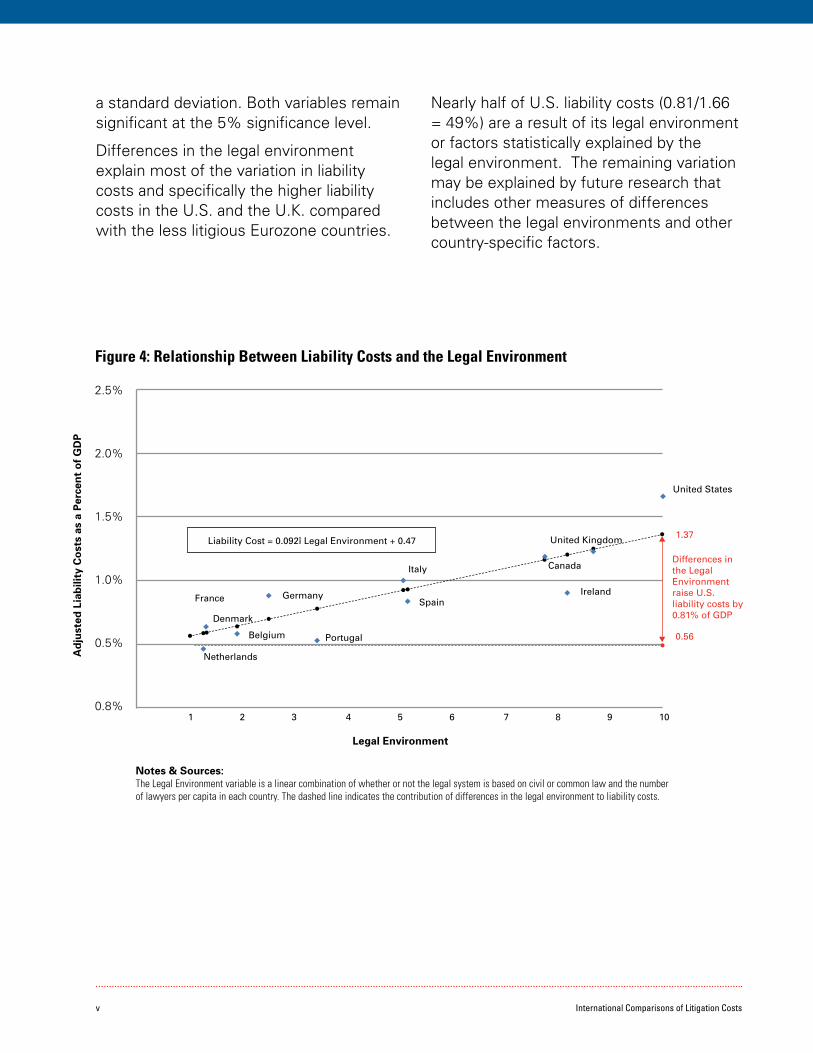
Differences in estimated liability costs adjusted for government spending and country demographics may, at least in part, be explained by features of each legal environment. Regression analysis shows that the number of lawyers per capita24 in each country and whether the country has a civil or common law system25 correlate to higher liability costs (see Figure 4). These two features of the legal environment are suitable for inclusion in the model because they can be objectively measured for each country and exhibit variation across the comparison countries.
For presentation purposes, the two measures of the legal environment are combined together in Figure 4 (a
linear combination in proportion to their influence on liability costs measured in the regression)26 into a single legal environment variable expressed as a score from 1 to 10, 1 representing the least costly legal environment and 10 the most costly. Adjusted liability costs highly correlate to features of the legal environment. These factors explain more than 70% of the variation in adjusted liability costs.
We test the robustness of the measured effects of the legal environment variables to the inclusion of private health care expenditures. The coefficient on lawyers per capita is nearly unchanged, falling by 0.02 standard deviations. The effect of a civil law tradition dropped by less than half
v International Comparisons of Litigation Costs
a standard deviation. Both variables remain significant at the 5% significance level.
Differences in the legal environment explain most of the variation in liability costs and specifically the higher liability costs in the U.S. and the U.K. compared with the less litigious Eurozone countries.
Nearly half of U.S. liability costs (0.81/1.66 = 49%) are a result of its legal environment or factors statistically explained by the legal environment. The remaining variation may be explained by future research that includes other measures of differences between the legal environments and other country-specific factors.
Figure 4: Relationship Between Liability Costs and the Legal Environment
2.5%
2.0%
1.5%
1.0%
0.5%
0.8%
Ad
just
ed L
iab
ility
Co
sts
as a
Per
cen
t o
f G
DP
Legal Environment
France
Denmark
Netherlands
Belgium
Germany
Portugal
Italy
Spain
United KingdomLiability Cost = 0.092î Legal Environment + 0.47
1 2 3 4 5 6 7 8 9 10
Canada
Ireland
United States
1.37
0.56
Differences in the Legal Environment raise U.S. liability costs by 0.81% of GDP
Notes & Sources: The Legal Environment variable is a linear combination of whether or not the legal system is based on civil or common law and the number of lawyers per capita in each country. The dashed line indicates the contribution of differences in the legal environment to liability costs.
viU.S. Chamber Institute for Legal Reform
End Notes1 David McKnight is a consultant and Paul Hinton is a vice president at NERA Economic Consulting. This paper was
developed for the U.S. Chamber Institute for Legal Reform (ILR). We would like to acknowledge the contributions of those who commented on earlier drafts, in particular Oriana Senatore, Vice President, Policy and Research, ILR, Mary Terzino and our NERA colleague David Tabak. Neil Malani and Uday Singh provided research assistance.
2 See, e.g., Thomas J. Campbell, Daniel P. Kessler & George B. Shepherd, The Causes and Effects of Liability Reform: Some Empirical Evidence, (Nat’l Bureau of Econ. Research, Working Paper No. 4989, 1995).
3 The direct costs of litigated claims represent only a fraction of all liability costs, but litigation risk influences the cost of resolving claims even if they are resolved without recourse to litigation.
4 Non-litigation claims resolutions could include, for example, resolutions resulting from arbitrations; the use of alternative dispute resolution mechanisms to resolve claims; or payments resulting from pre-litigation negotiated settlements.
5 This figure reports the results of the econometric analysis described in the Appendix. The econometric analysis produces estimates of relative costs. We express the relative costs in each country in relation to the U.S. 2011 tort cost estimate published by Towers Watson. Towers Watson, “U.S. Tort Cost Trends, 2011 Update.”
6 See, e.g., Mark J. Browne & Joan T. Schmit, Litigation Patterns in Automobile Bodily Injury Claims 1977-1997: Effects of Time and Tort Reforms, 75 J. Risk & ins., 83 (2008). We presented a review of the literature on the economic consequences of tort liability in our 2011 report on the legal environment. Paul J. Hinton & DaviD l. McknigHt, cReating conDitions foR econoMic gRowtH: tHe Role of tHe legal enviRonMent (NERA Economic Consulting 2011).
7 Marsh data includes premiums for the following liability insurance policies: General Liability, Liquor Law Liability, Nuclear Energy Liability, Owners/Contractors Protective, Railroad Protective Liability, Wrap Up/Construction, Products Recall or Warranty, and Clinical Trials Liability.
8 We have included all countries in which Marsh placed insurance programs for at least 100 companies, with both general liability and property coverage, in each year from 2009 through 2011. We further required the 100 companies to have data available on global revenue and employment from Dunn & Bradstreet.
9 Information about the limits of coverage and the insured risks for each policy were not available. Companies’ estimated business revenues and employment statistics were available but were not reported by country.
10 Even though the amount of compensation paid is a component of liability costs compared in this study, differences in liability costs are not explained by shortfalls in legitimate benefits.
11 Where authorities such as the U.S. Securities & Exchange Commission and U.K. Financial Services Authority use civil penalties and litigation in regulatory enforcement, regulation may contribute directly to liability costs, rather than reduce the incidence of liability events. Furthermore, regulatory enforcement, such as fines imposed for violations of financial market regulations may precipitate follow-on civil litigation, increasing costs further. Given the use of civil penalties for enforcement of these regulations in the U.S., relatively more burdensome regulation in this area, and, more importantly, more active enforcement, may actually increase liability costs, not reduce them. We do not explicitly account for this difference in our analysis.
12 In four different surveys, respondents were asked to identify OECD countries with more or less burdensome regulations than those in the U.S. In two of the surveys, the number of countries with more burdensome regulations exceeds the number with less burdensome regulations; in the other two surveys, the converse is the case. It is not possible to conclude from these surveys collectively that the U.S. has a less burdensome regulatory system than that of other OECD countries. Given the inconsistency in these survey findings, it is unlikely that the burden of regulation could explain why U.S. general liability insurance costs are 250% of the European average. steven globeRMan & geoRge geoRgoPoulos, Regulation anD tHe inteRnational coMPetitiveness of tHe u.s. econoMy (Mercatus Center at George Mason University 2012).
vii International Comparisons of Litigation Costs
13 Dana A. Kerr, Yu-Luen Ma & Joan T. Schmit, A Cross-National Study of Government Social Insurance as an Alternative to Tort Liability Compensation, 76 J. Risk & ins., 367 (2009).
14 The numbers of lawyers per capita in European countries are from the Council of Bars and Law Societies of Europe. council of baRs anD law societies of euRoPe, nuMbeR of lawyeRs in euRoPean countRies (2012). The number of lawyers per capita in Canada is from Statistics Canada, 2006 Census of Population. statistics canaDa, occuPation – national occuPational classification foR statistics (2006). The number of lawyers per capita in the United States is from the American Bar Association. aMeRican baR association, lawyeR DeMogRaPHics (2011).
15 Data for the prevailing legal systems are from the CIA World Factbook.
16 Conversely it is also possible that an important omitted variable from our econometric analysis could cause this estimate to be overstated. However, we have attempted to include the most important variables in our analysis to avoid this possibility.
17 It is possible that some features of each country’s business or regulatory environment explain both the variation in the legal environment and contributes to higher commercial liability insurance costs, throwing into doubt a causal connection between the features of the legal system and liability costs. We test this possibility using an independent measure of each country’s business and regulatory environment: the average cost of starting a business as a percentage of income per capita. To the extent that this is a good measure of relevant business and regulatory conditions, and such conditions are actually responsible for our findings, the inclusion of business startup costs in the regression would affect the results. Instead, we find that including this measure of the business and regulatory conditions does not affect the significance of the legal environment variables. woRlD bank, Doing business 2013: sMaRteR Regulations foR sMall anD MeDiuM-size enteRPRises (10 ed., World Bank Group 2013).
18 keRR, Ma & scHMit, supra note 13.
19 We estimate the model with robust standard errors with clustering by SIC code.
20 As a sensitivity test, we also include interaction terms for 2 digit SIC codes and the natural logarithm of property insurance premiums. This alternate specification allows for the possibility that the relationship between property insurance premiums and general liability premiums may differ by industry. We find that the effect of country on general liability insurance premium costs is similar in both specifications.
21 General liability premiums increase less than proportionally at a rate approximately equal to 40% of the rate of increase in property insurance premiums.
22 For technical reasons, one (baseline) country must be omitted from the regression and the other country’s fixed effects are reported relative to the omitted country. The choice of omitted country, in this instance France, is arbitrary and has no effect on the predictions.
23 Kerr, Ma & Schmit, supra note 13.
24 Supra note 14.
25 Supra note 15.
26 The number of lawyers per capita has a coefficient of 0.12 and a t-statistic of 2.10 and is significant at the 90% significance level. Whether the law system is based on civil or common law has a coefficient of -0.43 and a t-statistic of -3.18 and is significant at the 5% significance level.
viiiU.S. Chamber Institute for Legal Reform
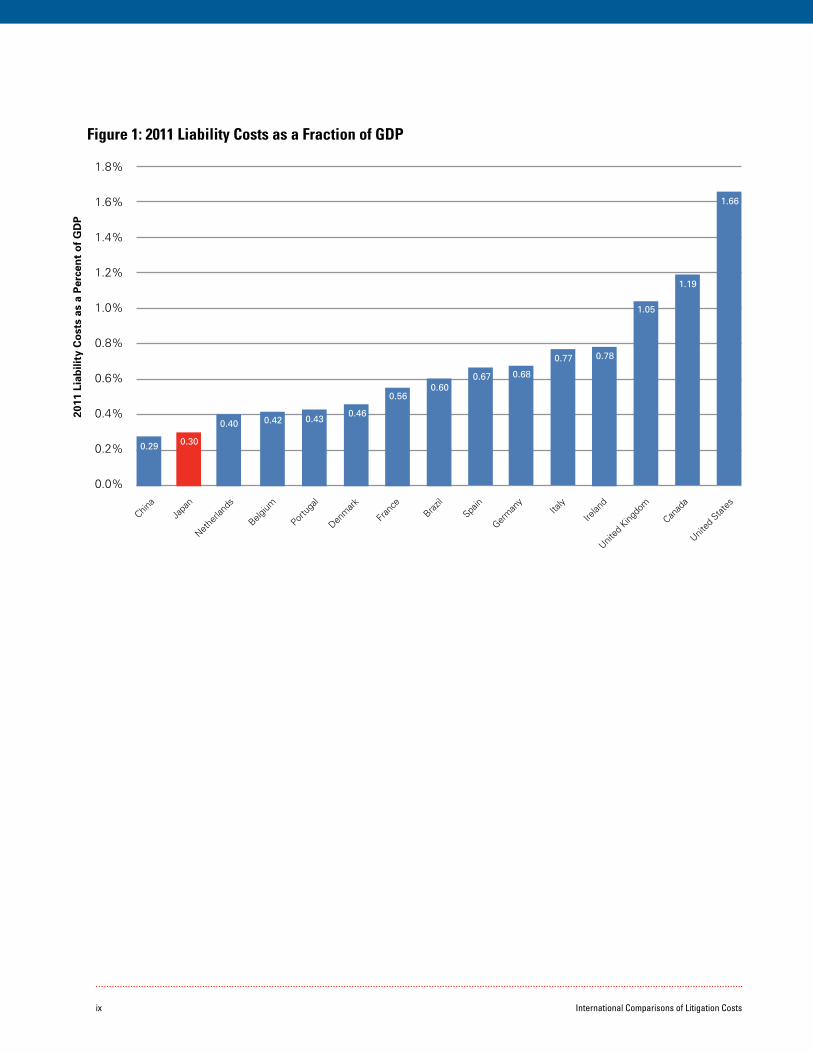
AddendumHow Japanese Liability Costs Compare to those in the US, Canada and EuropeThe cost of liability insurance has been wide-ly used as a benchmark for liability costs, and litigation costs in particular, to track costs over time, to compare costs between jurisdictions, and to study the factors that affect these costs.26 In a recent study for the US Chamber Institute for Legal Reform,26 we develop estimates of relative liability costs in the US, Canada and Europe using data on the cost of individual general liability insur-ance policies in each country. We expand this analysis below to include an estimate for Japan.
We define “liability costs” as the costs of civil claims for redress resulting from harm caused by another person or entity that is liable under a specific law (e.g. civil liability established under antitrust; bribery; or se-curities law), contract or tort. This definition encompasses the costs arising through litiga-tion or other claims resolution processes. Litigation costs represent only a fraction of all liability costs but litigation risk can influence liability costs even if claims are resolved without recourse to litigation. By this defini-tion, liability costs include amounts paid in compensation by defendants.
General liability insurance sold to companies provides a basis for comparison because poli-cies covers similar types of liability costs in each country. Even though some costs are
uninsured26 and the fraction uninsured may vary across jurisdictions, the cost of a similar policy can be used to compare the costliness of different jurisdictions overall.
We separate out any cost differences due to the mix of business, spending on government social programs and private healthcare costs in each country using econometric analysis.26 By controlling for non-litigation-related factors, we develop internationally comparable estimates of liability costs revealing how much more expensive the most costly countries’ legal environments are than the rest. These estimates are reported in Figure 1 for the US, Japan and other selected countries.26
For countries with similar scope of civil redress, similar regulatory protections and deterrence, it is still possible that the level of government benefits or healthcare costs could explain differences in liability costs. After controlling for these differences,26 remaining factors that offer explanations for liability cost differences are more frequent claims, higher costs, or both.
Japanese 2011 liability costs as a percent of GDP are lower than all of the other countries in the study except for China. The results of our econometric analysis show that most of the variation in liability costs is due to features of the legal system in each country. Using the US and the UK as benchmarks, these estimates suggest that changes in the legal environment in Japan that would encourage litigation could result in much higher liability costs.
ix International Comparisons of Litigation Costs
Nethe
rland
sChin
a
Belgium
Japa
n
Portu
gal
Denm
ark
Fran
ceBraz
il
Figure 1: 2011 Liability Costs as a Fraction of GDP
0.40
0.29
0.42
0.30
0.430.46
0.560.60
Spain
Germ
any
Italy
Irelan
d
United
King
dom
Canad
a
United
Stat
es
0.67 0.68
0.77 0.78
1.05
1.19
1.66
1.8%
1.6%
1.4%
1.2%
1.0%
0.8%
0.6%
0.4%
0.2%
0.0%
2011
Lia
bili
ty C
ost
s as
a P
erce
nt
of
GD
P

xU.S. Chamber Institute for Legal Reform

202.463.5724 main 202.463.5302 fax
1615 H Street, NW Washington, DC 20062
instituteforlegalreform.com