investors, mutual funds & returns trend analysis report · performance* of equity-oriented...
TRANSCRIPT
Investors, Mutual
Funds & Returns –
Trend Analysis
Report
July 2018
Industry Size
Investor Trends
Inflow Outflow Analysis
Sector Update
Category Performance
Industry Insights
Regulatory Update
Mutual Fund Screener – What’s Inside

Industry Size
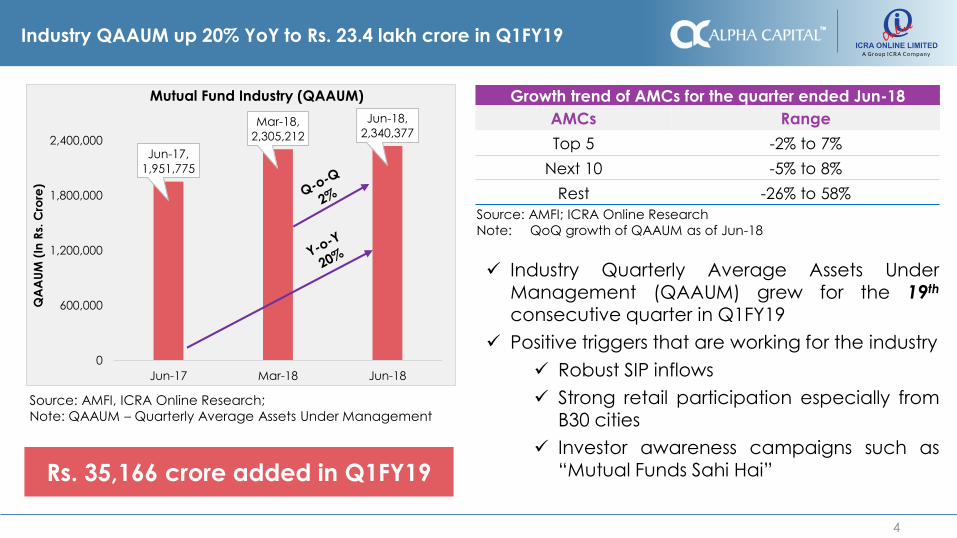
Industry QAAUM up 20% YoY to Rs. 23.4 lakh crore in Q1FY19
Growth trend of AMCs for the quarter ended Jun-18
AMCs Range
Top 5 -2% to 7%
Next 10 -5% to 8%
Rest -26% to 58%
Source: AMFI; ICRA Online Research
Note: QoQ growth of QAAUM as of Jun-18
4
Rs. 35,166 crore added in Q1FY19
Jun-17,
1,951,775
Mar-18,
2,305,212
Jun-18,
2,340,377
0
600,000
1,200,000
1,800,000
2,400,000
Jun-17 Mar-18 Jun-18
QA
AU
M (
In R
s. C
rore
)
Mutual Fund Industry (QAAUM)
Source: AMFI, ICRA Online Research;
Note: QAAUM – Quarterly Average Assets Under Management
✓ Industry Quarterly Average Assets UnderManagement (QAAUM) grew for the 19th
consecutive quarter in Q1FY19
✓ Positive triggers that are working for the industry
✓ Robust SIP inflows
✓ Strong retail participation especially fromB30 cities
✓ Investor awareness campaigns such as“Mutual Funds Sahi Hai”

Top 10 AMCs account for ~81% of QAAUM
5
Source: AMFI, ICRA Online Research
-2%
0%
2%
4%
6%
8%
0
70,000
140,000
210,000
280,000
350,000
ICICI
Prudential
Mutual Fund
HDFC Mutual
Fund
Aditya Birla
Sun Life
Mutual Fund
Reliance
Mutual Fund
SBI Mutual
Fund
UTI Mutual
Fund
Kotak
Mahindra
Mutual Fund
Franklin
Templeton
Mutual Fund
DSP
BlackRock
Mutual Fund
Axis Mutual
Fund
Q-o
-Q G
row
th (
In %
)
QA
AU
M (
In R
s. C
rore
)
Top 10 AMCs
Jun-18 Mar-18 % Change QoQ
QAAUM ≥ Rs. 3 lakh crore QAAUM ≥ Rs. 2 lakh
crore and < Rs. 3 lakh crore
QAAUM ≥ Rs. 1 lakh crore and < Rs. 2 lakh crore
0%
25%
50%
75%
100%
125%
0
20,000
40,000
60,000
80,000
Mira
e A
sse
t M
F
Ma
hin
dra
MF
Mo
tila
l Osw
al
MF
Ed
elw
eis
s M
F
L&T
MF
IIFL
MF
PP
FA
S M
F
IDB
I M
F
BO
I A
XA
MF
IL&
FS M
F (
IDF)
Yo
Y G
row
th (
In %
)
QA
AU
M (
In R
s. C
rore
)
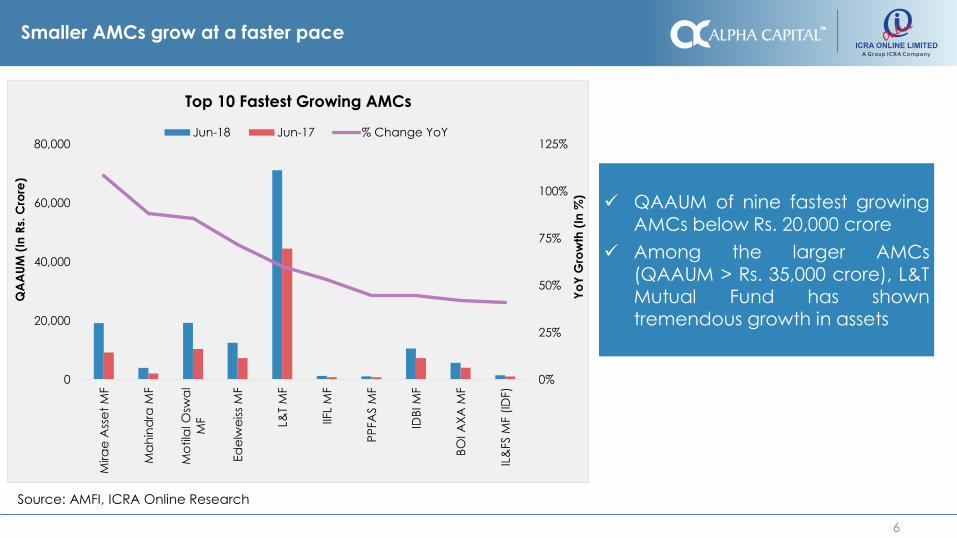
Top 10 Fastest Growing AMCs
Jun-18 Jun-17 % Change YoY
Source: AMFI, ICRA Online Research
Smaller AMCs grow at a faster pace
6
✓ QAAUM of nine fastest growingAMCs below Rs. 20,000 crore
✓ Among the larger AMCs
(QAAUM > Rs. 35,000 crore), L&TMutual Fund has showntremendous growth in assets

Private sector JVs (predominantly Indian) manage 54% of Q1FY19 QAAUM
7
Category
As a % of
Q1FY19
QAAUM
QAAUM (In Rs. Crore) Growth
Q1FY19 Q4FY18 Q1FY18 QoQ YoY
Bank Sponsored
Joint Ventures - Predominantly Indian 10.9% 255,479 240,779 187,361 6.1% 36.4%
Joint Ventures - Predominantly Foreign 0.5% 10,540 10,760 7,296 -2.0% 44.5%
Others 6.9% 161,176 165,653 155,411 -2.7% 3.7%
Institutions Indian 0.9% 21,057 20,768 24,373 1.4% -13.6%
Private Sector
Indian 17.8% 416,337 408,322 327,390 2.0% 27.2%
Joint Ventures - Predominantly Indian 54.5% 1,275,327 1,262,372 1,076,539 1.0% 18.5%
Foreign 6.7% 156,572 153,271 130,555 2.2% 19.9%
Joint Ventures - Predominantly Foreign 0.9% 20,752 19,692 16,175 5.4% 28.3%
Joint Ventures – Others 1.0% 23,137 23,595 25,720 -1.9% -10.0%
Source: AMFI, ICRA Online Research
Note: QoQ – Q1FY19 vs Q4FY18; YoY – Q1FY19 vs Q1FY18

Investor Trends
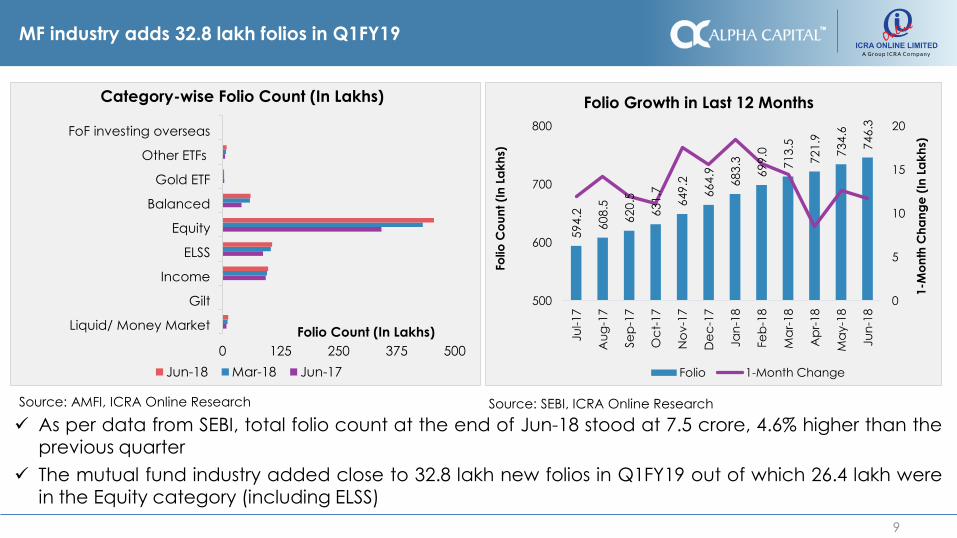
MF industry adds 32.8 lakh folios in Q1FY19
9
0 125 250 375 500
Liquid/ Money Market
Gilt
Income
ELSS
Equity
Balanced
Gold ETF
Other ETFs
FoF investing overseas
Folio Count (In Lakhs)
Category-wise Folio Count (In Lakhs)
Jun-18 Mar-18 Jun-17
Source: AMFI, ICRA Online Research
59
4.2
60
8.5
62
0.5
63
1.7
64
9.2
66
4.9
68
3.3
69
9.0
71
3.5
72
1.9
73
4.6
74
6.3
0
5
10
15
20
500
600
700
800
Ju
l-17
Au
g-1
7
Se
p-1
7
Oc
t-1
7
No
v-1
7
De
c-1
7
Ja
n-1
8
Fe
b-1
8
Ma
r-18
Ap
r-1
8
Ma
y-1
8
Ju
n-1
8
1-M
on
th C
ha
ng
e (
In L
ak
hs)
Fo
lio
Co
un
t (I
n L
ak
hs)
Folio Growth in Last 12 Months
Folio 1-Month Change
Source: SEBI, ICRA Online Research
✓ As per data from SEBI, total folio count at the end of Jun-18 stood at 7.5 crore, 4.6% higher than theprevious quarter
✓ The mutual fund industry added close to 32.8 lakh new folios in Q1FY19 out of which 26.4 lakh werein the Equity category (including ELSS)
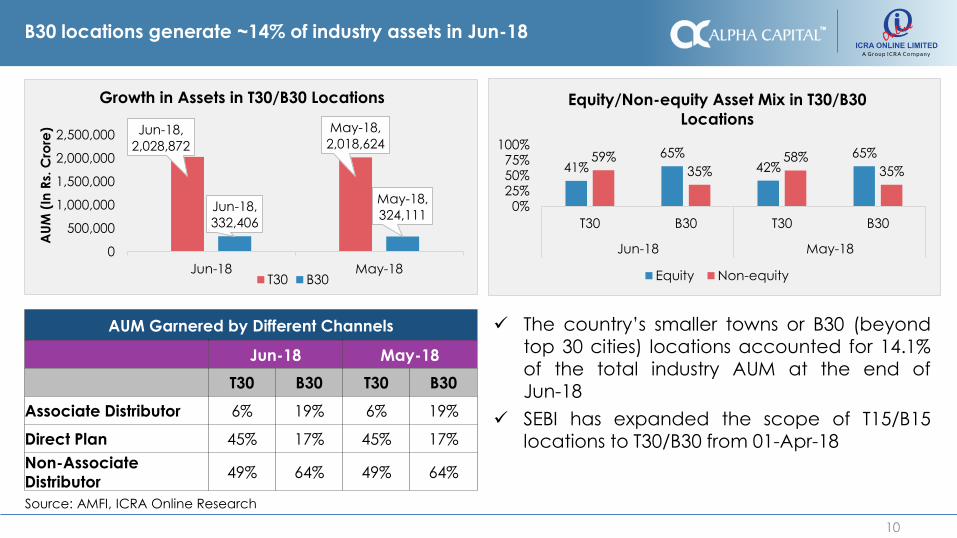
B30 locations generate ~14% of industry assets in Jun-18
10
Source: AMFI, ICRA Online Research
Jun-18,
2,028,872
May-18,
2,018,624
Jun-18,
332,406
May-18,
324,111
0
500,000
1,000,000
1,500,000
2,000,000
2,500,000
Jun-18 May-18
AU
M (
In R
s. C
rore
)
Growth in Assets in T30/B30 Locations
T30 B30
41%65%
42%65%59%
35%58%
35%
0%25%50%75%
100%
T30 B30 T30 B30
Jun-18 May-18
Equity/Non-equity Asset Mix in T30/B30
Locations
Equity Non-equity
✓ The country’s smaller towns or B30 (beyondtop 30 cities) locations accounted for 14.1%of the total industry AUM at the end ofJun-18
✓ SEBI has expanded the scope of T15/B15locations to T30/B30 from 01-Apr-18
AUM Garnered by Different Channels
Jun-18 May-18
T30 B30 T30 B30
Associate Distributor 6% 19% 6% 19%
Direct Plan 45% 17% 45% 17%
Non-Associate
Distributor49% 64% 49% 64%
Inflow Outflow Analysis
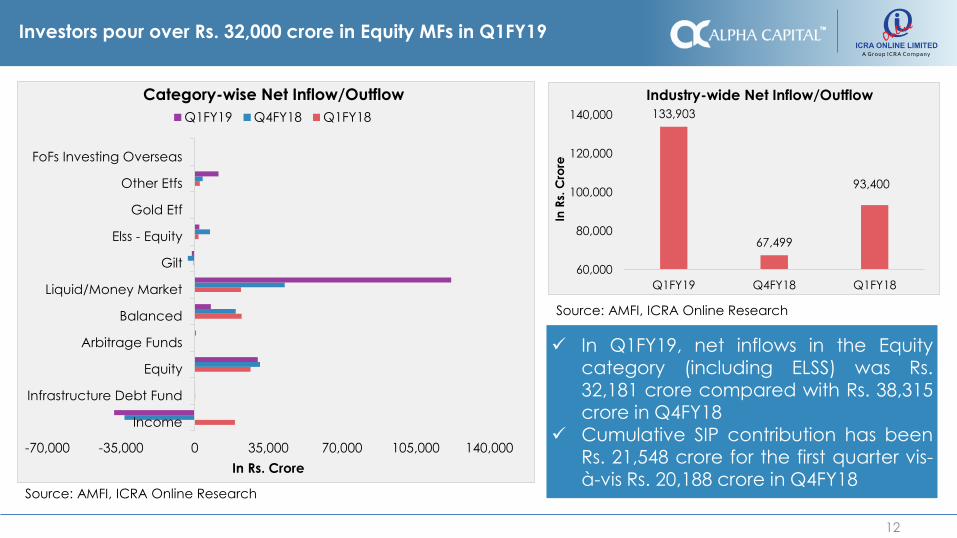
Investors pour over Rs. 32,000 crore in Equity MFs in Q1FY19
12
✓ In Q1FY19, net inflows in the Equity
category (including ELSS) was Rs.32,181 crore compared with Rs. 38,315crore in Q4FY18
✓ Cumulative SIP contribution has beenRs. 21,548 crore for the first quarter vis-à-vis Rs. 20,188 crore in Q4FY18
-70,000 -35,000 0 35,000 70,000 105,000 140,000
Income
Infrastructure Debt Fund
Equity
Arbitrage Funds
Balanced
Liquid/Money Market
Gilt
Elss - Equity
Gold Etf
Other Etfs
FoFs Investing Overseas
In Rs. Crore
Category-wise Net Inflow/Outflow
Q1FY19 Q4FY18 Q1FY18
Source: AMFI, ICRA Online Research
133,903
67,499
93,400
60,000
80,000
100,000
120,000
140,000
Q1FY19 Q4FY18 Q1FY18
In R
s. C
rore
Industry-wide Net Inflow/Outflow
Source: AMFI, ICRA Online Research
Robust SIP inflows seen from retail investors
13
-5,000
1,000
7,000
13,000
19,000
25,000
Jun-13 Dec-13 Jun-14 Dec-14 Jun-15 Dec-15 Jun-16 Dec-16 Jun-17 Dec-17 Jun-18
In R
s. C
rore
Equity Net Inflow/Outflow
Source: AMFI, ICRA Online Research;
Note: Equity includes ELSS funds
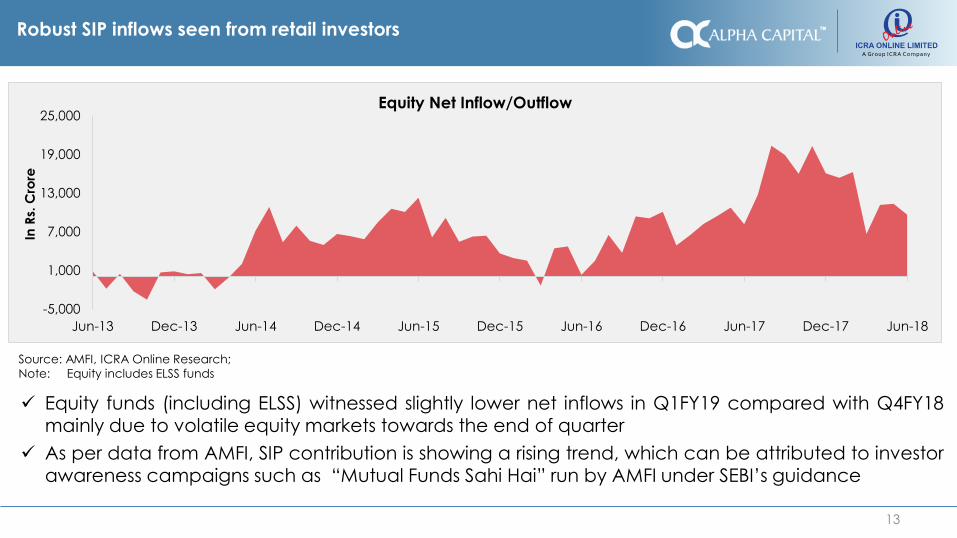
✓ Equity funds (including ELSS) witnessed slightly lower net inflows in Q1FY19 compared with Q4FY18mainly due to volatile equity markets towards the end of quarter
✓ As per data from AMFI, SIP contribution is showing a rising trend, which can be attributed to investor
awareness campaigns such as “Mutual Funds Sahi Hai” run by AMFI under SEBI’s guidance

Sector Update

Top 5 sectors constitute about 52% of the total equity AUM
15
✓ AMCs continue to bet on Bank and Finance sectors with ~ 31% of the total equity AUM
✓ Pharmaceuticals made it to the top five due to higher allocation compared with previous quarter
30,5
17
8,4
30
13,5
83
4,2
09
5,9
38
28,0
71
13,3
80
10,9
84
11,0
76
6,2
91
18,3
08
6,2
05 1
0,1
63
10,0
30
7,4
07
16,5
79
8,1
44
3,5
78
3,3
47
5,5
19
13,7
79
10,6
18
6,2
09
7,5
17
5,4
33
0
8,000
16,000
24,000
32,000
Banks Finance Software Consumer Non Durables Pharmaceuticals
Eq
uity
AU
M (
In R
s. C
rore
)
Equity exposure of Top 5 AMCs in Top 5 sectors (Jun-18)
HDFC Mutual Fund SBI Mutual Fund ICICI Prudential Mutual Fund Reliance Mutual Fund Aditya Birla Sun Life Mutual Fund
Source: AMFI, ICRA Online Research

Software sector sees the highest growth in inflow in percentage terms
16
-10.0%
10.0%
30.0%
50.0%
70.0%
0
45,000
90,000
135,000
180,000B
an
ks
Fin
an
ce
So
ftw
are
Co
nsu
me
r
No
n
Du
rab
les
Ph
arm
ac
eu
ti
ca
ls Au
to
Co
nst
ruc
tio
n
Pro
jec
t
Pe
tro
leu
m
Pro
du
cts
Po
we
r
Au
to
An
cill
arie
s
% C
ha
ng
e Y
oY
In R
s. C
rore
Sector wise Inflow in Jun-18 Vis-a-vis Mar-18 and Jun-17Jun-18 Mar-18 Jul-17 % change - QoQ % change - YoY
Source: AMFI, ICRA Online Research
Note: Only top-10 sectors considered
Category Performance
Market correction affects performance of Equity-oriented funds – mostly mid and small caps
18
7.8
10.1
18.2
13.2
9.1 1
0.6
18.2
6.4
10.7
19.3
13.4
8.0 8.5
15.1
12.1
4.9
10.6
23.8
16.3
7.9 9
.8
18.2
14.3
4.0
14.2
27.2
15.8
7.3
11.9
20.7
14
.9
0.0
5.0
10.0
15.0
20.0
25.0
30.0
1 Year 3 Year 5 Year 10 Year
Re
turn
s (I
n %
)
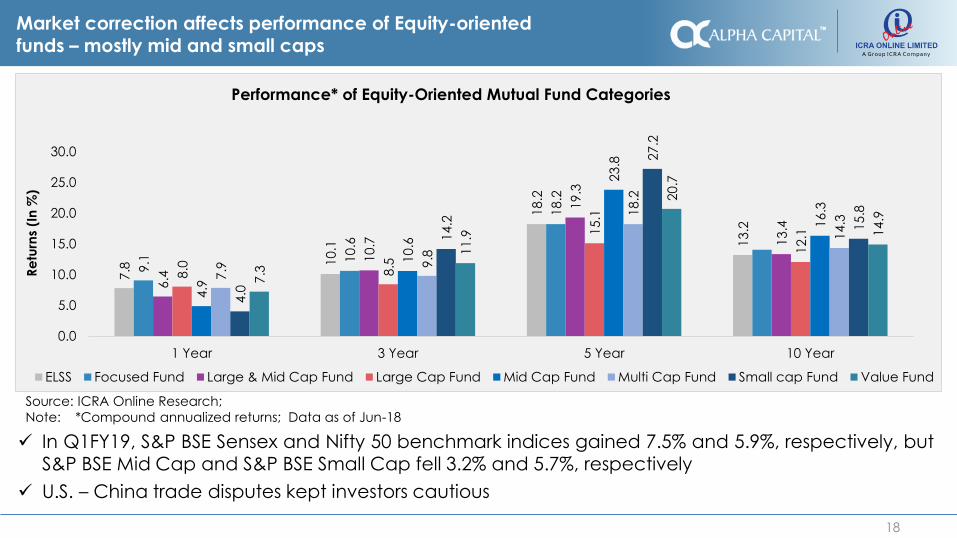
Performance* of Equity-Oriented Mutual Fund Categories
ELSS Focused Fund Large & Mid Cap Fund Large Cap Fund Mid Cap Fund Multi Cap Fund Small cap Fund Value Fund
Source: ICRA Online Research;
Note: *Compound annualized returns; Data as of Jun-18
✓ In Q1FY19, S&P BSE Sensex and Nifty 50 benchmark indices gained 7.5% and 5.9%, respectively, butS&P BSE Mid Cap and S&P BSE Small Cap fell 3.2% and 5.7%, respectively
✓ U.S. – China trade disputes kept investors cautious
Hybrid categories see muted performance
19
6.1
8.6
15.1
12.0
6.0 6.1 7
.1
7.1
3.4
7.2
9.1
8.8
7.1 7
.9
14.0
12.0
4.9
7.0 7
.7
7.7
6.4 7
.2
10.5
10.9
0.0
5.0
10.0
15.0
1 Year 3 Year 5 Year 10 Year
Re
turn
s (I
n %
)
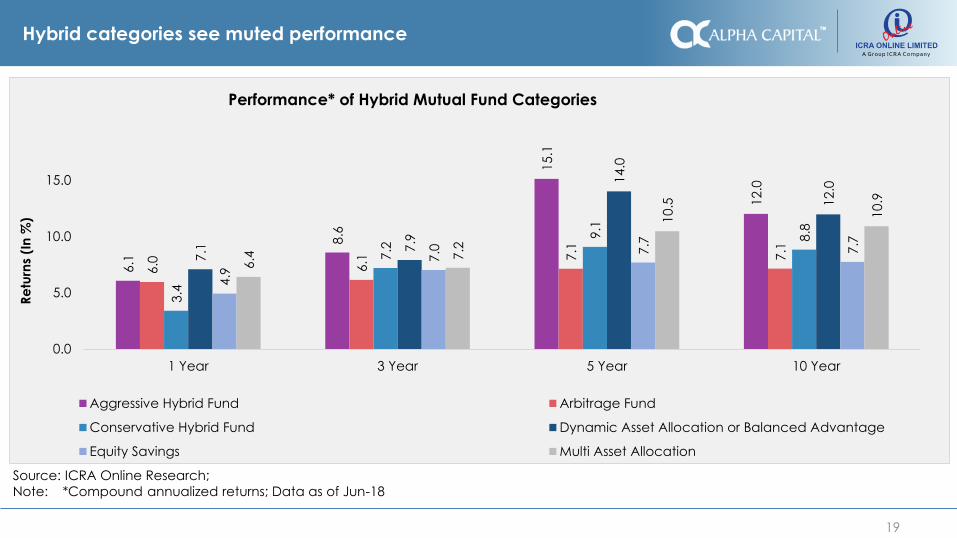
Performance* of Hybrid Mutual Fund Categories
Aggressive Hybrid Fund Arbitrage Fund
Conservative Hybrid Fund Dynamic Asset Allocation or Balanced Advantage
Equity Savings Multi Asset Allocation
Source: ICRA Online Research;
Note: *Compound annualized returns; Data as of Jun-18

20
Debt-oriented categories post muted returns
Key drivers:
✓ Bond yields continued to rise in Q1FY19 over concerns of widening fiscal deficit and tightening ofmonetary policy
✓ Medium- to long-term debt funds posted poor returns in the short-term periods
-3.0
5.3
2.4
2.3
1.1
-0.8
7.0
6.1
0.2
6.3
4.5 4.8
3.7
1.6
7.0
6.6
-1.2
6.3
4.7 5
.4
3.9
1.2
6.9
6.57.1 7.4
7.0 7.2
7.1
7.1 7.4
-4.0
-2.0
0.0
2.0
4.0
6.0
8.0
Gilt Fund Low Duration
Fund
Short Duration
Fund
Credit Risk
Fund
Corporate
Bond Fund
Dynamic Bond Liquid Fund Ultra Short
Duration Fund
Re
turn
s (I
n %
)
Performance* of debt funds
3 Months 6 Months 1 Year 3 YearsSource: ICRA Online Research
Note: *Compound annualised returns for periods ≥1 year; Simple annualised returns for <1 year; Data as of Jun-18
Long Term Medium Term Short Term

Industry Insights
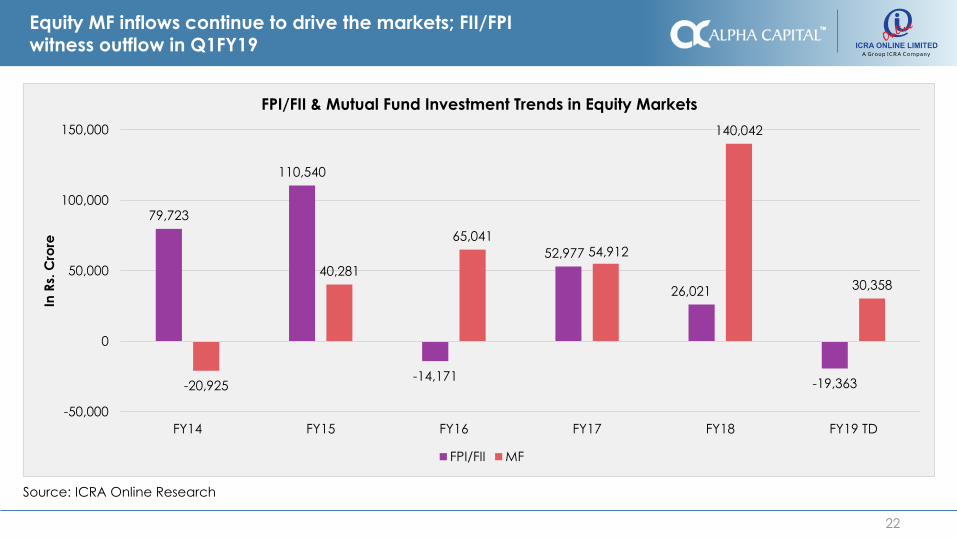
Equity MF inflows continue to drive the markets; FII/FPI witness outflow in Q1FY19
22
79,723
110,540
-14,171
52,977
26,021
-19,363-20,925
40,281
65,04154,912
140,042
30,358
-50,000
0
50,000
100,000
150,000
FY14 FY15 FY16 FY17 FY18 FY19 TD
In R
s. C
rore
FPI/FII & Mutual Fund Investment Trends in Equity Markets
FPI/FII MF
Source: ICRA Online Research

Instrument allocation pattern in debt segment
23
0%
25%
50%
Bond/
Debenture
CP CD Gilt SDL T Bill Others REITs & InvITs Cash &
Equivalents
In %
Jun-18 Mar-18 Dec-17
Source: ICRA Online Research
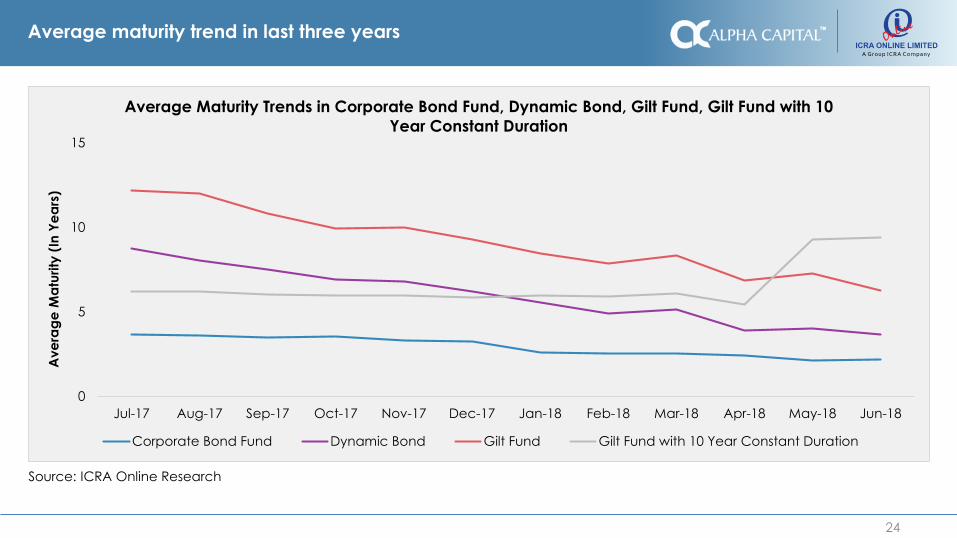
Average maturity trend in last three years
24
0
5
10
15
Jul-17 Aug-17 Sep-17 Oct-17 Nov-17 Dec-17 Jan-18 Feb-18 Mar-18 Apr-18 May-18 Jun-18
Ave
rag
e M
atu
rity
(In
Ye
ars
)
Average Maturity Trends in Corporate Bond Fund, Dynamic Bond, Gilt Fund, Gilt Fund with 10
Year Constant Duration
Corporate Bond Fund Dynamic Bond Gilt Fund Gilt Fund with 10 Year Constant Duration
Source: ICRA Online Research

Regulatory Update
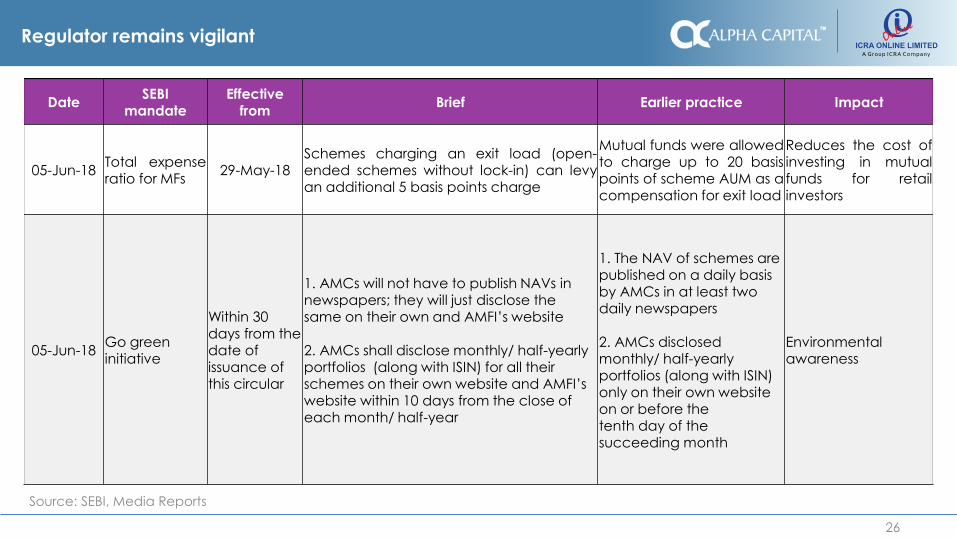
Regulator remains vigilant
26
DateSEBI
mandateEffective
fromBrief Earlier practice Impact
05-Jun-18Total expenseratio for MFs
29-May-18Schemes charging an exit load (open-ended schemes without lock-in) can levyan additional 5 basis points charge
Mutual funds were allowedto charge up to 20 basispoints of scheme AUM as acompensation for exit load
Reduces the cost ofinvesting in mutualfunds for retailinvestors
05-Jun-18Go green initiative
Within 30 days from the date of issuance of this circular
1. AMCs will not have to publish NAVs in newspapers; they will just disclose the same on their own and AMFI’s website
2. AMCs shall disclose monthly/ half-yearly portfolios (along with ISIN) for all their schemes on their own website and AMFI’s website within 10 days from the close of each month/ half-year
1. The NAV of schemes are published on a daily basis by AMCs in at least two daily newspapers
2. AMCs disclosed monthly/ half-yearly portfolios (along with ISIN) only on their own website on or before thetenth day of the succeeding month
Environmental awareness
Source: SEBI, Media Reports

MUMBAI
15, Ground Floor, Dosti shoppe
Link Dosti Acres, Antop Hill,
Wadala (East)
Mumbai - 400 037 Maharashtra,
Ph : 022 -2414 8864.
Contact Us
GURGAON
1154, 11th Floor Tower B, Spaze
Techpark, Sohna Road
Gurgaon - 122001
Haryana, Ph : 0124-4246036/8
Fax : 0124-4246037.
KOLKATA
Malancha, 4A, Elgin Road,
Kolkata - 700020 West Bengal,
Ph : 033 - 4003 4585,
Ph : 033 - 4006 8556
Fax : 033- 2280 8557.
COIMBATORE
207, 3rd Floor, Tulsi Complex,
1334 Thadagam Road, RS Puram,
Coimbatore - 641 002,
Tamil Nadu,
Ph : +91 422 4367 309.
SILIGURI
Himadri Bhawan Opp.
Gurudwara, Sevoke Road
Siliguri - 734401
West Bengal,
Ph : 0353 -2430 273.
Contact us
All information contained herein is obtained by ICRA Online Limited (“ICRON”) from sources believed by it to be accurate and reliable.
Because of the possibility of human or mechanical error as well as other factors, however, all information contained herein is provided “AS IS”
without warranty of any kind. ICRON adopts all necessary measures so that the information it uses is of sufficient quality and from sources
ICRON considers to be reliable including, when appropriate, independent third-party sources. However, ICRON is not an auditor and cannot
in every instance independently verify or validate information received in preparing this document.
All information contained herein must be construed solely as statements of opinion, and ICRA Online Limited or its affiliates or group
companies and its respective and any of its officers, directors, personnel and employees, disclaim liability to any loss, damage of any nature,
including but not limited to direct, indirect, punitive, special, exemplary, consequential, as also any loss of profit in any way arising from the
use of this document or its contents in any manner or for any contingency within or beyond the control of, ICRON or any of its directors,
officers, employees, agents, representatives, licensors or suppliers, arising from or in connection with the information contained herein or the
use of or inability to use any such information. Opinions expressed in the document are not the opinions of our holding company, ICRA Limited
(ICRA), and should not be construed as any indication of credit rating or grading of ICRA for any instruments that have been issued or are to
be issued by any entity. The recipient alone shall be fully responsible and/or are liable for any decision taken on the basis of this document
and/or the information contained herein.
Readers are requested to click here for ICRON disclaimer - http://www.icraonline.com/legal/standard-disclaimer.html
Disclaimer