leveraging distant relatedness to quantify human mutation ... · leveraging distant relatedness to...
TRANSCRIPT

Leveraging distant relatedness to quantify human mutation and gene
conversion rates
Pier Palamara
Harvard T. H. Chan School of Public Health
ASHG 2015.10.10

Methods for inferring the mutation rate
see e.g. [Scally & Durbin Nat Rev Gen 2012, Segurel et al. Annu. Rev. Genom. Hum. Gen. 2014 ]
generations
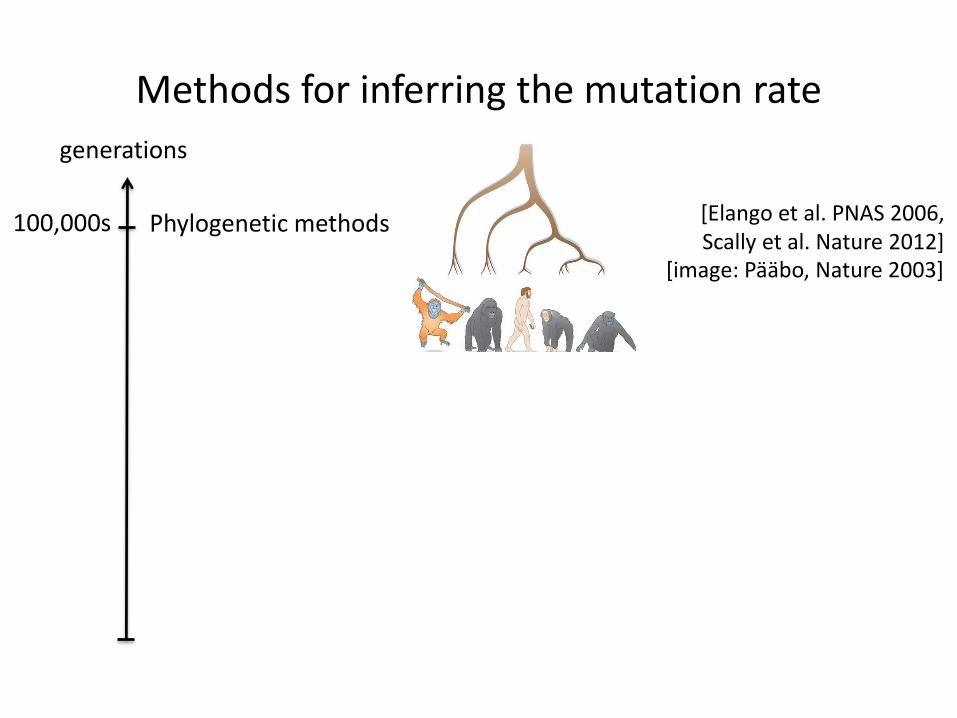
[Elango et al. PNAS 2006, Scally et al. Nature 2012]
[image: Pääbo, Nature 2003]
Methods for inferring the mutation rate
generations
100,000s Phylogenetic methods

generations
100,000s
1
Phylogenetic methods
Trios
[Conrad et al. Nat. Gen. 2011, Sun et al. Nat. Gen. 2012,
Kong et al. Nature 2012, Neale et al. Nature 2012]
[Elango et al. PNAS 2006, Scally et al. Nature 2012]
[image: Pääbo, Nature 2003]
Methods for inferring the mutation rate

[Conrad et al. Nat. Gen. 2011, Sun et al. Nat. Gen. 2012,
Kong et al. Nature 2012, Neale et al. Nature 2012]
[Elango et al. PNAS 2006, Scally et al. Nature 2012]
[image: Pääbo, Nature 2003]
Different estimates: 2.4 x 10⁻⁸ vs 1.2 x 10⁻⁸
Methods for inferring the mutation rate
generations
100,000s
1
Phylogenetic methods
Trios
[Scally & Durbin, Nat. Rev. Gen. 2012, Segurel et al. Annu. Rev. Genom. Hum. Gen. 2014 ]

1,000s Deep genealogical relationships
e.g. [Lipson et al. PLOS Gen. 2015 (in press)] [Image: Tishkoff and Verrelli, 2003]
Methods for inferring the mutation rate
generations
100,000s
1
Phylogenetic methods
Trios

10s Recent genealogical relationships
Methods for inferring the mutation rate
generations
100,000s
1
Phylogenetic methods
Trios
1,000s Deep genealogical relationships
this work

Identity By Descent
IBD
see e.g. [Browning & Browning, Annual Review of Genetics 2012]

Identity By Descent
IBD
see e.g. [Browning & Browning, Annual Review of Genetics 2012]

Inferring mutation rate in “unrelated” individuals IB
D m
ism
atch
ing
rate
2 × IBD segment age
• tMRCA regression: Regress IBD sequence mismatching rate on age of segments.

Inferring mutation rate in “unrelated” individuals IB
D m
ism
atch
ing
rate
2 × IBD segment age
• tMRCA regression: Regress IBD sequence mismatching rate on age of segments.

Inferring mutation rate in “unrelated” individuals
2 × IBD segment age
IBD
mis
mat
chin
g ra
te
• tMRCA regression: Regress IBD sequence mismatching rate on age of segments.

• tMRCA regression: Regress IBD sequence mismatching rate on age of segments.
slope = mutation rate
Inferring mutation rate in “unrelated” individuals
2 × TMRCA
IBD
mis
mat
chin
g ra
te
2 × IBD segment age

Genotyping errors
slope = mutation rate
Intercept ≈ genotype error
Inferring mutation rate in “unrelated” individuals
2 × TMRCA
IBD
mis
mat
chin
g ra
te
2 × IBD segment age
• tMRCA regression: Regress IBD sequence mismatching rate on age of segments.

Inferring the age of IBD segments
? ?
Unknown TMRCA Infer from demographic history
[Palamara et al. AJHG 2012] [Ralph & Coop, PLOS Bio. 2013]
IBD

• Gene conversion occurs at a rate proportional to recombination
• When it occurs, an existing SNP may be copied on IBD haplotypes
Dealing with non-crossover gene conversion
Gene conversion
May harbor common variant

• Gene conversion occurs at a rate proportional to recombination
• When it occurs, an existing SNP may be copied on IBD haplotype
Dealing with non-crossover gene conversion
… with probability proportional to number of generations
2 × TMRCA
IBD
mis
mat
chin
g ra
te
2 × IBD segment age

• Gene conversion occurs at a rate proportional to recombination
• When it occurs, an existing SNP may be copied on IBD haplotype
Dealing with non-crossover gene conversion
… with probability proportional to number of generations and variant frequency…
2 × TMRCA
IBD
mis
mat
chin
g ra
te
2 × IBD segment age

• Solution: perform a second regression, now using threshold on maximum MAF variants in sequence
Any polymorphic variant used
Maximum MAF
Infe
rred
mu
tati
on
rat
e
Non-crossover gene conversion: MaAF regression

• Solution: perform a second regression, now using threshold on maximum MAF variants in sequence
Only variants with MAF < 0.4
Maximum MAF
Infe
rred
mu
tati
on
rat
e
Maximum MAF
Non-crossover gene conversion: MaAF regression

• Solution: perform a second regression, now using threshold on maximum MAF variants in sequence
Gene conversion-corrected estimate
Maximum MAF
Infe
rred
mu
tati
on
rat
e
Maximum MAF
Non-crossover gene conversion: MaAF regression

• Solution: perform a second regression, now using threshold on maximum MAF variants in sequence
proportional to gene conversion
If population heterozygosity is known, can infer rate of gene conversion
Maximum MAF
Infe
rred
mu
tati
on
rat
e
Maximum MAF
Non-crossover gene conversion: MaAF regression

• Results: simulation and real data

tMRCA regression is robust to genotyping error
Simulated error rate
Infe
rred
mu
tati
on
rat
e (x
10
8)

IBD approach is more efficient than trio approach
Trios
IBD in GoNL
25 50 100 200 400
5e−10
1e−09
2e−09
5e−09
Samples
Sta
nda
rd e
rror
of estim
ate
Sample size
Stan
dar
d e
rro
r o
f es
tim
ate

Real data: the Genome of the Netherlands
• ~250 trios1
• ~13x coverage (~26x on transmitted haplotype)
• Trio-phased using MVNcall2
• IBD detected using GERMLINE3 (+ filtering)
• Demographic history (piece-wise expansion)
inferred using DoRIS4
Two periods of exponential expansion
Stronger recent expansion (Golden age)
1: [Francioli et al., Nat. Gen. 2014] 2: [Melanou & Marchini, Bioinformatics 2013] 3: [Gusev et al., Gen. Res. 2009] 4: [Palamara et al., AJHG 2012]

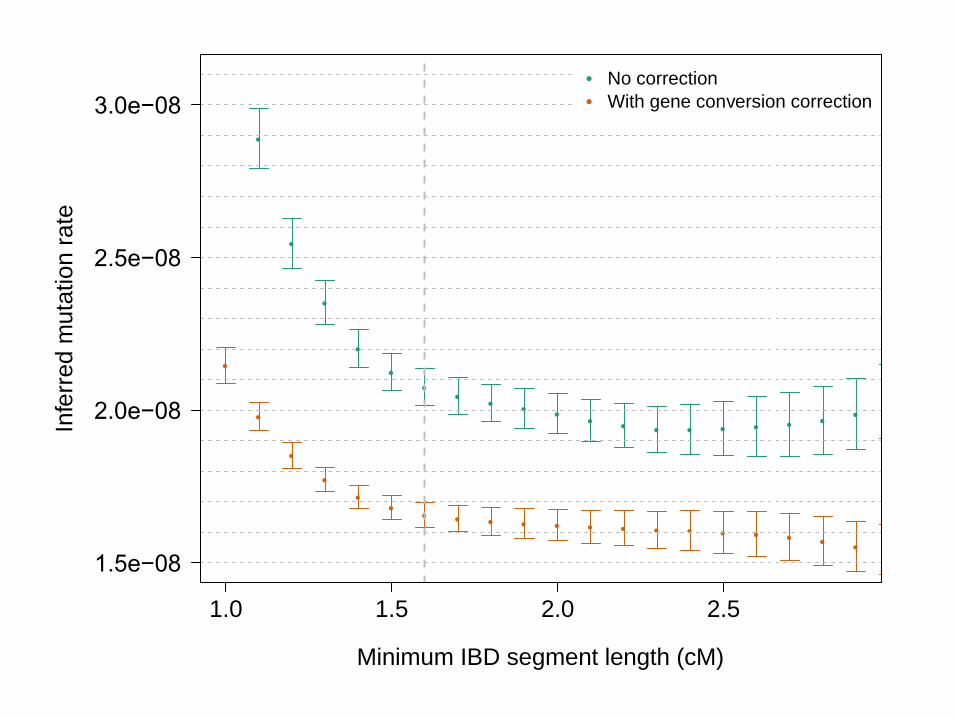
• When gene conversion correction is applied, for segments > 1.6cM, μ = 1.66 x 10⁻⁸, s.e. 0.04 x 10⁻⁸
• Higher than pedigree-based μ
Inferring μ in real data
Gene conversion-corrected estimate
Maximum MAF
Infe
rred
mu
tati
on
rat
e

• When gene conversion correction is applied, for segments > 1.6cM, μ = 1.66 x 10⁻⁸, s.e. 0.04 x 10⁻⁸
• Gene conversion rate of 5.99 x 10⁻⁶, s.e. 0.69 x 10⁻⁶
(Matches estimate of Williams et al. eLife 2015)
Inferring gene conversion rate in real data

• When gene conversion correction is applied, for segments > 1.6cM, μ = 1.66 x 10⁻⁸, s.e. 0.04 x 10⁻⁸
• Gene conversion rate of 5.99 x 10⁻⁶, s.e. 0.69 x 10⁻⁶
(Matches estimate of Williams et al. eLife 2015)
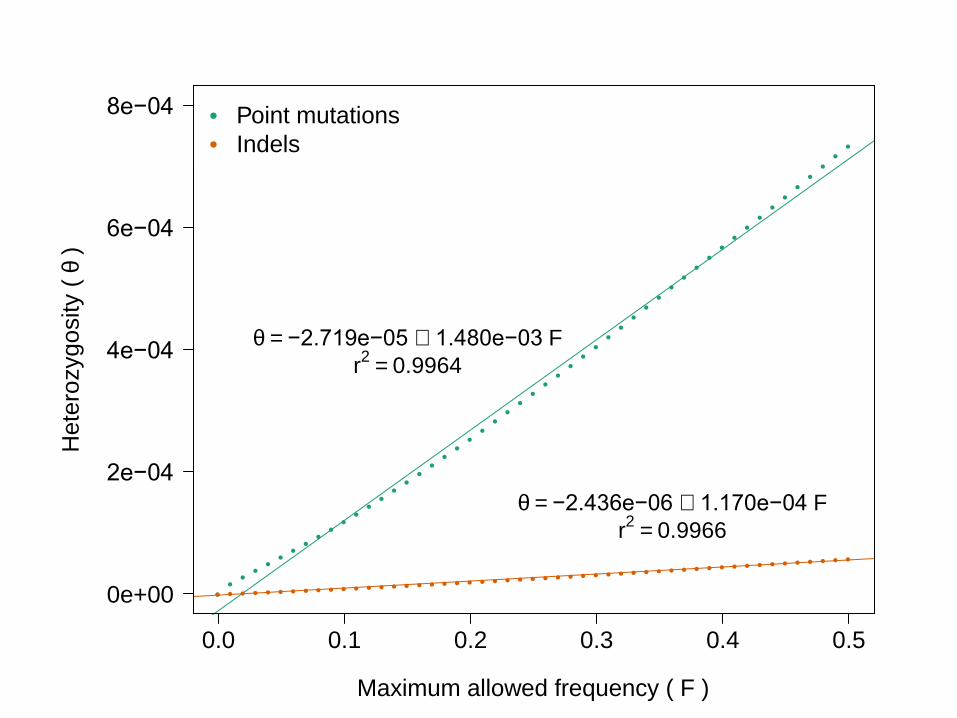
• Same method can be applied to estimate rate of short indels
μindel = 1.26 x 10⁻⁹, s.e. 0.06 x 10⁻⁹
(Compatible with Besenbacher et al. Nat. Comm. 2015)
Inferring indel rate in real data

• Rec. and mut. rates strongly correlated (p<10-5)
• After controlling for gene conversion, no association (p=0.17)
Recombination Mutation
Local standardized recombination rate
Infe
rred
mu
tati
on
rat
e

B statistic closely reflects local IBD sharing (p<10-6) But no impact on mutation rate estimate (p=0.19)
Selection Mutation
Local B statistic
B statistic: [McVicker et al. PLOS Gen. 2009]
Ave
rage
IBD
seg
men
t le
ngt
h

• Mismatching variants on IBD enriched for deleterious variation
• No evidence for enrichment/depletion of mutation rate in several genomic annotations
Other analyses

Conclusions and future work
• New method to infer mutation and gene conversion rates
– μ = 1.66 x 10⁻⁸ (higher than pedigree studies) • Agrees with recent estimate of Lipson et al. PLOS Gen. 2015 (in press)
– No effects of recombination/selection on estimate
– No enrichment/depletion in functional annotations
• Use in multi-generation pedigree data

Acknowledgements
Funding
NIH R01 MH101244, U54 CA121852-06; NSF 08929882, 0845677
PauI de Bakker Cisca Wijmenga
Clara C Elbers Sara L Pulit Androniki Menelaou Laurent Francioli
Genome of the Netherlands consortium
Abdel Abdellaoui Albert Hofman Alexandros Kanterakis Andre G Uitterlinden Anton JM de Craen Ben Oostra Bruce H Wolffenbuttel Cornelia M van Duijn Dorret Boomsma Eka HD Suchiman Eline P Slagboom Fernanodo Rivadeneira
Freerk van Dijk Gert-Jan van Ommen Gonneke Willemsen Heorhiy Byelas Hongzhi Cao Jeanine Houwing-Duistermaat Itsik Pe'er Jeroen FJ Laros Jessica van Setten Johan den Dunnen Jouke Jan Hottenga Jun Wang
Kai Ye Karol Estrada Lennart C Karssen Marian Beekman Martijn Dijkstra Martijn Vermaat Mathijs Kattenberg Morris A Swertz Ning Li Paz Polak Peter de Knijff Pier Palamara
Pieter B Neerincx Qibin Li Ruoyan Chen Shamil Sunyaev Sujie Cao Victor Guryev Vyacheslav Koval Wigard Kloosterman Yingrui Li Yuanping Du
Palamara et al. AJHG 2015 (in press) available on BioRxiv
(Harvard University) Alkes Price, John Wakeley, Shamil Sunyaev, Alexander Gusev, Peter Wilton, Hilary Finucane, Sriram Sankararaman
(University Medical Center Utrecht ) Laurent Francioli, Paul de Bakker
(Columbia University) Itsik Pe’er
(Broad Institute) Giulio Genovese


Genotyping error is captured by intercept

IBD approach is more efficient than trio approach
● ● ●Trios GoNL MASAI
50 100 200
2e−10
5e−10
1e−09
2e−09
5e−09
1e−08
2e−08
Samples
Sta
nda
rd e
rror
of estim
ate

No effects of background selection on inference
●
●
● ●
●
●
●●
●
●
●●
●
−5 −4 −3 −2 −1 0 1
1.0
e−
08
1.5
e−
08
2.0
e−
08
2.5
e−
08
Standardized B statistic in region
Infe
rre
d m
uta
tion
rate

0 100 200 300 400
Time (generations)
Effective
siz
e
10
310
41
05
10
6● ● ● ●Ashkenazi European Masai Dutch

0.0 0.2 0.4 0.6 0.8 1.0
0.001
0.002
0.005
0.010
0.020
0.050
0.100
0.200
Derived allele frequency
Pro
bab
ility
● ● ●alpha = 0.01 alpha = 0.5 alpha = 1

5 10 15 20
Physical position (Mb)
cM
/Mb
0
2
4
6
8 ● ●steps map hotspots map

● ● ● ● ● ●●
●●
●●
●
●
●
●
●
●
●
●
●
●
Posterior threshold
Inte
rce
pt
0.0 0.2 0.4 0.6 0.8 1.0
2.0e−06
2.5e−06
3.0e−06
3.5e−06
4.0e−06

● ● ● ● ● ● ● ● ● ● ● ● ● ● ● ● ● ● ● ●●
Posterior threshold
Infe
rred
muta
tio
n r
ate
0.0 0.2 0.4 0.6 0.8 1.0
1.4e−08
1.5e−08
1.6e−08
1.7e−08
1.8e−08
1.9e−08
●
●
●
●
●●
● ● ● ● ● ● ● ● ● ● ● ● ●● ●
●
●
●
●
●
●●
●●
●●
● ● ● ● ● ● ●●
●
Minimum IBD segment length (cM)
Infe
rred
muta
tio
n r
ate
1.0 1.5 2.0 2.5
1.5e−08
2.0e−08
2.5e−08
3.0e−08
●
●
No correction
With gene conversion correction
●●●●●●●●●●●●●●●●●●●●●●●●●●●●●●●●●●●●●●●●●●●●●●●●●●●
q = −2.719e−05 + 1.480e−03 F
r2
= 0.9964
● ● ● ● ● ● ● ● ● ● ● ● ● ● ● ● ● ● ● ● ● ● ● ● ● ● ● ● ● ● ● ● ● ● ● ● ● ● ● ● ● ● ● ● ● ● ● ● ● ● ●
q = −2.436e−06 + 1.170e−04 F
r2
= 0.9966
Maximum allowed frequency ( F )
Hete
rozygo
sity (
q )
0.0 0.1 0.2 0.3 0.4 0.5
0e+00
2e−04
4e−04
6e−04
8e−04 ●
●
Point mutations
Indels

●●
●
● ●
●
●
●
●
●
●
0.0e+00 5.0e−08 1.0e−07 1.5e−07 2.0e−07 2.5e−07 3.0e−07
0.0
00
00
0.0
00
05
0.0
00
10
0.0
00
15
0.0
00
20
Average recombination rate in region
Infe
rre
d g
en
e c
onve
rsio
n r
ate
pe
r b
p